Sentinel, OK Map & Demographics
Sentinel Map
Sentinel Overview
$55,998
PER CAPITA INCOME
$135,761
AVG FAMILY INCOME
$103,750
AVG HOUSEHOLD INCOME
39.7%
WAGE / INCOME GAP [ % ]
60.3¢/ $1
WAGE / INCOME GAP [ $ ]
$13,361
FAMILY INCOME DEFICIT
0.42
INEQUALITY / GINI INDEX
973
TOTAL POPULATION
443
MALE POPULATION
530
FEMALE POPULATION
83.58
MALES / 100 FEMALES
119.64
FEMALES / 100 MALES
38.7
MEDIAN AGE
2.2
AVG FAMILY SIZE
2.0
AVG HOUSEHOLD SIZE
557
LABOR FORCE [ PEOPLE ]
71.7%
PERCENT IN LABOR FORCE
2.6%
UNEMPLOYMENT RATE
Sentinel Zip Codes
Sentinel Area Codes
Income in Sentinel
Income Overview in Sentinel
Per Capita Income in Sentinel is $55,998, while median incomes of families and households are $135,761 and $103,750 respectively.
| Characteristic | Number | Measure |
| Per Capita Income | 973 | $55,998 |
| Median Family Income | 324 | $135,761 |
| Mean Family Income | 324 | $138,265 |
| Median Household Income | 475 | $103,750 |
| Mean Household Income | 475 | $110,375 |
| Income Deficit | 324 | $13,361 |
| Wage / Income Gap (%) | 973 | 39.70% |
| Wage / Income Gap ($) | 973 | 60.30¢ per $1 |
| Gini / Inequality Index | 973 | 0.42 |
Earnings by Sex in Sentinel
Average Earnings in Sentinel are $55,667, $43,750 for men and $72,557 for women, a difference of 39.7%.
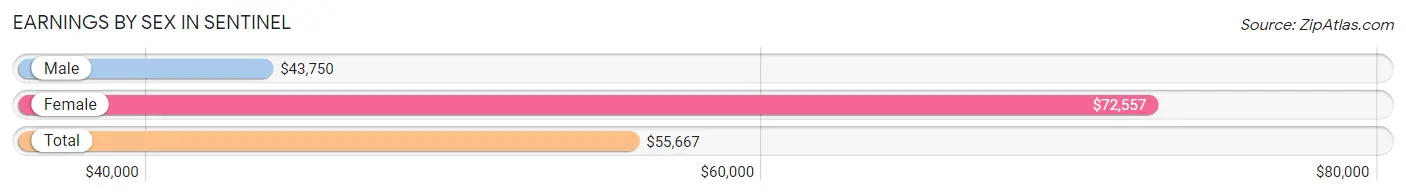
| Sex | Number | Average Earnings |
| Male | 228 (40.0%) | $43,750 |
| Female | 342 (60.0%) | $72,557 |
| Total | 570 (100.0%) | $55,667 |
Earnings by Sex by Income Bracket in Sentinel
The most common earnings brackets in Sentinel are $100,000+ for men (64 | 28.1%) and $65,000 to $74,999 for women (174 | 50.9%).
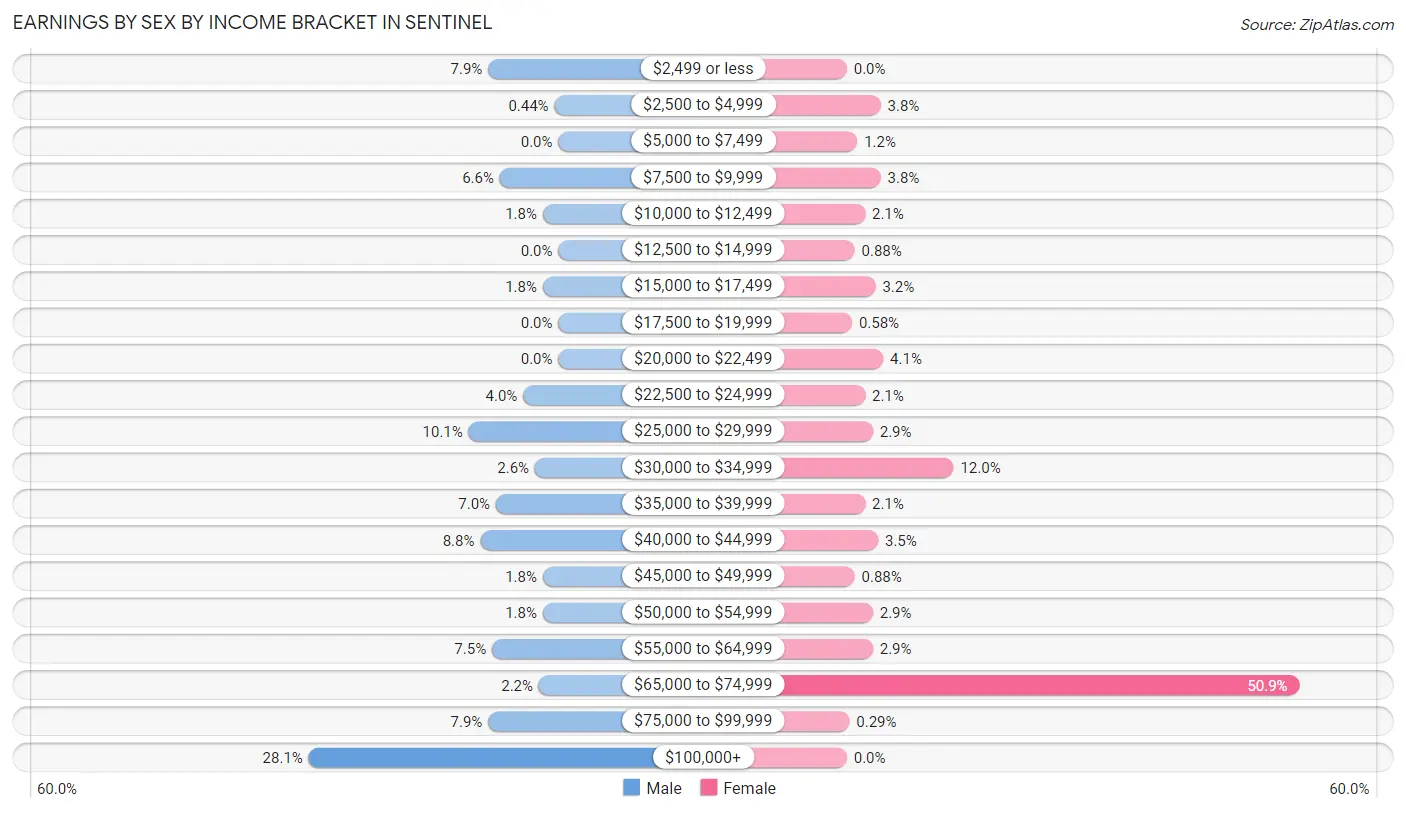
| Income | Male | Female |
| $2,499 or less | 18 (7.9%) | 0 (0.0%) |
| $2,500 to $4,999 | 1 (0.4%) | 13 (3.8%) |
| $5,000 to $7,499 | 0 (0.0%) | 4 (1.2%) |
| $7,500 to $9,999 | 15 (6.6%) | 13 (3.8%) |
| $10,000 to $12,499 | 4 (1.8%) | 7 (2.1%) |
| $12,500 to $14,999 | 0 (0.0%) | 3 (0.9%) |
| $15,000 to $17,499 | 4 (1.8%) | 11 (3.2%) |
| $17,500 to $19,999 | 0 (0.0%) | 2 (0.6%) |
| $20,000 to $22,499 | 0 (0.0%) | 14 (4.1%) |
| $22,500 to $24,999 | 9 (4.0%) | 7 (2.1%) |
| $25,000 to $29,999 | 23 (10.1%) | 10 (2.9%) |
| $30,000 to $34,999 | 6 (2.6%) | 41 (12.0%) |
| $35,000 to $39,999 | 16 (7.0%) | 7 (2.1%) |
| $40,000 to $44,999 | 20 (8.8%) | 12 (3.5%) |
| $45,000 to $49,999 | 4 (1.8%) | 3 (0.9%) |
| $50,000 to $54,999 | 4 (1.8%) | 10 (2.9%) |
| $55,000 to $64,999 | 17 (7.5%) | 10 (2.9%) |
| $65,000 to $74,999 | 5 (2.2%) | 174 (50.9%) |
| $75,000 to $99,999 | 18 (7.9%) | 1 (0.3%) |
| $100,000+ | 64 (28.1%) | 0 (0.0%) |
| Total | 228 (100.0%) | 342 (100.0%) |
Earnings by Sex by Educational Attainment in Sentinel
Average earnings in Sentinel are $61,875 for men and $72,866 for women, a difference of 15.1%. Men with an educational attainment of bachelor's degree enjoy the highest average annual earnings of $118,056, while those with less than high school education earn the least with $37,778. Women with an educational attainment of graduate degree earn the most with the average annual earnings of $73,657, while those with college or associate's degree education have the smallest earnings of $30,272.
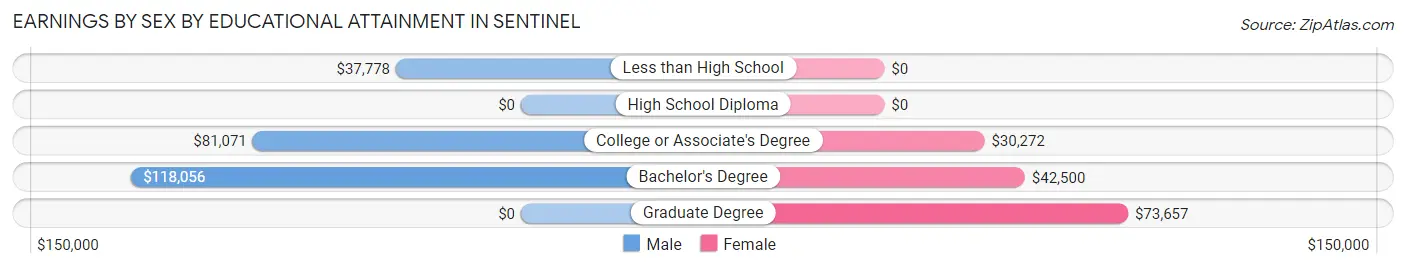
| Educational Attainment | Male Income | Female Income |
| Less than High School | $37,778 | $0 |
| High School Diploma | - | - |
| College or Associate's Degree | $81,071 | $30,272 |
| Bachelor's Degree | $118,056 | $42,500 |
| Graduate Degree | - | - |
| Total | $61,875 | $72,866 |
Family Income in Sentinel
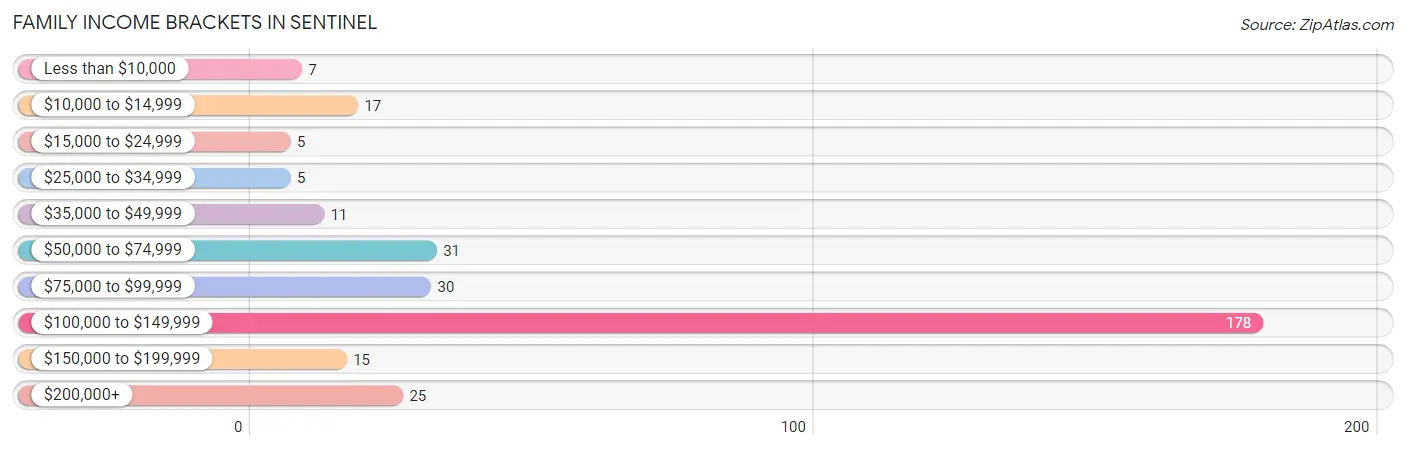
Family Income Brackets in Sentinel
According to the Sentinel family income data, there are 178 families falling into the $100,000 to $149,999 income range, which is the most common income bracket and makes up 54.9% of all families. Conversely, the $15,000 to $24,999 income bracket is the least frequent group with only 5 families (1.5%) belonging to this category.
| Income Bracket | # Families | % Families |
| Less than $10,000 | 7 | 2.2% |
| $10,000 to $14,999 | 17 | 5.2% |
| $15,000 to $24,999 | 5 | 1.5% |
| $25,000 to $34,999 | 5 | 1.5% |
| $35,000 to $49,999 | 11 | 3.4% |
| $50,000 to $74,999 | 31 | 9.6% |
| $75,000 to $99,999 | 30 | 9.3% |
| $100,000 to $149,999 | 178 | 54.9% |
| $150,000 to $199,999 | 15 | 4.6% |
| $200,000+ | 25 | 7.7% |
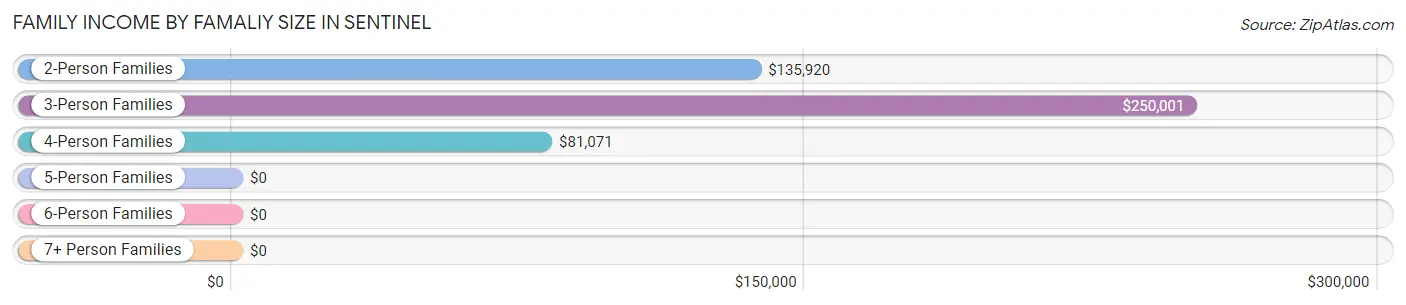
Family Income by Famaliy Size in Sentinel
3-person families (36 | 11.1%) account for the highest median family income in Sentinel with $250,001 per family, while 3-person families (36 | 11.1%) have the highest median income of $83,334 per family member.
| Income Bracket | # Families | Median Income |
| 2-Person Families | 244 (75.3%) | $135,920 |
| 3-Person Families | 36 (11.1%) | $250,001 |
| 4-Person Families | 26 (8.0%) | $81,071 |
| 5-Person Families | 12 (3.7%) | $0 |
| 6-Person Families | 4 (1.2%) | $0 |
| 7+ Person Families | 2 (0.6%) | $0 |
| Total | 324 (100.0%) | $135,761 |
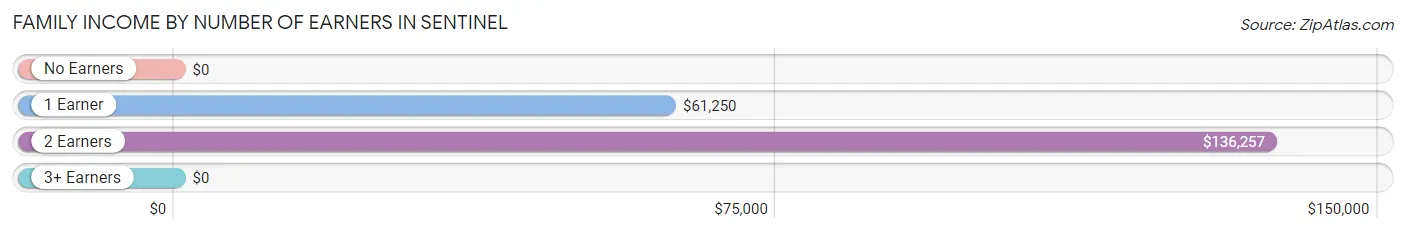
Family Income by Number of Earners in Sentinel
| Number of Earners | # Families | Median Income |
| No Earners | 32 (9.9%) | $0 |
| 1 Earner | 39 (12.0%) | $61,250 |
| 2 Earners | 243 (75.0%) | $136,257 |
| 3+ Earners | 10 (3.1%) | $0 |
| Total | 324 (100.0%) | $135,761 |
Household Income in Sentinel
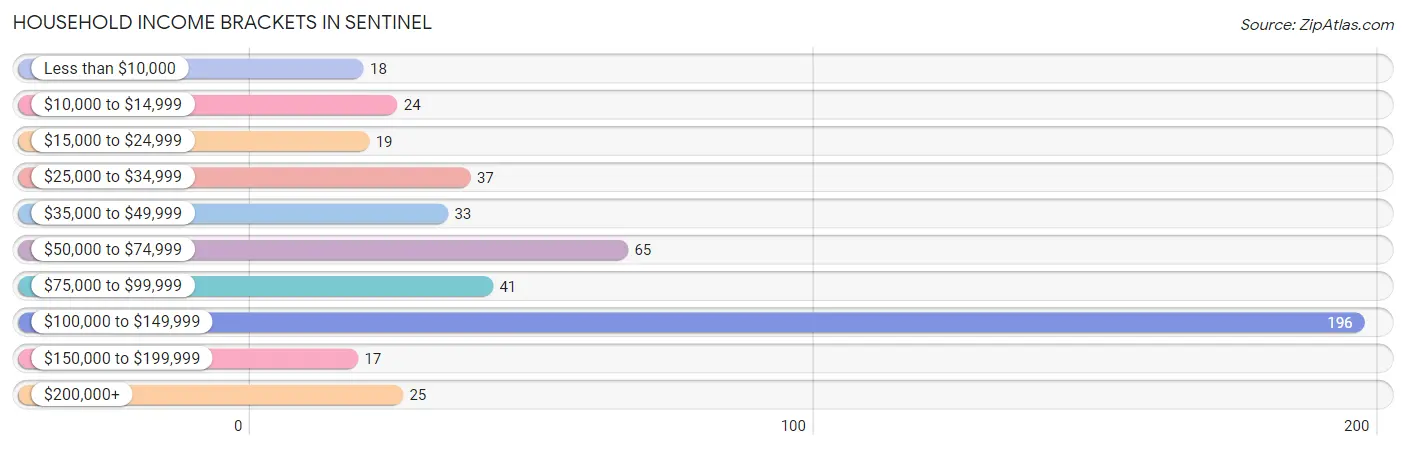
Household Income Brackets in Sentinel
With 196 households falling in the category, the $100,000 to $149,999 income range is the most frequent in Sentinel, accounting for 41.3% of all households. In contrast, only 17 households (3.6%) fall into the $150,000 to $199,999 income bracket, making it the least populous group.
| Income Bracket | # Households | % Households |
| Less than $10,000 | 18 | 3.8% |
| $10,000 to $14,999 | 24 | 5.1% |
| $15,000 to $24,999 | 19 | 4.0% |
| $25,000 to $34,999 | 37 | 7.8% |
| $35,000 to $49,999 | 33 | 6.9% |
| $50,000 to $74,999 | 65 | 13.7% |
| $75,000 to $99,999 | 41 | 8.6% |
| $100,000 to $149,999 | 196 | 41.3% |
| $150,000 to $199,999 | 17 | 3.6% |
| $200,000+ | 25 | 5.3% |
Household Income by Householder Age in Sentinel
The median household income in Sentinel is $103,750, with the highest median household income of $135,718 found in the 65+ years age bracket for the primary householder. A total of 252 households (53.0%) fall into this category. Meanwhile, the 15 to 24 years age bracket for the primary householder has the lowest median household income of $52,500, with 28 households (5.9%) in this group.
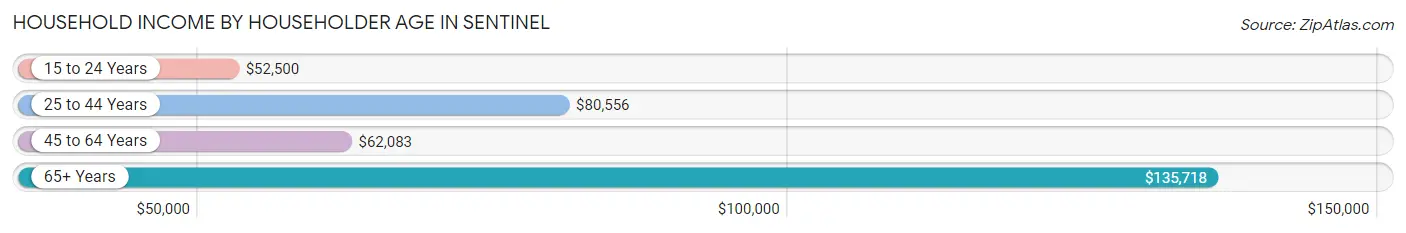
| Income Bracket | # Households | Median Income |
| 15 to 24 Years | 28 (5.9%) | $52,500 |
| 25 to 44 Years | 102 (21.5%) | $80,556 |
| 45 to 64 Years | 93 (19.6%) | $62,083 |
| 65+ Years | 252 (53.0%) | $135,718 |
| Total | 475 (100.0%) | $103,750 |
Poverty in Sentinel
Income Below Poverty by Sex and Age in Sentinel
With 15.8% poverty level for males and 19.5% for females among the residents of Sentinel, 16 and 17 year old males and 35 to 44 year old females are the most vulnerable to poverty, with 12 males (66.7%) and 25 females (51.0%) in their respective age groups living below the poverty level.
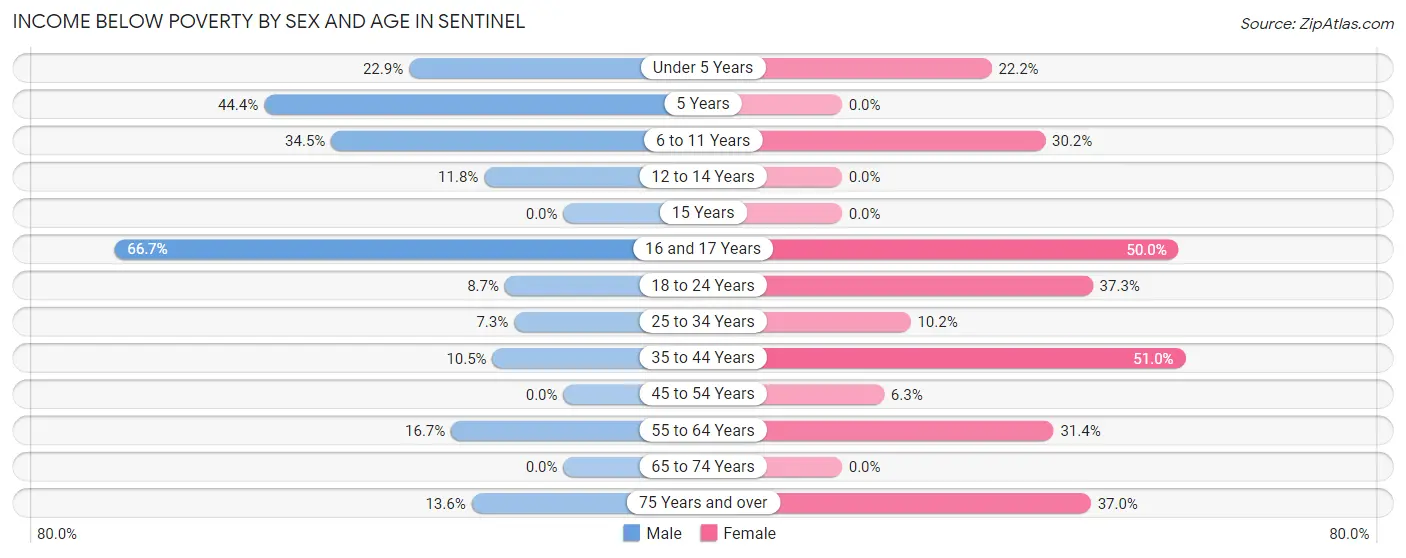
| Age Bracket | Male | Female |
| Under 5 Years | 11 (22.9%) | 2 (22.2%) |
| 5 Years | 4 (44.4%) | 0 (0.0%) |
| 6 to 11 Years | 10 (34.5%) | 16 (30.2%) |
| 12 to 14 Years | 2 (11.8%) | 0 (0.0%) |
| 15 Years | 0 (0.0%) | 0 (0.0%) |
| 16 and 17 Years | 12 (66.7%) | 5 (50.0%) |
| 18 to 24 Years | 4 (8.7%) | 19 (37.2%) |
| 25 to 34 Years | 3 (7.3%) | 5 (10.2%) |
| 35 to 44 Years | 8 (10.5%) | 25 (51.0%) |
| 45 to 54 Years | 0 (0.0%) | 2 (6.2%) |
| 55 to 64 Years | 10 (16.7%) | 11 (31.4%) |
| 65 to 74 Years | 0 (0.0%) | 0 (0.0%) |
| 75 Years and over | 3 (13.6%) | 17 (37.0%) |
| Total | 67 (15.8%) | 102 (19.5%) |
Income Above Poverty by Sex and Age in Sentinel
According to the poverty statistics in Sentinel, males aged 15 years and females aged 15 years are the age groups that are most secure financially, with 100.0% of males and 100.0% of females in these age groups living above the poverty line.
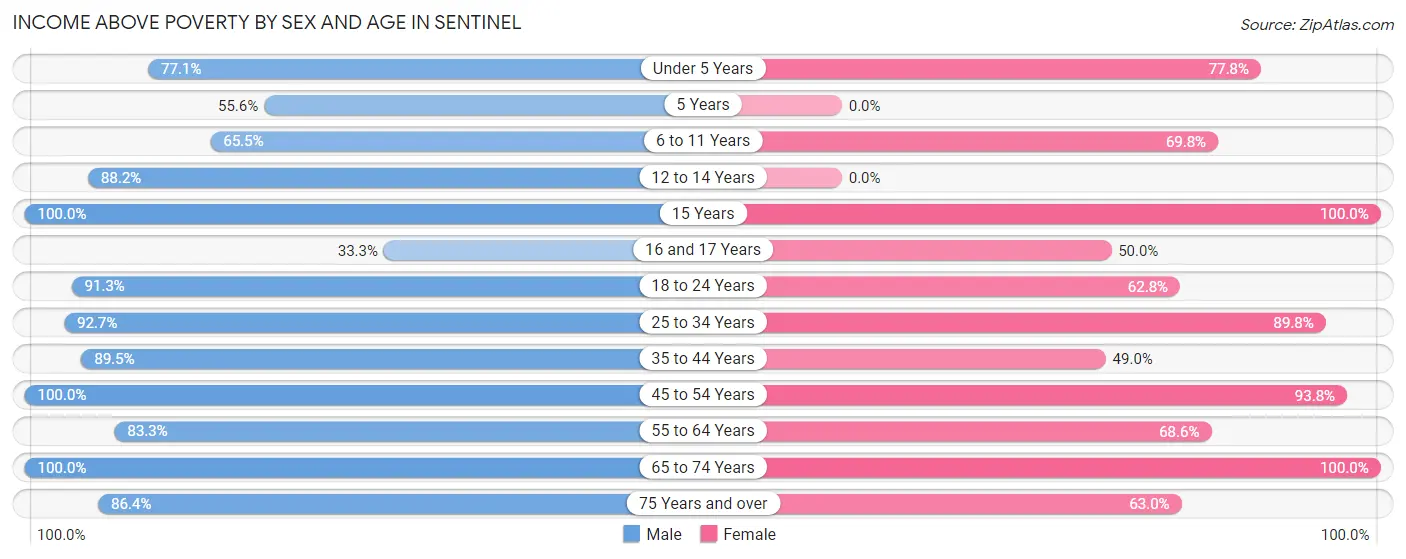
| Age Bracket | Male | Female |
| Under 5 Years | 37 (77.1%) | 7 (77.8%) |
| 5 Years | 5 (55.6%) | 0 (0.0%) |
| 6 to 11 Years | 19 (65.5%) | 37 (69.8%) |
| 12 to 14 Years | 15 (88.2%) | 0 (0.0%) |
| 15 Years | 5 (100.0%) | 1 (100.0%) |
| 16 and 17 Years | 6 (33.3%) | 5 (50.0%) |
| 18 to 24 Years | 42 (91.3%) | 32 (62.7%) |
| 25 to 34 Years | 38 (92.7%) | 44 (89.8%) |
| 35 to 44 Years | 68 (89.5%) | 24 (49.0%) |
| 45 to 54 Years | 34 (100.0%) | 30 (93.8%) |
| 55 to 64 Years | 50 (83.3%) | 24 (68.6%) |
| 65 to 74 Years | 19 (100.0%) | 189 (100.0%) |
| 75 Years and over | 19 (86.4%) | 29 (63.0%) |
| Total | 357 (84.2%) | 422 (80.5%) |
Income Below Poverty Among Married-Couple Families in Sentinel
The poverty statistics for married-couple families in Sentinel show that 2.5% or 7 of the total 286 families live below the poverty line. Families with 3 or 4 children have the highest poverty rate of 35.7%, comprising of 5 families. On the other hand, families with no children have the lowest poverty rate of 0.0%, which includes 0 families.
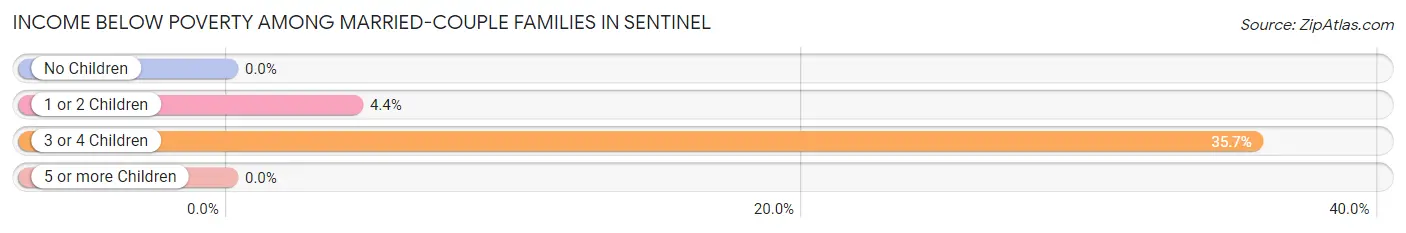
| Children | Above Poverty | Below Poverty |
| No Children | 224 (100.0%) | 0 (0.0%) |
| 1 or 2 Children | 44 (95.7%) | 2 (4.3%) |
| 3 or 4 Children | 9 (64.3%) | 5 (35.7%) |
| 5 or more Children | 2 (100.0%) | 0 (0.0%) |
| Total | 279 (97.6%) | 7 (2.5%) |
Income Below Poverty Among Single-Parent Households in Sentinel
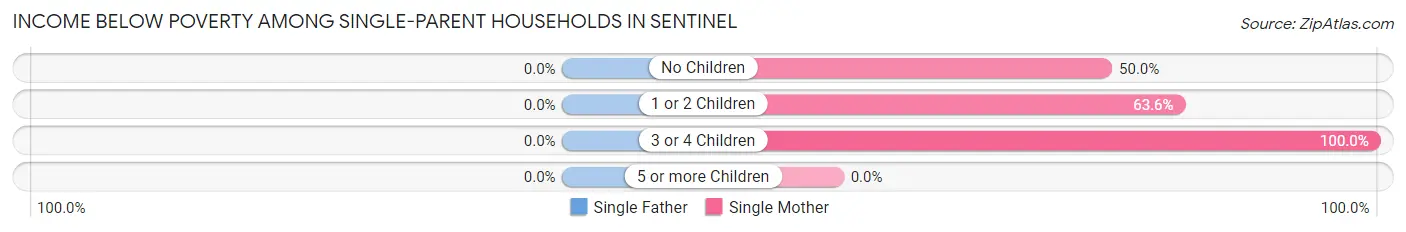
| Children | Single Father | Single Mother |
| No Children | 0 (0.0%) | 6 (50.0%) |
| 1 or 2 Children | 0 (0.0%) | 14 (63.6%) |
| 3 or 4 Children | 0 (0.0%) | 4 (100.0%) |
| 5 or more Children | 0 (0.0%) | 0 (0.0%) |
| Total | 0 (0.0%) | 24 (63.2%) |
Income Below Poverty Among Married-Couple vs Single-Parent Households in Sentinel
The poverty data for Sentinel shows that 7 of the married-couple family households (2.5%) and 24 of the single-parent households (63.2%) are living below the poverty level. Within the married-couple family households, those with 3 or 4 children have the highest poverty rate, with 5 households (35.7%) falling below the poverty line. Among the single-parent households, those with 3 or 4 children have the highest poverty rate, with 4 household (100.0%) living below poverty.
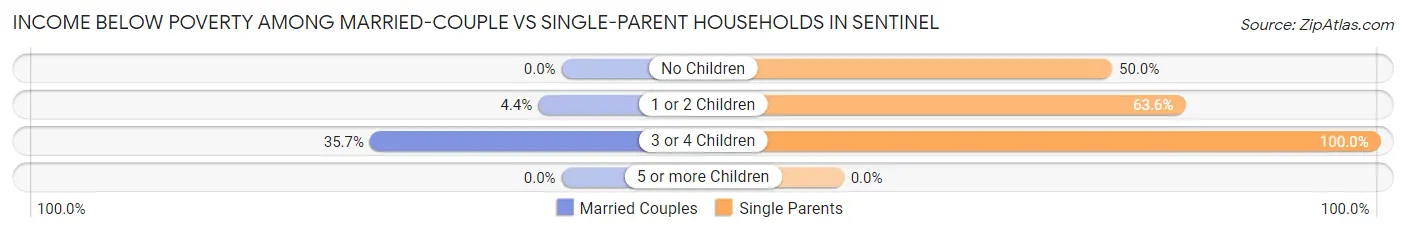
| Children | Married-Couple Families | Single-Parent Households |
| No Children | 0 (0.0%) | 6 (50.0%) |
| 1 or 2 Children | 2 (4.3%) | 14 (63.6%) |
| 3 or 4 Children | 5 (35.7%) | 4 (100.0%) |
| 5 or more Children | 0 (0.0%) | 0 (0.0%) |
| Total | 7 (2.5%) | 24 (63.2%) |
Race in Sentinel
The most populous races in Sentinel are White / Caucasian (766 | 78.7%), Hispanic or Latino (166 | 17.1%), and Some other Race (88 | 9.0%).
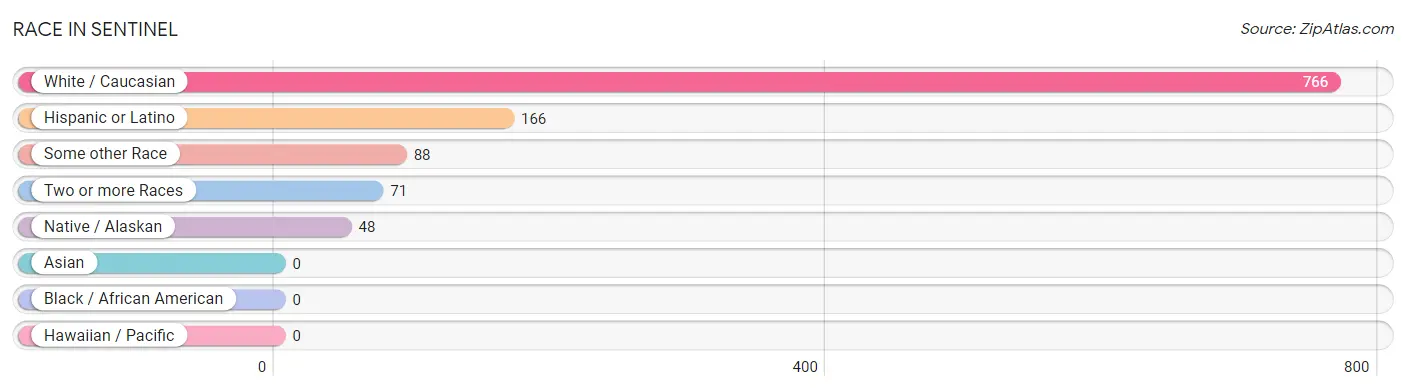
| Race | # Population | % Population |
| Asian | 0 | 0.0% |
| Black / African American | 0 | 0.0% |
| Hawaiian / Pacific | 0 | 0.0% |
| Hispanic or Latino | 166 | 17.1% |
| Native / Alaskan | 48 | 4.9% |
| White / Caucasian | 766 | 78.7% |
| Two or more Races | 71 | 7.3% |
| Some other Race | 88 | 9.0% |
| Total | 973 | 100.0% |
Ancestry in Sentinel
The most populous ancestries reported in Sentinel are Mexican (152 | 15.6%), German (125 | 12.9%), Irish (122 | 12.5%), English (87 | 8.9%), and American (64 | 6.6%), together accounting for 56.5% of all Sentinel residents.
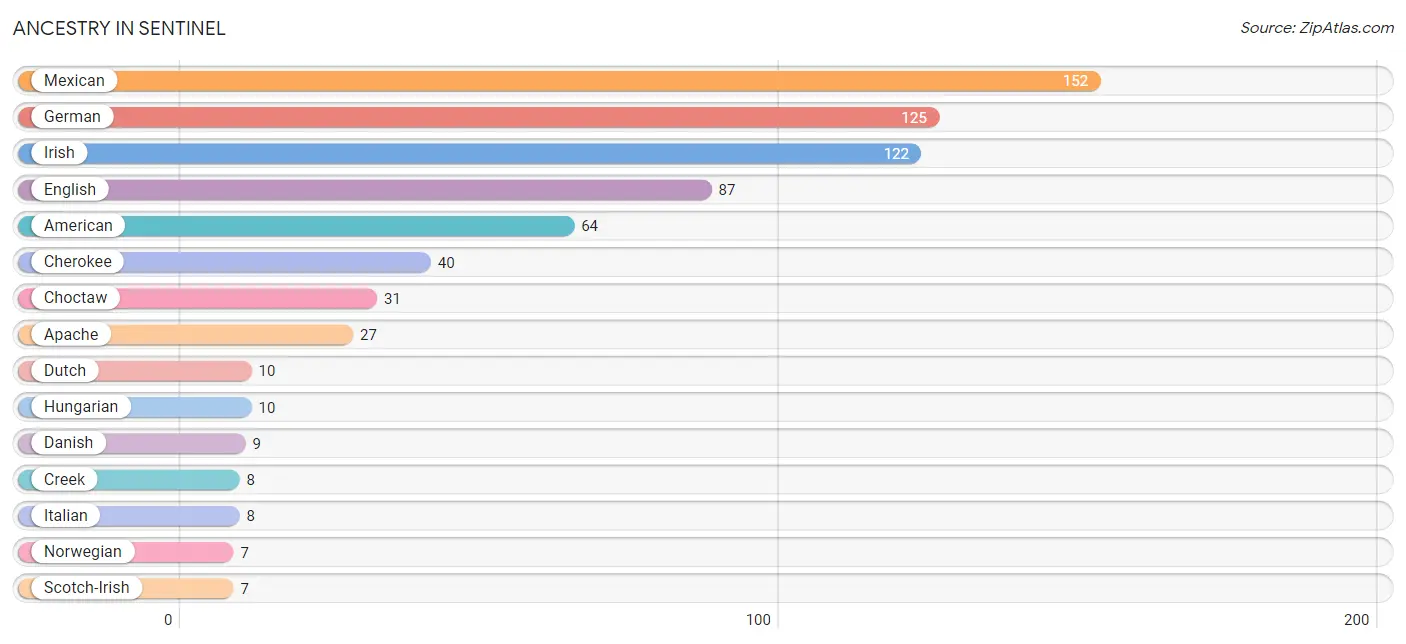
| Ancestry | # Population | % Population |
| American | 64 | 6.6% |
| Apache | 27 | 2.8% |
| Cherokee | 40 | 4.1% |
| Chickasaw | 2 | 0.2% |
| Choctaw | 31 | 3.2% |
| Comanche | 2 | 0.2% |
| Creek | 8 | 0.8% |
| Danish | 9 | 0.9% |
| Delaware | 2 | 0.2% |
| Dutch | 10 | 1.0% |
| English | 87 | 8.9% |
| European | 4 | 0.4% |
| French | 4 | 0.4% |
| German | 125 | 12.9% |
| Hungarian | 10 | 1.0% |
| Irish | 122 | 12.5% |
| Italian | 8 | 0.8% |
| Mexican | 152 | 15.6% |
| Norwegian | 7 | 0.7% |
| Polish | 2 | 0.2% |
| Potawatomi | 3 | 0.3% |
| Scotch-Irish | 7 | 0.7% |
| Scottish | 4 | 0.4% |
| Welsh | 2 | 0.2% | View All 24 Rows |
Immigrants in Sentinel
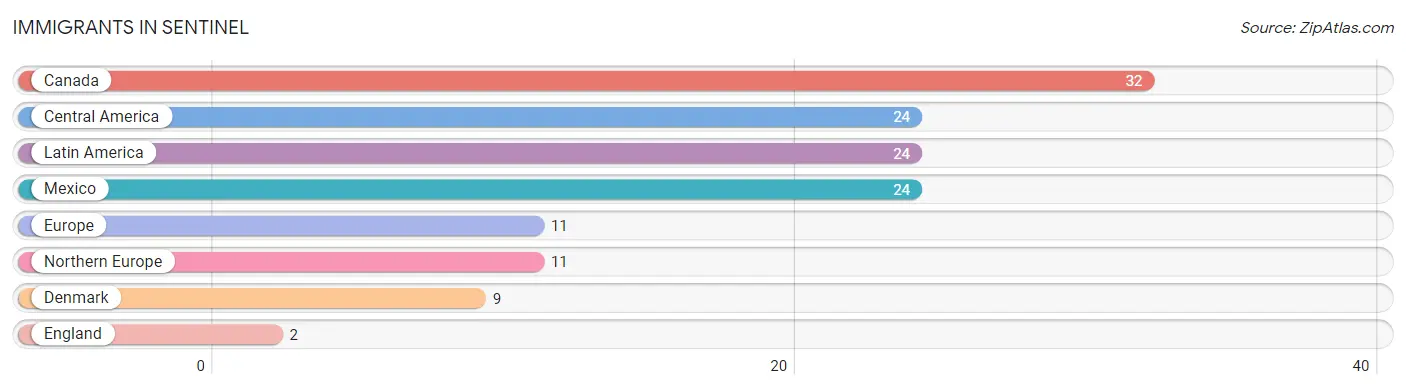
The most numerous immigrant groups reported in Sentinel came from Canada (32 | 3.3%), Central America (24 | 2.5%), Latin America (24 | 2.5%), Mexico (24 | 2.5%), and Europe (11 | 1.1%), together accounting for 11.8% of all Sentinel residents.
| Immigration Origin | # Population | % Population |
| Canada | 32 | 3.3% |
| Central America | 24 | 2.5% |
| Denmark | 9 | 0.9% |
| England | 2 | 0.2% |
| Europe | 11 | 1.1% |
| Latin America | 24 | 2.5% |
| Mexico | 24 | 2.5% |
| Northern Europe | 11 | 1.1% | View All 8 Rows |
Sex and Age in Sentinel
Sex and Age in Sentinel
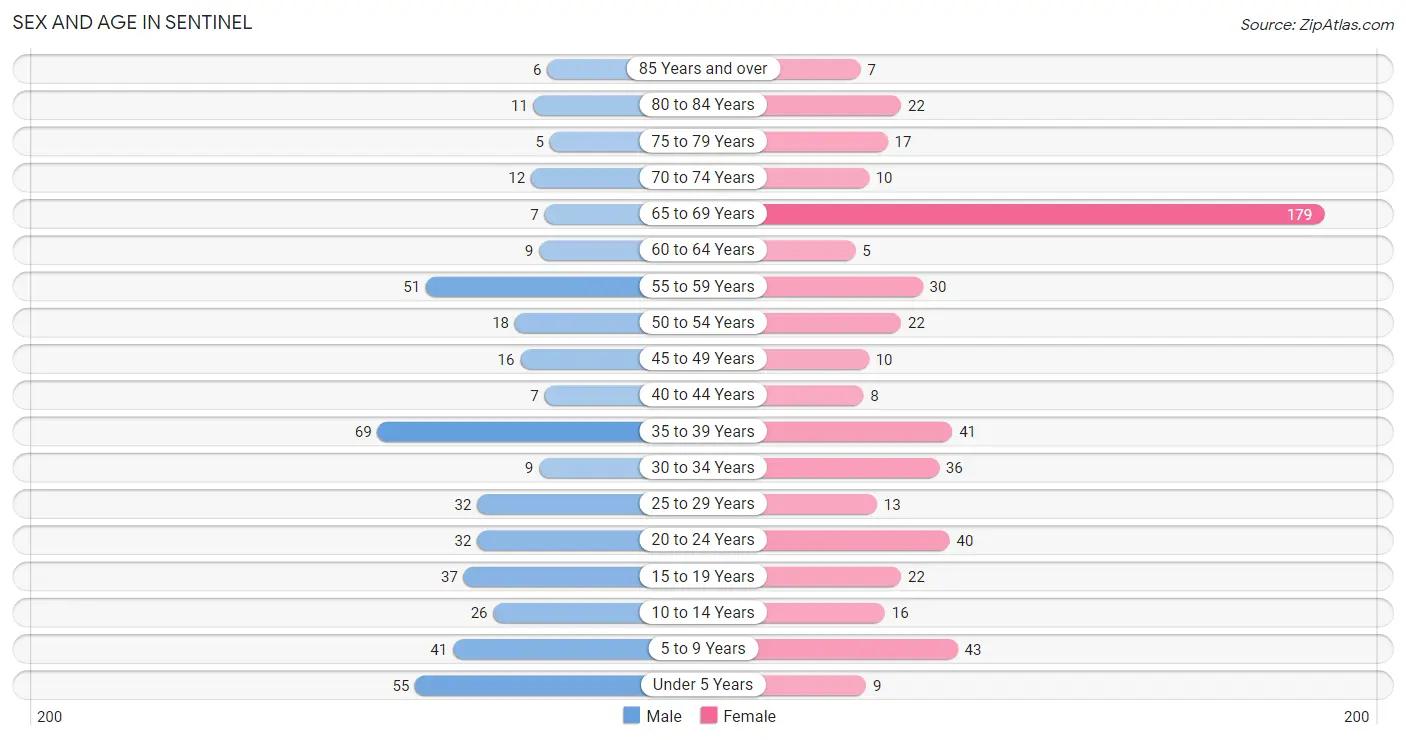
The most populous age groups in Sentinel are 35 to 39 Years (69 | 15.6%) for men and 65 to 69 Years (179 | 33.8%) for women.
| Age Bracket | Male | Female |
| Under 5 Years | 55 (12.4%) | 9 (1.7%) |
| 5 to 9 Years | 41 (9.3%) | 43 (8.1%) |
| 10 to 14 Years | 26 (5.9%) | 16 (3.0%) |
| 15 to 19 Years | 37 (8.4%) | 22 (4.2%) |
| 20 to 24 Years | 32 (7.2%) | 40 (7.5%) |
| 25 to 29 Years | 32 (7.2%) | 13 (2.5%) |
| 30 to 34 Years | 9 (2.0%) | 36 (6.8%) |
| 35 to 39 Years | 69 (15.6%) | 41 (7.7%) |
| 40 to 44 Years | 7 (1.6%) | 8 (1.5%) |
| 45 to 49 Years | 16 (3.6%) | 10 (1.9%) |
| 50 to 54 Years | 18 (4.1%) | 22 (4.2%) |
| 55 to 59 Years | 51 (11.5%) | 30 (5.7%) |
| 60 to 64 Years | 9 (2.0%) | 5 (0.9%) |
| 65 to 69 Years | 7 (1.6%) | 179 (33.8%) |
| 70 to 74 Years | 12 (2.7%) | 10 (1.9%) |
| 75 to 79 Years | 5 (1.1%) | 17 (3.2%) |
| 80 to 84 Years | 11 (2.5%) | 22 (4.2%) |
| 85 Years and over | 6 (1.3%) | 7 (1.3%) |
| Total | 443 (100.0%) | 530 (100.0%) |
Families and Households in Sentinel
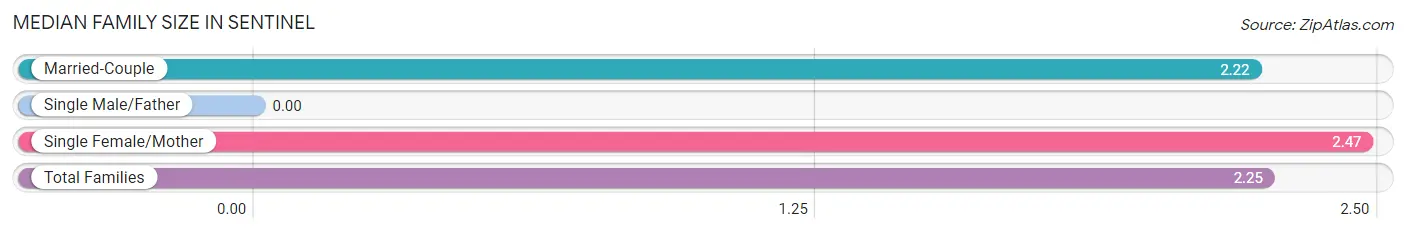
Median Family Size in Sentinel
| Family Type | # Families | Family Size |
| Married-Couple | 286 (88.3%) | 2.22 |
| Single Male/Father | 0 (0.0%) | - |
| Single Female/Mother | 38 (11.7%) | 2.47 |
| Total Families | 324 (100.0%) | 2.25 |
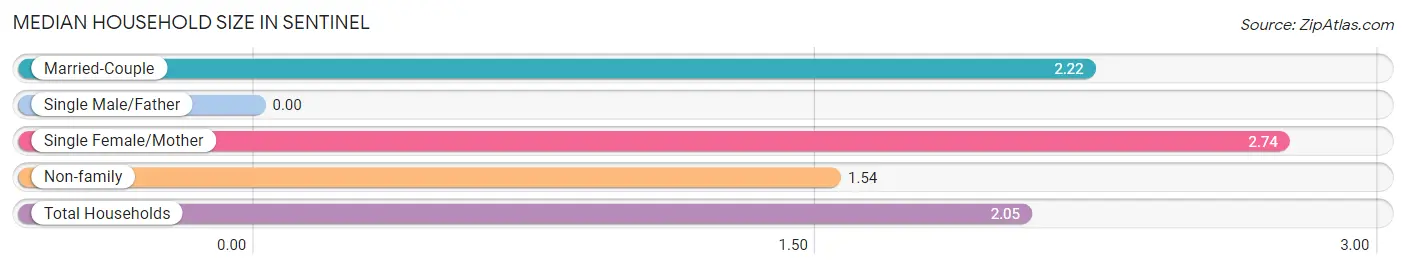
Median Household Size in Sentinel
| Household Type | # Households | Household Size |
| Married-Couple | 286 (60.2%) | 2.22 |
| Single Male/Father | 0 (0.0%) | - |
| Single Female/Mother | 38 (8.0%) | 2.74 |
| Non-family | 151 (31.8%) | 1.54 |
| Total Households | 475 (100.0%) | 2.05 |
Household Size by Marriage Status in Sentinel
Out of a total of 475 households in Sentinel, 324 (68.2%) are family households, while 151 (31.8%) are nonfamily households. The most numerous type of family households are 2-person households, comprising 239, and the most common type of nonfamily households are 1-person households, comprising 117.
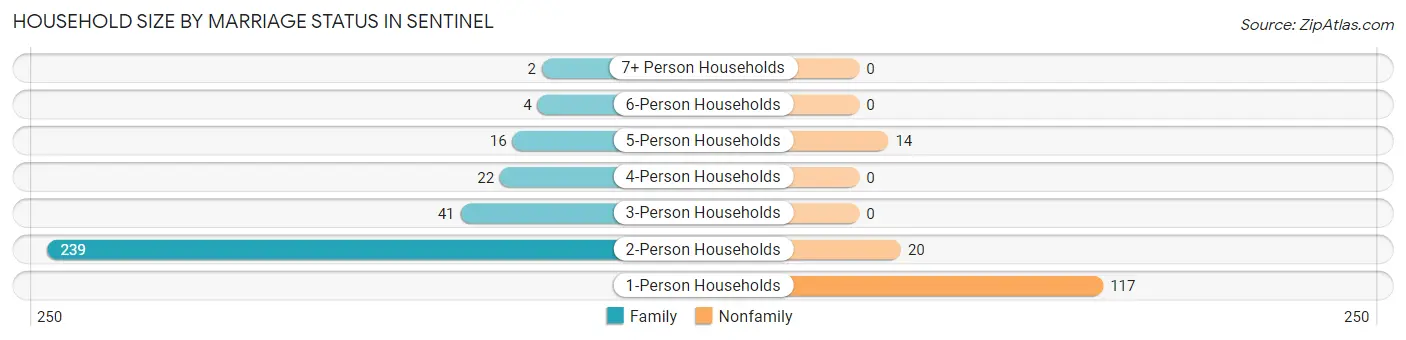
| Household Size | Family Households | Nonfamily Households |
| 1-Person Households | - | 117 (24.6%) |
| 2-Person Households | 239 (50.3%) | 20 (4.2%) |
| 3-Person Households | 41 (8.6%) | 0 (0.0%) |
| 4-Person Households | 22 (4.6%) | 0 (0.0%) |
| 5-Person Households | 16 (3.4%) | 14 (2.9%) |
| 6-Person Households | 4 (0.8%) | 0 (0.0%) |
| 7+ Person Households | 2 (0.4%) | 0 (0.0%) |
| Total | 324 (68.2%) | 151 (31.8%) |
Female Fertility in Sentinel
Fertility by Age in Sentinel
Average fertility rate in Sentinel is 47.0 births per 1,000 women. Women in the age bracket of 35 to 50 years have the highest fertility rate with 68.0 births per 1,000 women. Women in the age bracket of 20 to 34 years acount for 50.0% of all women with births.
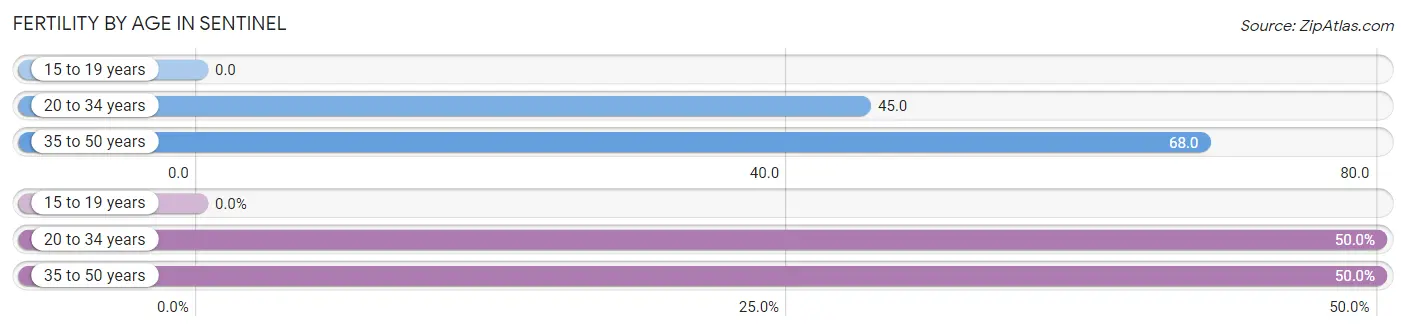
| Age Bracket | Women with Births | Births / 1,000 Women |
| 15 to 19 years | 0 (0.0%) | 0.0 |
| 20 to 34 years | 4 (50.0%) | 45.0 |
| 35 to 50 years | 4 (50.0%) | 68.0 |
| Total | 8 (100.0%) | 47.0 |
Fertility by Age by Marriage Status in Sentinel
50.0% of women with births (8) in Sentinel are married. The highest percentage of unmarried women with births falls into 20 to 34 years age bracket with 100.0% of them unmarried at the time of birth, while the lowest percentage of unmarried women with births belong to 35 to 50 years age bracket with 0.0% of them unmarried.
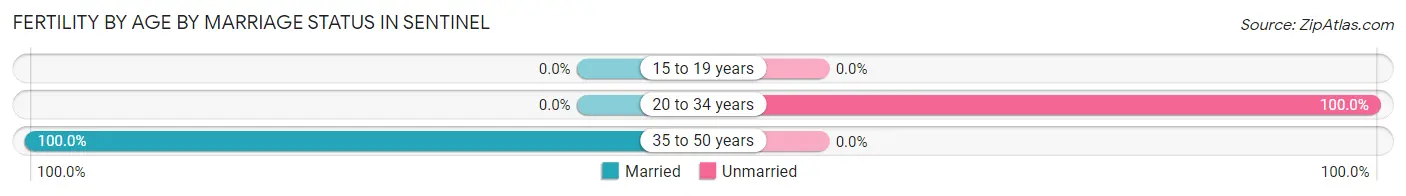
| Age Bracket | Married | Unmarried |
| 15 to 19 years | 0 (0.0%) | 0 (0.0%) |
| 20 to 34 years | 0 (0.0%) | 4 (100.0%) |
| 35 to 50 years | 4 (100.0%) | 0 (0.0%) |
| Total | 4 (50.0%) | 4 (50.0%) |
Fertility by Education in Sentinel
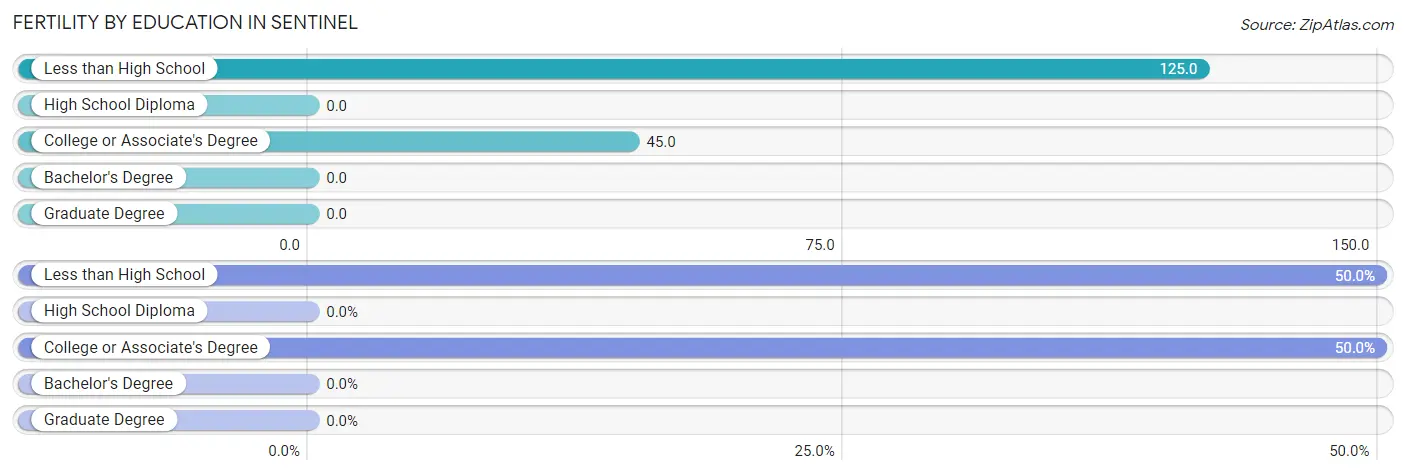
| Educational Attainment | Women with Births | Births / 1,000 Women |
| Less than High School | 4 (50.0%) | 125.0 |
| High School Diploma | 0 (0.0%) | 0.0 |
| College or Associate's Degree | 4 (50.0%) | 45.0 |
| Bachelor's Degree | 0 (0.0%) | 0.0 |
| Graduate Degree | 0 (0.0%) | 0.0 |
| Total | 8 (100.0%) | 47.0 |
Fertility by Education by Marriage Status in Sentinel
50.0% of women with births in Sentinel are unmarried. Women with the educational attainment of less than high school are most likely to be married with 100.0% of them married at childbirth, while women with the educational attainment of college or associate's degree are least likely to be married with 100.0% of them unmarried at childbirth.
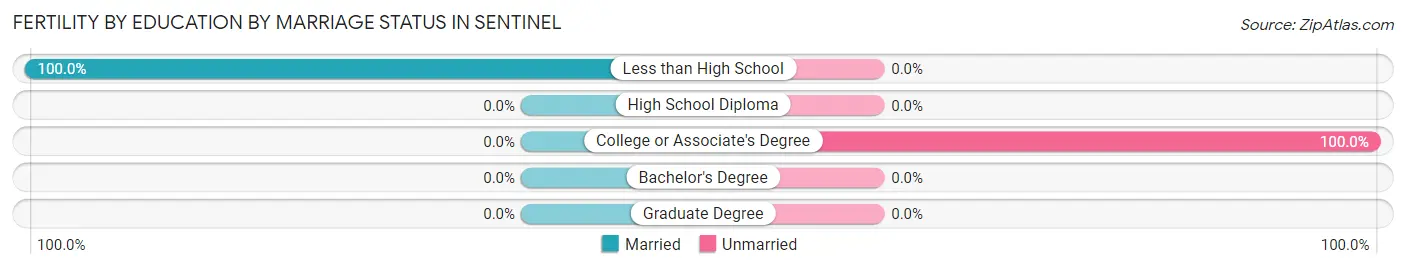
| Educational Attainment | Married | Unmarried |
| Less than High School | 4 (100.0%) | 0 (0.0%) |
| High School Diploma | 0 (0.0%) | 0 (0.0%) |
| College or Associate's Degree | 0 (0.0%) | 4 (100.0%) |
| Bachelor's Degree | 0 (0.0%) | 0 (0.0%) |
| Graduate Degree | 0 (0.0%) | 0 (0.0%) |
| Total | 4 (50.0%) | 4 (50.0%) |
Employment Characteristics in Sentinel
Employment by Class of Employer in Sentinel
Among the 538 employed individuals in Sentinel, private company employees (208 | 38.7%), not-for-profit organizations (191 | 35.5%), and local government employees (37 | 6.9%) make up the most common classes of employment.
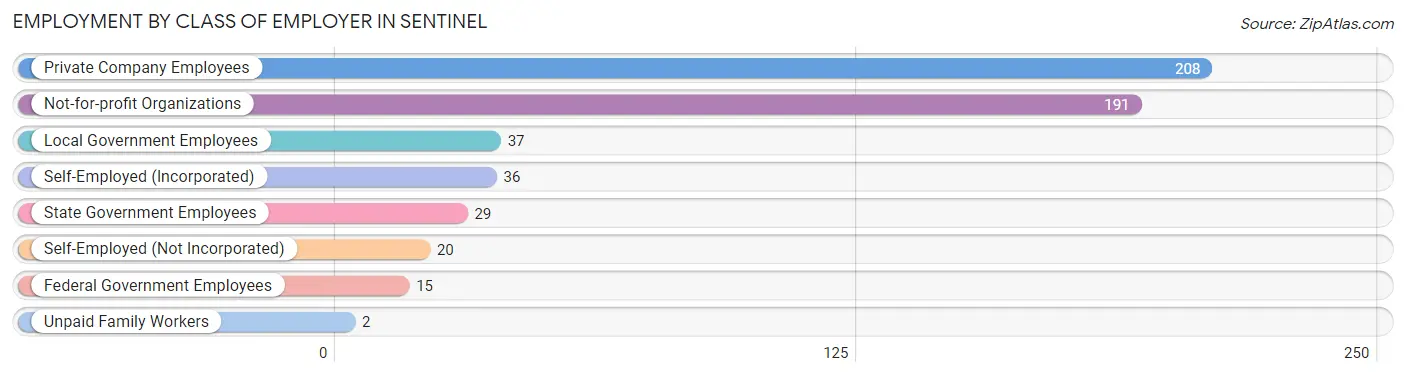
| Employer Class | # Employees | % Employees |
| Private Company Employees | 208 | 38.7% |
| Self-Employed (Incorporated) | 36 | 6.7% |
| Self-Employed (Not Incorporated) | 20 | 3.7% |
| Not-for-profit Organizations | 191 | 35.5% |
| Local Government Employees | 37 | 6.9% |
| State Government Employees | 29 | 5.4% |
| Federal Government Employees | 15 | 2.8% |
| Unpaid Family Workers | 2 | 0.4% |
| Total | 538 | 100.0% |
Employment Status by Age in Sentinel
According to the labor force statistics for Sentinel, out of the total population over 16 years of age (777), 71.7% or 557 individuals are in the labor force, with 2.6% or 14 of them unemployed. The age group with the highest labor force participation rate is 30 to 34 years, with 91.1% or 41 individuals in the labor force. Within the labor force, the 55 to 59 years age range has the highest percentage of unemployed individuals, with 13.7% or 7 of them being unemployed.
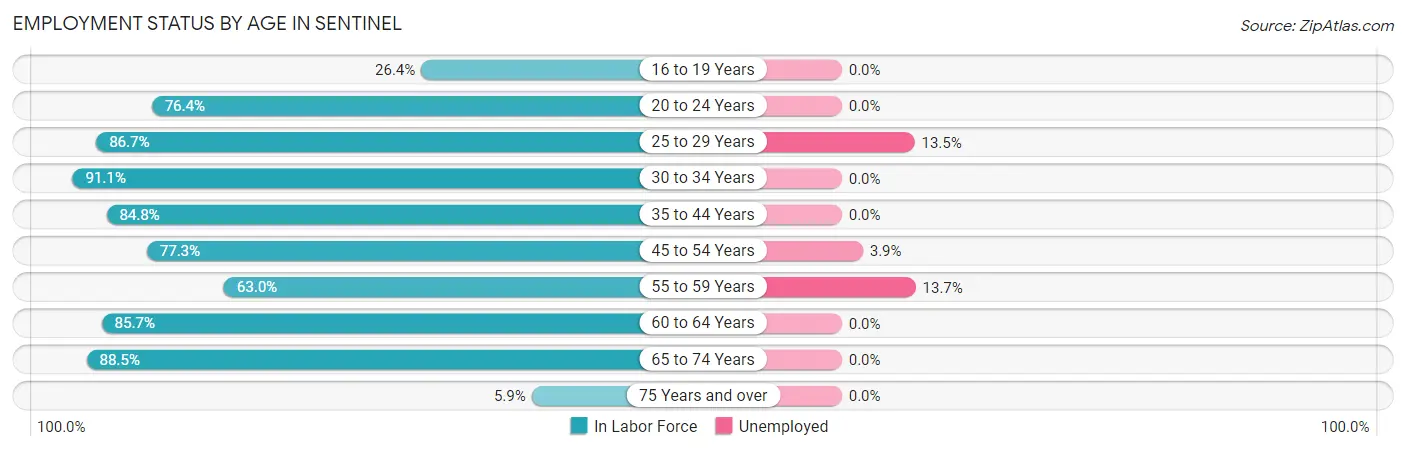
| Age Bracket | In Labor Force | Unemployed |
| 16 to 19 Years | 14 (26.4%) | 0 (0.0%) |
| 20 to 24 Years | 55 (76.4%) | 0 (0.0%) |
| 25 to 29 Years | 39 (86.7%) | 5 (13.5%) |
| 30 to 34 Years | 41 (91.1%) | 0 (0.0%) |
| 35 to 44 Years | 106 (84.8%) | 0 (0.0%) |
| 45 to 54 Years | 51 (77.3%) | 2 (3.9%) |
| 55 to 59 Years | 51 (63.0%) | 7 (13.7%) |
| 60 to 64 Years | 12 (85.7%) | 0 (0.0%) |
| 65 to 74 Years | 184 (88.5%) | 0 (0.0%) |
| 75 Years and over | 4 (5.9%) | 0 (0.0%) |
| Total | 557 (71.7%) | 14 (2.6%) |
Employment Status by Educational Attainment in Sentinel
According to labor force statistics for Sentinel, 79.8% of individuals (300) out of the total population between 25 and 64 years of age (376) are in the labor force, with 4.7% or 14 of them being unemployed. The group with the highest labor force participation rate are those with the educational attainment of bachelor's degree or higher, with 90.4% or 66 individuals in the labor force. Within the labor force, individuals with college / associate degree education have the highest percentage of unemployment, with 9.0% or 9 of them being unemployed.
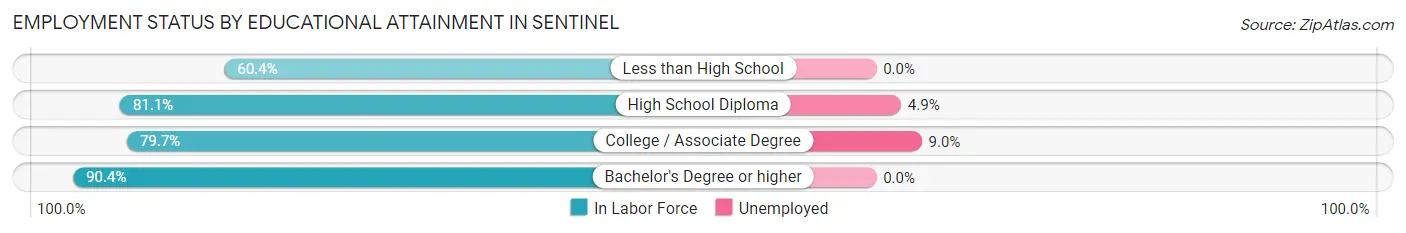
| Educational Attainment | In Labor Force | Unemployed |
| Less than High School | 29 (60.4%) | 0 (0.0%) |
| High School Diploma | 103 (81.1%) | 6 (4.9%) |
| College / Associate Degree | 102 (79.7%) | 12 (9.0%) |
| Bachelor's Degree or higher | 66 (90.4%) | 0 (0.0%) |
| Total | 300 (79.8%) | 18 (4.7%) |
Employment Occupations by Sex in Sentinel
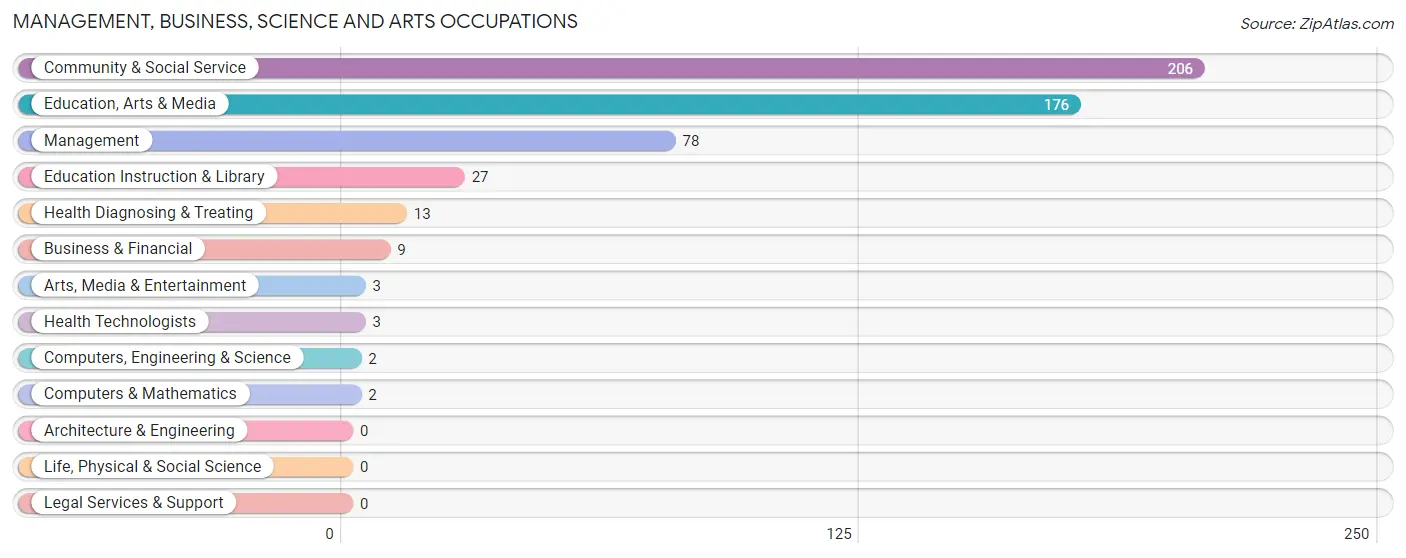
Management, Business, Science and Arts Occupations
The most common Management, Business, Science and Arts occupations in Sentinel are Community & Social Service (206 | 38.7%), Education, Arts & Media (176 | 33.0%), Management (78 | 14.6%), Education Instruction & Library (27 | 5.1%), and Health Diagnosing & Treating (13 | 2.4%).
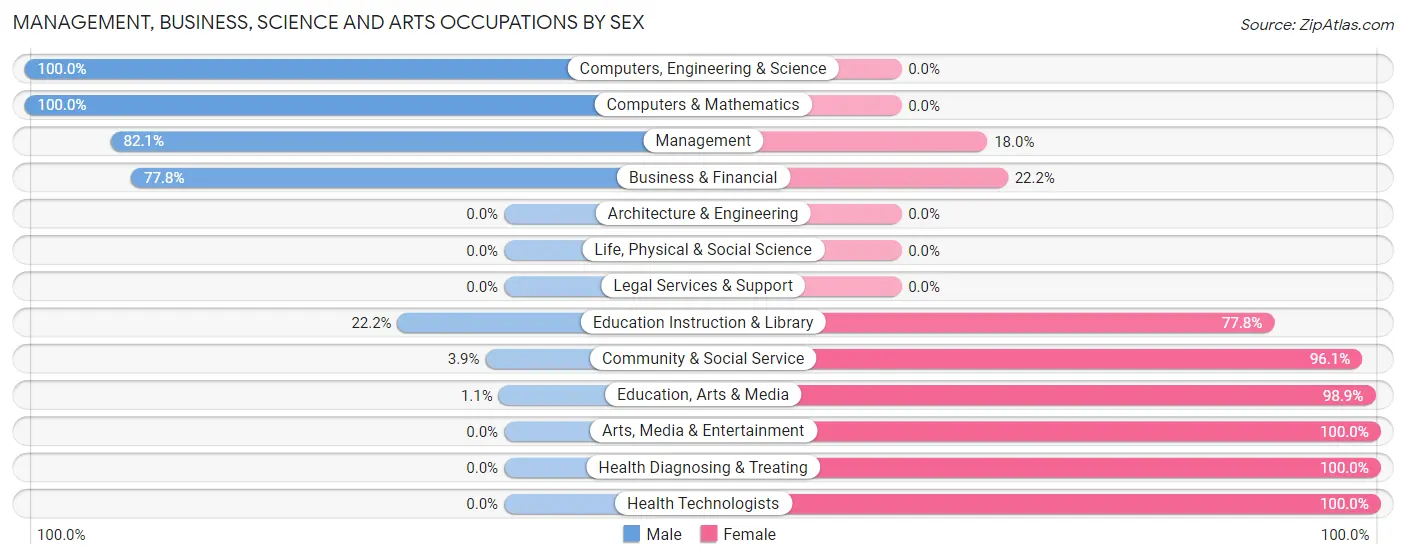
Management, Business, Science and Arts Occupations by Sex
Within the Management, Business, Science and Arts occupations in Sentinel, the most male-oriented occupations are Computers, Engineering & Science (100.0%), Computers & Mathematics (100.0%), and Management (82.1%), while the most female-oriented occupations are Arts, Media & Entertainment (100.0%), Health Diagnosing & Treating (100.0%), and Health Technologists (100.0%).
| Occupation | Male | Female |
| Management | 64 (82.1%) | 14 (17.9%) |
| Business & Financial | 7 (77.8%) | 2 (22.2%) |
| Computers, Engineering & Science | 2 (100.0%) | 0 (0.0%) |
| Computers & Mathematics | 2 (100.0%) | 0 (0.0%) |
| Architecture & Engineering | 0 (0.0%) | 0 (0.0%) |
| Life, Physical & Social Science | 0 (0.0%) | 0 (0.0%) |
| Community & Social Service | 8 (3.9%) | 198 (96.1%) |
| Education, Arts & Media | 2 (1.1%) | 174 (98.9%) |
| Legal Services & Support | 0 (0.0%) | 0 (0.0%) |
| Education Instruction & Library | 6 (22.2%) | 21 (77.8%) |
| Arts, Media & Entertainment | 0 (0.0%) | 3 (100.0%) |
| Health Diagnosing & Treating | 0 (0.0%) | 13 (100.0%) |
| Health Technologists | 0 (0.0%) | 3 (100.0%) |
| Total (Category) | 81 (26.3%) | 227 (73.7%) |
| Total (Overall) | 196 (36.8%) | 337 (63.2%) |
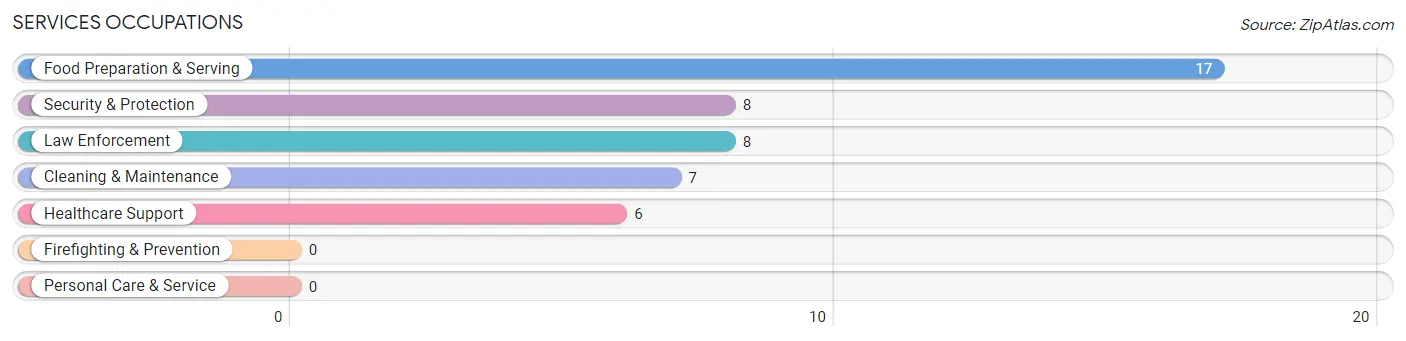
Services Occupations
The most common Services occupations in Sentinel are Food Preparation & Serving (17 | 3.2%), Security & Protection (8 | 1.5%), Law Enforcement (8 | 1.5%), Cleaning & Maintenance (7 | 1.3%), and Healthcare Support (6 | 1.1%).
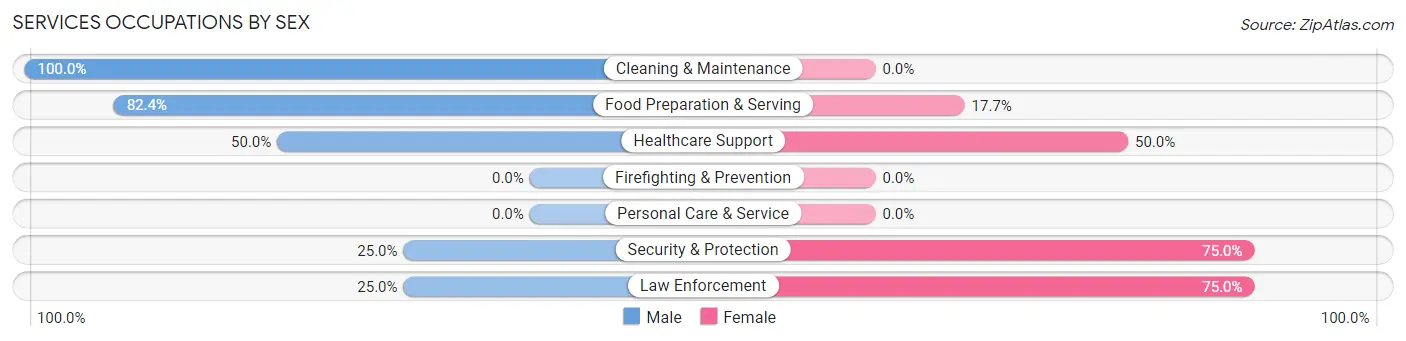
Services Occupations by Sex
Within the Services occupations in Sentinel, the most male-oriented occupations are Cleaning & Maintenance (100.0%), Food Preparation & Serving (82.4%), and Healthcare Support (50.0%), while the most female-oriented occupations are Security & Protection (75.0%), Law Enforcement (75.0%), and Healthcare Support (50.0%).
| Occupation | Male | Female |
| Healthcare Support | 3 (50.0%) | 3 (50.0%) |
| Security & Protection | 2 (25.0%) | 6 (75.0%) |
| Firefighting & Prevention | 0 (0.0%) | 0 (0.0%) |
| Law Enforcement | 2 (25.0%) | 6 (75.0%) |
| Food Preparation & Serving | 14 (82.4%) | 3 (17.6%) |
| Cleaning & Maintenance | 7 (100.0%) | 0 (0.0%) |
| Personal Care & Service | 0 (0.0%) | 0 (0.0%) |
| Total (Category) | 26 (68.4%) | 12 (31.6%) |
| Total (Overall) | 196 (36.8%) | 337 (63.2%) |
Sales and Office Occupations
The most common Sales and Office occupations in Sentinel are Sales & Related (59 | 11.1%), and Office & Administration (33 | 6.2%).
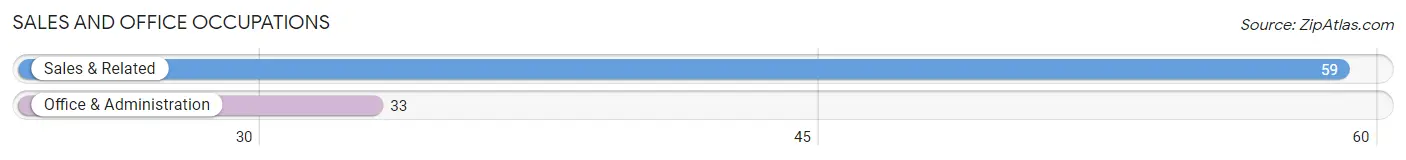
Sales and Office Occupations by Sex
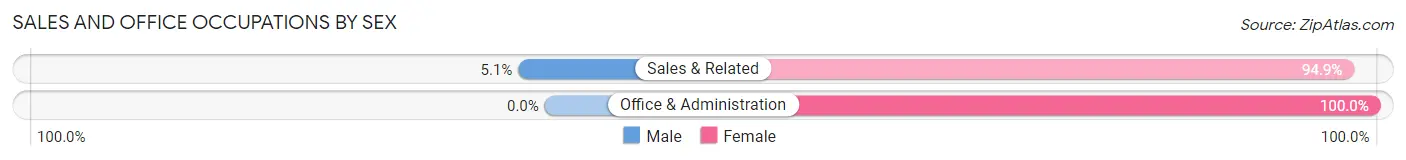
| Occupation | Male | Female |
| Sales & Related | 3 (5.1%) | 56 (94.9%) |
| Office & Administration | 0 (0.0%) | 33 (100.0%) |
| Total (Category) | 3 (3.3%) | 89 (96.7%) |
| Total (Overall) | 196 (36.8%) | 337 (63.2%) |
Natural Resources, Construction and Maintenance Occupations
The most common Natural Resources, Construction and Maintenance occupations in Sentinel are Construction & Extraction (31 | 5.8%), Installation, Maintenance & Repair (19 | 3.6%), and Farming, Fishing & Forestry (2 | 0.4%).
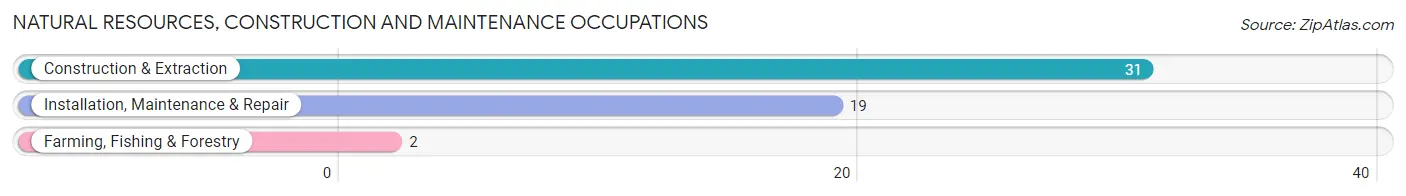
Natural Resources, Construction and Maintenance Occupations by Sex
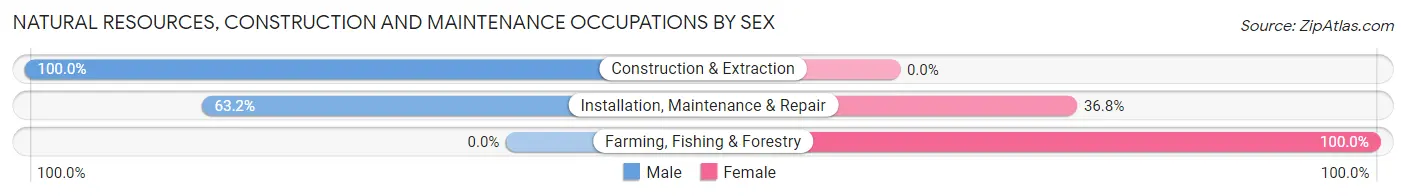
| Occupation | Male | Female |
| Farming, Fishing & Forestry | 0 (0.0%) | 2 (100.0%) |
| Construction & Extraction | 31 (100.0%) | 0 (0.0%) |
| Installation, Maintenance & Repair | 12 (63.2%) | 7 (36.8%) |
| Total (Category) | 43 (82.7%) | 9 (17.3%) |
| Total (Overall) | 196 (36.8%) | 337 (63.2%) |
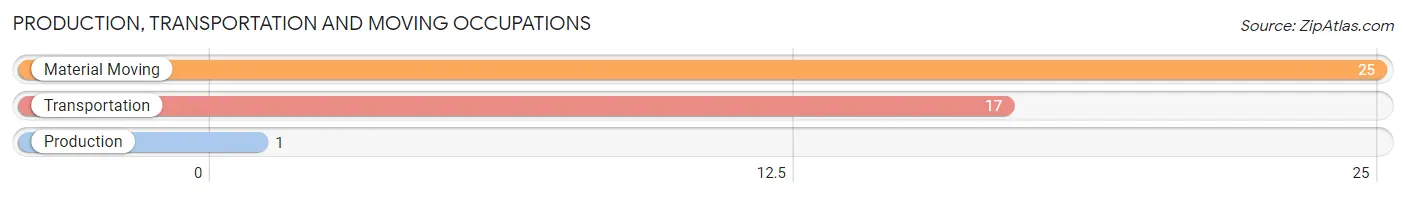
Production, Transportation and Moving Occupations
The most common Production, Transportation and Moving occupations in Sentinel are Material Moving (25 | 4.7%), Transportation (17 | 3.2%), and Production (1 | 0.2%).
Production, Transportation and Moving Occupations by Sex
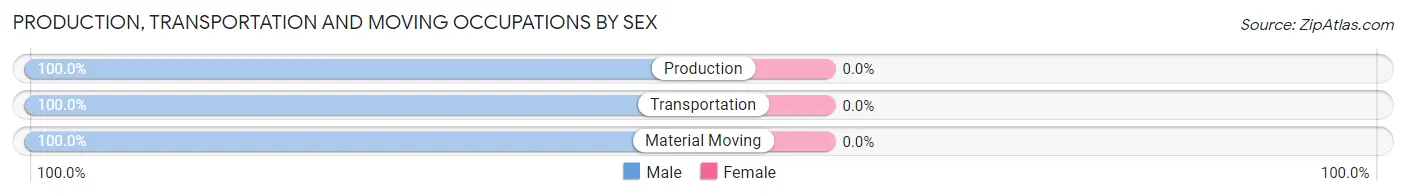
| Occupation | Male | Female |
| Production | 1 (100.0%) | 0 (0.0%) |
| Transportation | 17 (100.0%) | 0 (0.0%) |
| Material Moving | 25 (100.0%) | 0 (0.0%) |
| Total (Category) | 43 (100.0%) | 0 (0.0%) |
| Total (Overall) | 196 (36.8%) | 337 (63.2%) |
Employment Industries by Sex in Sentinel
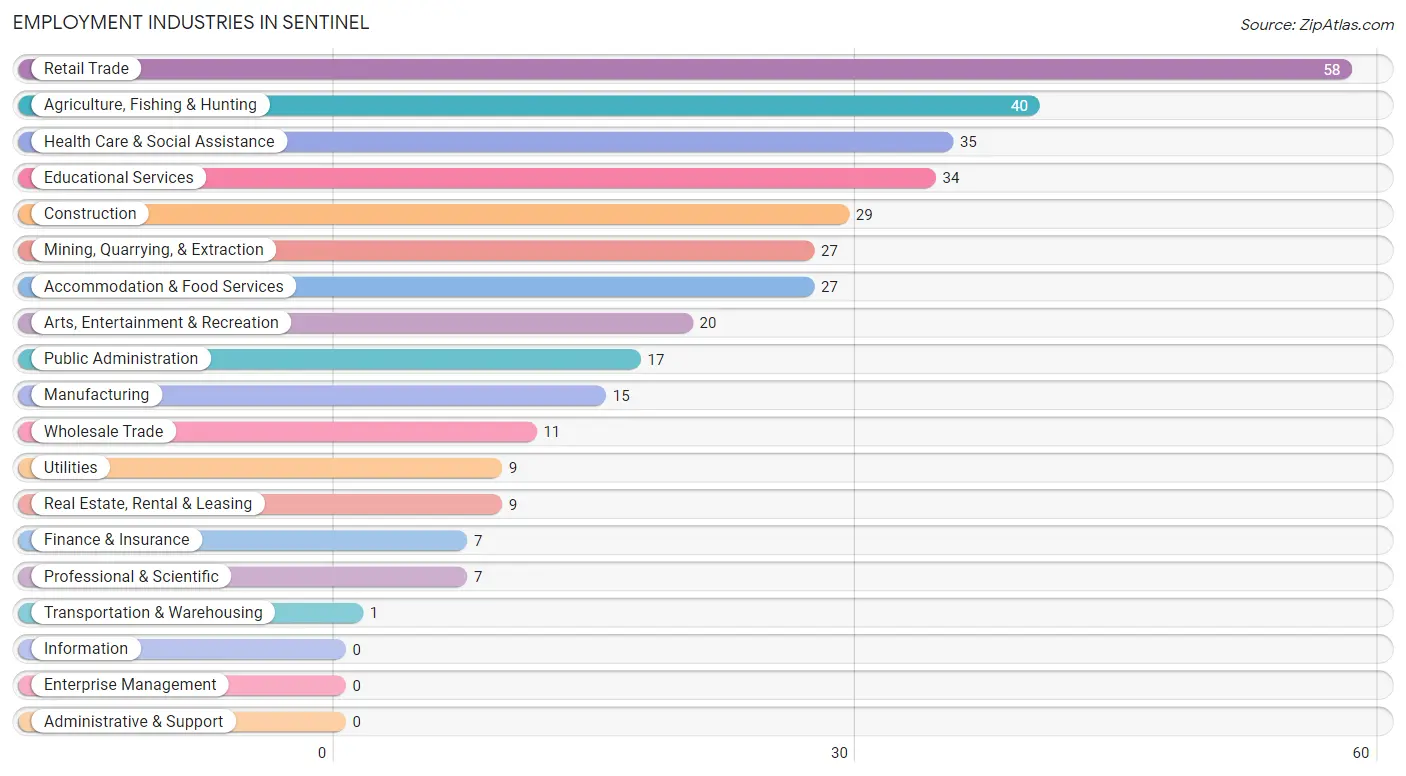
Employment Industries in Sentinel
The major employment industries in Sentinel include Retail Trade (58 | 10.9%), Agriculture, Fishing & Hunting (40 | 7.5%), Health Care & Social Assistance (35 | 6.6%), Educational Services (34 | 6.4%), and Construction (29 | 5.4%).
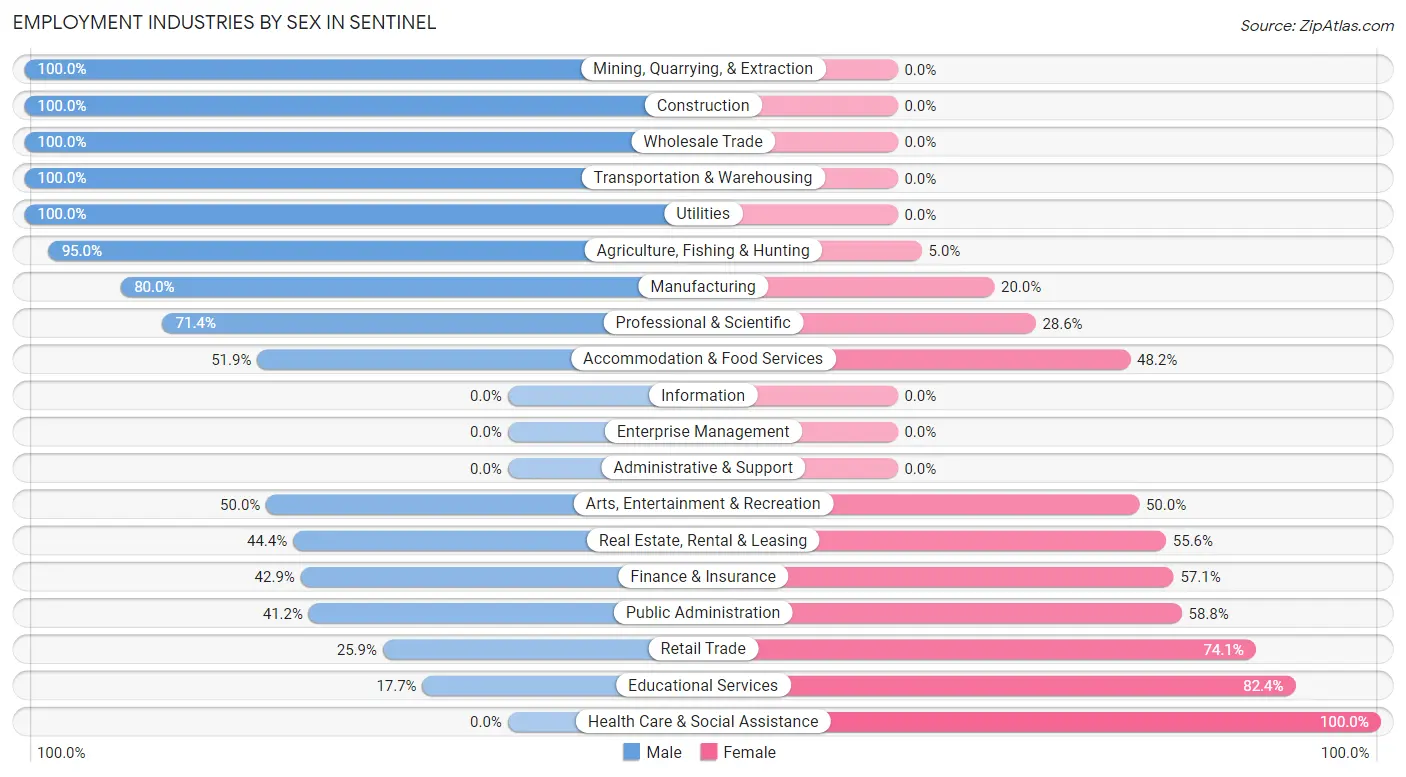
Employment Industries by Sex in Sentinel
The Sentinel industries that see more men than women are Mining, Quarrying, & Extraction (100.0%), Construction (100.0%), and Wholesale Trade (100.0%), whereas the industries that tend to have a higher number of women are Health Care & Social Assistance (100.0%), Educational Services (82.4%), and Retail Trade (74.1%).
| Industry | Male | Female |
| Agriculture, Fishing & Hunting | 38 (95.0%) | 2 (5.0%) |
| Mining, Quarrying, & Extraction | 27 (100.0%) | 0 (0.0%) |
| Construction | 29 (100.0%) | 0 (0.0%) |
| Manufacturing | 12 (80.0%) | 3 (20.0%) |
| Wholesale Trade | 11 (100.0%) | 0 (0.0%) |
| Retail Trade | 15 (25.9%) | 43 (74.1%) |
| Transportation & Warehousing | 1 (100.0%) | 0 (0.0%) |
| Utilities | 9 (100.0%) | 0 (0.0%) |
| Information | 0 (0.0%) | 0 (0.0%) |
| Finance & Insurance | 3 (42.9%) | 4 (57.1%) |
| Real Estate, Rental & Leasing | 4 (44.4%) | 5 (55.6%) |
| Professional & Scientific | 5 (71.4%) | 2 (28.6%) |
| Enterprise Management | 0 (0.0%) | 0 (0.0%) |
| Administrative & Support | 0 (0.0%) | 0 (0.0%) |
| Educational Services | 6 (17.6%) | 28 (82.4%) |
| Health Care & Social Assistance | 0 (0.0%) | 35 (100.0%) |
| Arts, Entertainment & Recreation | 10 (50.0%) | 10 (50.0%) |
| Accommodation & Food Services | 14 (51.8%) | 13 (48.1%) |
| Public Administration | 7 (41.2%) | 10 (58.8%) |
| Total | 196 (36.8%) | 337 (63.2%) |
Education in Sentinel
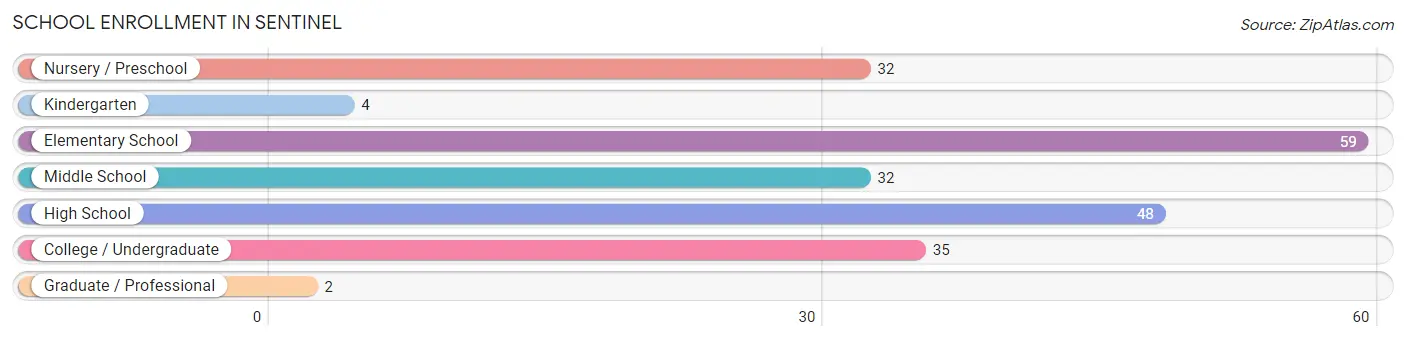
School Enrollment in Sentinel
The most common levels of schooling among the 212 students in Sentinel are elementary school (59 | 27.8%), high school (48 | 22.6%), and college / undergraduate (35 | 16.5%).
| School Level | # Students | % Students |
| Nursery / Preschool | 32 | 15.1% |
| Kindergarten | 4 | 1.9% |
| Elementary School | 59 | 27.8% |
| Middle School | 32 | 15.1% |
| High School | 48 | 22.6% |
| College / Undergraduate | 35 | 16.5% |
| Graduate / Professional | 2 | 0.9% |
| Total | 212 | 100.0% |
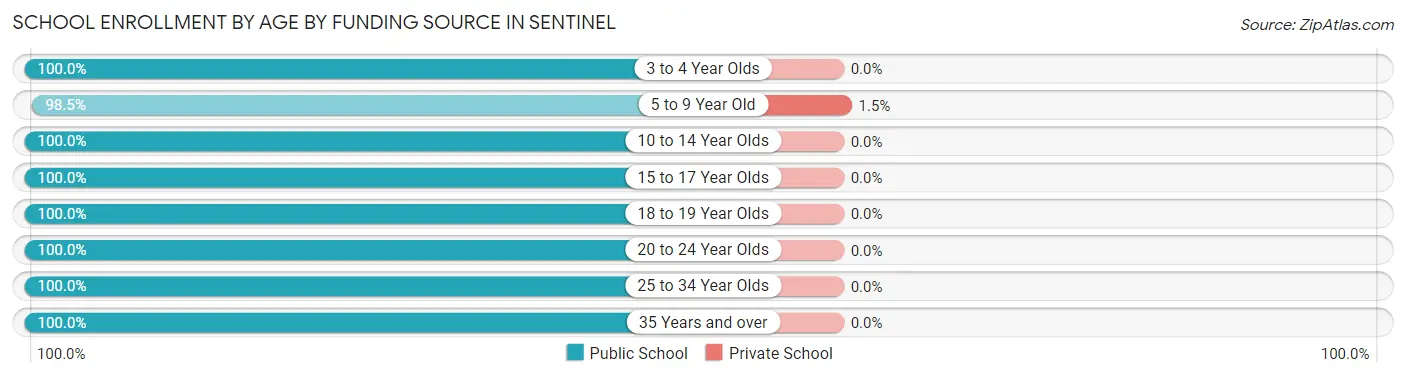
School Enrollment by Age by Funding Source in Sentinel
Out of a total of 212 students who are enrolled in schools in Sentinel, 1 (0.5%) attend a private institution, while the remaining 211 (99.5%) are enrolled in public schools. The age group of 5 to 9 year old has the highest likelihood of being enrolled in private schools, with 1 (1.5% in the age bracket) enrolled. Conversely, the age group of 3 to 4 year olds has the lowest likelihood of being enrolled in a private school, with 17 (100.0% in the age bracket) attending a public institution.
| Age Bracket | Public School | Private School |
| 3 to 4 Year Olds | 17 (100.0%) | 0 (0.0%) |
| 5 to 9 Year Old | 67 (98.5%) | 1 (1.5%) |
| 10 to 14 Year Olds | 42 (100.0%) | 0 (0.0%) |
| 15 to 17 Year Olds | 34 (100.0%) | 0 (0.0%) |
| 18 to 19 Year Olds | 25 (100.0%) | 0 (0.0%) |
| 20 to 24 Year Olds | 8 (100.0%) | 0 (0.0%) |
| 25 to 34 Year Olds | 4 (100.0%) | 0 (0.0%) |
| 35 Years and over | 14 (100.0%) | 0 (0.0%) |
| Total | 211 (99.5%) | 1 (0.5%) |
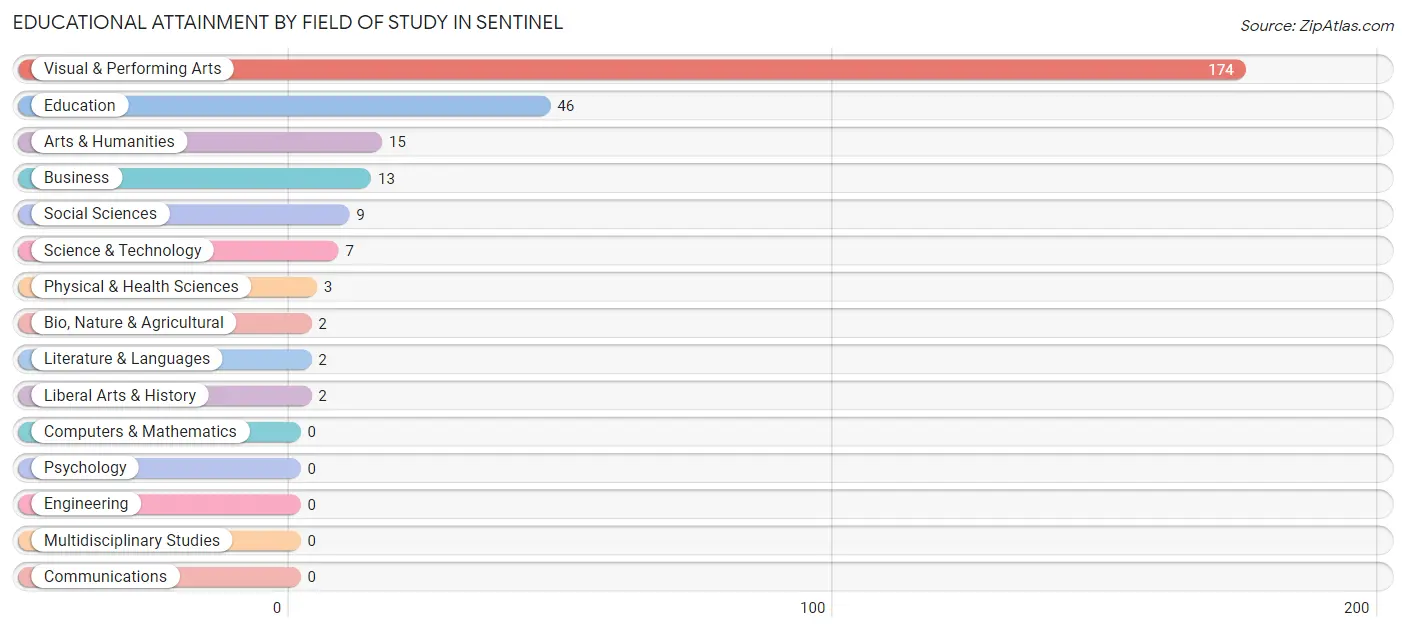
Educational Attainment by Field of Study in Sentinel
Visual & performing arts (174 | 63.7%), education (46 | 16.9%), arts & humanities (15 | 5.5%), business (13 | 4.8%), and social sciences (9 | 3.3%) are the most common fields of study among 273 individuals in Sentinel who have obtained a bachelor's degree or higher.
| Field of Study | # Graduates | % Graduates |
| Computers & Mathematics | 0 | 0.0% |
| Bio, Nature & Agricultural | 2 | 0.7% |
| Physical & Health Sciences | 3 | 1.1% |
| Psychology | 0 | 0.0% |
| Social Sciences | 9 | 3.3% |
| Engineering | 0 | 0.0% |
| Multidisciplinary Studies | 0 | 0.0% |
| Science & Technology | 7 | 2.6% |
| Business | 13 | 4.8% |
| Education | 46 | 16.9% |
| Literature & Languages | 2 | 0.7% |
| Liberal Arts & History | 2 | 0.7% |
| Visual & Performing Arts | 174 | 63.7% |
| Communications | 0 | 0.0% |
| Arts & Humanities | 15 | 5.5% |
| Total | 273 | 100.0% |
Transportation & Commute in Sentinel
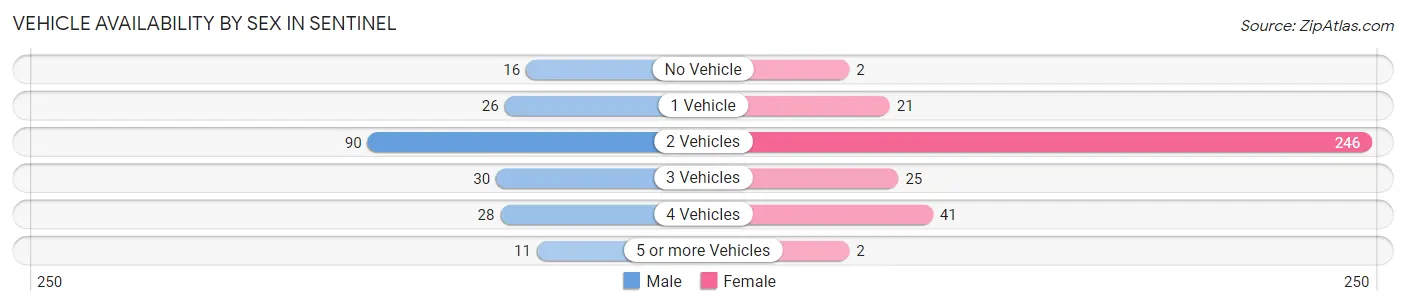
Vehicle Availability by Sex in Sentinel
The most prevalent vehicle ownership categories in Sentinel are males with 2 vehicles (90, accounting for 44.8%) and females with 2 vehicles (246, making up 26.7%).
| Vehicles Available | Male | Female |
| No Vehicle | 16 (8.0%) | 2 (0.6%) |
| 1 Vehicle | 26 (12.9%) | 21 (6.2%) |
| 2 Vehicles | 90 (44.8%) | 246 (73.0%) |
| 3 Vehicles | 30 (14.9%) | 25 (7.4%) |
| 4 Vehicles | 28 (13.9%) | 41 (12.2%) |
| 5 or more Vehicles | 11 (5.5%) | 2 (0.6%) |
| Total | 201 (100.0%) | 337 (100.0%) |
Commute Time in Sentinel
The most frequently occuring commute durations in Sentinel are less than 5 minutes (234 commuters, 44.6%), 15 to 19 minutes (55 commuters, 10.5%), and 5 to 9 minutes (50 commuters, 9.5%).
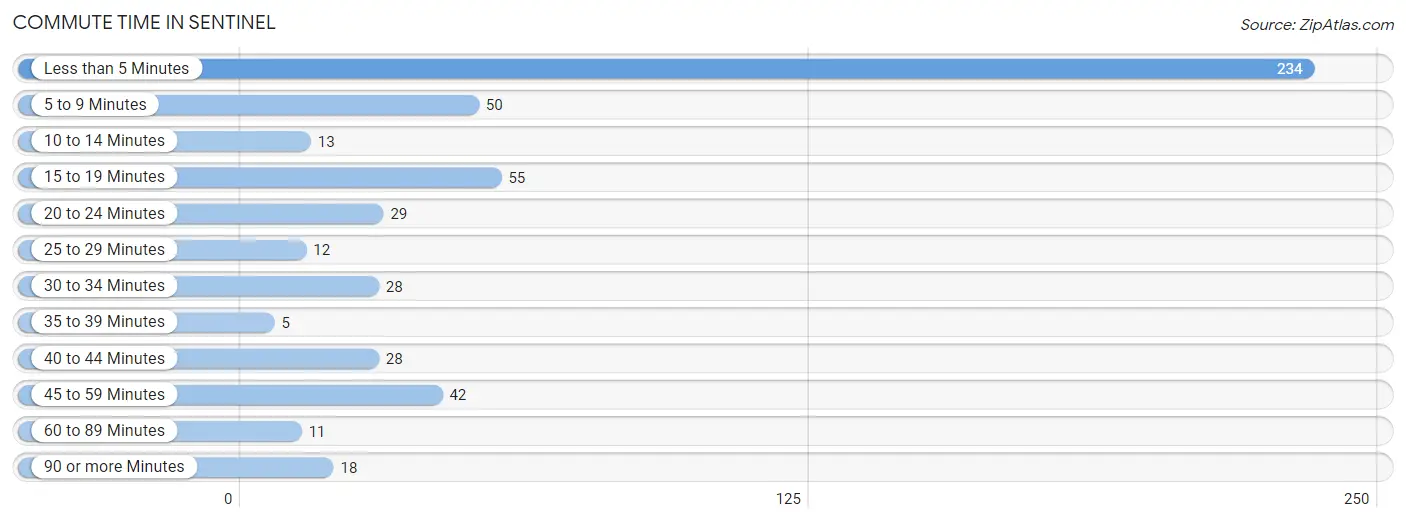
| Commute Time | # Commuters | % Commuters |
| Less than 5 Minutes | 234 | 44.6% |
| 5 to 9 Minutes | 50 | 9.5% |
| 10 to 14 Minutes | 13 | 2.5% |
| 15 to 19 Minutes | 55 | 10.5% |
| 20 to 24 Minutes | 29 | 5.5% |
| 25 to 29 Minutes | 12 | 2.3% |
| 30 to 34 Minutes | 28 | 5.3% |
| 35 to 39 Minutes | 5 | 0.9% |
| 40 to 44 Minutes | 28 | 5.3% |
| 45 to 59 Minutes | 42 | 8.0% |
| 60 to 89 Minutes | 11 | 2.1% |
| 90 or more Minutes | 18 | 3.4% |
Commute Time by Sex in Sentinel
The most common commute times in Sentinel are 15 to 19 minutes (45 commuters, 23.8%) for males and less than 5 minutes (217 commuters, 64.6%) for females.
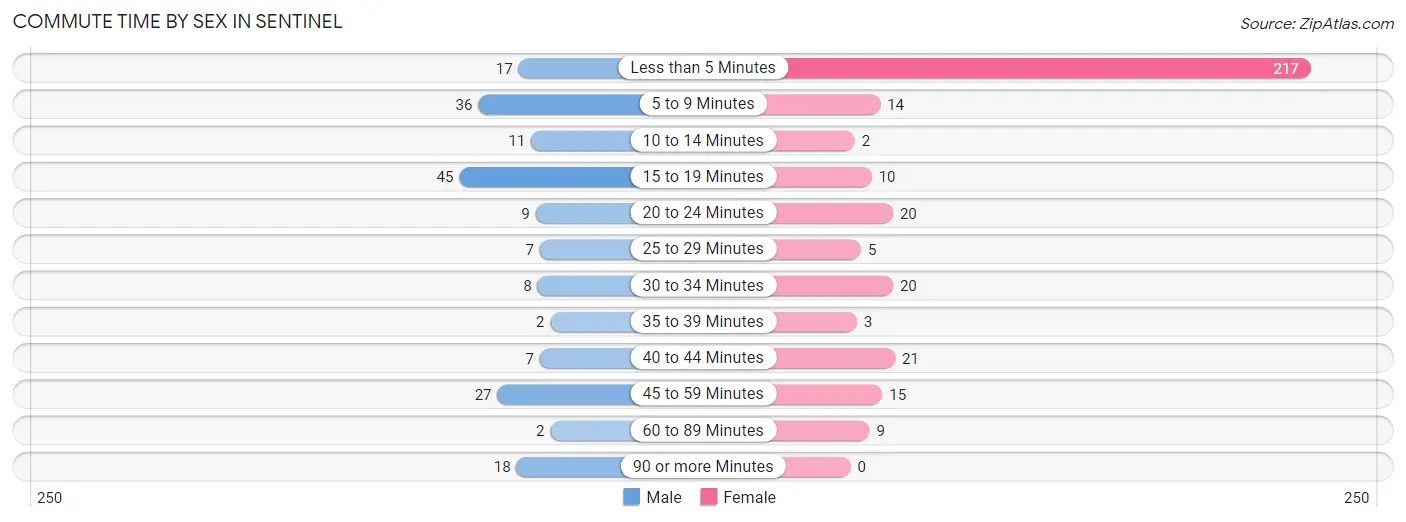
| Commute Time | Male | Female |
| Less than 5 Minutes | 17 (9.0%) | 217 (64.6%) |
| 5 to 9 Minutes | 36 (19.1%) | 14 (4.2%) |
| 10 to 14 Minutes | 11 (5.8%) | 2 (0.6%) |
| 15 to 19 Minutes | 45 (23.8%) | 10 (3.0%) |
| 20 to 24 Minutes | 9 (4.8%) | 20 (5.9%) |
| 25 to 29 Minutes | 7 (3.7%) | 5 (1.5%) |
| 30 to 34 Minutes | 8 (4.2%) | 20 (5.9%) |
| 35 to 39 Minutes | 2 (1.1%) | 3 (0.9%) |
| 40 to 44 Minutes | 7 (3.7%) | 21 (6.2%) |
| 45 to 59 Minutes | 27 (14.3%) | 15 (4.5%) |
| 60 to 89 Minutes | 2 (1.1%) | 9 (2.7%) |
| 90 or more Minutes | 18 (9.5%) | 0 (0.0%) |
Time of Departure to Work by Sex in Sentinel
The most frequent times of departure to work in Sentinel are 7:30 AM to 7:59 AM (49, 25.9%) for males and 9:00 AM to 9:59 AM (197, 58.6%) for females.
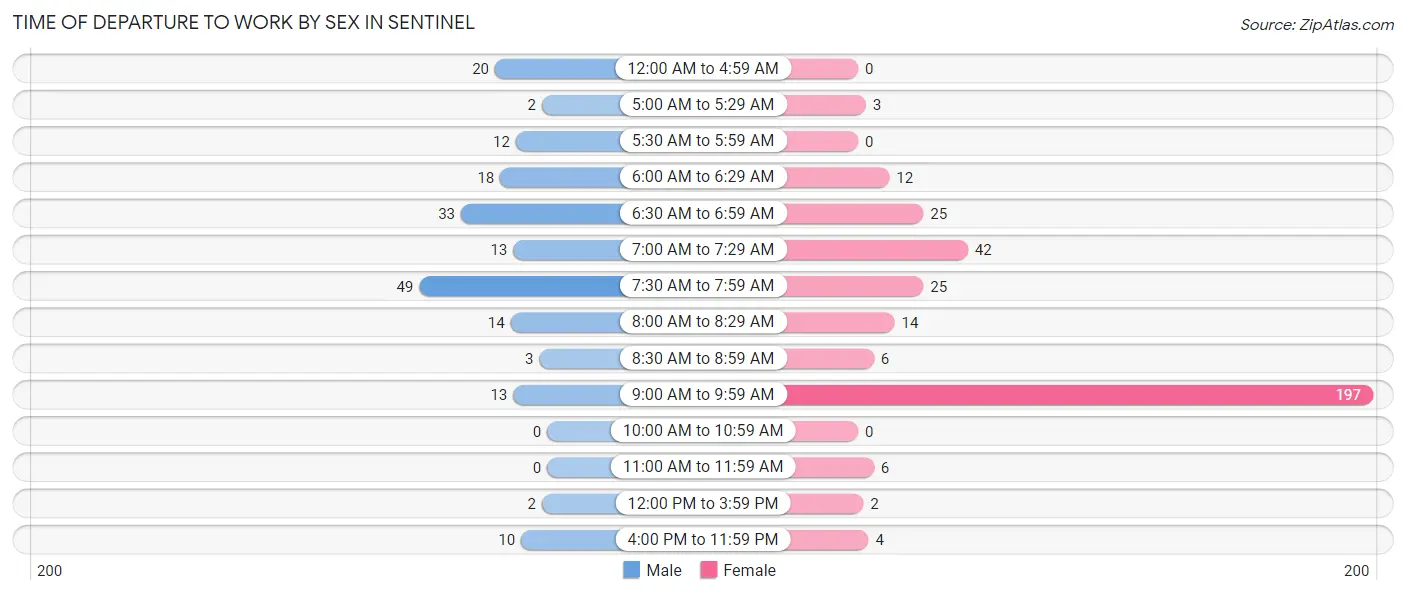
| Time of Departure | Male | Female |
| 12:00 AM to 4:59 AM | 20 (10.6%) | 0 (0.0%) |
| 5:00 AM to 5:29 AM | 2 (1.1%) | 3 (0.9%) |
| 5:30 AM to 5:59 AM | 12 (6.4%) | 0 (0.0%) |
| 6:00 AM to 6:29 AM | 18 (9.5%) | 12 (3.6%) |
| 6:30 AM to 6:59 AM | 33 (17.5%) | 25 (7.4%) |
| 7:00 AM to 7:29 AM | 13 (6.9%) | 42 (12.5%) |
| 7:30 AM to 7:59 AM | 49 (25.9%) | 25 (7.4%) |
| 8:00 AM to 8:29 AM | 14 (7.4%) | 14 (4.2%) |
| 8:30 AM to 8:59 AM | 3 (1.6%) | 6 (1.8%) |
| 9:00 AM to 9:59 AM | 13 (6.9%) | 197 (58.6%) |
| 10:00 AM to 10:59 AM | 0 (0.0%) | 0 (0.0%) |
| 11:00 AM to 11:59 AM | 0 (0.0%) | 6 (1.8%) |
| 12:00 PM to 3:59 PM | 2 (1.1%) | 2 (0.6%) |
| 4:00 PM to 11:59 PM | 10 (5.3%) | 4 (1.2%) |
| Total | 189 (100.0%) | 336 (100.0%) |
Housing Occupancy in Sentinel
Occupancy by Ownership in Sentinel
Of the total 475 dwellings in Sentinel, owner-occupied units account for 373 (78.5%), while renter-occupied units make up 102 (21.5%).
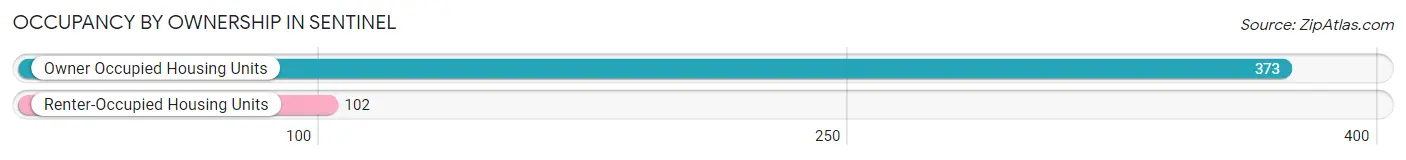
| Occupancy | # Housing Units | % Housing Units |
| Owner Occupied Housing Units | 373 | 78.5% |
| Renter-Occupied Housing Units | 102 | 21.5% |
| Total Occupied Housing Units | 475 | 100.0% |
Occupancy by Household Size in Sentinel
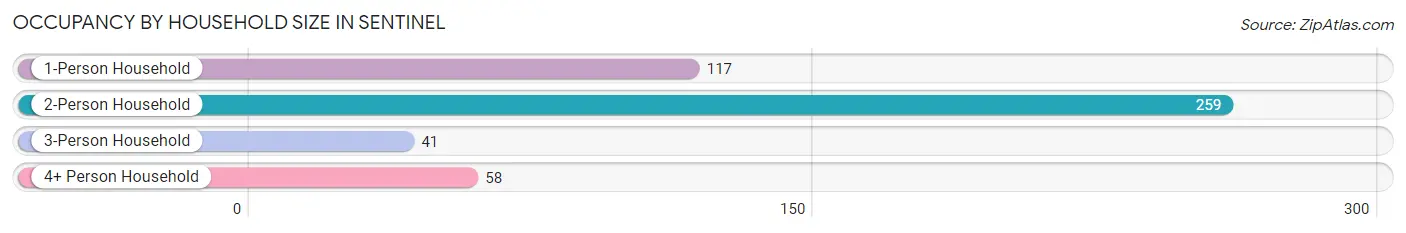
| Household Size | # Housing Units | % Housing Units |
| 1-Person Household | 117 | 24.6% |
| 2-Person Household | 259 | 54.5% |
| 3-Person Household | 41 | 8.6% |
| 4+ Person Household | 58 | 12.2% |
| Total Housing Units | 475 | 100.0% |
Occupancy by Ownership by Household Size in Sentinel
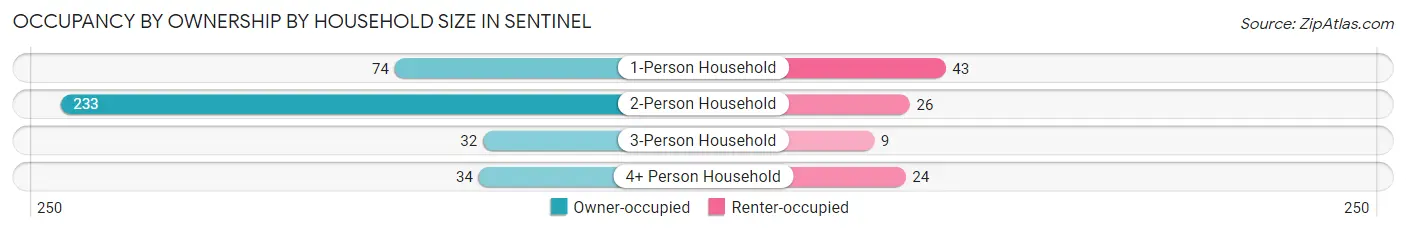
| Household Size | Owner-occupied | Renter-occupied |
| 1-Person Household | 74 (63.2%) | 43 (36.7%) |
| 2-Person Household | 233 (90.0%) | 26 (10.0%) |
| 3-Person Household | 32 (78.0%) | 9 (22.0%) |
| 4+ Person Household | 34 (58.6%) | 24 (41.4%) |
| Total Housing Units | 373 (78.5%) | 102 (21.5%) |
Occupancy by Educational Attainment in Sentinel
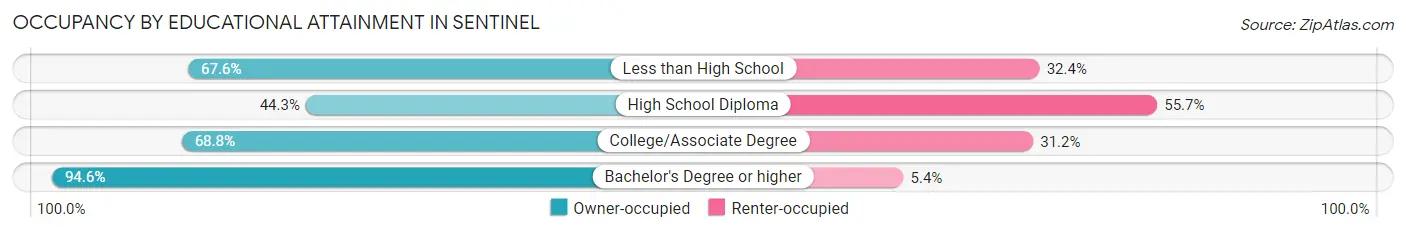
| Household Size | Owner-occupied | Renter-occupied |
| Less than High School | 25 (67.6%) | 12 (32.4%) |
| High School Diploma | 27 (44.3%) | 34 (55.7%) |
| College/Associate Degree | 95 (68.8%) | 43 (31.2%) |
| Bachelor's Degree or higher | 226 (94.6%) | 13 (5.4%) |
Occupancy by Age of Householder in Sentinel
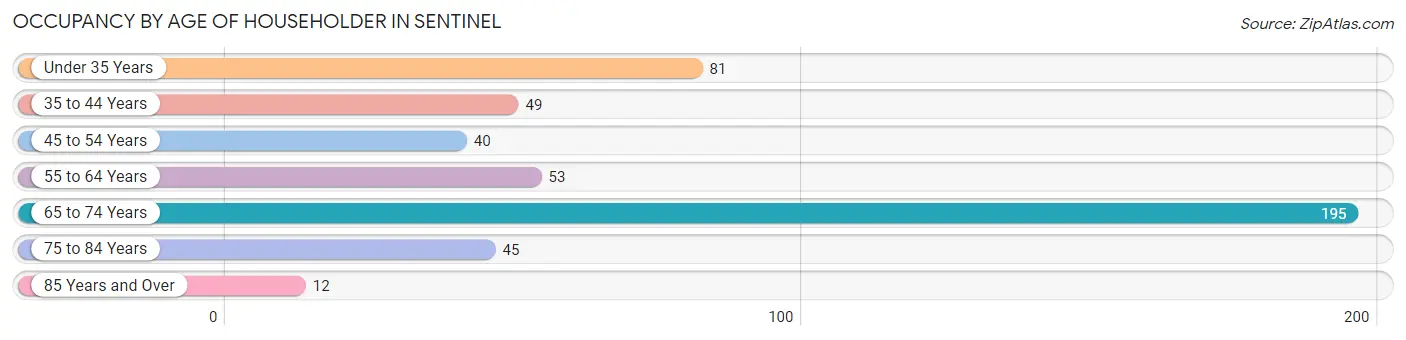
| Age Bracket | # Households | % Households |
| Under 35 Years | 81 | 17.1% |
| 35 to 44 Years | 49 | 10.3% |
| 45 to 54 Years | 40 | 8.4% |
| 55 to 64 Years | 53 | 11.2% |
| 65 to 74 Years | 195 | 41.0% |
| 75 to 84 Years | 45 | 9.5% |
| 85 Years and Over | 12 | 2.5% |
| Total | 475 | 100.0% |
Housing Finances in Sentinel
Median Income by Occupancy in Sentinel
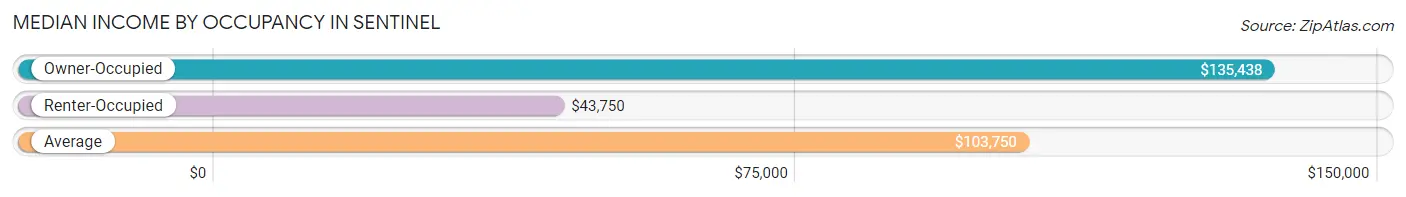
| Occupancy Type | # Households | Median Income |
| Owner-Occupied | 373 (78.5%) | $135,438 |
| Renter-Occupied | 102 (21.5%) | $43,750 |
| Average | 475 (100.0%) | $103,750 |
Occupancy by Householder Income Bracket in Sentinel
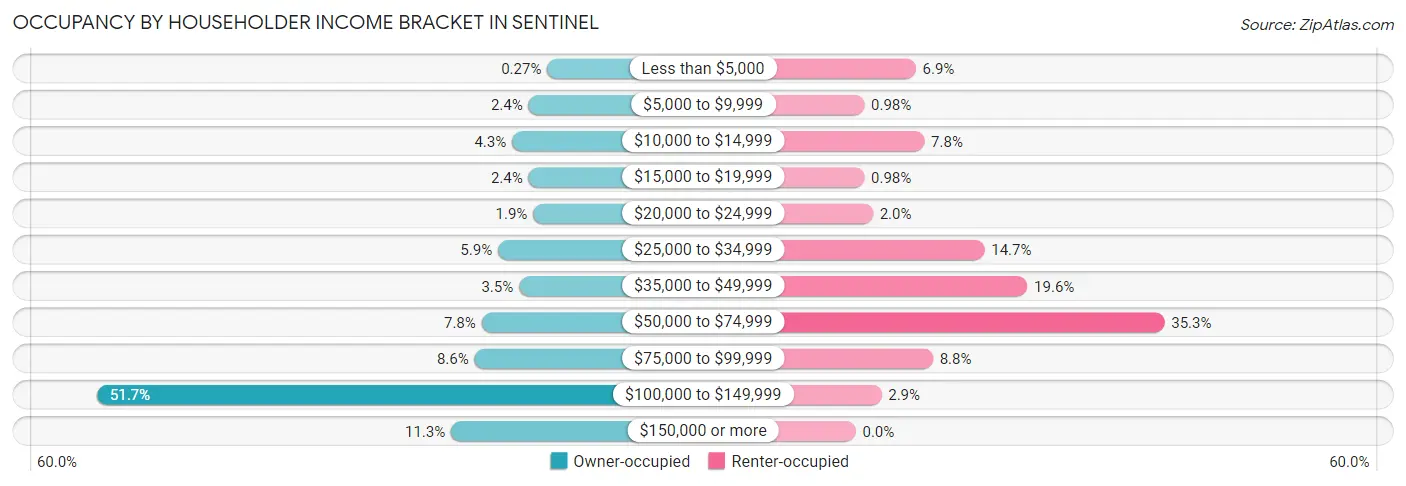
| Income Bracket | Owner-occupied | Renter-occupied |
| Less than $5,000 | 1 (0.3%) | 7 (6.9%) |
| $5,000 to $9,999 | 9 (2.4%) | 1 (1.0%) |
| $10,000 to $14,999 | 16 (4.3%) | 8 (7.8%) |
| $15,000 to $19,999 | 9 (2.4%) | 1 (1.0%) |
| $20,000 to $24,999 | 7 (1.9%) | 2 (2.0%) |
| $25,000 to $34,999 | 22 (5.9%) | 15 (14.7%) |
| $35,000 to $49,999 | 13 (3.5%) | 20 (19.6%) |
| $50,000 to $74,999 | 29 (7.8%) | 36 (35.3%) |
| $75,000 to $99,999 | 32 (8.6%) | 9 (8.8%) |
| $100,000 to $149,999 | 193 (51.7%) | 3 (2.9%) |
| $150,000 or more | 42 (11.3%) | 0 (0.0%) |
| Total | 373 (100.0%) | 102 (100.0%) |
Monthly Housing Cost Tiers in Sentinel
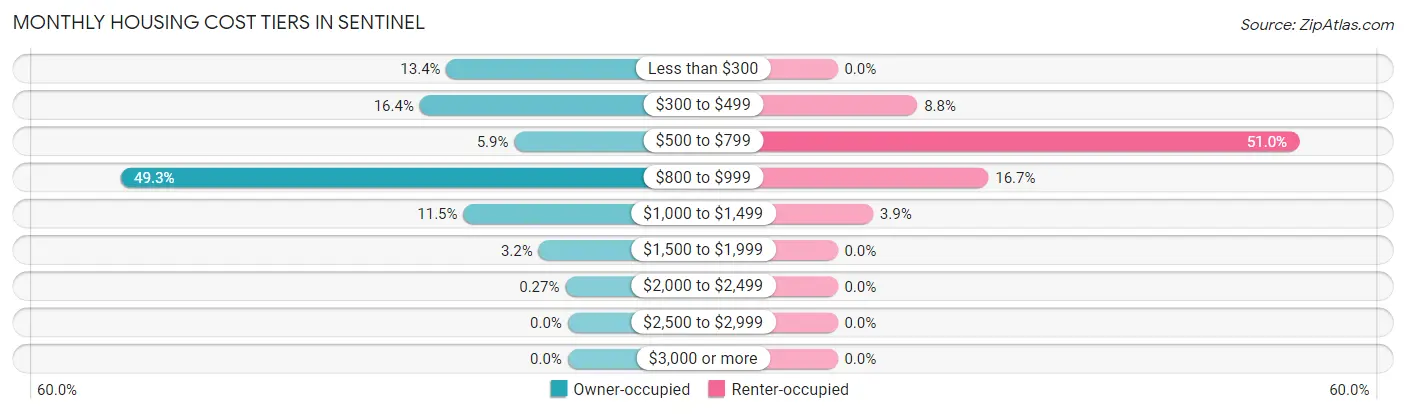
| Monthly Cost | Owner-occupied | Renter-occupied |
| Less than $300 | 50 (13.4%) | 0 (0.0%) |
| $300 to $499 | 61 (16.4%) | 9 (8.8%) |
| $500 to $799 | 22 (5.9%) | 52 (51.0%) |
| $800 to $999 | 184 (49.3%) | 17 (16.7%) |
| $1,000 to $1,499 | 43 (11.5%) | 4 (3.9%) |
| $1,500 to $1,999 | 12 (3.2%) | 0 (0.0%) |
| $2,000 to $2,499 | 1 (0.3%) | 0 (0.0%) |
| $2,500 to $2,999 | 0 (0.0%) | 0 (0.0%) |
| $3,000 or more | 0 (0.0%) | 0 (0.0%) |
| Total | 373 (100.0%) | 102 (100.0%) |
Physical Housing Characteristics in Sentinel
Housing Structures in Sentinel
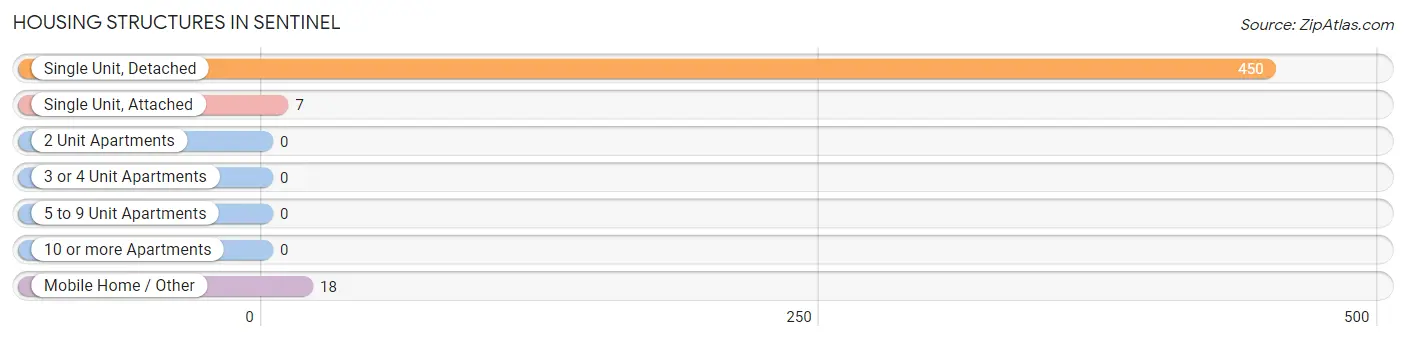
| Structure Type | # Housing Units | % Housing Units |
| Single Unit, Detached | 450 | 94.7% |
| Single Unit, Attached | 7 | 1.5% |
| 2 Unit Apartments | 0 | 0.0% |
| 3 or 4 Unit Apartments | 0 | 0.0% |
| 5 to 9 Unit Apartments | 0 | 0.0% |
| 10 or more Apartments | 0 | 0.0% |
| Mobile Home / Other | 18 | 3.8% |
| Total | 475 | 100.0% |
Housing Structures by Occupancy in Sentinel
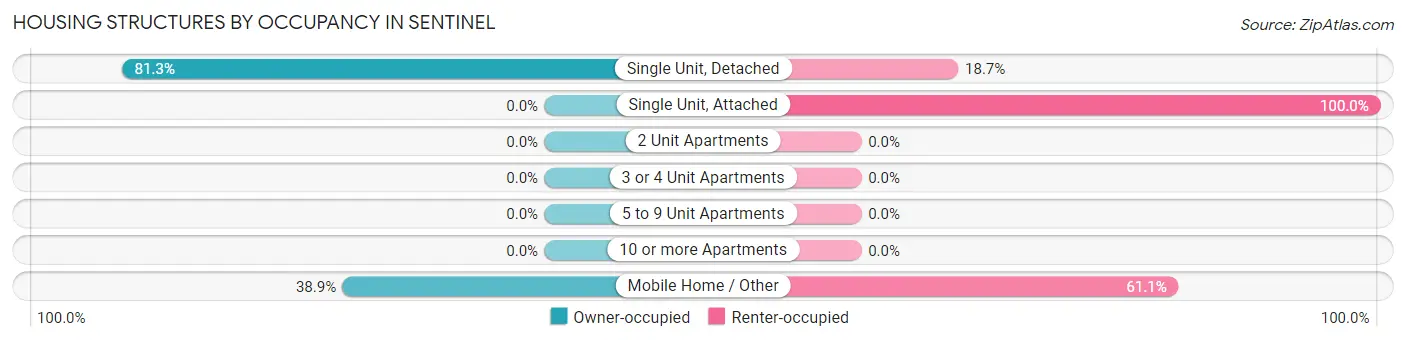
| Structure Type | Owner-occupied | Renter-occupied |
| Single Unit, Detached | 366 (81.3%) | 84 (18.7%) |
| Single Unit, Attached | 0 (0.0%) | 7 (100.0%) |
| 2 Unit Apartments | 0 (0.0%) | 0 (0.0%) |
| 3 or 4 Unit Apartments | 0 (0.0%) | 0 (0.0%) |
| 5 to 9 Unit Apartments | 0 (0.0%) | 0 (0.0%) |
| 10 or more Apartments | 0 (0.0%) | 0 (0.0%) |
| Mobile Home / Other | 7 (38.9%) | 11 (61.1%) |
| Total | 373 (78.5%) | 102 (21.5%) |
Housing Structures by Number of Rooms in Sentinel
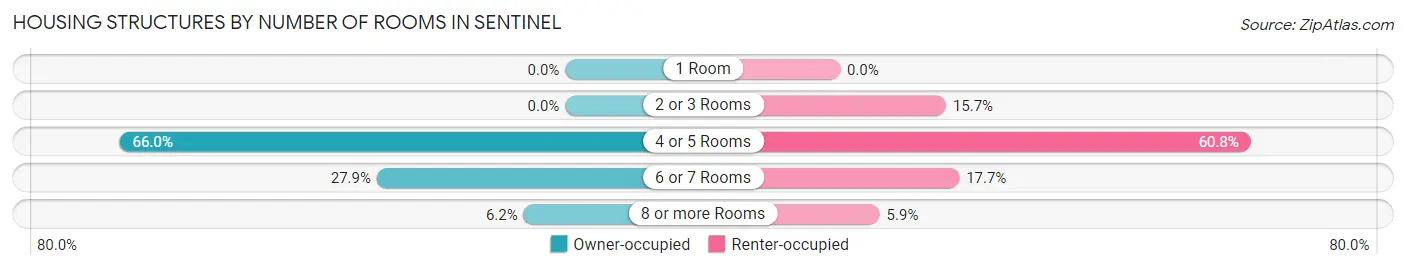
| Number of Rooms | Owner-occupied | Renter-occupied |
| 1 Room | 0 (0.0%) | 0 (0.0%) |
| 2 or 3 Rooms | 0 (0.0%) | 16 (15.7%) |
| 4 or 5 Rooms | 246 (65.9%) | 62 (60.8%) |
| 6 or 7 Rooms | 104 (27.9%) | 18 (17.6%) |
| 8 or more Rooms | 23 (6.2%) | 6 (5.9%) |
| Total | 373 (100.0%) | 102 (100.0%) |
Housing Structure by Heating Type in Sentinel
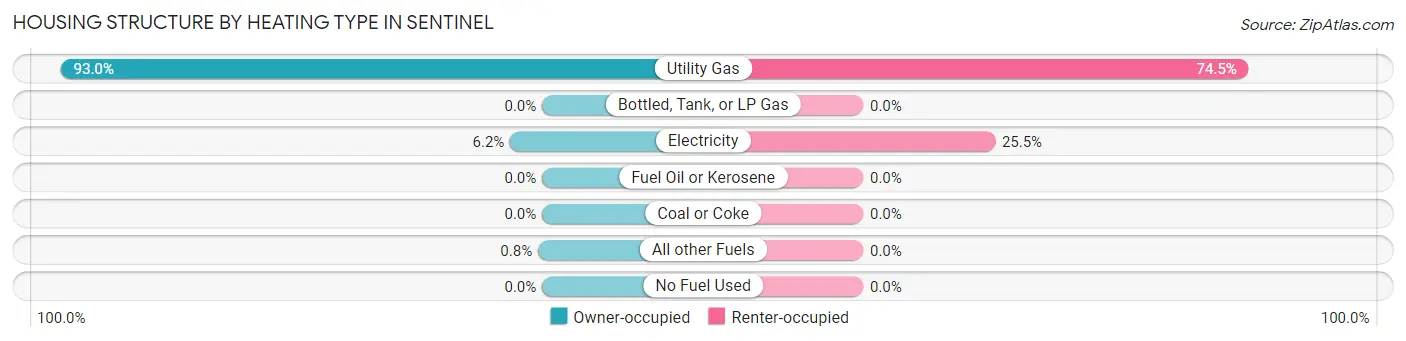
| Heating Type | Owner-occupied | Renter-occupied |
| Utility Gas | 347 (93.0%) | 76 (74.5%) |
| Bottled, Tank, or LP Gas | 0 (0.0%) | 0 (0.0%) |
| Electricity | 23 (6.2%) | 26 (25.5%) |
| Fuel Oil or Kerosene | 0 (0.0%) | 0 (0.0%) |
| Coal or Coke | 0 (0.0%) | 0 (0.0%) |
| All other Fuels | 3 (0.8%) | 0 (0.0%) |
| No Fuel Used | 0 (0.0%) | 0 (0.0%) |
| Total | 373 (100.0%) | 102 (100.0%) |
Household Vehicle Usage in Sentinel
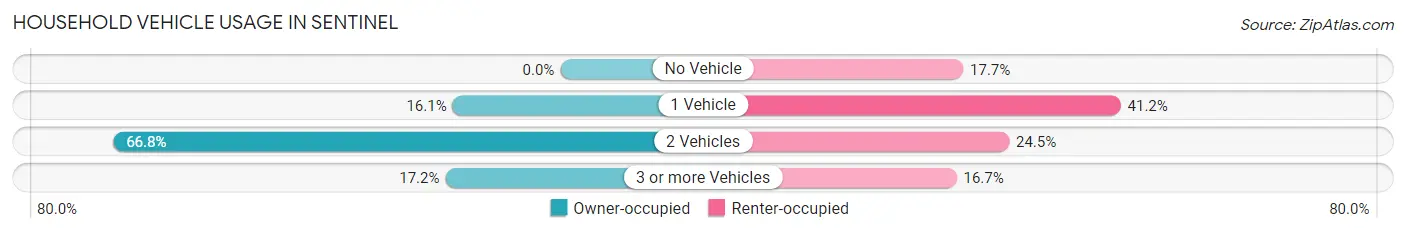
| Vehicles per Household | Owner-occupied | Renter-occupied |
| No Vehicle | 0 (0.0%) | 18 (17.6%) |
| 1 Vehicle | 60 (16.1%) | 42 (41.2%) |
| 2 Vehicles | 249 (66.8%) | 25 (24.5%) |
| 3 or more Vehicles | 64 (17.2%) | 17 (16.7%) |
| Total | 373 (100.0%) | 102 (100.0%) |
Real Estate & Mortgages in Sentinel
Real Estate and Mortgage Overview in Sentinel
| Characteristic | Without Mortgage | With Mortgage |
| Housing Units | 126 | 247 |
| Median Property Value | $50,000 | $95,900 |
| Median Household Income | $36,250 | $40 |
| Monthly Housing Costs | $333 | $0 |
| Real Estate Taxes | $199 | $0 |
Property Value by Mortgage Status in Sentinel
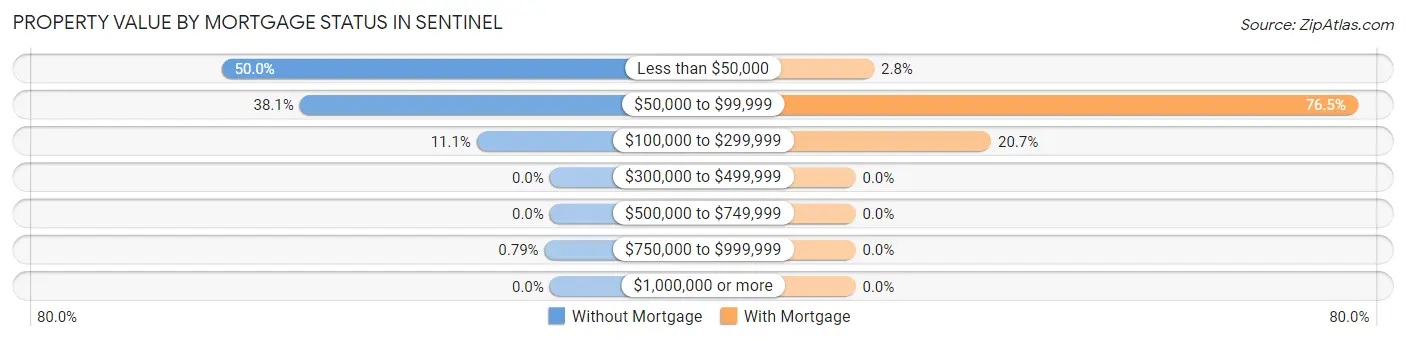
| Property Value | Without Mortgage | With Mortgage |
| Less than $50,000 | 63 (50.0%) | 7 (2.8%) |
| $50,000 to $99,999 | 48 (38.1%) | 189 (76.5%) |
| $100,000 to $299,999 | 14 (11.1%) | 51 (20.6%) |
| $300,000 to $499,999 | 0 (0.0%) | 0 (0.0%) |
| $500,000 to $749,999 | 0 (0.0%) | 0 (0.0%) |
| $750,000 to $999,999 | 1 (0.8%) | 0 (0.0%) |
| $1,000,000 or more | 0 (0.0%) | 0 (0.0%) |
| Total | 126 (100.0%) | 247 (100.0%) |
Household Income by Mortgage Status in Sentinel
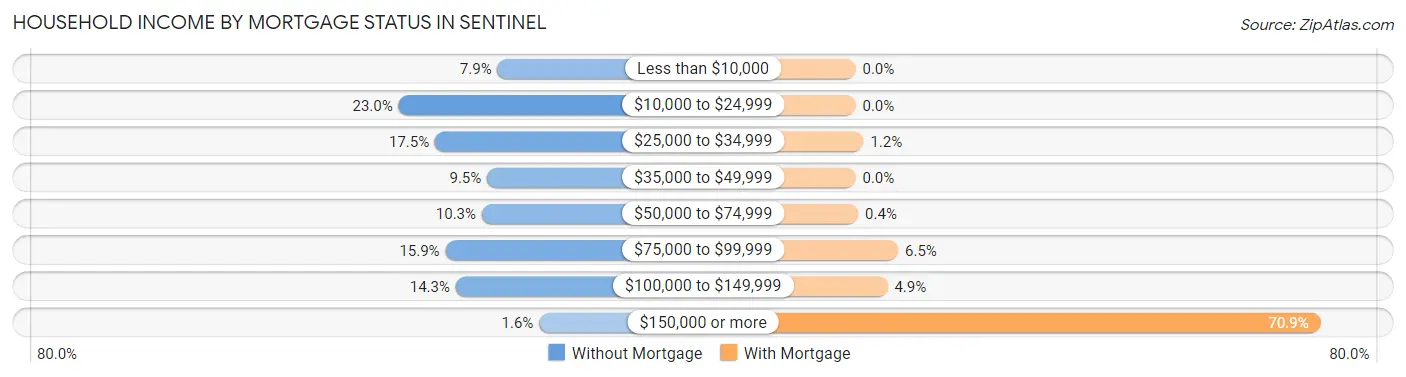
| Household Income | Without Mortgage | With Mortgage |
| Less than $10,000 | 10 (7.9%) | 0 (0.0%) |
| $10,000 to $24,999 | 29 (23.0%) | 0 (0.0%) |
| $25,000 to $34,999 | 22 (17.5%) | 3 (1.2%) |
| $35,000 to $49,999 | 12 (9.5%) | 0 (0.0%) |
| $50,000 to $74,999 | 13 (10.3%) | 1 (0.4%) |
| $75,000 to $99,999 | 20 (15.9%) | 16 (6.5%) |
| $100,000 to $149,999 | 18 (14.3%) | 12 (4.9%) |
| $150,000 or more | 2 (1.6%) | 175 (70.9%) |
| Total | 126 (100.0%) | 247 (100.0%) |
Property Value to Household Income Ratio in Sentinel
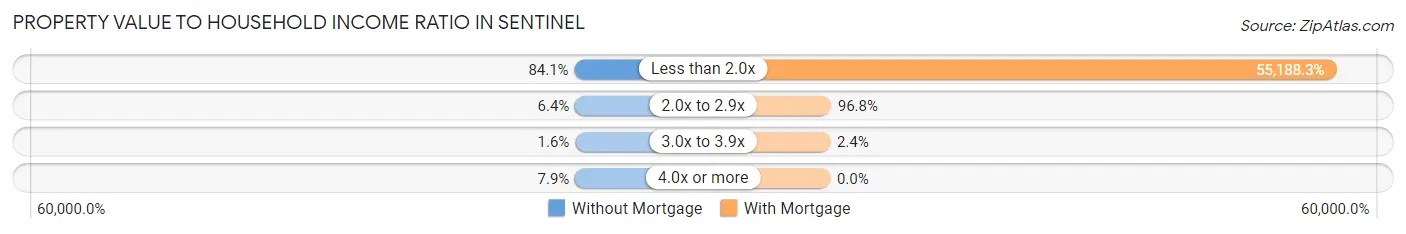
| Value-to-Income Ratio | Without Mortgage | With Mortgage |
| Less than 2.0x | 106 (84.1%) | 136,315 (55,188.3%) |
| 2.0x to 2.9x | 8 (6.4%) | 239 (96.8%) |
| 3.0x to 3.9x | 2 (1.6%) | 6 (2.4%) |
| 4.0x or more | 10 (7.9%) | 0 (0.0%) |
| Total | 126 (100.0%) | 247 (100.0%) |
Real Estate Taxes by Mortgage Status in Sentinel
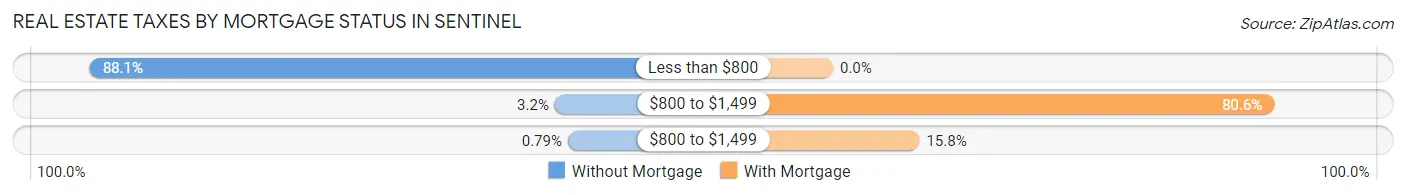
| Property Taxes | Without Mortgage | With Mortgage |
| Less than $800 | 111 (88.1%) | 0 (0.0%) |
| $800 to $1,499 | 4 (3.2%) | 199 (80.6%) |
| $800 to $1,499 | 1 (0.8%) | 39 (15.8%) |
| Total | 126 (100.0%) | 247 (100.0%) |
Health & Disability in Sentinel
Health Insurance Coverage by Age in Sentinel
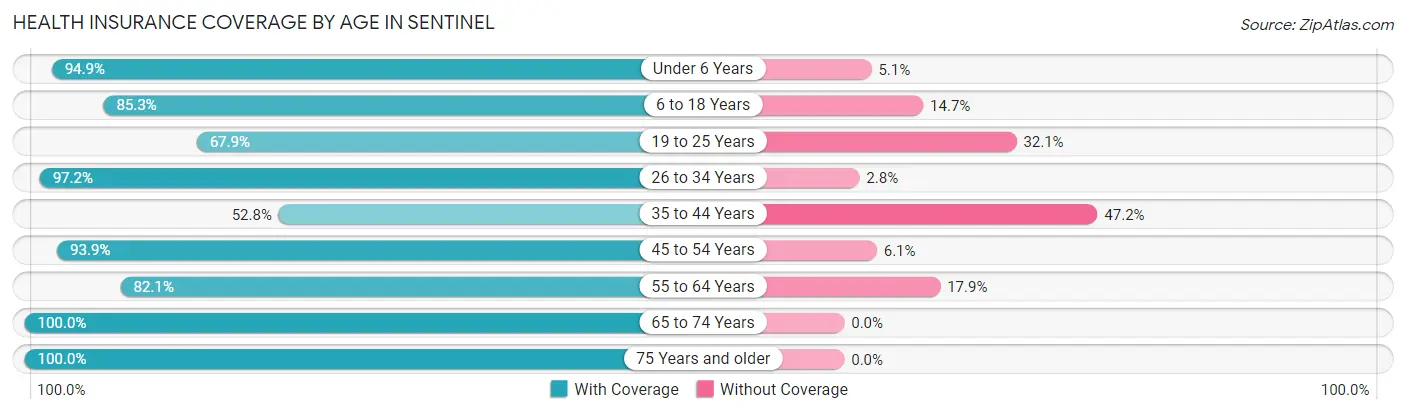
| Age Bracket | With Coverage | Without Coverage |
| Under 6 Years | 75 (94.9%) | 4 (5.1%) |
| 6 to 18 Years | 145 (85.3%) | 25 (14.7%) |
| 19 to 25 Years | 55 (67.9%) | 26 (32.1%) |
| 26 to 34 Years | 69 (97.2%) | 2 (2.8%) |
| 35 to 44 Years | 66 (52.8%) | 59 (47.2%) |
| 45 to 54 Years | 62 (93.9%) | 4 (6.1%) |
| 55 to 64 Years | 78 (82.1%) | 17 (17.9%) |
| 65 to 74 Years | 208 (100.0%) | 0 (0.0%) |
| 75 Years and older | 68 (100.0%) | 0 (0.0%) |
| Total | 826 (85.8%) | 137 (14.2%) |
Health Insurance Coverage by Citizenship Status in Sentinel
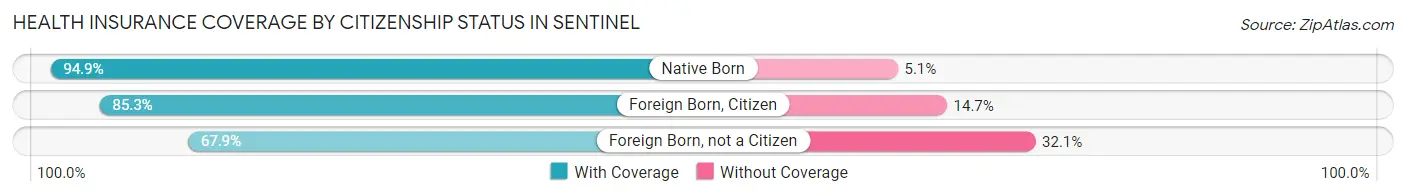
| Citizenship Status | With Coverage | Without Coverage |
| Native Born | 75 (94.9%) | 4 (5.1%) |
| Foreign Born, Citizen | 145 (85.3%) | 25 (14.7%) |
| Foreign Born, not a Citizen | 55 (67.9%) | 26 (32.1%) |
Health Insurance Coverage by Household Income in Sentinel
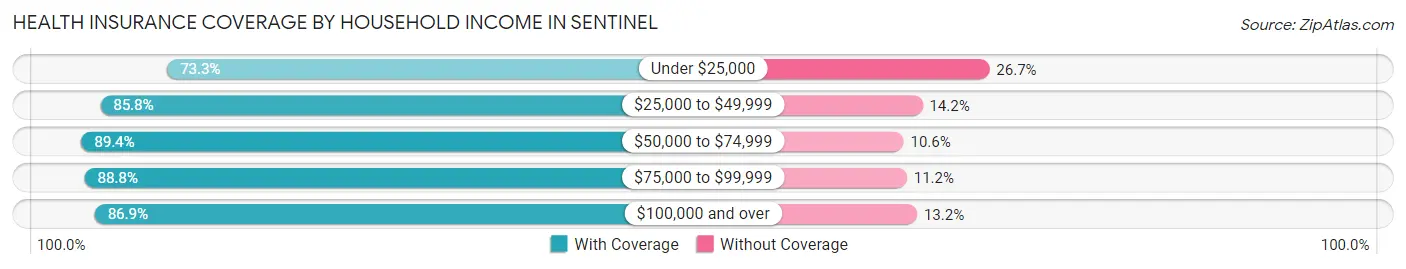
| Household Income | With Coverage | Without Coverage |
| Under $25,000 | 85 (73.3%) | 31 (26.7%) |
| $25,000 to $49,999 | 115 (85.8%) | 19 (14.2%) |
| $50,000 to $74,999 | 126 (89.4%) | 15 (10.6%) |
| $75,000 to $99,999 | 150 (88.8%) | 19 (11.2%) |
| $100,000 and over | 350 (86.9%) | 53 (13.2%) |
Public vs Private Health Insurance Coverage by Age in Sentinel
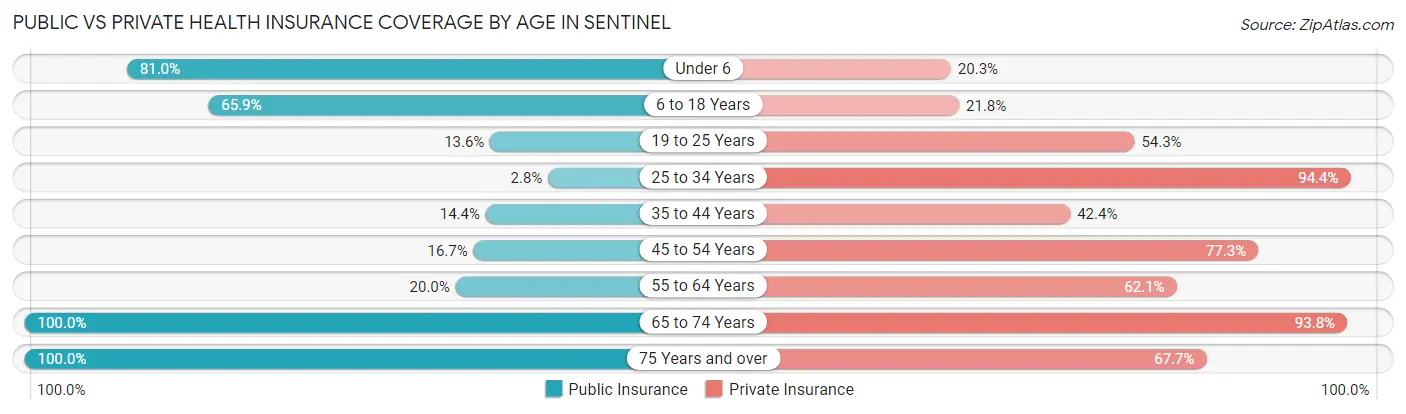
| Age Bracket | Public Insurance | Private Insurance |
| Under 6 | 64 (81.0%) | 16 (20.3%) |
| 6 to 18 Years | 112 (65.9%) | 37 (21.8%) |
| 19 to 25 Years | 11 (13.6%) | 44 (54.3%) |
| 25 to 34 Years | 2 (2.8%) | 67 (94.4%) |
| 35 to 44 Years | 18 (14.4%) | 53 (42.4%) |
| 45 to 54 Years | 11 (16.7%) | 51 (77.3%) |
| 55 to 64 Years | 19 (20.0%) | 59 (62.1%) |
| 65 to 74 Years | 208 (100.0%) | 195 (93.8%) |
| 75 Years and over | 68 (100.0%) | 46 (67.6%) |
| Total | 513 (53.3%) | 568 (59.0%) |
Disability Status by Sex by Age in Sentinel
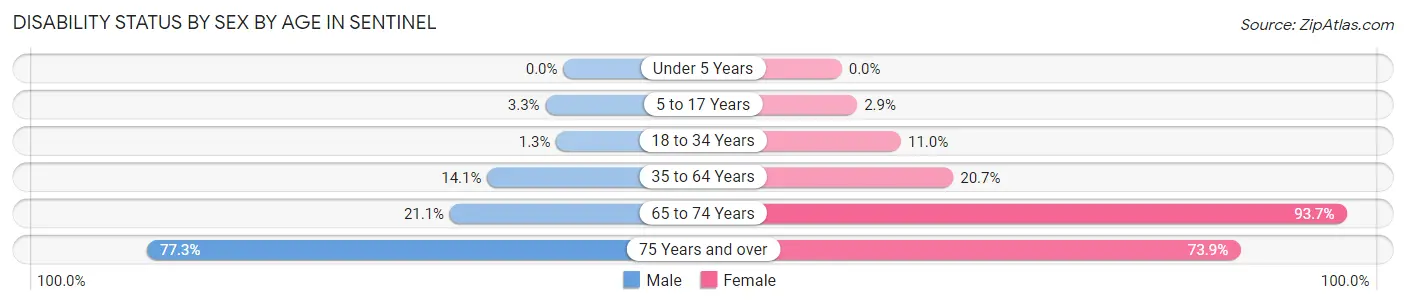
| Age Bracket | Male | Female |
| Under 5 Years | 0 (0.0%) | 0 (0.0%) |
| 5 to 17 Years | 3 (3.3%) | 2 (2.9%) |
| 18 to 34 Years | 1 (1.3%) | 11 (11.0%) |
| 35 to 64 Years | 24 (14.1%) | 24 (20.7%) |
| 65 to 74 Years | 4 (21.0%) | 177 (93.6%) |
| 75 Years and over | 17 (77.3%) | 34 (73.9%) |
Disability Class by Sex by Age in Sentinel
Disability Class: Hearing Difficulty
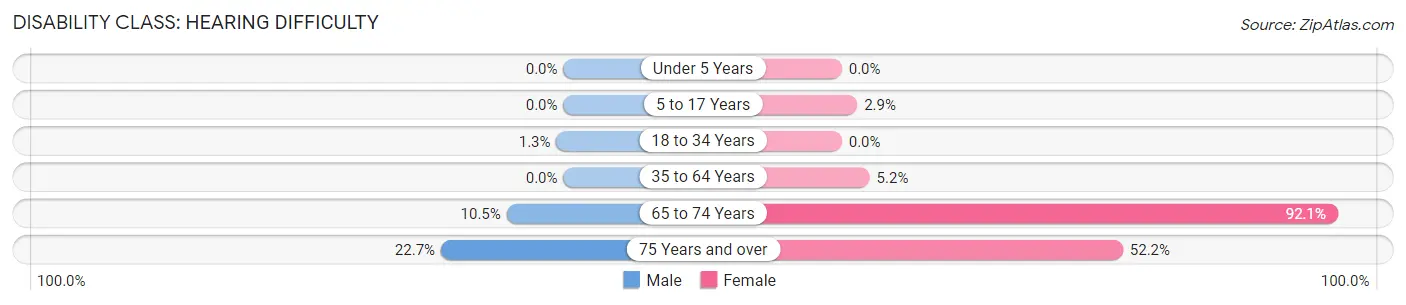
| Age Bracket | Male | Female |
| Under 5 Years | 0 (0.0%) | 0 (0.0%) |
| 5 to 17 Years | 0 (0.0%) | 2 (2.9%) |
| 18 to 34 Years | 1 (1.3%) | 0 (0.0%) |
| 35 to 64 Years | 0 (0.0%) | 6 (5.2%) |
| 65 to 74 Years | 2 (10.5%) | 174 (92.1%) |
| 75 Years and over | 5 (22.7%) | 24 (52.2%) |
Disability Class: Vision Difficulty
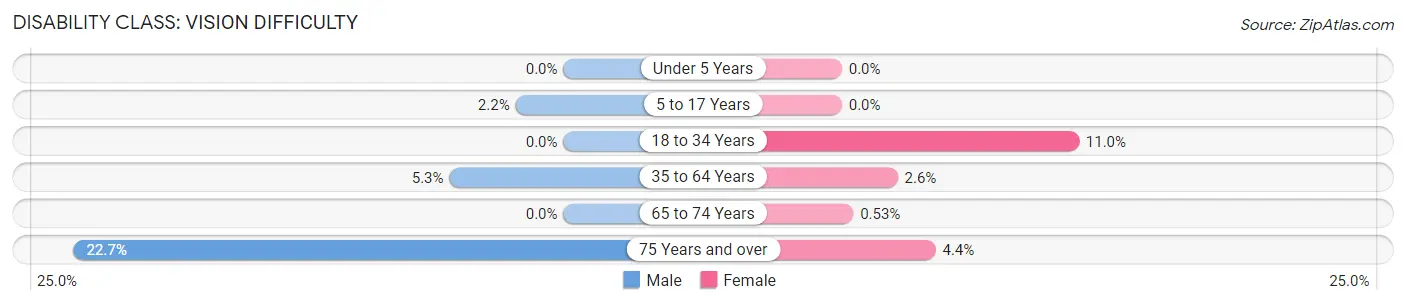
| Age Bracket | Male | Female |
| Under 5 Years | 0 (0.0%) | 0 (0.0%) |
| 5 to 17 Years | 2 (2.2%) | 0 (0.0%) |
| 18 to 34 Years | 0 (0.0%) | 11 (11.0%) |
| 35 to 64 Years | 9 (5.3%) | 3 (2.6%) |
| 65 to 74 Years | 0 (0.0%) | 1 (0.5%) |
| 75 Years and over | 5 (22.7%) | 2 (4.3%) |
Disability Class: Cognitive Difficulty
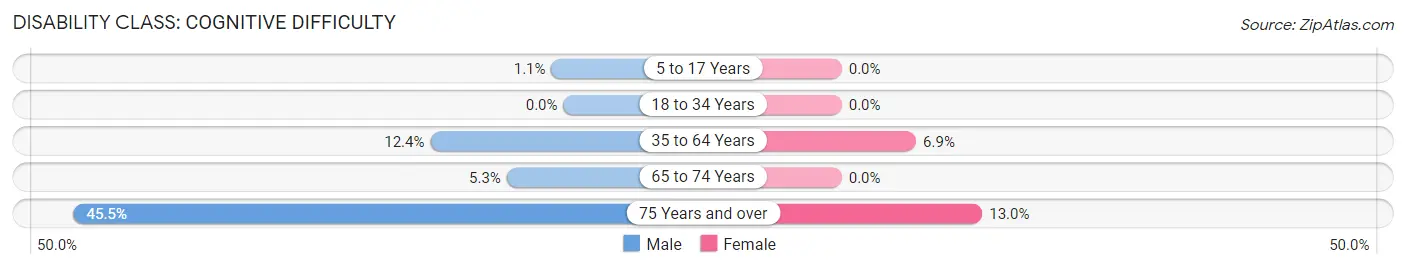
| Age Bracket | Male | Female |
| 5 to 17 Years | 1 (1.1%) | 0 (0.0%) |
| 18 to 34 Years | 0 (0.0%) | 0 (0.0%) |
| 35 to 64 Years | 21 (12.3%) | 8 (6.9%) |
| 65 to 74 Years | 1 (5.3%) | 0 (0.0%) |
| 75 Years and over | 10 (45.5%) | 6 (13.0%) |
Disability Class: Ambulatory Difficulty
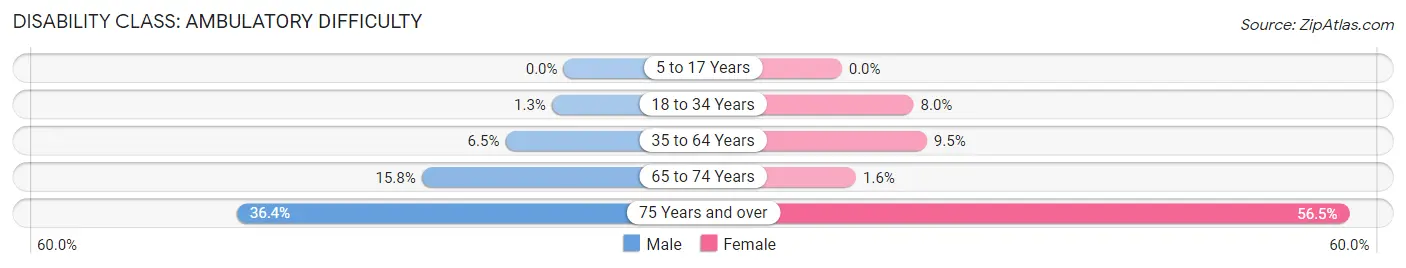
| Age Bracket | Male | Female |
| 5 to 17 Years | 0 (0.0%) | 0 (0.0%) |
| 18 to 34 Years | 1 (1.3%) | 8 (8.0%) |
| 35 to 64 Years | 11 (6.5%) | 11 (9.5%) |
| 65 to 74 Years | 3 (15.8%) | 3 (1.6%) |
| 75 Years and over | 8 (36.4%) | 26 (56.5%) |
Disability Class: Self-Care Difficulty
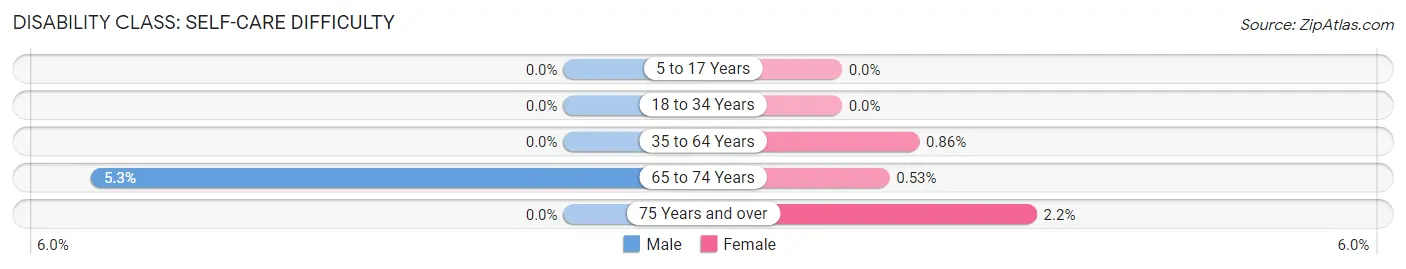
| Age Bracket | Male | Female |
| 5 to 17 Years | 0 (0.0%) | 0 (0.0%) |
| 18 to 34 Years | 0 (0.0%) | 0 (0.0%) |
| 35 to 64 Years | 0 (0.0%) | 1 (0.9%) |
| 65 to 74 Years | 1 (5.3%) | 1 (0.5%) |
| 75 Years and over | 0 (0.0%) | 1 (2.2%) |
Technology Access in Sentinel
Computing Device Access in Sentinel
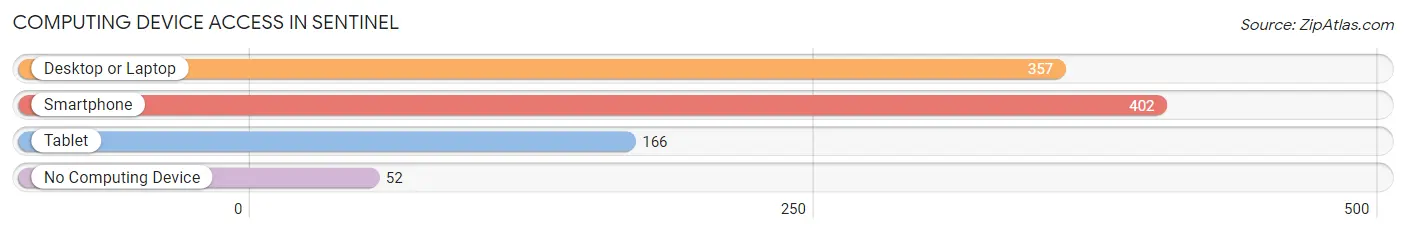
| Device Type | # Households | % Households |
| Desktop or Laptop | 357 | 75.2% |
| Smartphone | 402 | 84.6% |
| Tablet | 166 | 34.9% |
| No Computing Device | 52 | 11.0% |
| Total | 475 | 100.0% |
Internet Access in Sentinel
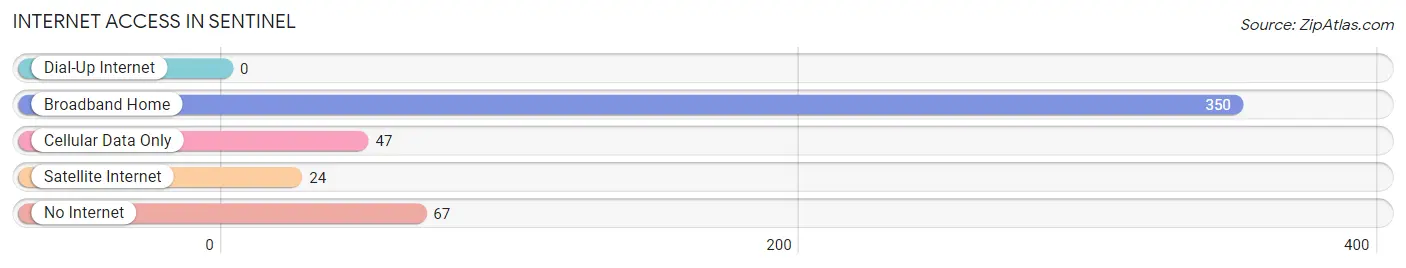
| Internet Type | # Households | % Households |
| Dial-Up Internet | 0 | 0.0% |
| Broadband Home | 350 | 73.7% |
| Cellular Data Only | 47 | 9.9% |
| Satellite Internet | 24 | 5.1% |
| No Internet | 67 | 14.1% |
| Total | 475 | 100.0% |
Sentinel Summary
History
Sentinel, Oklahoma is a small town located in Washita County in the southwestern part of the state. The town was founded in 1901 by the Choctaw Nation and was named after the nearby Sentinel Mountain. The town was originally a trading post and was home to a few hundred people.
In the early 1900s, the town began to grow as more settlers moved to the area. The town was incorporated in 1909 and the first mayor was elected in 1910. The town was home to a variety of businesses, including a bank, a hotel, a general store, a blacksmith shop, and a livery stable.
The town was also home to a number of churches, including the First Baptist Church, the First Methodist Church, and the First Presbyterian Church. The town also had a school, which was built in 1910 and served the community until it closed in the 1950s.
The town was also home to a number of fraternal organizations, including the Masons, the Odd Fellows, and the Knights of Pythias.
In the 1920s, the town began to decline as the population began to move away. The Great Depression also had a negative impact on the town, and by the 1940s, the population had dropped to just over 200 people.
The town began to experience a resurgence in the 1950s, as the population began to grow again. The town was home to a number of businesses, including a grocery store, a hardware store, a drug store, and a movie theater.
The town was also home to a number of churches, including the First Baptist Church, the First Methodist Church, and the First Presbyterian Church. The town also had a school, which was built in 1910 and served the community until it closed in the 1950s.
The town was also home to a number of fraternal organizations, including the Masons, the Odd Fellows, and the Knights of Pythias.
Geography
Sentinel is located in southwestern Oklahoma, in Washita County. The town is situated on the banks of the Washita River, which flows through the town. The town is located about 25 miles south of the city of Cordell and about 50 miles west of the city of Lawton.
The town is located in a semi-arid climate, with hot summers and mild winters. The average annual temperature is around 65 degrees Fahrenheit, with an average high of around 90 degrees in the summer and an average low of around 40 degrees in the winter.
The town is located in an area of rolling hills and grasslands, with some areas of dense forest. The town is surrounded by a number of small lakes and ponds, which provide a variety of recreational activities.
Economy
The economy of Sentinel is largely based on agriculture and ranching. The town is home to a number of farms and ranches, which produce a variety of crops, including wheat, corn, and hay. The town is also home to a number of cattle ranches, which produce beef and dairy products.
The town is also home to a number of small businesses, including a grocery store, a hardware store, a drug store, and a movie theater. The town is also home to a number of churches, which provide a variety of services to the community.
Demographics
As of the 2010 census, the population of Sentinel was 1,093. The town is predominantly white, with a small Hispanic population. The median household income is around $30,000, and the median home value is around $60,000. The town has a high rate of poverty, with around 25% of the population living below the poverty line.
Common Questions
What is Per Capita Income in Sentinel?
Per Capita income in Sentinel is $55,998.
What is the Median Family Income in Sentinel?
Median Family Income in Sentinel is $135,761.
What is the Median Household income in Sentinel?
Median Household Income in Sentinel is $103,750.
What is Income or Wage Gap in Sentinel?
Income or Wage Gap in Sentinel is 39.7%.
Women in Sentinel earn 60.3 cents for every dollar earned by a man.
What is Family Income Deficit in Sentinel?
Family Income Deficit in Sentinel is $13,361.
Families that are below poverty line in Sentinel earn $13,361 less on average than the poverty threshold level.
What is Inequality or Gini Index in Sentinel?
Inequality or Gini Index in Sentinel is 0.42.
What is the Total Population of Sentinel?
Total Population of Sentinel is 973.
What is the Total Male Population of Sentinel?
Total Male Population of Sentinel is 443.
What is the Total Female Population of Sentinel?
Total Female Population of Sentinel is 530.
What is the Ratio of Males per 100 Females in Sentinel?
There are 83.58 Males per 100 Females in Sentinel.
What is the Ratio of Females per 100 Males in Sentinel?
There are 119.64 Females per 100 Males in Sentinel.
What is the Median Population Age in Sentinel?
Median Population Age in Sentinel is 38.7 Years.
What is the Average Family Size in Sentinel
Average Family Size in Sentinel is 2.2 People.
What is the Average Household Size in Sentinel
Average Household Size in Sentinel is 2.0 People.
How Large is the Labor Force in Sentinel?
There are 557 People in the Labor Forcein in Sentinel.
What is the Percentage of People in the Labor Force in Sentinel?
71.7% of People are in the Labor Force in Sentinel.
What is the Unemployment Rate in Sentinel?
Unemployment Rate in Sentinel is 2.6%.