Robbins, TN Map & Demographics
Robbins Map
Robbins Overview
$18,377
PER CAPITA INCOME
$27,841
AVG HOUSEHOLD INCOME
0.33
INEQUALITY / GINI INDEX
109
TOTAL POPULATION
68
MALE POPULATION
41
FEMALE POPULATION
165.85
MALES / 100 FEMALES
60.29
FEMALES / 100 MALES
64.1
MEDIAN AGE
2.4
AVG FAMILY SIZE
1.6
AVG HOUSEHOLD SIZE
16
LABOR FORCE [ PEOPLE ]
16.7%
PERCENT IN LABOR FORCE
Robbins Zip Codes
Robbins Area Codes
Income in Robbins
Income Overview in Robbins
| Characteristic | Number | Measure |
| Per Capita Income | 109 | $18,377 |
| Median Family Income | 31 | $0 |
| Mean Family Income | 31 | $39,839 |
| Median Household Income | 67 | $27,841 |
| Mean Household Income | 67 | $30,940 |
| Income Deficit | 31 | $0 |
| Wage / Income Gap (%) | 109 | 0.00% |
| Wage / Income Gap ($) | 109 | 100.00¢ per $1 |
| Gini / Inequality Index | 109 | 0.33 |
Earnings by Sex in Robbins
| Sex | Number | Average Earnings |
| Male | 10 (62.5%) | $0 |
| Female | 6 (37.5%) | $0 |
| Total | 16 (100.0%) | $0 |
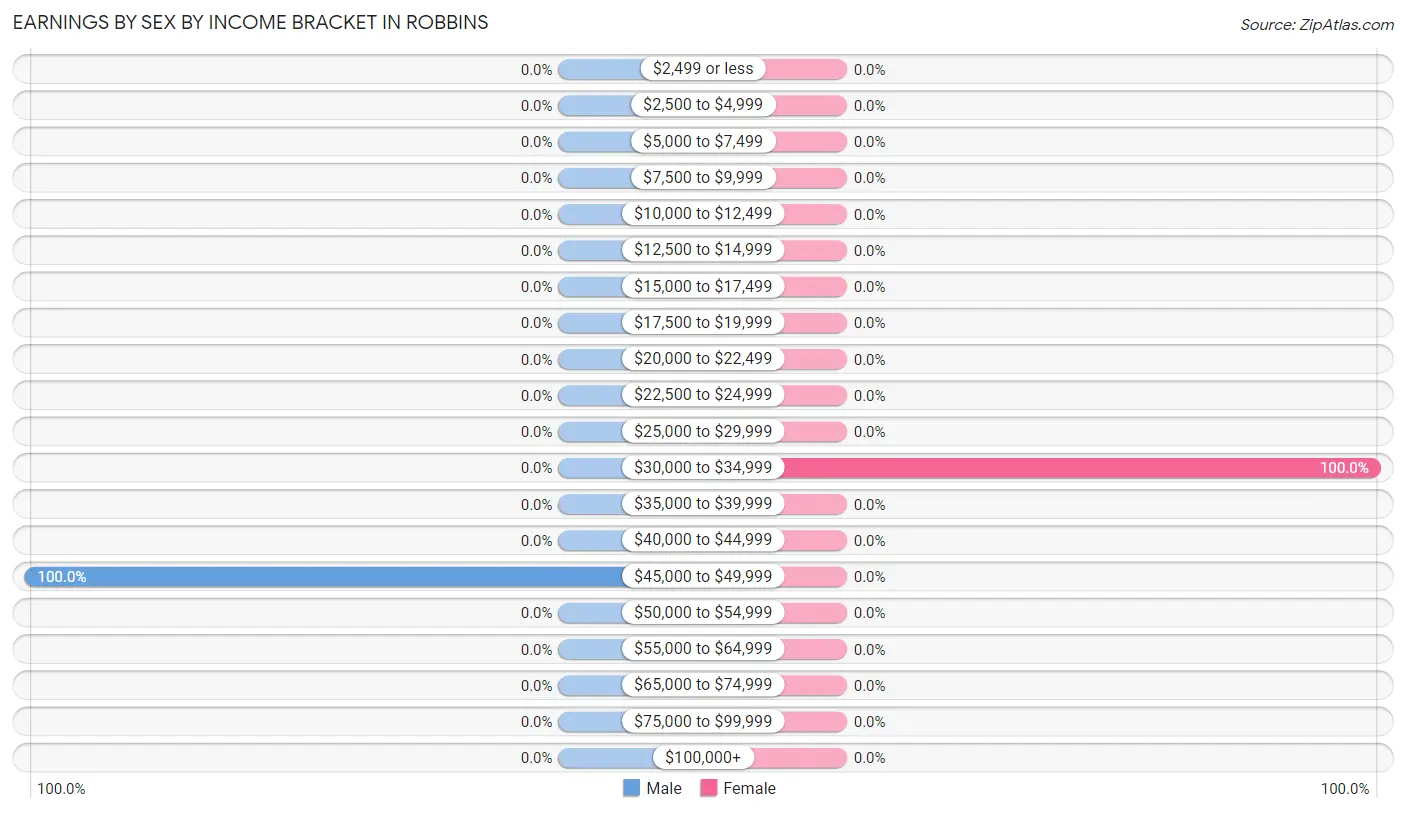
Earnings by Sex by Income Bracket in Robbins
The most common earnings brackets in Robbins are $45,000 to $49,999 for men (10 | 100.0%) and $30,000 to $34,999 for women (6 | 100.0%).
| Income | Male | Female |
| $2,499 or less | 0 (0.0%) | 0 (0.0%) |
| $2,500 to $4,999 | 0 (0.0%) | 0 (0.0%) |
| $5,000 to $7,499 | 0 (0.0%) | 0 (0.0%) |
| $7,500 to $9,999 | 0 (0.0%) | 0 (0.0%) |
| $10,000 to $12,499 | 0 (0.0%) | 0 (0.0%) |
| $12,500 to $14,999 | 0 (0.0%) | 0 (0.0%) |
| $15,000 to $17,499 | 0 (0.0%) | 0 (0.0%) |
| $17,500 to $19,999 | 0 (0.0%) | 0 (0.0%) |
| $20,000 to $22,499 | 0 (0.0%) | 0 (0.0%) |
| $22,500 to $24,999 | 0 (0.0%) | 0 (0.0%) |
| $25,000 to $29,999 | 0 (0.0%) | 0 (0.0%) |
| $30,000 to $34,999 | 0 (0.0%) | 6 (100.0%) |
| $35,000 to $39,999 | 0 (0.0%) | 0 (0.0%) |
| $40,000 to $44,999 | 0 (0.0%) | 0 (0.0%) |
| $45,000 to $49,999 | 10 (100.0%) | 0 (0.0%) |
| $50,000 to $54,999 | 0 (0.0%) | 0 (0.0%) |
| $55,000 to $64,999 | 0 (0.0%) | 0 (0.0%) |
| $65,000 to $74,999 | 0 (0.0%) | 0 (0.0%) |
| $75,000 to $99,999 | 0 (0.0%) | 0 (0.0%) |
| $100,000+ | 0 (0.0%) | 0 (0.0%) |
| Total | 10 (100.0%) | 6 (100.0%) |
Earnings by Sex by Educational Attainment in Robbins
| Educational Attainment | Male Income | Female Income |
| Less than High School | - | - |
| High School Diploma | - | - |
| College or Associate's Degree | - | - |
| Bachelor's Degree | - | - |
| Graduate Degree | - | - |
| Total | - | - |
Family Income in Robbins
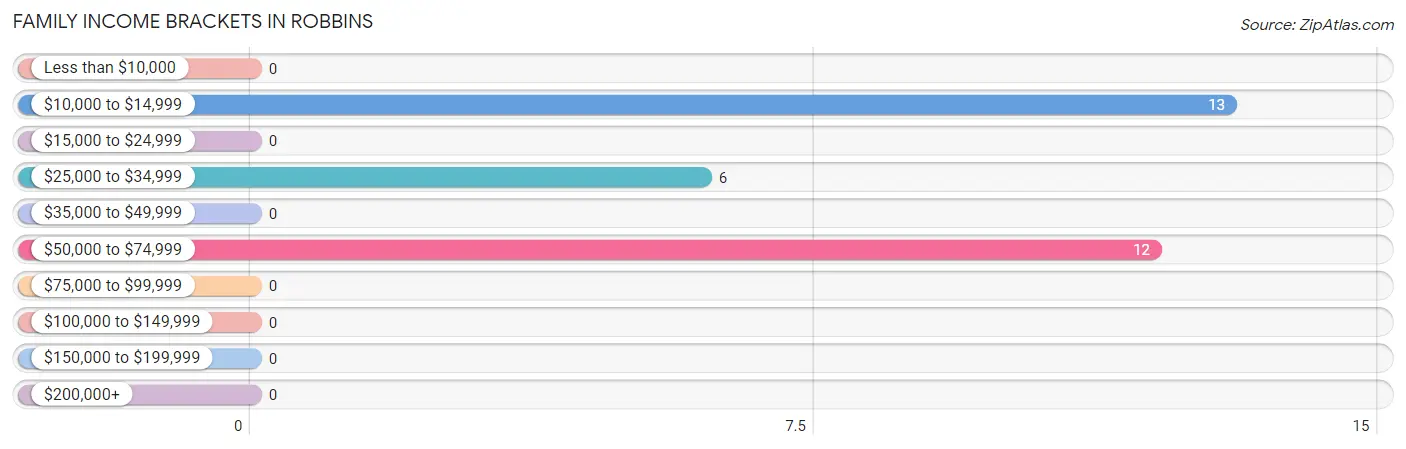
Family Income Brackets in Robbins
According to the Robbins family income data, there are 13 families falling into the $10,000 to $14,999 income range, which is the most common income bracket and makes up 41.9% of all families.
| Income Bracket | # Families | % Families |
| Less than $10,000 | 0 | 0.0% |
| $10,000 to $14,999 | 13 | 41.9% |
| $15,000 to $24,999 | 0 | 0.0% |
| $25,000 to $34,999 | 6 | 19.4% |
| $35,000 to $49,999 | 0 | 0.0% |
| $50,000 to $74,999 | 12 | 38.7% |
| $75,000 to $99,999 | 0 | 0.0% |
| $100,000 to $149,999 | 0 | 0.0% |
| $150,000 to $199,999 | 0 | 0.0% |
| $200,000+ | 0 | 0.0% |
Family Income by Famaliy Size in Robbins
| Income Bracket | # Families | Median Income |
| 2-Person Families | 19 (61.3%) | $0 |
| 3-Person Families | 12 (38.7%) | $0 |
| 4-Person Families | 0 (0.0%) | $0 |
| 5-Person Families | 0 (0.0%) | $0 |
| 6-Person Families | 0 (0.0%) | $0 |
| 7+ Person Families | 0 (0.0%) | $0 |
| Total | 31 (100.0%) | $0 |
Family Income by Number of Earners in Robbins
| Number of Earners | # Families | Median Income |
| No Earners | 19 (61.3%) | $0 |
| 1 Earner | 12 (38.7%) | $0 |
| 2 Earners | 0 (0.0%) | $0 |
| 3+ Earners | 0 (0.0%) | $0 |
| Total | 31 (100.0%) | $0 |
Household Income in Robbins
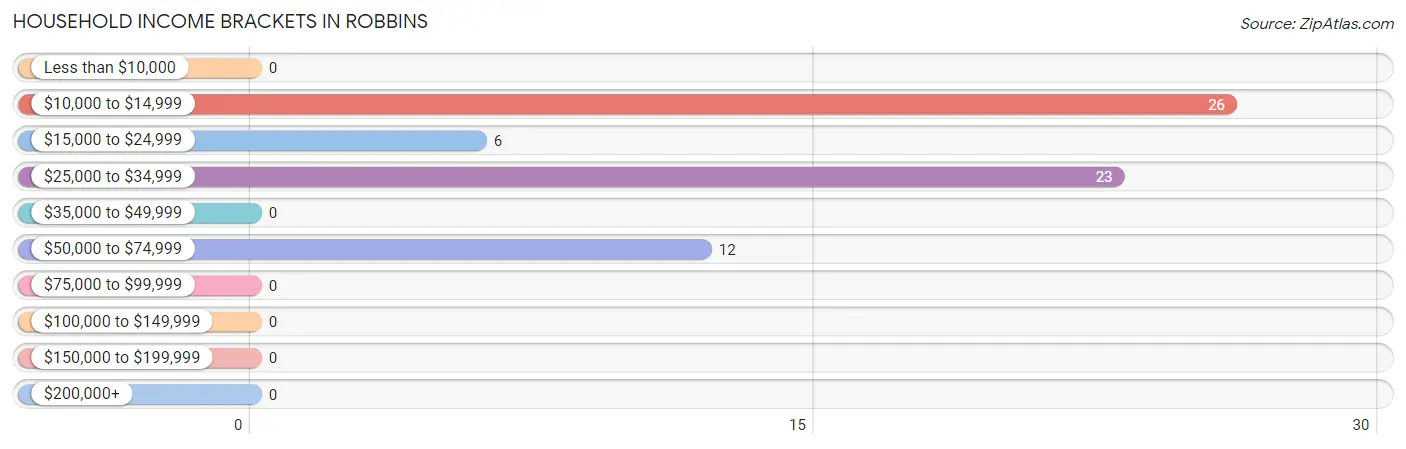
Household Income Brackets in Robbins
With 26 households falling in the category, the $10,000 to $14,999 income range is the most frequent in Robbins, accounting for 38.8% of all households.
| Income Bracket | # Households | % Households |
| Less than $10,000 | 0 | 0.0% |
| $10,000 to $14,999 | 26 | 38.8% |
| $15,000 to $24,999 | 6 | 9.0% |
| $25,000 to $34,999 | 23 | 34.3% |
| $35,000 to $49,999 | 0 | 0.0% |
| $50,000 to $74,999 | 12 | 17.9% |
| $75,000 to $99,999 | 0 | 0.0% |
| $100,000 to $149,999 | 0 | 0.0% |
| $150,000 to $199,999 | 0 | 0.0% |
| $200,000+ | 0 | 0.0% |
Household Income by Householder Age in Robbins
The median household income in Robbins is $27,841, with the highest median household income of $27,955 found in the 65+ years age bracket for the primary householder. A total of 30 households (44.8%) fall into this category.
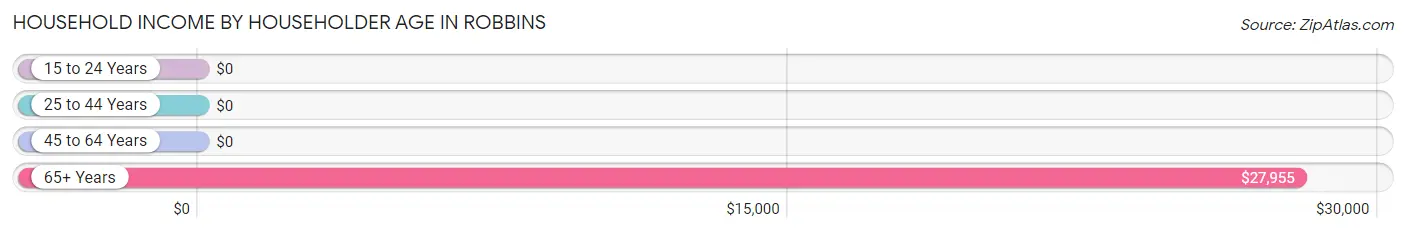
| Income Bracket | # Households | Median Income |
| 15 to 24 Years | 0 (0.0%) | $0 |
| 25 to 44 Years | 12 (17.9%) | $0 |
| 45 to 64 Years | 25 (37.3%) | $0 |
| 65+ Years | 30 (44.8%) | $27,955 |
| Total | 67 (100.0%) | $27,841 |
Poverty in Robbins
Income Below Poverty by Sex and Age in Robbins
With 38.2% poverty level for males and 26.8% for females among the residents of Robbins, 45 to 54 year old males and 65 to 74 year old females are the most vulnerable to poverty, with 13 males (100.0%) and 11 females (64.7%) in their respective age groups living below the poverty level.
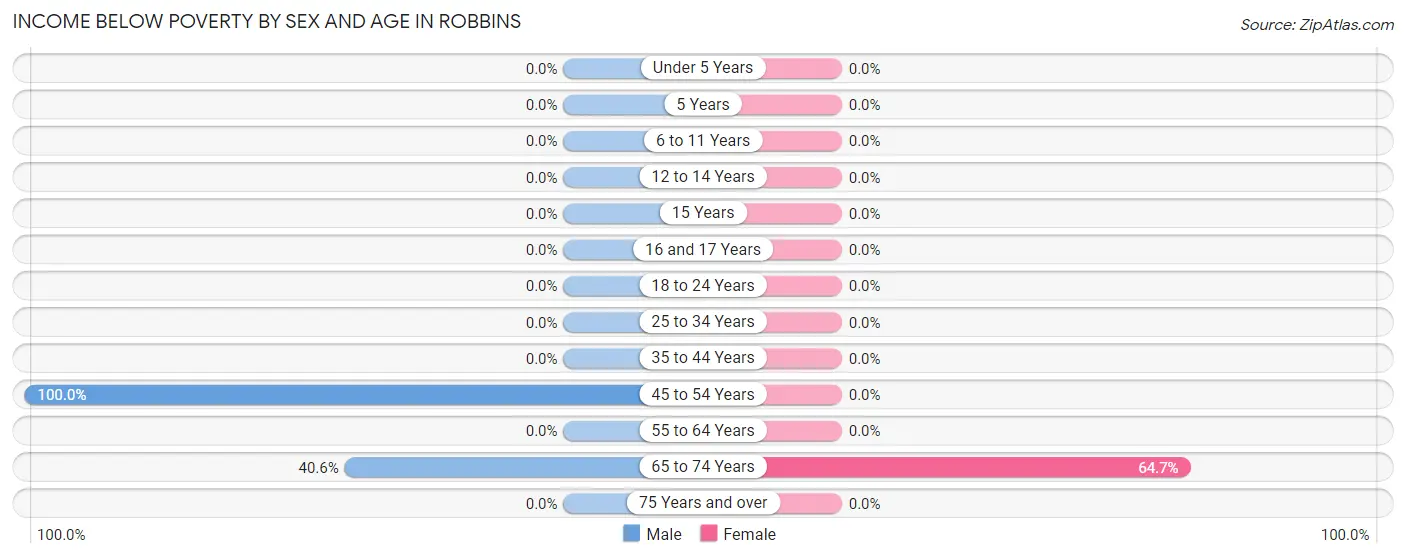
| Age Bracket | Male | Female |
| Under 5 Years | 0 (0.0%) | 0 (0.0%) |
| 5 Years | 0 (0.0%) | 0 (0.0%) |
| 6 to 11 Years | 0 (0.0%) | 0 (0.0%) |
| 12 to 14 Years | 0 (0.0%) | 0 (0.0%) |
| 15 Years | 0 (0.0%) | 0 (0.0%) |
| 16 and 17 Years | 0 (0.0%) | 0 (0.0%) |
| 18 to 24 Years | 0 (0.0%) | 0 (0.0%) |
| 25 to 34 Years | 0 (0.0%) | 0 (0.0%) |
| 35 to 44 Years | 0 (0.0%) | 0 (0.0%) |
| 45 to 54 Years | 13 (100.0%) | 0 (0.0%) |
| 55 to 64 Years | 0 (0.0%) | 0 (0.0%) |
| 65 to 74 Years | 13 (40.6%) | 11 (64.7%) |
| 75 Years and over | 0 (0.0%) | 0 (0.0%) |
| Total | 26 (38.2%) | 11 (26.8%) |
Income Above Poverty by Sex and Age in Robbins
According to the poverty statistics in Robbins, males aged 15 years and females aged 35 to 44 years are the age groups that are most secure financially, with 100.0% of males and 100.0% of females in these age groups living above the poverty line.
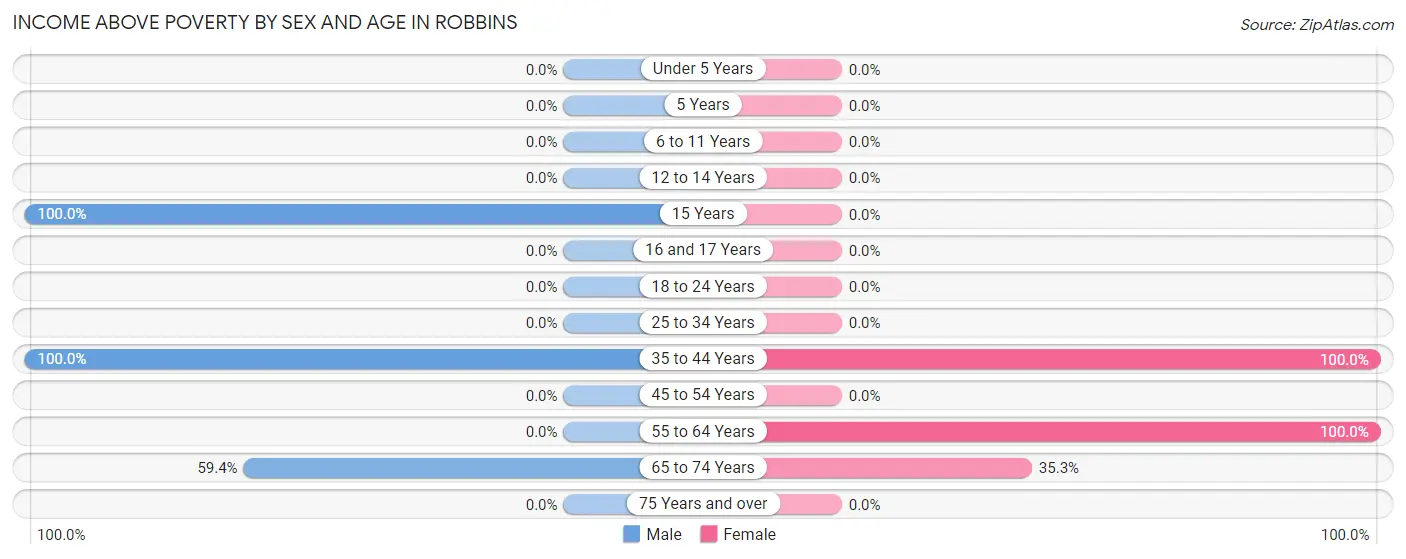
| Age Bracket | Male | Female |
| Under 5 Years | 0 (0.0%) | 0 (0.0%) |
| 5 Years | 0 (0.0%) | 0 (0.0%) |
| 6 to 11 Years | 0 (0.0%) | 0 (0.0%) |
| 12 to 14 Years | 0 (0.0%) | 0 (0.0%) |
| 15 Years | 13 (100.0%) | 0 (0.0%) |
| 16 and 17 Years | 0 (0.0%) | 0 (0.0%) |
| 18 to 24 Years | 0 (0.0%) | 0 (0.0%) |
| 25 to 34 Years | 0 (0.0%) | 0 (0.0%) |
| 35 to 44 Years | 10 (100.0%) | 12 (100.0%) |
| 45 to 54 Years | 0 (0.0%) | 0 (0.0%) |
| 55 to 64 Years | 0 (0.0%) | 12 (100.0%) |
| 65 to 74 Years | 19 (59.4%) | 6 (35.3%) |
| 75 Years and over | 0 (0.0%) | 0 (0.0%) |
| Total | 42 (61.8%) | 30 (73.2%) |
Income Below Poverty Among Married-Couple Families in Robbins
The poverty statistics for married-couple families in Robbins show that 41.9% or 13 of the total 31 families live below the poverty line. Families with no children have the highest poverty rate of 68.4%, comprising of 13 families. On the other hand, families with 1 or 2 children have the lowest poverty rate of 0.0%, which includes 0 families.
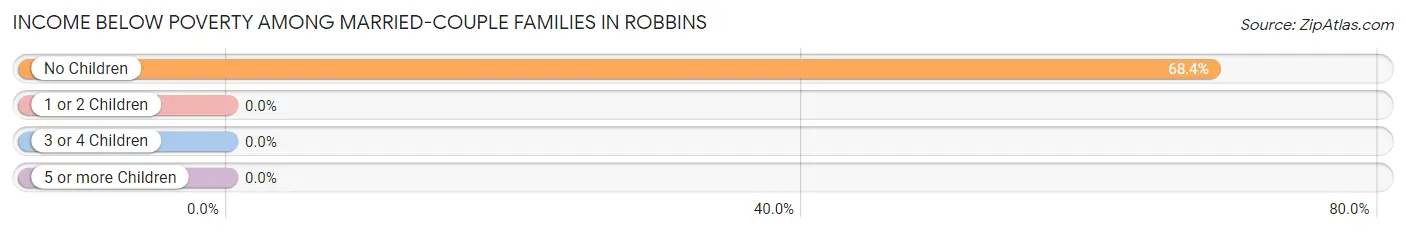
| Children | Above Poverty | Below Poverty |
| No Children | 6 (31.6%) | 13 (68.4%) |
| 1 or 2 Children | 12 (100.0%) | 0 (0.0%) |
| 3 or 4 Children | 0 (0.0%) | 0 (0.0%) |
| 5 or more Children | 0 (0.0%) | 0 (0.0%) |
| Total | 18 (58.1%) | 13 (41.9%) |
Income Below Poverty Among Single-Parent Households in Robbins
| Children | Single Father | Single Mother |
| No Children | 0 (0.0%) | 0 (0.0%) |
| 1 or 2 Children | 0 (0.0%) | 0 (0.0%) |
| 3 or 4 Children | 0 (0.0%) | 0 (0.0%) |
| 5 or more Children | 0 (0.0%) | 0 (0.0%) |
| Total | 0 (0.0%) | 0 (0.0%) |
Income Below Poverty Among Married-Couple vs Single-Parent Households in Robbins
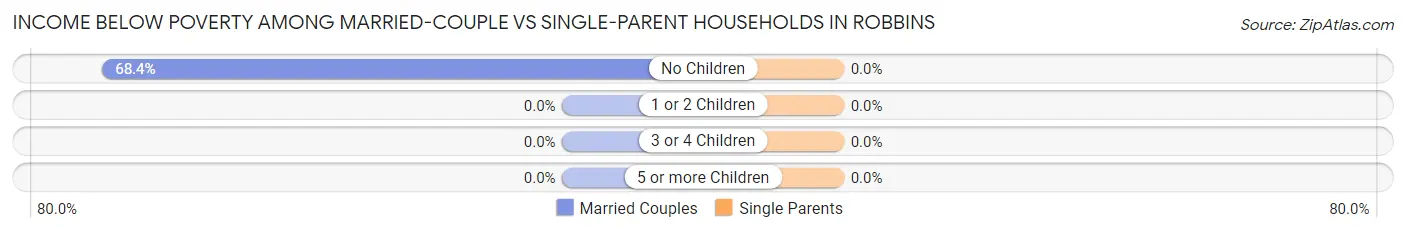
| Children | Married-Couple Families | Single-Parent Households |
| No Children | 13 (68.4%) | 0 (0.0%) |
| 1 or 2 Children | 0 (0.0%) | 0 (0.0%) |
| 3 or 4 Children | 0 (0.0%) | 0 (0.0%) |
| 5 or more Children | 0 (0.0%) | 0 (0.0%) |
| Total | 13 (41.9%) | 0 (0.0%) |
Race in Robbins
The most populous races in Robbins are , and White / Caucasian (109 | 100.0%).
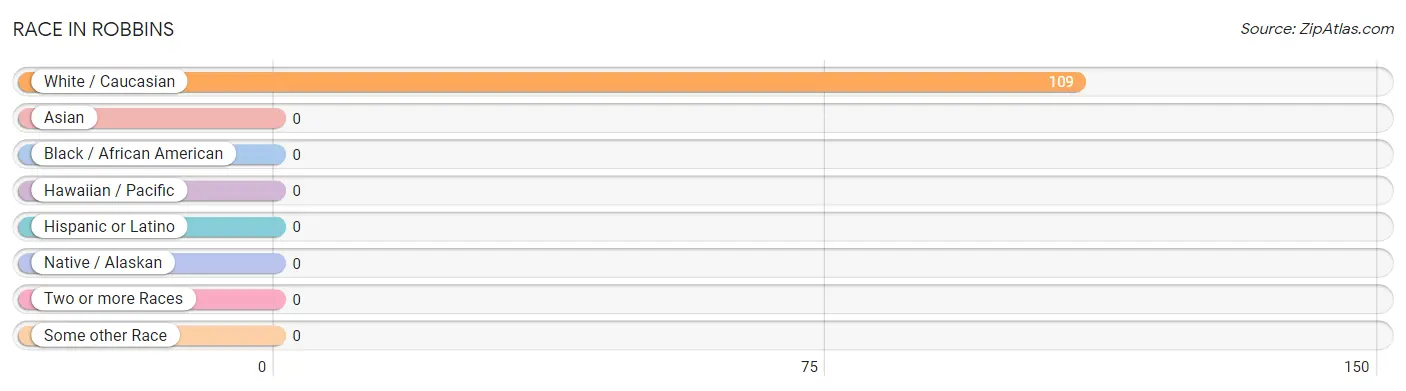
| Race | # Population | % Population |
| Asian | 0 | 0.0% |
| Black / African American | 0 | 0.0% |
| Hawaiian / Pacific | 0 | 0.0% |
| Hispanic or Latino | 0 | 0.0% |
| Native / Alaskan | 0 | 0.0% |
| White / Caucasian | 109 | 100.0% |
| Two or more Races | 0 | 0.0% |
| Some other Race | 0 | 0.0% |
| Total | 109 | 100.0% |
Ancestry in Robbins
The most populous ancestries reported in Robbins are American (65 | 59.6%), European (22 | 20.2%), and Irish (6 | 5.5%), together accounting for 85.3% of all Robbins residents.
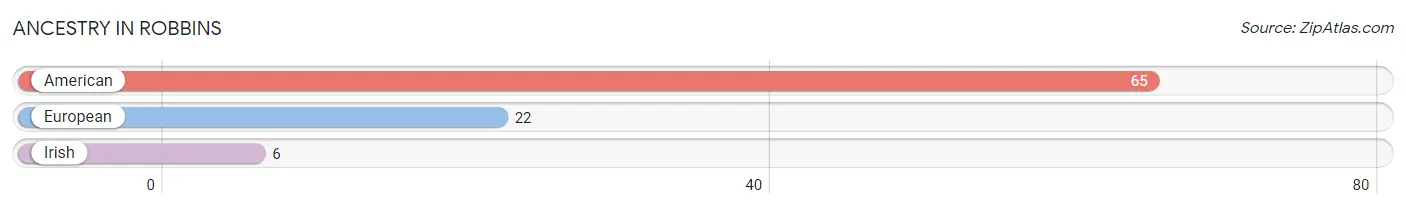
| Ancestry | # Population | % Population |
| American | 65 | 59.6% |
| European | 22 | 20.2% |
| Irish | 6 | 5.5% | View All 3 Rows |
Immigrants in Robbins

| Immigration Origin | # Population | % Population | View All 0 Rows |
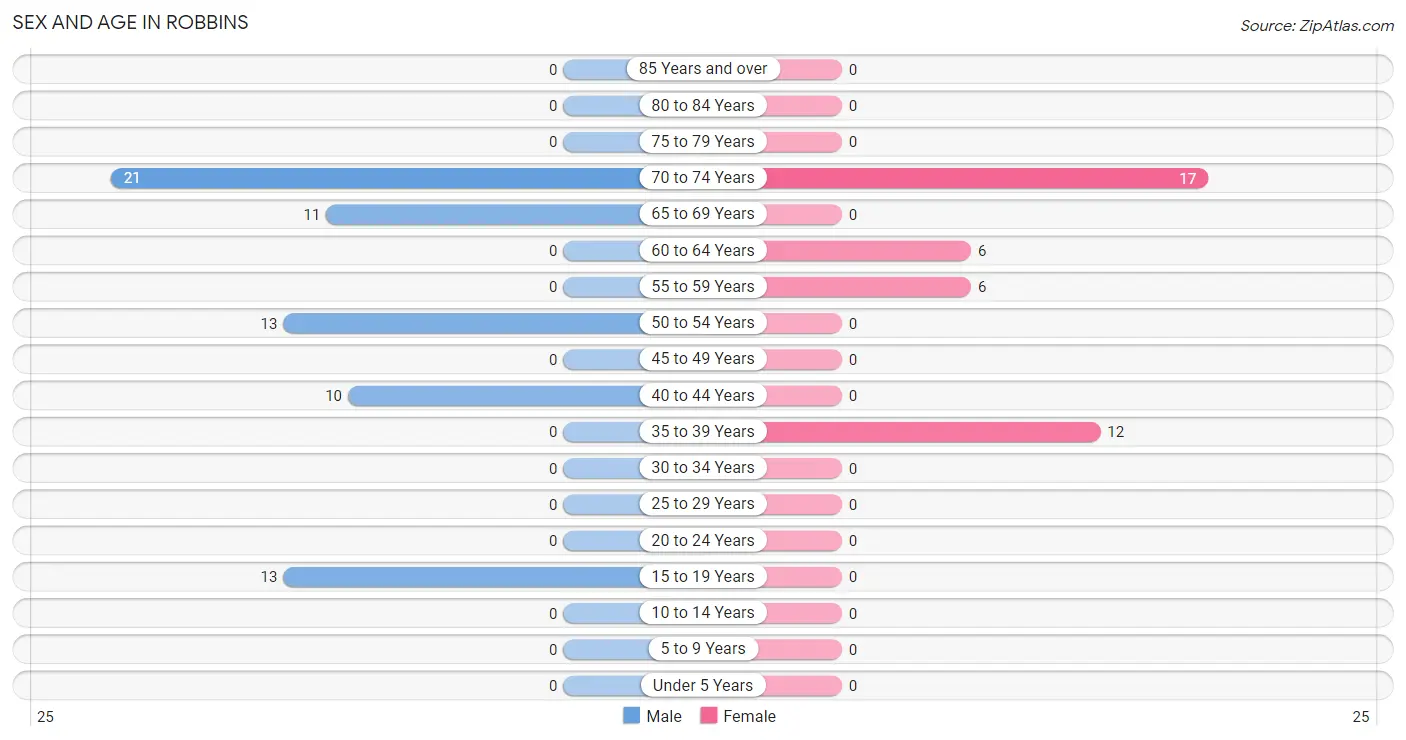
Sex and Age in Robbins
Sex and Age in Robbins
The most populous age groups in Robbins are 70 to 74 Years (21 | 30.9%) for men and 70 to 74 Years (17 | 41.5%) for women.
| Age Bracket | Male | Female |
| Under 5 Years | 0 (0.0%) | 0 (0.0%) |
| 5 to 9 Years | 0 (0.0%) | 0 (0.0%) |
| 10 to 14 Years | 0 (0.0%) | 0 (0.0%) |
| 15 to 19 Years | 13 (19.1%) | 0 (0.0%) |
| 20 to 24 Years | 0 (0.0%) | 0 (0.0%) |
| 25 to 29 Years | 0 (0.0%) | 0 (0.0%) |
| 30 to 34 Years | 0 (0.0%) | 0 (0.0%) |
| 35 to 39 Years | 0 (0.0%) | 12 (29.3%) |
| 40 to 44 Years | 10 (14.7%) | 0 (0.0%) |
| 45 to 49 Years | 0 (0.0%) | 0 (0.0%) |
| 50 to 54 Years | 13 (19.1%) | 0 (0.0%) |
| 55 to 59 Years | 0 (0.0%) | 6 (14.6%) |
| 60 to 64 Years | 0 (0.0%) | 6 (14.6%) |
| 65 to 69 Years | 11 (16.2%) | 0 (0.0%) |
| 70 to 74 Years | 21 (30.9%) | 17 (41.5%) |
| 75 to 79 Years | 0 (0.0%) | 0 (0.0%) |
| 80 to 84 Years | 0 (0.0%) | 0 (0.0%) |
| 85 Years and over | 0 (0.0%) | 0 (0.0%) |
| Total | 68 (100.0%) | 41 (100.0%) |
Families and Households in Robbins
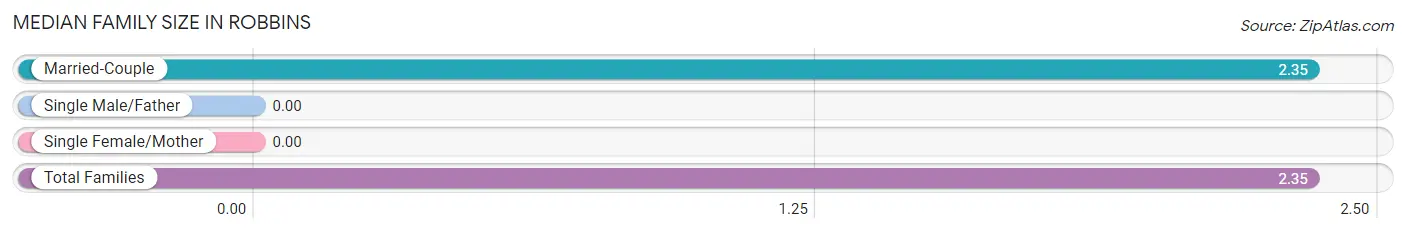
Median Family Size in Robbins
| Family Type | # Families | Family Size |
| Married-Couple | 31 (100.0%) | 2.35 |
| Single Male/Father | 0 (0.0%) | - |
| Single Female/Mother | 0 (0.0%) | - |
| Total Families | 31 (100.0%) | 2.35 |
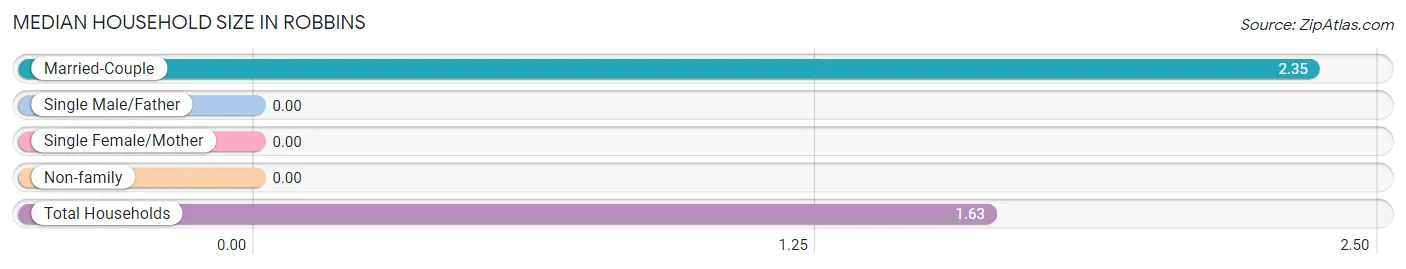
Median Household Size in Robbins
| Household Type | # Households | Household Size |
| Married-Couple | 31 (46.3%) | 2.35 |
| Single Male/Father | 0 (0.0%) | - |
| Single Female/Mother | 0 (0.0%) | - |
| Non-family | 36 (53.7%) | - |
| Total Households | 67 (100.0%) | 1.63 |
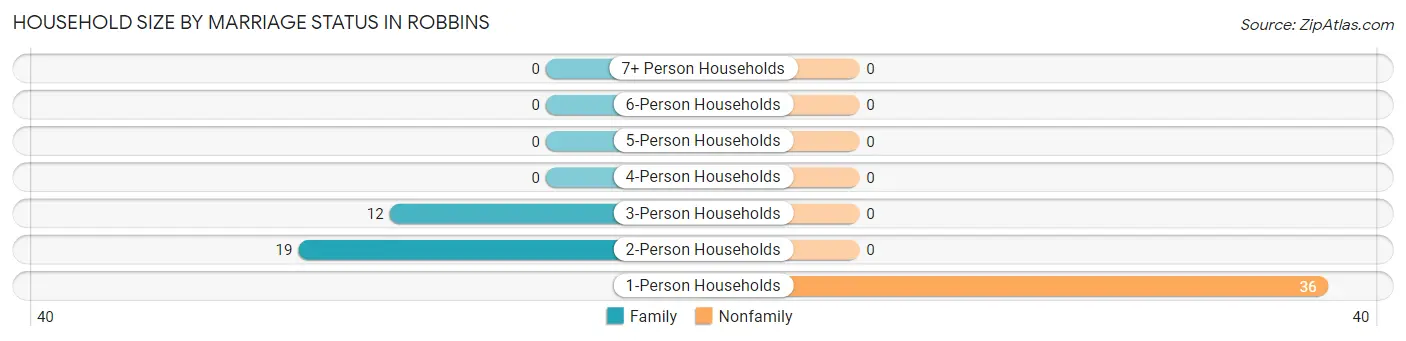
Household Size by Marriage Status in Robbins
Out of a total of 67 households in Robbins, 31 (46.3%) are family households, while 36 (53.7%) are nonfamily households. The most numerous type of family households are 2-person households, comprising 19, and the most common type of nonfamily households are 1-person households, comprising 36.
| Household Size | Family Households | Nonfamily Households |
| 1-Person Households | - | 36 (53.7%) |
| 2-Person Households | 19 (28.4%) | 0 (0.0%) |
| 3-Person Households | 12 (17.9%) | 0 (0.0%) |
| 4-Person Households | 0 (0.0%) | 0 (0.0%) |
| 5-Person Households | 0 (0.0%) | 0 (0.0%) |
| 6-Person Households | 0 (0.0%) | 0 (0.0%) |
| 7+ Person Households | 0 (0.0%) | 0 (0.0%) |
| Total | 31 (46.3%) | 36 (53.7%) |
Female Fertility in Robbins
Fertility by Age in Robbins
| Age Bracket | Women with Births | Births / 1,000 Women |
| 15 to 19 years | 0 (0.0%) | 0.0 |
| 20 to 34 years | 0 (0.0%) | 0.0 |
| 35 to 50 years | 0 (0.0%) | 0.0 |
| Total | 0 (0.0%) | 0.0 |
Fertility by Age by Marriage Status in Robbins
| Age Bracket | Married | Unmarried |
| 15 to 19 years | 0 (0.0%) | 0 (0.0%) |
| 20 to 34 years | 0 (0.0%) | 0 (0.0%) |
| 35 to 50 years | 0 (0.0%) | 0 (0.0%) |
| Total | 0 (0.0%) | 0 (0.0%) |
Fertility by Education in Robbins
| Educational Attainment | Women with Births | Births / 1,000 Women |
| Less than High School | 0 (0.0%) | 0.0 |
| High School Diploma | 0 (0.0%) | 0.0 |
| College or Associate's Degree | 0 (0.0%) | 0.0 |
| Bachelor's Degree | 0 (0.0%) | 0.0 |
| Graduate Degree | 0 (0.0%) | 0.0 |
| Total | 0 (0.0%) | 0.0 |
Fertility by Education by Marriage Status in Robbins
| Educational Attainment | Married | Unmarried |
| Less than High School | 0 (0.0%) | 0 (0.0%) |
| High School Diploma | 0 (0.0%) | 0 (0.0%) |
| College or Associate's Degree | 0 (0.0%) | 0 (0.0%) |
| Bachelor's Degree | 0 (0.0%) | 0 (0.0%) |
| Graduate Degree | 0 (0.0%) | 0 (0.0%) |
| Total | 0 (0.0%) | 0 (0.0%) |
Employment Characteristics in Robbins
Employment by Class of Employer in Robbins
Among the 16 employed individuals in Robbins, private company employees (10 | 62.5%), and state government employees (6 | 37.5%) make up the most common classes of employment.
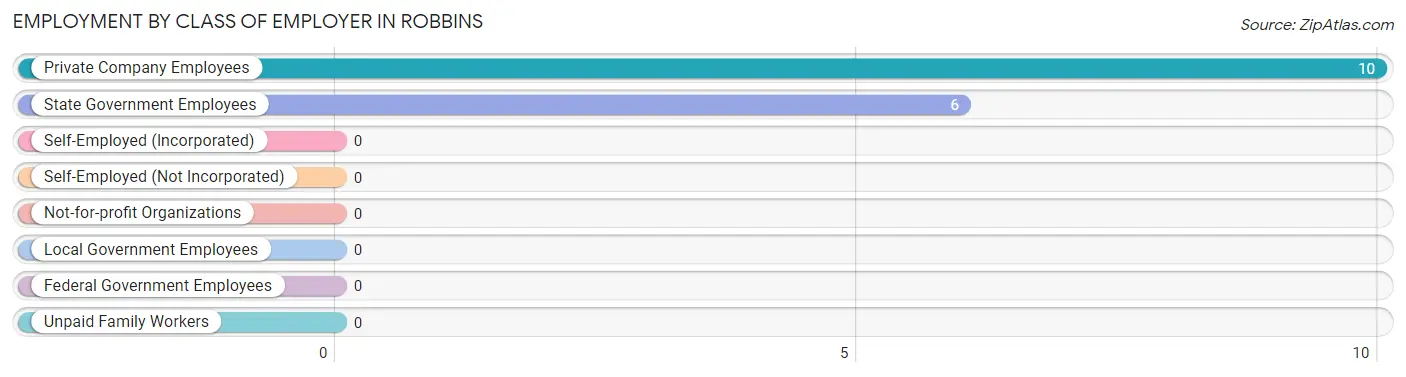
| Employer Class | # Employees | % Employees |
| Private Company Employees | 10 | 62.5% |
| Self-Employed (Incorporated) | 0 | 0.0% |
| Self-Employed (Not Incorporated) | 0 | 0.0% |
| Not-for-profit Organizations | 0 | 0.0% |
| Local Government Employees | 0 | 0.0% |
| State Government Employees | 6 | 37.5% |
| Federal Government Employees | 0 | 0.0% |
| Unpaid Family Workers | 0 | 0.0% |
| Total | 16 | 100.0% |
Employment Status by Age in Robbins
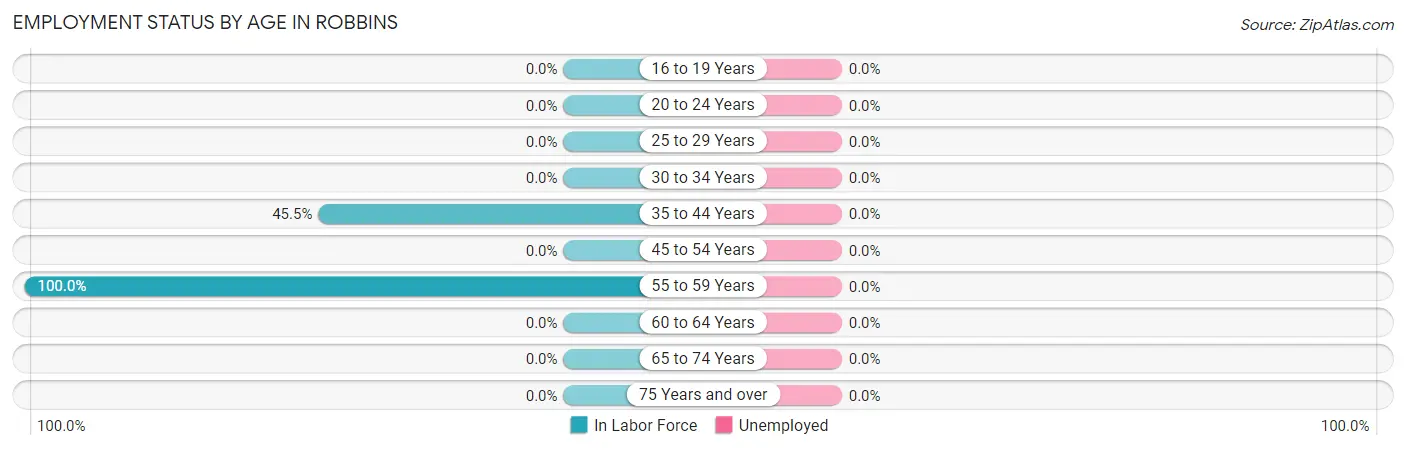
| Age Bracket | In Labor Force | Unemployed |
| 16 to 19 Years | 0 (0.0%) | 0 (0.0%) |
| 20 to 24 Years | 0 (0.0%) | 0 (0.0%) |
| 25 to 29 Years | 0 (0.0%) | 0 (0.0%) |
| 30 to 34 Years | 0 (0.0%) | 0 (0.0%) |
| 35 to 44 Years | 10 (45.5%) | 0 (0.0%) |
| 45 to 54 Years | 0 (0.0%) | 0 (0.0%) |
| 55 to 59 Years | 6 (100.0%) | 0 (0.0%) |
| 60 to 64 Years | 0 (0.0%) | 0 (0.0%) |
| 65 to 74 Years | 0 (0.0%) | 0 (0.0%) |
| 75 Years and over | 0 (0.0%) | 0 (0.0%) |
| Total | 16 (16.7%) | 0 (0.0%) |
Employment Status by Educational Attainment in Robbins
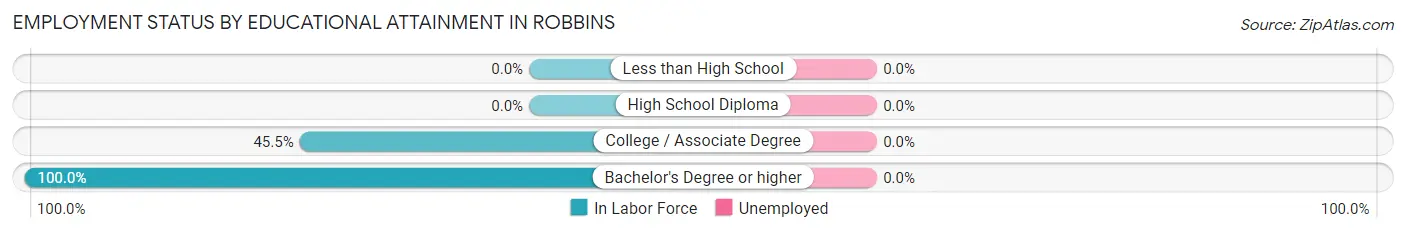
| Educational Attainment | In Labor Force | Unemployed |
| Less than High School | 0 (0.0%) | 0 (0.0%) |
| High School Diploma | 0 (0.0%) | 0 (0.0%) |
| College / Associate Degree | 10 (45.5%) | 0 (0.0%) |
| Bachelor's Degree or higher | 6 (100.0%) | 0 (0.0%) |
| Total | 16 (34.0%) | 0 (0.0%) |
Employment Occupations by Sex in Robbins
Management, Business, Science and Arts Occupations
The most common Management, Business, Science and Arts occupations in Robbins are Community & Social Service (6 | 37.5%), and Education, Arts & Media (6 | 37.5%).
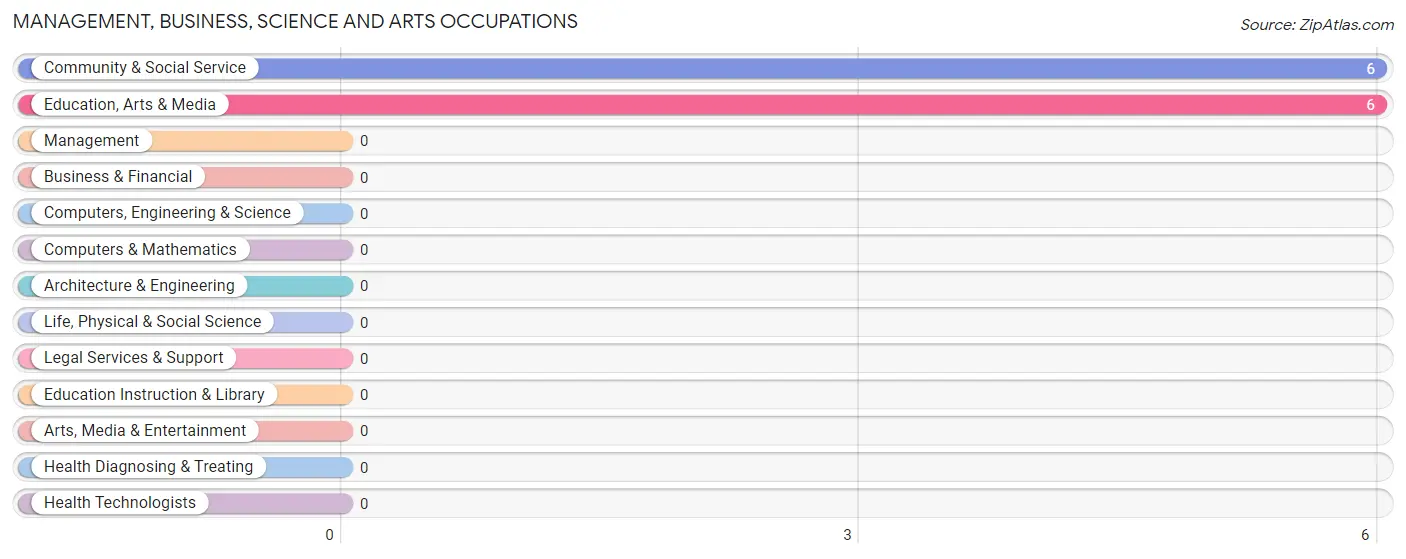
Management, Business, Science and Arts Occupations by Sex
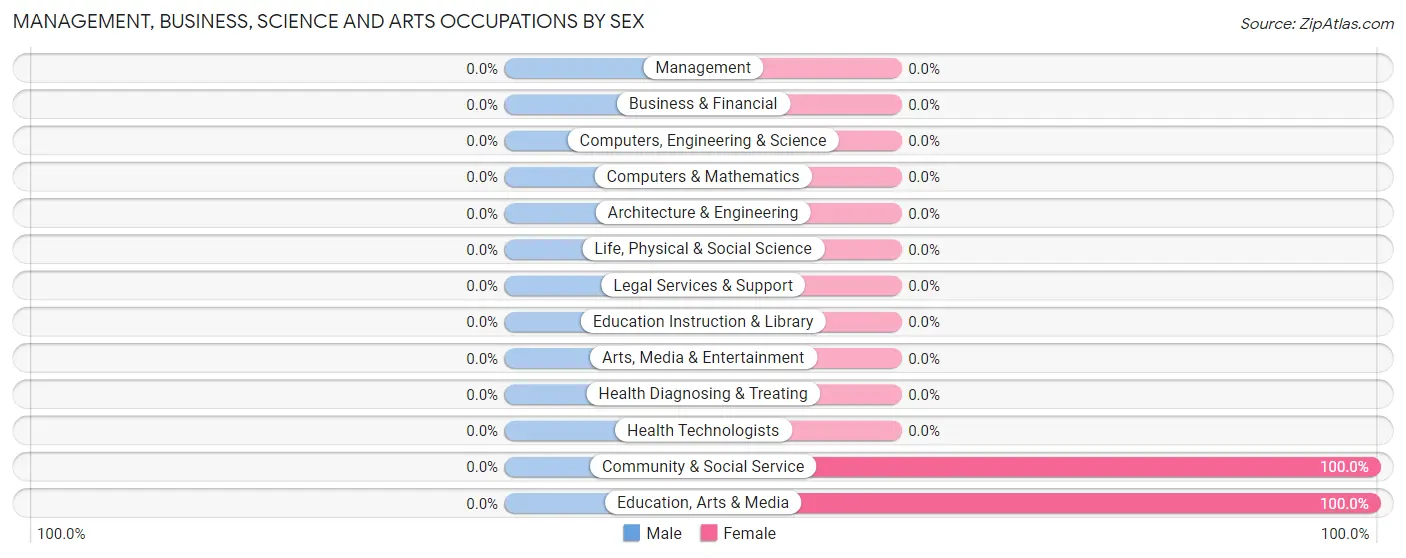
| Occupation | Male | Female |
| Management | 0 (0.0%) | 0 (0.0%) |
| Business & Financial | 0 (0.0%) | 0 (0.0%) |
| Computers, Engineering & Science | 0 (0.0%) | 0 (0.0%) |
| Computers & Mathematics | 0 (0.0%) | 0 (0.0%) |
| Architecture & Engineering | 0 (0.0%) | 0 (0.0%) |
| Life, Physical & Social Science | 0 (0.0%) | 0 (0.0%) |
| Community & Social Service | 0 (0.0%) | 6 (100.0%) |
| Education, Arts & Media | 0 (0.0%) | 6 (100.0%) |
| Legal Services & Support | 0 (0.0%) | 0 (0.0%) |
| Education Instruction & Library | 0 (0.0%) | 0 (0.0%) |
| Arts, Media & Entertainment | 0 (0.0%) | 0 (0.0%) |
| Health Diagnosing & Treating | 0 (0.0%) | 0 (0.0%) |
| Health Technologists | 0 (0.0%) | 0 (0.0%) |
| Total (Category) | 0 (0.0%) | 6 (100.0%) |
| Total (Overall) | 10 (62.5%) | 6 (37.5%) |
Services Occupations
Services Occupations by Sex
| Occupation | Male | Female |
| Healthcare Support | 0 (0.0%) | 0 (0.0%) |
| Security & Protection | 0 (0.0%) | 0 (0.0%) |
| Firefighting & Prevention | 0 (0.0%) | 0 (0.0%) |
| Law Enforcement | 0 (0.0%) | 0 (0.0%) |
| Food Preparation & Serving | 0 (0.0%) | 0 (0.0%) |
| Cleaning & Maintenance | 0 (0.0%) | 0 (0.0%) |
| Personal Care & Service | 0 (0.0%) | 0 (0.0%) |
| Total (Category) | 0 (0.0%) | 0 (0.0%) |
| Total (Overall) | 10 (62.5%) | 6 (37.5%) |
Sales and Office Occupations
Sales and Office Occupations by Sex
| Occupation | Male | Female |
| Sales & Related | 0 (0.0%) | 0 (0.0%) |
| Office & Administration | 0 (0.0%) | 0 (0.0%) |
| Total (Category) | 0 (0.0%) | 0 (0.0%) |
| Total (Overall) | 10 (62.5%) | 6 (37.5%) |
Natural Resources, Construction and Maintenance Occupations
Natural Resources, Construction and Maintenance Occupations by Sex
| Occupation | Male | Female |
| Farming, Fishing & Forestry | 0 (0.0%) | 0 (0.0%) |
| Construction & Extraction | 0 (0.0%) | 0 (0.0%) |
| Installation, Maintenance & Repair | 0 (0.0%) | 0 (0.0%) |
| Total (Category) | 0 (0.0%) | 0 (0.0%) |
| Total (Overall) | 10 (62.5%) | 6 (37.5%) |
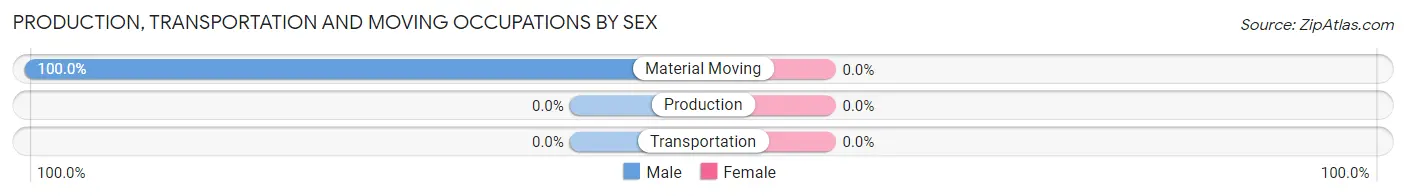
Production, Transportation and Moving Occupations
The most common Production, Transportation and Moving occupations in Robbins are , and Material Moving (10 | 62.5%).
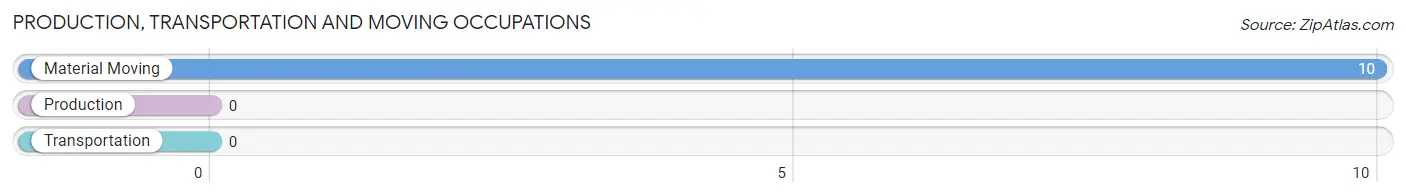
Production, Transportation and Moving Occupations by Sex
| Occupation | Male | Female |
| Production | 0 (0.0%) | 0 (0.0%) |
| Transportation | 0 (0.0%) | 0 (0.0%) |
| Material Moving | 10 (100.0%) | 0 (0.0%) |
| Total (Category) | 10 (100.0%) | 0 (0.0%) |
| Total (Overall) | 10 (62.5%) | 6 (37.5%) |
Employment Industries by Sex in Robbins
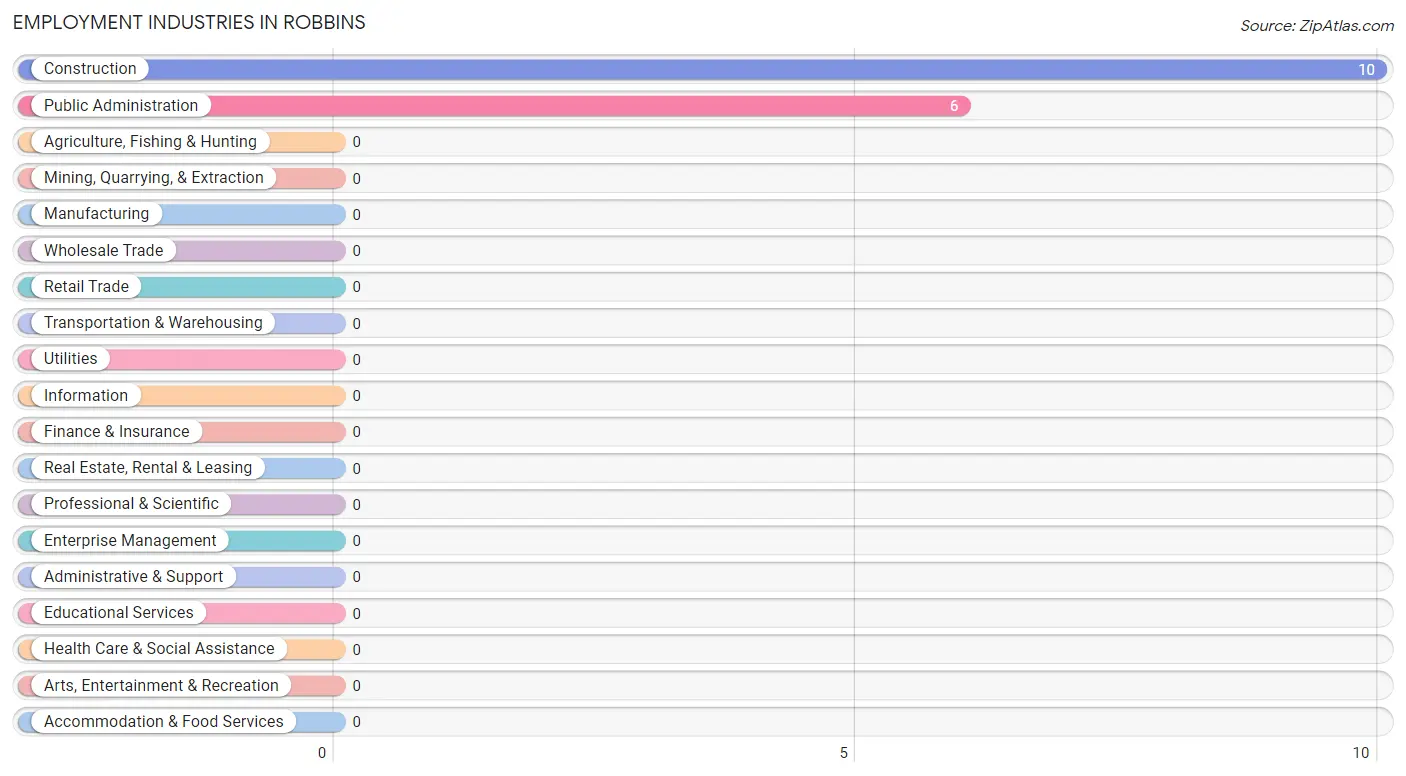
Employment Industries in Robbins
The major employment industries in Robbins include Construction (10 | 62.5%), and Public Administration (6 | 37.5%).
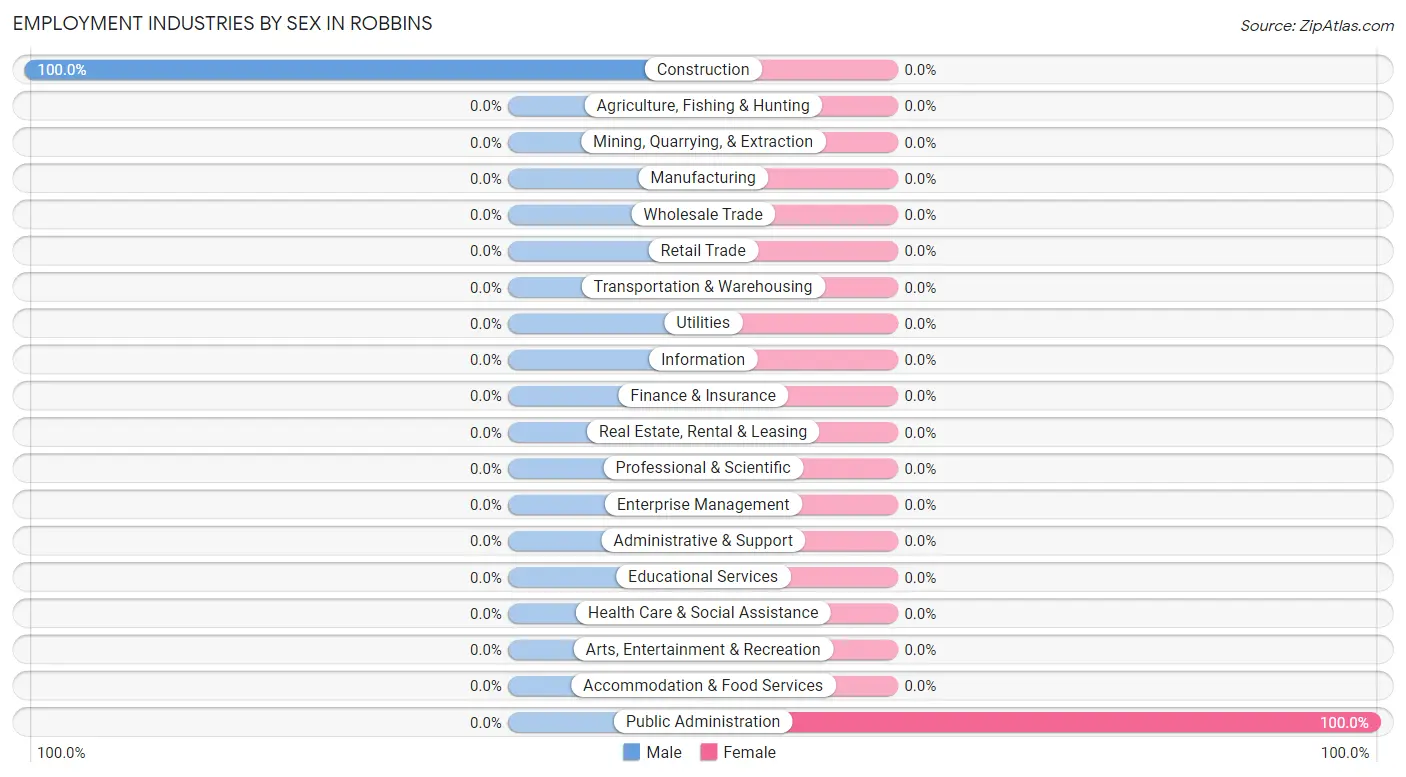
Employment Industries by Sex in Robbins
| Industry | Male | Female |
| Agriculture, Fishing & Hunting | 0 (0.0%) | 0 (0.0%) |
| Mining, Quarrying, & Extraction | 0 (0.0%) | 0 (0.0%) |
| Construction | 10 (100.0%) | 0 (0.0%) |
| Manufacturing | 0 (0.0%) | 0 (0.0%) |
| Wholesale Trade | 0 (0.0%) | 0 (0.0%) |
| Retail Trade | 0 (0.0%) | 0 (0.0%) |
| Transportation & Warehousing | 0 (0.0%) | 0 (0.0%) |
| Utilities | 0 (0.0%) | 0 (0.0%) |
| Information | 0 (0.0%) | 0 (0.0%) |
| Finance & Insurance | 0 (0.0%) | 0 (0.0%) |
| Real Estate, Rental & Leasing | 0 (0.0%) | 0 (0.0%) |
| Professional & Scientific | 0 (0.0%) | 0 (0.0%) |
| Enterprise Management | 0 (0.0%) | 0 (0.0%) |
| Administrative & Support | 0 (0.0%) | 0 (0.0%) |
| Educational Services | 0 (0.0%) | 0 (0.0%) |
| Health Care & Social Assistance | 0 (0.0%) | 0 (0.0%) |
| Arts, Entertainment & Recreation | 0 (0.0%) | 0 (0.0%) |
| Accommodation & Food Services | 0 (0.0%) | 0 (0.0%) |
| Public Administration | 0 (0.0%) | 6 (100.0%) |
| Total | 10 (62.5%) | 6 (37.5%) |
Education in Robbins
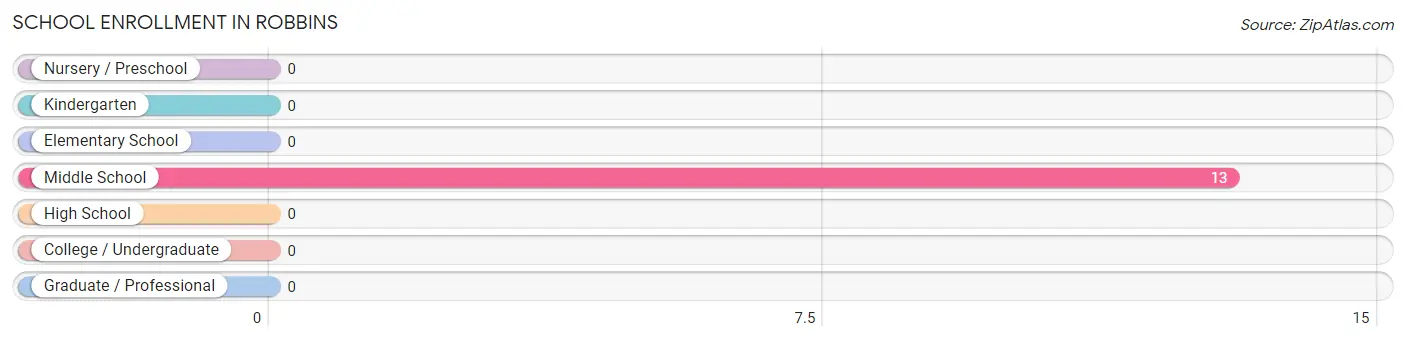
School Enrollment in Robbins
| School Level | # Students | % Students |
| Nursery / Preschool | 0 | 0.0% |
| Kindergarten | 0 | 0.0% |
| Elementary School | 0 | 0.0% |
| Middle School | 13 | 100.0% |
| High School | 0 | 0.0% |
| College / Undergraduate | 0 | 0.0% |
| Graduate / Professional | 0 | 0.0% |
| Total | 13 | 100.0% |
School Enrollment by Age by Funding Source in Robbins
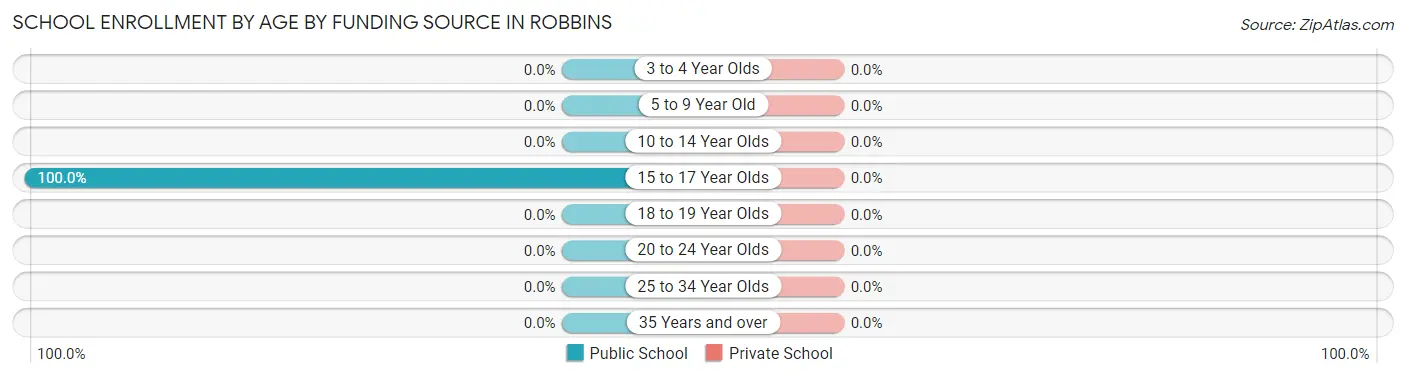
| Age Bracket | Public School | Private School |
| 3 to 4 Year Olds | 0 (0.0%) | 0 (0.0%) |
| 5 to 9 Year Old | 0 (0.0%) | 0 (0.0%) |
| 10 to 14 Year Olds | 0 (0.0%) | 0 (0.0%) |
| 15 to 17 Year Olds | 13 (100.0%) | 0 (0.0%) |
| 18 to 19 Year Olds | 0 (0.0%) | 0 (0.0%) |
| 20 to 24 Year Olds | 0 (0.0%) | 0 (0.0%) |
| 25 to 34 Year Olds | 0 (0.0%) | 0 (0.0%) |
| 35 Years and over | 0 (0.0%) | 0 (0.0%) |
| Total | 13 (100.0%) | 0 (0.0%) |
Educational Attainment by Field of Study in Robbins
Business (11 | 47.8%), psychology (6 | 26.1%), and education (6 | 26.1%) are the most common fields of study among 23 individuals in Robbins who have obtained a bachelor's degree or higher.
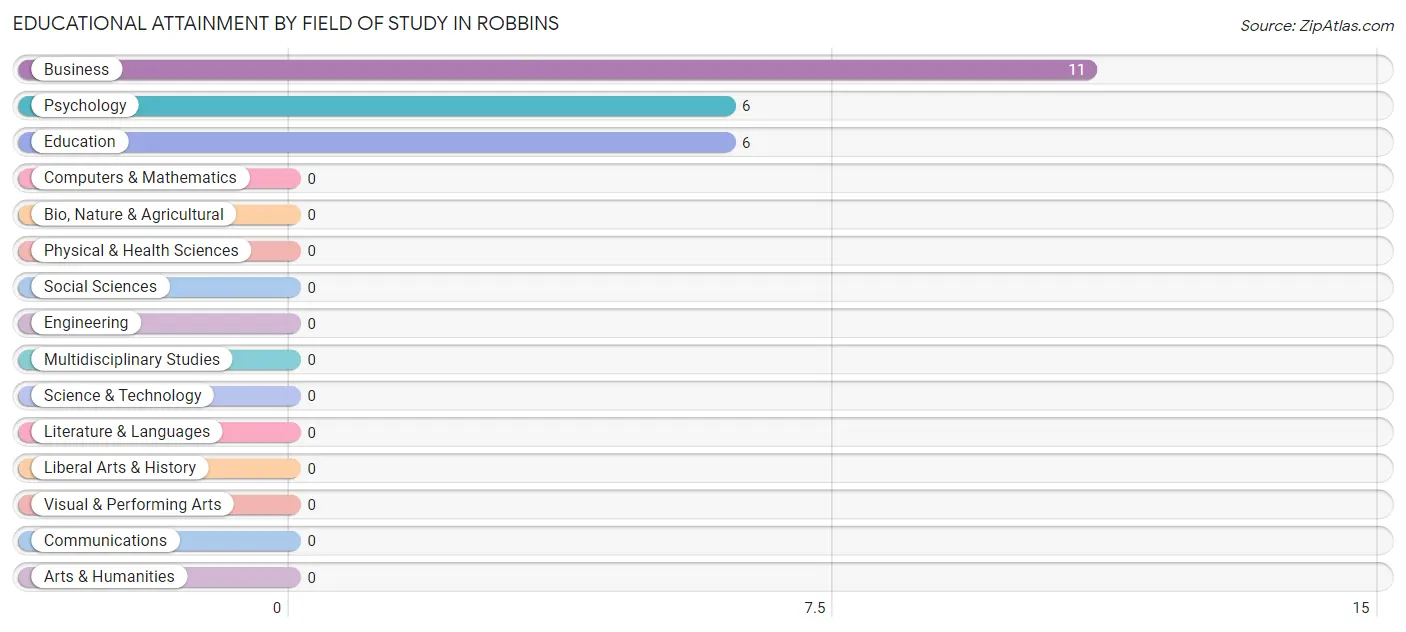
| Field of Study | # Graduates | % Graduates |
| Computers & Mathematics | 0 | 0.0% |
| Bio, Nature & Agricultural | 0 | 0.0% |
| Physical & Health Sciences | 0 | 0.0% |
| Psychology | 6 | 26.1% |
| Social Sciences | 0 | 0.0% |
| Engineering | 0 | 0.0% |
| Multidisciplinary Studies | 0 | 0.0% |
| Science & Technology | 0 | 0.0% |
| Business | 11 | 47.8% |
| Education | 6 | 26.1% |
| Literature & Languages | 0 | 0.0% |
| Liberal Arts & History | 0 | 0.0% |
| Visual & Performing Arts | 0 | 0.0% |
| Communications | 0 | 0.0% |
| Arts & Humanities | 0 | 0.0% |
| Total | 23 | 100.0% |
Transportation & Commute in Robbins
Vehicle Availability by Sex in Robbins
The most prevalent vehicle ownership categories in Robbins are males with 2 vehicles (10, accounting for 100.0%) and females with 2 vehicles (0, making up 166.7%).
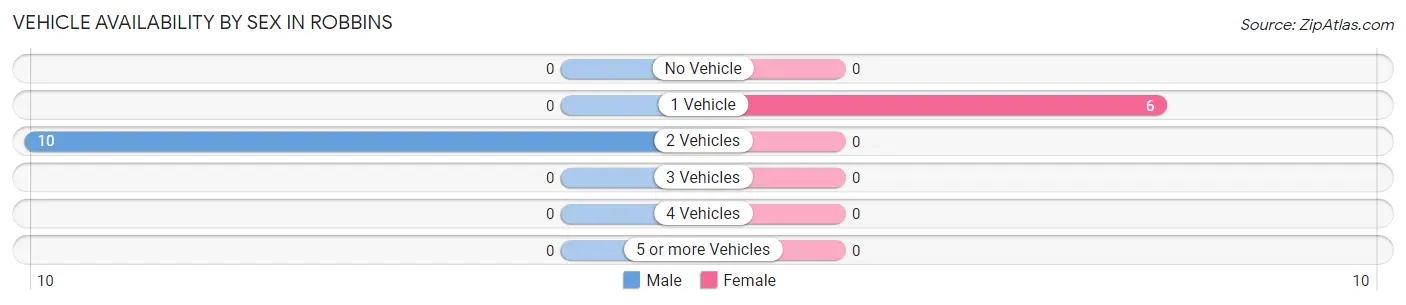
| Vehicles Available | Male | Female |
| No Vehicle | 0 (0.0%) | 0 (0.0%) |
| 1 Vehicle | 0 (0.0%) | 6 (100.0%) |
| 2 Vehicles | 10 (100.0%) | 0 (0.0%) |
| 3 Vehicles | 0 (0.0%) | 0 (0.0%) |
| 4 Vehicles | 0 (0.0%) | 0 (0.0%) |
| 5 or more Vehicles | 0 (0.0%) | 0 (0.0%) |
| Total | 10 (100.0%) | 6 (100.0%) |
Commute Time in Robbins
The most frequently occuring commute durations in Robbins are 60 to 89 minutes (10 commuters, 62.5%), 15 to 19 minutes (6 commuters, 37.5%), and less than 5 minutes (0 commuters, 0.0%).
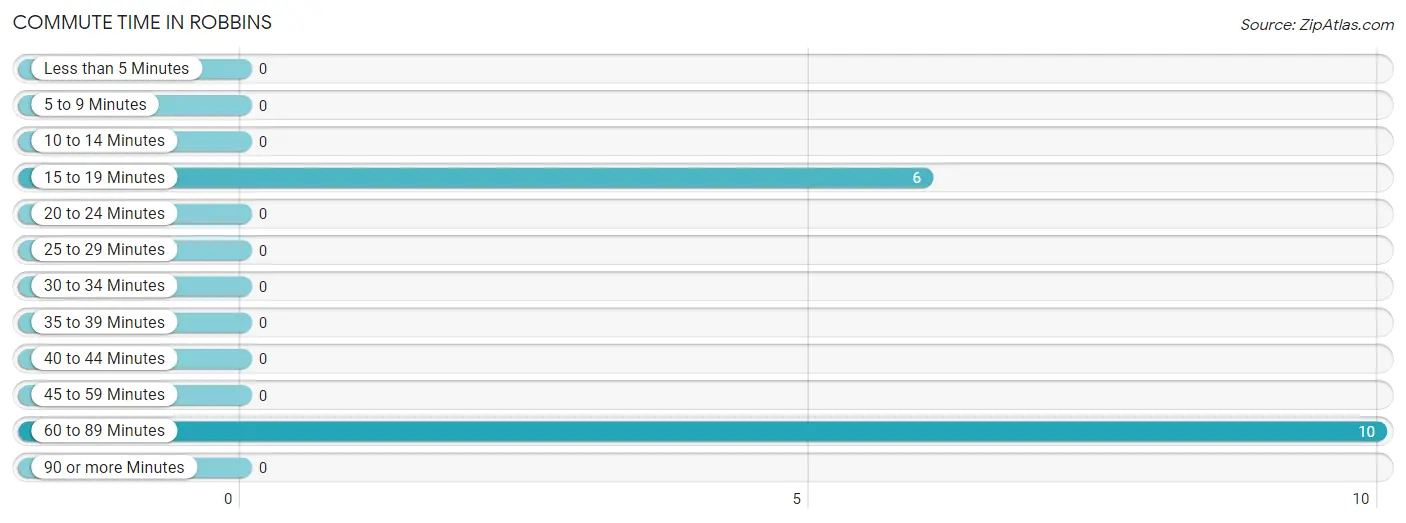
| Commute Time | # Commuters | % Commuters |
| Less than 5 Minutes | 0 | 0.0% |
| 5 to 9 Minutes | 0 | 0.0% |
| 10 to 14 Minutes | 0 | 0.0% |
| 15 to 19 Minutes | 6 | 37.5% |
| 20 to 24 Minutes | 0 | 0.0% |
| 25 to 29 Minutes | 0 | 0.0% |
| 30 to 34 Minutes | 0 | 0.0% |
| 35 to 39 Minutes | 0 | 0.0% |
| 40 to 44 Minutes | 0 | 0.0% |
| 45 to 59 Minutes | 0 | 0.0% |
| 60 to 89 Minutes | 10 | 62.5% |
| 90 or more Minutes | 0 | 0.0% |
Commute Time by Sex in Robbins
The most common commute times in Robbins are 60 to 89 minutes (10 commuters, 100.0%) for males and 15 to 19 minutes (6 commuters, 100.0%) for females.
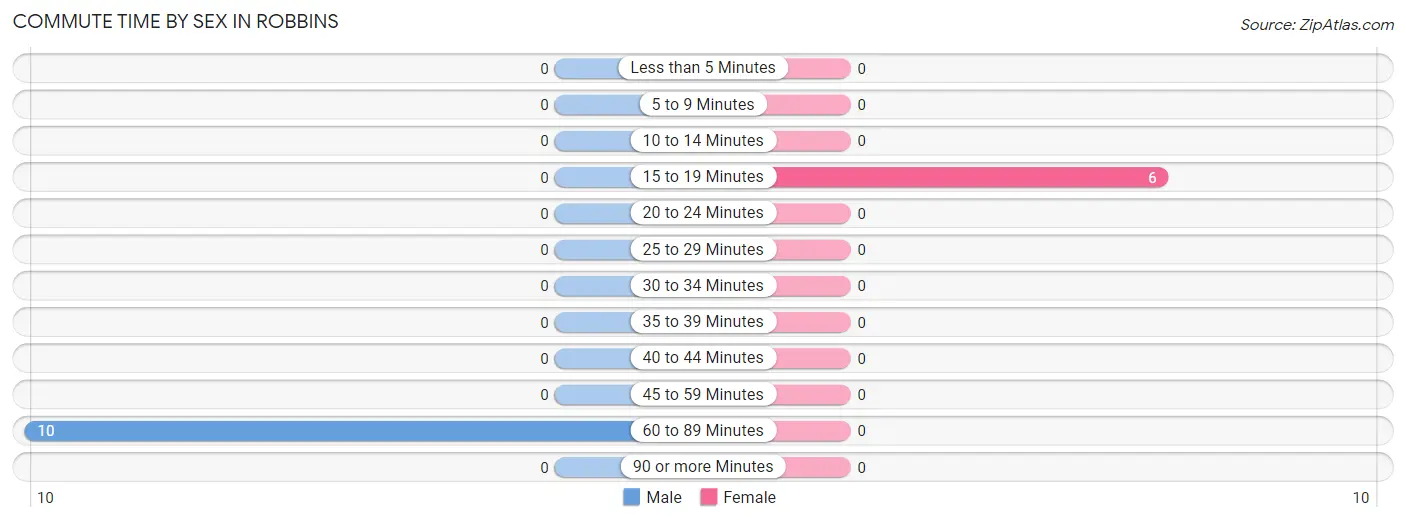
| Commute Time | Male | Female |
| Less than 5 Minutes | 0 (0.0%) | 0 (0.0%) |
| 5 to 9 Minutes | 0 (0.0%) | 0 (0.0%) |
| 10 to 14 Minutes | 0 (0.0%) | 0 (0.0%) |
| 15 to 19 Minutes | 0 (0.0%) | 6 (100.0%) |
| 20 to 24 Minutes | 0 (0.0%) | 0 (0.0%) |
| 25 to 29 Minutes | 0 (0.0%) | 0 (0.0%) |
| 30 to 34 Minutes | 0 (0.0%) | 0 (0.0%) |
| 35 to 39 Minutes | 0 (0.0%) | 0 (0.0%) |
| 40 to 44 Minutes | 0 (0.0%) | 0 (0.0%) |
| 45 to 59 Minutes | 0 (0.0%) | 0 (0.0%) |
| 60 to 89 Minutes | 10 (100.0%) | 0 (0.0%) |
| 90 or more Minutes | 0 (0.0%) | 0 (0.0%) |
Time of Departure to Work by Sex in Robbins
The most frequent times of departure to work in Robbins are 5:00 AM to 5:29 AM (10, 100.0%) for males and 7:30 AM to 7:59 AM (6, 100.0%) for females.
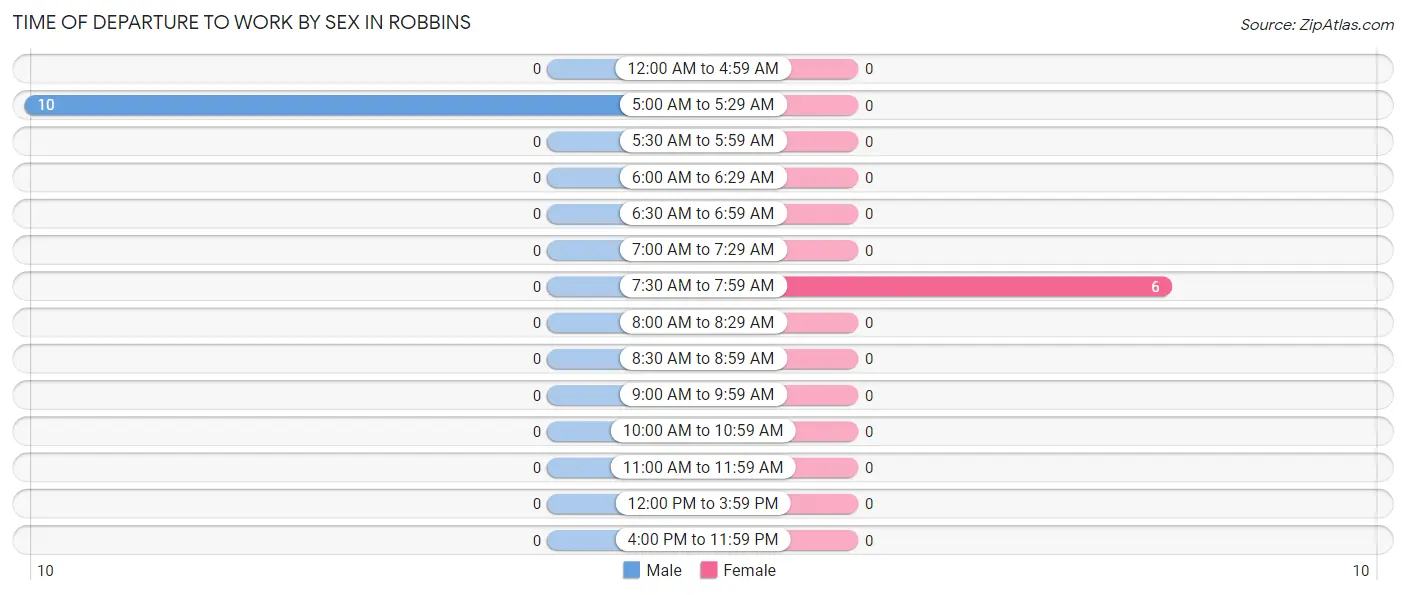
| Time of Departure | Male | Female |
| 12:00 AM to 4:59 AM | 0 (0.0%) | 0 (0.0%) |
| 5:00 AM to 5:29 AM | 10 (100.0%) | 0 (0.0%) |
| 5:30 AM to 5:59 AM | 0 (0.0%) | 0 (0.0%) |
| 6:00 AM to 6:29 AM | 0 (0.0%) | 0 (0.0%) |
| 6:30 AM to 6:59 AM | 0 (0.0%) | 0 (0.0%) |
| 7:00 AM to 7:29 AM | 0 (0.0%) | 0 (0.0%) |
| 7:30 AM to 7:59 AM | 0 (0.0%) | 6 (100.0%) |
| 8:00 AM to 8:29 AM | 0 (0.0%) | 0 (0.0%) |
| 8:30 AM to 8:59 AM | 0 (0.0%) | 0 (0.0%) |
| 9:00 AM to 9:59 AM | 0 (0.0%) | 0 (0.0%) |
| 10:00 AM to 10:59 AM | 0 (0.0%) | 0 (0.0%) |
| 11:00 AM to 11:59 AM | 0 (0.0%) | 0 (0.0%) |
| 12:00 PM to 3:59 PM | 0 (0.0%) | 0 (0.0%) |
| 4:00 PM to 11:59 PM | 0 (0.0%) | 0 (0.0%) |
| Total | 10 (100.0%) | 6 (100.0%) |
Housing Occupancy in Robbins
Occupancy by Ownership in Robbins
Of the total 67 dwellings in Robbins, owner-occupied units account for 55 (82.1%), while renter-occupied units make up 12 (17.9%).
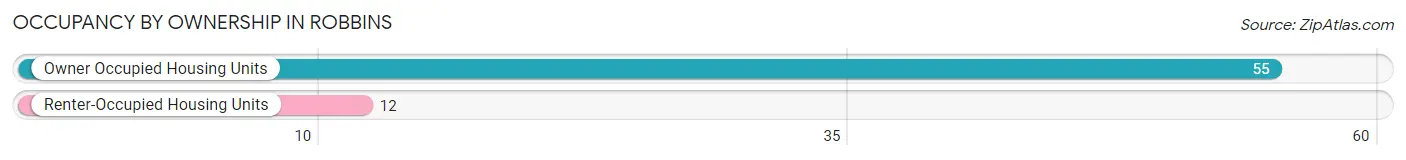
| Occupancy | # Housing Units | % Housing Units |
| Owner Occupied Housing Units | 55 | 82.1% |
| Renter-Occupied Housing Units | 12 | 17.9% |
| Total Occupied Housing Units | 67 | 100.0% |
Occupancy by Household Size in Robbins
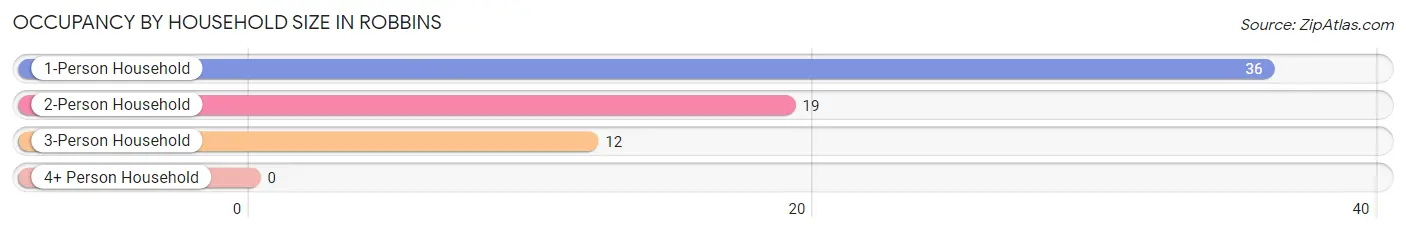
| Household Size | # Housing Units | % Housing Units |
| 1-Person Household | 36 | 53.7% |
| 2-Person Household | 19 | 28.4% |
| 3-Person Household | 12 | 17.9% |
| 4+ Person Household | 0 | 0.0% |
| Total Housing Units | 67 | 100.0% |
Occupancy by Ownership by Household Size in Robbins
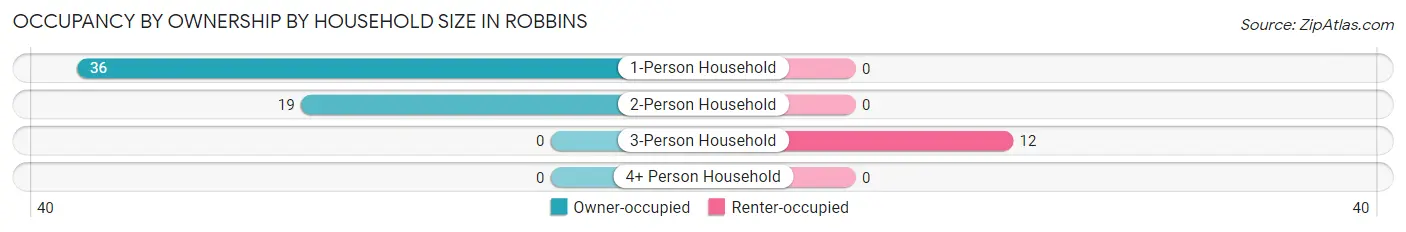
| Household Size | Owner-occupied | Renter-occupied |
| 1-Person Household | 36 (100.0%) | 0 (0.0%) |
| 2-Person Household | 19 (100.0%) | 0 (0.0%) |
| 3-Person Household | 0 (0.0%) | 12 (100.0%) |
| 4+ Person Household | 0 (0.0%) | 0 (0.0%) |
| Total Housing Units | 55 (82.1%) | 12 (17.9%) |
Occupancy by Educational Attainment in Robbins
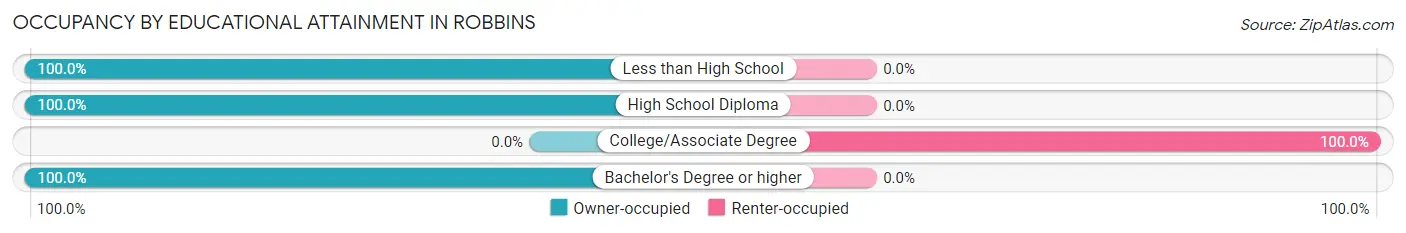
| Household Size | Owner-occupied | Renter-occupied |
| Less than High School | 13 (100.0%) | 0 (0.0%) |
| High School Diploma | 25 (100.0%) | 0 (0.0%) |
| College/Associate Degree | 0 (0.0%) | 12 (100.0%) |
| Bachelor's Degree or higher | 17 (100.0%) | 0 (0.0%) |
Occupancy by Age of Householder in Robbins
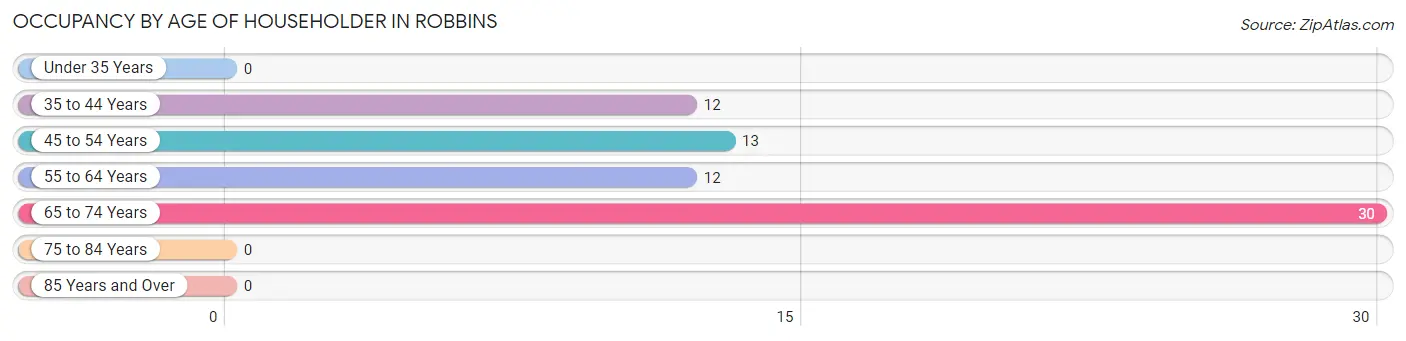
| Age Bracket | # Households | % Households |
| Under 35 Years | 0 | 0.0% |
| 35 to 44 Years | 12 | 17.9% |
| 45 to 54 Years | 13 | 19.4% |
| 55 to 64 Years | 12 | 17.9% |
| 65 to 74 Years | 30 | 44.8% |
| 75 to 84 Years | 0 | 0.0% |
| 85 Years and Over | 0 | 0.0% |
| Total | 67 | 100.0% |
Housing Finances in Robbins
Median Income by Occupancy in Robbins
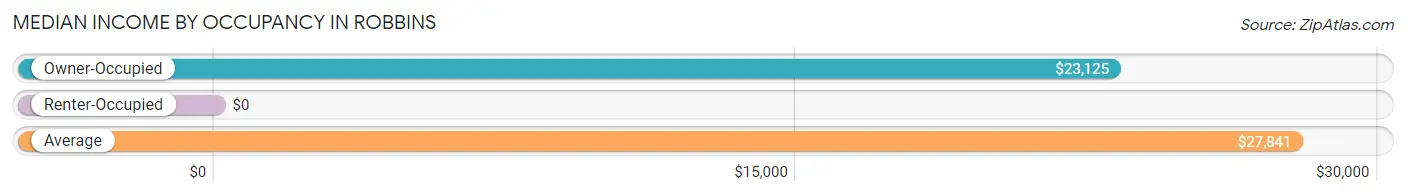
| Occupancy Type | # Households | Median Income |
| Owner-Occupied | 55 (82.1%) | $23,125 |
| Renter-Occupied | 12 (17.9%) | $0 |
| Average | 67 (100.0%) | $27,841 |
Occupancy by Householder Income Bracket in Robbins
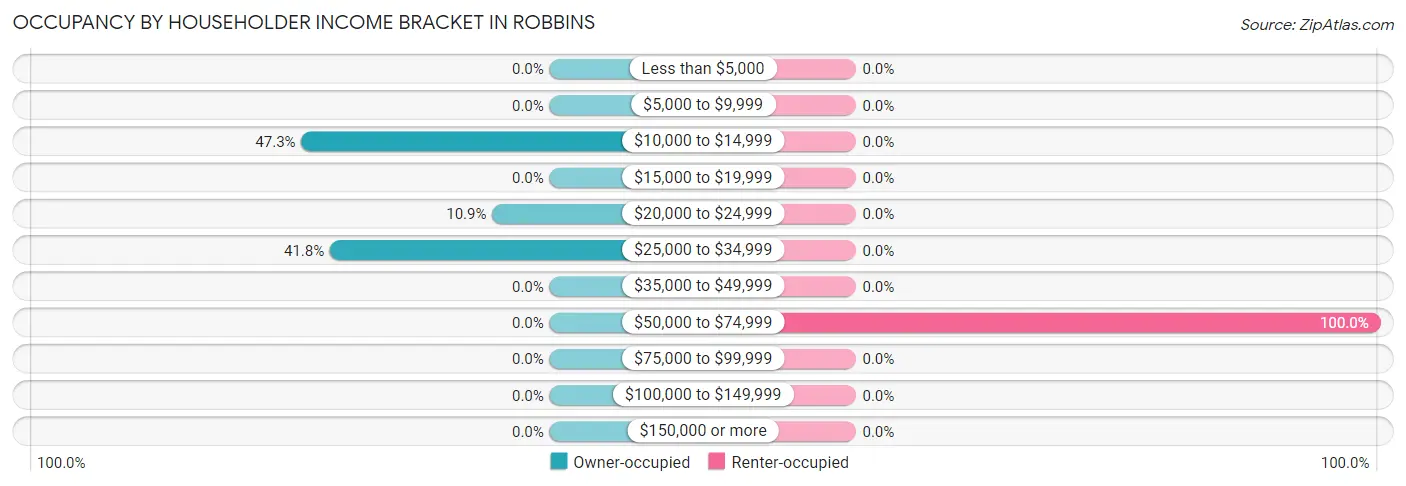
| Income Bracket | Owner-occupied | Renter-occupied |
| Less than $5,000 | 0 (0.0%) | 0 (0.0%) |
| $5,000 to $9,999 | 0 (0.0%) | 0 (0.0%) |
| $10,000 to $14,999 | 26 (47.3%) | 0 (0.0%) |
| $15,000 to $19,999 | 0 (0.0%) | 0 (0.0%) |
| $20,000 to $24,999 | 6 (10.9%) | 0 (0.0%) |
| $25,000 to $34,999 | 23 (41.8%) | 0 (0.0%) |
| $35,000 to $49,999 | 0 (0.0%) | 0 (0.0%) |
| $50,000 to $74,999 | 0 (0.0%) | 12 (100.0%) |
| $75,000 to $99,999 | 0 (0.0%) | 0 (0.0%) |
| $100,000 to $149,999 | 0 (0.0%) | 0 (0.0%) |
| $150,000 or more | 0 (0.0%) | 0 (0.0%) |
| Total | 55 (100.0%) | 12 (100.0%) |
Monthly Housing Cost Tiers in Robbins
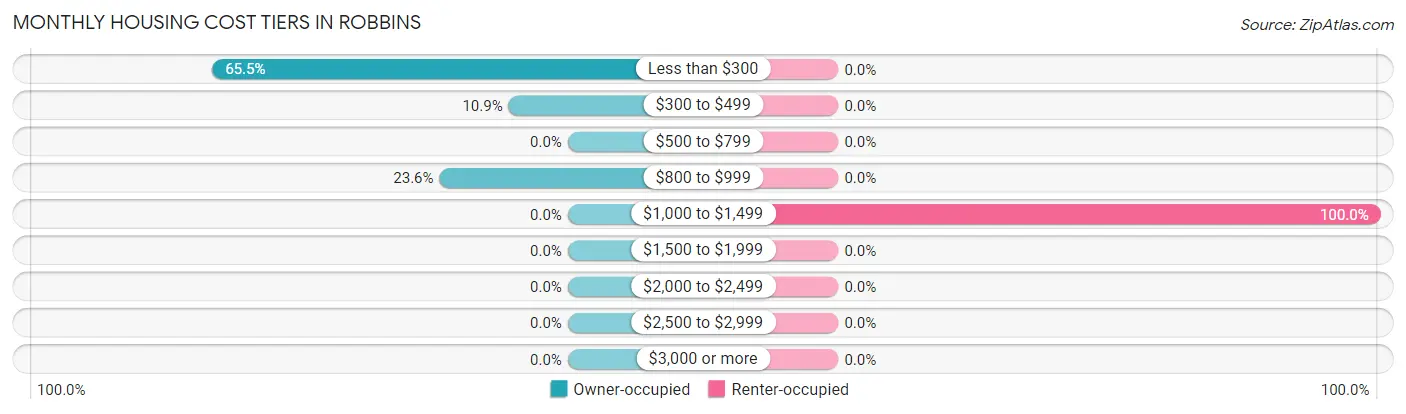
| Monthly Cost | Owner-occupied | Renter-occupied |
| Less than $300 | 36 (65.4%) | 0 (0.0%) |
| $300 to $499 | 6 (10.9%) | 0 (0.0%) |
| $500 to $799 | 0 (0.0%) | 0 (0.0%) |
| $800 to $999 | 13 (23.6%) | 0 (0.0%) |
| $1,000 to $1,499 | 0 (0.0%) | 12 (100.0%) |
| $1,500 to $1,999 | 0 (0.0%) | 0 (0.0%) |
| $2,000 to $2,499 | 0 (0.0%) | 0 (0.0%) |
| $2,500 to $2,999 | 0 (0.0%) | 0 (0.0%) |
| $3,000 or more | 0 (0.0%) | 0 (0.0%) |
| Total | 55 (100.0%) | 12 (100.0%) |
Physical Housing Characteristics in Robbins
Housing Structures in Robbins
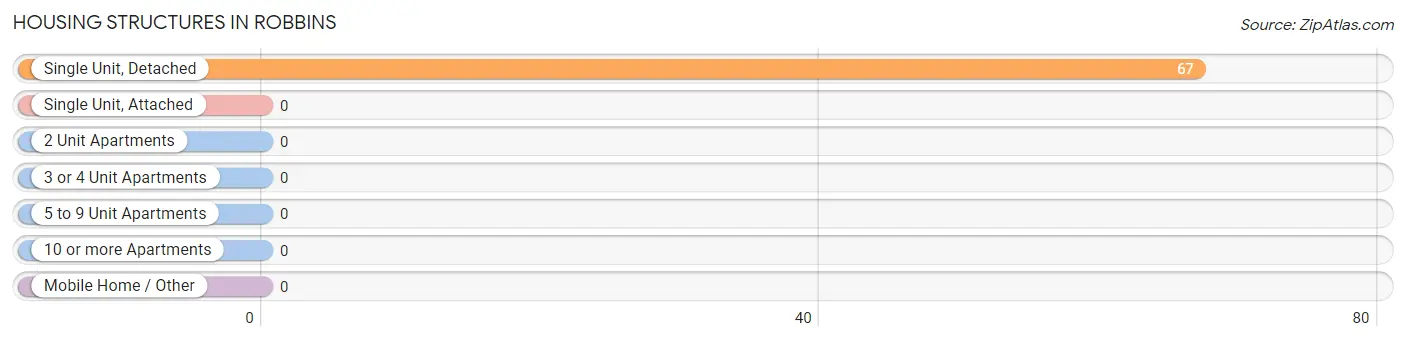
| Structure Type | # Housing Units | % Housing Units |
| Single Unit, Detached | 67 | 100.0% |
| Single Unit, Attached | 0 | 0.0% |
| 2 Unit Apartments | 0 | 0.0% |
| 3 or 4 Unit Apartments | 0 | 0.0% |
| 5 to 9 Unit Apartments | 0 | 0.0% |
| 10 or more Apartments | 0 | 0.0% |
| Mobile Home / Other | 0 | 0.0% |
| Total | 67 | 100.0% |
Housing Structures by Occupancy in Robbins
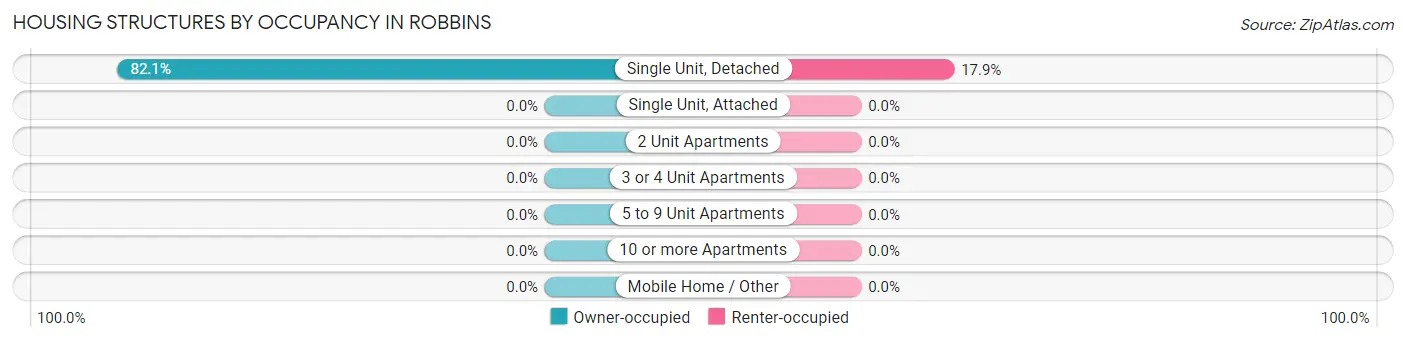
| Structure Type | Owner-occupied | Renter-occupied |
| Single Unit, Detached | 55 (82.1%) | 12 (17.9%) |
| Single Unit, Attached | 0 (0.0%) | 0 (0.0%) |
| 2 Unit Apartments | 0 (0.0%) | 0 (0.0%) |
| 3 or 4 Unit Apartments | 0 (0.0%) | 0 (0.0%) |
| 5 to 9 Unit Apartments | 0 (0.0%) | 0 (0.0%) |
| 10 or more Apartments | 0 (0.0%) | 0 (0.0%) |
| Mobile Home / Other | 0 (0.0%) | 0 (0.0%) |
| Total | 55 (82.1%) | 12 (17.9%) |
Housing Structures by Number of Rooms in Robbins
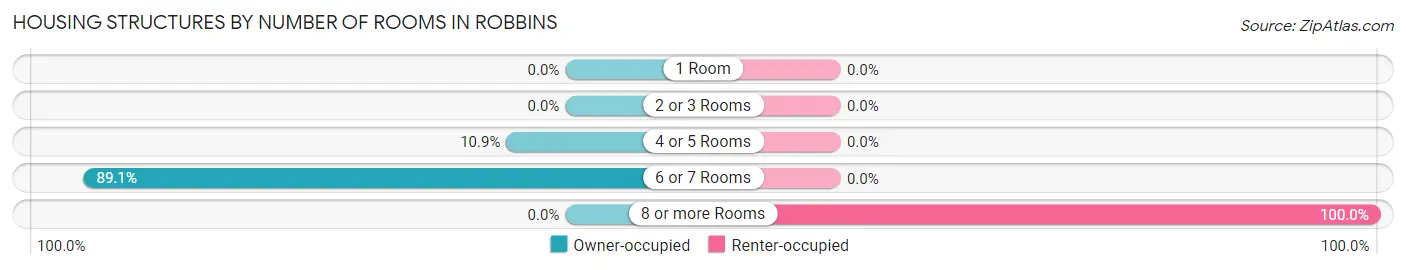
| Number of Rooms | Owner-occupied | Renter-occupied |
| 1 Room | 0 (0.0%) | 0 (0.0%) |
| 2 or 3 Rooms | 0 (0.0%) | 0 (0.0%) |
| 4 or 5 Rooms | 6 (10.9%) | 0 (0.0%) |
| 6 or 7 Rooms | 49 (89.1%) | 0 (0.0%) |
| 8 or more Rooms | 0 (0.0%) | 12 (100.0%) |
| Total | 55 (100.0%) | 12 (100.0%) |
Housing Structure by Heating Type in Robbins
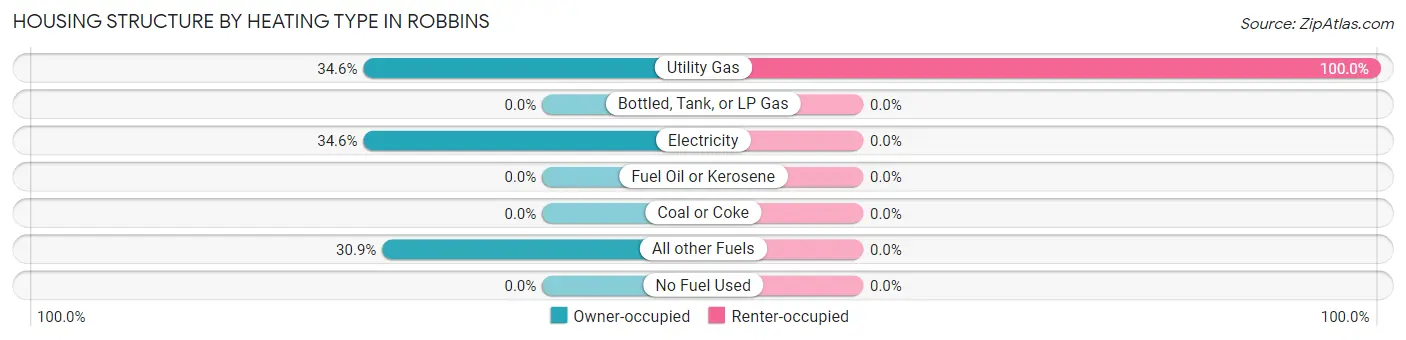
| Heating Type | Owner-occupied | Renter-occupied |
| Utility Gas | 19 (34.5%) | 12 (100.0%) |
| Bottled, Tank, or LP Gas | 0 (0.0%) | 0 (0.0%) |
| Electricity | 19 (34.5%) | 0 (0.0%) |
| Fuel Oil or Kerosene | 0 (0.0%) | 0 (0.0%) |
| Coal or Coke | 0 (0.0%) | 0 (0.0%) |
| All other Fuels | 17 (30.9%) | 0 (0.0%) |
| No Fuel Used | 0 (0.0%) | 0 (0.0%) |
| Total | 55 (100.0%) | 12 (100.0%) |
Household Vehicle Usage in Robbins
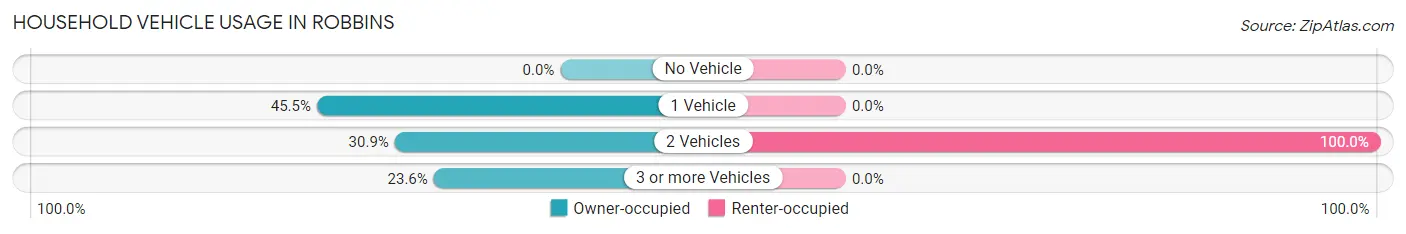
| Vehicles per Household | Owner-occupied | Renter-occupied |
| No Vehicle | 0 (0.0%) | 0 (0.0%) |
| 1 Vehicle | 25 (45.5%) | 0 (0.0%) |
| 2 Vehicles | 17 (30.9%) | 12 (100.0%) |
| 3 or more Vehicles | 13 (23.6%) | 0 (0.0%) |
| Total | 55 (100.0%) | 12 (100.0%) |
Real Estate & Mortgages in Robbins
Real Estate and Mortgage Overview in Robbins
| Characteristic | Without Mortgage | With Mortgage |
| Housing Units | 55 | 0 |
| Median Property Value | $66,500 | $0 |
| Median Household Income | $23,125 | $0 |
| Monthly Housing Costs | $99 | $0 |
| Real Estate Taxes | $391 | $0 |
Property Value by Mortgage Status in Robbins
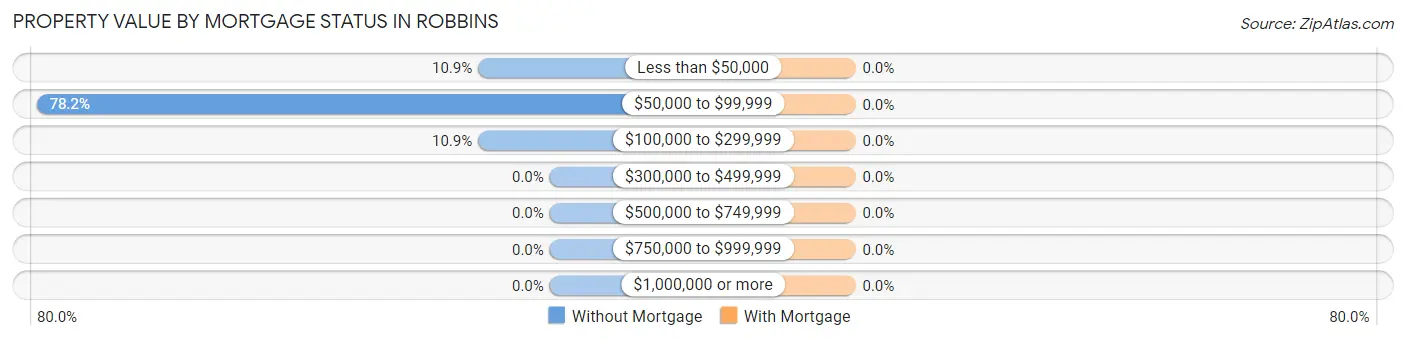
| Property Value | Without Mortgage | With Mortgage |
| Less than $50,000 | 6 (10.9%) | 0 (0.0%) |
| $50,000 to $99,999 | 43 (78.2%) | 0 (0.0%) |
| $100,000 to $299,999 | 6 (10.9%) | 0 (0.0%) |
| $300,000 to $499,999 | 0 (0.0%) | 0 (0.0%) |
| $500,000 to $749,999 | 0 (0.0%) | 0 (0.0%) |
| $750,000 to $999,999 | 0 (0.0%) | 0 (0.0%) |
| $1,000,000 or more | 0 (0.0%) | 0 (0.0%) |
| Total | 55 (100.0%) | 0 (0.0%) |
Household Income by Mortgage Status in Robbins
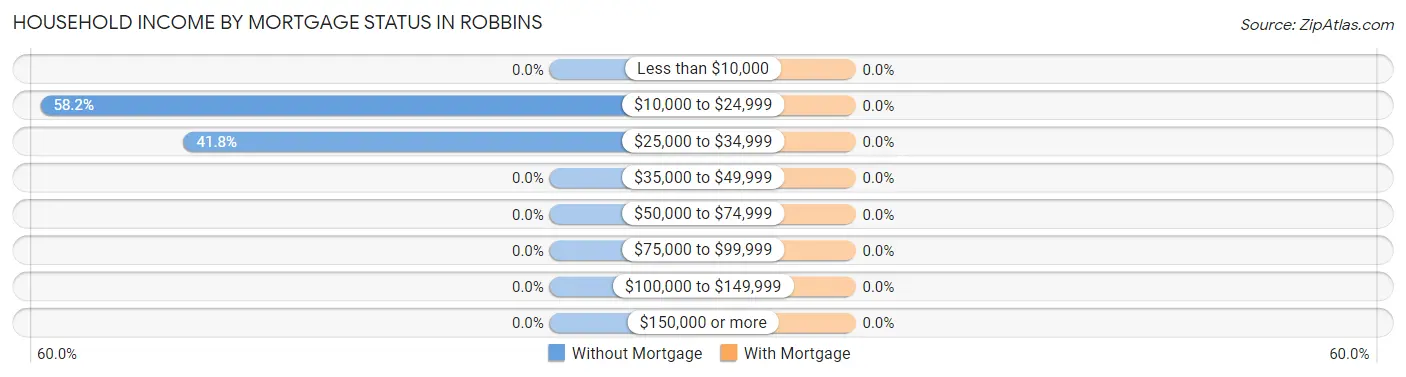
| Household Income | Without Mortgage | With Mortgage |
| Less than $10,000 | 0 (0.0%) | 0 (0.0%) |
| $10,000 to $24,999 | 32 (58.2%) | 0 (0.0%) |
| $25,000 to $34,999 | 23 (41.8%) | 0 (0.0%) |
| $35,000 to $49,999 | 0 (0.0%) | 0 (0.0%) |
| $50,000 to $74,999 | 0 (0.0%) | 0 (0.0%) |
| $75,000 to $99,999 | 0 (0.0%) | 0 (0.0%) |
| $100,000 to $149,999 | 0 (0.0%) | 0 (0.0%) |
| $150,000 or more | 0 (0.0%) | 0 (0.0%) |
| Total | 55 (100.0%) | 0 (0.0%) |
Property Value to Household Income Ratio in Robbins
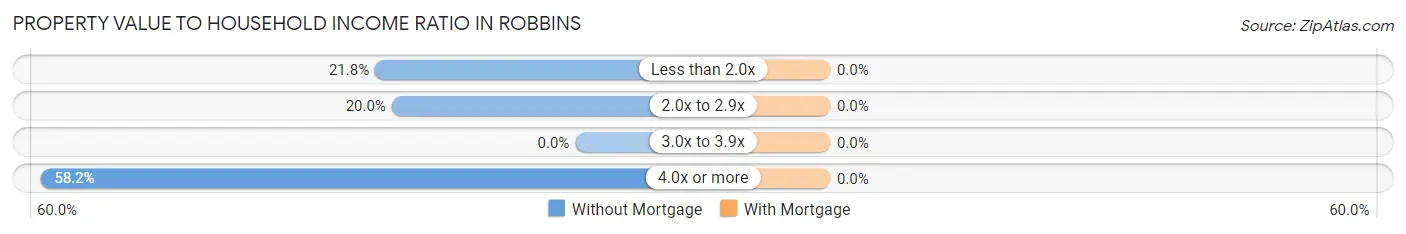
| Value-to-Income Ratio | Without Mortgage | With Mortgage |
| Less than 2.0x | 12 (21.8%) | 0 (0.0%) |
| 2.0x to 2.9x | 11 (20.0%) | 0 (0.0%) |
| 3.0x to 3.9x | 0 (0.0%) | 0 (0.0%) |
| 4.0x or more | 32 (58.2%) | 0 (0.0%) |
| Total | 55 (100.0%) | 0 (0.0%) |
Real Estate Taxes by Mortgage Status in Robbins
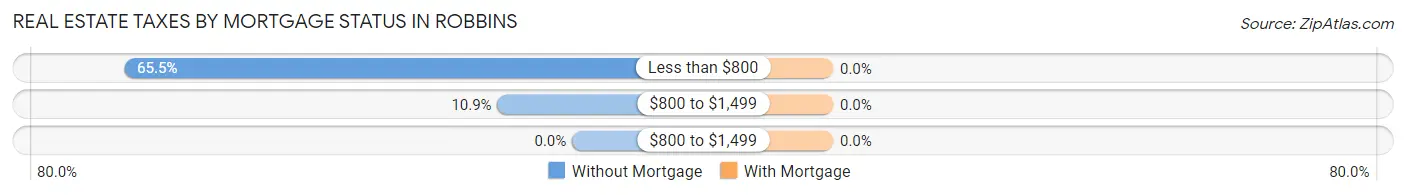
| Property Taxes | Without Mortgage | With Mortgage |
| Less than $800 | 36 (65.4%) | 0 (0.0%) |
| $800 to $1,499 | 6 (10.9%) | 0 (0.0%) |
| $800 to $1,499 | 0 (0.0%) | 0 (0.0%) |
| Total | 55 (100.0%) | 0 (0.0%) |
Health & Disability in Robbins
Health Insurance Coverage by Age in Robbins
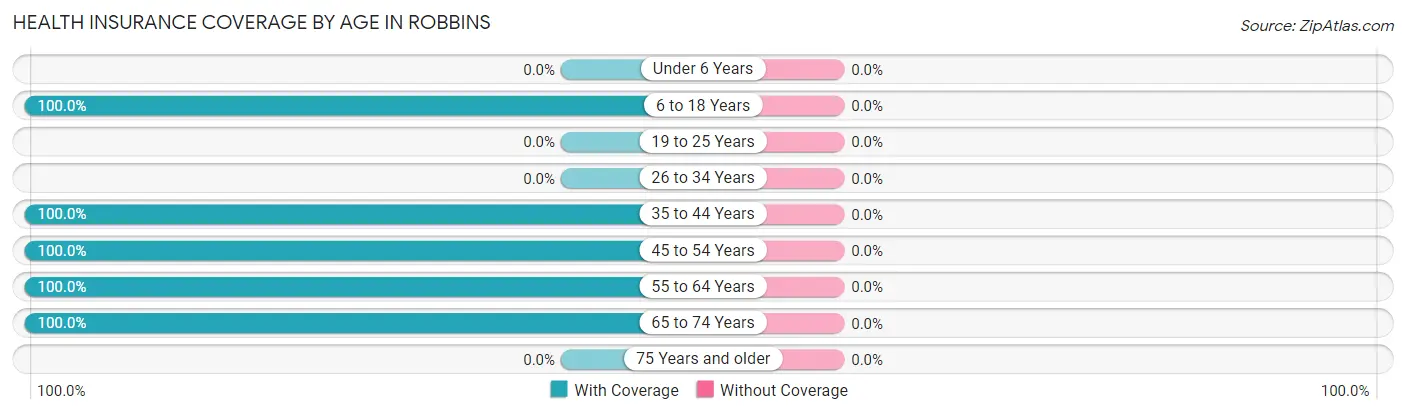
| Age Bracket | With Coverage | Without Coverage |
| Under 6 Years | 0 (0.0%) | 0 (0.0%) |
| 6 to 18 Years | 13 (100.0%) | 0 (0.0%) |
| 19 to 25 Years | 0 (0.0%) | 0 (0.0%) |
| 26 to 34 Years | 0 (0.0%) | 0 (0.0%) |
| 35 to 44 Years | 22 (100.0%) | 0 (0.0%) |
| 45 to 54 Years | 13 (100.0%) | 0 (0.0%) |
| 55 to 64 Years | 12 (100.0%) | 0 (0.0%) |
| 65 to 74 Years | 49 (100.0%) | 0 (0.0%) |
| 75 Years and older | 0 (0.0%) | 0 (0.0%) |
| Total | 109 (100.0%) | 0 (0.0%) |
Health Insurance Coverage by Citizenship Status in Robbins
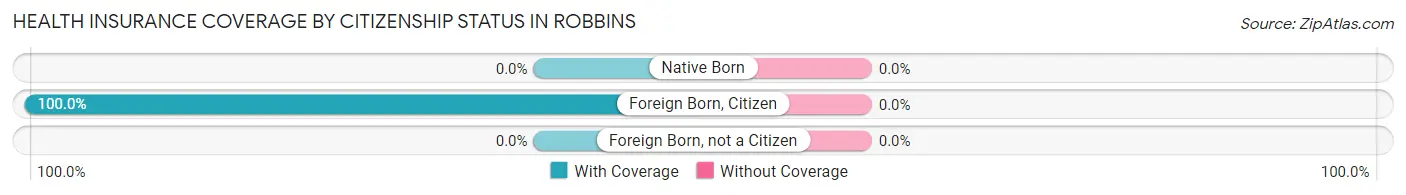
| Citizenship Status | With Coverage | Without Coverage |
| Native Born | 0 (0.0%) | 0 (0.0%) |
| Foreign Born, Citizen | 13 (100.0%) | 0 (0.0%) |
| Foreign Born, not a Citizen | 0 (0.0%) | 0 (0.0%) |
Health Insurance Coverage by Household Income in Robbins
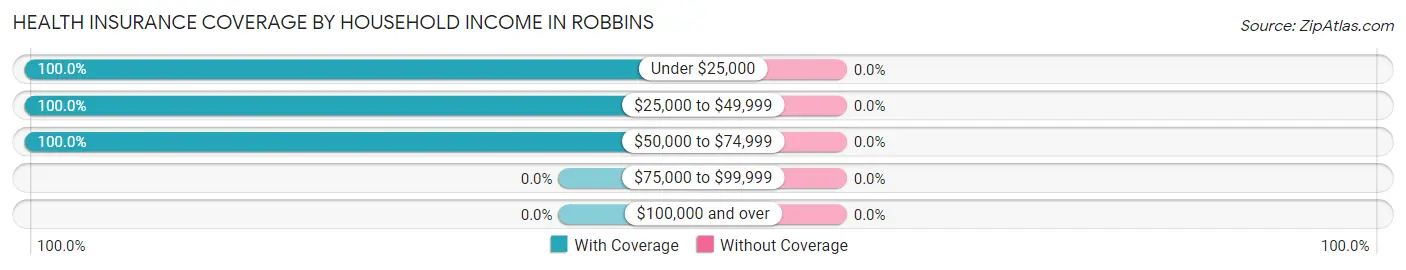
| Household Income | With Coverage | Without Coverage |
| Under $25,000 | 43 (100.0%) | 0 (0.0%) |
| $25,000 to $49,999 | 31 (100.0%) | 0 (0.0%) |
| $50,000 to $74,999 | 35 (100.0%) | 0 (0.0%) |
| $75,000 to $99,999 | 0 (0.0%) | 0 (0.0%) |
| $100,000 and over | 0 (0.0%) | 0 (0.0%) |
Public vs Private Health Insurance Coverage by Age in Robbins
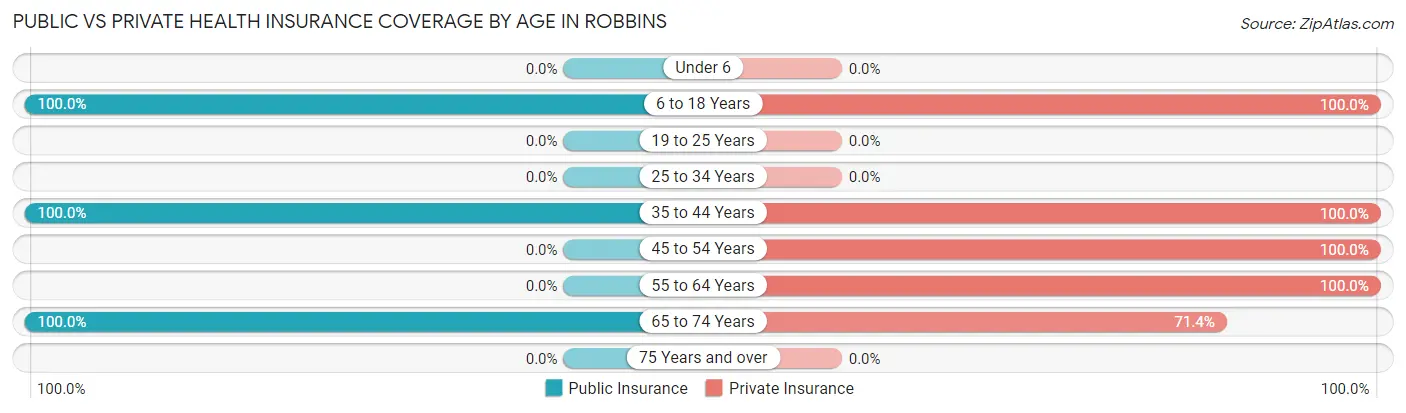
| Age Bracket | Public Insurance | Private Insurance |
| Under 6 | 0 (0.0%) | 0 (0.0%) |
| 6 to 18 Years | 13 (100.0%) | 13 (100.0%) |
| 19 to 25 Years | 0 (0.0%) | 0 (0.0%) |
| 25 to 34 Years | 0 (0.0%) | 0 (0.0%) |
| 35 to 44 Years | 22 (100.0%) | 22 (100.0%) |
| 45 to 54 Years | 0 (0.0%) | 13 (100.0%) |
| 55 to 64 Years | 0 (0.0%) | 12 (100.0%) |
| 65 to 74 Years | 49 (100.0%) | 35 (71.4%) |
| 75 Years and over | 0 (0.0%) | 0 (0.0%) |
| Total | 84 (77.1%) | 95 (87.2%) |
Disability Status by Sex by Age in Robbins
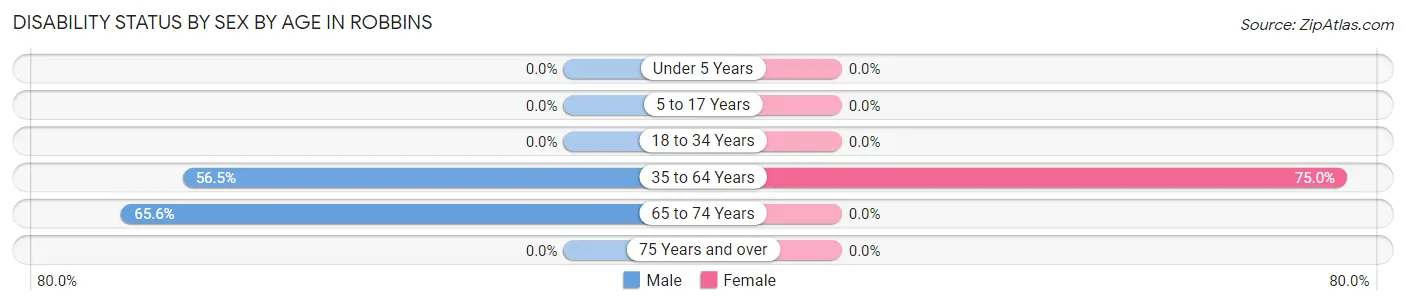
| Age Bracket | Male | Female |
| Under 5 Years | 0 (0.0%) | 0 (0.0%) |
| 5 to 17 Years | 0 (0.0%) | 0 (0.0%) |
| 18 to 34 Years | 0 (0.0%) | 0 (0.0%) |
| 35 to 64 Years | 13 (56.5%) | 18 (75.0%) |
| 65 to 74 Years | 21 (65.6%) | 0 (0.0%) |
| 75 Years and over | 0 (0.0%) | 0 (0.0%) |
Disability Class by Sex by Age in Robbins
Disability Class: Hearing Difficulty
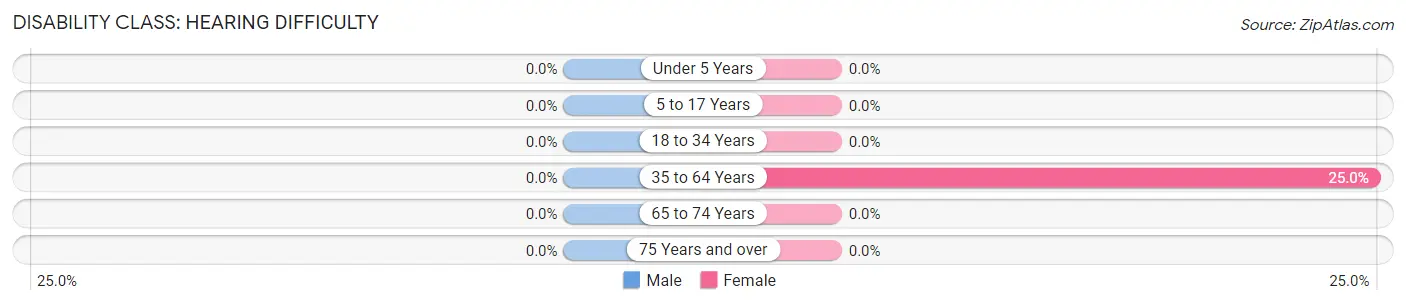
| Age Bracket | Male | Female |
| Under 5 Years | 0 (0.0%) | 0 (0.0%) |
| 5 to 17 Years | 0 (0.0%) | 0 (0.0%) |
| 18 to 34 Years | 0 (0.0%) | 0 (0.0%) |
| 35 to 64 Years | 0 (0.0%) | 6 (25.0%) |
| 65 to 74 Years | 0 (0.0%) | 0 (0.0%) |
| 75 Years and over | 0 (0.0%) | 0 (0.0%) |
Disability Class: Vision Difficulty
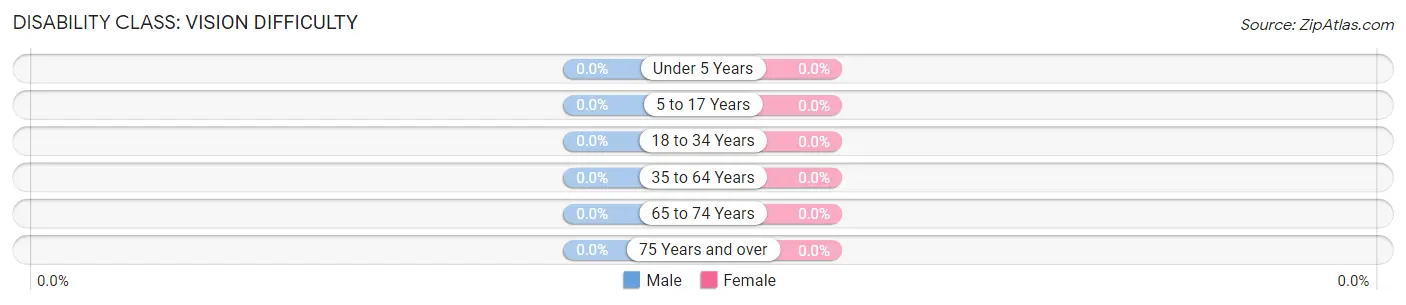
| Age Bracket | Male | Female |
| Under 5 Years | 0 (0.0%) | 0 (0.0%) |
| 5 to 17 Years | 0 (0.0%) | 0 (0.0%) |
| 18 to 34 Years | 0 (0.0%) | 0 (0.0%) |
| 35 to 64 Years | 0 (0.0%) | 0 (0.0%) |
| 65 to 74 Years | 0 (0.0%) | 0 (0.0%) |
| 75 Years and over | 0 (0.0%) | 0 (0.0%) |
Disability Class: Cognitive Difficulty

| Age Bracket | Male | Female |
| 5 to 17 Years | 0 (0.0%) | 0 (0.0%) |
| 18 to 34 Years | 0 (0.0%) | 0 (0.0%) |
| 35 to 64 Years | 13 (56.5%) | 0 (0.0%) |
| 65 to 74 Years | 0 (0.0%) | 0 (0.0%) |
| 75 Years and over | 0 (0.0%) | 0 (0.0%) |
Disability Class: Ambulatory Difficulty
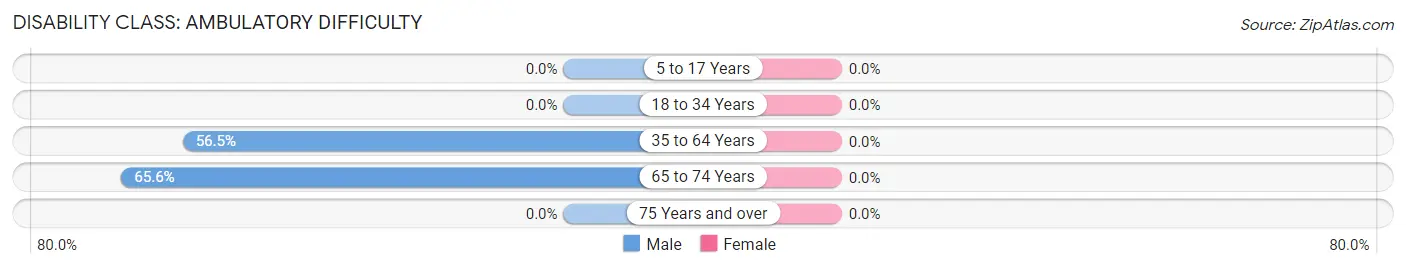
| Age Bracket | Male | Female |
| 5 to 17 Years | 0 (0.0%) | 0 (0.0%) |
| 18 to 34 Years | 0 (0.0%) | 0 (0.0%) |
| 35 to 64 Years | 13 (56.5%) | 0 (0.0%) |
| 65 to 74 Years | 21 (65.6%) | 0 (0.0%) |
| 75 Years and over | 0 (0.0%) | 0 (0.0%) |
Disability Class: Self-Care Difficulty
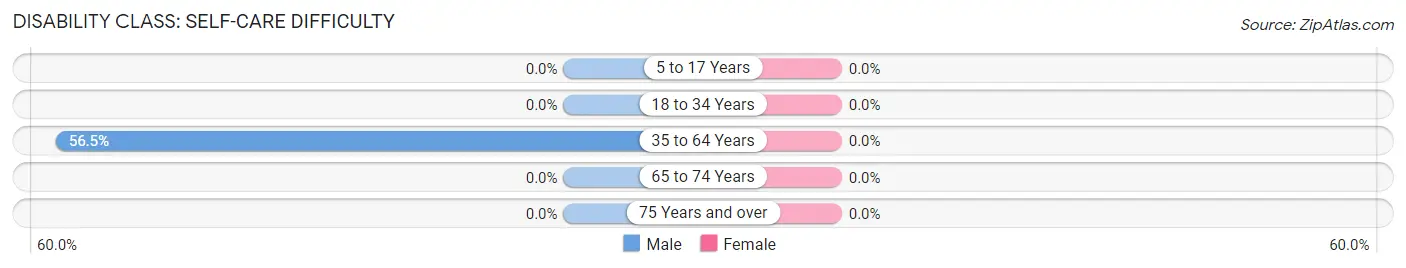
| Age Bracket | Male | Female |
| 5 to 17 Years | 0 (0.0%) | 0 (0.0%) |
| 18 to 34 Years | 0 (0.0%) | 0 (0.0%) |
| 35 to 64 Years | 13 (56.5%) | 0 (0.0%) |
| 65 to 74 Years | 0 (0.0%) | 0 (0.0%) |
| 75 Years and over | 0 (0.0%) | 0 (0.0%) |
Technology Access in Robbins
Computing Device Access in Robbins
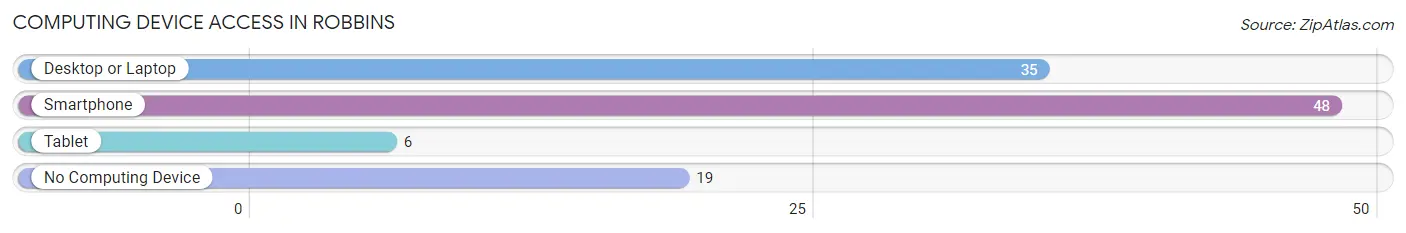
| Device Type | # Households | % Households |
| Desktop or Laptop | 35 | 52.2% |
| Smartphone | 48 | 71.6% |
| Tablet | 6 | 9.0% |
| No Computing Device | 19 | 28.4% |
| Total | 67 | 100.0% |
Internet Access in Robbins
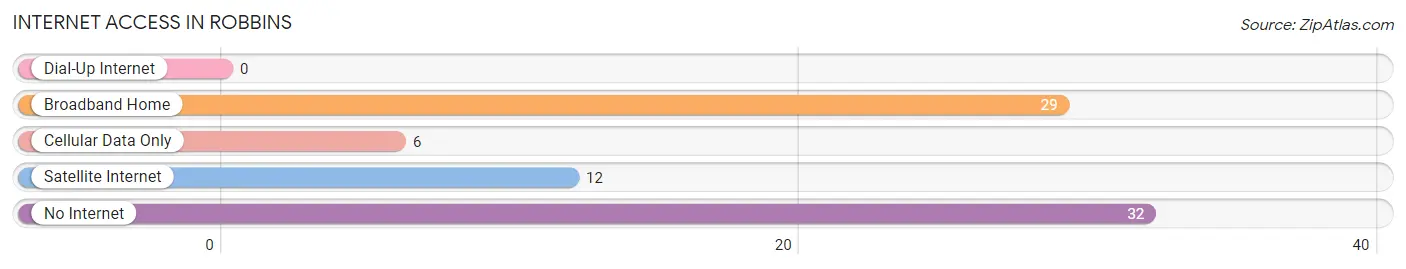
| Internet Type | # Households | % Households |
| Dial-Up Internet | 0 | 0.0% |
| Broadband Home | 29 | 43.3% |
| Cellular Data Only | 6 | 9.0% |
| Satellite Internet | 12 | 17.9% |
| No Internet | 32 | 47.8% |
| Total | 67 | 100.0% |
Robbins Summary
Robbins, Tennessee is a small town located in the eastern part of the state, in the foothills of the Appalachian Mountains. It is situated in the county of Moore, and is part of the larger metropolitan area of Chattanooga. The town has a population of approximately 1,500 people, and is known for its rural charm and friendly atmosphere.
Geography
Robbins is located in the eastern part of Tennessee, in the foothills of the Appalachian Mountains. It is situated in the county of Moore, and is part of the larger metropolitan area of Chattanooga. The town is located at an elevation of 1,000 feet above sea level, and is surrounded by rolling hills and lush forests. The town is located near the Tennessee River, and is close to the cities of Chattanooga, Knoxville, and Nashville.
Economy
Robbins is a small town with a limited economy. The town is home to a few small businesses, including a grocery store, a hardware store, and a few restaurants. The town also has a few manufacturing plants, which provide employment for many of the town’s residents. The town is also home to a few farms, which provide fresh produce to the local community.
Demographics
Robbins is a small town with a population of approximately 1,500 people. The town is predominantly white, with a small African American population. The median household income in Robbins is $35,000, and the median age is 37. The town has a low unemployment rate, and the majority of the population is employed in the manufacturing and service industries.
History
Robbins was founded in 1820 by a group of settlers from North Carolina. The town was named after a local Native American chief, Chief Robbins. The town grew slowly over the years, and by the late 19th century, it had become a thriving agricultural community. The town was also home to a few small businesses, including a sawmill and a gristmill.
In the early 20th century, the town began to experience a period of growth and prosperity. The town was home to several manufacturing plants, and the population began to grow. The town was also home to a few schools, and the town’s economy began to diversify.
Today, Robbins is a small town with a population of approximately 1,500 people. The town is known for its rural charm and friendly atmosphere. The town is home to a few small businesses, and the majority of the population is employed in the manufacturing and service industries. The town is also home to a few farms, which provide fresh produce to the local community.
Common Questions
What is Per Capita Income in Robbins?
Per Capita income in Robbins is $18,377.
What is the Median Household income in Robbins?
Median Household Income in Robbins is $27,841.
What is Inequality or Gini Index in Robbins?
Inequality or Gini Index in Robbins is 0.33.
What is the Total Population of Robbins?
Total Population of Robbins is 109.
What is the Total Male Population of Robbins?
Total Male Population of Robbins is 68.
What is the Total Female Population of Robbins?
Total Female Population of Robbins is 41.
What is the Ratio of Males per 100 Females in Robbins?
There are 165.85 Males per 100 Females in Robbins.
What is the Ratio of Females per 100 Males in Robbins?
There are 60.29 Females per 100 Males in Robbins.
What is the Median Population Age in Robbins?
Median Population Age in Robbins is 64.1 Years.
What is the Average Family Size in Robbins
Average Family Size in Robbins is 2.4 People.
What is the Average Household Size in Robbins
Average Household Size in Robbins is 1.6 People.
How Large is the Labor Force in Robbins?
There are 16 People in the Labor Forcein in Robbins.
What is the Percentage of People in the Labor Force in Robbins?
16.7% of People are in the Labor Force in Robbins.