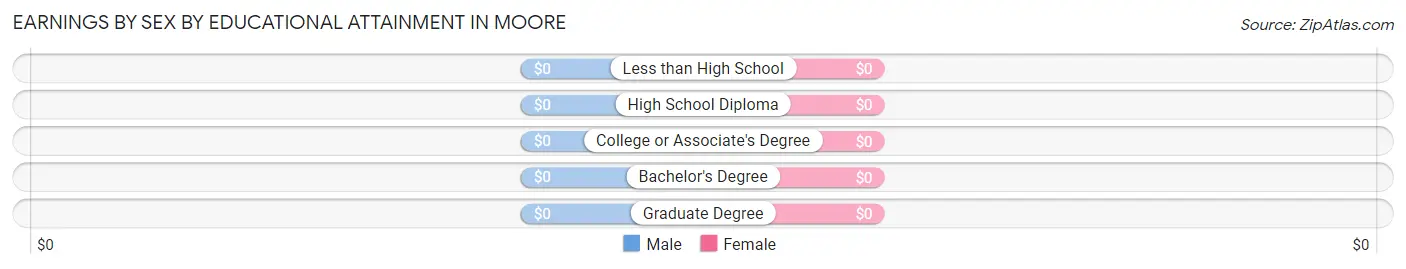
Earnings by Sex by Educational Attainment in Moore
Educational Attainment
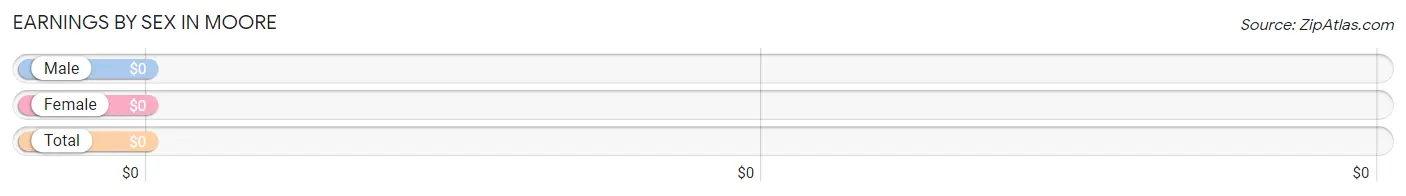
Male Income
Female Income
Less than High School
-
-
High School Diploma
-
-
College or Associate's Degree
-
-
Bachelor's Degree
-
-
Graduate Degree
-
-
Total
-
-
Family Income in Moore
Family Income Brackets in Moore
Income Bracket
# Families
% Families
Less than $10,000
0
0.0%
$10,000 to $14,999
0
0.0%
$15,000 to $24,999
0
0.0%
$25,000 to $34,999
0
0.0%
$35,000 to $49,999
0
0.0%
$50,000 to $74,999
0
0.0%
$75,000 to $99,999
0
0.0%
$100,000 to $149,999
0
0.0%
$150,000 to $199,999
0
0.0%
$200,000+
0
0.0%
Family Income by Famaliy Size in Moore
Income Bracket
# Families
Median Income
2-Person Families
0 (0.0%)
$0
3-Person Families
0 (0.0%)
$0
4-Person Families
0 (0.0%)
$0
5-Person Families
0 (0.0%)
$0
6-Person Families
0 (0.0%)
$0
7+ Person Families
0 (0.0%)
$0
Total
0 (0.0%)
$0
Family Income by Number of Earners in Moore
Number of Earners
# Families
Median Income
No Earners
0 (0.0%)
$0
1 Earner
0 (0.0%)
$0
2 Earners
0 (0.0%)
$0
3+ Earners
0 (0.0%)
$0
Total
0 (0.0%)
$0
Household Income in Moore
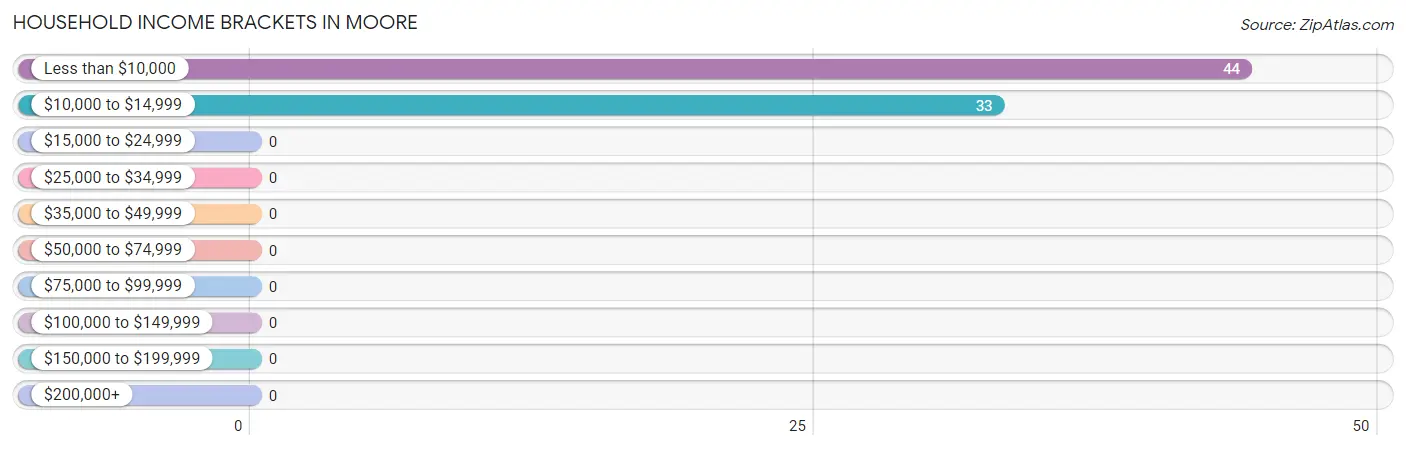
Household Income Brackets in Moore
With 44 households falling in the category, the less than $10,000 income range is the most frequent in Moore, accounting for 57.1% of all households.
Income Bracket
# Households
% Households
Less than $10,000
44
57.1%
$10,000 to $14,999
33
42.9%
$15,000 to $24,999
0
0.0%
$25,000 to $34,999
0
0.0%
$35,000 to $49,999
0
0.0%
$50,000 to $74,999
0
0.0%
$75,000 to $99,999
0
0.0%
$100,000 to $149,999
0
0.0%
$150,000 to $199,999
0
0.0%
$200,000+
0
0.0%
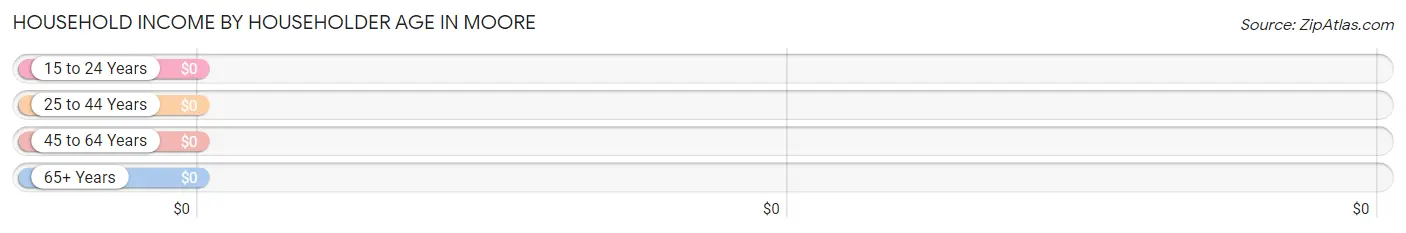
Household Income by Householder Age in Moore
Income Bracket
# Households
Median Income
15 to 24 Years
0 (0.0%)
$0
25 to 44 Years
0 (0.0%)
$0
45 to 64 Years
0 (0.0%)
$0
65+ Years
77 (100.0%)
$0
Total
77 (100.0%)
$0
Poverty in Moore
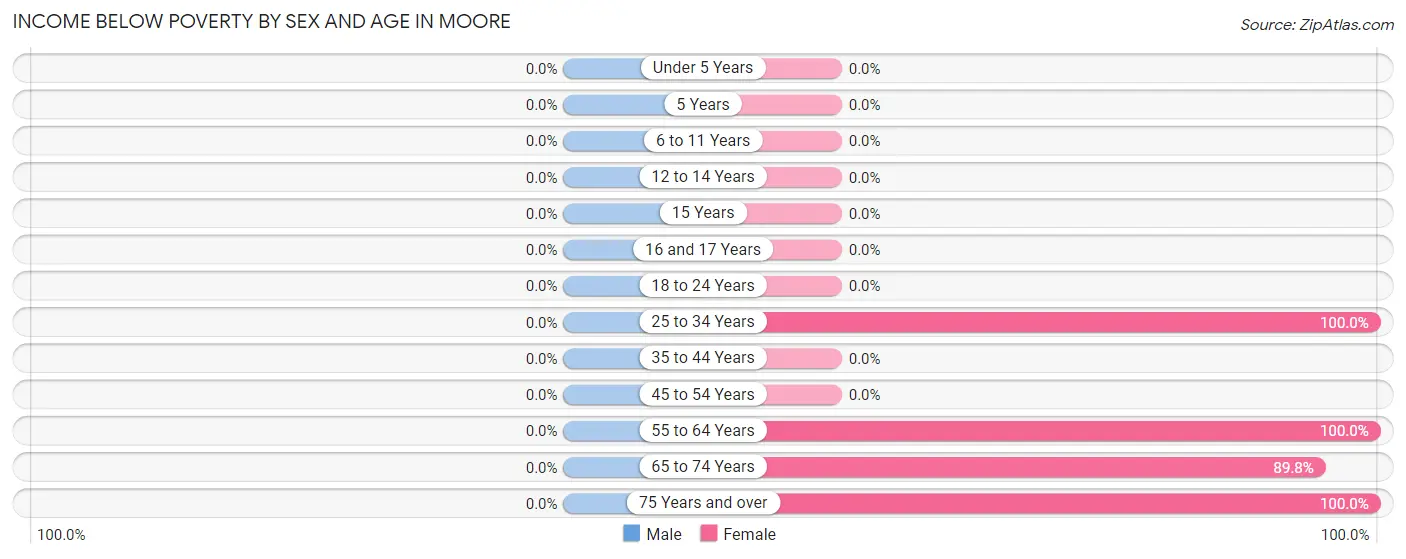
Income Below Poverty by Sex and Age in Moore
Age Bracket
Male
Female
Under 5 Years
0 (0.0%)
0 (0.0%)
5 Years
0 (0.0%)
0 (0.0%)
6 to 11 Years
0 (0.0%)
0 (0.0%)
12 to 14 Years
0 (0.0%)
0 (0.0%)
15 Years
0 (0.0%)
0 (0.0%)
16 and 17 Years
0 (0.0%)
0 (0.0%)
18 to 24 Years
0 (0.0%)
0 (0.0%)
25 to 34 Years
0 (0.0%)
7 (100.0%)
35 to 44 Years
0 (0.0%)
0 (0.0%)
45 to 54 Years
0 (0.0%)
0 (0.0%)
55 to 64 Years
0 (0.0%)
4 (100.0%)
65 to 74 Years
0 (0.0%)
44 (89.8%)
75 Years and over
0 (0.0%)
33 (100.0%)
Total
0 (0.0%)
88 (94.6%)
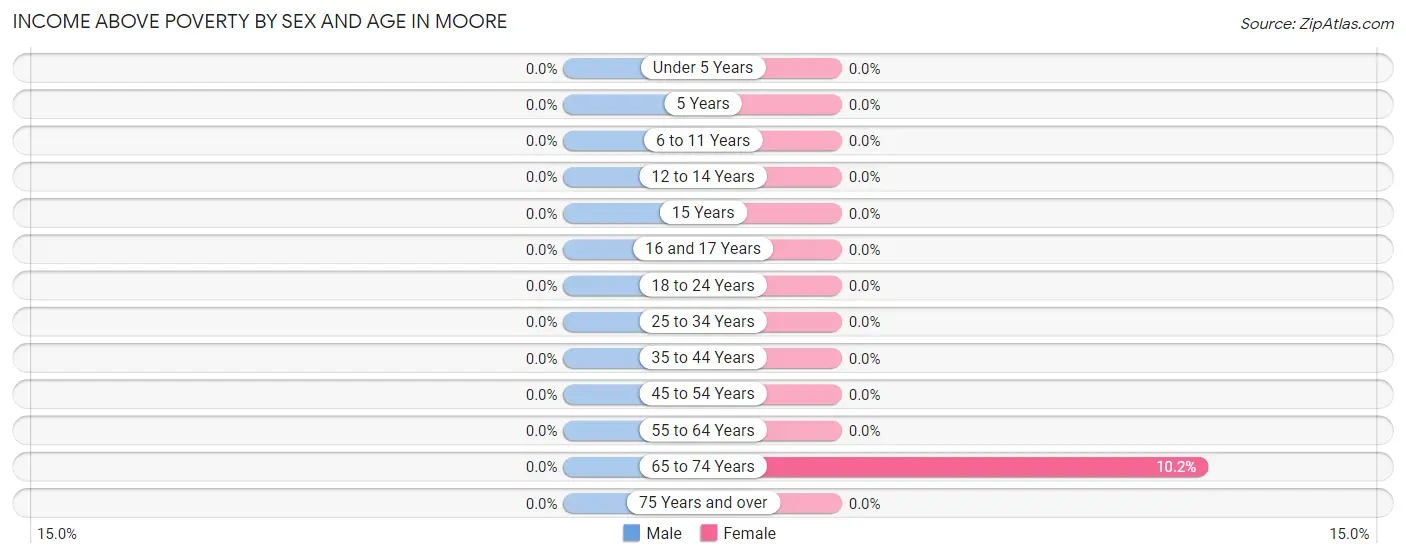
Income Above Poverty by Sex and Age in Moore
Age Bracket
Male
Female
Under 5 Years
0 (0.0%)
0 (0.0%)
5 Years
0 (0.0%)
0 (0.0%)
6 to 11 Years
0 (0.0%)
0 (0.0%)
12 to 14 Years
0 (0.0%)
0 (0.0%)
15 Years
0 (0.0%)
0 (0.0%)
16 and 17 Years
0 (0.0%)
0 (0.0%)
18 to 24 Years
0 (0.0%)
0 (0.0%)
25 to 34 Years
0 (0.0%)
0 (0.0%)
35 to 44 Years
0 (0.0%)
0 (0.0%)
45 to 54 Years
0 (0.0%)
0 (0.0%)
55 to 64 Years
0 (0.0%)
0 (0.0%)
65 to 74 Years
0 (0.0%)
5 (10.2%)
75 Years and over
0 (0.0%)
0 (0.0%)
Total
0 (0.0%)
5 (5.4%)
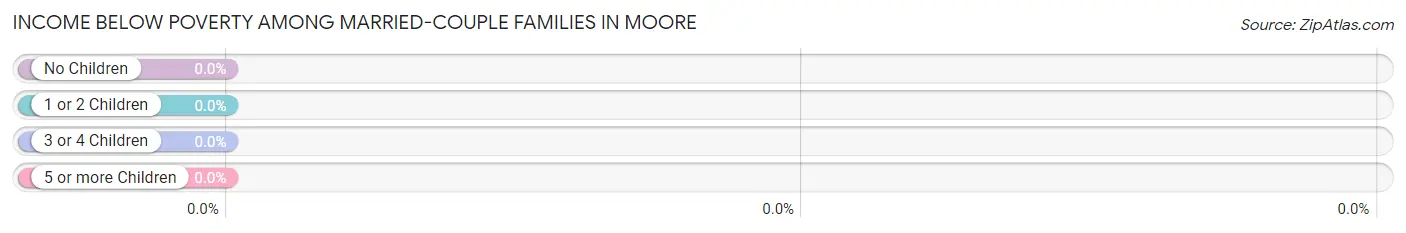
Income Below Poverty Among Married-Couple Families in Moore
Children
Above Poverty
Below Poverty
No Children
0 (0.0%)
0 (0.0%)
1 or 2 Children
0 (0.0%)
0 (0.0%)
3 or 4 Children
0 (0.0%)
0 (0.0%)
5 or more Children
0 (0.0%)
0 (0.0%)
Total
0 (0.0%)
0 (0.0%)
Income Below Poverty Among Single-Parent Households in Moore
Children
Single Father
Single Mother
No Children
0 (0.0%)
0 (0.0%)
1 or 2 Children
0 (0.0%)
0 (0.0%)
3 or 4 Children
0 (0.0%)
0 (0.0%)
5 or more Children
0 (0.0%)
0 (0.0%)
Total
0 (0.0%)
0 (0.0%)
Income Below Poverty Among Married-Couple vs Single-Parent Households in Moore
Children
Married-Couple Families
Single-Parent Households
No Children
0 (0.0%)
0 (0.0%)
1 or 2 Children
0 (0.0%)
0 (0.0%)
3 or 4 Children
0 (0.0%)
0 (0.0%)
5 or more Children
0 (0.0%)
0 (0.0%)
Total
0 (0.0%)
0 (0.0%)
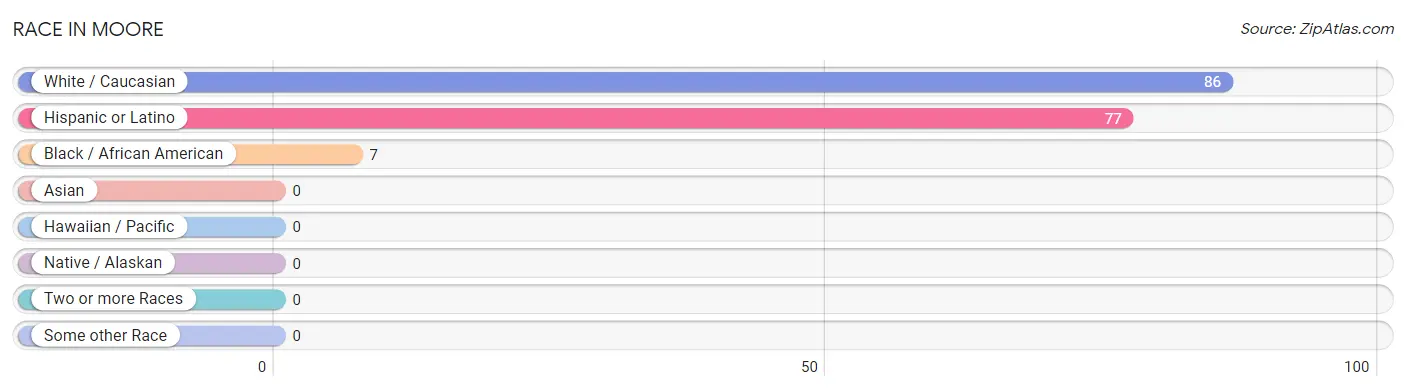
Race in Moore
The most populous races in Moore are White / Caucasian (86 | 92.5%), Hispanic or Latino (77 | 82.8%), and Black / African American (7 | 7.5%).
Race
# Population
% Population
Asian
0
0.0%
Black / African American
7
7.5%
Hawaiian / Pacific
0
0.0%
Hispanic or Latino
77
82.8%
Native / Alaskan
0
0.0%
White / Caucasian
86
92.5%
Two or more Races
0
0.0%
Some other Race
0
0.0%
Total
93
100.0%
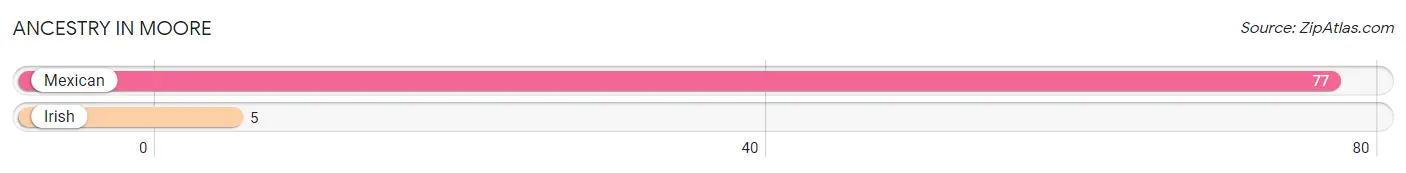
Ancestry in Moore
The most populous ancestries reported in Moore are Mexican (77 | 82.8%), and Irish (5 | 5.4%), together accounting for 88.2% of all Moore residents.
Ancestry
# Population
% Population
Irish
5
5.4%
Mexican
77
82.8%
View All 2 Rows
Immigrants in Moore
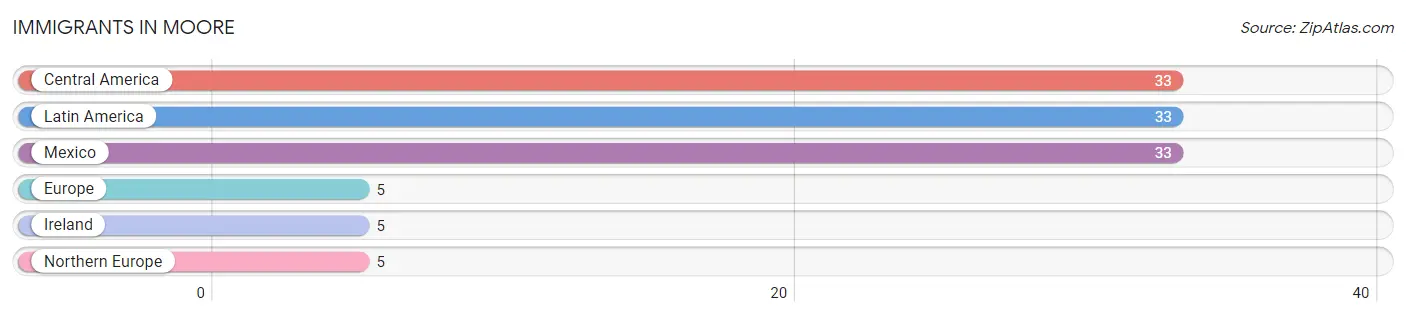
The most numerous immigrant groups reported in Moore came from Central America (33 | 35.5%), Latin America (33 | 35.5%), Mexico (33 | 35.5%), Europe (5 | 5.4%), and Ireland (5 | 5.4%), together accounting for 117.2% of all Moore residents.
Immigration Origin
# Population
% Population
Central America
33
35.5%
Europe
5
5.4%
Ireland
5
5.4%
Latin America
33
35.5%
Mexico
33
35.5%
Northern Europe
5
5.4%
View All 6 Rows
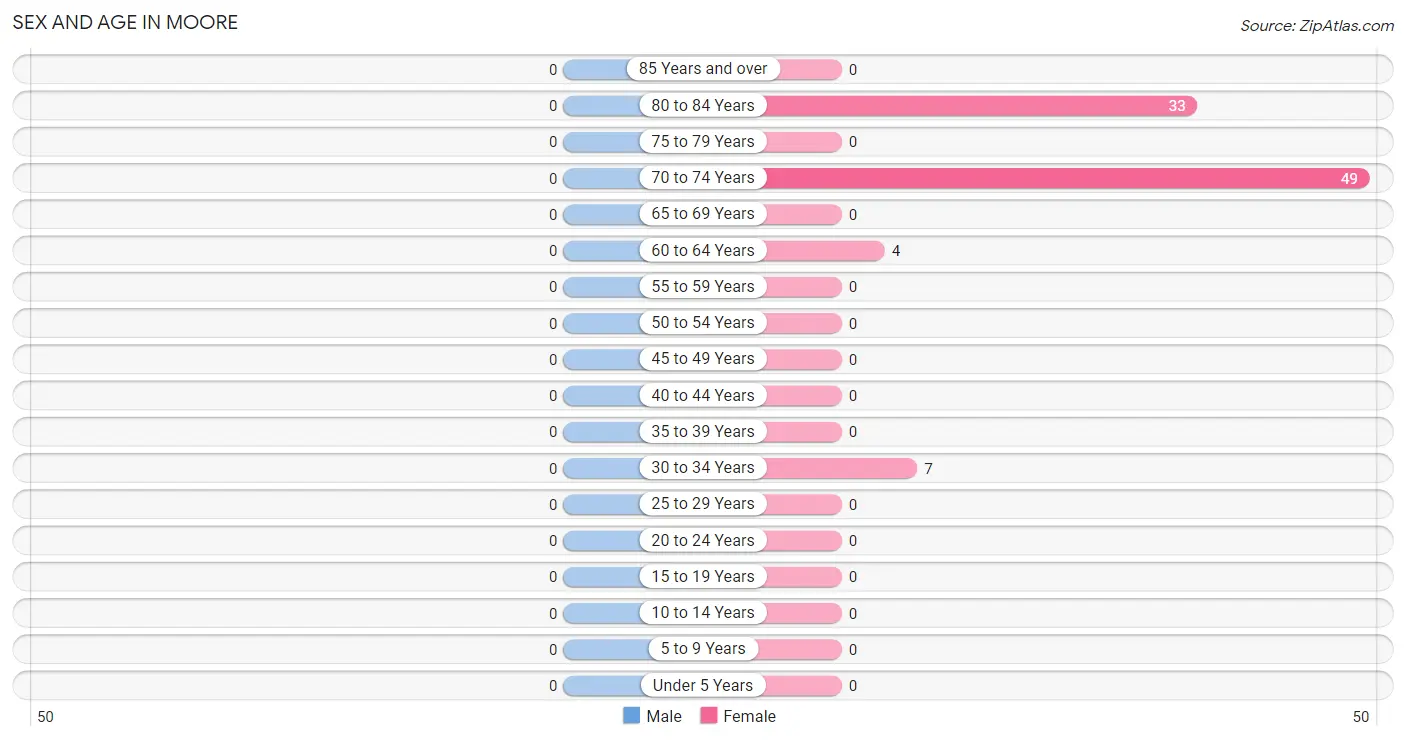
Sex and Age in Moore
Sex and Age in Moore
Age Bracket
Male
Female
Under 5 Years
0 (0.0%)
0 (0.0%)
5 to 9 Years
0 (0.0%)
0 (0.0%)
10 to 14 Years
0 (0.0%)
0 (0.0%)
15 to 19 Years
0 (0.0%)
0 (0.0%)
20 to 24 Years
0 (0.0%)
0 (0.0%)
25 to 29 Years
0 (0.0%)
0 (0.0%)
30 to 34 Years
0 (0.0%)
7 (7.5%)
35 to 39 Years
0 (0.0%)
0 (0.0%)
40 to 44 Years
0 (0.0%)
0 (0.0%)
45 to 49 Years
0 (0.0%)
0 (0.0%)
50 to 54 Years
0 (0.0%)
0 (0.0%)
55 to 59 Years
0 (0.0%)
0 (0.0%)
60 to 64 Years
0 (0.0%)
4 (4.3%)
65 to 69 Years
0 (0.0%)
0 (0.0%)
70 to 74 Years
0 (0.0%)
49 (52.7%)
75 to 79 Years
0 (0.0%)
0 (0.0%)
80 to 84 Years
0 (0.0%)
33 (35.5%)
85 Years and over
0 (0.0%)
0 (0.0%)
Total
0 (0.0%)
93 (100.0%)
Families and Households in Moore
Median Family Size in Moore
Family Type
# Families
Family Size
Married-Couple
0 (0.0%)
-
Single Male/Father
0 (0.0%)
-
Single Female/Mother
0 (0.0%)
-
Total Families
0 (0.0%)
-
Median Household Size in Moore
Household Type
# Households
Household Size
Married-Couple
0 (0.0%)
-
Single Male/Father
0 (0.0%)
-
Single Female/Mother
0 (0.0%)
-
Non-family
77 (100.0%)
-
Total Households
77 (100.0%)
-
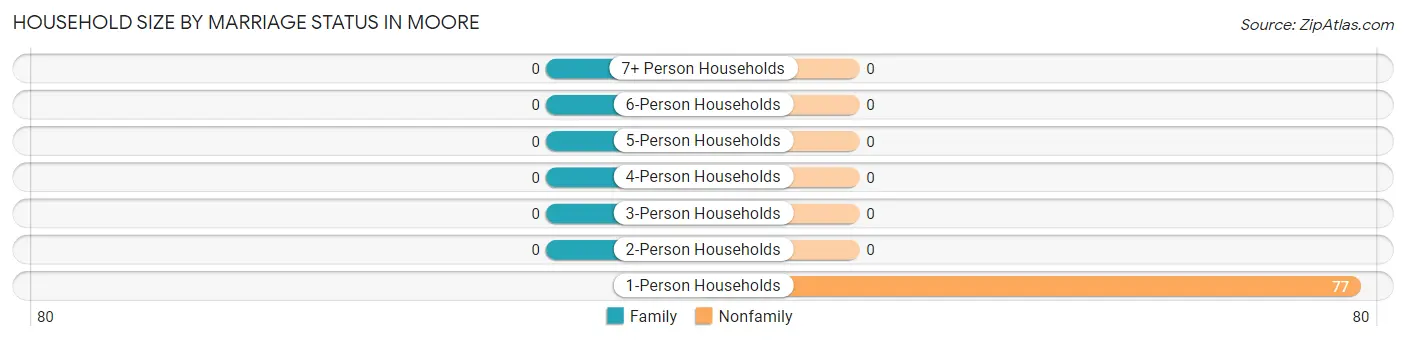
Household Size by Marriage Status in Moore
Household Size
Family Households
Nonfamily Households
1-Person Households
-
77 (100.0%)
2-Person Households
0 (0.0%)
0 (0.0%)
3-Person Households
0 (0.0%)
0 (0.0%)
4-Person Households
0 (0.0%)
0 (0.0%)
5-Person Households
0 (0.0%)
0 (0.0%)
6-Person Households
0 (0.0%)
0 (0.0%)
7+ Person Households
0 (0.0%)
0 (0.0%)
Total
0 (0.0%)
77 (100.0%)
Female Fertility in Moore
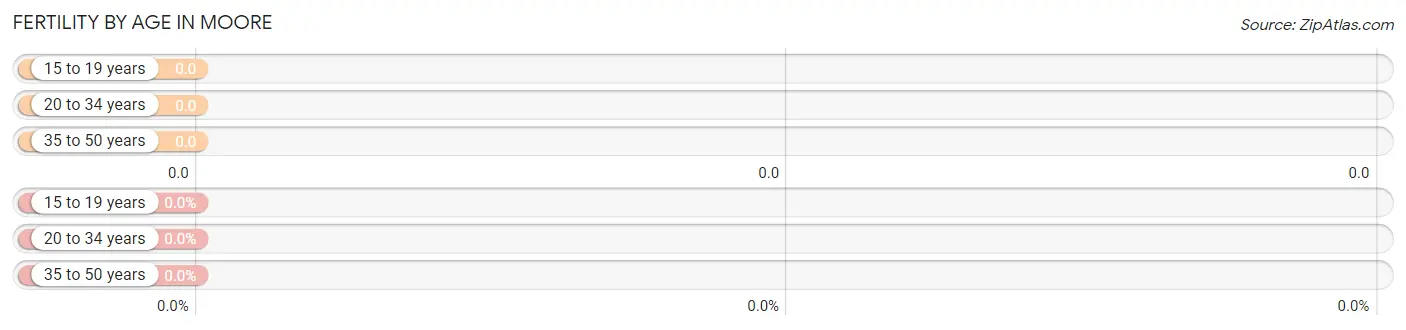
Fertility by Age in Moore
Age Bracket
Women with Births
Births / 1,000 Women
15 to 19 years
0 (0.0%)
0.0
20 to 34 years
0 (0.0%)
0.0
35 to 50 years
0 (0.0%)
0.0
Total
0 (0.0%)
0.0
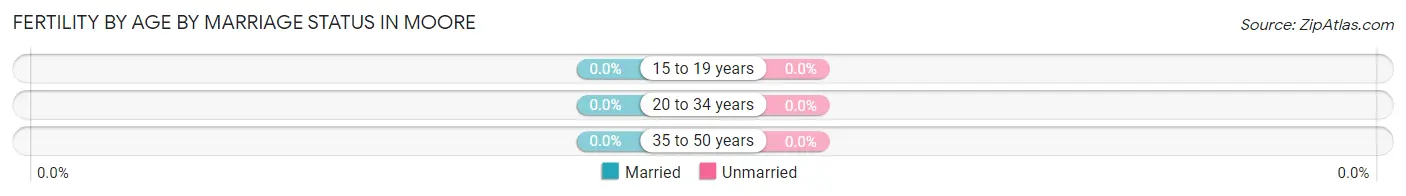
Fertility by Age by Marriage Status in Moore
Age Bracket
Married
Unmarried
15 to 19 years
0 (0.0%)
0 (0.0%)
20 to 34 years
0 (0.0%)
0 (0.0%)
35 to 50 years
0 (0.0%)
0 (0.0%)
Total
0 (0.0%)
0 (0.0%)
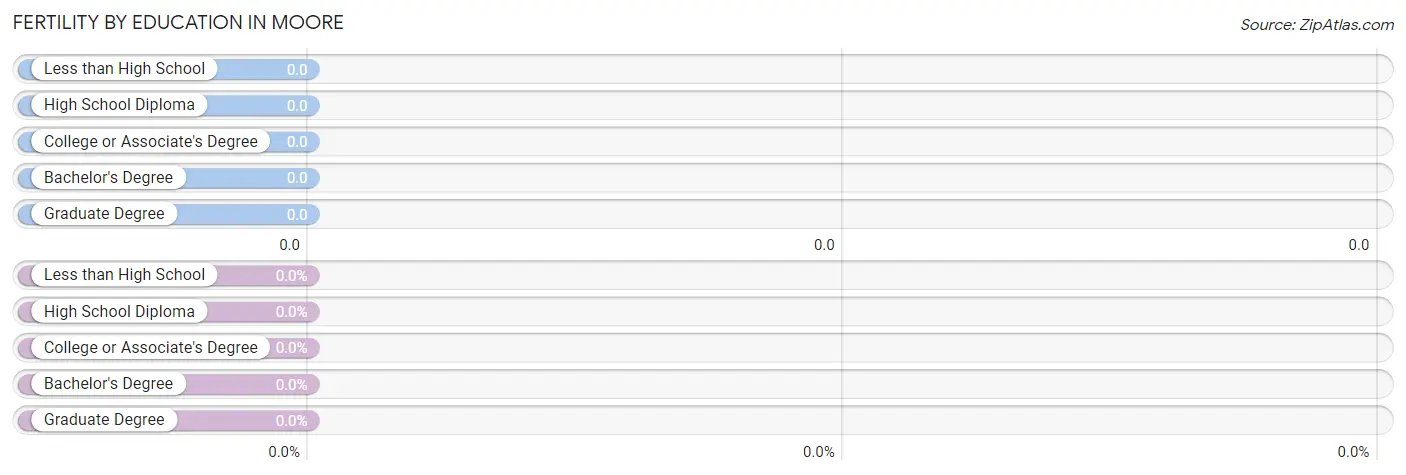
Fertility by Education in Moore
Educational Attainment
Women with Births
Births / 1,000 Women
Less than High School
0 (0.0%)
0.0
High School Diploma
0 (0.0%)
0.0
College or Associate's Degree
0 (0.0%)
0.0
Bachelor's Degree
0 (0.0%)
0.0
Graduate Degree
0 (0.0%)
0.0
Total
0 (0.0%)
0.0
Fertility by Education by Marriage Status in Moore
Educational Attainment
Married
Unmarried
Less than High School
0 (0.0%)
0 (0.0%)
High School Diploma
0 (0.0%)
0 (0.0%)
College or Associate's Degree
0 (0.0%)
0 (0.0%)
Bachelor's Degree
0 (0.0%)
0 (0.0%)
Graduate Degree
0 (0.0%)
0 (0.0%)
Total
0 (0.0%)
0 (0.0%)
Employment Characteristics in Moore
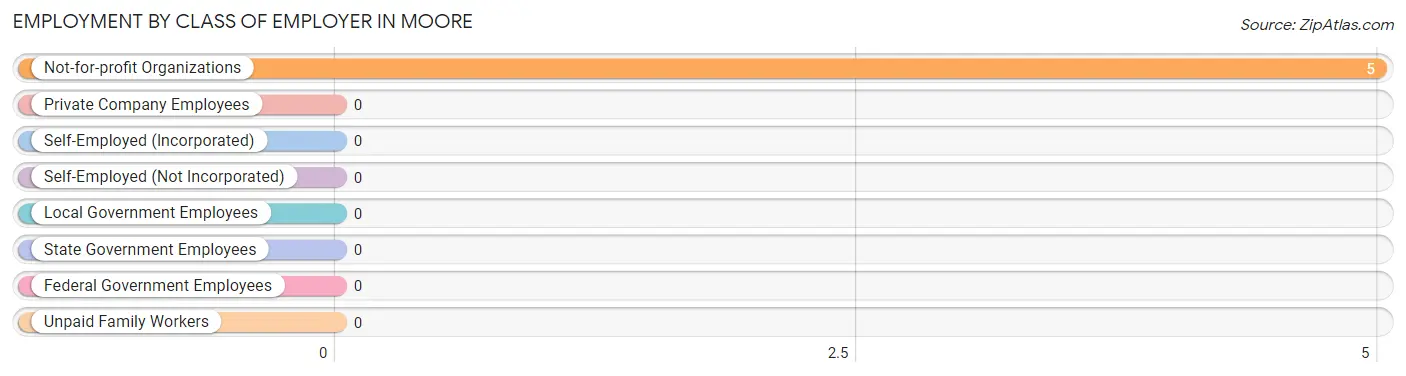
Employment by Class of Employer in Moore
Among the 5 employed individuals in Moore, , and not-for-profit organizations (5 | 100.0%) make up the most common classes of employment.
Employer Class
# Employees
% Employees
Private Company Employees
0
0.0%
Self-Employed (Incorporated)
0
0.0%
Self-Employed (Not Incorporated)
0
0.0%
Not-for-profit Organizations
5
100.0%
Local Government Employees
0
0.0%
State Government Employees
0
0.0%
Federal Government Employees
0
0.0%
Unpaid Family Workers
0
0.0%
Total
5
100.0%
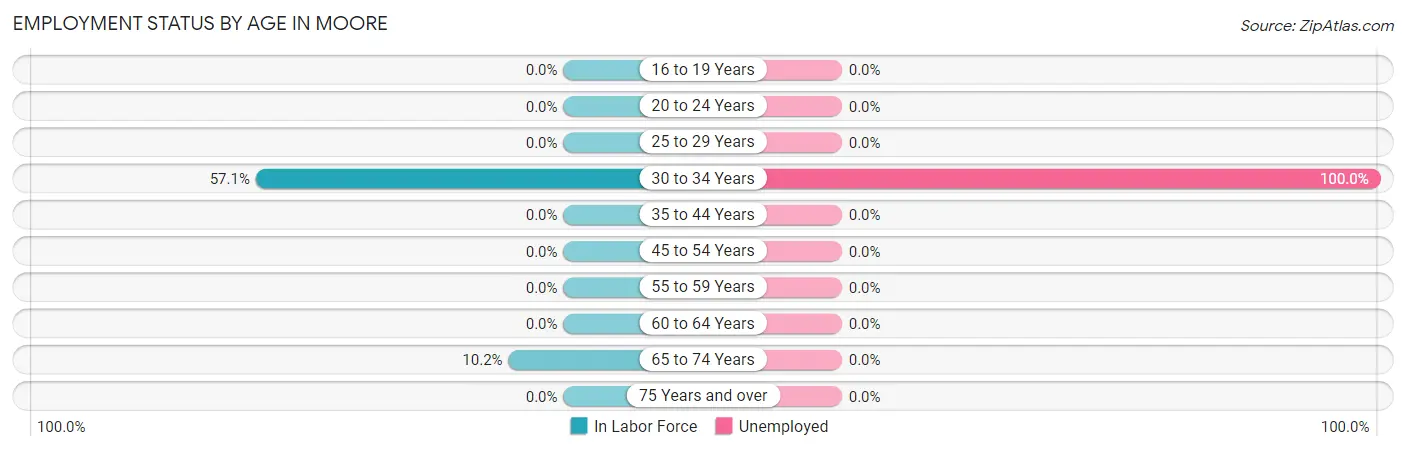
Employment Status by Age in Moore
According to the labor force statistics for Moore, out of the total population over 16 years of age (93), 9.7% or 9 individuals are in the labor force, with 44.4% or 4 of them unemployed. The age group with the highest labor force participation rate is 30 to 34 years, with 57.1% or 4 individuals in the labor force. Within the labor force, the 30 to 34 years age range has the highest percentage of unemployed individuals, with 100.0% or 4 of them being unemployed.
Age Bracket
In Labor Force
Unemployed
16 to 19 Years
0 (0.0%)
0 (0.0%)
20 to 24 Years
0 (0.0%)
0 (0.0%)
25 to 29 Years
0 (0.0%)
0 (0.0%)
30 to 34 Years
4 (57.1%)
4 (100.0%)
35 to 44 Years
0 (0.0%)
0 (0.0%)
45 to 54 Years
0 (0.0%)
0 (0.0%)
55 to 59 Years
0 (0.0%)
0 (0.0%)
60 to 64 Years
0 (0.0%)
0 (0.0%)
65 to 74 Years
5 (10.2%)
0 (0.0%)
75 Years and over
0 (0.0%)
0 (0.0%)
Total
9 (9.7%)
4 (44.4%)
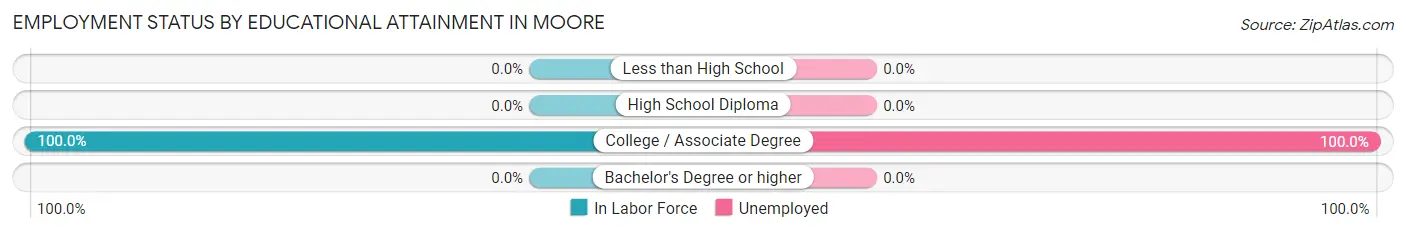
Employment Status by Educational Attainment in Moore
According to labor force statistics for Moore, 36.4% of individuals (4) out of the total population between 25 and 64 years of age (11) are in the labor force, with 100.0% or 4 of them being unemployed. The group with the highest labor force participation rate are those with the educational attainment of college / associate degree, with 100.0% or 4 individuals in the labor force. Within the labor force, individuals with college / associate degree education have the highest percentage of unemployment, with 100.0% or 4 of them being unemployed.
Educational Attainment
In Labor Force
Unemployed
Less than High School
0 (0.0%)
0 (0.0%)
High School Diploma
0 (0.0%)
0 (0.0%)
College / Associate Degree
4 (100.0%)
4 (100.0%)
Bachelor's Degree or higher
0 (0.0%)
0 (0.0%)
Total
4 (36.4%)
11 (100.0%)
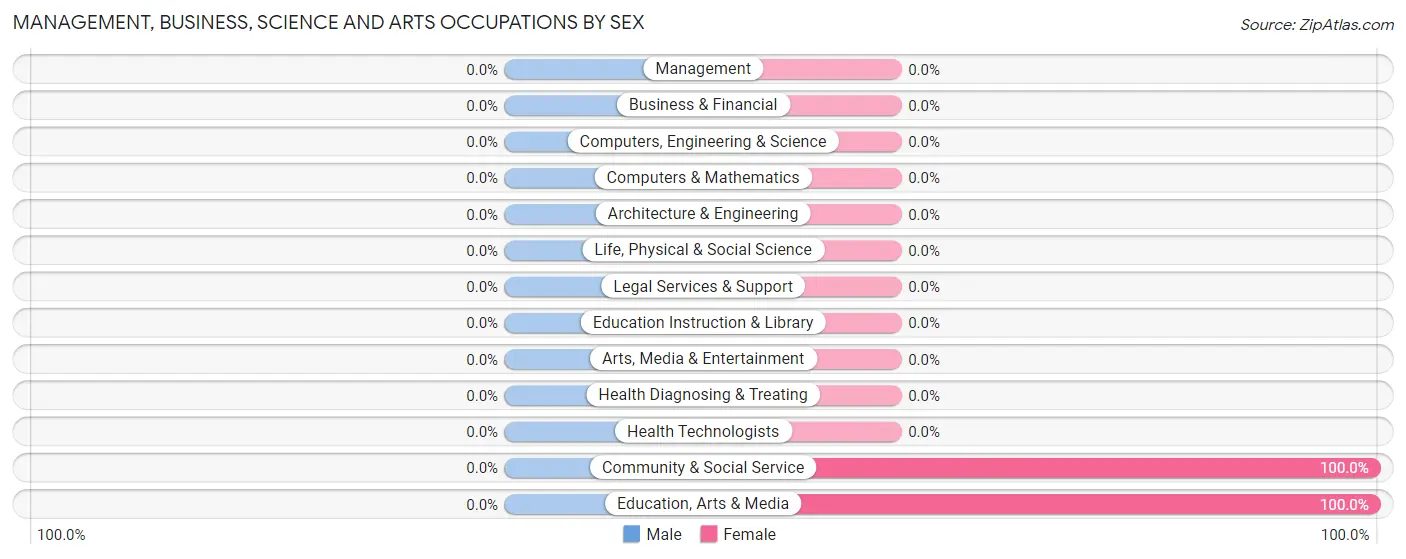
Employment Occupations by Sex in Moore
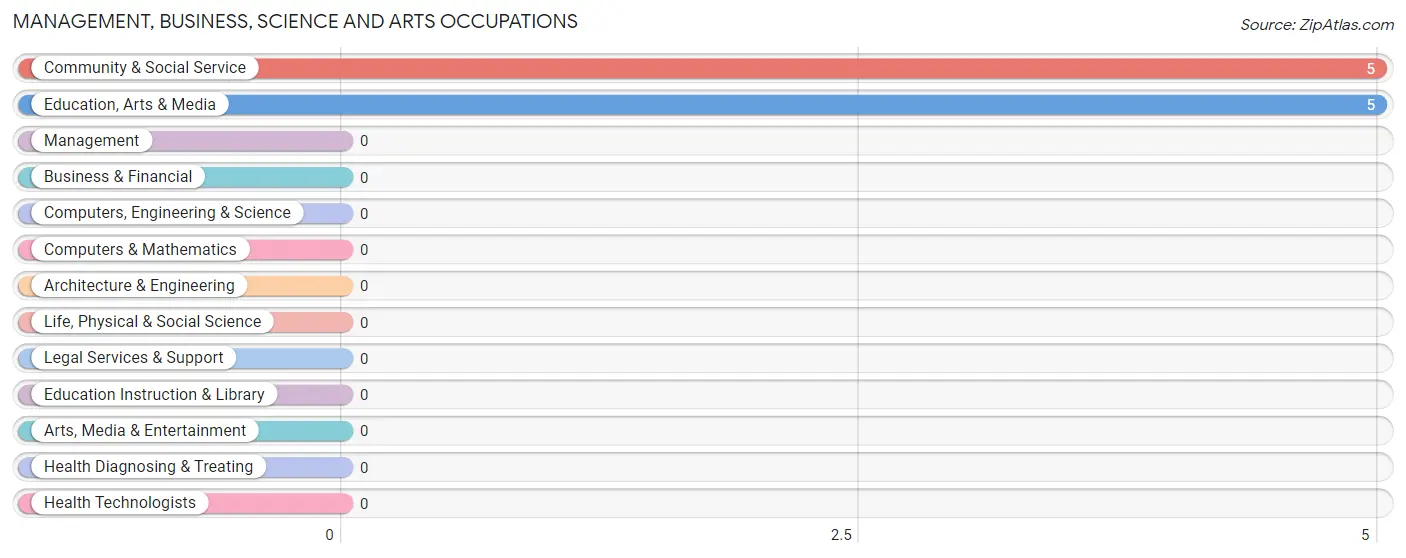
Management, Business, Science and Arts Occupations
The most common Management, Business, Science and Arts occupations in Moore are Community & Social Service (5 | 100.0%), and Education, Arts & Media (5 | 100.0%).
Management, Business, Science and Arts Occupations by Sex
Occupation
Male
Female
Management
0 (0.0%)
0 (0.0%)
Business & Financial
0 (0.0%)
0 (0.0%)
Computers, Engineering & Science
0 (0.0%)
0 (0.0%)
Computers & Mathematics
0 (0.0%)
0 (0.0%)
Architecture & Engineering
0 (0.0%)
0 (0.0%)
Life, Physical & Social Science
0 (0.0%)
0 (0.0%)
Community & Social Service
0 (0.0%)
5 (100.0%)
Education, Arts & Media
0 (0.0%)
5 (100.0%)
Legal Services & Support
0 (0.0%)
0 (0.0%)
Education Instruction & Library
0 (0.0%)
0 (0.0%)
Arts, Media & Entertainment
0 (0.0%)
0 (0.0%)
Health Diagnosing & Treating
0 (0.0%)
0 (0.0%)
Health Technologists
0 (0.0%)
0 (0.0%)
Total (Category)
0 (0.0%)
5 (100.0%)
Total (Overall)
0 (0.0%)
5 (100.0%)
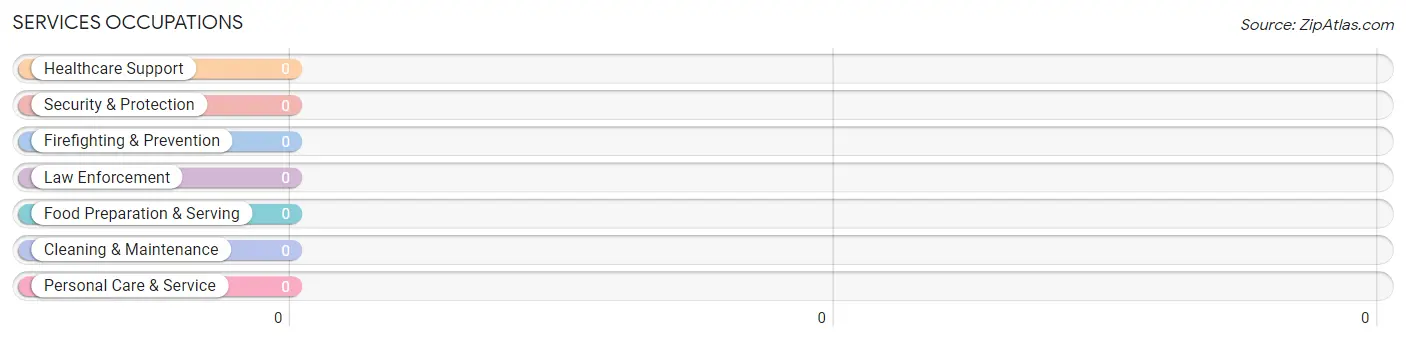
Services Occupations
Services Occupations by Sex
Occupation
Male
Female
Healthcare Support
0 (0.0%)
0 (0.0%)
Security & Protection
0 (0.0%)
0 (0.0%)
Firefighting & Prevention
0 (0.0%)
0 (0.0%)
Law Enforcement
0 (0.0%)
0 (0.0%)
Food Preparation & Serving
0 (0.0%)
0 (0.0%)
Cleaning & Maintenance
0 (0.0%)
0 (0.0%)
Personal Care & Service
0 (0.0%)
0 (0.0%)
Total (Category)
0 (0.0%)
0 (0.0%)
Total (Overall)
0 (0.0%)
5 (100.0%)
Sales and Office Occupations
Sales and Office Occupations by Sex
Occupation
Male
Female
Sales & Related
0 (0.0%)
0 (0.0%)
Office & Administration
0 (0.0%)
0 (0.0%)
Total (Category)
0 (0.0%)
0 (0.0%)
Total (Overall)
0 (0.0%)
5 (100.0%)
Natural Resources, Construction and Maintenance Occupations
Natural Resources, Construction and Maintenance Occupations by Sex
Occupation
Male
Female
Farming, Fishing & Forestry
0 (0.0%)
0 (0.0%)
Construction & Extraction
0 (0.0%)
0 (0.0%)
Installation, Maintenance & Repair
0 (0.0%)
0 (0.0%)
Total (Category)
0 (0.0%)
0 (0.0%)
Total (Overall)
0 (0.0%)
5 (100.0%)
Production, Transportation and Moving Occupations
Production, Transportation and Moving Occupations by Sex
Occupation
Male
Female
Production
0 (0.0%)
0 (0.0%)
Transportation
0 (0.0%)
0 (0.0%)
Material Moving
0 (0.0%)
0 (0.0%)
Total (Category)
0 (0.0%)
0 (0.0%)
Total (Overall)
0 (0.0%)
5 (100.0%)
Employment Industries by Sex in Moore
Employment Industries in Moore
Employment Industries by Sex in Moore
Industry
Male
Female
Agriculture, Fishing & Hunting
0 (0.0%)
0 (0.0%)
Mining, Quarrying, & Extraction
0 (0.0%)
0 (0.0%)
Construction
0 (0.0%)
0 (0.0%)
Manufacturing
0 (0.0%)
0 (0.0%)
Wholesale Trade
0 (0.0%)
0 (0.0%)
Retail Trade
0 (0.0%)
0 (0.0%)
Transportation & Warehousing
0 (0.0%)
0 (0.0%)
Utilities
0 (0.0%)
0 (0.0%)
Information
0 (0.0%)
0 (0.0%)
Finance & Insurance
0 (0.0%)
0 (0.0%)
Real Estate, Rental & Leasing
0 (0.0%)
0 (0.0%)
Professional & Scientific
0 (0.0%)
0 (0.0%)
Enterprise Management
0 (0.0%)
0 (0.0%)
Administrative & Support
0 (0.0%)
0 (0.0%)
Educational Services
0 (0.0%)
0 (0.0%)
Health Care & Social Assistance
0 (0.0%)
0 (0.0%)
Arts, Entertainment & Recreation
0 (0.0%)
0 (0.0%)
Accommodation & Food Services
0 (0.0%)
0 (0.0%)
Public Administration
0 (0.0%)
0 (0.0%)
Total
0 (0.0%)
5 (100.0%)
Education in Moore
School Enrollment in Moore
School Level
# Students
% Students
Nursery / Preschool
0
0.0%
Kindergarten
0
0.0%
Elementary School
0
0.0%
Middle School
0
0.0%
High School
0
0.0%
College / Undergraduate
0
0.0%
Graduate / Professional
0
0.0%
Total
0
0.0%
School Enrollment by Age by Funding Source in Moore
Age Bracket
Public School
Private School
3 to 4 Year Olds
0 (0.0%)
0 (0.0%)
5 to 9 Year Old
0 (0.0%)
0 (0.0%)
10 to 14 Year Olds
0 (0.0%)
0 (0.0%)
15 to 17 Year Olds
0 (0.0%)
0 (0.0%)
18 to 19 Year Olds
0 (0.0%)
0 (0.0%)
20 to 24 Year Olds
0 (0.0%)
0 (0.0%)
25 to 34 Year Olds
0 (0.0%)
0 (0.0%)
35 Years and over
0 (0.0%)
0 (0.0%)
Total
0 (0.0%)
0 (0.0%)
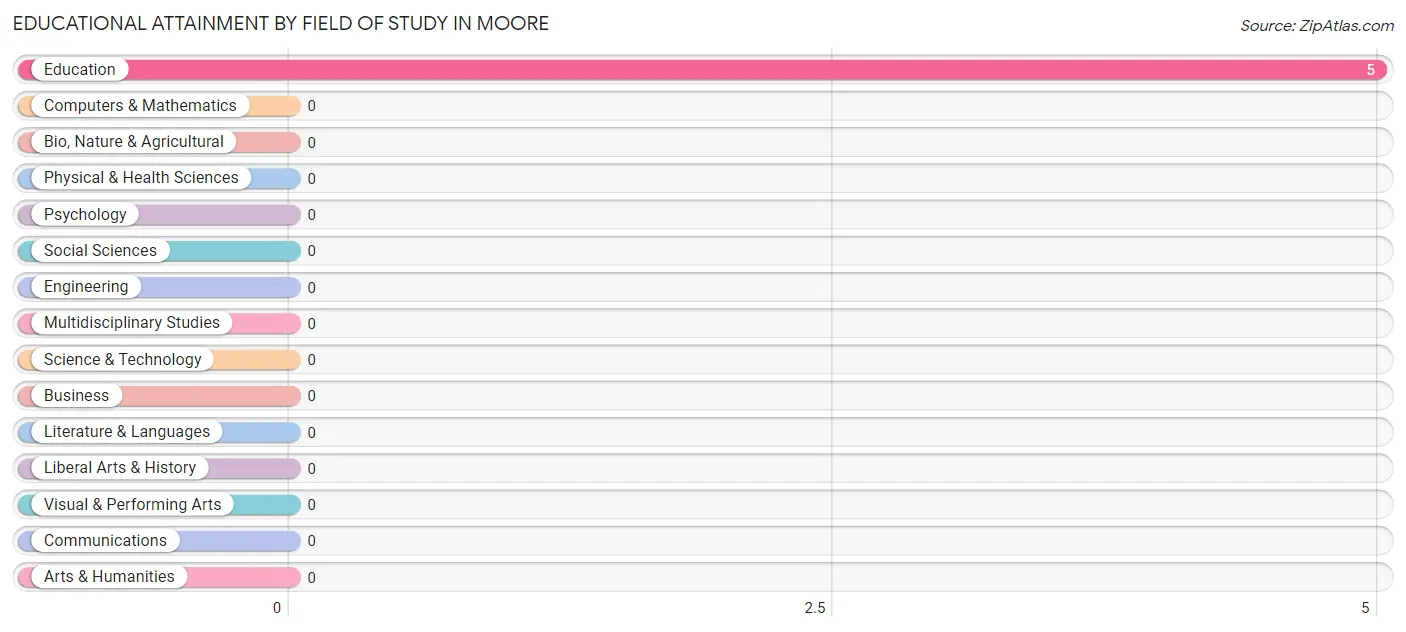
Educational Attainment by Field of Study in Moore
, and education (5 | 100.0%) are the most common fields of study among 5 individuals in Moore who have obtained a bachelor's degree or higher.
Field of Study
# Graduates
% Graduates
Computers & Mathematics
0
0.0%
Bio, Nature & Agricultural
0
0.0%
Physical & Health Sciences
0
0.0%
Psychology
0
0.0%
Social Sciences
0
0.0%
Engineering
0
0.0%
Multidisciplinary Studies
0
0.0%
Science & Technology
0
0.0%
Business
0
0.0%
Education
5
100.0%
Literature & Languages
0
0.0%
Liberal Arts & History
0
0.0%
Visual & Performing Arts
0
0.0%
Communications
0
0.0%
Arts & Humanities
0
0.0%
Total
5
100.0%
Transportation & Commute in Moore
Vehicle Availability by Sex in Moore
Vehicles Available
Male
Female
No Vehicle
0 (0.0%)
0 (0.0%)
1 Vehicle
0 (0.0%)
0 (0.0%)
2 Vehicles
0 (0.0%)
0 (0.0%)
3 Vehicles
0 (0.0%)
0 (0.0%)
4 Vehicles
0 (0.0%)
0 (0.0%)
5 or more Vehicles
0 (0.0%)
0 (0.0%)
Total
0 (0.0%)
0 (0.0%)
Commute Time in Moore
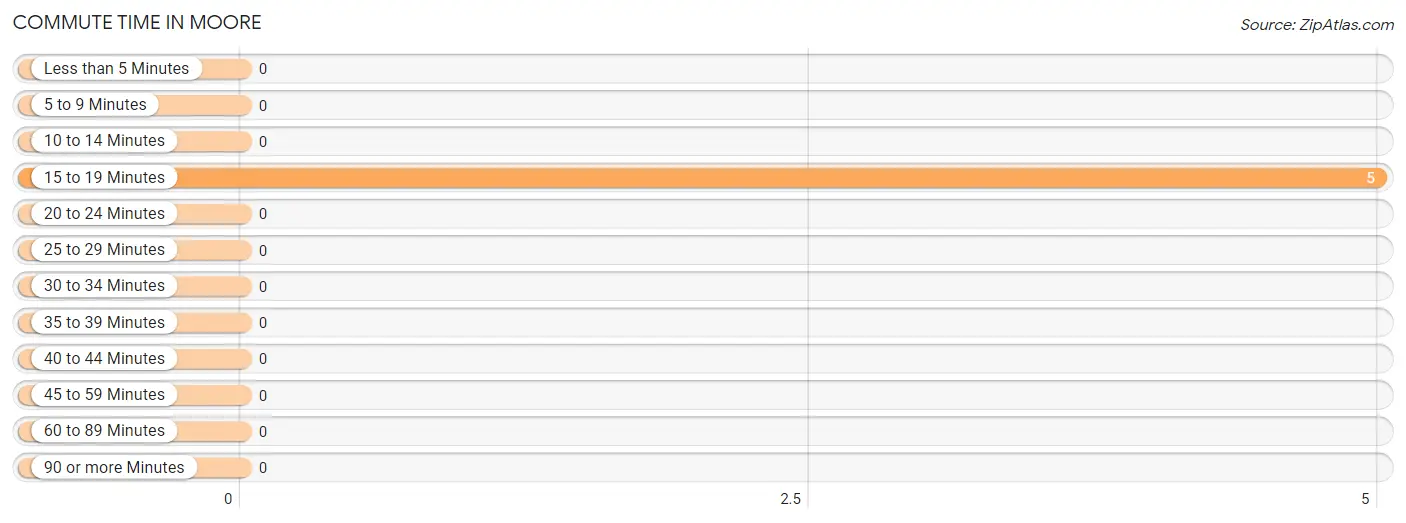
The most frequently occuring commute durations in Moore are 15 to 19 minutes (5 commuters, 100.0%), less than 5 minutes (0 commuters, 0.0%), and 5 to 9 minutes (0 commuters, 0.0%).
Commute Time
# Commuters
% Commuters
Less than 5 Minutes
0
0.0%
5 to 9 Minutes
0
0.0%
10 to 14 Minutes
0
0.0%
15 to 19 Minutes
5
100.0%
20 to 24 Minutes
0
0.0%
25 to 29 Minutes
0
0.0%
30 to 34 Minutes
0
0.0%
35 to 39 Minutes
0
0.0%
40 to 44 Minutes
0
0.0%
45 to 59 Minutes
0
0.0%
60 to 89 Minutes
0
0.0%
90 or more Minutes
0
0.0%
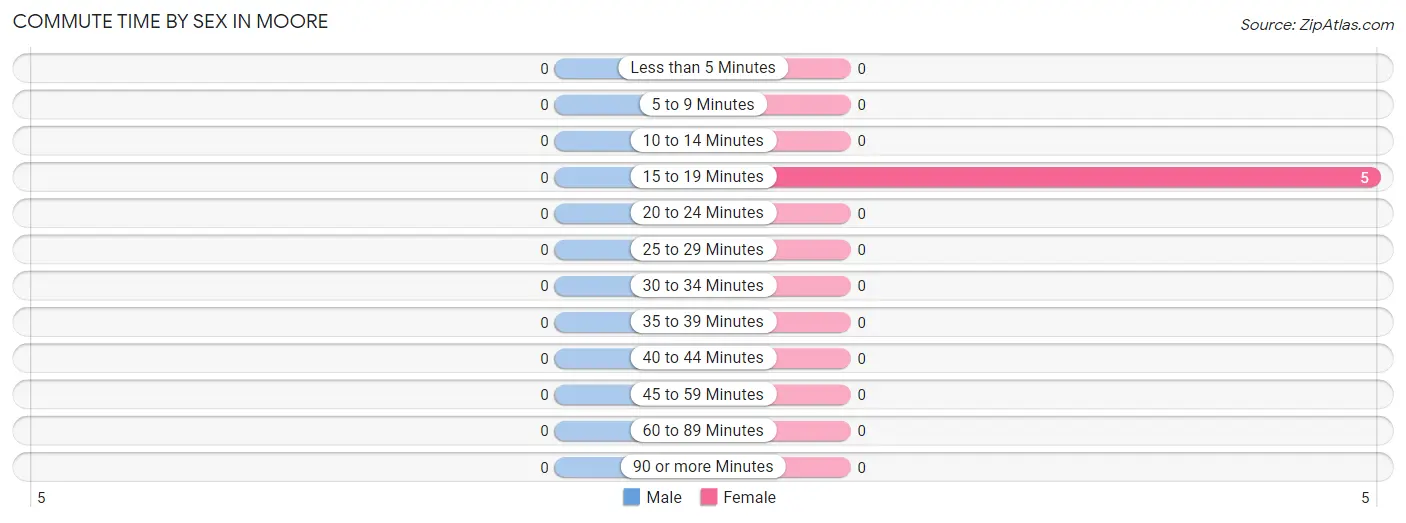
Commute Time by Sex in Moore
Commute Time
Male
Female
Less than 5 Minutes
0 (0.0%)
0 (0.0%)
5 to 9 Minutes
0 (0.0%)
0 (0.0%)
10 to 14 Minutes
0 (0.0%)
0 (0.0%)
15 to 19 Minutes
0 (0.0%)
5 (100.0%)
20 to 24 Minutes
0 (0.0%)
0 (0.0%)
25 to 29 Minutes
0 (0.0%)
0 (0.0%)
30 to 34 Minutes
0 (0.0%)
0 (0.0%)
35 to 39 Minutes
0 (0.0%)
0 (0.0%)
40 to 44 Minutes
0 (0.0%)
0 (0.0%)
45 to 59 Minutes
0 (0.0%)
0 (0.0%)
60 to 89 Minutes
0 (0.0%)
0 (0.0%)
90 or more Minutes
0 (0.0%)
0 (0.0%)
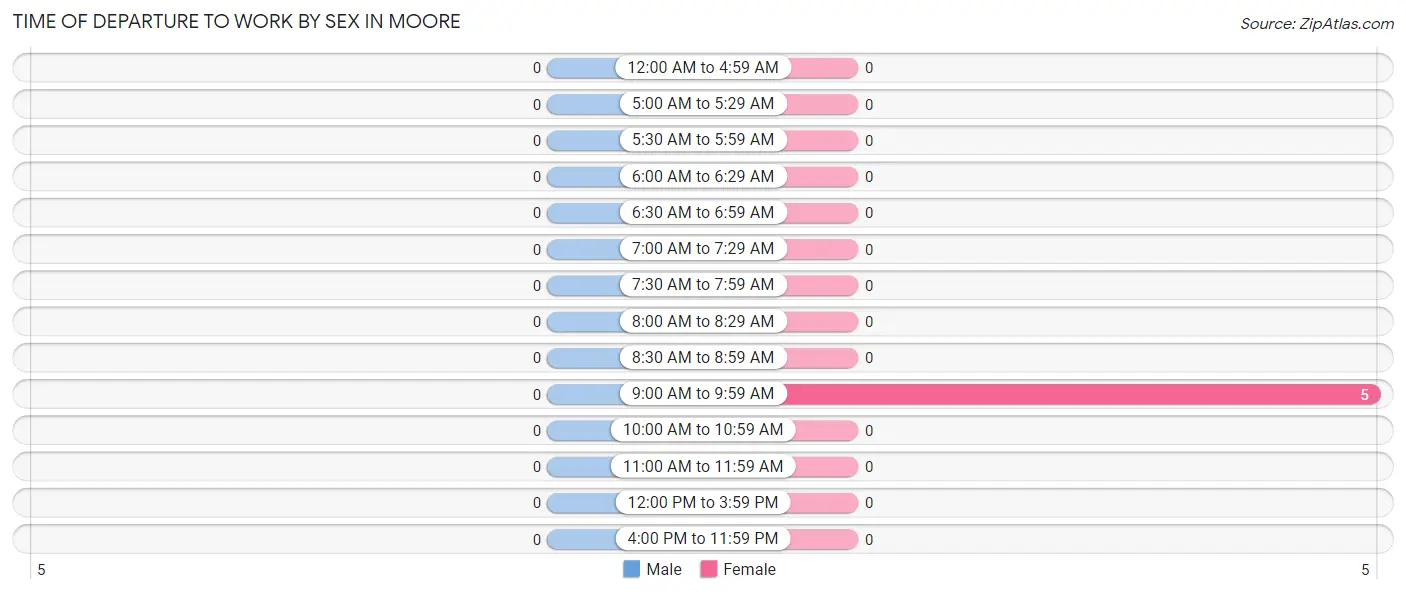
Time of Departure to Work by Sex in Moore
Time of Departure
Male
Female
12:00 AM to 4:59 AM
0 (0.0%)
0 (0.0%)
5:00 AM to 5:29 AM
0 (0.0%)
0 (0.0%)
5:30 AM to 5:59 AM
0 (0.0%)
0 (0.0%)
6:00 AM to 6:29 AM
0 (0.0%)
0 (0.0%)
6:30 AM to 6:59 AM
0 (0.0%)
0 (0.0%)
7:00 AM to 7:29 AM
0 (0.0%)
0 (0.0%)
7:30 AM to 7:59 AM
0 (0.0%)
0 (0.0%)
8:00 AM to 8:29 AM
0 (0.0%)
0 (0.0%)
8:30 AM to 8:59 AM
0 (0.0%)
0 (0.0%)
9:00 AM to 9:59 AM
0 (0.0%)
5 (100.0%)
10:00 AM to 10:59 AM
0 (0.0%)
0 (0.0%)
11:00 AM to 11:59 AM
0 (0.0%)
0 (0.0%)
12:00 PM to 3:59 PM
0 (0.0%)
0 (0.0%)
4:00 PM to 11:59 PM
0 (0.0%)
0 (0.0%)
Total
0 (0.0%)
5 (100.0%)
Housing Occupancy in Moore
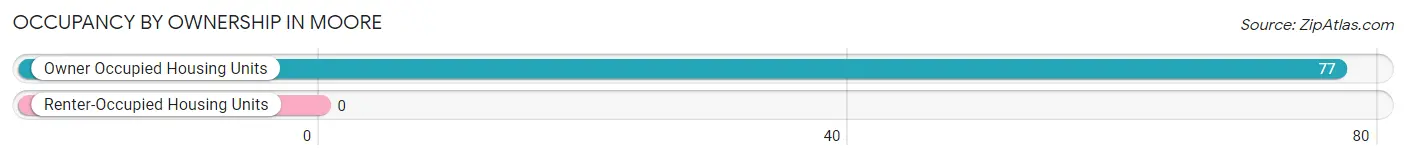
Occupancy by Ownership in Moore
Of the total 77 dwellings in Moore, owner-occupied units account for 77 (100.0%), while renter-occupied units make up 0 (0.0%).
Occupancy
# Housing Units
% Housing Units
Owner Occupied Housing Units
77
100.0%
Renter-Occupied Housing Units
0
0.0%
Total Occupied Housing Units
77
100.0%
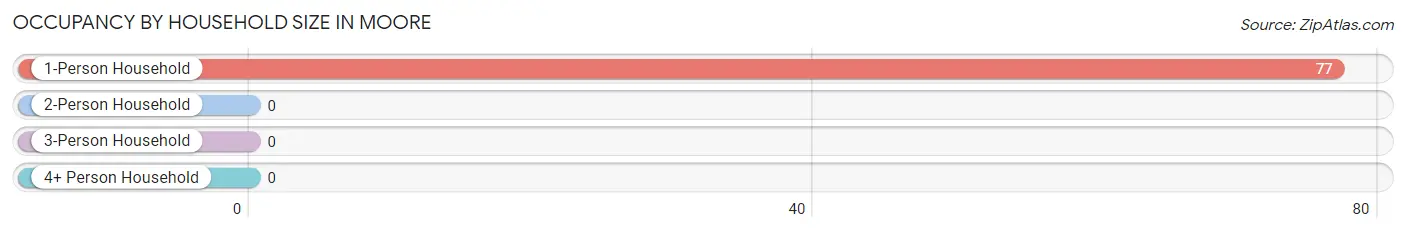
Occupancy by Household Size in Moore
Household Size
# Housing Units
% Housing Units
1-Person Household
77
100.0%
2-Person Household
0
0.0%
3-Person Household
0
0.0%
4+ Person Household
0
0.0%
Total Housing Units
77
100.0%
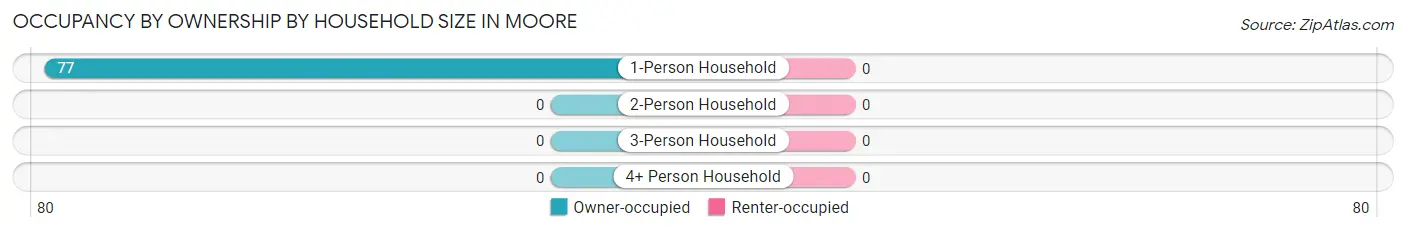
Occupancy by Ownership by Household Size in Moore
Household Size
Owner-occupied
Renter-occupied
1-Person Household
77 (100.0%)
0 (0.0%)
2-Person Household
0 (0.0%)
0 (0.0%)
3-Person Household
0 (0.0%)
0 (0.0%)
4+ Person Household
0 (0.0%)
0 (0.0%)
Total Housing Units
77 (100.0%)
0 (0.0%)
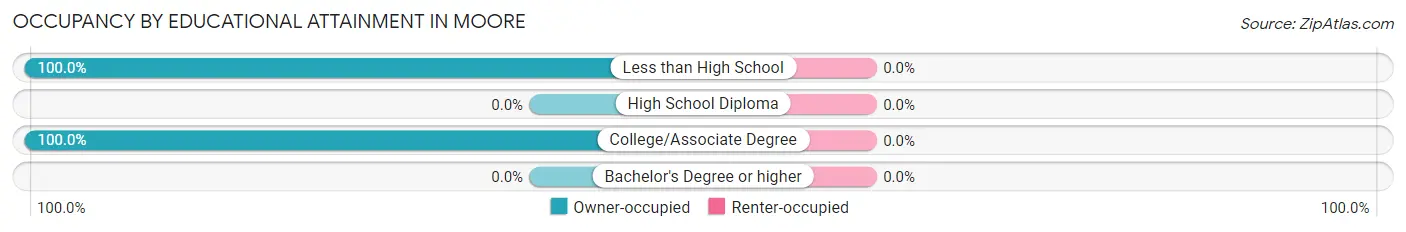
Occupancy by Educational Attainment in Moore
Household Size
Owner-occupied
Renter-occupied
Less than High School
33 (100.0%)
0 (0.0%)
High School Diploma
0 (0.0%)
0 (0.0%)
College/Associate Degree
44 (100.0%)
0 (0.0%)
Bachelor's Degree or higher
0 (0.0%)
0 (0.0%)
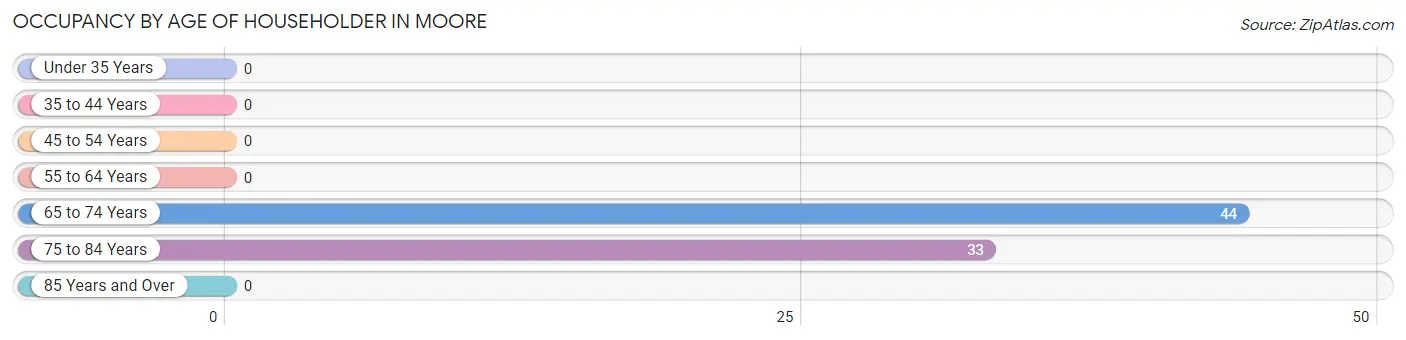
Occupancy by Age of Householder in Moore
Age Bracket
# Households
% Households
Under 35 Years
0
0.0%
35 to 44 Years
0
0.0%
45 to 54 Years
0
0.0%
55 to 64 Years
0
0.0%
65 to 74 Years
44
57.1%
75 to 84 Years
33
42.9%
85 Years and Over
0
0.0%
Total
77
100.0%
Housing Finances in Moore
Median Income by Occupancy in Moore
Occupancy Type
# Households
Median Income
Owner-Occupied
77 (100.0%)
$0
Renter-Occupied
0 (0.0%)
$0
Average
77 (100.0%)
$0
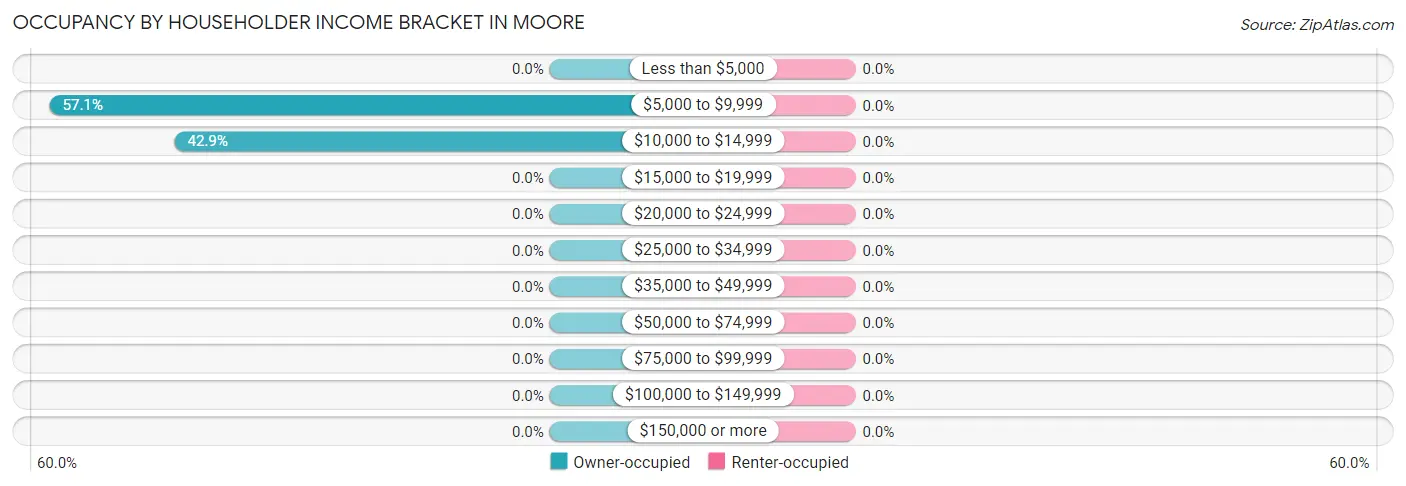
Occupancy by Householder Income Bracket in Moore
Income Bracket
Owner-occupied
Renter-occupied
Less than $5,000
0 (0.0%)
0 (0.0%)
$5,000 to $9,999
44 (57.1%)
0 (0.0%)
$10,000 to $14,999
33 (42.9%)
0 (0.0%)
$15,000 to $19,999
0 (0.0%)
0 (0.0%)
$20,000 to $24,999
0 (0.0%)
0 (0.0%)
$25,000 to $34,999
0 (0.0%)
0 (0.0%)
$35,000 to $49,999
0 (0.0%)
0 (0.0%)
$50,000 to $74,999
0 (0.0%)
0 (0.0%)
$75,000 to $99,999
0 (0.0%)
0 (0.0%)
$100,000 to $149,999
0 (0.0%)
0 (0.0%)
$150,000 or more
0 (0.0%)
0 (0.0%)
Total
77 (100.0%)
0 (0.0%)
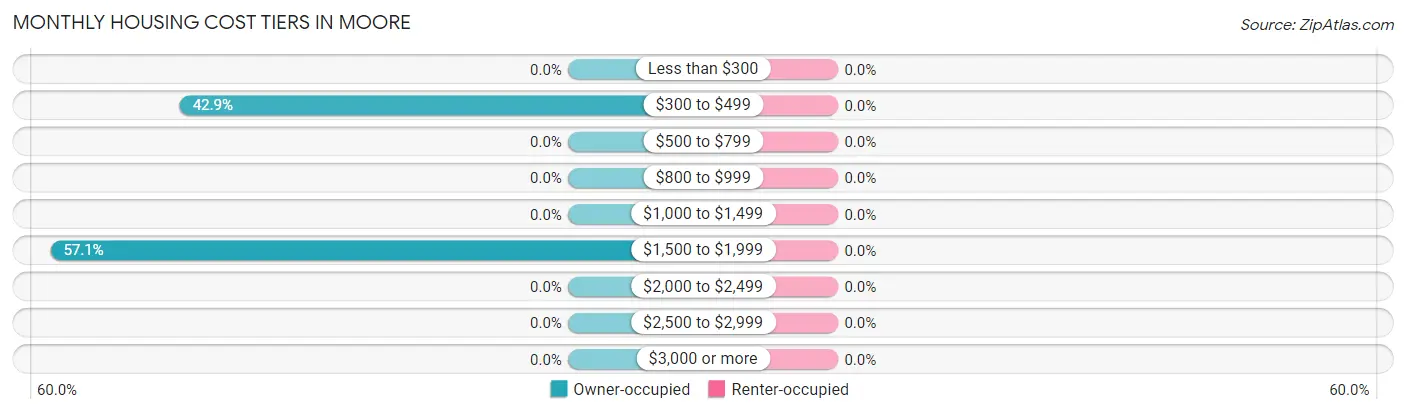
Monthly Housing Cost Tiers in Moore
Monthly Cost
Owner-occupied
Renter-occupied
Less than $300
0 (0.0%)
0 (0.0%)
$300 to $499
33 (42.9%)
0 (0.0%)
$500 to $799
0 (0.0%)
0 (0.0%)
$800 to $999
0 (0.0%)
0 (0.0%)
$1,000 to $1,499
0 (0.0%)
0 (0.0%)
$1,500 to $1,999
44 (57.1%)
0 (0.0%)
$2,000 to $2,499
0 (0.0%)
0 (0.0%)
$2,500 to $2,999
0 (0.0%)
0 (0.0%)
$3,000 or more
0 (0.0%)
0 (0.0%)
Total
77 (100.0%)
0 (0.0%)
Physical Housing Characteristics in Moore
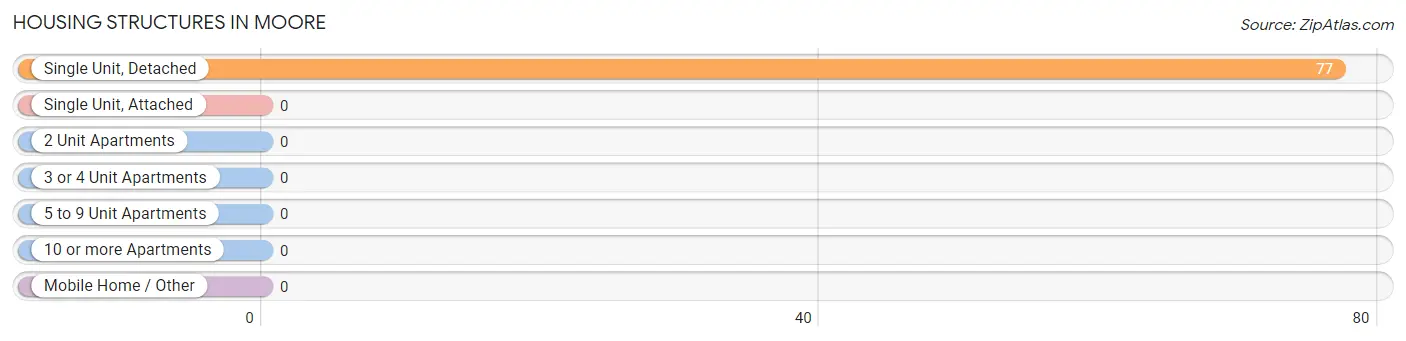
Housing Structures in Moore
Structure Type
# Housing Units
% Housing Units
Single Unit, Detached
77
100.0%
Single Unit, Attached
0
0.0%
2 Unit Apartments
0
0.0%
3 or 4 Unit Apartments
0
0.0%
5 to 9 Unit Apartments
0
0.0%
10 or more Apartments
0
0.0%
Mobile Home / Other
0
0.0%
Total
77
100.0%
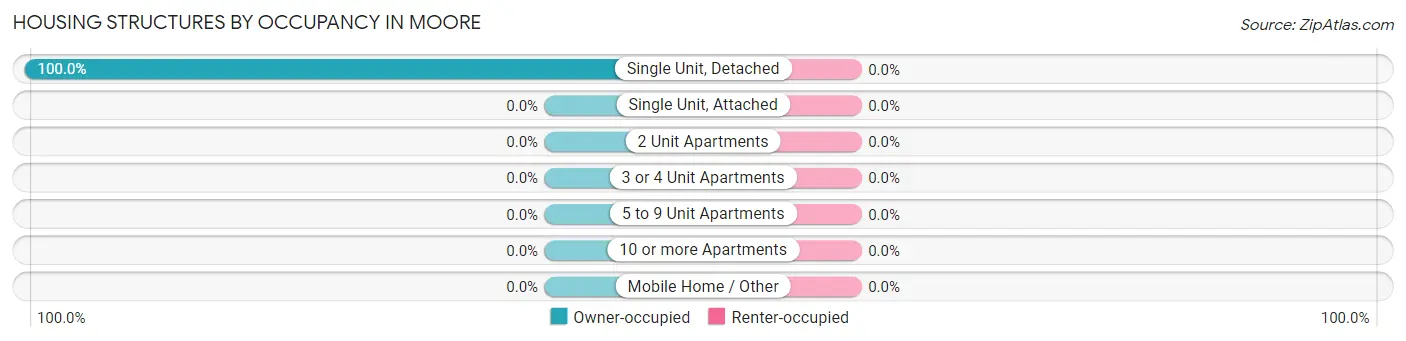
Housing Structures by Occupancy in Moore
Structure Type
Owner-occupied
Renter-occupied
Single Unit, Detached
77 (100.0%)
0 (0.0%)
Single Unit, Attached
0 (0.0%)
0 (0.0%)
2 Unit Apartments
0 (0.0%)
0 (0.0%)
3 or 4 Unit Apartments
0 (0.0%)
0 (0.0%)
5 to 9 Unit Apartments
0 (0.0%)
0 (0.0%)
10 or more Apartments
0 (0.0%)
0 (0.0%)
Mobile Home / Other
0 (0.0%)
0 (0.0%)
Total
77 (100.0%)
0 (0.0%)
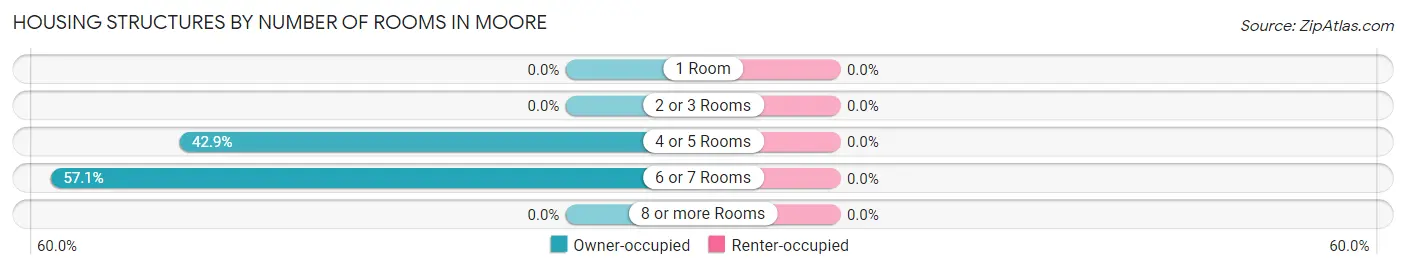
Housing Structures by Number of Rooms in Moore
Number of Rooms
Owner-occupied
Renter-occupied
1 Room
0 (0.0%)
0 (0.0%)
2 or 3 Rooms
0 (0.0%)
0 (0.0%)
4 or 5 Rooms
33 (42.9%)
0 (0.0%)
6 or 7 Rooms
44 (57.1%)
0 (0.0%)
8 or more Rooms
0 (0.0%)
0 (0.0%)
Total
77 (100.0%)
0 (0.0%)
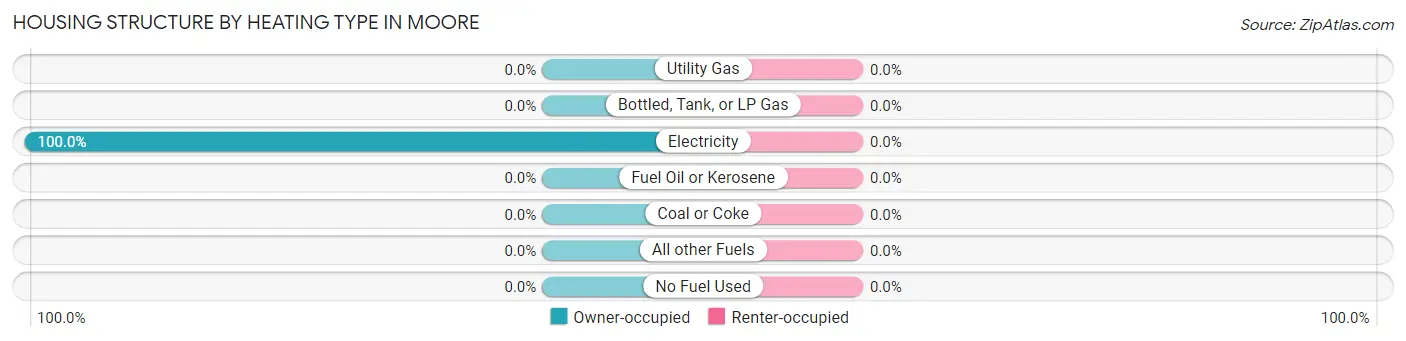
Housing Structure by Heating Type in Moore
Heating Type
Owner-occupied
Renter-occupied
Utility Gas
0 (0.0%)
0 (0.0%)
Bottled, Tank, or LP Gas
0 (0.0%)
0 (0.0%)
Electricity
77 (100.0%)
0 (0.0%)
Fuel Oil or Kerosene
0 (0.0%)
0 (0.0%)
Coal or Coke
0 (0.0%)
0 (0.0%)
All other Fuels
0 (0.0%)
0 (0.0%)
No Fuel Used
0 (0.0%)
0 (0.0%)
Total
77 (100.0%)
0 (0.0%)
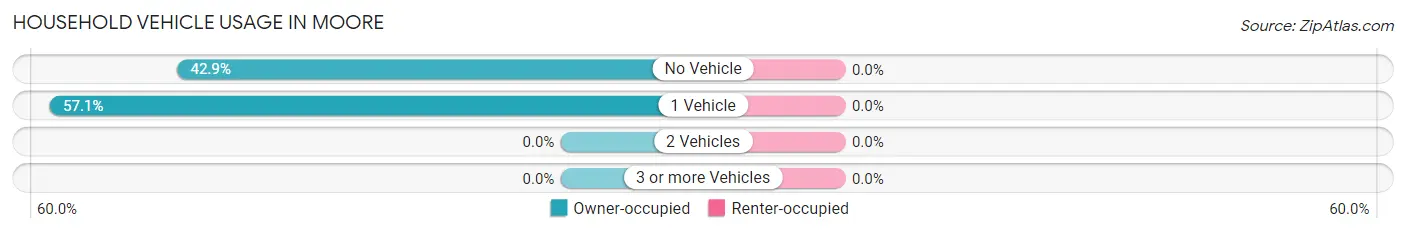
Household Vehicle Usage in Moore
Vehicles per Household
Owner-occupied
Renter-occupied
No Vehicle
33 (42.9%)
0 (0.0%)
1 Vehicle
44 (57.1%)
0 (0.0%)
2 Vehicles
0 (0.0%)
0 (0.0%)
3 or more Vehicles
0 (0.0%)
0 (0.0%)
Total
77 (100.0%)
0 (0.0%)
Real Estate & Mortgages in Moore
Real Estate and Mortgage Overview in Moore
Characteristic
Without Mortgage
With Mortgage
Housing Units
33
44
Median Property Value
-
-
Median Household Income
-
-
Monthly Housing Costs
-
-
Real Estate Taxes
-
-
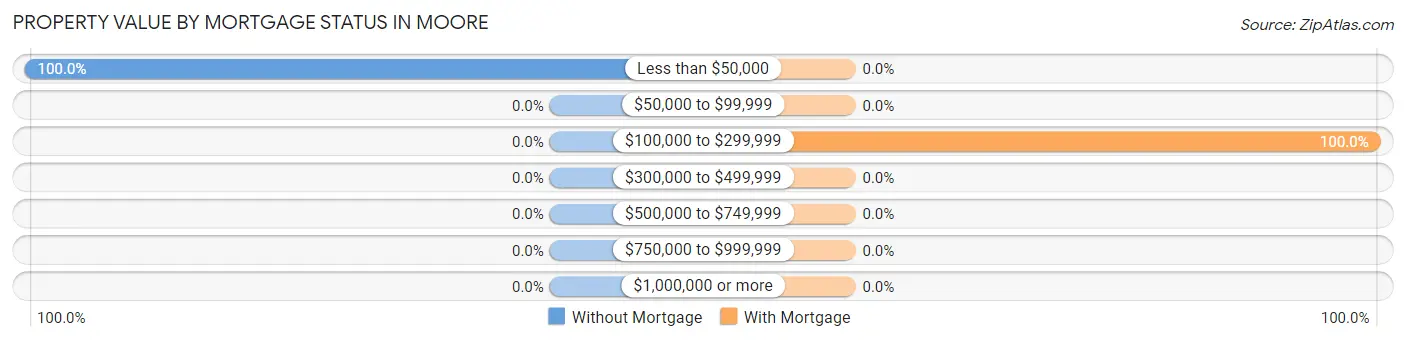
Property Value by Mortgage Status in Moore
Property Value
Without Mortgage
With Mortgage
Less than $50,000
33 (100.0%)
0 (0.0%)
$50,000 to $99,999
0 (0.0%)
0 (0.0%)
$100,000 to $299,999
0 (0.0%)
44 (100.0%)
$300,000 to $499,999
0 (0.0%)
0 (0.0%)
$500,000 to $749,999
0 (0.0%)
0 (0.0%)
$750,000 to $999,999
0 (0.0%)
0 (0.0%)
$1,000,000 or more
0 (0.0%)
0 (0.0%)
Total
33 (100.0%)
44 (100.0%)
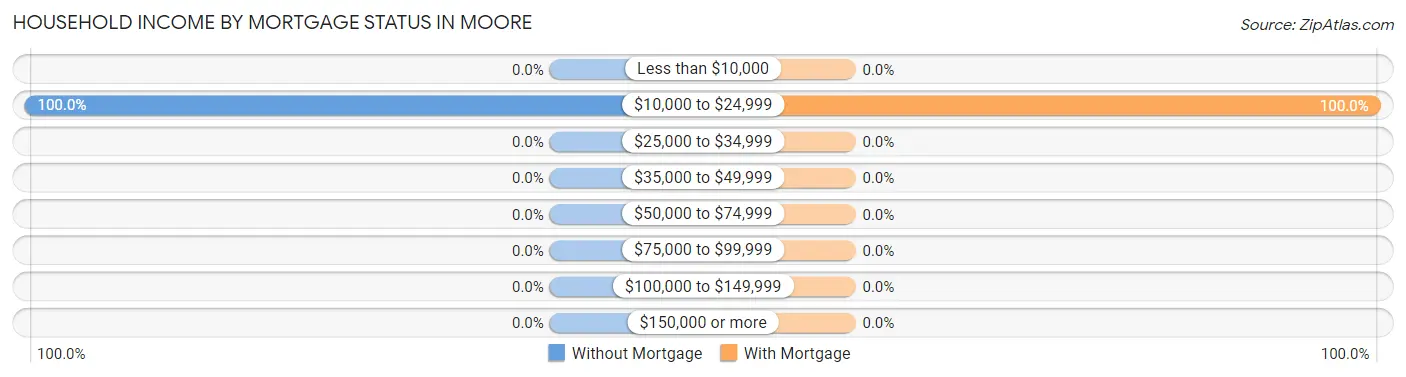
Household Income by Mortgage Status in Moore
Household Income
Without Mortgage
With Mortgage
Less than $10,000
0 (0.0%)
0 (0.0%)
$10,000 to $24,999
33 (100.0%)
44 (100.0%)
$25,000 to $34,999
0 (0.0%)
0 (0.0%)
$35,000 to $49,999
0 (0.0%)
0 (0.0%)
$50,000 to $74,999
0 (0.0%)
0 (0.0%)
$75,000 to $99,999
0 (0.0%)
0 (0.0%)
$100,000 to $149,999
0 (0.0%)
0 (0.0%)
$150,000 or more
0 (0.0%)
0 (0.0%)
Total
33 (100.0%)
44 (100.0%)
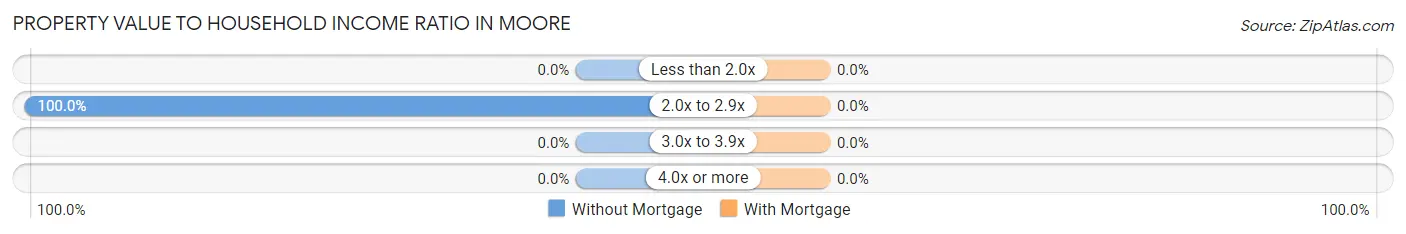
Property Value to Household Income Ratio in Moore
Value-to-Income Ratio
Without Mortgage
With Mortgage
Less than 2.0x
0 (0.0%)
0 (0.0%)
2.0x to 2.9x
33 (100.0%)
0 (0.0%)
3.0x to 3.9x
0 (0.0%)
0 (0.0%)
4.0x or more
0 (0.0%)
0 (0.0%)
Total
33 (100.0%)
44 (100.0%)
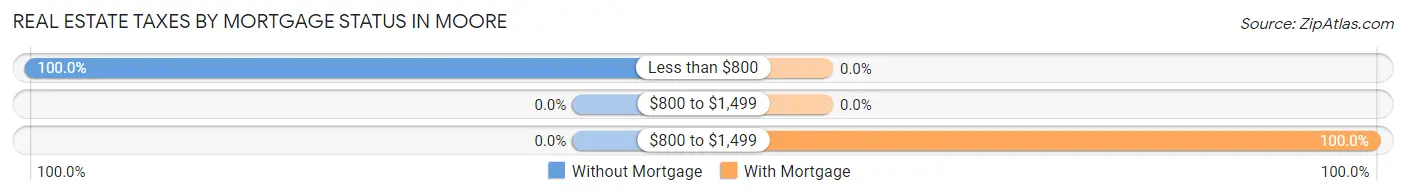
Real Estate Taxes by Mortgage Status in Moore
Property Taxes
Without Mortgage
With Mortgage
Less than $800
33 (100.0%)
0 (0.0%)
$800 to $1,499
0 (0.0%)
0 (0.0%)
$800 to $1,499
0 (0.0%)
44 (100.0%)
Total
33 (100.0%)
44 (100.0%)
Health & Disability in Moore
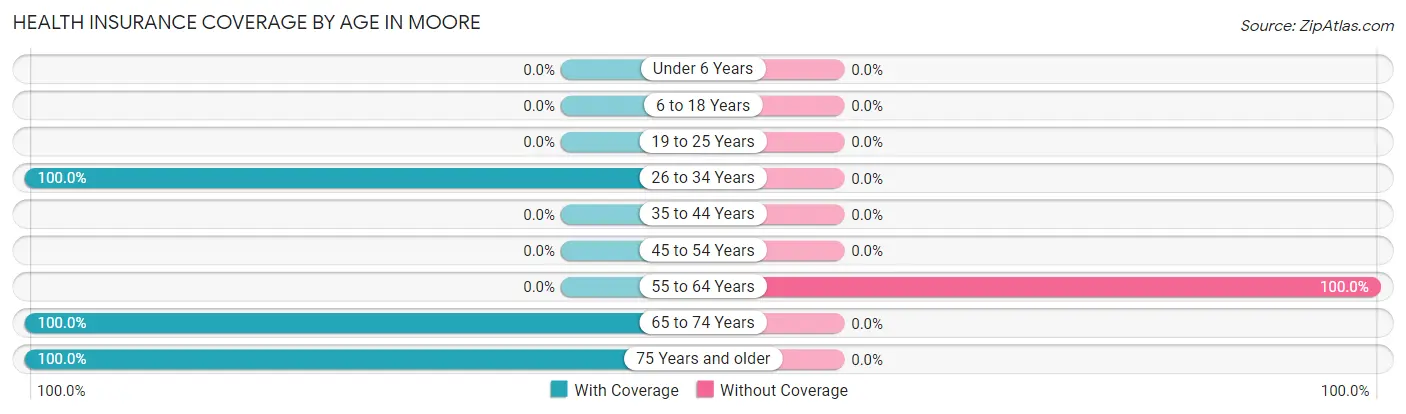
Health Insurance Coverage by Age in Moore
Age Bracket
With Coverage
Without Coverage
Under 6 Years
0 (0.0%)
0 (0.0%)
6 to 18 Years
0 (0.0%)
0 (0.0%)
19 to 25 Years
0 (0.0%)
0 (0.0%)
26 to 34 Years
7 (100.0%)
0 (0.0%)
35 to 44 Years
0 (0.0%)
0 (0.0%)
45 to 54 Years
0 (0.0%)
0 (0.0%)
55 to 64 Years
0 (0.0%)
4 (100.0%)
65 to 74 Years
49 (100.0%)
0 (0.0%)
75 Years and older
33 (100.0%)
0 (0.0%)
Total
89 (95.7%)
4 (4.3%)
Health Insurance Coverage by Citizenship Status in Moore
Citizenship Status
With Coverage
Without Coverage
Native Born
0 (0.0%)
0 (0.0%)
Foreign Born, Citizen
0 (0.0%)
0 (0.0%)
Foreign Born, not a Citizen
0 (0.0%)
0 (0.0%)
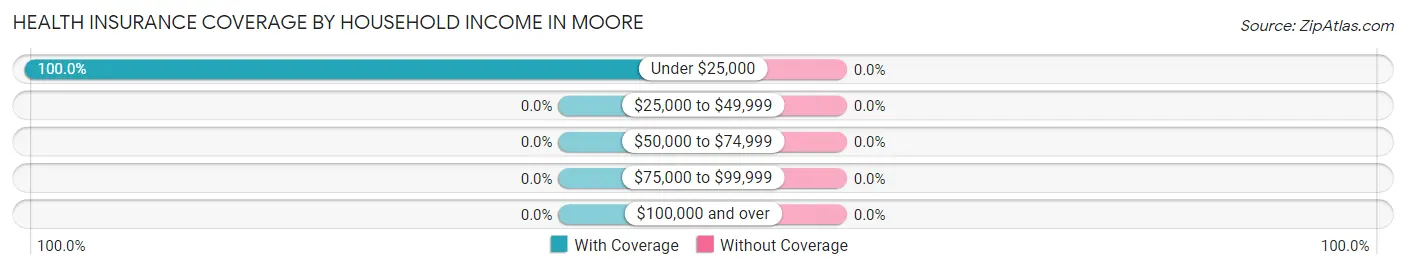
Health Insurance Coverage by Household Income in Moore
Household Income
With Coverage
Without Coverage
Under $25,000
77 (100.0%)
0 (0.0%)
$25,000 to $49,999
0 (0.0%)
0 (0.0%)
$50,000 to $74,999
0 (0.0%)
0 (0.0%)
$75,000 to $99,999
0 (0.0%)
0 (0.0%)
$100,000 and over
0 (0.0%)
0 (0.0%)
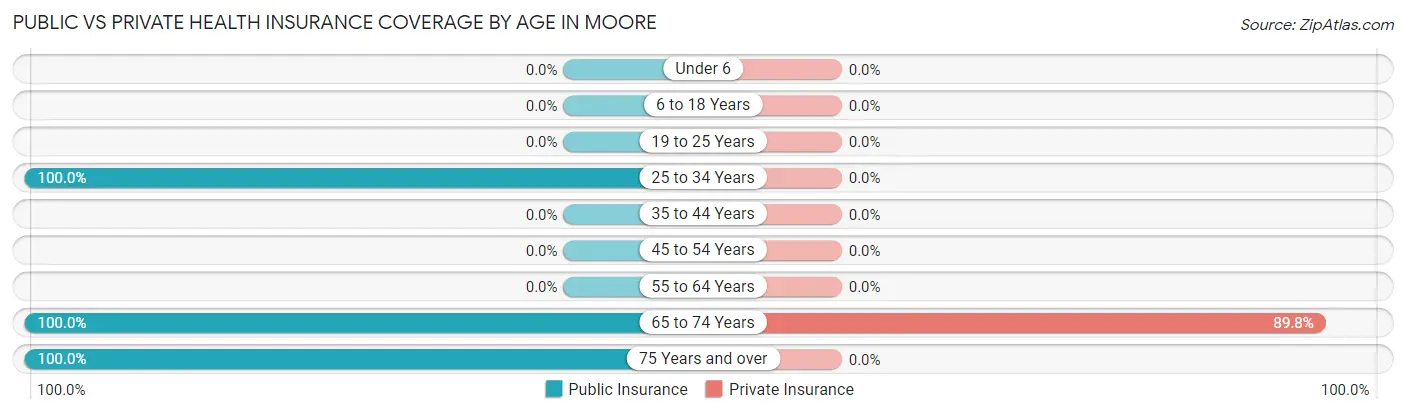
Public vs Private Health Insurance Coverage by Age in Moore
Age Bracket
Public Insurance
Private Insurance
Under 6
0 (0.0%)
0 (0.0%)
6 to 18 Years
0 (0.0%)
0 (0.0%)
19 to 25 Years
0 (0.0%)
0 (0.0%)
25 to 34 Years
7 (100.0%)
0 (0.0%)
35 to 44 Years
0 (0.0%)
0 (0.0%)
45 to 54 Years
0 (0.0%)
0 (0.0%)
55 to 64 Years
0 (0.0%)
0 (0.0%)
65 to 74 Years
49 (100.0%)
44 (89.8%)
75 Years and over
33 (100.0%)
0 (0.0%)
Total
89 (95.7%)
44 (47.3%)
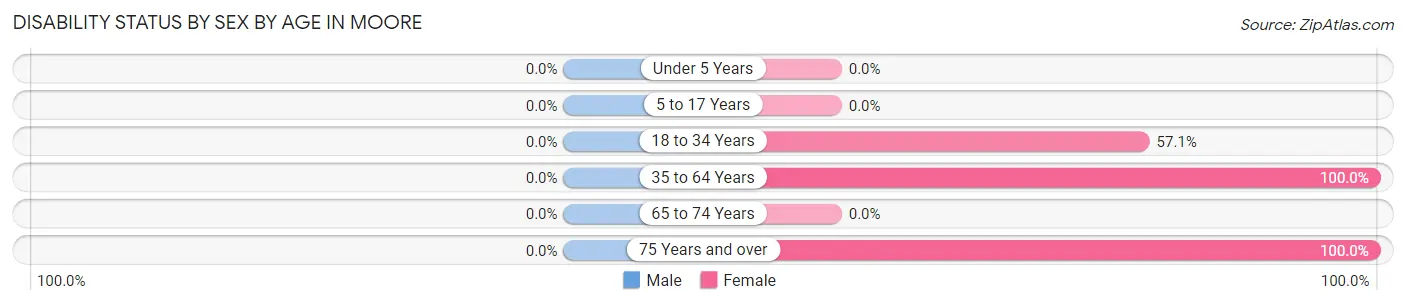
Disability Status by Sex by Age in Moore
Age Bracket
Male
Female
Under 5 Years
0 (0.0%)
0 (0.0%)
5 to 17 Years
0 (0.0%)
0 (0.0%)
18 to 34 Years
0 (0.0%)
4 (57.1%)
35 to 64 Years
0 (0.0%)
4 (100.0%)
65 to 74 Years
0 (0.0%)
0 (0.0%)
75 Years and over
0 (0.0%)
33 (100.0%)
Disability Class by Sex by Age in Moore
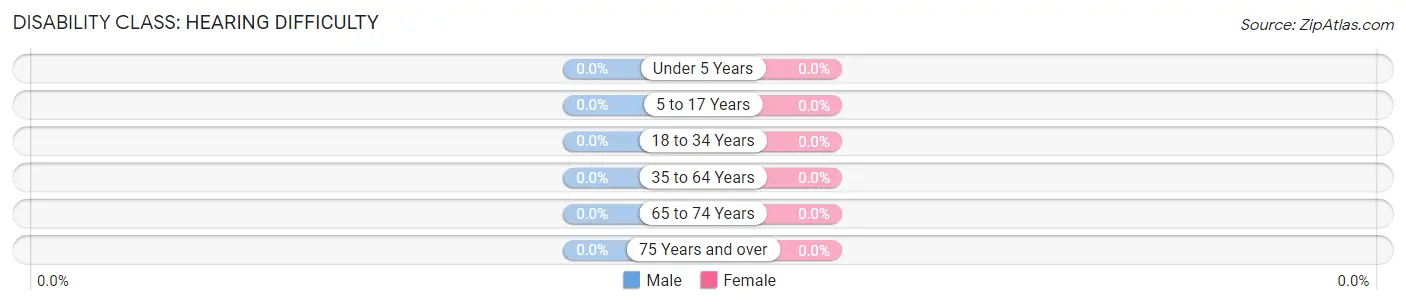
Disability Class: Hearing Difficulty
Age Bracket
Male
Female
Under 5 Years
0 (0.0%)
0 (0.0%)
5 to 17 Years
0 (0.0%)
0 (0.0%)
18 to 34 Years
0 (0.0%)
0 (0.0%)
35 to 64 Years
0 (0.0%)
0 (0.0%)
65 to 74 Years
0 (0.0%)
0 (0.0%)
75 Years and over
0 (0.0%)
0 (0.0%)
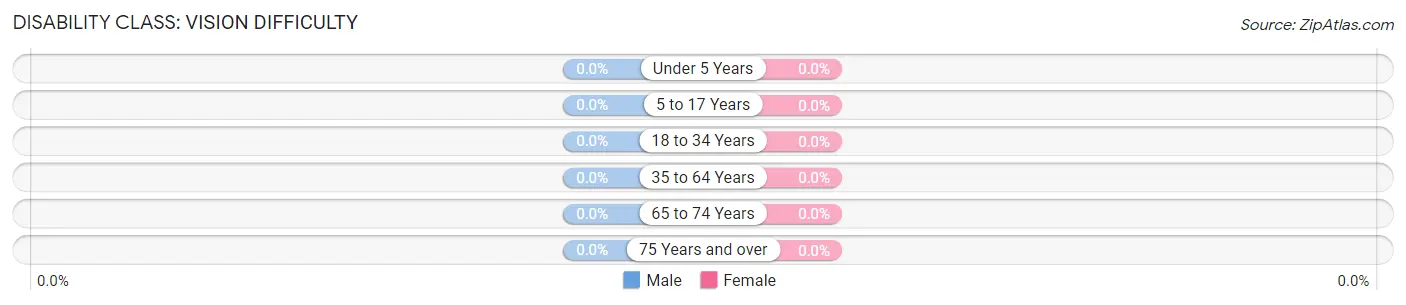
Disability Class: Vision Difficulty
Age Bracket
Male
Female
Under 5 Years
0 (0.0%)
0 (0.0%)
5 to 17 Years
0 (0.0%)
0 (0.0%)
18 to 34 Years
0 (0.0%)
0 (0.0%)
35 to 64 Years
0 (0.0%)
0 (0.0%)
65 to 74 Years
0 (0.0%)
0 (0.0%)
75 Years and over
0 (0.0%)
0 (0.0%)
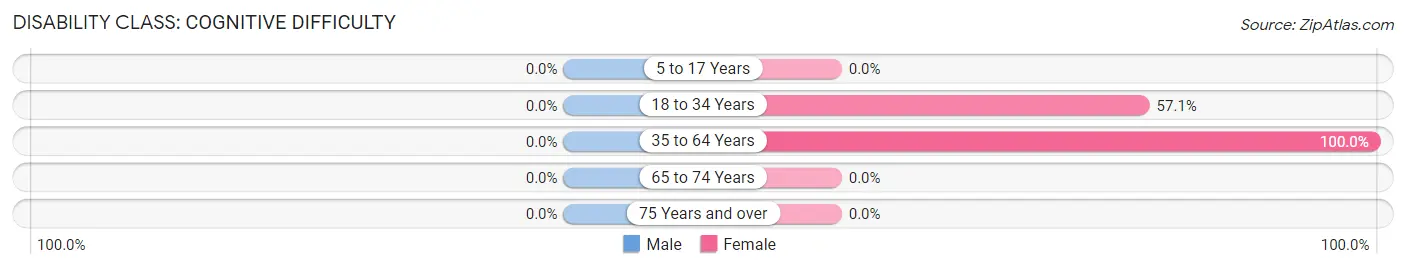
Disability Class: Cognitive Difficulty
Age Bracket
Male
Female
5 to 17 Years
0 (0.0%)
0 (0.0%)
18 to 34 Years
0 (0.0%)
4 (57.1%)
35 to 64 Years
0 (0.0%)
4 (100.0%)
65 to 74 Years
0 (0.0%)
0 (0.0%)
75 Years and over
0 (0.0%)
0 (0.0%)
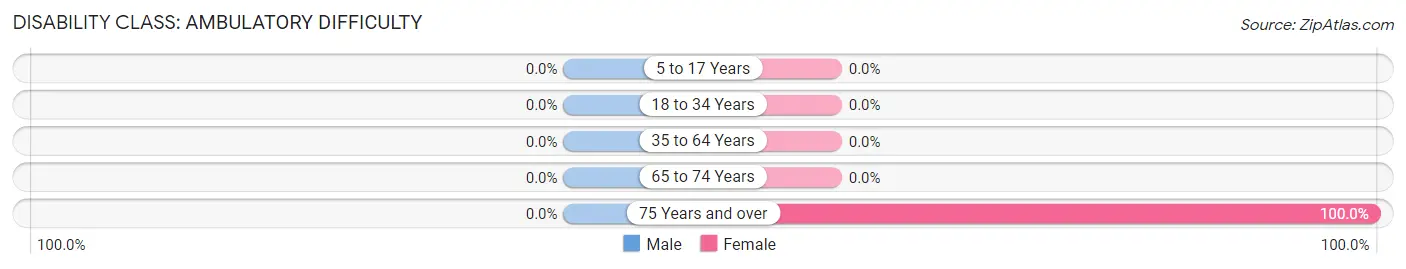
Disability Class: Ambulatory Difficulty
Age Bracket
Male
Female
5 to 17 Years
0 (0.0%)
0 (0.0%)
18 to 34 Years
0 (0.0%)
0 (0.0%)
35 to 64 Years
0 (0.0%)
0 (0.0%)
65 to 74 Years
0 (0.0%)
0 (0.0%)
75 Years and over
0 (0.0%)
33 (100.0%)
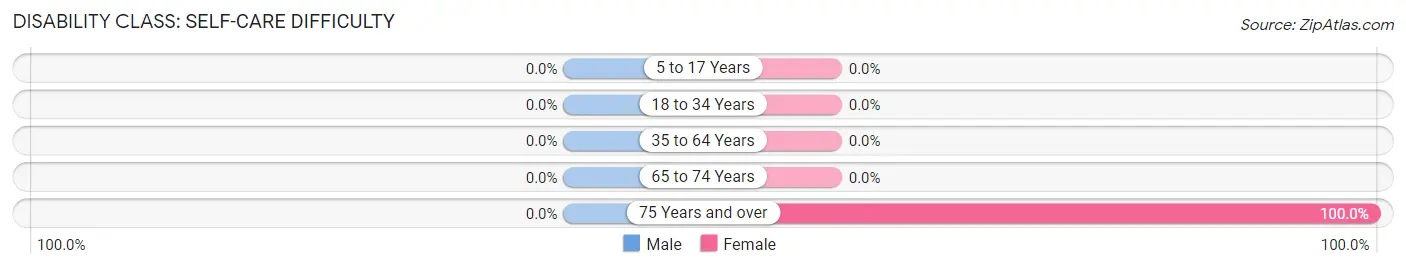
Disability Class: Self-Care Difficulty
Age Bracket
Male
Female
5 to 17 Years
0 (0.0%)
0 (0.0%)
18 to 34 Years
0 (0.0%)
0 (0.0%)
35 to 64 Years
0 (0.0%)
0 (0.0%)
65 to 74 Years
0 (0.0%)
0 (0.0%)
75 Years and over
0 (0.0%)
33 (100.0%)
Technology Access in Moore
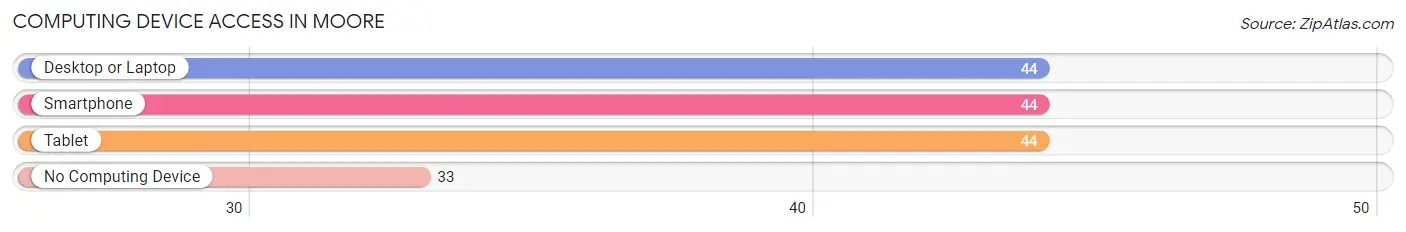
Computing Device Access in Moore
Device Type
# Households
% Households
Desktop or Laptop
44
57.1%
Smartphone
44
57.1%
Tablet
44
57.1%
No Computing Device
33
42.9%
Total
77
100.0%
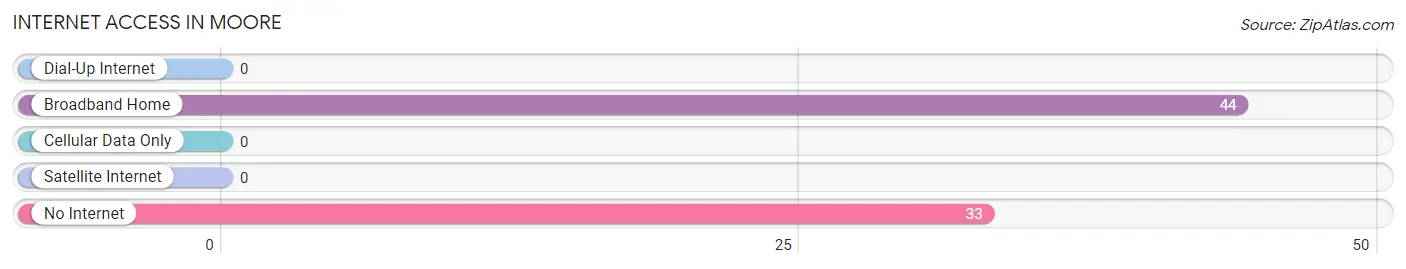
Internet Access in Moore
Internet Type
# Households
% Households
Dial-Up Internet
0
0.0%
Broadband Home
44
57.1%
Cellular Data Only
0
0.0%
Satellite Internet
0
0.0%
No Internet
33
42.9%
Total
77
100.0%
Moore Summary
Moore is a small town located in the state of Texas, in the United States. It is situated in the northern part of the state, in the county of Collin. The town has a population of approximately 1,000 people, and is part of the Dallas-Fort Worth metropolitan area.
History
Moore was founded in 1873 by a group of settlers from Missouri. The town was named after the first settler, William Moore, who had purchased the land from the local Native American tribes. The town was originally a farming community, and the main crops grown were cotton and corn. In the late 19th century, the town began to grow and develop, and by the early 20th century, it had become a thriving community.
In the 1950s, the town began to experience a period of rapid growth, as the population increased and new businesses were established. This growth was largely due to the development of the nearby Dallas-Fort Worth metropolitan area. In the late 20th century, Moore experienced a period of decline, as many of the businesses that had been established in the 1950s closed down. However, in recent years, the town has seen a resurgence in growth, as new businesses have opened and the population has increased.
Geography
Moore is located in the northern part of Texas, in the county of Collin. The town is situated on the banks of the Trinity River, and is surrounded by rolling hills and wooded areas. The town is located approximately 30 miles north of Dallas, and is part of the Dallas-Fort Worth metropolitan area.
The climate in Moore is generally warm and humid, with temperatures ranging from the mid-50s in the winter to the mid-90s in the summer. The town receives an average of 40 inches of rain per year, and is prone to occasional severe weather, such as tornadoes and thunderstorms.
Economy
The economy of Moore is largely based on agriculture and manufacturing. The town is home to several large farms, which produce a variety of crops, including cotton, corn, and soybeans. In addition, the town is home to several manufacturing companies, which produce a variety of products, including furniture, clothing, and electronics.
The town is also home to several small businesses, including restaurants, retail stores, and service providers. In recent years, the town has seen an increase in tourism, as visitors come to explore the town’s history and enjoy its natural beauty.
Demographics
As of the 2010 census, the population of Moore was 1,000 people. The town is predominantly white, with approximately 75% of the population identifying as such. The remaining 25% of the population is made up of African Americans, Hispanics, and other ethnicities. The median household income in Moore is $45,000, and the median home value is $150,000.
Moore is a small town with a rich history and a bright future. The town is home to a diverse population, and its economy is largely based on agriculture and manufacturing. In recent years, the town has seen an increase in tourism, as visitors come to explore the town’s history and enjoy its natural beauty. Moore is a great place to live, work, and raise a family.
Common Questions
What is Per Capita Income in Moore?
Per Capita income in Moore is $11,481.
What is Inequality or Gini Index in Moore?
Inequality or Gini Index in Moore is 0.07.
What is the Total Population of Moore?
Total Population of Moore is 93.
What is the Total Female Population of Moore?
Total Female Population of Moore is 93.
What is the Median Population Age in Moore?
Median Population Age in Moore is 74.7 Years.
How Large is the Labor Force in Moore?
There are 9 People in the Labor Forcein in Moore.
What is the Percentage of People in the Labor Force in Moore?
9.7% of People are in the Labor Force in Moore.
What is the Unemployment Rate in Moore?
Unemployment Rate in Moore is 44.4%.
Report Title
Report Link
HTML Copy & Paste Link
Social Media
Copy and paste the folowing code into any webpage where you would like this interactive chart to display