Tioga, WV Map & Demographics
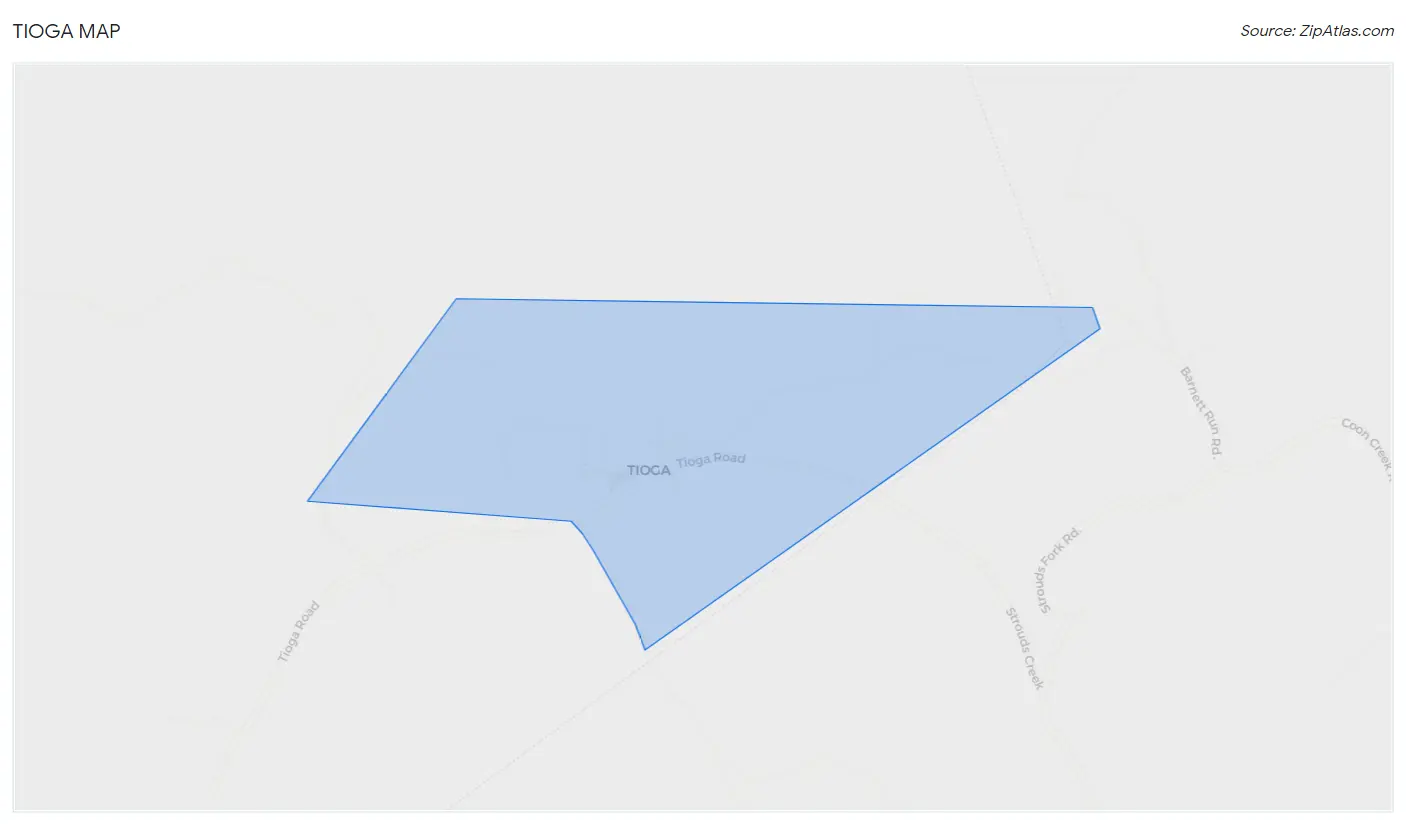
Tioga Map
Tioga Overview
$20,175
PER CAPITA INCOME
$78,050
AVG FAMILY INCOME
$78,667
AVG HOUSEHOLD INCOME
0.24
INEQUALITY / GINI INDEX
545
TOTAL POPULATION
345
MALE POPULATION
200
FEMALE POPULATION
172.50
MALES / 100 FEMALES
57.97
FEMALES / 100 MALES
38.4
MEDIAN AGE
3.6
AVG FAMILY SIZE
4.3
AVG HOUSEHOLD SIZE
213
LABOR FORCE [ PEOPLE ]
63.6%
PERCENT IN LABOR FORCE
22.1%
UNEMPLOYMENT RATE
Tioga Zip Codes
Tioga Area Codes
Income in Tioga
Income Overview in Tioga
Per Capita Income in Tioga is $20,175, while median incomes of families and households are $78,050 and $78,667 respectively.
| Characteristic | Number | Measure |
| Per Capita Income | 545 | $20,175 |
| Median Family Income | 117 | $78,050 |
| Mean Family Income | 117 | $67,038 |
| Median Household Income | 128 | $78,667 |
| Mean Household Income | 128 | $85,143 |
| Income Deficit | 117 | $0 |
| Wage / Income Gap (%) | 545 | 0.00% |
| Wage / Income Gap ($) | 545 | 100.00¢ per $1 |
| Gini / Inequality Index | 545 | 0.24 |
Earnings by Sex in Tioga
| Sex | Number | Average Earnings |
| Male | 20 (12.0%) | $0 |
| Female | 146 (87.9%) | $0 |
| Total | 166 (100.0%) | $0 |
Earnings by Sex by Income Bracket in Tioga
The most common earnings brackets in Tioga are $100,000+ for men (20 | 100.0%) and $75,000 to $99,999 for women (75 | 51.4%).
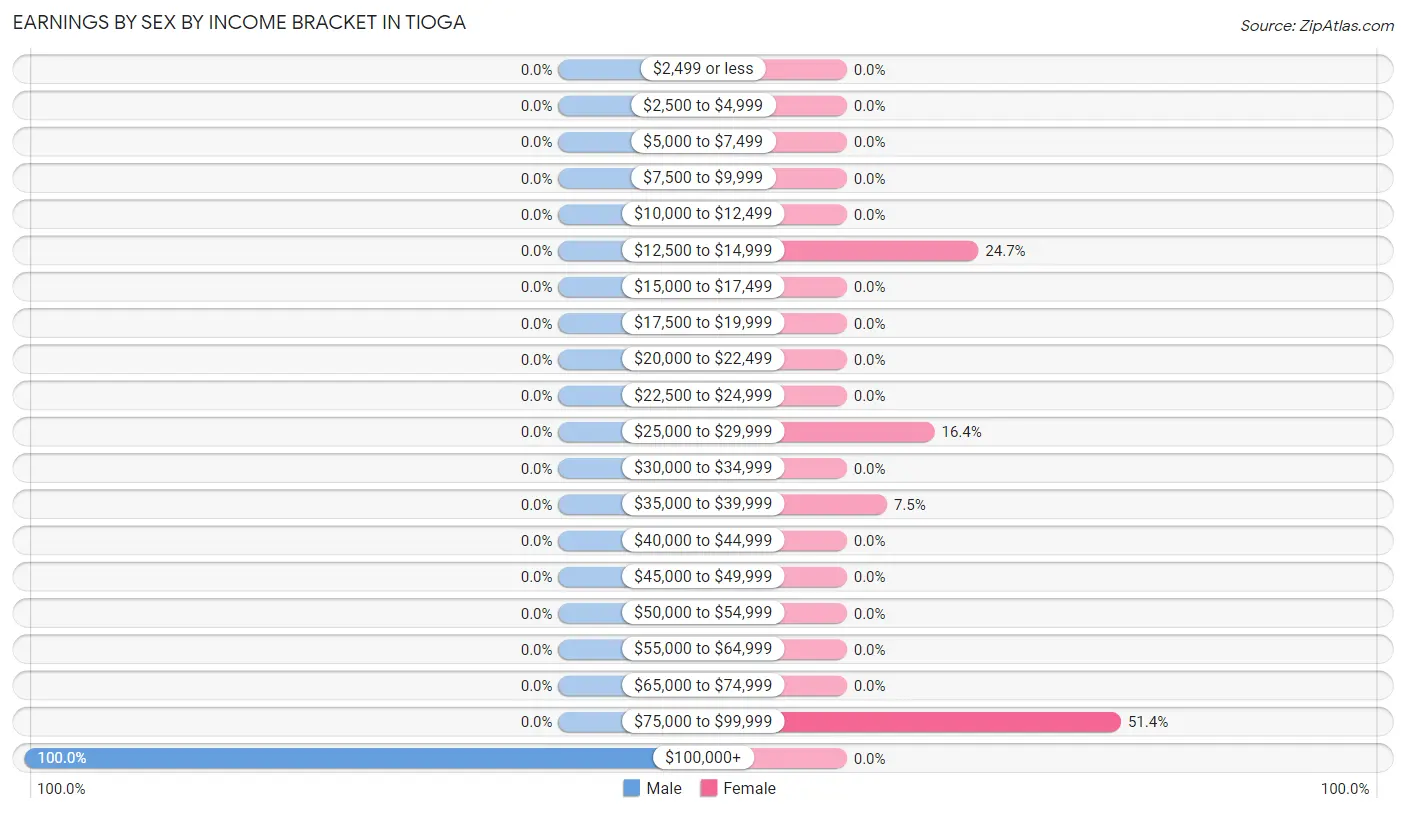
| Income | Male | Female |
| $2,499 or less | 0 (0.0%) | 0 (0.0%) |
| $2,500 to $4,999 | 0 (0.0%) | 0 (0.0%) |
| $5,000 to $7,499 | 0 (0.0%) | 0 (0.0%) |
| $7,500 to $9,999 | 0 (0.0%) | 0 (0.0%) |
| $10,000 to $12,499 | 0 (0.0%) | 0 (0.0%) |
| $12,500 to $14,999 | 0 (0.0%) | 36 (24.7%) |
| $15,000 to $17,499 | 0 (0.0%) | 0 (0.0%) |
| $17,500 to $19,999 | 0 (0.0%) | 0 (0.0%) |
| $20,000 to $22,499 | 0 (0.0%) | 0 (0.0%) |
| $22,500 to $24,999 | 0 (0.0%) | 0 (0.0%) |
| $25,000 to $29,999 | 0 (0.0%) | 24 (16.4%) |
| $30,000 to $34,999 | 0 (0.0%) | 0 (0.0%) |
| $35,000 to $39,999 | 0 (0.0%) | 11 (7.5%) |
| $40,000 to $44,999 | 0 (0.0%) | 0 (0.0%) |
| $45,000 to $49,999 | 0 (0.0%) | 0 (0.0%) |
| $50,000 to $54,999 | 0 (0.0%) | 0 (0.0%) |
| $55,000 to $64,999 | 0 (0.0%) | 0 (0.0%) |
| $65,000 to $74,999 | 0 (0.0%) | 0 (0.0%) |
| $75,000 to $99,999 | 0 (0.0%) | 75 (51.4%) |
| $100,000+ | 20 (100.0%) | 0 (0.0%) |
| Total | 20 (100.0%) | 146 (100.0%) |
Earnings by Sex by Educational Attainment in Tioga
| Educational Attainment | Male Income | Female Income |
| Less than High School | - | - |
| High School Diploma | - | - |
| College or Associate's Degree | - | - |
| Bachelor's Degree | - | - |
| Graduate Degree | - | - |
| Total | - | - |
Family Income in Tioga
Family Income Brackets in Tioga
According to the Tioga family income data, there are 75 families falling into the $75,000 to $99,999 income range, which is the most common income bracket and makes up 64.1% of all families.
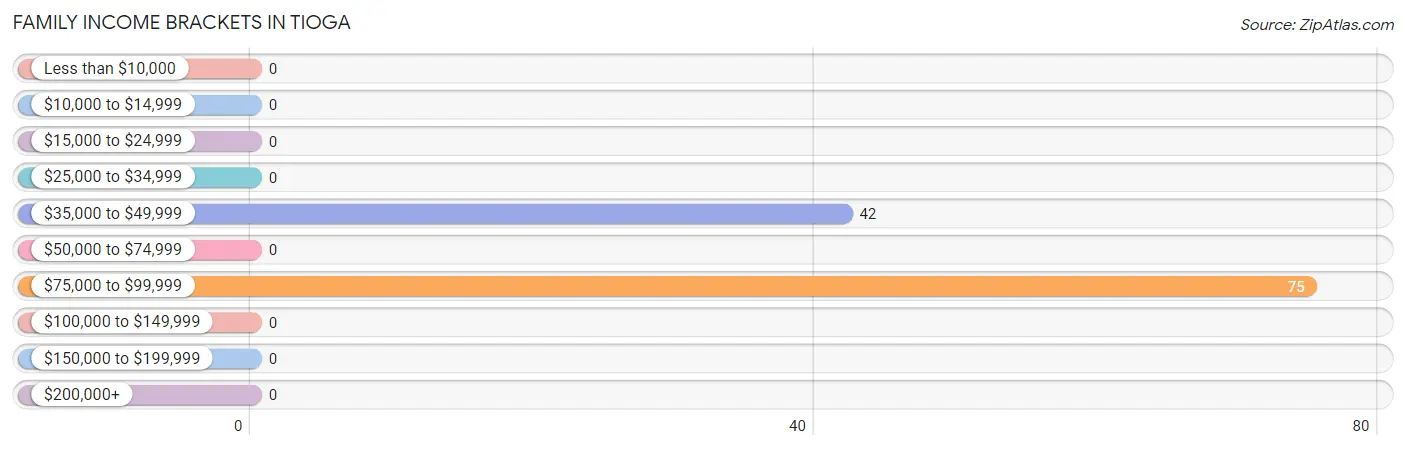
| Income Bracket | # Families | % Families |
| Less than $10,000 | 0 | 0.0% |
| $10,000 to $14,999 | 0 | 0.0% |
| $15,000 to $24,999 | 0 | 0.0% |
| $25,000 to $34,999 | 0 | 0.0% |
| $35,000 to $49,999 | 42 | 35.9% |
| $50,000 to $74,999 | 0 | 0.0% |
| $75,000 to $99,999 | 75 | 64.1% |
| $100,000 to $149,999 | 0 | 0.0% |
| $150,000 to $199,999 | 0 | 0.0% |
| $200,000+ | 0 | 0.0% |
Family Income by Famaliy Size in Tioga
| Income Bracket | # Families | Median Income |
| 2-Person Families | 18 (15.4%) | $0 |
| 3-Person Families | 99 (84.6%) | $0 |
| 4-Person Families | 0 (0.0%) | $0 |
| 5-Person Families | 0 (0.0%) | $0 |
| 6-Person Families | 0 (0.0%) | $0 |
| 7+ Person Families | 0 (0.0%) | $0 |
| Total | 117 (100.0%) | $78,050 |
Family Income by Number of Earners in Tioga
| Number of Earners | # Families | Median Income |
| No Earners | 7 (6.0%) | $0 |
| 1 Earner | 86 (73.5%) | $0 |
| 2 Earners | 24 (20.5%) | $0 |
| 3+ Earners | 0 (0.0%) | $0 |
| Total | 117 (100.0%) | $78,050 |
Household Income in Tioga
Household Income Brackets in Tioga
With 75 households falling in the category, the $75,000 to $99,999 income range is the most frequent in Tioga, accounting for 58.6% of all households.
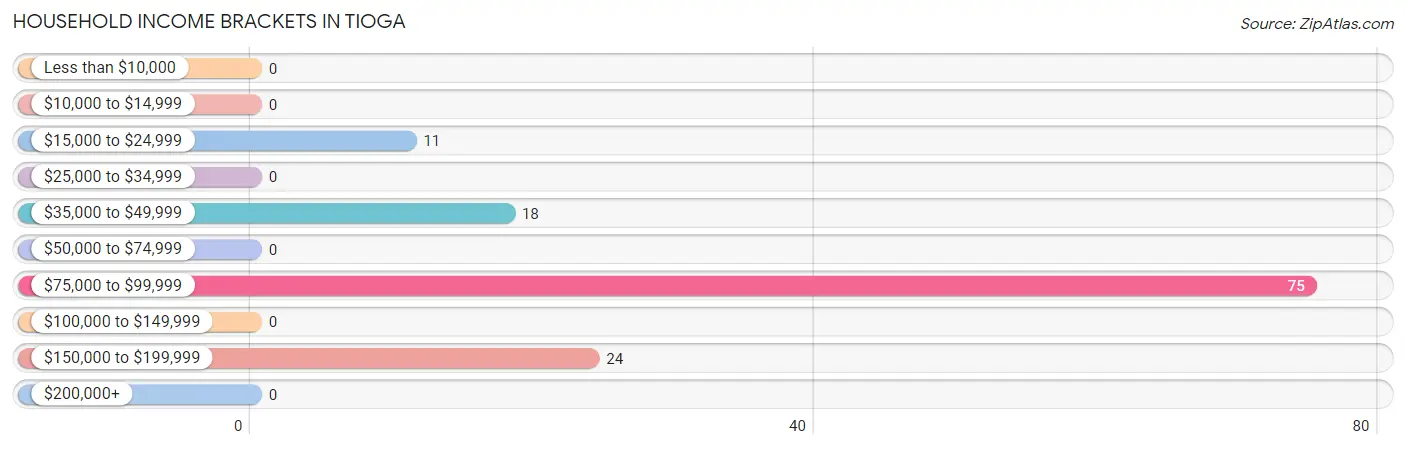
| Income Bracket | # Households | % Households |
| Less than $10,000 | 0 | 0.0% |
| $10,000 to $14,999 | 0 | 0.0% |
| $15,000 to $24,999 | 11 | 8.6% |
| $25,000 to $34,999 | 0 | 0.0% |
| $35,000 to $49,999 | 18 | 14.1% |
| $50,000 to $74,999 | 0 | 0.0% |
| $75,000 to $99,999 | 75 | 58.6% |
| $100,000 to $149,999 | 0 | 0.0% |
| $150,000 to $199,999 | 24 | 18.8% |
| $200,000+ | 0 | 0.0% |
Household Income by Householder Age in Tioga
| Income Bracket | # Households | Median Income |
| 15 to 24 Years | 0 (0.0%) | $0 |
| 25 to 44 Years | 86 (67.2%) | $0 |
| 45 to 64 Years | 35 (27.3%) | $0 |
| 65+ Years | 7 (5.5%) | $0 |
| Total | 128 (100.0%) | $78,667 |
Poverty in Tioga
Income Below Poverty by Sex and Age in Tioga
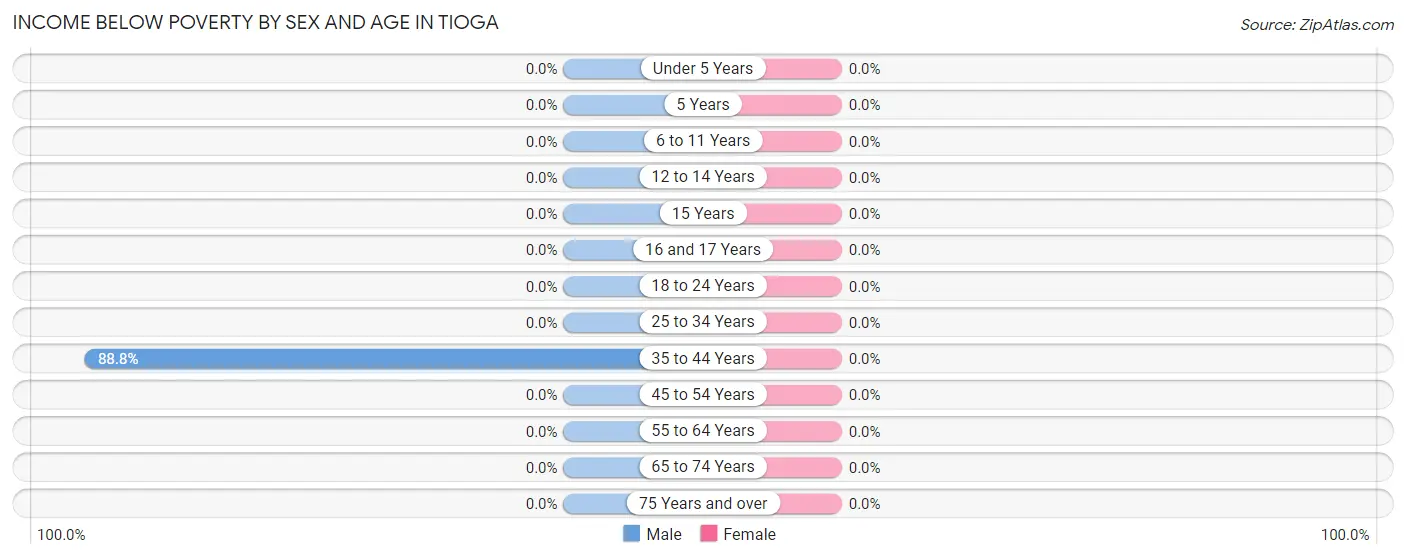
| Age Bracket | Male | Female |
| Under 5 Years | 0 (0.0%) | 0 (0.0%) |
| 5 Years | 0 (0.0%) | 0 (0.0%) |
| 6 to 11 Years | 0 (0.0%) | 0 (0.0%) |
| 12 to 14 Years | 0 (0.0%) | 0 (0.0%) |
| 15 Years | 0 (0.0%) | 0 (0.0%) |
| 16 and 17 Years | 0 (0.0%) | 0 (0.0%) |
| 18 to 24 Years | 0 (0.0%) | 0 (0.0%) |
| 25 to 34 Years | 0 (0.0%) | 0 (0.0%) |
| 35 to 44 Years | 87 (88.8%) | 0 (0.0%) |
| 45 to 54 Years | 0 (0.0%) | 0 (0.0%) |
| 55 to 64 Years | 0 (0.0%) | 0 (0.0%) |
| 65 to 74 Years | 0 (0.0%) | 0 (0.0%) |
| 75 Years and over | 0 (0.0%) | 0 (0.0%) |
| Total | 87 (25.2%) | 0 (0.0%) |
Income Above Poverty by Sex and Age in Tioga
According to the poverty statistics in Tioga, males aged 6 to 11 years and females aged 18 to 24 years are the age groups that are most secure financially, with 100.0% of males and 100.0% of females in these age groups living above the poverty line.
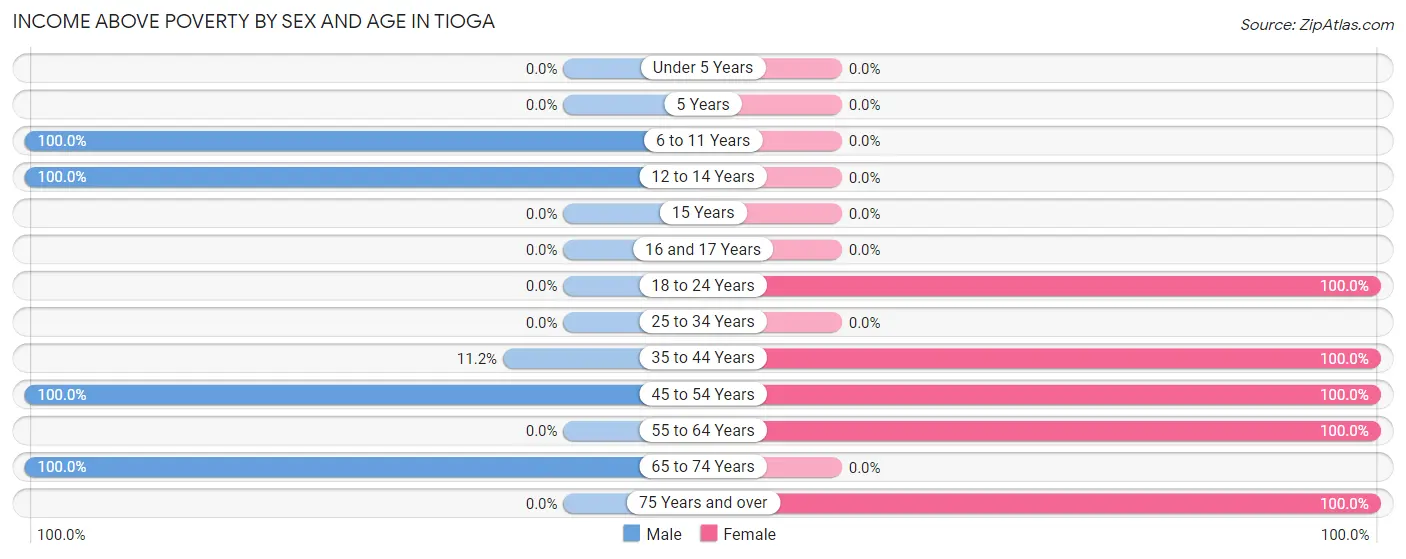
| Age Bracket | Male | Female |
| Under 5 Years | 0 (0.0%) | 0 (0.0%) |
| 5 Years | 0 (0.0%) | 0 (0.0%) |
| 6 to 11 Years | 93 (100.0%) | 0 (0.0%) |
| 12 to 14 Years | 117 (100.0%) | 0 (0.0%) |
| 15 Years | 0 (0.0%) | 0 (0.0%) |
| 16 and 17 Years | 0 (0.0%) | 0 (0.0%) |
| 18 to 24 Years | 0 (0.0%) | 36 (100.0%) |
| 25 to 34 Years | 0 (0.0%) | 0 (0.0%) |
| 35 to 44 Years | 11 (11.2%) | 75 (100.0%) |
| 45 to 54 Years | 20 (100.0%) | 24 (100.0%) |
| 55 to 64 Years | 0 (0.0%) | 58 (100.0%) |
| 65 to 74 Years | 17 (100.0%) | 0 (0.0%) |
| 75 Years and over | 0 (0.0%) | 7 (100.0%) |
| Total | 258 (74.8%) | 200 (100.0%) |
Income Below Poverty Among Married-Couple Families in Tioga
| Children | Above Poverty | Below Poverty |
| No Children | 11 (100.0%) | 0 (0.0%) |
| 1 or 2 Children | 0 (0.0%) | 0 (0.0%) |
| 3 or 4 Children | 0 (0.0%) | 0 (0.0%) |
| 5 or more Children | 0 (0.0%) | 0 (0.0%) |
| Total | 11 (100.0%) | 0 (0.0%) |
Income Below Poverty Among Single-Parent Households in Tioga
| Children | Single Father | Single Mother |
| No Children | 0 (0.0%) | 0 (0.0%) |
| 1 or 2 Children | 0 (0.0%) | 0 (0.0%) |
| 3 or 4 Children | 0 (0.0%) | 0 (0.0%) |
| 5 or more Children | 0 (0.0%) | 0 (0.0%) |
| Total | 0 (0.0%) | 0 (0.0%) |
Income Below Poverty Among Married-Couple vs Single-Parent Households in Tioga
| Children | Married-Couple Families | Single-Parent Households |
| No Children | 0 (0.0%) | 0 (0.0%) |
| 1 or 2 Children | 0 (0.0%) | 0 (0.0%) |
| 3 or 4 Children | 0 (0.0%) | 0 (0.0%) |
| 5 or more Children | 0 (0.0%) | 0 (0.0%) |
| Total | 0 (0.0%) | 0 (0.0%) |
Race in Tioga
The most populous races in Tioga are White / Caucasian (534 | 98.0%), and Two or more Races (11 | 2.0%).
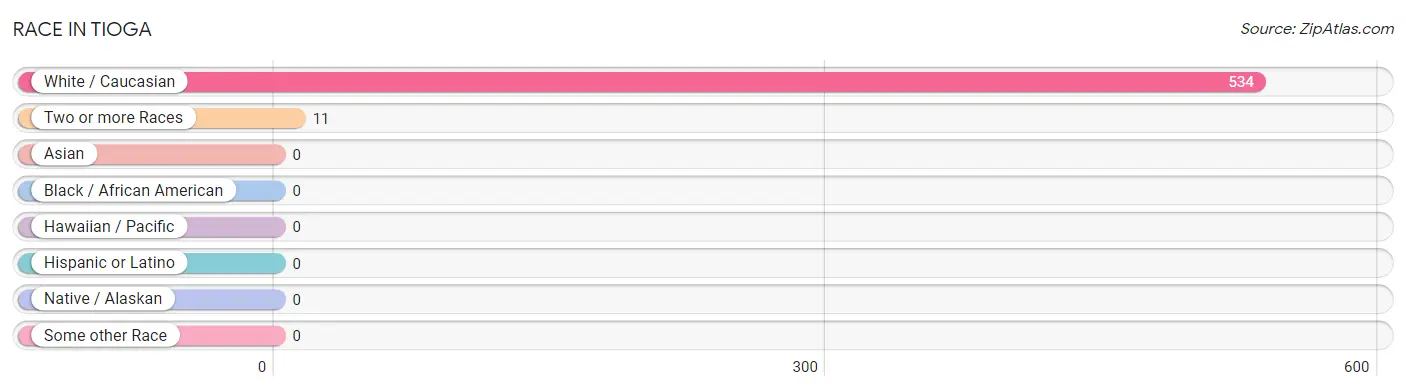
| Race | # Population | % Population |
| Asian | 0 | 0.0% |
| Black / African American | 0 | 0.0% |
| Hawaiian / Pacific | 0 | 0.0% |
| Hispanic or Latino | 0 | 0.0% |
| Native / Alaskan | 0 | 0.0% |
| White / Caucasian | 534 | 98.0% |
| Two or more Races | 11 | 2.0% |
| Some other Race | 0 | 0.0% |
| Total | 545 | 100.0% |
Ancestry in Tioga
The most populous ancestries reported in Tioga are English (348 | 63.8%), Irish (47 | 8.6%), American (24 | 4.4%), and German (20 | 3.7%), together accounting for 80.5% of all Tioga residents.
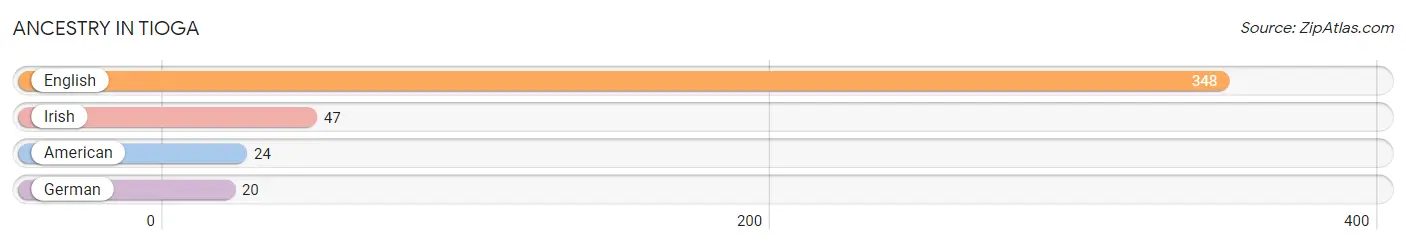
| Ancestry | # Population | % Population |
| American | 24 | 4.4% |
| English | 348 | 63.8% |
| German | 20 | 3.7% |
| Irish | 47 | 8.6% | View All 4 Rows |
Immigrants in Tioga

| Immigration Origin | # Population | % Population | View All 0 Rows |
Sex and Age in Tioga
Sex and Age in Tioga
The most populous age groups in Tioga are 10 to 14 Years (210 | 60.9%) for men and 35 to 39 Years (75 | 37.5%) for women.
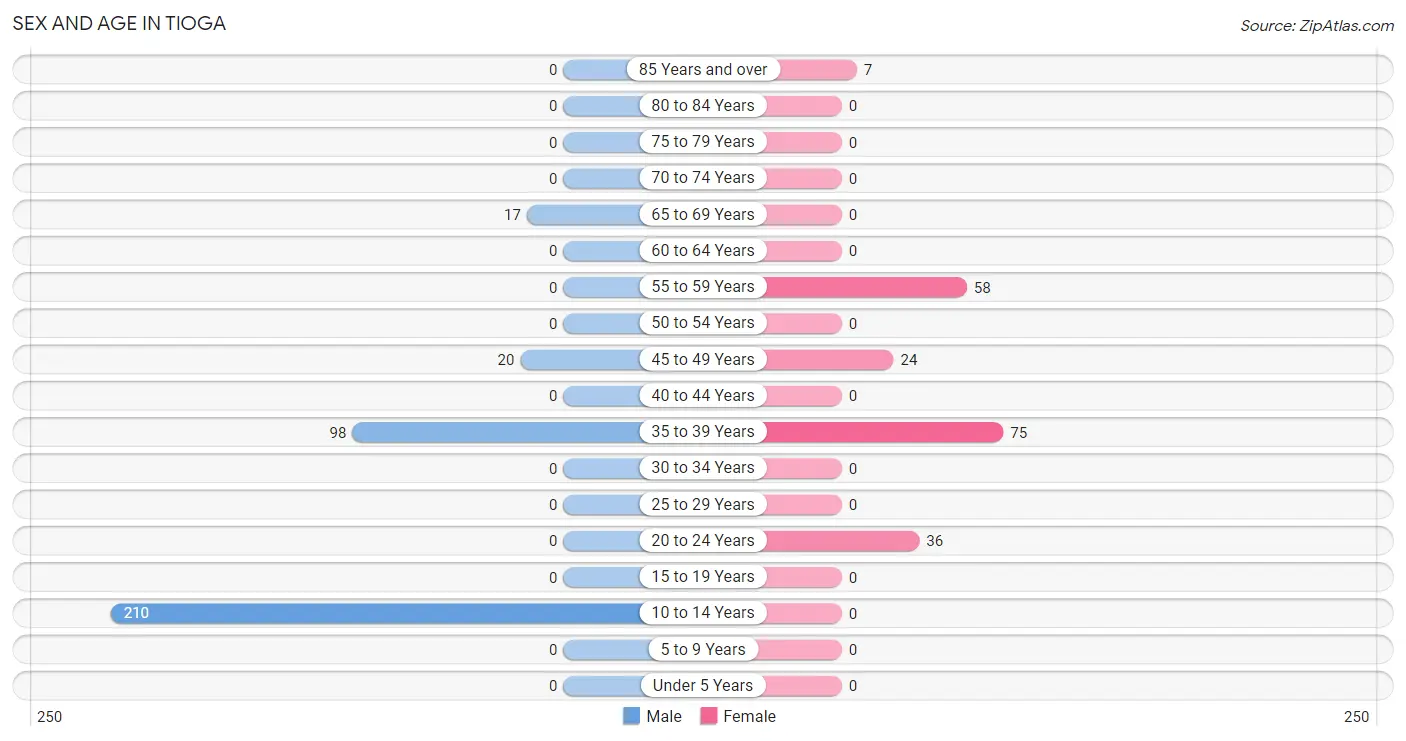
| Age Bracket | Male | Female |
| Under 5 Years | 0 (0.0%) | 0 (0.0%) |
| 5 to 9 Years | 0 (0.0%) | 0 (0.0%) |
| 10 to 14 Years | 210 (60.9%) | 0 (0.0%) |
| 15 to 19 Years | 0 (0.0%) | 0 (0.0%) |
| 20 to 24 Years | 0 (0.0%) | 36 (18.0%) |
| 25 to 29 Years | 0 (0.0%) | 0 (0.0%) |
| 30 to 34 Years | 0 (0.0%) | 0 (0.0%) |
| 35 to 39 Years | 98 (28.4%) | 75 (37.5%) |
| 40 to 44 Years | 0 (0.0%) | 0 (0.0%) |
| 45 to 49 Years | 20 (5.8%) | 24 (12.0%) |
| 50 to 54 Years | 0 (0.0%) | 0 (0.0%) |
| 55 to 59 Years | 0 (0.0%) | 58 (29.0%) |
| 60 to 64 Years | 0 (0.0%) | 0 (0.0%) |
| 65 to 69 Years | 17 (4.9%) | 0 (0.0%) |
| 70 to 74 Years | 0 (0.0%) | 0 (0.0%) |
| 75 to 79 Years | 0 (0.0%) | 0 (0.0%) |
| 80 to 84 Years | 0 (0.0%) | 0 (0.0%) |
| 85 Years and over | 0 (0.0%) | 7 (3.5%) |
| Total | 345 (100.0%) | 200 (100.0%) |
Families and Households in Tioga
Median Family Size in Tioga
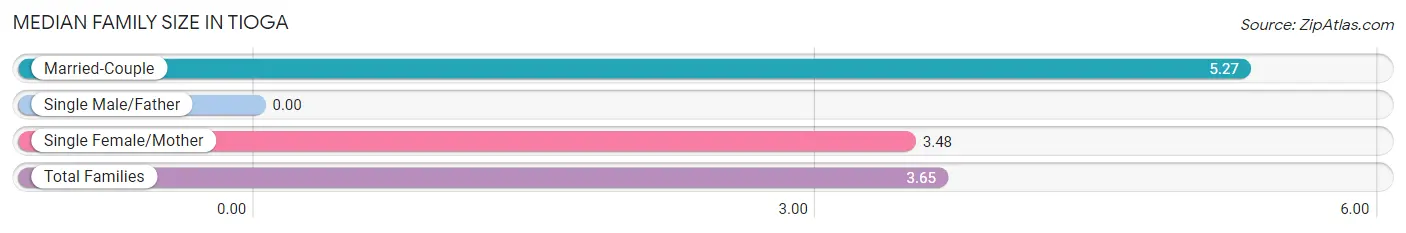
| Family Type | # Families | Family Size |
| Married-Couple | 11 (9.4%) | 5.27 |
| Single Male/Father | 0 (0.0%) | - |
| Single Female/Mother | 106 (90.6%) | 3.48 |
| Total Families | 117 (100.0%) | 3.65 |
Median Household Size in Tioga
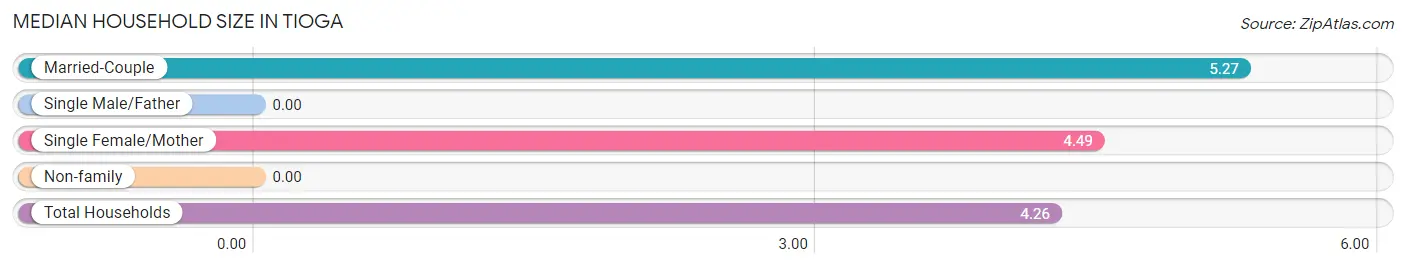
| Household Type | # Households | Household Size |
| Married-Couple | 11 (8.6%) | 5.27 |
| Single Male/Father | 0 (0.0%) | - |
| Single Female/Mother | 106 (82.8%) | 4.49 |
| Non-family | 11 (8.6%) | - |
| Total Households | 128 (100.0%) | 4.26 |
Household Size by Marriage Status in Tioga
Out of a total of 128 households in Tioga, 117 (91.4%) are family households, while 11 (8.6%) are nonfamily households. The most numerous type of family households are 4-person households, comprising 99, and the most common type of nonfamily households are 1-person households, comprising 11.
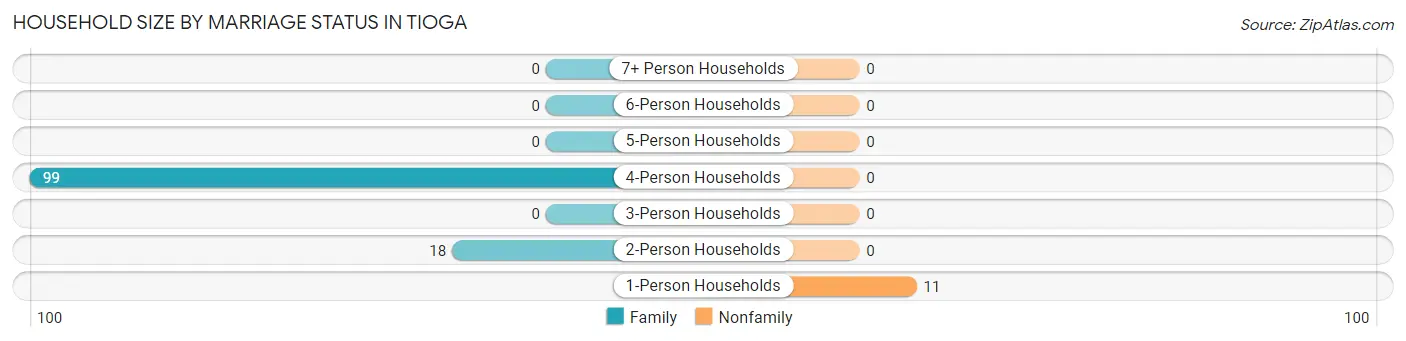
| Household Size | Family Households | Nonfamily Households |
| 1-Person Households | - | 11 (8.6%) |
| 2-Person Households | 18 (14.1%) | 0 (0.0%) |
| 3-Person Households | 0 (0.0%) | 0 (0.0%) |
| 4-Person Households | 99 (77.3%) | 0 (0.0%) |
| 5-Person Households | 0 (0.0%) | 0 (0.0%) |
| 6-Person Households | 0 (0.0%) | 0 (0.0%) |
| 7+ Person Households | 0 (0.0%) | 0 (0.0%) |
| Total | 117 (91.4%) | 11 (8.6%) |
Female Fertility in Tioga
Fertility by Age in Tioga
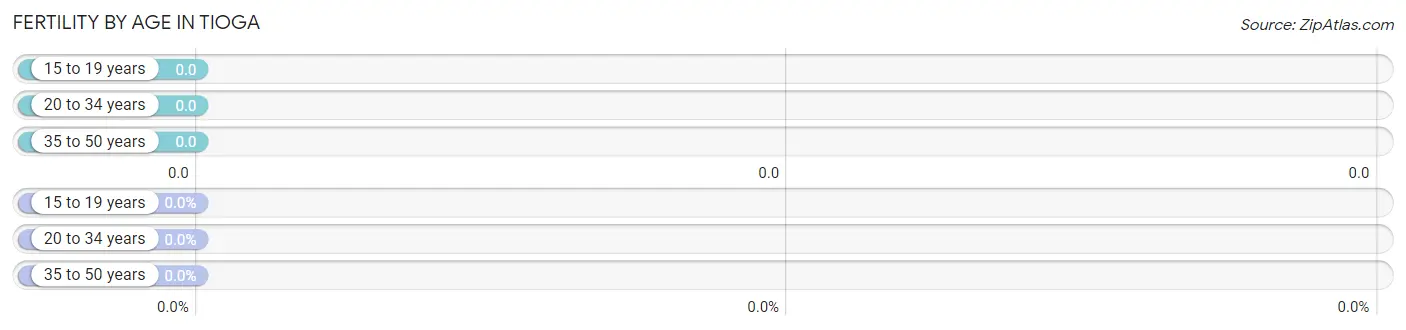
| Age Bracket | Women with Births | Births / 1,000 Women |
| 15 to 19 years | 0 (0.0%) | 0.0 |
| 20 to 34 years | 0 (0.0%) | 0.0 |
| 35 to 50 years | 0 (0.0%) | 0.0 |
| Total | 0 (0.0%) | 0.0 |
Fertility by Age by Marriage Status in Tioga
| Age Bracket | Married | Unmarried |
| 15 to 19 years | 0 (0.0%) | 0 (0.0%) |
| 20 to 34 years | 0 (0.0%) | 0 (0.0%) |
| 35 to 50 years | 0 (0.0%) | 0 (0.0%) |
| Total | 0 (0.0%) | 0 (0.0%) |
Fertility by Education in Tioga
| Educational Attainment | Women with Births | Births / 1,000 Women |
| Less than High School | 0 (0.0%) | 0.0 |
| High School Diploma | 0 (0.0%) | 0.0 |
| College or Associate's Degree | 0 (0.0%) | 0.0 |
| Bachelor's Degree | 0 (0.0%) | 0.0 |
| Graduate Degree | 0 (0.0%) | 0.0 |
| Total | 0 (0.0%) | 0.0 |
Fertility by Education by Marriage Status in Tioga
| Educational Attainment | Married | Unmarried |
| Less than High School | 0 (0.0%) | 0 (0.0%) |
| High School Diploma | 0 (0.0%) | 0 (0.0%) |
| College or Associate's Degree | 0 (0.0%) | 0 (0.0%) |
| Bachelor's Degree | 0 (0.0%) | 0 (0.0%) |
| Graduate Degree | 0 (0.0%) | 0 (0.0%) |
| Total | 0 (0.0%) | 0 (0.0%) |
Employment Characteristics in Tioga
Employment by Class of Employer in Tioga
Among the 166 employed individuals in Tioga, private company employees (91 | 54.8%), and state government employees (75 | 45.2%) make up the most common classes of employment.
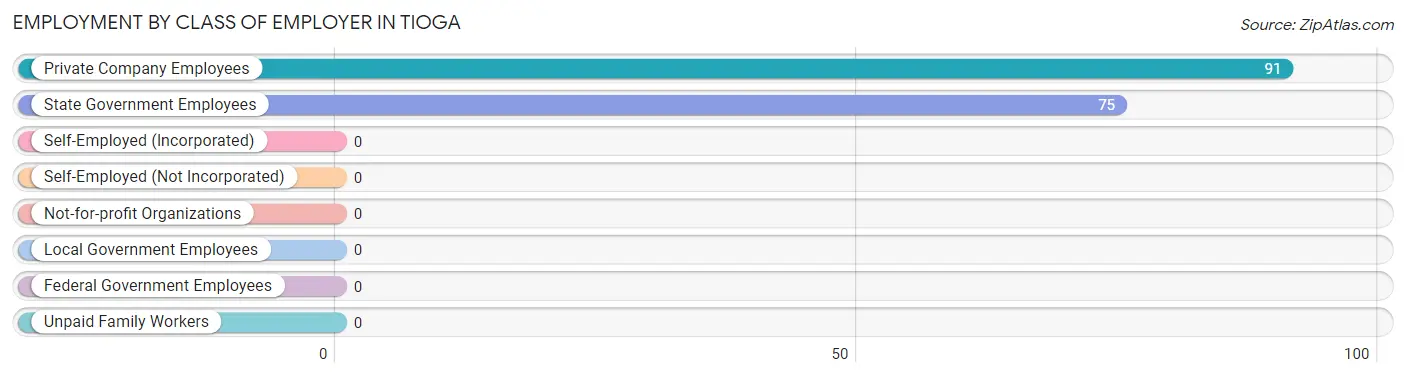
| Employer Class | # Employees | % Employees |
| Private Company Employees | 91 | 54.8% |
| Self-Employed (Incorporated) | 0 | 0.0% |
| Self-Employed (Not Incorporated) | 0 | 0.0% |
| Not-for-profit Organizations | 0 | 0.0% |
| Local Government Employees | 0 | 0.0% |
| State Government Employees | 75 | 45.2% |
| Federal Government Employees | 0 | 0.0% |
| Unpaid Family Workers | 0 | 0.0% |
| Total | 166 | 100.0% |
Employment Status by Age in Tioga
According to the labor force statistics for Tioga, out of the total population over 16 years of age (335), 63.6% or 213 individuals are in the labor force, with 22.1% or 47 of them unemployed. The age group with the highest labor force participation rate is 20 to 24 years, with 100.0% or 36 individuals in the labor force. Within the labor force, the 55 to 59 years age range has the highest percentage of unemployed individuals, with 81.0% or 47 of them being unemployed.
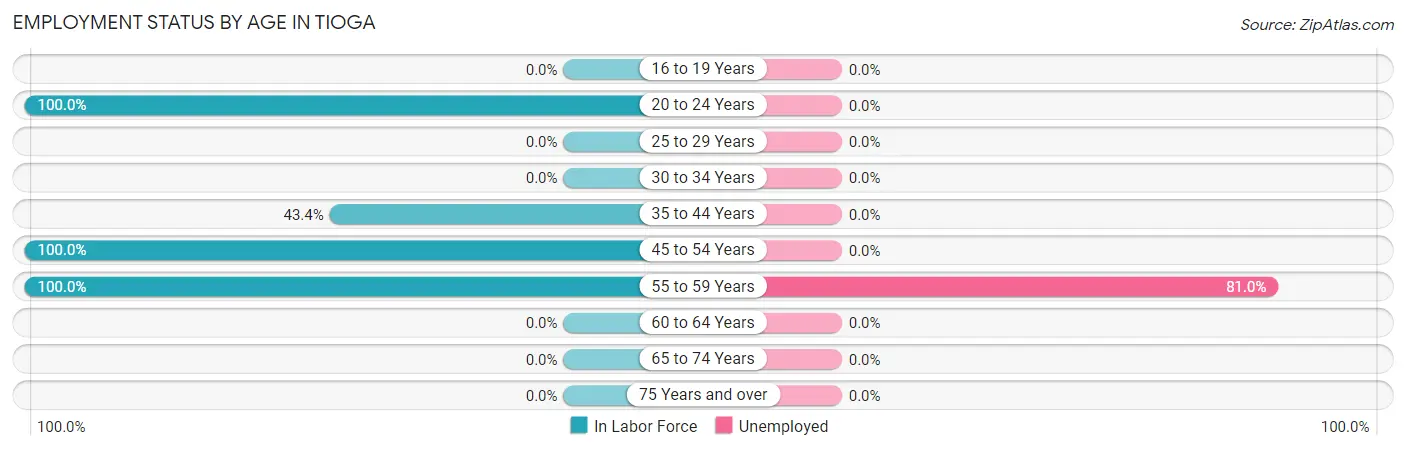
| Age Bracket | In Labor Force | Unemployed |
| 16 to 19 Years | 0 (0.0%) | 0 (0.0%) |
| 20 to 24 Years | 36 (100.0%) | 0 (0.0%) |
| 25 to 29 Years | 0 (0.0%) | 0 (0.0%) |
| 30 to 34 Years | 0 (0.0%) | 0 (0.0%) |
| 35 to 44 Years | 75 (43.4%) | 0 (0.0%) |
| 45 to 54 Years | 44 (100.0%) | 0 (0.0%) |
| 55 to 59 Years | 58 (100.0%) | 47 (81.0%) |
| 60 to 64 Years | 0 (0.0%) | 0 (0.0%) |
| 65 to 74 Years | 0 (0.0%) | 0 (0.0%) |
| 75 Years and over | 0 (0.0%) | 0 (0.0%) |
| Total | 213 (63.6%) | 47 (22.1%) |
Employment Status by Educational Attainment in Tioga
According to labor force statistics for Tioga, 64.4% of individuals (177) out of the total population between 25 and 64 years of age (275) are in the labor force, with 26.6% or 47 of them being unemployed. The group with the highest labor force participation rate are those with the educational attainment of college / associate degree, with 100.0% or 11 individuals in the labor force. Within the labor force, individuals with high school diploma education have the highest percentage of unemployment, with 51.6% or 47 of them being unemployed.
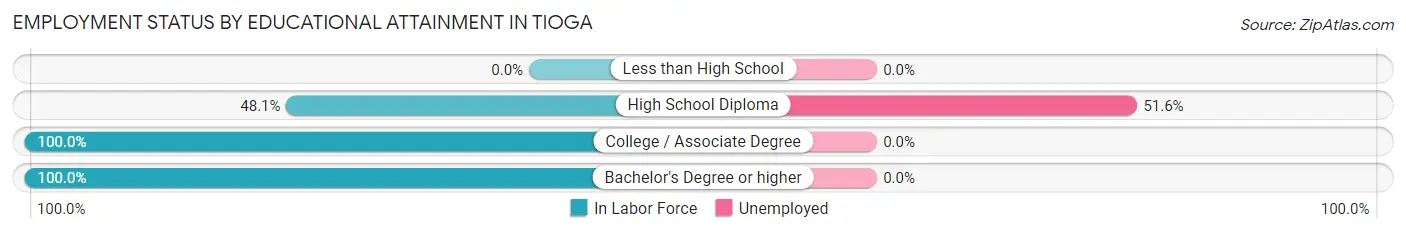
| Educational Attainment | In Labor Force | Unemployed |
| Less than High School | 0 (0.0%) | 0 (0.0%) |
| High School Diploma | 91 (48.1%) | 98 (51.6%) |
| College / Associate Degree | 11 (100.0%) | 0 (0.0%) |
| Bachelor's Degree or higher | 75 (100.0%) | 0 (0.0%) |
| Total | 177 (64.4%) | 73 (26.6%) |
Employment Occupations by Sex in Tioga
Management, Business, Science and Arts Occupations
The most common Management, Business, Science and Arts occupations in Tioga are Community & Social Service (75 | 45.2%), Education, Arts & Media (75 | 45.2%), and Management (11 | 6.6%).
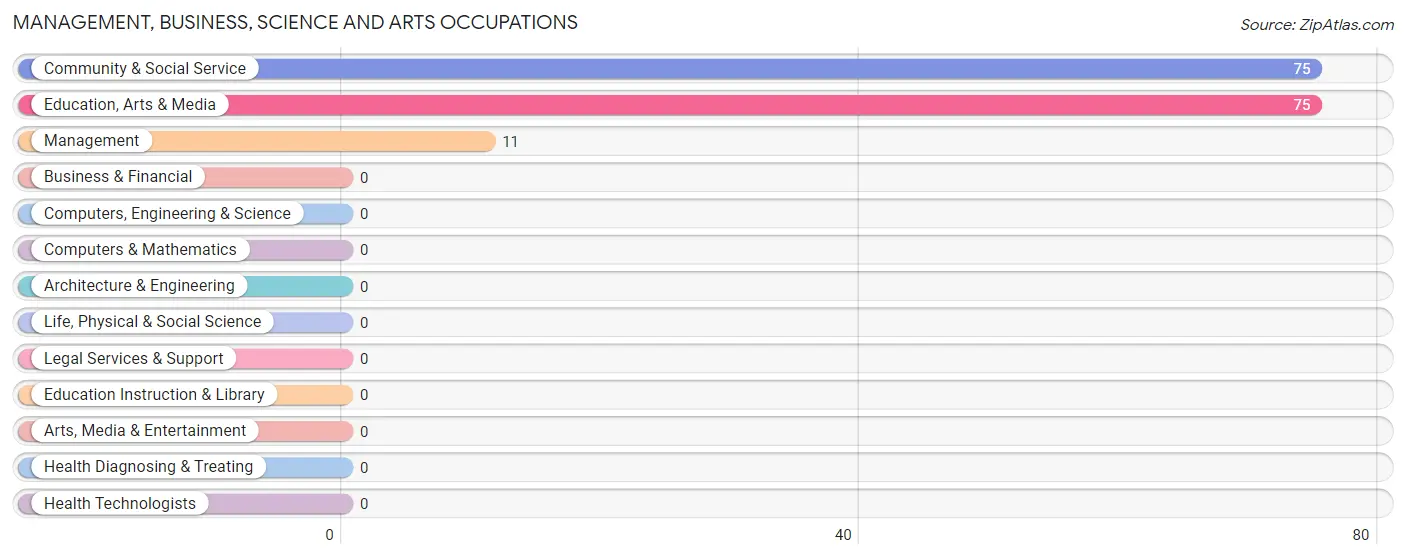
Management, Business, Science and Arts Occupations by Sex
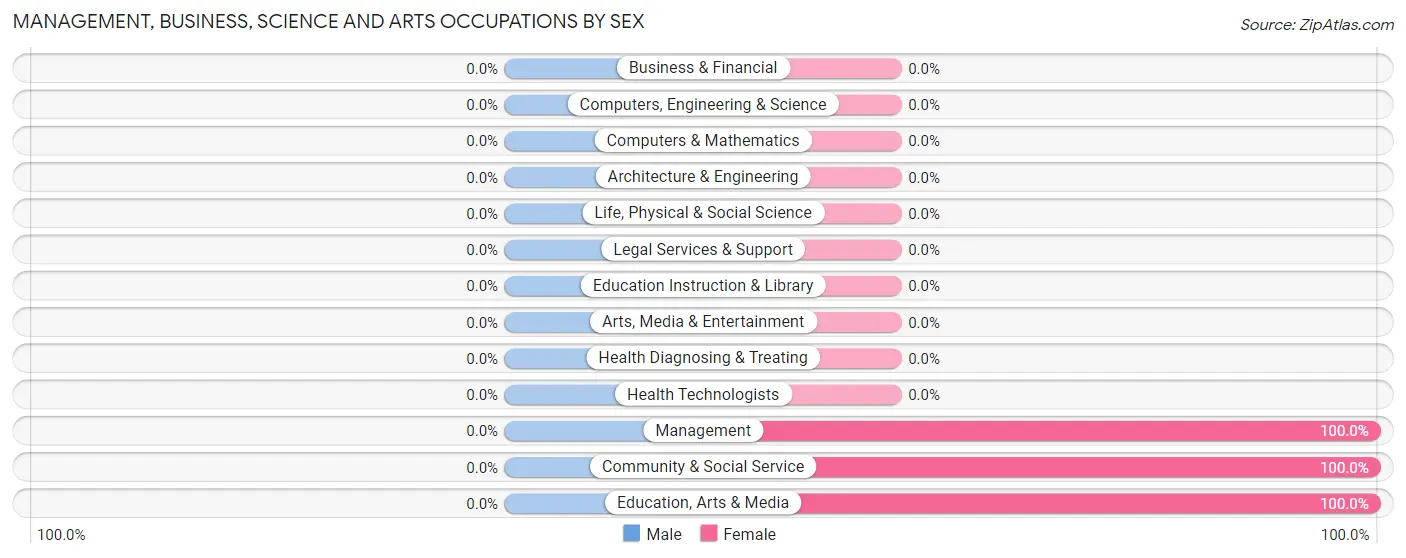
| Occupation | Male | Female |
| Management | 0 (0.0%) | 11 (100.0%) |
| Business & Financial | 0 (0.0%) | 0 (0.0%) |
| Computers, Engineering & Science | 0 (0.0%) | 0 (0.0%) |
| Computers & Mathematics | 0 (0.0%) | 0 (0.0%) |
| Architecture & Engineering | 0 (0.0%) | 0 (0.0%) |
| Life, Physical & Social Science | 0 (0.0%) | 0 (0.0%) |
| Community & Social Service | 0 (0.0%) | 75 (100.0%) |
| Education, Arts & Media | 0 (0.0%) | 75 (100.0%) |
| Legal Services & Support | 0 (0.0%) | 0 (0.0%) |
| Education Instruction & Library | 0 (0.0%) | 0 (0.0%) |
| Arts, Media & Entertainment | 0 (0.0%) | 0 (0.0%) |
| Health Diagnosing & Treating | 0 (0.0%) | 0 (0.0%) |
| Health Technologists | 0 (0.0%) | 0 (0.0%) |
| Total (Category) | 0 (0.0%) | 86 (100.0%) |
| Total (Overall) | 20 (12.0%) | 146 (87.9%) |
Services Occupations
The most common Services occupations in Tioga are , and Food Preparation & Serving (36 | 21.7%).
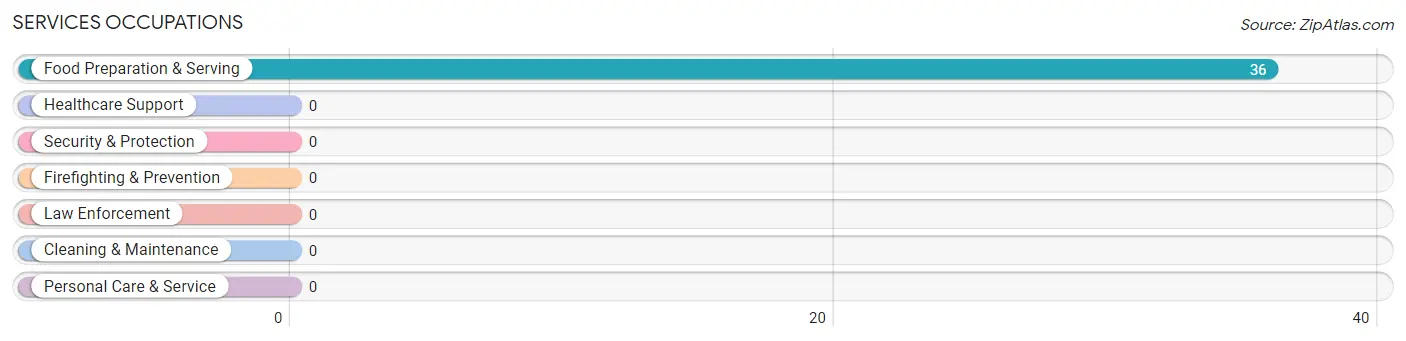
Services Occupations by Sex
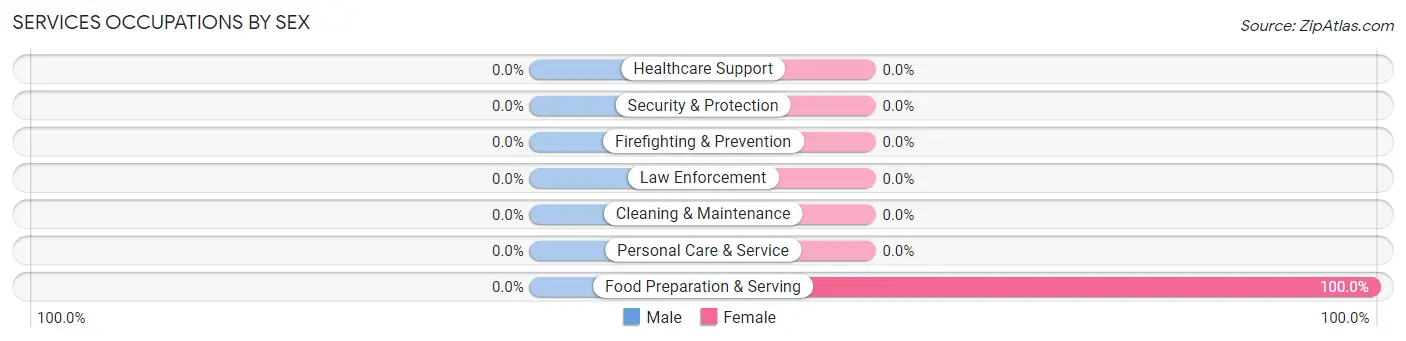
| Occupation | Male | Female |
| Healthcare Support | 0 (0.0%) | 0 (0.0%) |
| Security & Protection | 0 (0.0%) | 0 (0.0%) |
| Firefighting & Prevention | 0 (0.0%) | 0 (0.0%) |
| Law Enforcement | 0 (0.0%) | 0 (0.0%) |
| Food Preparation & Serving | 0 (0.0%) | 36 (100.0%) |
| Cleaning & Maintenance | 0 (0.0%) | 0 (0.0%) |
| Personal Care & Service | 0 (0.0%) | 0 (0.0%) |
| Total (Category) | 0 (0.0%) | 36 (100.0%) |
| Total (Overall) | 20 (12.0%) | 146 (87.9%) |
Sales and Office Occupations
The most common Sales and Office occupations in Tioga are , and Sales & Related (24 | 14.5%).
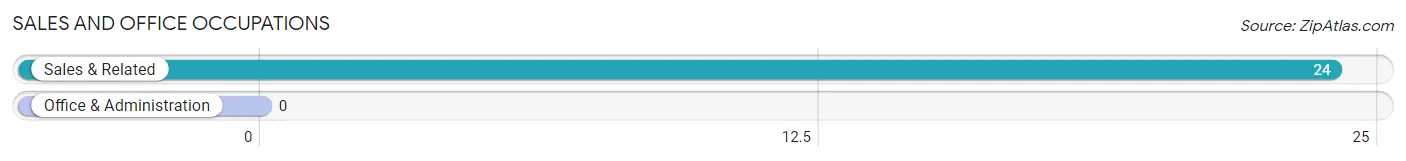
Sales and Office Occupations by Sex

| Occupation | Male | Female |
| Sales & Related | 0 (0.0%) | 24 (100.0%) |
| Office & Administration | 0 (0.0%) | 0 (0.0%) |
| Total (Category) | 0 (0.0%) | 24 (100.0%) |
| Total (Overall) | 20 (12.0%) | 146 (87.9%) |
Natural Resources, Construction and Maintenance Occupations
The most common Natural Resources, Construction and Maintenance occupations in Tioga are , and Construction & Extraction (20 | 12.0%).
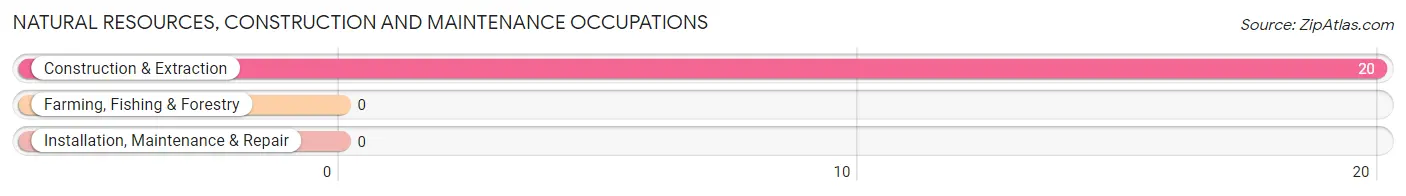
Natural Resources, Construction and Maintenance Occupations by Sex
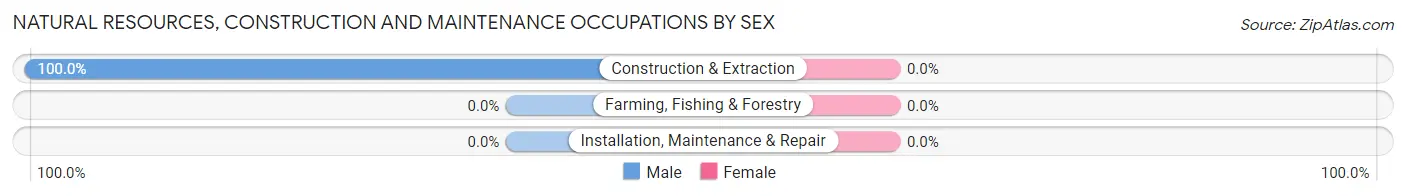
| Occupation | Male | Female |
| Farming, Fishing & Forestry | 0 (0.0%) | 0 (0.0%) |
| Construction & Extraction | 20 (100.0%) | 0 (0.0%) |
| Installation, Maintenance & Repair | 0 (0.0%) | 0 (0.0%) |
| Total (Category) | 20 (100.0%) | 0 (0.0%) |
| Total (Overall) | 20 (12.0%) | 146 (87.9%) |
Production, Transportation and Moving Occupations
Production, Transportation and Moving Occupations by Sex
| Occupation | Male | Female |
| Production | 0 (0.0%) | 0 (0.0%) |
| Transportation | 0 (0.0%) | 0 (0.0%) |
| Material Moving | 0 (0.0%) | 0 (0.0%) |
| Total (Category) | 0 (0.0%) | 0 (0.0%) |
| Total (Overall) | 20 (12.0%) | 146 (87.9%) |
Employment Industries by Sex in Tioga
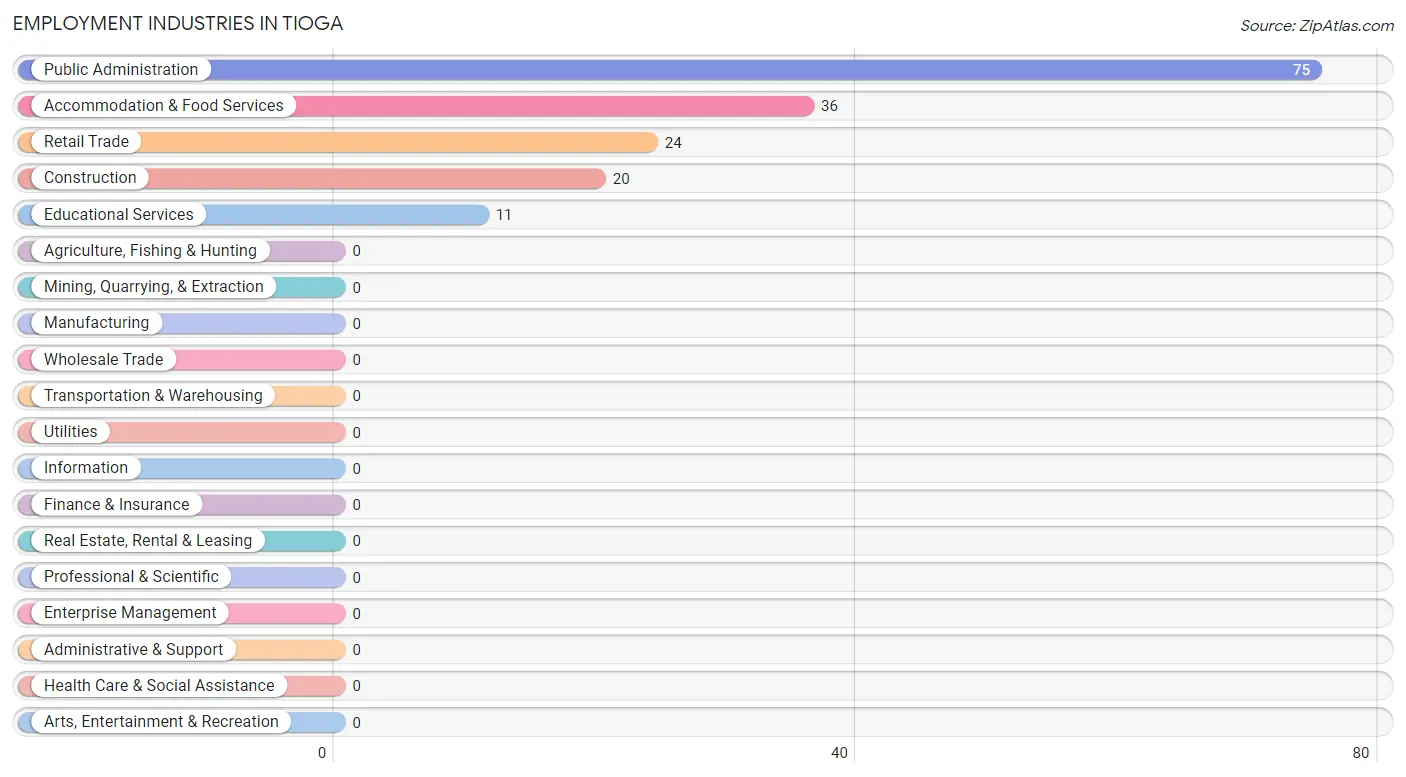
Employment Industries in Tioga
The major employment industries in Tioga include Public Administration (75 | 45.2%), Accommodation & Food Services (36 | 21.7%), Retail Trade (24 | 14.5%), Construction (20 | 12.0%), and Educational Services (11 | 6.6%).
Employment Industries by Sex in Tioga
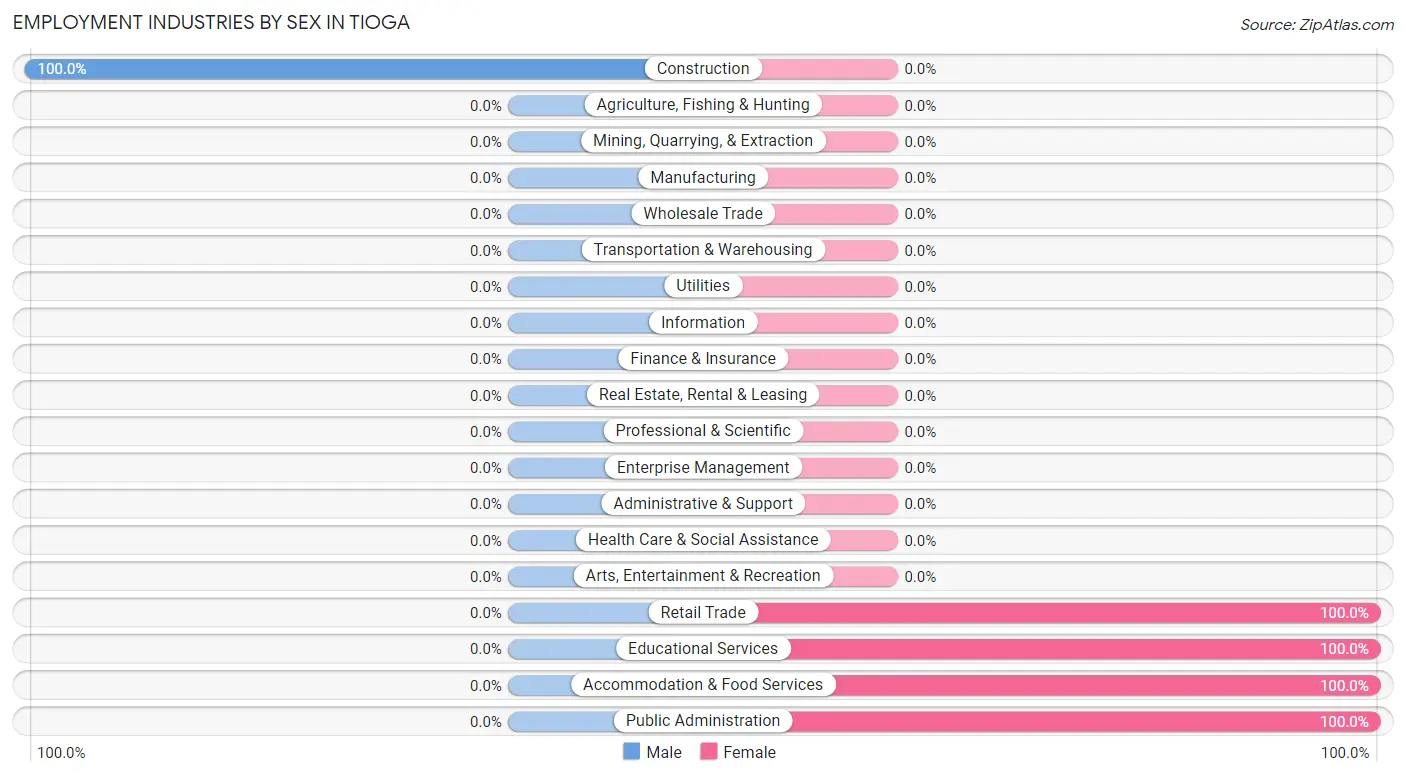
| Industry | Male | Female |
| Agriculture, Fishing & Hunting | 0 (0.0%) | 0 (0.0%) |
| Mining, Quarrying, & Extraction | 0 (0.0%) | 0 (0.0%) |
| Construction | 20 (100.0%) | 0 (0.0%) |
| Manufacturing | 0 (0.0%) | 0 (0.0%) |
| Wholesale Trade | 0 (0.0%) | 0 (0.0%) |
| Retail Trade | 0 (0.0%) | 24 (100.0%) |
| Transportation & Warehousing | 0 (0.0%) | 0 (0.0%) |
| Utilities | 0 (0.0%) | 0 (0.0%) |
| Information | 0 (0.0%) | 0 (0.0%) |
| Finance & Insurance | 0 (0.0%) | 0 (0.0%) |
| Real Estate, Rental & Leasing | 0 (0.0%) | 0 (0.0%) |
| Professional & Scientific | 0 (0.0%) | 0 (0.0%) |
| Enterprise Management | 0 (0.0%) | 0 (0.0%) |
| Administrative & Support | 0 (0.0%) | 0 (0.0%) |
| Educational Services | 0 (0.0%) | 11 (100.0%) |
| Health Care & Social Assistance | 0 (0.0%) | 0 (0.0%) |
| Arts, Entertainment & Recreation | 0 (0.0%) | 0 (0.0%) |
| Accommodation & Food Services | 0 (0.0%) | 36 (100.0%) |
| Public Administration | 0 (0.0%) | 75 (100.0%) |
| Total | 20 (12.0%) | 146 (87.9%) |
Education in Tioga
School Enrollment in Tioga
The most common levels of schooling among the 210 students in Tioga are middle school (117 | 55.7%), and elementary school (93 | 44.3%).
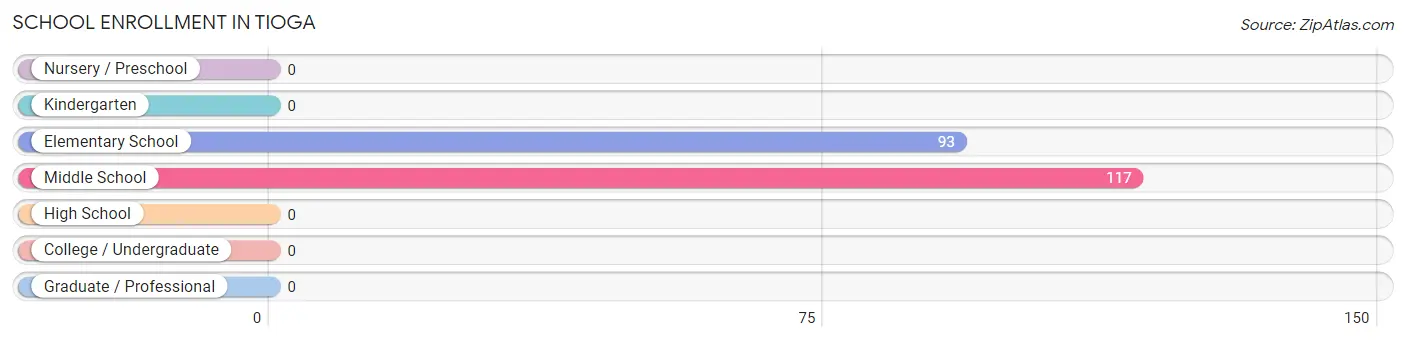
| School Level | # Students | % Students |
| Nursery / Preschool | 0 | 0.0% |
| Kindergarten | 0 | 0.0% |
| Elementary School | 93 | 44.3% |
| Middle School | 117 | 55.7% |
| High School | 0 | 0.0% |
| College / Undergraduate | 0 | 0.0% |
| Graduate / Professional | 0 | 0.0% |
| Total | 210 | 100.0% |
School Enrollment by Age by Funding Source in Tioga
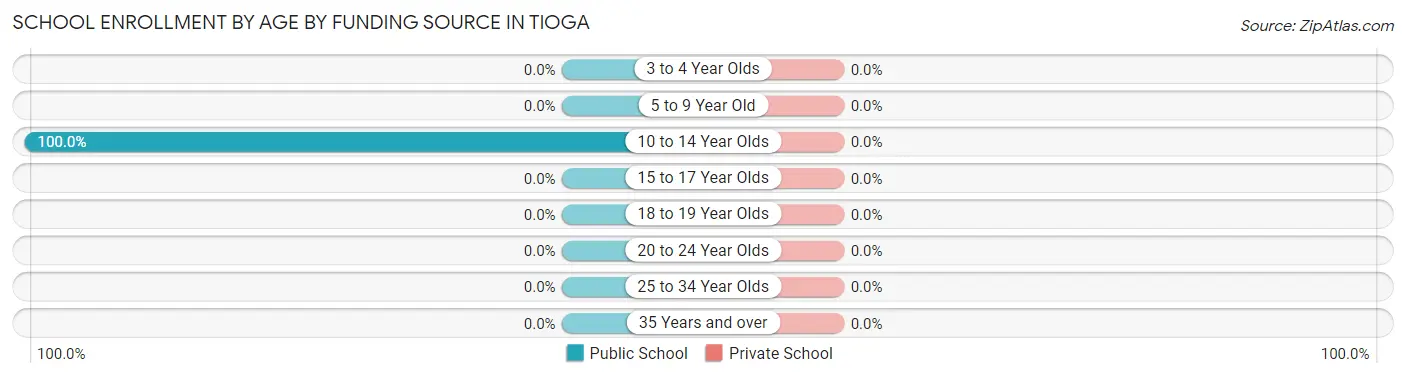
| Age Bracket | Public School | Private School |
| 3 to 4 Year Olds | 0 (0.0%) | 0 (0.0%) |
| 5 to 9 Year Old | 0 (0.0%) | 0 (0.0%) |
| 10 to 14 Year Olds | 210 (100.0%) | 0 (0.0%) |
| 15 to 17 Year Olds | 0 (0.0%) | 0 (0.0%) |
| 18 to 19 Year Olds | 0 (0.0%) | 0 (0.0%) |
| 20 to 24 Year Olds | 0 (0.0%) | 0 (0.0%) |
| 25 to 34 Year Olds | 0 (0.0%) | 0 (0.0%) |
| 35 Years and over | 0 (0.0%) | 0 (0.0%) |
| Total | 210 (100.0%) | 0 (0.0%) |
Educational Attainment by Field of Study in Tioga
, and psychology (75 | 100.0%) are the most common fields of study among 75 individuals in Tioga who have obtained a bachelor's degree or higher.
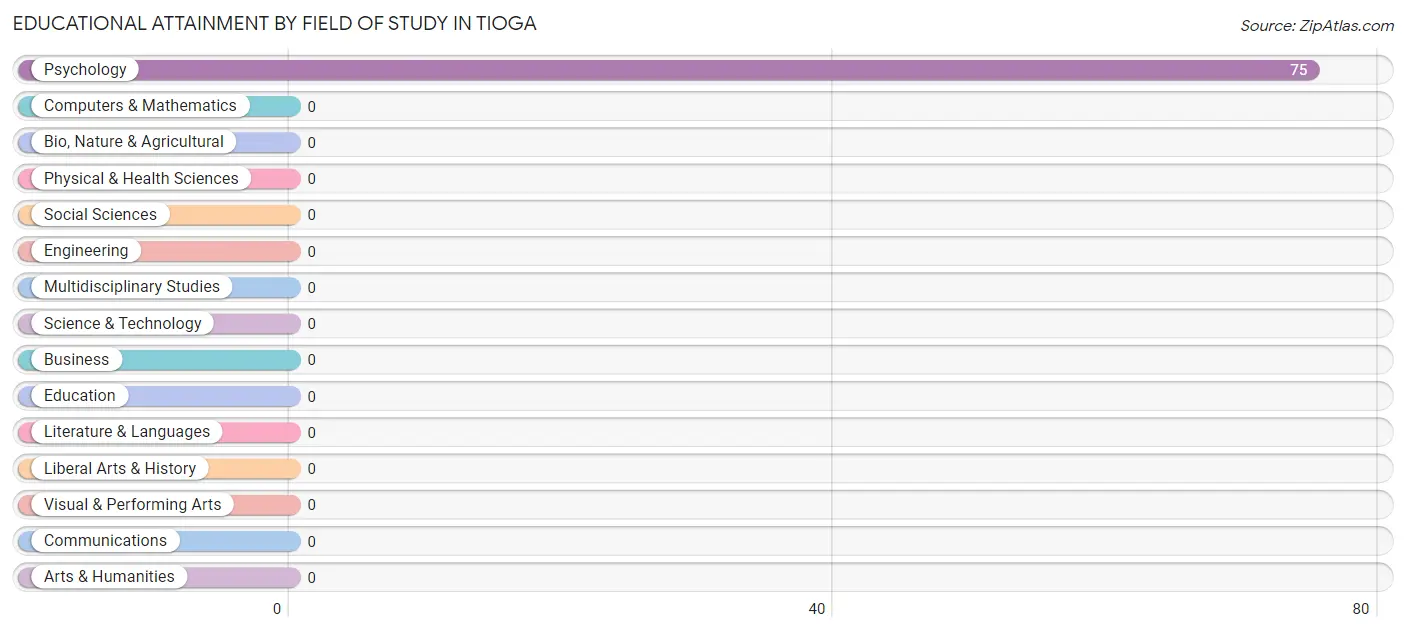
| Field of Study | # Graduates | % Graduates |
| Computers & Mathematics | 0 | 0.0% |
| Bio, Nature & Agricultural | 0 | 0.0% |
| Physical & Health Sciences | 0 | 0.0% |
| Psychology | 75 | 100.0% |
| Social Sciences | 0 | 0.0% |
| Engineering | 0 | 0.0% |
| Multidisciplinary Studies | 0 | 0.0% |
| Science & Technology | 0 | 0.0% |
| Business | 0 | 0.0% |
| Education | 0 | 0.0% |
| Literature & Languages | 0 | 0.0% |
| Liberal Arts & History | 0 | 0.0% |
| Visual & Performing Arts | 0 | 0.0% |
| Communications | 0 | 0.0% |
| Arts & Humanities | 0 | 0.0% |
| Total | 75 | 100.0% |
Transportation & Commute in Tioga
Vehicle Availability by Sex in Tioga
The most prevalent vehicle ownership categories in Tioga are males with 2 vehicles (20, accounting for 100.0%) and females with 2 vehicles (71, making up 13.7%).
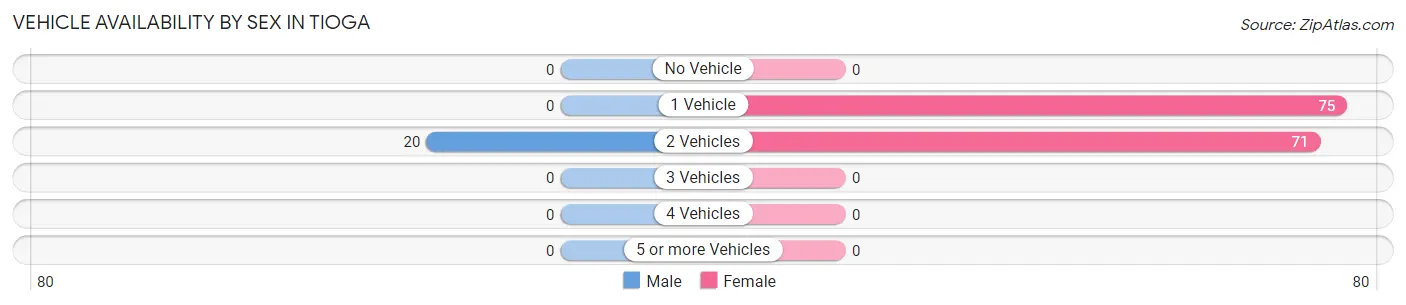
| Vehicles Available | Male | Female |
| No Vehicle | 0 (0.0%) | 0 (0.0%) |
| 1 Vehicle | 0 (0.0%) | 75 (51.4%) |
| 2 Vehicles | 20 (100.0%) | 71 (48.6%) |
| 3 Vehicles | 0 (0.0%) | 0 (0.0%) |
| 4 Vehicles | 0 (0.0%) | 0 (0.0%) |
| 5 or more Vehicles | 0 (0.0%) | 0 (0.0%) |
| Total | 20 (100.0%) | 146 (100.0%) |
Commute Time in Tioga
The most frequently occuring commute durations in Tioga are 60 to 89 minutes (75 commuters, 45.2%), 30 to 34 minutes (60 commuters, 36.1%), and 25 to 29 minutes (20 commuters, 12.0%).
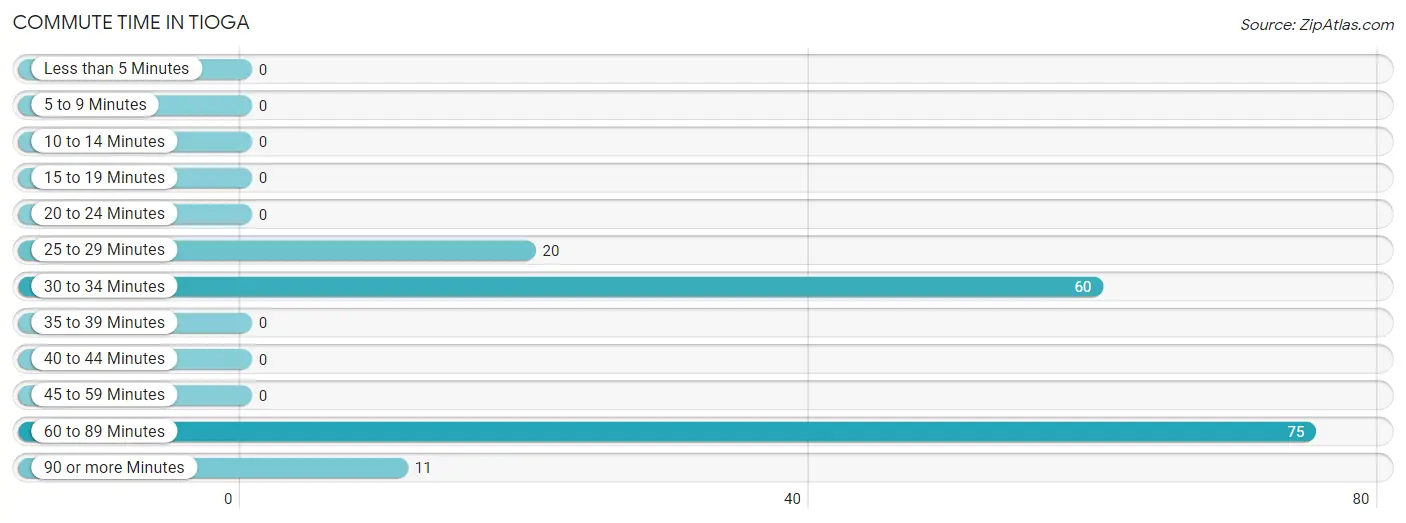
| Commute Time | # Commuters | % Commuters |
| Less than 5 Minutes | 0 | 0.0% |
| 5 to 9 Minutes | 0 | 0.0% |
| 10 to 14 Minutes | 0 | 0.0% |
| 15 to 19 Minutes | 0 | 0.0% |
| 20 to 24 Minutes | 0 | 0.0% |
| 25 to 29 Minutes | 20 | 12.0% |
| 30 to 34 Minutes | 60 | 36.1% |
| 35 to 39 Minutes | 0 | 0.0% |
| 40 to 44 Minutes | 0 | 0.0% |
| 45 to 59 Minutes | 0 | 0.0% |
| 60 to 89 Minutes | 75 | 45.2% |
| 90 or more Minutes | 11 | 6.6% |
Commute Time by Sex in Tioga
The most common commute times in Tioga are 25 to 29 minutes (20 commuters, 100.0%) for males and 60 to 89 minutes (75 commuters, 51.4%) for females.
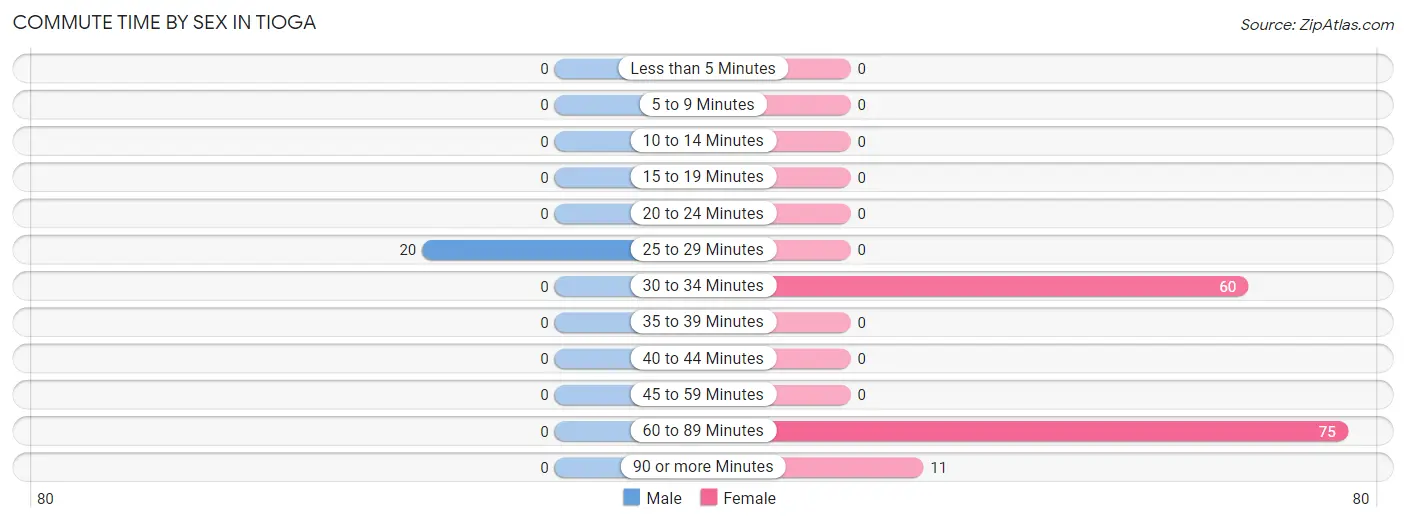
| Commute Time | Male | Female |
| Less than 5 Minutes | 0 (0.0%) | 0 (0.0%) |
| 5 to 9 Minutes | 0 (0.0%) | 0 (0.0%) |
| 10 to 14 Minutes | 0 (0.0%) | 0 (0.0%) |
| 15 to 19 Minutes | 0 (0.0%) | 0 (0.0%) |
| 20 to 24 Minutes | 0 (0.0%) | 0 (0.0%) |
| 25 to 29 Minutes | 20 (100.0%) | 0 (0.0%) |
| 30 to 34 Minutes | 0 (0.0%) | 60 (41.1%) |
| 35 to 39 Minutes | 0 (0.0%) | 0 (0.0%) |
| 40 to 44 Minutes | 0 (0.0%) | 0 (0.0%) |
| 45 to 59 Minutes | 0 (0.0%) | 0 (0.0%) |
| 60 to 89 Minutes | 0 (0.0%) | 75 (51.4%) |
| 90 or more Minutes | 0 (0.0%) | 11 (7.5%) |
Time of Departure to Work by Sex in Tioga
The most frequent times of departure to work in Tioga are 4:00 PM to 11:59 PM (20, 100.0%) for males and 7:00 AM to 7:29 AM (75, 51.4%) for females.
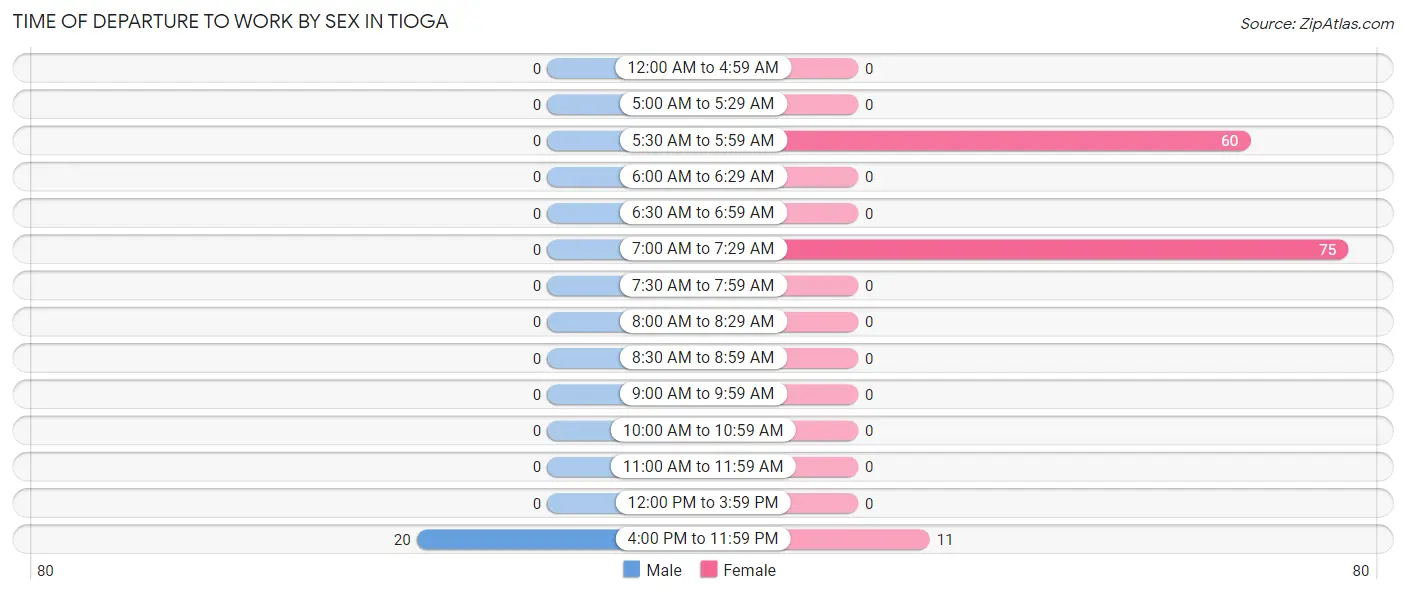
| Time of Departure | Male | Female |
| 12:00 AM to 4:59 AM | 0 (0.0%) | 0 (0.0%) |
| 5:00 AM to 5:29 AM | 0 (0.0%) | 0 (0.0%) |
| 5:30 AM to 5:59 AM | 0 (0.0%) | 60 (41.1%) |
| 6:00 AM to 6:29 AM | 0 (0.0%) | 0 (0.0%) |
| 6:30 AM to 6:59 AM | 0 (0.0%) | 0 (0.0%) |
| 7:00 AM to 7:29 AM | 0 (0.0%) | 75 (51.4%) |
| 7:30 AM to 7:59 AM | 0 (0.0%) | 0 (0.0%) |
| 8:00 AM to 8:29 AM | 0 (0.0%) | 0 (0.0%) |
| 8:30 AM to 8:59 AM | 0 (0.0%) | 0 (0.0%) |
| 9:00 AM to 9:59 AM | 0 (0.0%) | 0 (0.0%) |
| 10:00 AM to 10:59 AM | 0 (0.0%) | 0 (0.0%) |
| 11:00 AM to 11:59 AM | 0 (0.0%) | 0 (0.0%) |
| 12:00 PM to 3:59 PM | 0 (0.0%) | 0 (0.0%) |
| 4:00 PM to 11:59 PM | 20 (100.0%) | 11 (7.5%) |
| Total | 20 (100.0%) | 146 (100.0%) |
Housing Occupancy in Tioga
Occupancy by Ownership in Tioga
Of the total 128 dwellings in Tioga, owner-occupied units account for 53 (41.4%), while renter-occupied units make up 75 (58.6%).
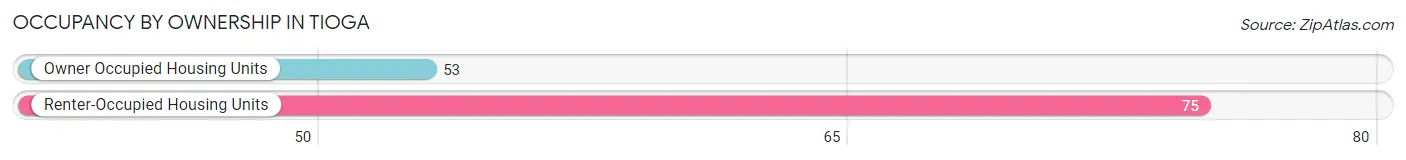
| Occupancy | # Housing Units | % Housing Units |
| Owner Occupied Housing Units | 53 | 41.4% |
| Renter-Occupied Housing Units | 75 | 58.6% |
| Total Occupied Housing Units | 128 | 100.0% |
Occupancy by Household Size in Tioga
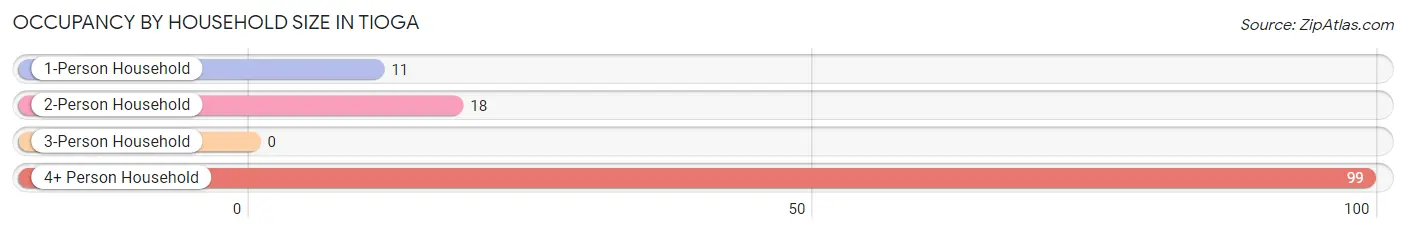
| Household Size | # Housing Units | % Housing Units |
| 1-Person Household | 11 | 8.6% |
| 2-Person Household | 18 | 14.1% |
| 3-Person Household | 0 | 0.0% |
| 4+ Person Household | 99 | 77.3% |
| Total Housing Units | 128 | 100.0% |
Occupancy by Ownership by Household Size in Tioga
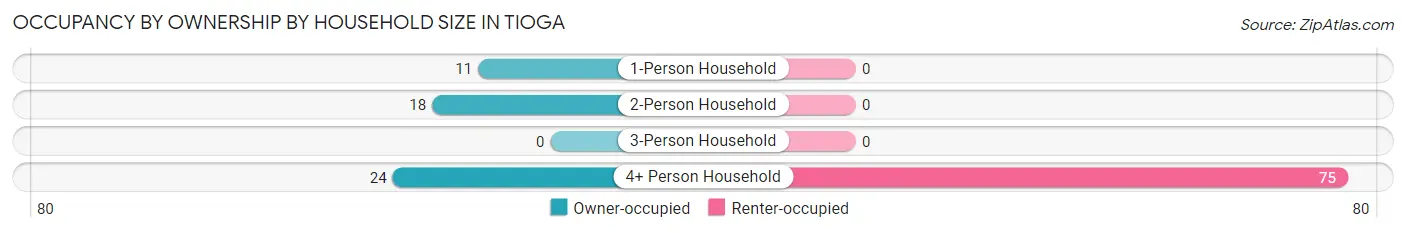
| Household Size | Owner-occupied | Renter-occupied |
| 1-Person Household | 11 (100.0%) | 0 (0.0%) |
| 2-Person Household | 18 (100.0%) | 0 (0.0%) |
| 3-Person Household | 0 (0.0%) | 0 (0.0%) |
| 4+ Person Household | 24 (24.2%) | 75 (75.8%) |
| Total Housing Units | 53 (41.4%) | 75 (58.6%) |
Occupancy by Educational Attainment in Tioga
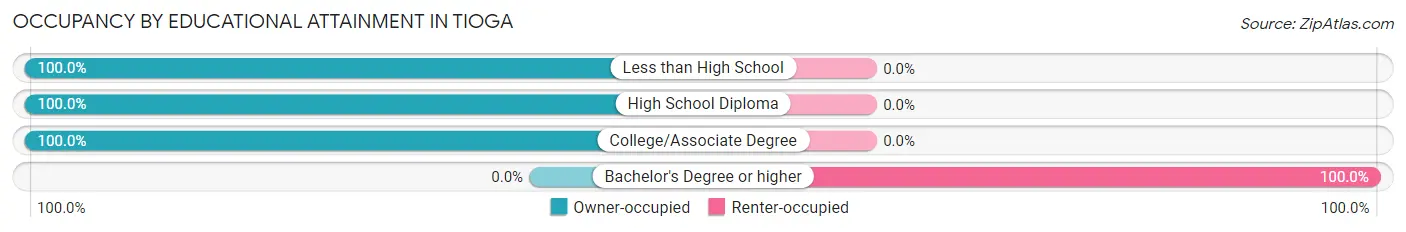
| Household Size | Owner-occupied | Renter-occupied |
| Less than High School | 7 (100.0%) | 0 (0.0%) |
| High School Diploma | 35 (100.0%) | 0 (0.0%) |
| College/Associate Degree | 11 (100.0%) | 0 (0.0%) |
| Bachelor's Degree or higher | 0 (0.0%) | 75 (100.0%) |
Occupancy by Age of Householder in Tioga
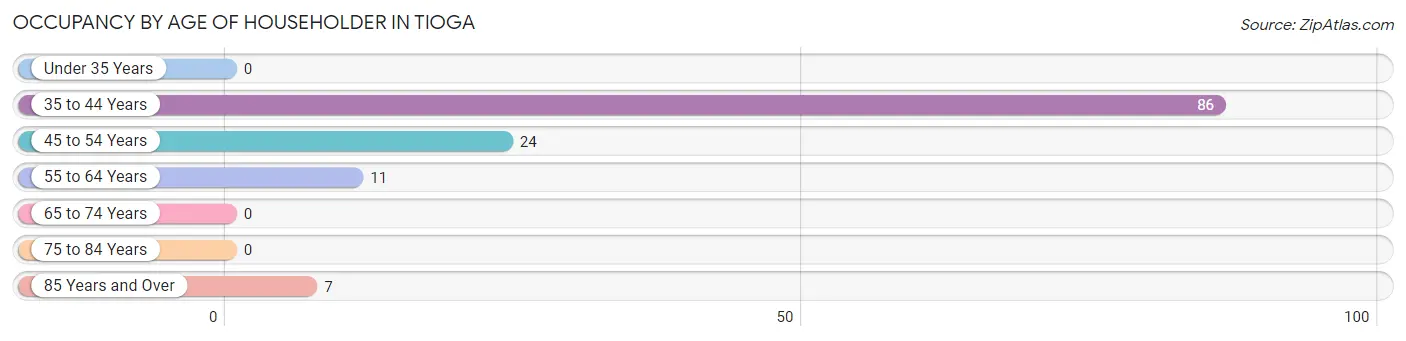
| Age Bracket | # Households | % Households |
| Under 35 Years | 0 | 0.0% |
| 35 to 44 Years | 86 | 67.2% |
| 45 to 54 Years | 24 | 18.8% |
| 55 to 64 Years | 11 | 8.6% |
| 65 to 74 Years | 0 | 0.0% |
| 75 to 84 Years | 0 | 0.0% |
| 85 Years and Over | 7 | 5.5% |
| Total | 128 | 100.0% |
Housing Finances in Tioga
Median Income by Occupancy in Tioga
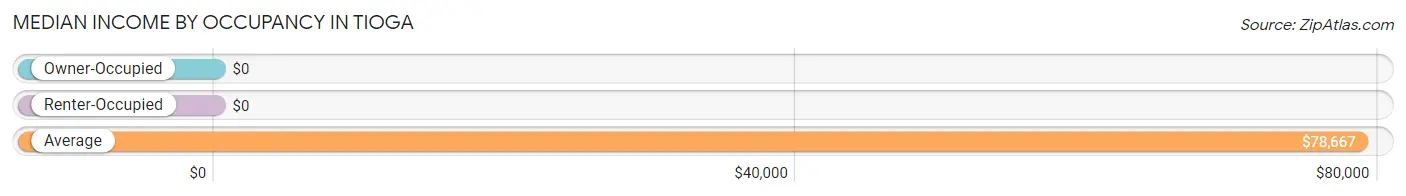
| Occupancy Type | # Households | Median Income |
| Owner-Occupied | 53 (41.4%) | $0 |
| Renter-Occupied | 75 (58.6%) | $0 |
| Average | 128 (100.0%) | $78,667 |
Occupancy by Householder Income Bracket in Tioga
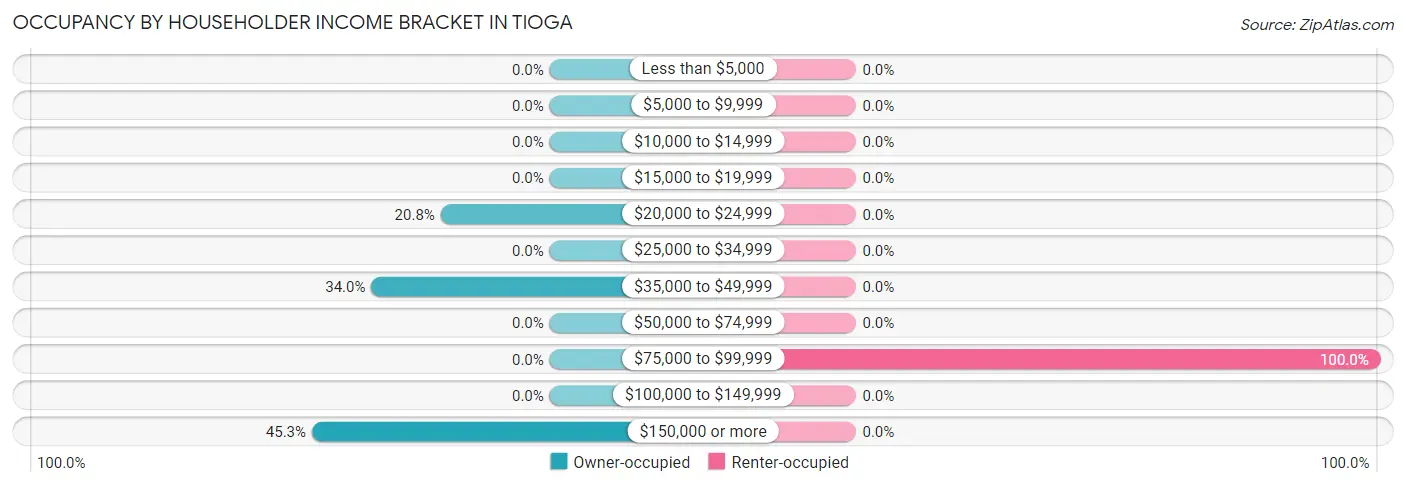
| Income Bracket | Owner-occupied | Renter-occupied |
| Less than $5,000 | 0 (0.0%) | 0 (0.0%) |
| $5,000 to $9,999 | 0 (0.0%) | 0 (0.0%) |
| $10,000 to $14,999 | 0 (0.0%) | 0 (0.0%) |
| $15,000 to $19,999 | 0 (0.0%) | 0 (0.0%) |
| $20,000 to $24,999 | 11 (20.7%) | 0 (0.0%) |
| $25,000 to $34,999 | 0 (0.0%) | 0 (0.0%) |
| $35,000 to $49,999 | 18 (34.0%) | 0 (0.0%) |
| $50,000 to $74,999 | 0 (0.0%) | 0 (0.0%) |
| $75,000 to $99,999 | 0 (0.0%) | 75 (100.0%) |
| $100,000 to $149,999 | 0 (0.0%) | 0 (0.0%) |
| $150,000 or more | 24 (45.3%) | 0 (0.0%) |
| Total | 53 (100.0%) | 75 (100.0%) |
Monthly Housing Cost Tiers in Tioga
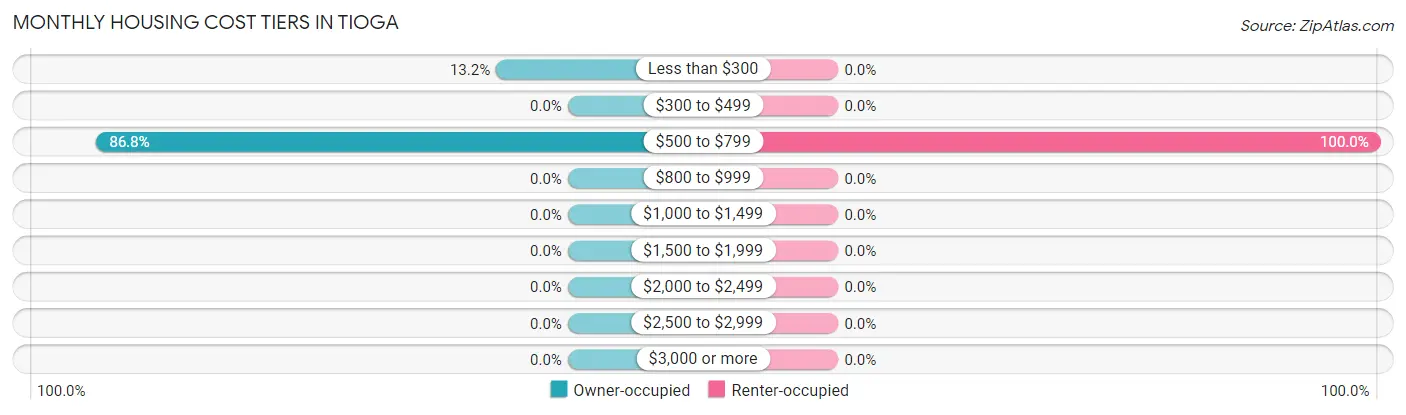
| Monthly Cost | Owner-occupied | Renter-occupied |
| Less than $300 | 7 (13.2%) | 0 (0.0%) |
| $300 to $499 | 0 (0.0%) | 0 (0.0%) |
| $500 to $799 | 46 (86.8%) | 75 (100.0%) |
| $800 to $999 | 0 (0.0%) | 0 (0.0%) |
| $1,000 to $1,499 | 0 (0.0%) | 0 (0.0%) |
| $1,500 to $1,999 | 0 (0.0%) | 0 (0.0%) |
| $2,000 to $2,499 | 0 (0.0%) | 0 (0.0%) |
| $2,500 to $2,999 | 0 (0.0%) | 0 (0.0%) |
| $3,000 or more | 0 (0.0%) | 0 (0.0%) |
| Total | 53 (100.0%) | 75 (100.0%) |
Physical Housing Characteristics in Tioga
Housing Structures in Tioga
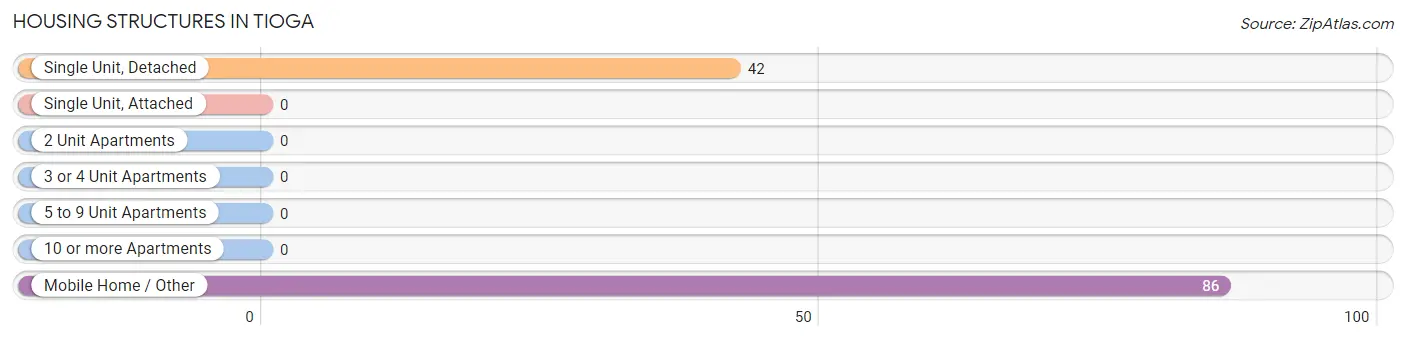
| Structure Type | # Housing Units | % Housing Units |
| Single Unit, Detached | 42 | 32.8% |
| Single Unit, Attached | 0 | 0.0% |
| 2 Unit Apartments | 0 | 0.0% |
| 3 or 4 Unit Apartments | 0 | 0.0% |
| 5 to 9 Unit Apartments | 0 | 0.0% |
| 10 or more Apartments | 0 | 0.0% |
| Mobile Home / Other | 86 | 67.2% |
| Total | 128 | 100.0% |
Housing Structures by Occupancy in Tioga
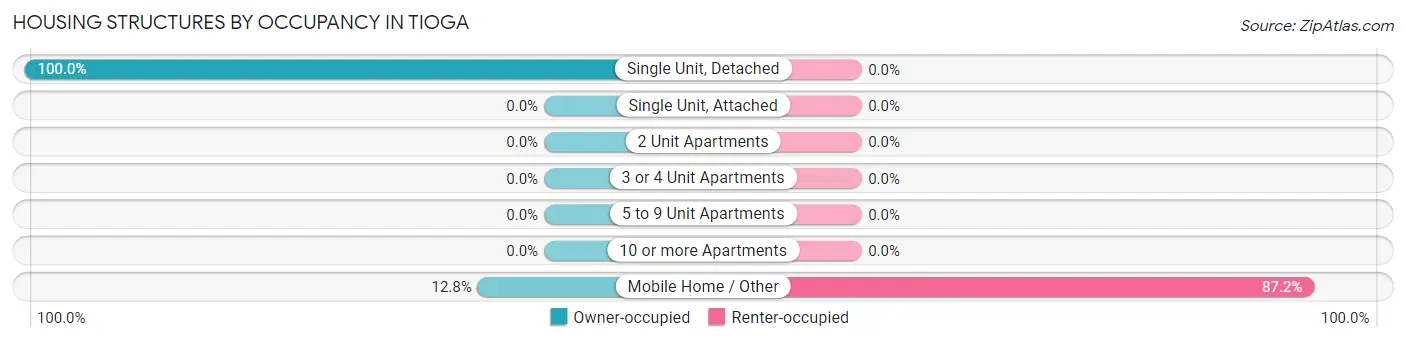
| Structure Type | Owner-occupied | Renter-occupied |
| Single Unit, Detached | 42 (100.0%) | 0 (0.0%) |
| Single Unit, Attached | 0 (0.0%) | 0 (0.0%) |
| 2 Unit Apartments | 0 (0.0%) | 0 (0.0%) |
| 3 or 4 Unit Apartments | 0 (0.0%) | 0 (0.0%) |
| 5 to 9 Unit Apartments | 0 (0.0%) | 0 (0.0%) |
| 10 or more Apartments | 0 (0.0%) | 0 (0.0%) |
| Mobile Home / Other | 11 (12.8%) | 75 (87.2%) |
| Total | 53 (41.4%) | 75 (58.6%) |
Housing Structures by Number of Rooms in Tioga
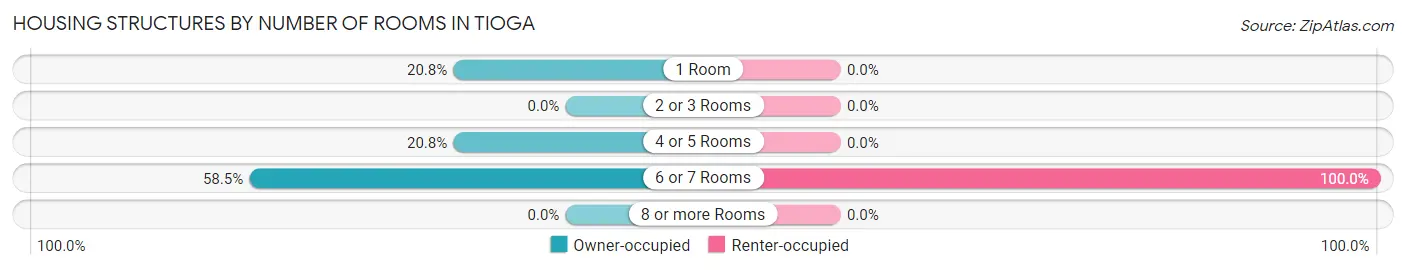
| Number of Rooms | Owner-occupied | Renter-occupied |
| 1 Room | 11 (20.7%) | 0 (0.0%) |
| 2 or 3 Rooms | 0 (0.0%) | 0 (0.0%) |
| 4 or 5 Rooms | 11 (20.7%) | 0 (0.0%) |
| 6 or 7 Rooms | 31 (58.5%) | 75 (100.0%) |
| 8 or more Rooms | 0 (0.0%) | 0 (0.0%) |
| Total | 53 (100.0%) | 75 (100.0%) |
Housing Structure by Heating Type in Tioga
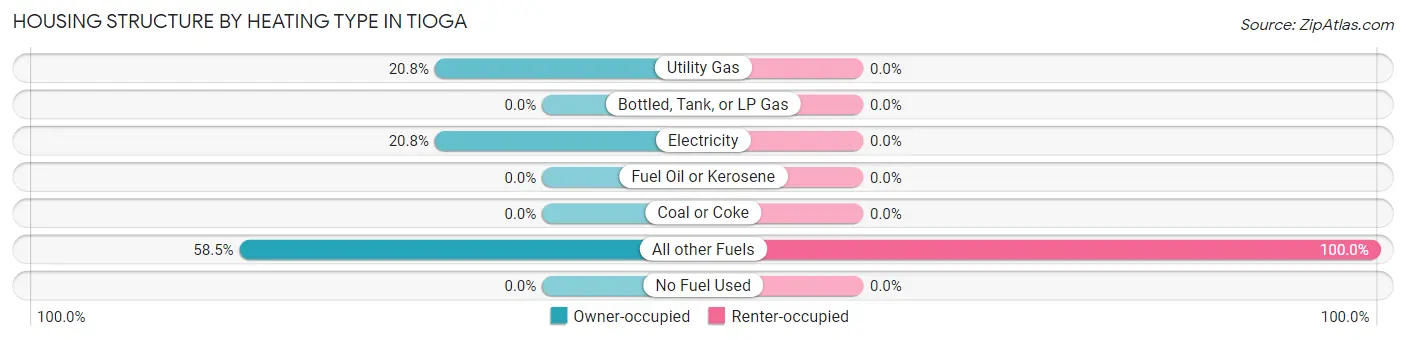
| Heating Type | Owner-occupied | Renter-occupied |
| Utility Gas | 11 (20.7%) | 0 (0.0%) |
| Bottled, Tank, or LP Gas | 0 (0.0%) | 0 (0.0%) |
| Electricity | 11 (20.7%) | 0 (0.0%) |
| Fuel Oil or Kerosene | 0 (0.0%) | 0 (0.0%) |
| Coal or Coke | 0 (0.0%) | 0 (0.0%) |
| All other Fuels | 31 (58.5%) | 75 (100.0%) |
| No Fuel Used | 0 (0.0%) | 0 (0.0%) |
| Total | 53 (100.0%) | 75 (100.0%) |
Household Vehicle Usage in Tioga
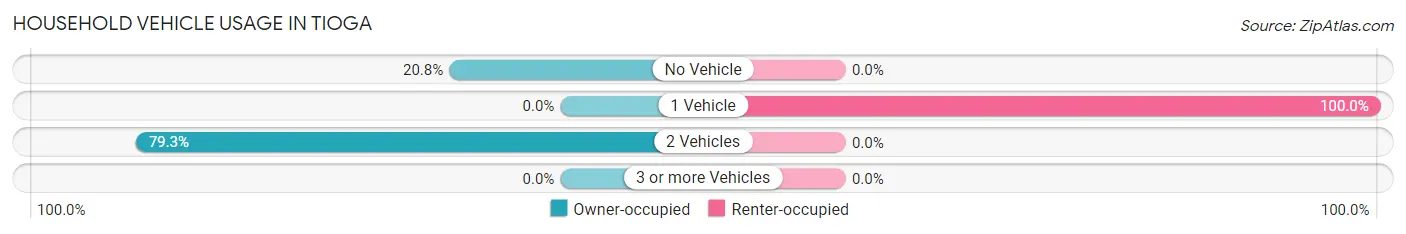
| Vehicles per Household | Owner-occupied | Renter-occupied |
| No Vehicle | 11 (20.7%) | 0 (0.0%) |
| 1 Vehicle | 0 (0.0%) | 75 (100.0%) |
| 2 Vehicles | 42 (79.2%) | 0 (0.0%) |
| 3 or more Vehicles | 0 (0.0%) | 0 (0.0%) |
| Total | 53 (100.0%) | 75 (100.0%) |
Real Estate & Mortgages in Tioga
Real Estate and Mortgage Overview in Tioga
| Characteristic | Without Mortgage | With Mortgage |
| Housing Units | 53 | 0 |
| Median Property Value | - | - |
| Median Household Income | - | - |
| Monthly Housing Costs | $556 | $0 |
| Real Estate Taxes | - | - |
Property Value by Mortgage Status in Tioga
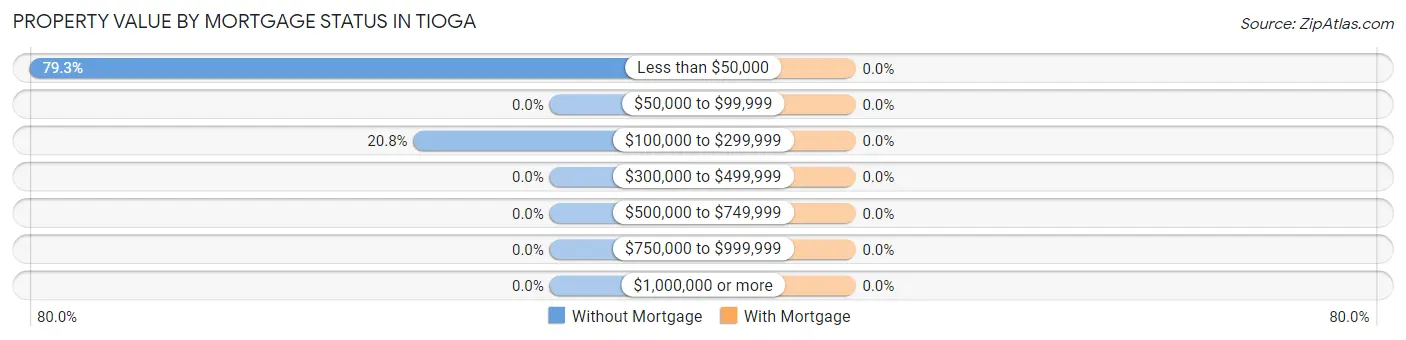
| Property Value | Without Mortgage | With Mortgage |
| Less than $50,000 | 42 (79.2%) | 0 (0.0%) |
| $50,000 to $99,999 | 0 (0.0%) | 0 (0.0%) |
| $100,000 to $299,999 | 11 (20.7%) | 0 (0.0%) |
| $300,000 to $499,999 | 0 (0.0%) | 0 (0.0%) |
| $500,000 to $749,999 | 0 (0.0%) | 0 (0.0%) |
| $750,000 to $999,999 | 0 (0.0%) | 0 (0.0%) |
| $1,000,000 or more | 0 (0.0%) | 0 (0.0%) |
| Total | 53 (100.0%) | 0 (0.0%) |
Household Income by Mortgage Status in Tioga
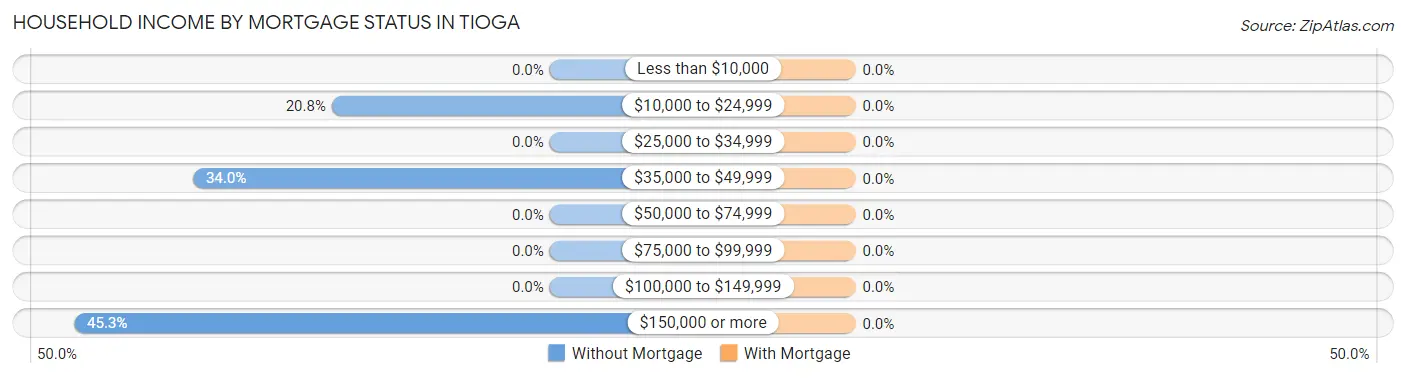
| Household Income | Without Mortgage | With Mortgage |
| Less than $10,000 | 0 (0.0%) | 0 (0.0%) |
| $10,000 to $24,999 | 11 (20.7%) | 0 (0.0%) |
| $25,000 to $34,999 | 0 (0.0%) | 0 (0.0%) |
| $35,000 to $49,999 | 18 (34.0%) | 0 (0.0%) |
| $50,000 to $74,999 | 0 (0.0%) | 0 (0.0%) |
| $75,000 to $99,999 | 0 (0.0%) | 0 (0.0%) |
| $100,000 to $149,999 | 0 (0.0%) | 0 (0.0%) |
| $150,000 or more | 24 (45.3%) | 0 (0.0%) |
| Total | 53 (100.0%) | 0 (0.0%) |
Property Value to Household Income Ratio in Tioga
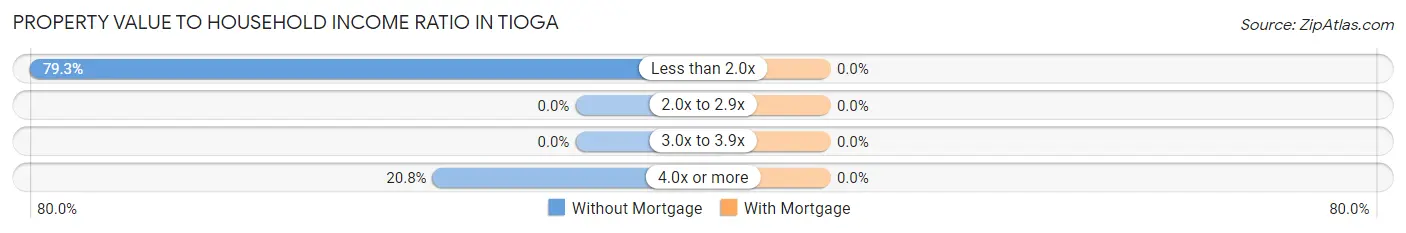
| Value-to-Income Ratio | Without Mortgage | With Mortgage |
| Less than 2.0x | 42 (79.2%) | 0 (0.0%) |
| 2.0x to 2.9x | 0 (0.0%) | 0 (0.0%) |
| 3.0x to 3.9x | 0 (0.0%) | 0 (0.0%) |
| 4.0x or more | 11 (20.7%) | 0 (0.0%) |
| Total | 53 (100.0%) | 0 (0.0%) |
Real Estate Taxes by Mortgage Status in Tioga
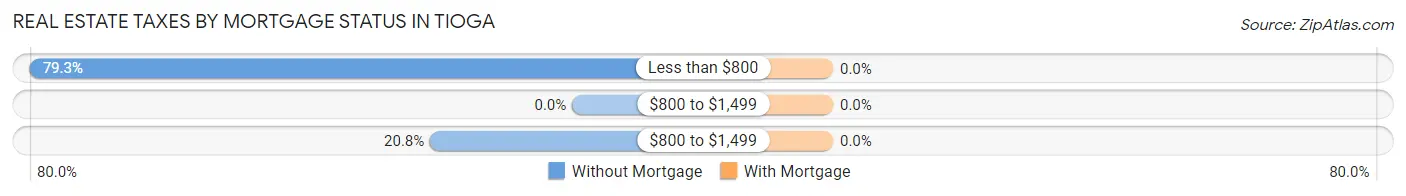
| Property Taxes | Without Mortgage | With Mortgage |
| Less than $800 | 42 (79.2%) | 0 (0.0%) |
| $800 to $1,499 | 0 (0.0%) | 0 (0.0%) |
| $800 to $1,499 | 11 (20.7%) | 0 (0.0%) |
| Total | 53 (100.0%) | 0 (0.0%) |
Health & Disability in Tioga
Health Insurance Coverage by Age in Tioga
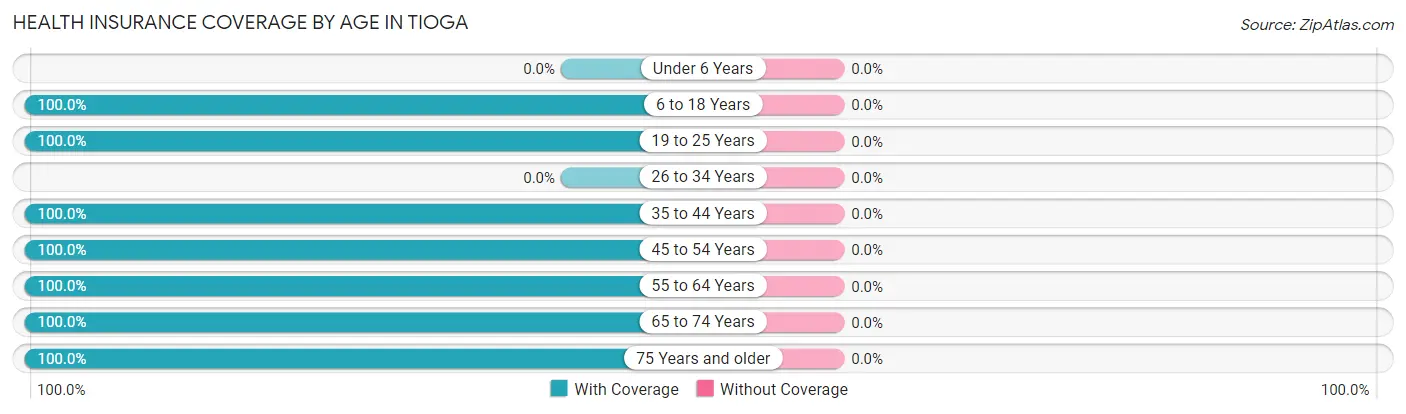
| Age Bracket | With Coverage | Without Coverage |
| Under 6 Years | 0 (0.0%) | 0 (0.0%) |
| 6 to 18 Years | 210 (100.0%) | 0 (0.0%) |
| 19 to 25 Years | 36 (100.0%) | 0 (0.0%) |
| 26 to 34 Years | 0 (0.0%) | 0 (0.0%) |
| 35 to 44 Years | 173 (100.0%) | 0 (0.0%) |
| 45 to 54 Years | 44 (100.0%) | 0 (0.0%) |
| 55 to 64 Years | 58 (100.0%) | 0 (0.0%) |
| 65 to 74 Years | 17 (100.0%) | 0 (0.0%) |
| 75 Years and older | 7 (100.0%) | 0 (0.0%) |
| Total | 545 (100.0%) | 0 (0.0%) |
Health Insurance Coverage by Citizenship Status in Tioga
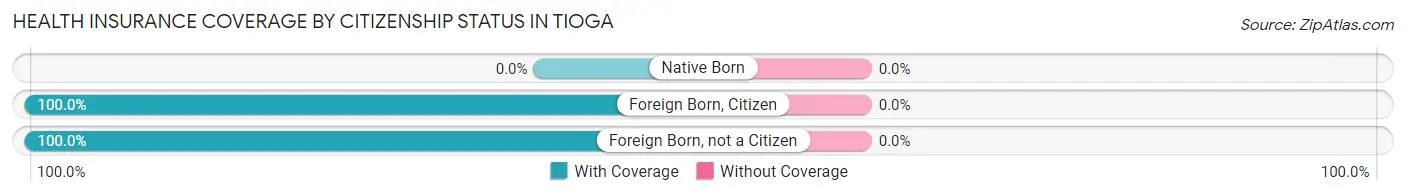
| Citizenship Status | With Coverage | Without Coverage |
| Native Born | 0 (0.0%) | 0 (0.0%) |
| Foreign Born, Citizen | 210 (100.0%) | 0 (0.0%) |
| Foreign Born, not a Citizen | 36 (100.0%) | 0 (0.0%) |
Health Insurance Coverage by Household Income in Tioga
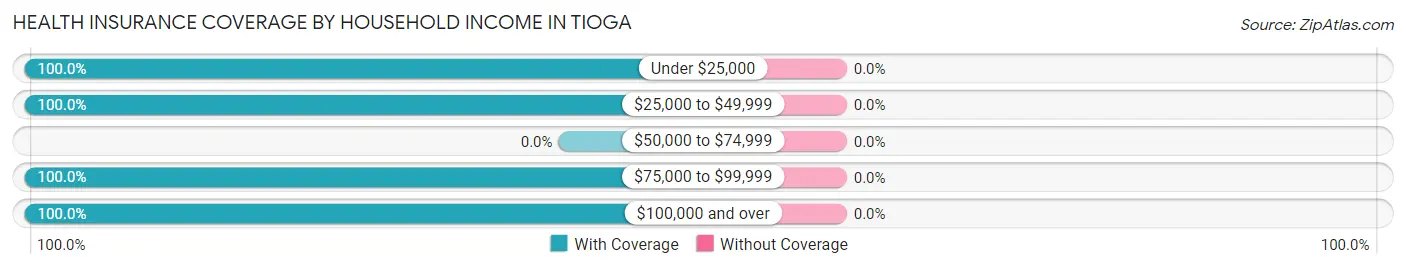
| Household Income | With Coverage | Without Coverage |
| Under $25,000 | 11 (100.0%) | 0 (0.0%) |
| $25,000 to $49,999 | 82 (100.0%) | 0 (0.0%) |
| $50,000 to $74,999 | 0 (0.0%) | 0 (0.0%) |
| $75,000 to $99,999 | 348 (100.0%) | 0 (0.0%) |
| $100,000 and over | 104 (100.0%) | 0 (0.0%) |
Public vs Private Health Insurance Coverage by Age in Tioga
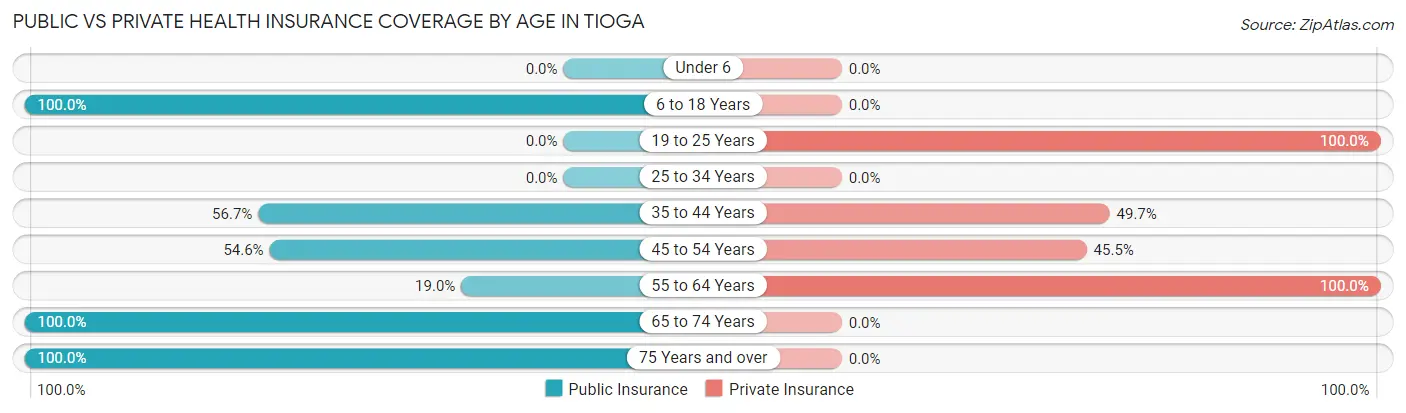
| Age Bracket | Public Insurance | Private Insurance |
| Under 6 | 0 (0.0%) | 0 (0.0%) |
| 6 to 18 Years | 210 (100.0%) | 0 (0.0%) |
| 19 to 25 Years | 0 (0.0%) | 36 (100.0%) |
| 25 to 34 Years | 0 (0.0%) | 0 (0.0%) |
| 35 to 44 Years | 98 (56.7%) | 86 (49.7%) |
| 45 to 54 Years | 24 (54.5%) | 20 (45.5%) |
| 55 to 64 Years | 11 (19.0%) | 58 (100.0%) |
| 65 to 74 Years | 17 (100.0%) | 0 (0.0%) |
| 75 Years and over | 7 (100.0%) | 0 (0.0%) |
| Total | 367 (67.3%) | 200 (36.7%) |
Disability Status by Sex by Age in Tioga
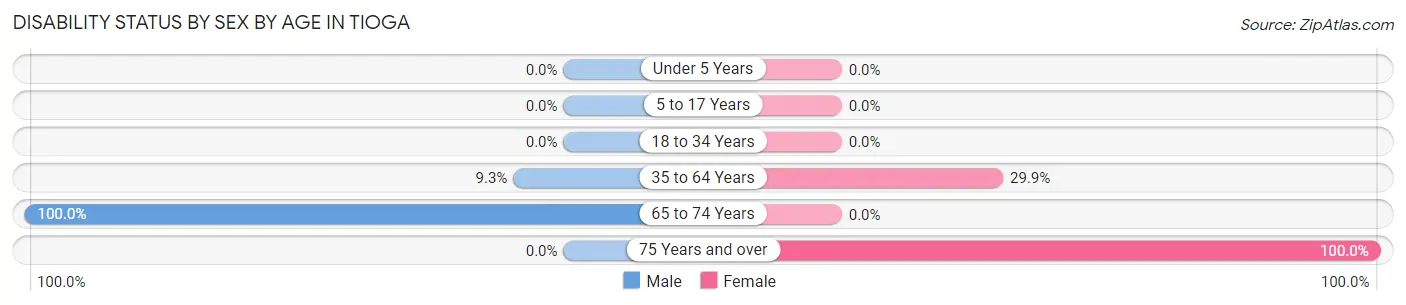
| Age Bracket | Male | Female |
| Under 5 Years | 0 (0.0%) | 0 (0.0%) |
| 5 to 17 Years | 0 (0.0%) | 0 (0.0%) |
| 18 to 34 Years | 0 (0.0%) | 0 (0.0%) |
| 35 to 64 Years | 11 (9.3%) | 47 (29.9%) |
| 65 to 74 Years | 17 (100.0%) | 0 (0.0%) |
| 75 Years and over | 0 (0.0%) | 7 (100.0%) |
Disability Class by Sex by Age in Tioga
Disability Class: Hearing Difficulty
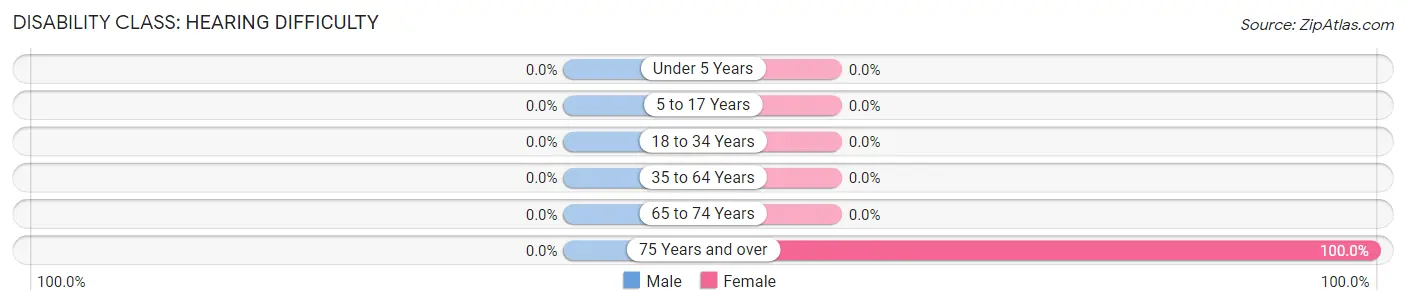
| Age Bracket | Male | Female |
| Under 5 Years | 0 (0.0%) | 0 (0.0%) |
| 5 to 17 Years | 0 (0.0%) | 0 (0.0%) |
| 18 to 34 Years | 0 (0.0%) | 0 (0.0%) |
| 35 to 64 Years | 0 (0.0%) | 0 (0.0%) |
| 65 to 74 Years | 0 (0.0%) | 0 (0.0%) |
| 75 Years and over | 0 (0.0%) | 7 (100.0%) |
Disability Class: Vision Difficulty

| Age Bracket | Male | Female |
| Under 5 Years | 0 (0.0%) | 0 (0.0%) |
| 5 to 17 Years | 0 (0.0%) | 0 (0.0%) |
| 18 to 34 Years | 0 (0.0%) | 0 (0.0%) |
| 35 to 64 Years | 0 (0.0%) | 0 (0.0%) |
| 65 to 74 Years | 0 (0.0%) | 0 (0.0%) |
| 75 Years and over | 0 (0.0%) | 7 (100.0%) |
Disability Class: Cognitive Difficulty
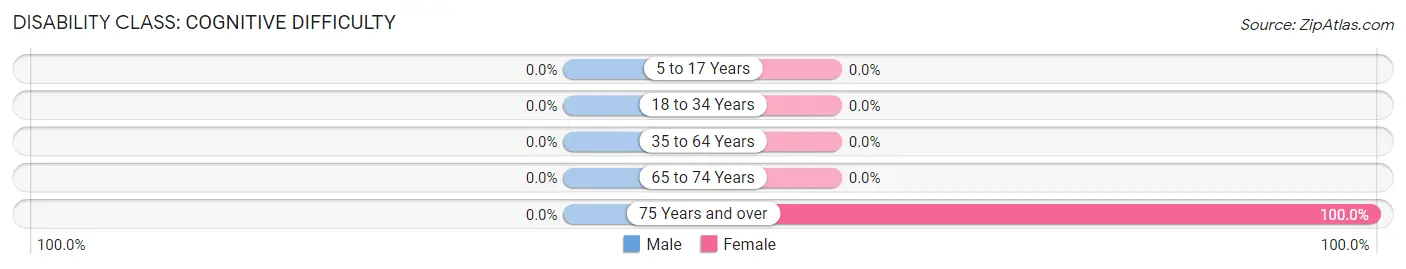
| Age Bracket | Male | Female |
| 5 to 17 Years | 0 (0.0%) | 0 (0.0%) |
| 18 to 34 Years | 0 (0.0%) | 0 (0.0%) |
| 35 to 64 Years | 0 (0.0%) | 0 (0.0%) |
| 65 to 74 Years | 0 (0.0%) | 0 (0.0%) |
| 75 Years and over | 0 (0.0%) | 7 (100.0%) |
Disability Class: Ambulatory Difficulty
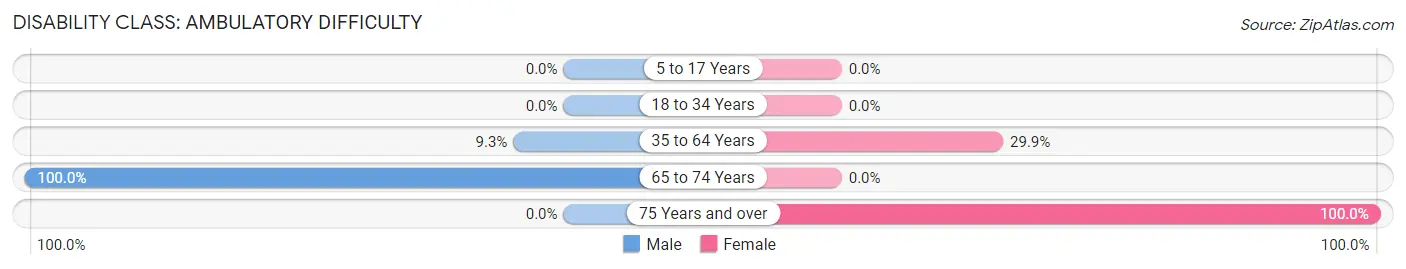
| Age Bracket | Male | Female |
| 5 to 17 Years | 0 (0.0%) | 0 (0.0%) |
| 18 to 34 Years | 0 (0.0%) | 0 (0.0%) |
| 35 to 64 Years | 11 (9.3%) | 47 (29.9%) |
| 65 to 74 Years | 17 (100.0%) | 0 (0.0%) |
| 75 Years and over | 0 (0.0%) | 7 (100.0%) |
Disability Class: Self-Care Difficulty
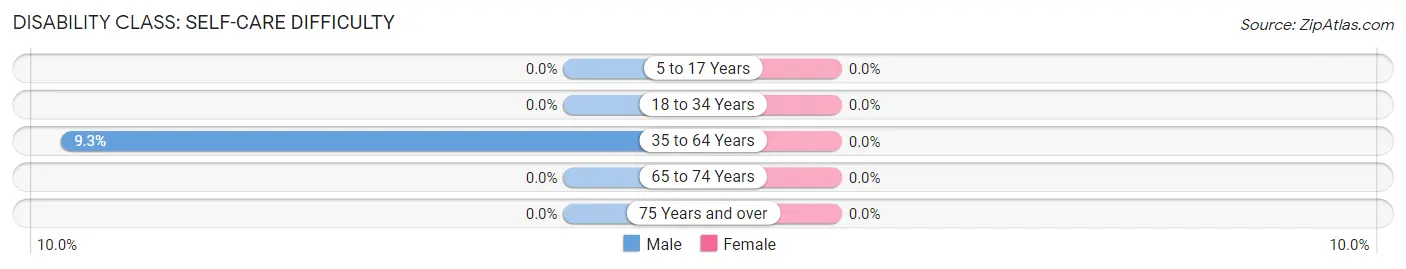
| Age Bracket | Male | Female |
| 5 to 17 Years | 0 (0.0%) | 0 (0.0%) |
| 18 to 34 Years | 0 (0.0%) | 0 (0.0%) |
| 35 to 64 Years | 11 (9.3%) | 0 (0.0%) |
| 65 to 74 Years | 0 (0.0%) | 0 (0.0%) |
| 75 Years and over | 0 (0.0%) | 0 (0.0%) |
Technology Access in Tioga
Computing Device Access in Tioga
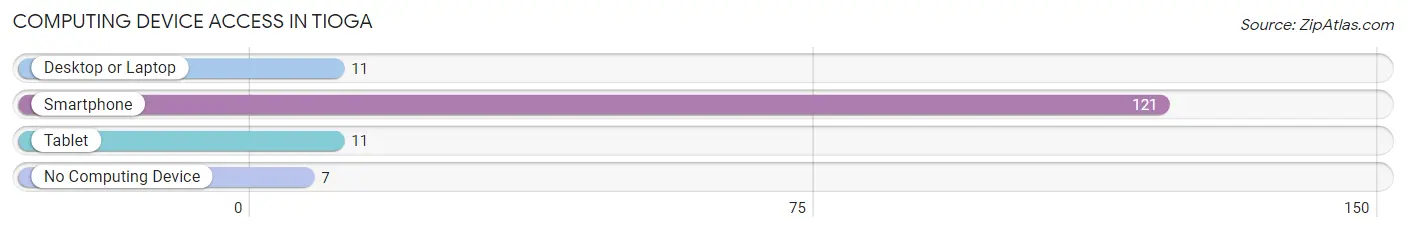
| Device Type | # Households | % Households |
| Desktop or Laptop | 11 | 8.6% |
| Smartphone | 121 | 94.5% |
| Tablet | 11 | 8.6% |
| No Computing Device | 7 | 5.5% |
| Total | 128 | 100.0% |
Internet Access in Tioga
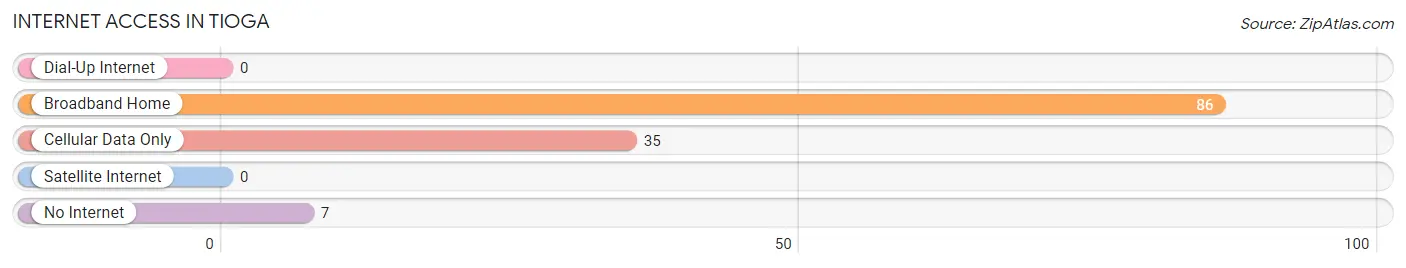
| Internet Type | # Households | % Households |
| Dial-Up Internet | 0 | 0.0% |
| Broadband Home | 86 | 67.2% |
| Cellular Data Only | 35 | 27.3% |
| Satellite Internet | 0 | 0.0% |
| No Internet | 7 | 5.5% |
| Total | 128 | 100.0% |
Tioga Summary
Tioga is a small unincorporated community located in the northern part of West Virginia, in the United States. It is situated in the Monongahela National Forest, in the Appalachian Mountains. The community is located in Tucker County, and is part of the Davis-Thomas Census-Designated Place.
History
The area that is now Tioga was first settled in the late 1700s by a group of settlers from Pennsylvania. The settlers were attracted to the area due to its abundance of natural resources, including timber and coal. The first post office in the area was established in 1883, and the community was officially named Tioga in 1884.
The town was originally a coal mining town, and the coal industry was the primary source of employment for the residents. The coal industry declined in the early 1900s, and the town began to decline as well. The population of Tioga decreased from a peak of around 500 in the early 1900s to just over 100 in the 2000 census.
Geography
Tioga is located in the northern part of West Virginia, in the Appalachian Mountains. It is situated in the Monongahela National Forest, and is part of the Davis-Thomas Census-Designated Place. The town is located at an elevation of 2,845 feet (867 m).
The town is located in a valley, surrounded by mountains on all sides. The closest major city is Elkins, which is located about 25 miles (40 km) to the south. The closest major airport is Pittsburgh International Airport, which is located about 100 miles (160 km) to the north.
Economy
The economy of Tioga is largely based on tourism. The town is a popular destination for outdoor recreation, such as hiking, camping, fishing, and hunting. The town is also home to several small businesses, including a general store, a gas station, and a restaurant.
The town is also home to a small coal mine, which is operated by the Tioga Mining Company. The mine is the only source of employment in the town, and provides jobs for around 20 people.
Demographics
According to the 2000 census, the population of Tioga was 102. The racial makeup of the town was 97.1% White, 0.9% African American, 0.9% Native American, and 1.0% from other races. The median household income was $25,000, and the median family income was $30,000.
Conclusion
Tioga is a small unincorporated community located in the northern part of West Virginia, in the United States. It is situated in the Monongahela National Forest, in the Appalachian Mountains. The town is largely dependent on tourism for its economy, and is home to a small coal mine. The population of Tioga was 102 in the 2000 census, and the median household income was $25,000.
Common Questions
What is Per Capita Income in Tioga?
Per Capita income in Tioga is $20,175.
What is the Median Family Income in Tioga?
Median Family Income in Tioga is $78,050.
What is the Median Household income in Tioga?
Median Household Income in Tioga is $78,667.
What is Inequality or Gini Index in Tioga?
Inequality or Gini Index in Tioga is 0.24.
What is the Total Population of Tioga?
Total Population of Tioga is 545.
What is the Total Male Population of Tioga?
Total Male Population of Tioga is 345.
What is the Total Female Population of Tioga?
Total Female Population of Tioga is 200.
What is the Ratio of Males per 100 Females in Tioga?
There are 172.50 Males per 100 Females in Tioga.
What is the Ratio of Females per 100 Males in Tioga?
There are 57.97 Females per 100 Males in Tioga.
What is the Median Population Age in Tioga?
Median Population Age in Tioga is 38.4 Years.
What is the Average Family Size in Tioga
Average Family Size in Tioga is 3.6 People.
What is the Average Household Size in Tioga
Average Household Size in Tioga is 4.3 People.
How Large is the Labor Force in Tioga?
There are 213 People in the Labor Forcein in Tioga.
What is the Percentage of People in the Labor Force in Tioga?
63.6% of People are in the Labor Force in Tioga.
What is the Unemployment Rate in Tioga?
Unemployment Rate in Tioga is 22.1%.