Bluff, UT Map & Demographics
Bluff Map
Bluff Overview
$27,985
PER CAPITA INCOME
$51,429
AVG FAMILY INCOME
$51,607
AVG HOUSEHOLD INCOME
0.18
INEQUALITY / GINI INDEX
123
TOTAL POPULATION
41
MALE POPULATION
82
FEMALE POPULATION
50.00
MALES / 100 FEMALES
200.00
FEMALES / 100 MALES
68.1
MEDIAN AGE
3.5
AVG FAMILY SIZE
3.1
AVG HOUSEHOLD SIZE
27
LABOR FORCE [ PEOPLE ]
22.0%
PERCENT IN LABOR FORCE
Bluff Zip Codes
Bluff Area Codes
Income in Bluff
Income Overview in Bluff
Per Capita Income in Bluff is $27,985, while median incomes of families and households are $51,429 and $51,607 respectively.
| Characteristic | Number | Measure |
| Per Capita Income | 123 | $27,985 |
| Median Family Income | 30 | $51,429 |
| Mean Family Income | 30 | $56,467 |
| Median Household Income | 40 | $51,607 |
| Mean Household Income | 40 | $52,398 |
| Income Deficit | 30 | $0 |
| Wage / Income Gap (%) | 123 | 0.00% |
| Wage / Income Gap ($) | 123 | 100.00¢ per $1 |
| Gini / Inequality Index | 123 | 0.18 |
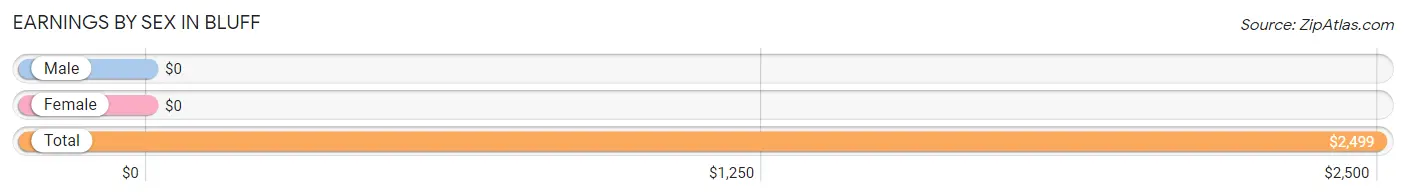
Earnings by Sex in Bluff
| Sex | Number | Average Earnings |
| Male | 7 (25.9%) | $0 |
| Female | 20 (74.1%) | $0 |
| Total | 27 (100.0%) | $2,499 |
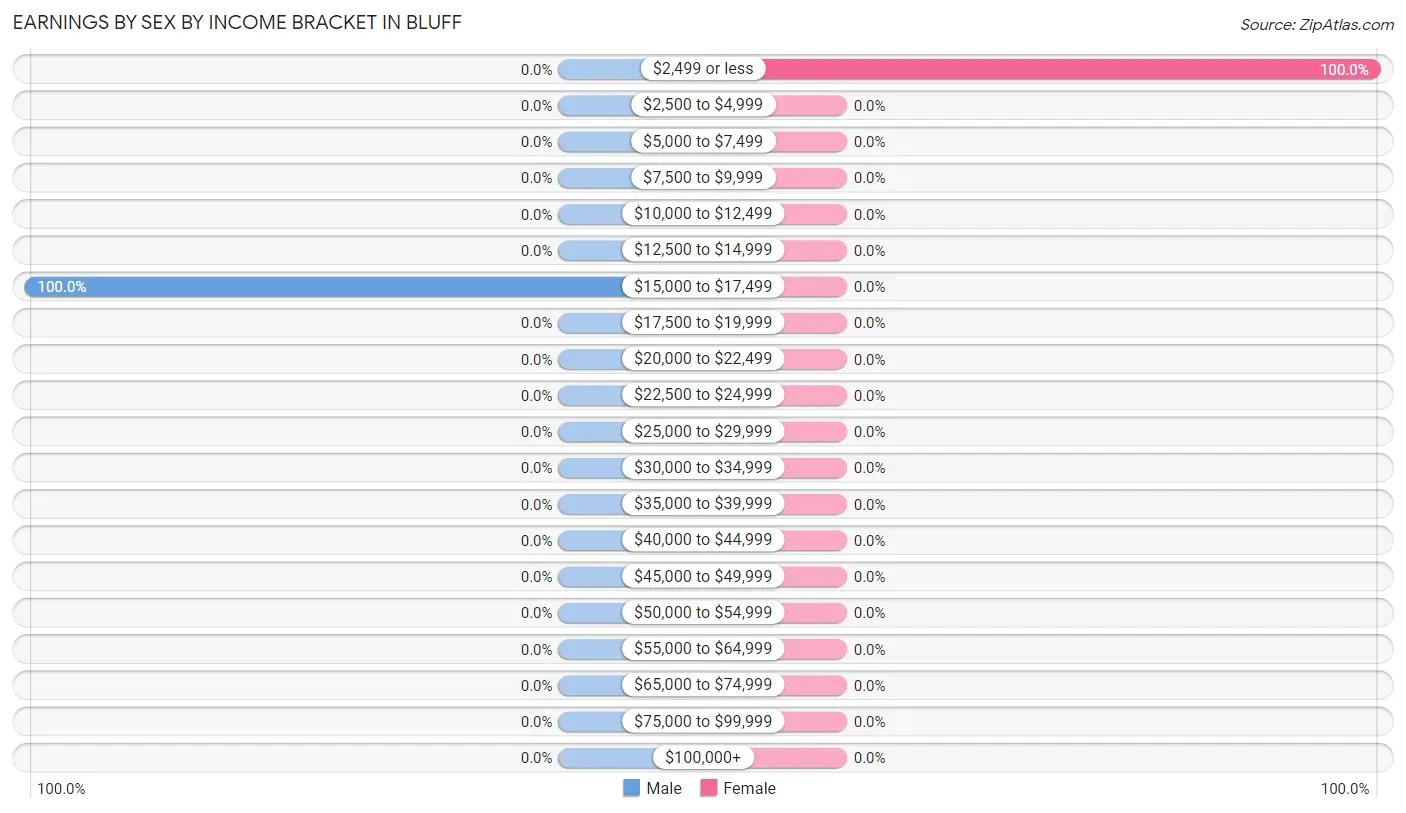
Earnings by Sex by Income Bracket in Bluff
The most common earnings brackets in Bluff are $15,000 to $17,499 for men (7 | 100.0%) and $2,499 or less for women (20 | 100.0%).
| Income | Male | Female |
| $2,499 or less | 0 (0.0%) | 20 (100.0%) |
| $2,500 to $4,999 | 0 (0.0%) | 0 (0.0%) |
| $5,000 to $7,499 | 0 (0.0%) | 0 (0.0%) |
| $7,500 to $9,999 | 0 (0.0%) | 0 (0.0%) |
| $10,000 to $12,499 | 0 (0.0%) | 0 (0.0%) |
| $12,500 to $14,999 | 0 (0.0%) | 0 (0.0%) |
| $15,000 to $17,499 | 7 (100.0%) | 0 (0.0%) |
| $17,500 to $19,999 | 0 (0.0%) | 0 (0.0%) |
| $20,000 to $22,499 | 0 (0.0%) | 0 (0.0%) |
| $22,500 to $24,999 | 0 (0.0%) | 0 (0.0%) |
| $25,000 to $29,999 | 0 (0.0%) | 0 (0.0%) |
| $30,000 to $34,999 | 0 (0.0%) | 0 (0.0%) |
| $35,000 to $39,999 | 0 (0.0%) | 0 (0.0%) |
| $40,000 to $44,999 | 0 (0.0%) | 0 (0.0%) |
| $45,000 to $49,999 | 0 (0.0%) | 0 (0.0%) |
| $50,000 to $54,999 | 0 (0.0%) | 0 (0.0%) |
| $55,000 to $64,999 | 0 (0.0%) | 0 (0.0%) |
| $65,000 to $74,999 | 0 (0.0%) | 0 (0.0%) |
| $75,000 to $99,999 | 0 (0.0%) | 0 (0.0%) |
| $100,000+ | 0 (0.0%) | 0 (0.0%) |
| Total | 7 (100.0%) | 20 (100.0%) |
Earnings by Sex by Educational Attainment in Bluff
| Educational Attainment | Male Income | Female Income |
| Less than High School | - | - |
| High School Diploma | - | - |
| College or Associate's Degree | - | - |
| Bachelor's Degree | - | - |
| Graduate Degree | - | - |
| Total | - | - |
Family Income in Bluff
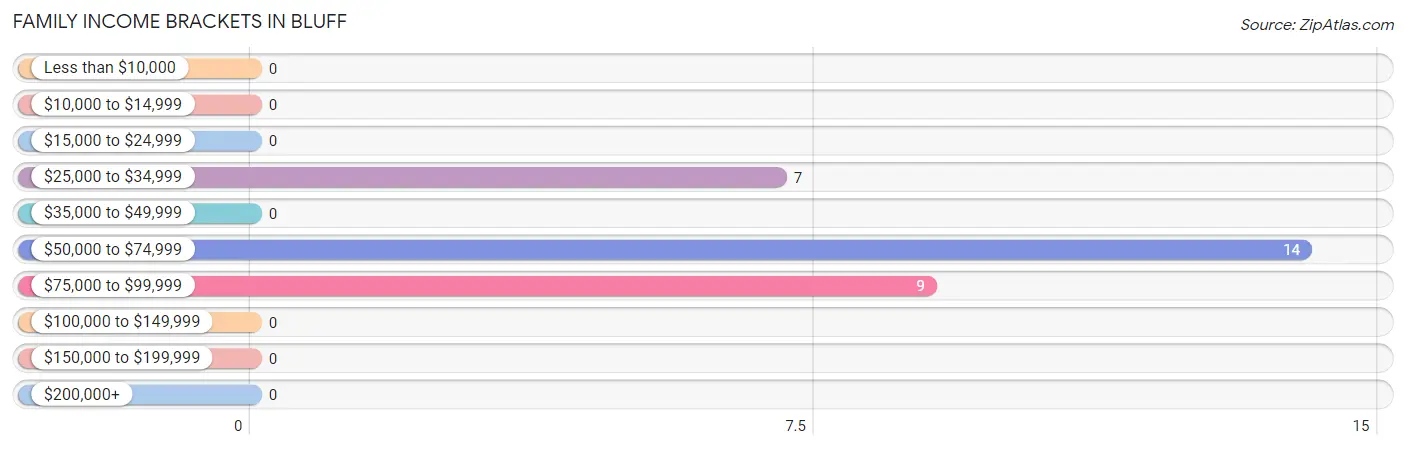
Family Income Brackets in Bluff
According to the Bluff family income data, there are 14 families falling into the $50,000 to $74,999 income range, which is the most common income bracket and makes up 46.7% of all families.
| Income Bracket | # Families | % Families |
| Less than $10,000 | 0 | 0.0% |
| $10,000 to $14,999 | 0 | 0.0% |
| $15,000 to $24,999 | 0 | 0.0% |
| $25,000 to $34,999 | 7 | 23.3% |
| $35,000 to $49,999 | 0 | 0.0% |
| $50,000 to $74,999 | 14 | 46.7% |
| $75,000 to $99,999 | 9 | 30.0% |
| $100,000 to $149,999 | 0 | 0.0% |
| $150,000 to $199,999 | 0 | 0.0% |
| $200,000+ | 0 | 0.0% |
Family Income by Famaliy Size in Bluff
| Income Bracket | # Families | Median Income |
| 2-Person Families | 23 (76.7%) | $0 |
| 3-Person Families | 7 (23.3%) | $0 |
| 4-Person Families | 0 (0.0%) | $0 |
| 5-Person Families | 0 (0.0%) | $0 |
| 6-Person Families | 0 (0.0%) | $0 |
| 7+ Person Families | 0 (0.0%) | $0 |
| Total | 30 (100.0%) | $51,429 |
Family Income by Number of Earners in Bluff
| Number of Earners | # Families | Median Income |
| No Earners | 9 (30.0%) | $0 |
| 1 Earner | 14 (46.7%) | $0 |
| 2 Earners | 7 (23.3%) | $0 |
| 3+ Earners | 0 (0.0%) | $0 |
| Total | 30 (100.0%) | $51,429 |
Household Income in Bluff
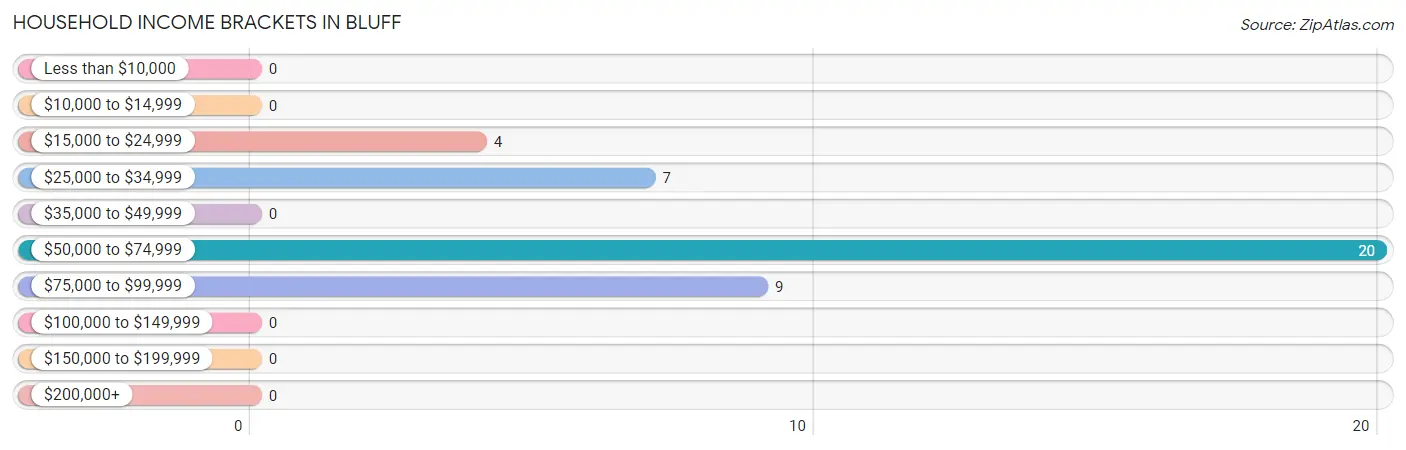
Household Income Brackets in Bluff
With 20 households falling in the category, the $50,000 to $74,999 income range is the most frequent in Bluff, accounting for 50.0% of all households.
| Income Bracket | # Households | % Households |
| Less than $10,000 | 0 | 0.0% |
| $10,000 to $14,999 | 0 | 0.0% |
| $15,000 to $24,999 | 4 | 10.0% |
| $25,000 to $34,999 | 7 | 17.5% |
| $35,000 to $49,999 | 0 | 0.0% |
| $50,000 to $74,999 | 20 | 50.0% |
| $75,000 to $99,999 | 9 | 22.5% |
| $100,000 to $149,999 | 0 | 0.0% |
| $150,000 to $199,999 | 0 | 0.0% |
| $200,000+ | 0 | 0.0% |
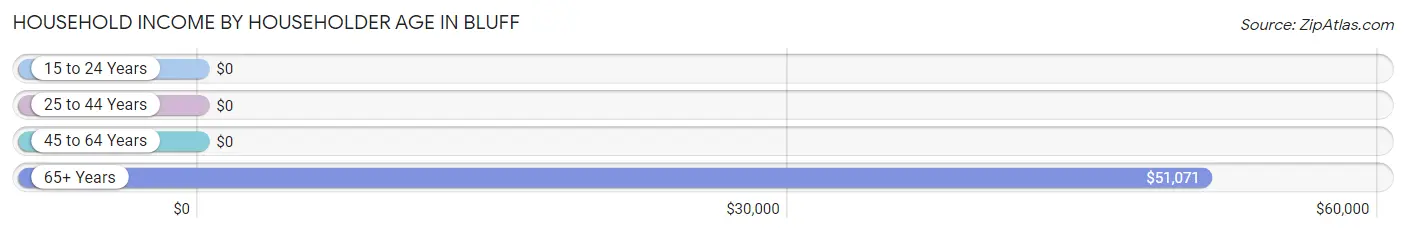
Household Income by Householder Age in Bluff
The median household income in Bluff is $51,607, with the highest median household income of $51,071 found in the 65+ years age bracket for the primary householder. A total of 34 households (85.0%) fall into this category.
| Income Bracket | # Households | Median Income |
| 15 to 24 Years | 0 (0.0%) | $0 |
| 25 to 44 Years | 0 (0.0%) | $0 |
| 45 to 64 Years | 6 (15.0%) | $0 |
| 65+ Years | 34 (85.0%) | $51,071 |
| Total | 40 (100.0%) | $51,607 |
Poverty in Bluff
Income Below Poverty by Sex and Age in Bluff
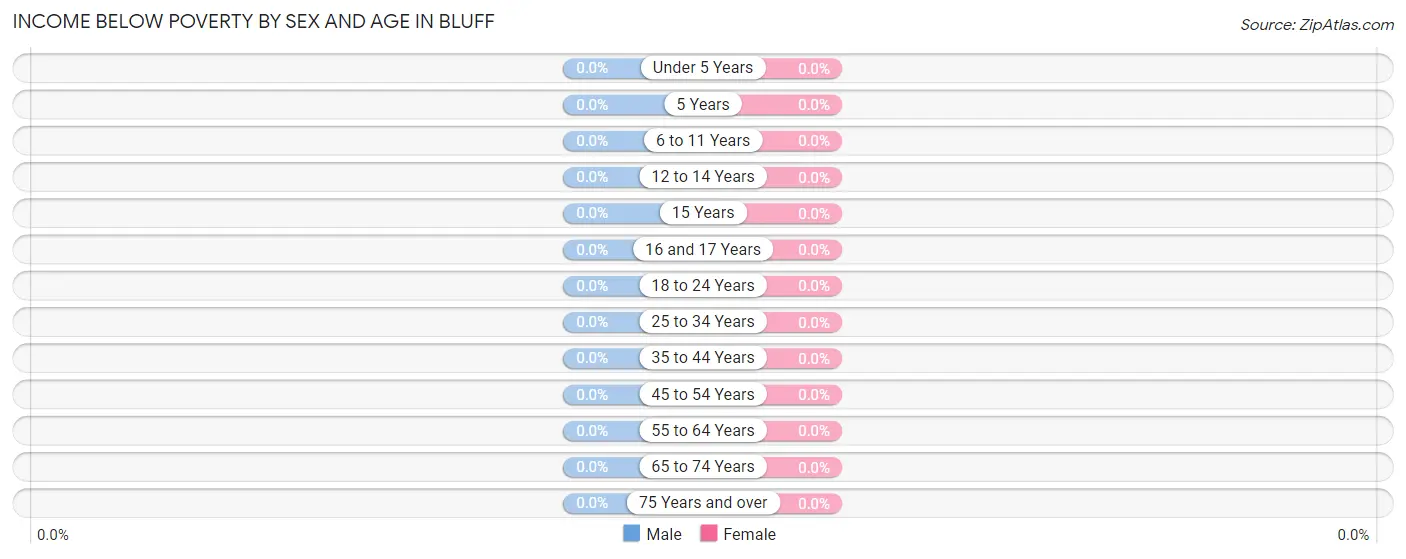
| Age Bracket | Male | Female |
| Under 5 Years | 0 (0.0%) | 0 (0.0%) |
| 5 Years | 0 (0.0%) | 0 (0.0%) |
| 6 to 11 Years | 0 (0.0%) | 0 (0.0%) |
| 12 to 14 Years | 0 (0.0%) | 0 (0.0%) |
| 15 Years | 0 (0.0%) | 0 (0.0%) |
| 16 and 17 Years | 0 (0.0%) | 0 (0.0%) |
| 18 to 24 Years | 0 (0.0%) | 0 (0.0%) |
| 25 to 34 Years | 0 (0.0%) | 0 (0.0%) |
| 35 to 44 Years | 0 (0.0%) | 0 (0.0%) |
| 45 to 54 Years | 0 (0.0%) | 0 (0.0%) |
| 55 to 64 Years | 0 (0.0%) | 0 (0.0%) |
| 65 to 74 Years | 0 (0.0%) | 0 (0.0%) |
| 75 Years and over | 0 (0.0%) | 0 (0.0%) |
| Total | 0 (0.0%) | 0 (0.0%) |
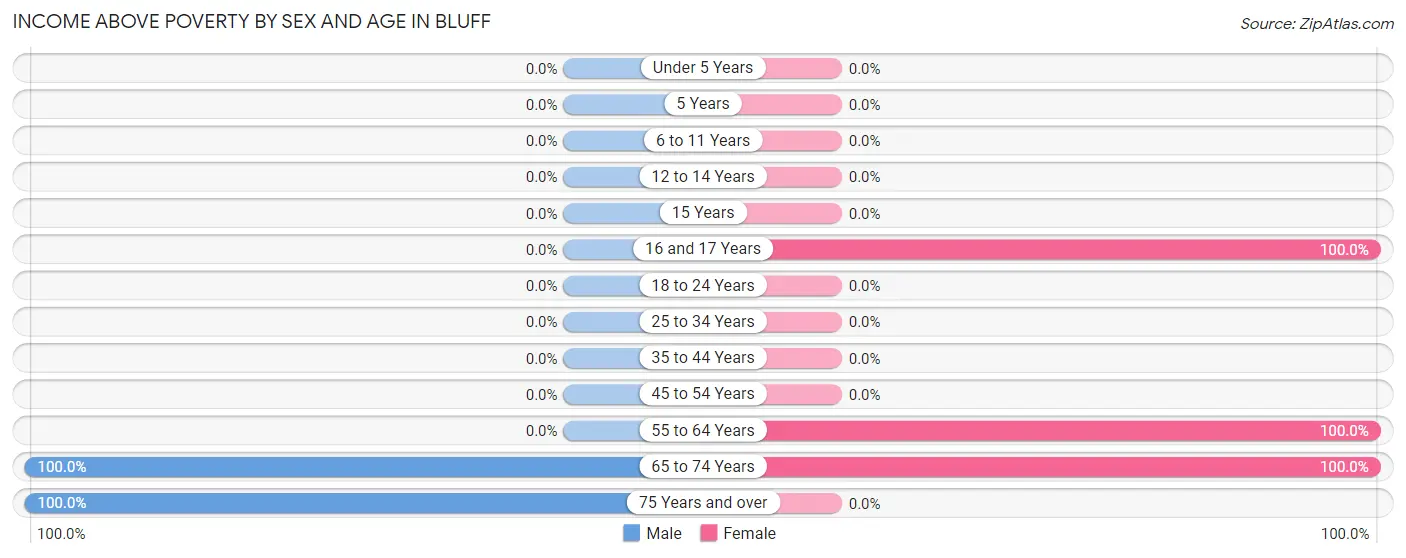
Income Above Poverty by Sex and Age in Bluff
According to the poverty statistics in Bluff, males aged 65 to 74 years and females aged 16 and 17 years are the age groups that are most secure financially, with 100.0% of males and 100.0% of females in these age groups living above the poverty line.
| Age Bracket | Male | Female |
| Under 5 Years | 0 (0.0%) | 0 (0.0%) |
| 5 Years | 0 (0.0%) | 0 (0.0%) |
| 6 to 11 Years | 0 (0.0%) | 0 (0.0%) |
| 12 to 14 Years | 0 (0.0%) | 0 (0.0%) |
| 15 Years | 0 (0.0%) | 0 (0.0%) |
| 16 and 17 Years | 0 (0.0%) | 12 (100.0%) |
| 18 to 24 Years | 0 (0.0%) | 0 (0.0%) |
| 25 to 34 Years | 0 (0.0%) | 0 (0.0%) |
| 35 to 44 Years | 0 (0.0%) | 0 (0.0%) |
| 45 to 54 Years | 0 (0.0%) | 0 (0.0%) |
| 55 to 64 Years | 0 (0.0%) | 13 (100.0%) |
| 65 to 74 Years | 37 (100.0%) | 57 (100.0%) |
| 75 Years and over | 4 (100.0%) | 0 (0.0%) |
| Total | 41 (100.0%) | 82 (100.0%) |
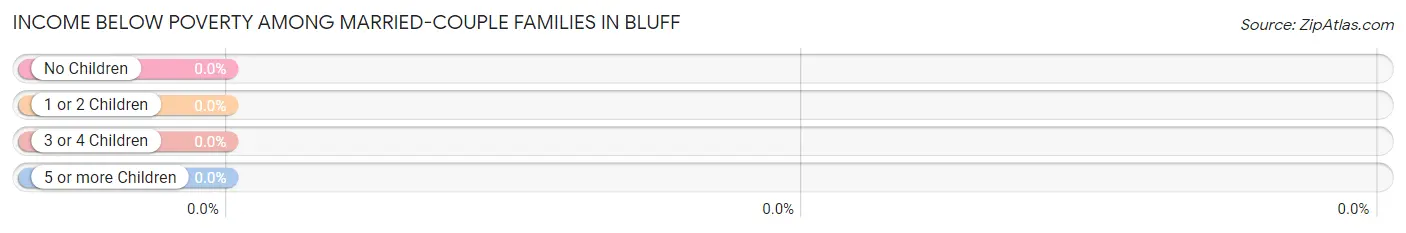
Income Below Poverty Among Married-Couple Families in Bluff
| Children | Above Poverty | Below Poverty |
| No Children | 23 (100.0%) | 0 (0.0%) |
| 1 or 2 Children | 7 (100.0%) | 0 (0.0%) |
| 3 or 4 Children | 0 (0.0%) | 0 (0.0%) |
| 5 or more Children | 0 (0.0%) | 0 (0.0%) |
| Total | 30 (100.0%) | 0 (0.0%) |
Income Below Poverty Among Single-Parent Households in Bluff
| Children | Single Father | Single Mother |
| No Children | 0 (0.0%) | 0 (0.0%) |
| 1 or 2 Children | 0 (0.0%) | 0 (0.0%) |
| 3 or 4 Children | 0 (0.0%) | 0 (0.0%) |
| 5 or more Children | 0 (0.0%) | 0 (0.0%) |
| Total | 0 (0.0%) | 0 (0.0%) |
Income Below Poverty Among Married-Couple vs Single-Parent Households in Bluff
| Children | Married-Couple Families | Single-Parent Households |
| No Children | 0 (0.0%) | 0 (0.0%) |
| 1 or 2 Children | 0 (0.0%) | 0 (0.0%) |
| 3 or 4 Children | 0 (0.0%) | 0 (0.0%) |
| 5 or more Children | 0 (0.0%) | 0 (0.0%) |
| Total | 0 (0.0%) | 0 (0.0%) |
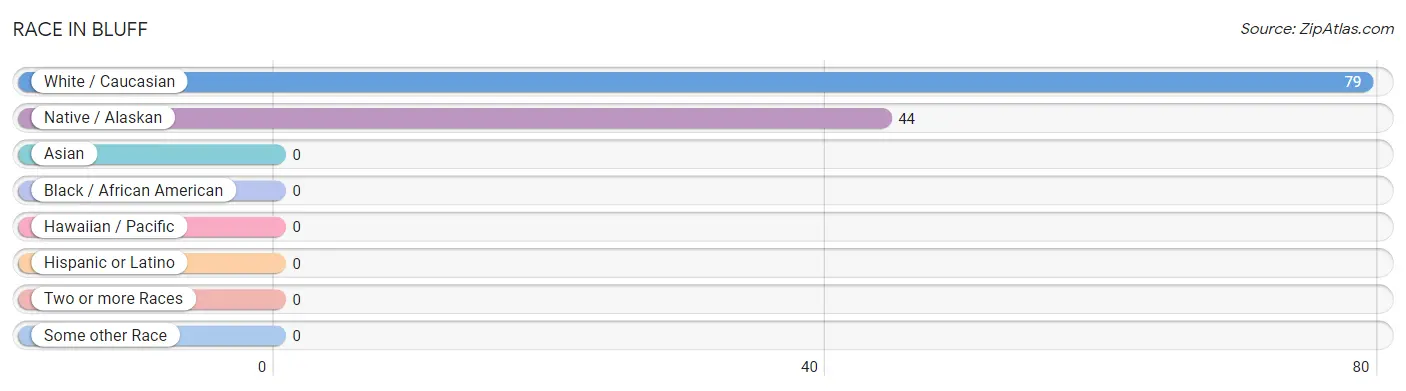
Race in Bluff
The most populous races in Bluff are White / Caucasian (79 | 64.2%), and Native / Alaskan (44 | 35.8%).
| Race | # Population | % Population |
| Asian | 0 | 0.0% |
| Black / African American | 0 | 0.0% |
| Hawaiian / Pacific | 0 | 0.0% |
| Hispanic or Latino | 0 | 0.0% |
| Native / Alaskan | 44 | 35.8% |
| White / Caucasian | 79 | 64.2% |
| Two or more Races | 0 | 0.0% |
| Some other Race | 0 | 0.0% |
| Total | 123 | 100.0% |
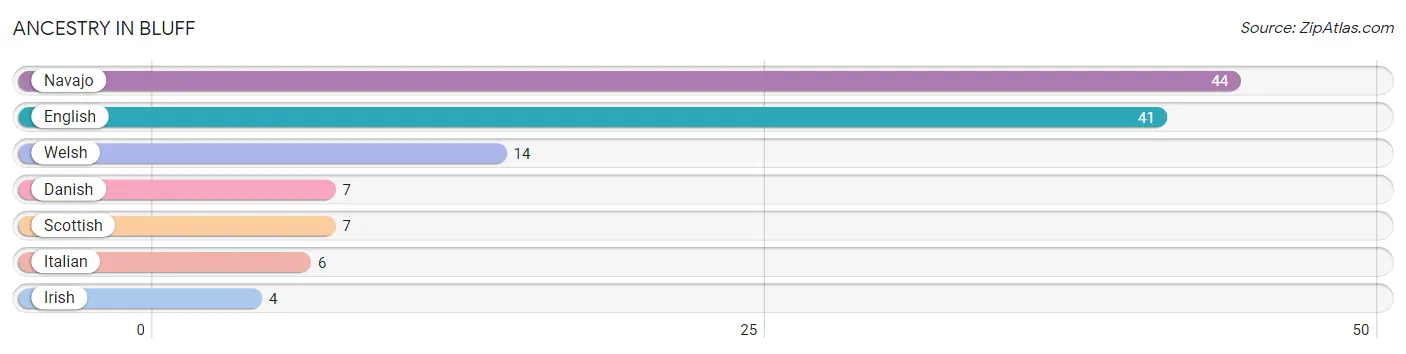
Ancestry in Bluff
The most populous ancestries reported in Bluff are Navajo (44 | 35.8%), English (41 | 33.3%), Welsh (14 | 11.4%), Danish (7 | 5.7%), and Scottish (7 | 5.7%), together accounting for 91.9% of all Bluff residents.
| Ancestry | # Population | % Population |
| Danish | 7 | 5.7% |
| English | 41 | 33.3% |
| Irish | 4 | 3.3% |
| Italian | 6 | 4.9% |
| Navajo | 44 | 35.8% |
| Scottish | 7 | 5.7% |
| Welsh | 14 | 11.4% | View All 7 Rows |
Immigrants in Bluff

| Immigration Origin | # Population | % Population | View All 0 Rows |
Sex and Age in Bluff
Sex and Age in Bluff
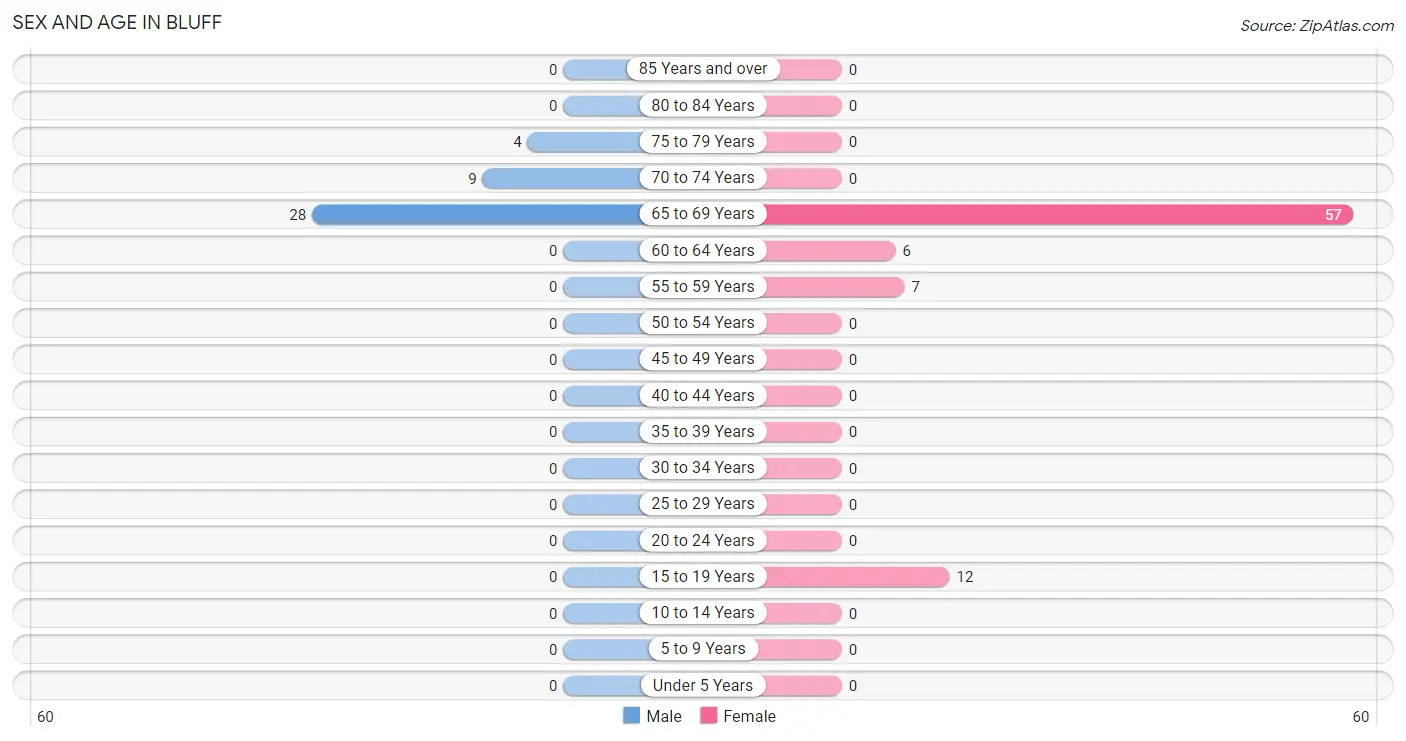
The most populous age groups in Bluff are 65 to 69 Years (28 | 68.3%) for men and 65 to 69 Years (57 | 69.5%) for women.
| Age Bracket | Male | Female |
| Under 5 Years | 0 (0.0%) | 0 (0.0%) |
| 5 to 9 Years | 0 (0.0%) | 0 (0.0%) |
| 10 to 14 Years | 0 (0.0%) | 0 (0.0%) |
| 15 to 19 Years | 0 (0.0%) | 12 (14.6%) |
| 20 to 24 Years | 0 (0.0%) | 0 (0.0%) |
| 25 to 29 Years | 0 (0.0%) | 0 (0.0%) |
| 30 to 34 Years | 0 (0.0%) | 0 (0.0%) |
| 35 to 39 Years | 0 (0.0%) | 0 (0.0%) |
| 40 to 44 Years | 0 (0.0%) | 0 (0.0%) |
| 45 to 49 Years | 0 (0.0%) | 0 (0.0%) |
| 50 to 54 Years | 0 (0.0%) | 0 (0.0%) |
| 55 to 59 Years | 0 (0.0%) | 7 (8.5%) |
| 60 to 64 Years | 0 (0.0%) | 6 (7.3%) |
| 65 to 69 Years | 28 (68.3%) | 57 (69.5%) |
| 70 to 74 Years | 9 (22.0%) | 0 (0.0%) |
| 75 to 79 Years | 4 (9.8%) | 0 (0.0%) |
| 80 to 84 Years | 0 (0.0%) | 0 (0.0%) |
| 85 Years and over | 0 (0.0%) | 0 (0.0%) |
| Total | 41 (100.0%) | 82 (100.0%) |
Families and Households in Bluff
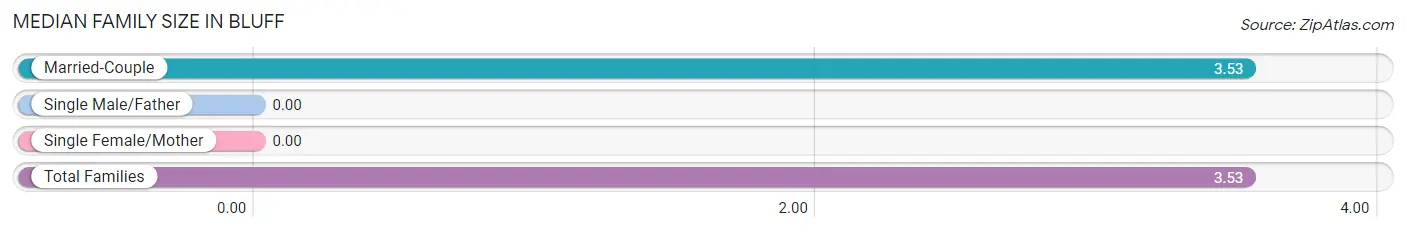
Median Family Size in Bluff
| Family Type | # Families | Family Size |
| Married-Couple | 30 (100.0%) | 3.53 |
| Single Male/Father | 0 (0.0%) | - |
| Single Female/Mother | 0 (0.0%) | - |
| Total Families | 30 (100.0%) | 3.53 |
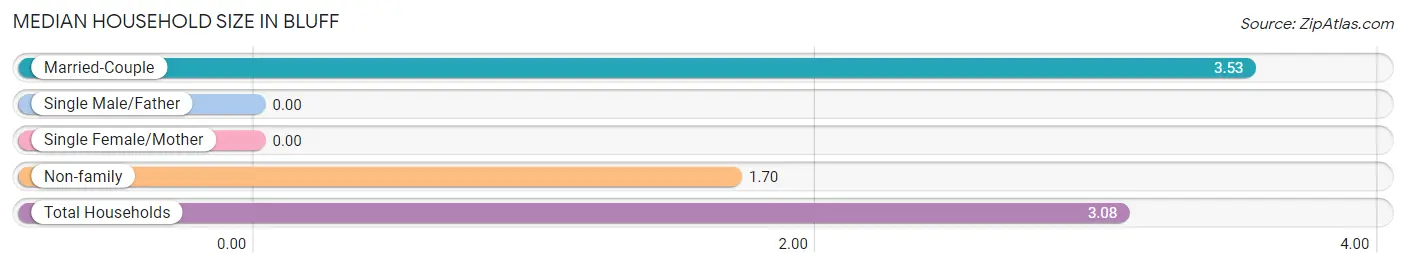
Median Household Size in Bluff
| Household Type | # Households | Household Size |
| Married-Couple | 30 (75.0%) | 3.53 |
| Single Male/Father | 0 (0.0%) | - |
| Single Female/Mother | 0 (0.0%) | - |
| Non-family | 10 (25.0%) | 1.70 |
| Total Households | 40 (100.0%) | 3.08 |
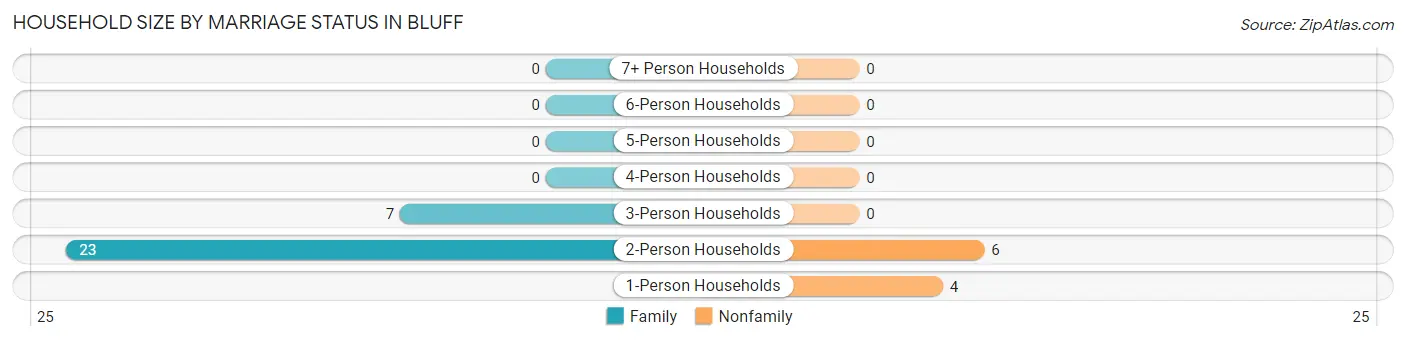
Household Size by Marriage Status in Bluff
Out of a total of 40 households in Bluff, 30 (75.0%) are family households, while 10 (25.0%) are nonfamily households. The most numerous type of family households are 2-person households, comprising 23, and the most common type of nonfamily households are 2-person households, comprising 6.
| Household Size | Family Households | Nonfamily Households |
| 1-Person Households | - | 4 (10.0%) |
| 2-Person Households | 23 (57.5%) | 6 (15.0%) |
| 3-Person Households | 7 (17.5%) | 0 (0.0%) |
| 4-Person Households | 0 (0.0%) | 0 (0.0%) |
| 5-Person Households | 0 (0.0%) | 0 (0.0%) |
| 6-Person Households | 0 (0.0%) | 0 (0.0%) |
| 7+ Person Households | 0 (0.0%) | 0 (0.0%) |
| Total | 30 (75.0%) | 10 (25.0%) |
Female Fertility in Bluff
Fertility by Age in Bluff
| Age Bracket | Women with Births | Births / 1,000 Women |
| 15 to 19 years | 0 (0.0%) | 0.0 |
| 20 to 34 years | 0 (0.0%) | 0.0 |
| 35 to 50 years | 0 (0.0%) | 0.0 |
| Total | 0 (0.0%) | 0.0 |
Fertility by Age by Marriage Status in Bluff
| Age Bracket | Married | Unmarried |
| 15 to 19 years | 0 (0.0%) | 0 (0.0%) |
| 20 to 34 years | 0 (0.0%) | 0 (0.0%) |
| 35 to 50 years | 0 (0.0%) | 0 (0.0%) |
| Total | 0 (0.0%) | 0 (0.0%) |
Fertility by Education in Bluff
| Educational Attainment | Women with Births | Births / 1,000 Women |
| Less than High School | 0 (0.0%) | 0.0 |
| High School Diploma | 0 (0.0%) | 0.0 |
| College or Associate's Degree | 0 (0.0%) | 0.0 |
| Bachelor's Degree | 0 (0.0%) | 0.0 |
| Graduate Degree | 0 (0.0%) | 0.0 |
| Total | 0 (0.0%) | 0.0 |
Fertility by Education by Marriage Status in Bluff
| Educational Attainment | Married | Unmarried |
| Less than High School | 0 (0.0%) | 0 (0.0%) |
| High School Diploma | 0 (0.0%) | 0 (0.0%) |
| College or Associate's Degree | 0 (0.0%) | 0 (0.0%) |
| Bachelor's Degree | 0 (0.0%) | 0 (0.0%) |
| Graduate Degree | 0 (0.0%) | 0 (0.0%) |
| Total | 0 (0.0%) | 0 (0.0%) |
Employment Characteristics in Bluff
Employment by Class of Employer in Bluff
Among the 27 employed individuals in Bluff, state government employees (20 | 74.1%), and private company employees (7 | 25.9%) make up the most common classes of employment.
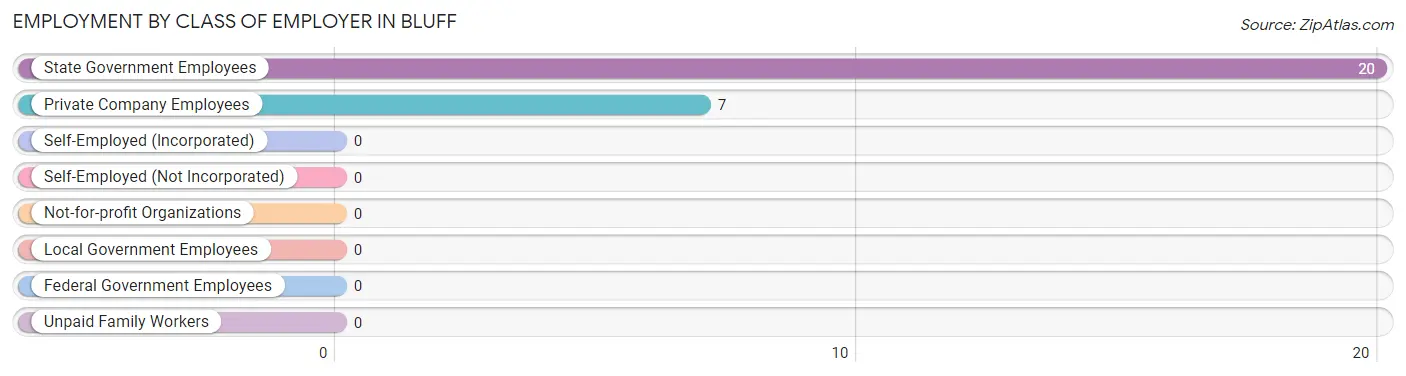
| Employer Class | # Employees | % Employees |
| Private Company Employees | 7 | 25.9% |
| Self-Employed (Incorporated) | 0 | 0.0% |
| Self-Employed (Not Incorporated) | 0 | 0.0% |
| Not-for-profit Organizations | 0 | 0.0% |
| Local Government Employees | 0 | 0.0% |
| State Government Employees | 20 | 74.1% |
| Federal Government Employees | 0 | 0.0% |
| Unpaid Family Workers | 0 | 0.0% |
| Total | 27 | 100.0% |
Employment Status by Age in Bluff
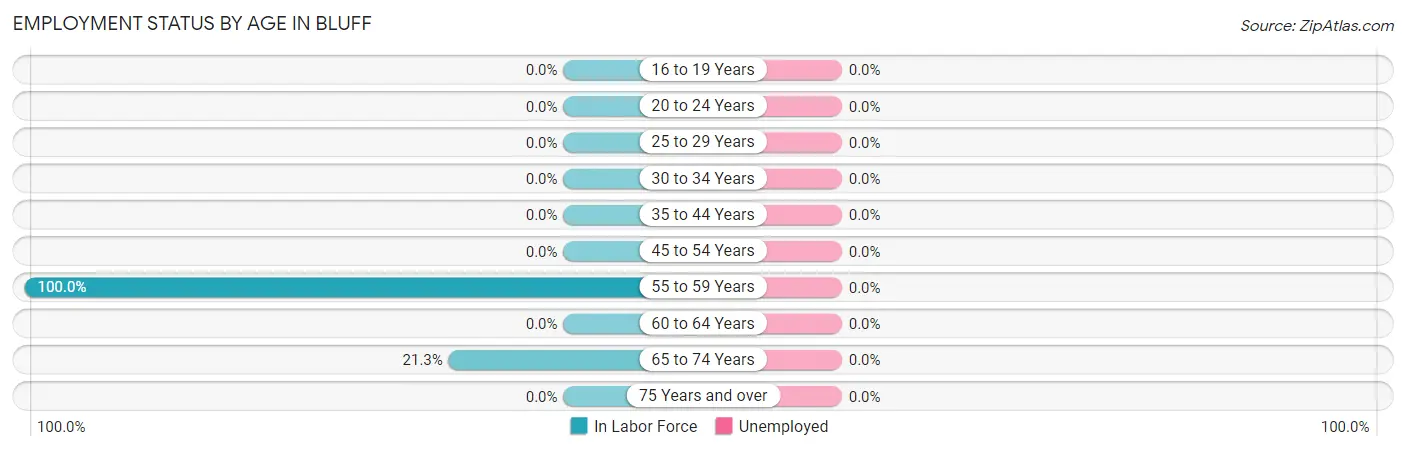
| Age Bracket | In Labor Force | Unemployed |
| 16 to 19 Years | 0 (0.0%) | 0 (0.0%) |
| 20 to 24 Years | 0 (0.0%) | 0 (0.0%) |
| 25 to 29 Years | 0 (0.0%) | 0 (0.0%) |
| 30 to 34 Years | 0 (0.0%) | 0 (0.0%) |
| 35 to 44 Years | 0 (0.0%) | 0 (0.0%) |
| 45 to 54 Years | 0 (0.0%) | 0 (0.0%) |
| 55 to 59 Years | 7 (100.0%) | 0 (0.0%) |
| 60 to 64 Years | 0 (0.0%) | 0 (0.0%) |
| 65 to 74 Years | 20 (21.3%) | 0 (0.0%) |
| 75 Years and over | 0 (0.0%) | 0 (0.0%) |
| Total | 27 (22.0%) | 0 (0.0%) |
Employment Status by Educational Attainment in Bluff
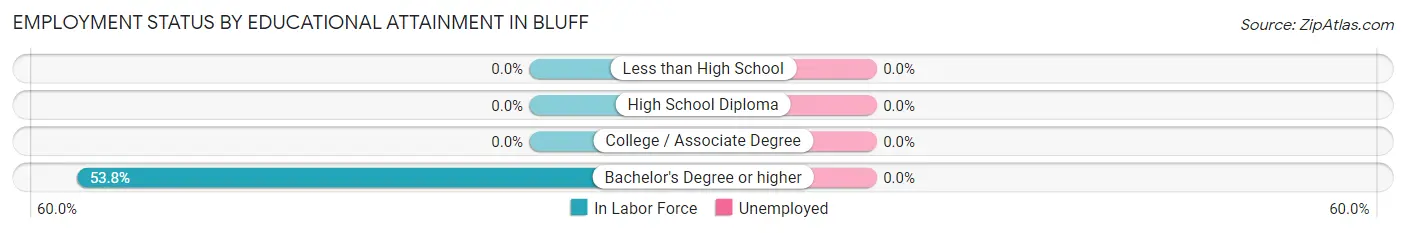
| Educational Attainment | In Labor Force | Unemployed |
| Less than High School | 0 (0.0%) | 0 (0.0%) |
| High School Diploma | 0 (0.0%) | 0 (0.0%) |
| College / Associate Degree | 0 (0.0%) | 0 (0.0%) |
| Bachelor's Degree or higher | 7 (53.8%) | 0 (0.0%) |
| Total | 7 (53.8%) | 0 (0.0%) |
Employment Occupations by Sex in Bluff
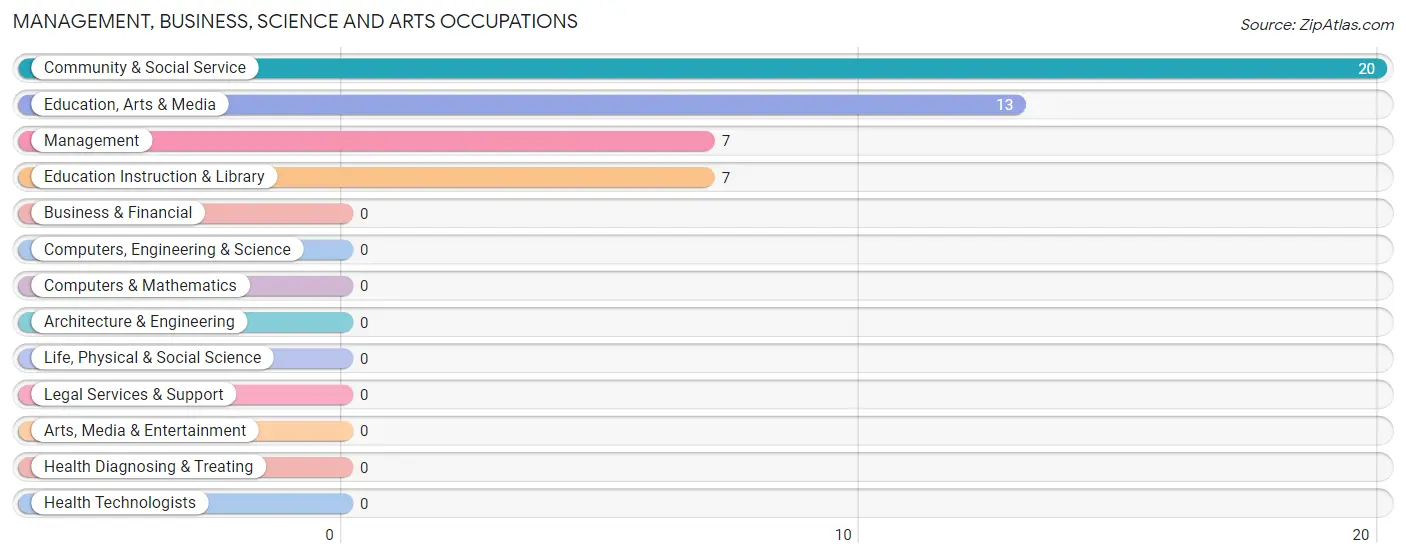
Management, Business, Science and Arts Occupations
The most common Management, Business, Science and Arts occupations in Bluff are Community & Social Service (20 | 74.1%), Education, Arts & Media (13 | 48.1%), Management (7 | 25.9%), and Education Instruction & Library (7 | 25.9%).
Management, Business, Science and Arts Occupations by Sex
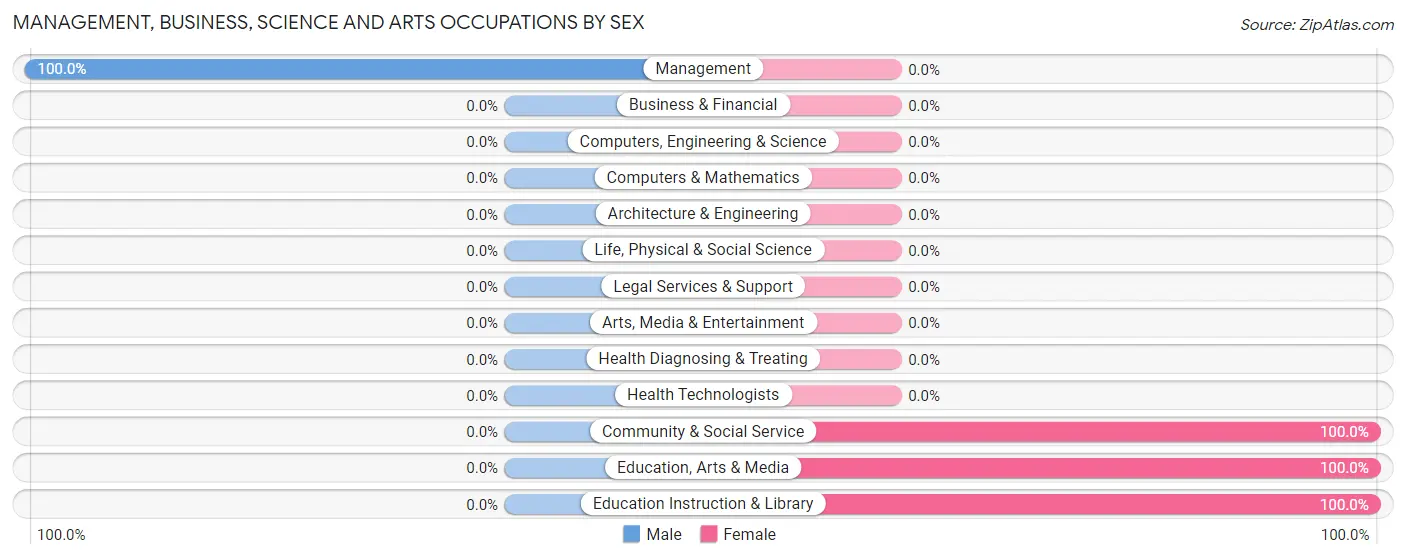
| Occupation | Male | Female |
| Management | 7 (100.0%) | 0 (0.0%) |
| Business & Financial | 0 (0.0%) | 0 (0.0%) |
| Computers, Engineering & Science | 0 (0.0%) | 0 (0.0%) |
| Computers & Mathematics | 0 (0.0%) | 0 (0.0%) |
| Architecture & Engineering | 0 (0.0%) | 0 (0.0%) |
| Life, Physical & Social Science | 0 (0.0%) | 0 (0.0%) |
| Community & Social Service | 0 (0.0%) | 20 (100.0%) |
| Education, Arts & Media | 0 (0.0%) | 13 (100.0%) |
| Legal Services & Support | 0 (0.0%) | 0 (0.0%) |
| Education Instruction & Library | 0 (0.0%) | 7 (100.0%) |
| Arts, Media & Entertainment | 0 (0.0%) | 0 (0.0%) |
| Health Diagnosing & Treating | 0 (0.0%) | 0 (0.0%) |
| Health Technologists | 0 (0.0%) | 0 (0.0%) |
| Total (Category) | 7 (25.9%) | 20 (74.1%) |
| Total (Overall) | 7 (25.9%) | 20 (74.1%) |
Services Occupations
Services Occupations by Sex
| Occupation | Male | Female |
| Healthcare Support | 0 (0.0%) | 0 (0.0%) |
| Security & Protection | 0 (0.0%) | 0 (0.0%) |
| Firefighting & Prevention | 0 (0.0%) | 0 (0.0%) |
| Law Enforcement | 0 (0.0%) | 0 (0.0%) |
| Food Preparation & Serving | 0 (0.0%) | 0 (0.0%) |
| Cleaning & Maintenance | 0 (0.0%) | 0 (0.0%) |
| Personal Care & Service | 0 (0.0%) | 0 (0.0%) |
| Total (Category) | 0 (0.0%) | 0 (0.0%) |
| Total (Overall) | 7 (25.9%) | 20 (74.1%) |
Sales and Office Occupations
Sales and Office Occupations by Sex
| Occupation | Male | Female |
| Sales & Related | 0 (0.0%) | 0 (0.0%) |
| Office & Administration | 0 (0.0%) | 0 (0.0%) |
| Total (Category) | 0 (0.0%) | 0 (0.0%) |
| Total (Overall) | 7 (25.9%) | 20 (74.1%) |
Natural Resources, Construction and Maintenance Occupations

Natural Resources, Construction and Maintenance Occupations by Sex
| Occupation | Male | Female |
| Farming, Fishing & Forestry | 0 (0.0%) | 0 (0.0%) |
| Construction & Extraction | 0 (0.0%) | 0 (0.0%) |
| Installation, Maintenance & Repair | 0 (0.0%) | 0 (0.0%) |
| Total (Category) | 0 (0.0%) | 0 (0.0%) |
| Total (Overall) | 7 (25.9%) | 20 (74.1%) |
Production, Transportation and Moving Occupations
Production, Transportation and Moving Occupations by Sex
| Occupation | Male | Female |
| Production | 0 (0.0%) | 0 (0.0%) |
| Transportation | 0 (0.0%) | 0 (0.0%) |
| Material Moving | 0 (0.0%) | 0 (0.0%) |
| Total (Category) | 0 (0.0%) | 0 (0.0%) |
| Total (Overall) | 7 (25.9%) | 20 (74.1%) |
Employment Industries by Sex in Bluff
Employment Industries in Bluff
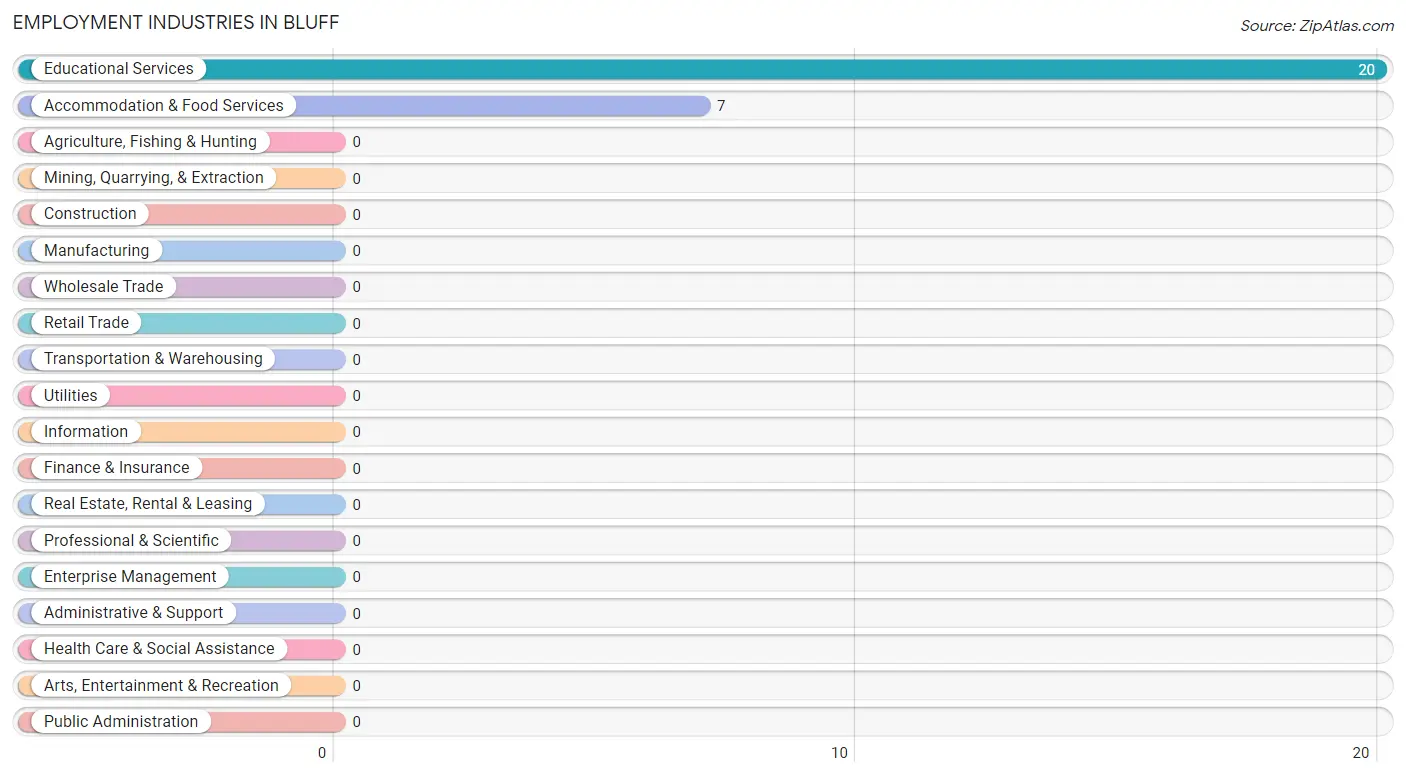
The major employment industries in Bluff include Educational Services (20 | 74.1%), and Accommodation & Food Services (7 | 25.9%).
Employment Industries by Sex in Bluff
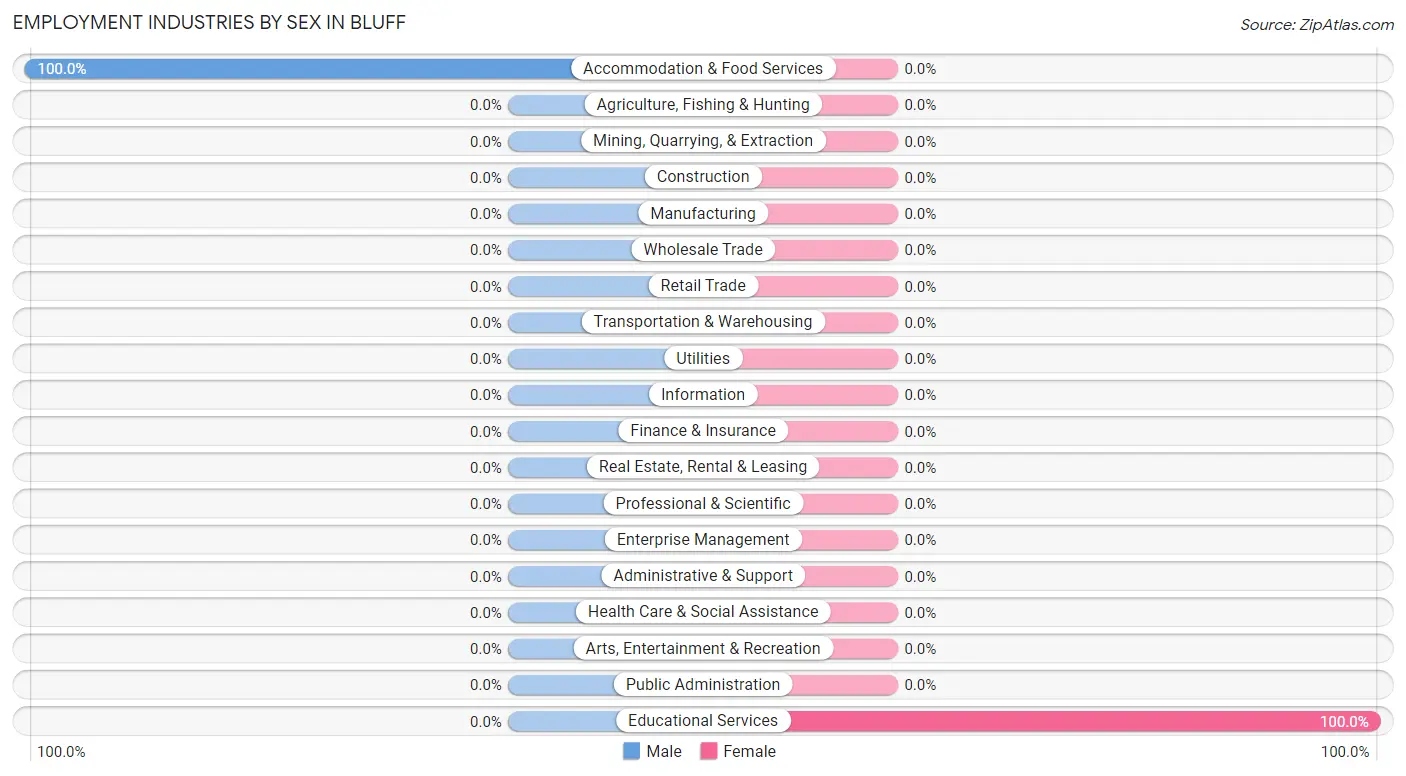
| Industry | Male | Female |
| Agriculture, Fishing & Hunting | 0 (0.0%) | 0 (0.0%) |
| Mining, Quarrying, & Extraction | 0 (0.0%) | 0 (0.0%) |
| Construction | 0 (0.0%) | 0 (0.0%) |
| Manufacturing | 0 (0.0%) | 0 (0.0%) |
| Wholesale Trade | 0 (0.0%) | 0 (0.0%) |
| Retail Trade | 0 (0.0%) | 0 (0.0%) |
| Transportation & Warehousing | 0 (0.0%) | 0 (0.0%) |
| Utilities | 0 (0.0%) | 0 (0.0%) |
| Information | 0 (0.0%) | 0 (0.0%) |
| Finance & Insurance | 0 (0.0%) | 0 (0.0%) |
| Real Estate, Rental & Leasing | 0 (0.0%) | 0 (0.0%) |
| Professional & Scientific | 0 (0.0%) | 0 (0.0%) |
| Enterprise Management | 0 (0.0%) | 0 (0.0%) |
| Administrative & Support | 0 (0.0%) | 0 (0.0%) |
| Educational Services | 0 (0.0%) | 20 (100.0%) |
| Health Care & Social Assistance | 0 (0.0%) | 0 (0.0%) |
| Arts, Entertainment & Recreation | 0 (0.0%) | 0 (0.0%) |
| Accommodation & Food Services | 7 (100.0%) | 0 (0.0%) |
| Public Administration | 0 (0.0%) | 0 (0.0%) |
| Total | 7 (25.9%) | 20 (74.1%) |
Education in Bluff
School Enrollment in Bluff
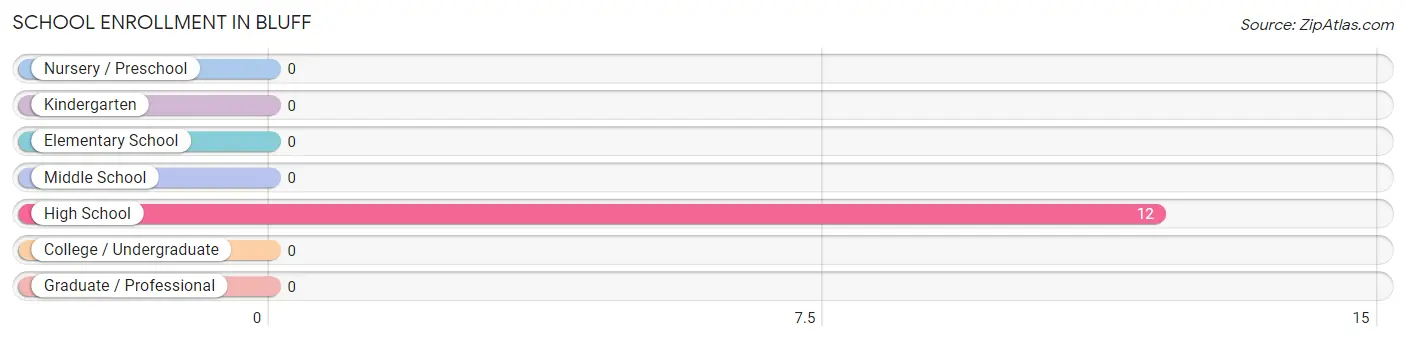
| School Level | # Students | % Students |
| Nursery / Preschool | 0 | 0.0% |
| Kindergarten | 0 | 0.0% |
| Elementary School | 0 | 0.0% |
| Middle School | 0 | 0.0% |
| High School | 12 | 100.0% |
| College / Undergraduate | 0 | 0.0% |
| Graduate / Professional | 0 | 0.0% |
| Total | 12 | 100.0% |
School Enrollment by Age by Funding Source in Bluff
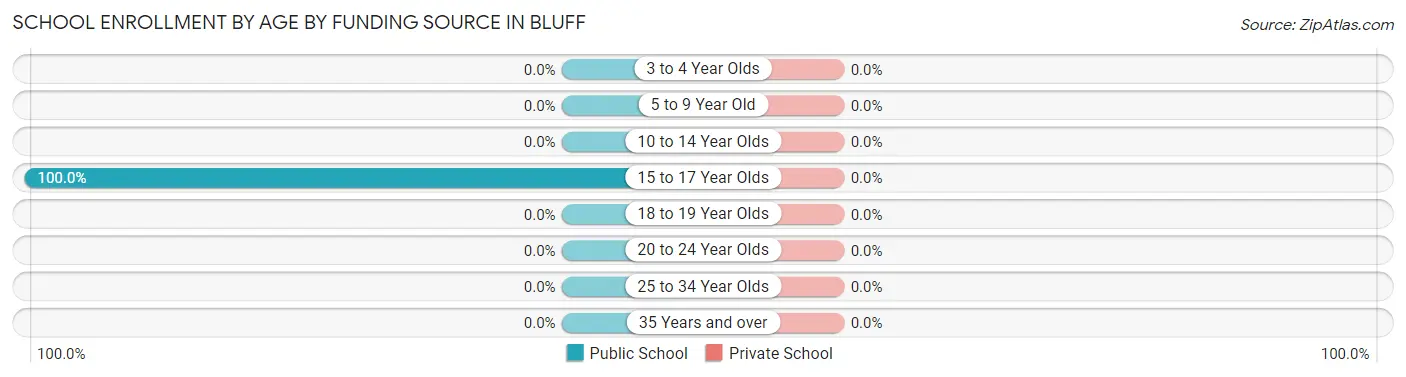
| Age Bracket | Public School | Private School |
| 3 to 4 Year Olds | 0 (0.0%) | 0 (0.0%) |
| 5 to 9 Year Old | 0 (0.0%) | 0 (0.0%) |
| 10 to 14 Year Olds | 0 (0.0%) | 0 (0.0%) |
| 15 to 17 Year Olds | 12 (100.0%) | 0 (0.0%) |
| 18 to 19 Year Olds | 0 (0.0%) | 0 (0.0%) |
| 20 to 24 Year Olds | 0 (0.0%) | 0 (0.0%) |
| 25 to 34 Year Olds | 0 (0.0%) | 0 (0.0%) |
| 35 Years and over | 0 (0.0%) | 0 (0.0%) |
| Total | 12 (100.0%) | 0 (0.0%) |
Educational Attainment by Field of Study in Bluff
Psychology (44 | 60.3%), education (9 | 12.3%), bio, nature & agricultural (7 | 9.6%), science & technology (7 | 9.6%), and visual & performing arts (6 | 8.2%) are the most common fields of study among 73 individuals in Bluff who have obtained a bachelor's degree or higher.
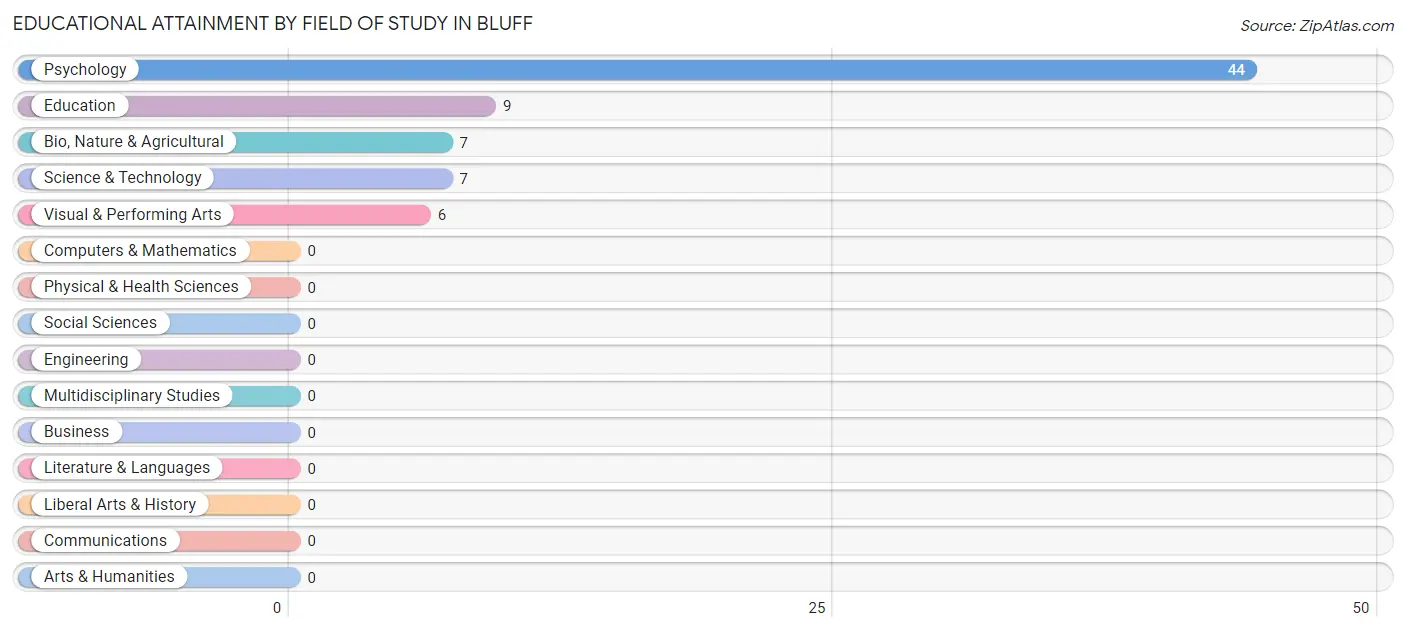
| Field of Study | # Graduates | % Graduates |
| Computers & Mathematics | 0 | 0.0% |
| Bio, Nature & Agricultural | 7 | 9.6% |
| Physical & Health Sciences | 0 | 0.0% |
| Psychology | 44 | 60.3% |
| Social Sciences | 0 | 0.0% |
| Engineering | 0 | 0.0% |
| Multidisciplinary Studies | 0 | 0.0% |
| Science & Technology | 7 | 9.6% |
| Business | 0 | 0.0% |
| Education | 9 | 12.3% |
| Literature & Languages | 0 | 0.0% |
| Liberal Arts & History | 0 | 0.0% |
| Visual & Performing Arts | 6 | 8.2% |
| Communications | 0 | 0.0% |
| Arts & Humanities | 0 | 0.0% |
| Total | 73 | 100.0% |
Transportation & Commute in Bluff
Vehicle Availability by Sex in Bluff
The most prevalent vehicle ownership categories in Bluff are males with 2 vehicles (7, accounting for 100.0%) and females with 2 vehicles (7, making up 35.0%).
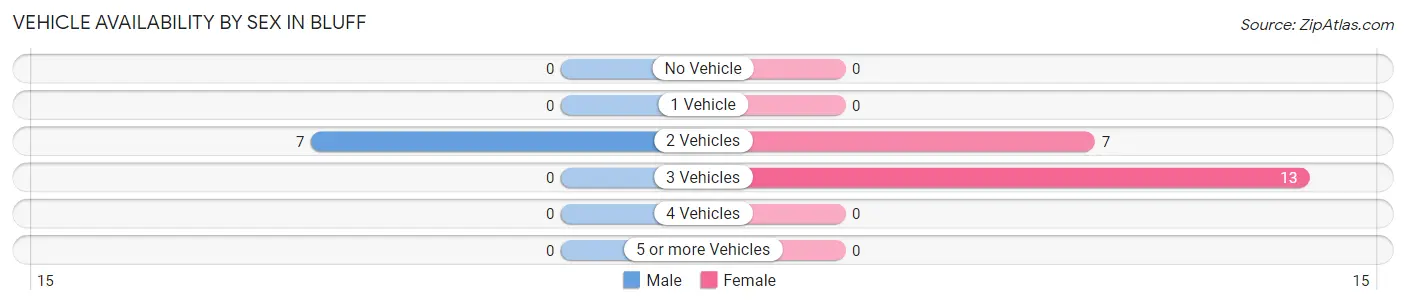
| Vehicles Available | Male | Female |
| No Vehicle | 0 (0.0%) | 0 (0.0%) |
| 1 Vehicle | 0 (0.0%) | 0 (0.0%) |
| 2 Vehicles | 7 (100.0%) | 7 (35.0%) |
| 3 Vehicles | 0 (0.0%) | 13 (65.0%) |
| 4 Vehicles | 0 (0.0%) | 0 (0.0%) |
| 5 or more Vehicles | 0 (0.0%) | 0 (0.0%) |
| Total | 7 (100.0%) | 20 (100.0%) |
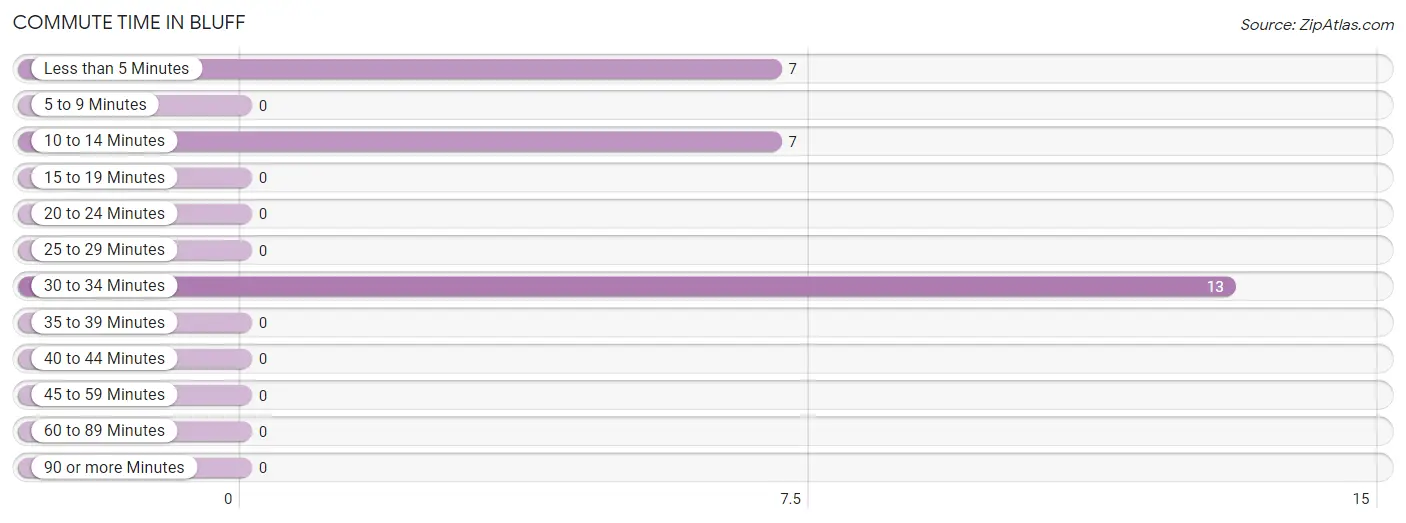
Commute Time in Bluff
The most frequently occuring commute durations in Bluff are 30 to 34 minutes (13 commuters, 48.1%), less than 5 minutes (7 commuters, 25.9%), and 10 to 14 minutes (7 commuters, 25.9%).
| Commute Time | # Commuters | % Commuters |
| Less than 5 Minutes | 7 | 25.9% |
| 5 to 9 Minutes | 0 | 0.0% |
| 10 to 14 Minutes | 7 | 25.9% |
| 15 to 19 Minutes | 0 | 0.0% |
| 20 to 24 Minutes | 0 | 0.0% |
| 25 to 29 Minutes | 0 | 0.0% |
| 30 to 34 Minutes | 13 | 48.1% |
| 35 to 39 Minutes | 0 | 0.0% |
| 40 to 44 Minutes | 0 | 0.0% |
| 45 to 59 Minutes | 0 | 0.0% |
| 60 to 89 Minutes | 0 | 0.0% |
| 90 or more Minutes | 0 | 0.0% |
Commute Time by Sex in Bluff
The most common commute times in Bluff are less than 5 minutes (7 commuters, 100.0%) for males and 30 to 34 minutes (13 commuters, 65.0%) for females.
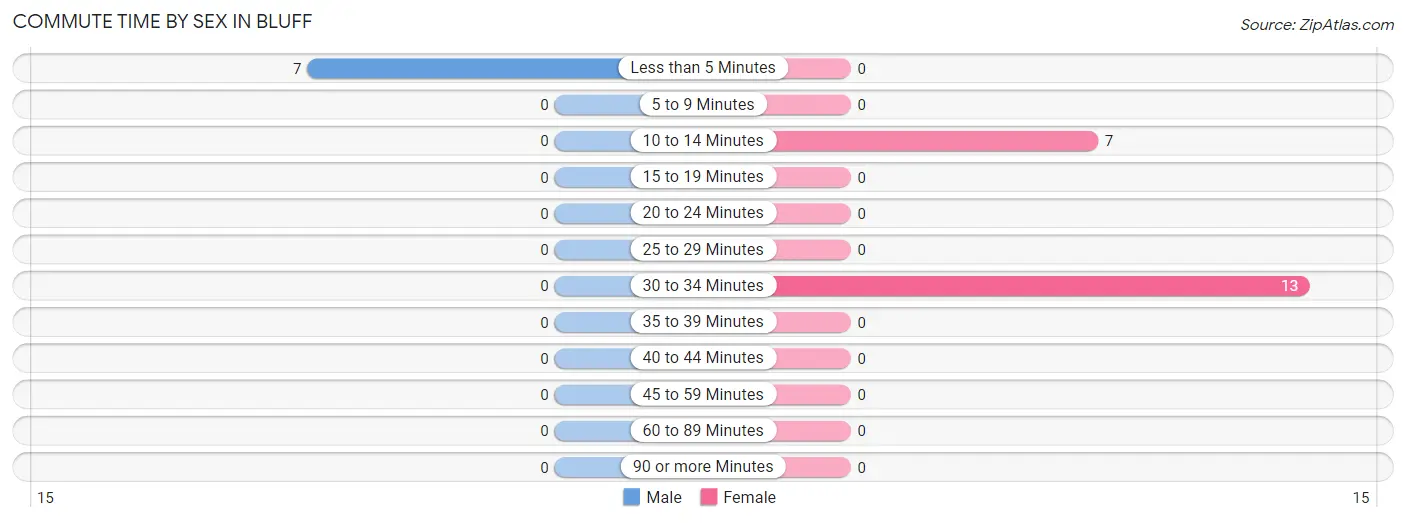
| Commute Time | Male | Female |
| Less than 5 Minutes | 7 (100.0%) | 0 (0.0%) |
| 5 to 9 Minutes | 0 (0.0%) | 0 (0.0%) |
| 10 to 14 Minutes | 0 (0.0%) | 7 (35.0%) |
| 15 to 19 Minutes | 0 (0.0%) | 0 (0.0%) |
| 20 to 24 Minutes | 0 (0.0%) | 0 (0.0%) |
| 25 to 29 Minutes | 0 (0.0%) | 0 (0.0%) |
| 30 to 34 Minutes | 0 (0.0%) | 13 (65.0%) |
| 35 to 39 Minutes | 0 (0.0%) | 0 (0.0%) |
| 40 to 44 Minutes | 0 (0.0%) | 0 (0.0%) |
| 45 to 59 Minutes | 0 (0.0%) | 0 (0.0%) |
| 60 to 89 Minutes | 0 (0.0%) | 0 (0.0%) |
| 90 or more Minutes | 0 (0.0%) | 0 (0.0%) |
Time of Departure to Work by Sex in Bluff
The most frequent times of departure to work in Bluff are 9:00 AM to 9:59 AM (7, 100.0%) for males and 6:30 AM to 6:59 AM (13, 65.0%) for females.
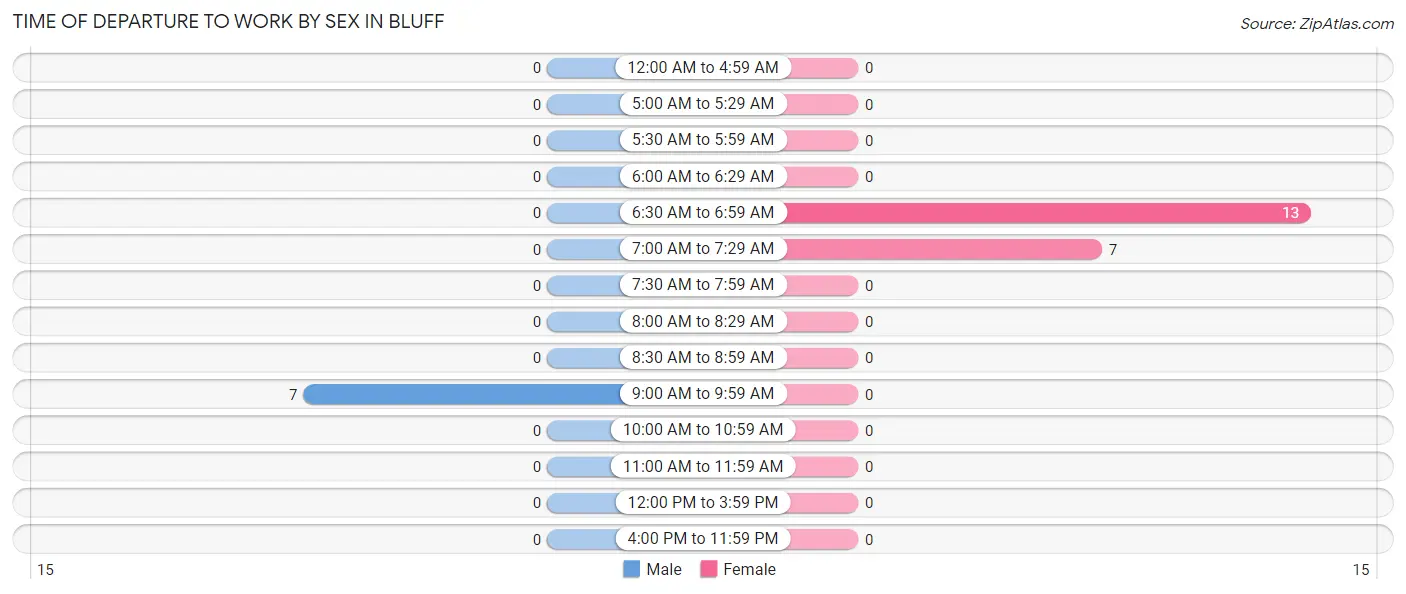
| Time of Departure | Male | Female |
| 12:00 AM to 4:59 AM | 0 (0.0%) | 0 (0.0%) |
| 5:00 AM to 5:29 AM | 0 (0.0%) | 0 (0.0%) |
| 5:30 AM to 5:59 AM | 0 (0.0%) | 0 (0.0%) |
| 6:00 AM to 6:29 AM | 0 (0.0%) | 0 (0.0%) |
| 6:30 AM to 6:59 AM | 0 (0.0%) | 13 (65.0%) |
| 7:00 AM to 7:29 AM | 0 (0.0%) | 7 (35.0%) |
| 7:30 AM to 7:59 AM | 0 (0.0%) | 0 (0.0%) |
| 8:00 AM to 8:29 AM | 0 (0.0%) | 0 (0.0%) |
| 8:30 AM to 8:59 AM | 0 (0.0%) | 0 (0.0%) |
| 9:00 AM to 9:59 AM | 7 (100.0%) | 0 (0.0%) |
| 10:00 AM to 10:59 AM | 0 (0.0%) | 0 (0.0%) |
| 11:00 AM to 11:59 AM | 0 (0.0%) | 0 (0.0%) |
| 12:00 PM to 3:59 PM | 0 (0.0%) | 0 (0.0%) |
| 4:00 PM to 11:59 PM | 0 (0.0%) | 0 (0.0%) |
| Total | 7 (100.0%) | 20 (100.0%) |
Housing Occupancy in Bluff
Occupancy by Ownership in Bluff
Of the total 40 dwellings in Bluff, owner-occupied units account for 40 (100.0%), while renter-occupied units make up 0 (0.0%).
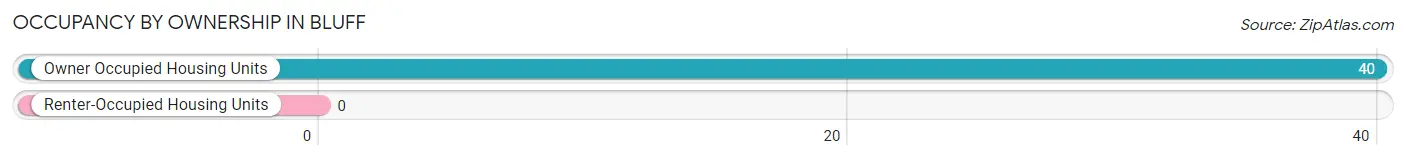
| Occupancy | # Housing Units | % Housing Units |
| Owner Occupied Housing Units | 40 | 100.0% |
| Renter-Occupied Housing Units | 0 | 0.0% |
| Total Occupied Housing Units | 40 | 100.0% |
Occupancy by Household Size in Bluff
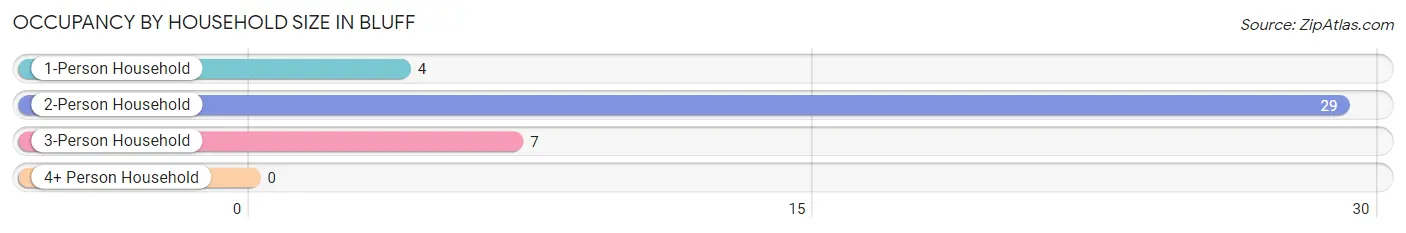
| Household Size | # Housing Units | % Housing Units |
| 1-Person Household | 4 | 10.0% |
| 2-Person Household | 29 | 72.5% |
| 3-Person Household | 7 | 17.5% |
| 4+ Person Household | 0 | 0.0% |
| Total Housing Units | 40 | 100.0% |
Occupancy by Ownership by Household Size in Bluff
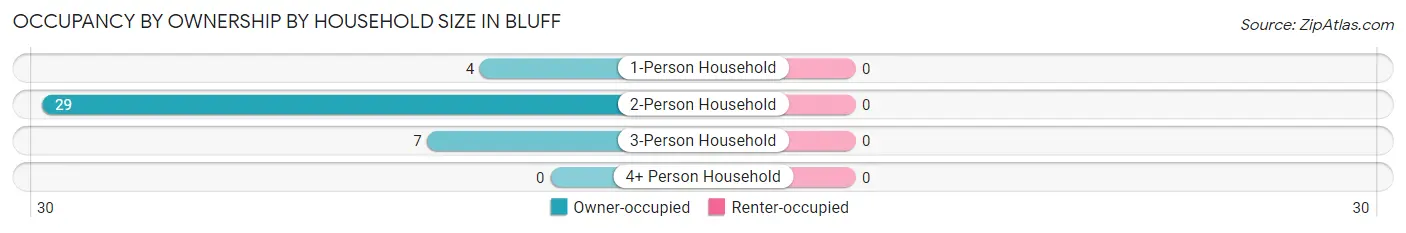
| Household Size | Owner-occupied | Renter-occupied |
| 1-Person Household | 4 (100.0%) | 0 (0.0%) |
| 2-Person Household | 29 (100.0%) | 0 (0.0%) |
| 3-Person Household | 7 (100.0%) | 0 (0.0%) |
| 4+ Person Household | 0 (0.0%) | 0 (0.0%) |
| Total Housing Units | 40 (100.0%) | 0 (0.0%) |
Occupancy by Educational Attainment in Bluff
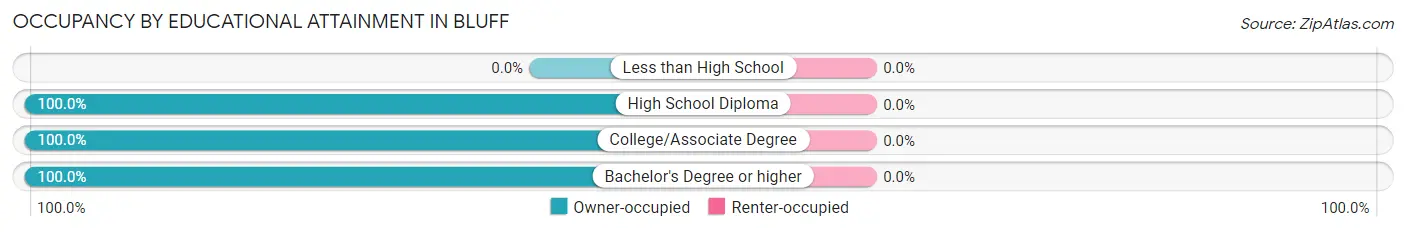
| Household Size | Owner-occupied | Renter-occupied |
| Less than High School | 0 (0.0%) | 0 (0.0%) |
| High School Diploma | 14 (100.0%) | 0 (0.0%) |
| College/Associate Degree | 4 (100.0%) | 0 (0.0%) |
| Bachelor's Degree or higher | 22 (100.0%) | 0 (0.0%) |
Occupancy by Age of Householder in Bluff
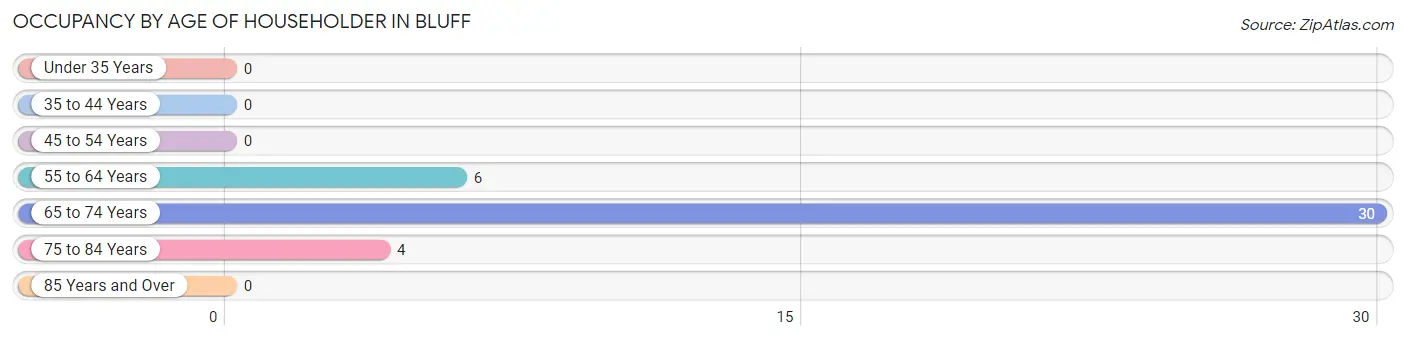
| Age Bracket | # Households | % Households |
| Under 35 Years | 0 | 0.0% |
| 35 to 44 Years | 0 | 0.0% |
| 45 to 54 Years | 0 | 0.0% |
| 55 to 64 Years | 6 | 15.0% |
| 65 to 74 Years | 30 | 75.0% |
| 75 to 84 Years | 4 | 10.0% |
| 85 Years and Over | 0 | 0.0% |
| Total | 40 | 100.0% |
Housing Finances in Bluff
Median Income by Occupancy in Bluff
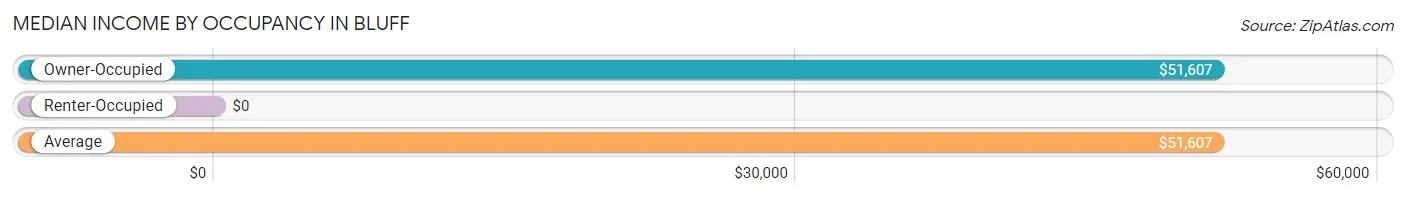
| Occupancy Type | # Households | Median Income |
| Owner-Occupied | 40 (100.0%) | $51,607 |
| Renter-Occupied | 0 (0.0%) | $0 |
| Average | 40 (100.0%) | $51,607 |
Occupancy by Householder Income Bracket in Bluff
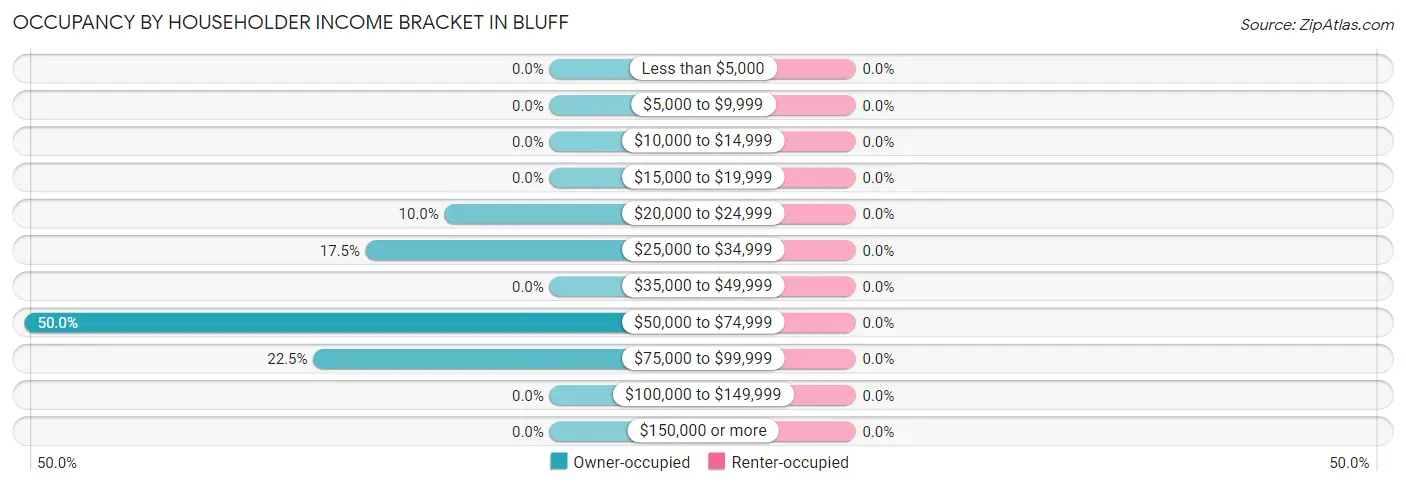
| Income Bracket | Owner-occupied | Renter-occupied |
| Less than $5,000 | 0 (0.0%) | 0 (0.0%) |
| $5,000 to $9,999 | 0 (0.0%) | 0 (0.0%) |
| $10,000 to $14,999 | 0 (0.0%) | 0 (0.0%) |
| $15,000 to $19,999 | 0 (0.0%) | 0 (0.0%) |
| $20,000 to $24,999 | 4 (10.0%) | 0 (0.0%) |
| $25,000 to $34,999 | 7 (17.5%) | 0 (0.0%) |
| $35,000 to $49,999 | 0 (0.0%) | 0 (0.0%) |
| $50,000 to $74,999 | 20 (50.0%) | 0 (0.0%) |
| $75,000 to $99,999 | 9 (22.5%) | 0 (0.0%) |
| $100,000 to $149,999 | 0 (0.0%) | 0 (0.0%) |
| $150,000 or more | 0 (0.0%) | 0 (0.0%) |
| Total | 40 (100.0%) | 0 (0.0%) |
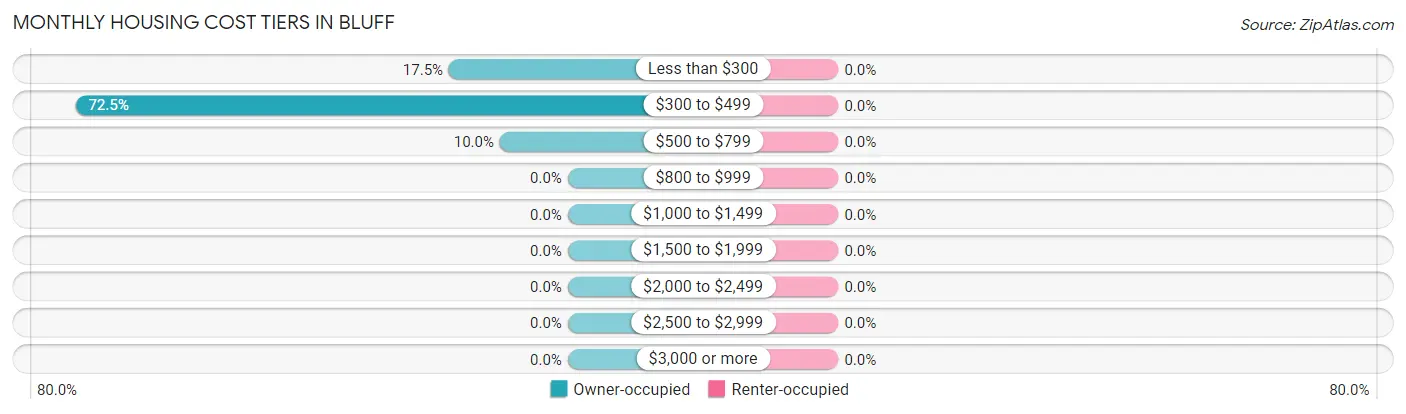
Monthly Housing Cost Tiers in Bluff
| Monthly Cost | Owner-occupied | Renter-occupied |
| Less than $300 | 7 (17.5%) | 0 (0.0%) |
| $300 to $499 | 29 (72.5%) | 0 (0.0%) |
| $500 to $799 | 4 (10.0%) | 0 (0.0%) |
| $800 to $999 | 0 (0.0%) | 0 (0.0%) |
| $1,000 to $1,499 | 0 (0.0%) | 0 (0.0%) |
| $1,500 to $1,999 | 0 (0.0%) | 0 (0.0%) |
| $2,000 to $2,499 | 0 (0.0%) | 0 (0.0%) |
| $2,500 to $2,999 | 0 (0.0%) | 0 (0.0%) |
| $3,000 or more | 0 (0.0%) | 0 (0.0%) |
| Total | 40 (100.0%) | 0 (0.0%) |
Physical Housing Characteristics in Bluff
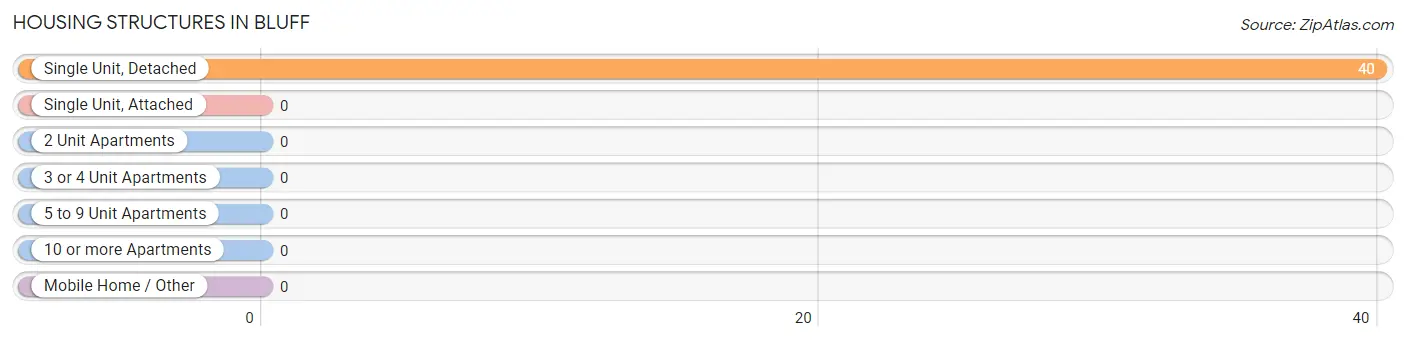
Housing Structures in Bluff
| Structure Type | # Housing Units | % Housing Units |
| Single Unit, Detached | 40 | 100.0% |
| Single Unit, Attached | 0 | 0.0% |
| 2 Unit Apartments | 0 | 0.0% |
| 3 or 4 Unit Apartments | 0 | 0.0% |
| 5 to 9 Unit Apartments | 0 | 0.0% |
| 10 or more Apartments | 0 | 0.0% |
| Mobile Home / Other | 0 | 0.0% |
| Total | 40 | 100.0% |
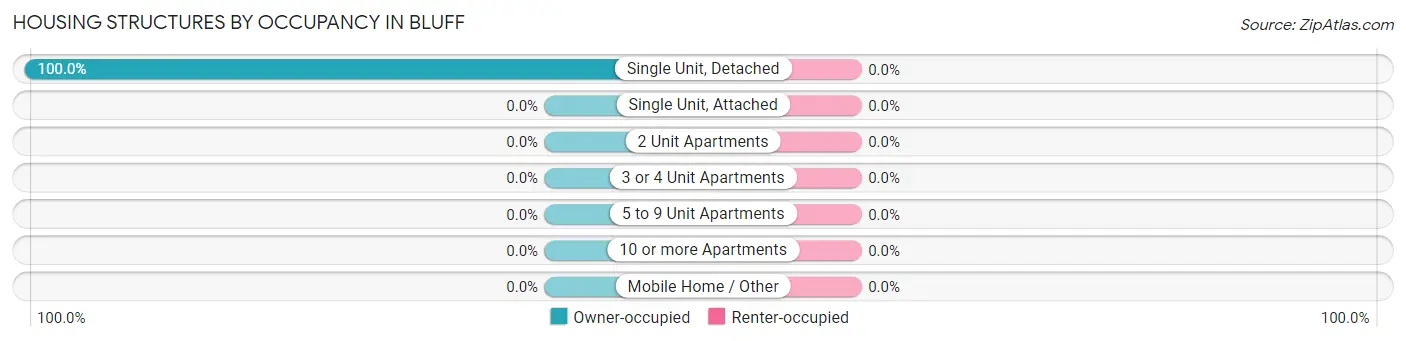
Housing Structures by Occupancy in Bluff
| Structure Type | Owner-occupied | Renter-occupied |
| Single Unit, Detached | 40 (100.0%) | 0 (0.0%) |
| Single Unit, Attached | 0 (0.0%) | 0 (0.0%) |
| 2 Unit Apartments | 0 (0.0%) | 0 (0.0%) |
| 3 or 4 Unit Apartments | 0 (0.0%) | 0 (0.0%) |
| 5 to 9 Unit Apartments | 0 (0.0%) | 0 (0.0%) |
| 10 or more Apartments | 0 (0.0%) | 0 (0.0%) |
| Mobile Home / Other | 0 (0.0%) | 0 (0.0%) |
| Total | 40 (100.0%) | 0 (0.0%) |
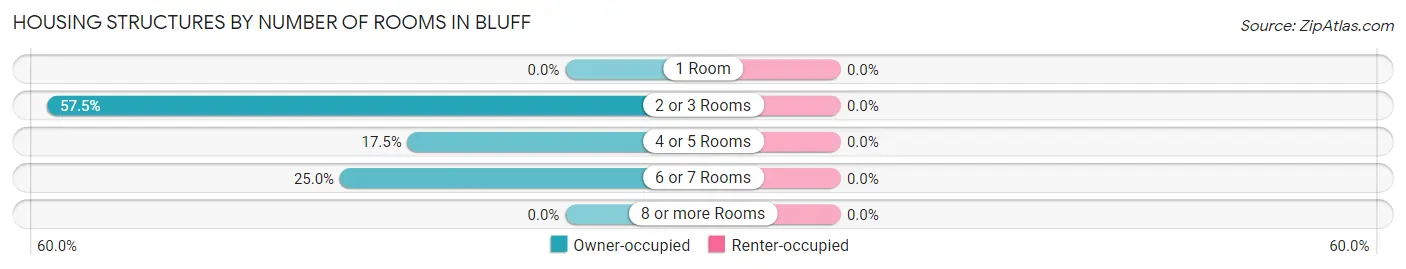
Housing Structures by Number of Rooms in Bluff
| Number of Rooms | Owner-occupied | Renter-occupied |
| 1 Room | 0 (0.0%) | 0 (0.0%) |
| 2 or 3 Rooms | 23 (57.5%) | 0 (0.0%) |
| 4 or 5 Rooms | 7 (17.5%) | 0 (0.0%) |
| 6 or 7 Rooms | 10 (25.0%) | 0 (0.0%) |
| 8 or more Rooms | 0 (0.0%) | 0 (0.0%) |
| Total | 40 (100.0%) | 0 (0.0%) |
Housing Structure by Heating Type in Bluff
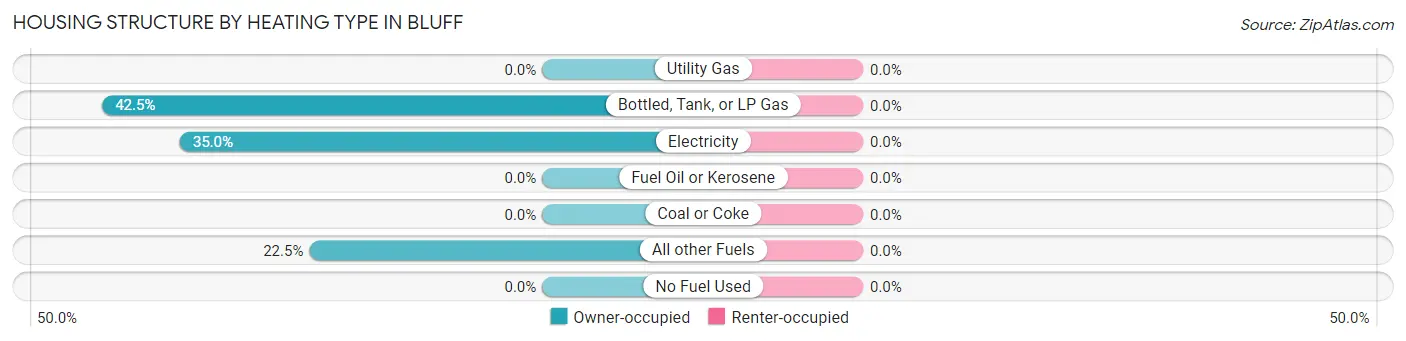
| Heating Type | Owner-occupied | Renter-occupied |
| Utility Gas | 0 (0.0%) | 0 (0.0%) |
| Bottled, Tank, or LP Gas | 17 (42.5%) | 0 (0.0%) |
| Electricity | 14 (35.0%) | 0 (0.0%) |
| Fuel Oil or Kerosene | 0 (0.0%) | 0 (0.0%) |
| Coal or Coke | 0 (0.0%) | 0 (0.0%) |
| All other Fuels | 9 (22.5%) | 0 (0.0%) |
| No Fuel Used | 0 (0.0%) | 0 (0.0%) |
| Total | 40 (100.0%) | 0 (0.0%) |
Household Vehicle Usage in Bluff
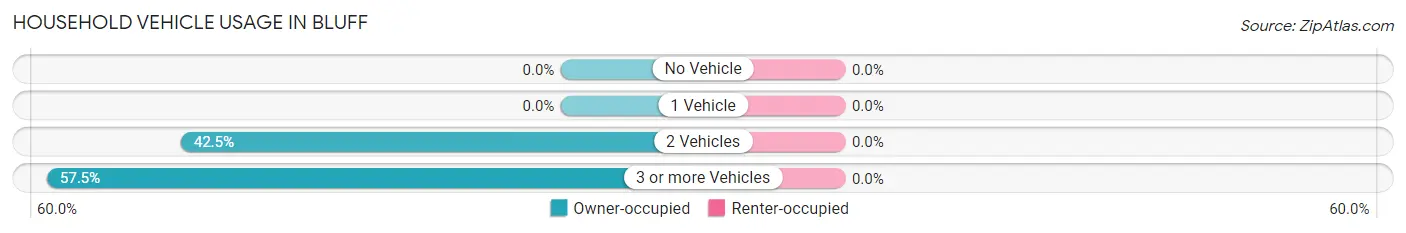
| Vehicles per Household | Owner-occupied | Renter-occupied |
| No Vehicle | 0 (0.0%) | 0 (0.0%) |
| 1 Vehicle | 0 (0.0%) | 0 (0.0%) |
| 2 Vehicles | 17 (42.5%) | 0 (0.0%) |
| 3 or more Vehicles | 23 (57.5%) | 0 (0.0%) |
| Total | 40 (100.0%) | 0 (0.0%) |
Real Estate & Mortgages in Bluff
Real Estate and Mortgage Overview in Bluff
| Characteristic | Without Mortgage | With Mortgage |
| Housing Units | 40 | 0 |
| Median Property Value | $224,100 | $0 |
| Median Household Income | $51,607 | $0 |
| Monthly Housing Costs | $420 | $0 |
| Real Estate Taxes | $900 | $0 |
Property Value by Mortgage Status in Bluff
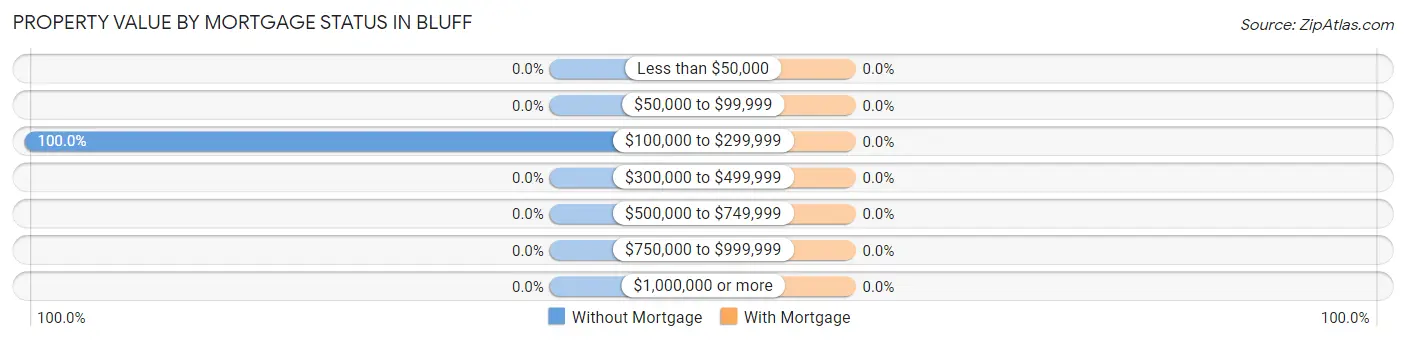
| Property Value | Without Mortgage | With Mortgage |
| Less than $50,000 | 0 (0.0%) | 0 (0.0%) |
| $50,000 to $99,999 | 0 (0.0%) | 0 (0.0%) |
| $100,000 to $299,999 | 40 (100.0%) | 0 (0.0%) |
| $300,000 to $499,999 | 0 (0.0%) | 0 (0.0%) |
| $500,000 to $749,999 | 0 (0.0%) | 0 (0.0%) |
| $750,000 to $999,999 | 0 (0.0%) | 0 (0.0%) |
| $1,000,000 or more | 0 (0.0%) | 0 (0.0%) |
| Total | 40 (100.0%) | 0 (0.0%) |
Household Income by Mortgage Status in Bluff
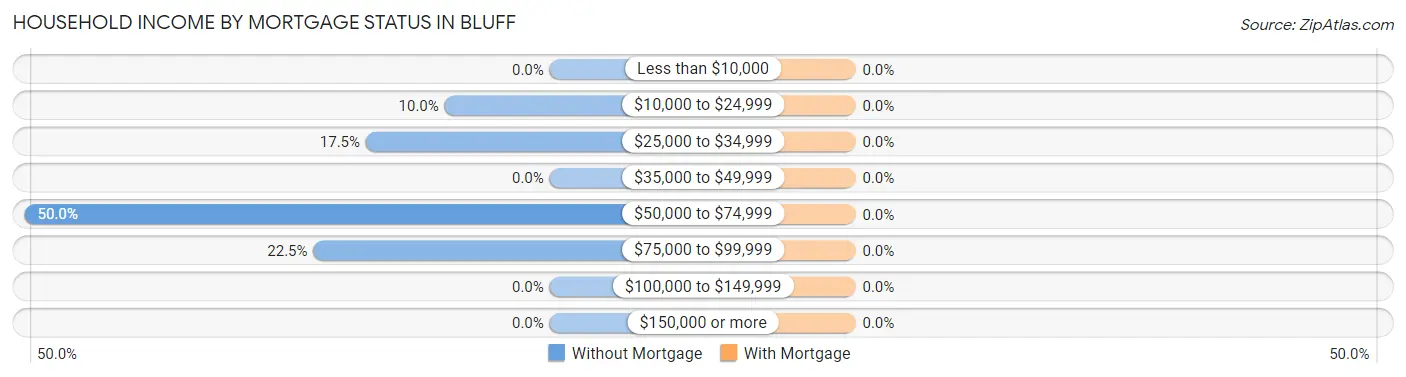
| Household Income | Without Mortgage | With Mortgage |
| Less than $10,000 | 0 (0.0%) | 0 (0.0%) |
| $10,000 to $24,999 | 4 (10.0%) | 0 (0.0%) |
| $25,000 to $34,999 | 7 (17.5%) | 0 (0.0%) |
| $35,000 to $49,999 | 0 (0.0%) | 0 (0.0%) |
| $50,000 to $74,999 | 20 (50.0%) | 0 (0.0%) |
| $75,000 to $99,999 | 9 (22.5%) | 0 (0.0%) |
| $100,000 to $149,999 | 0 (0.0%) | 0 (0.0%) |
| $150,000 or more | 0 (0.0%) | 0 (0.0%) |
| Total | 40 (100.0%) | 0 (0.0%) |
Property Value to Household Income Ratio in Bluff
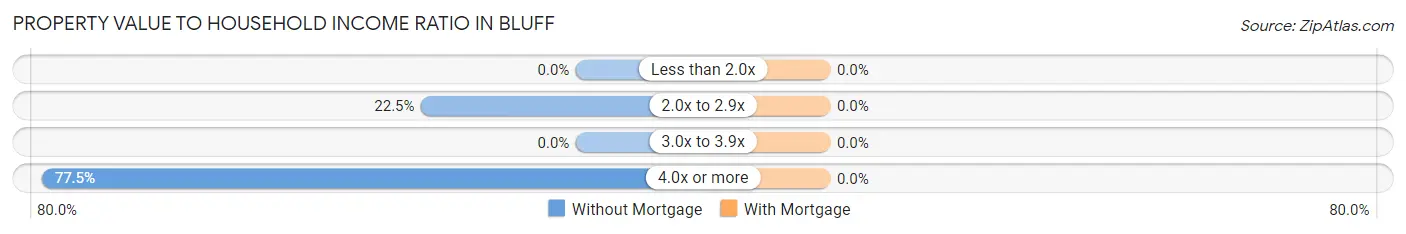
| Value-to-Income Ratio | Without Mortgage | With Mortgage |
| Less than 2.0x | 0 (0.0%) | 0 (0.0%) |
| 2.0x to 2.9x | 9 (22.5%) | 0 (0.0%) |
| 3.0x to 3.9x | 0 (0.0%) | 0 (0.0%) |
| 4.0x or more | 31 (77.5%) | 0 (0.0%) |
| Total | 40 (100.0%) | 0 (0.0%) |
Real Estate Taxes by Mortgage Status in Bluff
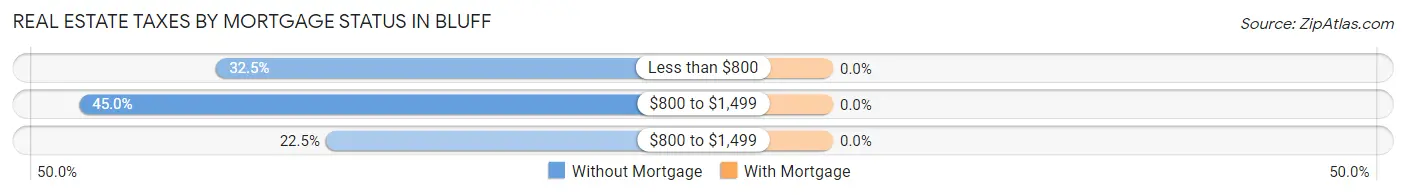
| Property Taxes | Without Mortgage | With Mortgage |
| Less than $800 | 13 (32.5%) | 0 (0.0%) |
| $800 to $1,499 | 18 (45.0%) | 0 (0.0%) |
| $800 to $1,499 | 9 (22.5%) | 0 (0.0%) |
| Total | 40 (100.0%) | 0 (0.0%) |
Health & Disability in Bluff
Health Insurance Coverage by Age in Bluff
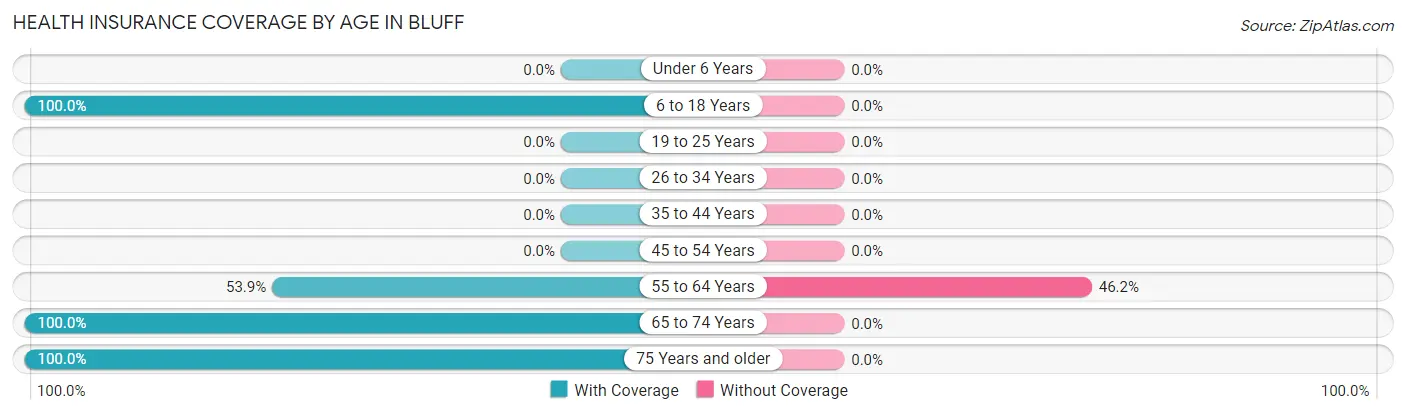
| Age Bracket | With Coverage | Without Coverage |
| Under 6 Years | 0 (0.0%) | 0 (0.0%) |
| 6 to 18 Years | 12 (100.0%) | 0 (0.0%) |
| 19 to 25 Years | 0 (0.0%) | 0 (0.0%) |
| 26 to 34 Years | 0 (0.0%) | 0 (0.0%) |
| 35 to 44 Years | 0 (0.0%) | 0 (0.0%) |
| 45 to 54 Years | 0 (0.0%) | 0 (0.0%) |
| 55 to 64 Years | 7 (53.8%) | 6 (46.2%) |
| 65 to 74 Years | 94 (100.0%) | 0 (0.0%) |
| 75 Years and older | 4 (100.0%) | 0 (0.0%) |
| Total | 117 (95.1%) | 6 (4.9%) |
Health Insurance Coverage by Citizenship Status in Bluff
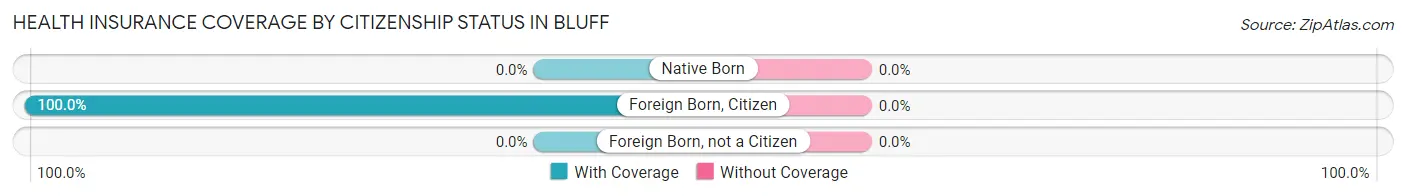
| Citizenship Status | With Coverage | Without Coverage |
| Native Born | 0 (0.0%) | 0 (0.0%) |
| Foreign Born, Citizen | 12 (100.0%) | 0 (0.0%) |
| Foreign Born, not a Citizen | 0 (0.0%) | 0 (0.0%) |
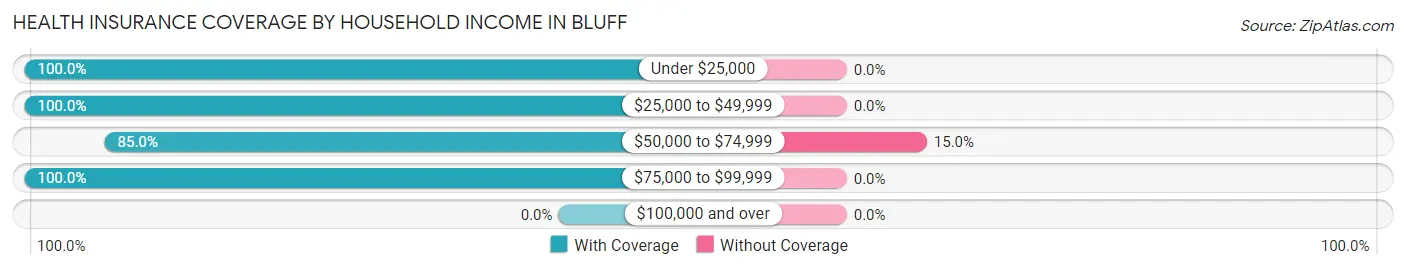
Health Insurance Coverage by Household Income in Bluff
| Household Income | With Coverage | Without Coverage |
| Under $25,000 | 4 (100.0%) | 0 (0.0%) |
| $25,000 to $49,999 | 26 (100.0%) | 0 (0.0%) |
| $50,000 to $74,999 | 34 (85.0%) | 6 (15.0%) |
| $75,000 to $99,999 | 53 (100.0%) | 0 (0.0%) |
| $100,000 and over | 0 (0.0%) | 0 (0.0%) |
Public vs Private Health Insurance Coverage by Age in Bluff
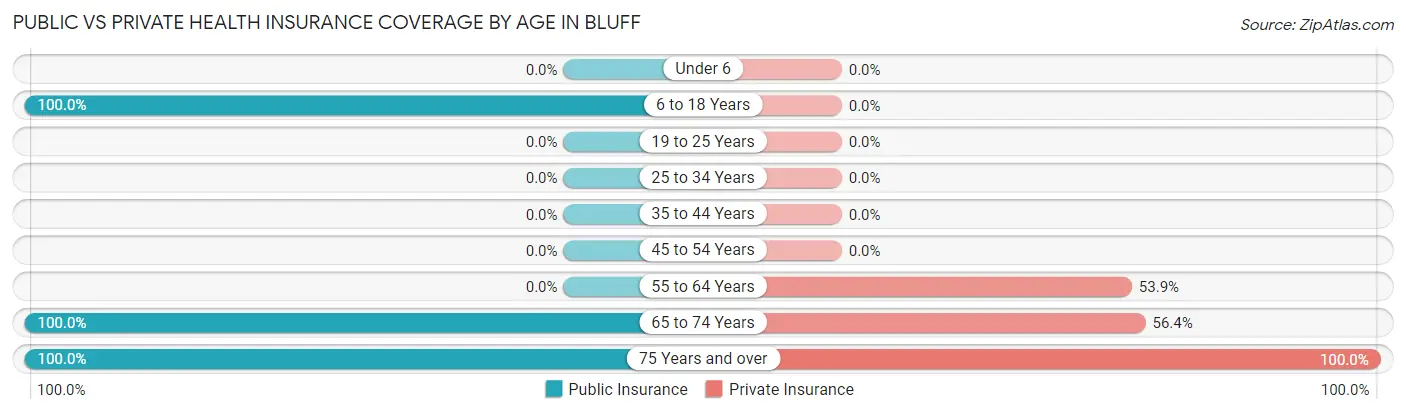
| Age Bracket | Public Insurance | Private Insurance |
| Under 6 | 0 (0.0%) | 0 (0.0%) |
| 6 to 18 Years | 12 (100.0%) | 0 (0.0%) |
| 19 to 25 Years | 0 (0.0%) | 0 (0.0%) |
| 25 to 34 Years | 0 (0.0%) | 0 (0.0%) |
| 35 to 44 Years | 0 (0.0%) | 0 (0.0%) |
| 45 to 54 Years | 0 (0.0%) | 0 (0.0%) |
| 55 to 64 Years | 0 (0.0%) | 7 (53.8%) |
| 65 to 74 Years | 94 (100.0%) | 53 (56.4%) |
| 75 Years and over | 4 (100.0%) | 4 (100.0%) |
| Total | 110 (89.4%) | 64 (52.0%) |
Disability Status by Sex by Age in Bluff
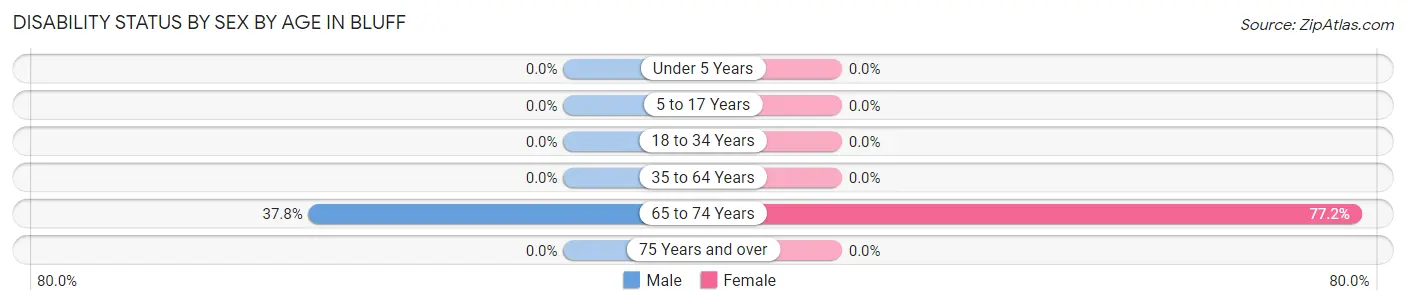
| Age Bracket | Male | Female |
| Under 5 Years | 0 (0.0%) | 0 (0.0%) |
| 5 to 17 Years | 0 (0.0%) | 0 (0.0%) |
| 18 to 34 Years | 0 (0.0%) | 0 (0.0%) |
| 35 to 64 Years | 0 (0.0%) | 0 (0.0%) |
| 65 to 74 Years | 14 (37.8%) | 44 (77.2%) |
| 75 Years and over | 0 (0.0%) | 0 (0.0%) |
Disability Class by Sex by Age in Bluff
Disability Class: Hearing Difficulty
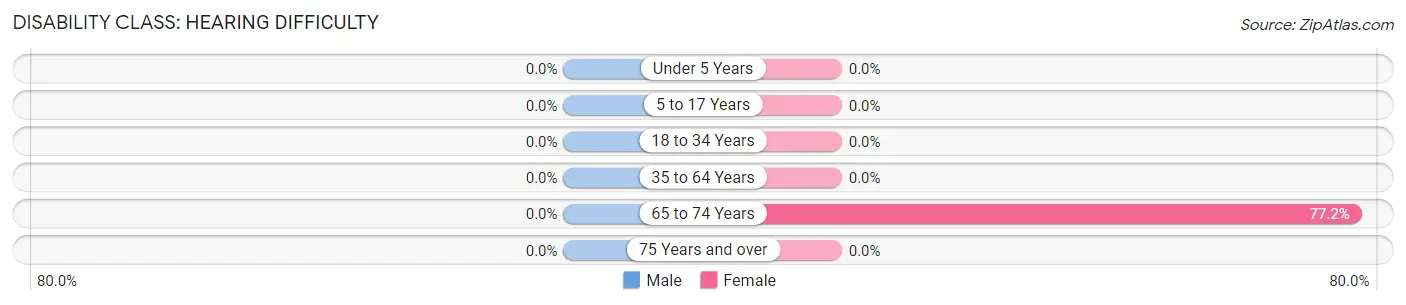
| Age Bracket | Male | Female |
| Under 5 Years | 0 (0.0%) | 0 (0.0%) |
| 5 to 17 Years | 0 (0.0%) | 0 (0.0%) |
| 18 to 34 Years | 0 (0.0%) | 0 (0.0%) |
| 35 to 64 Years | 0 (0.0%) | 0 (0.0%) |
| 65 to 74 Years | 0 (0.0%) | 44 (77.2%) |
| 75 Years and over | 0 (0.0%) | 0 (0.0%) |
Disability Class: Vision Difficulty
| Age Bracket | Male | Female |
| Under 5 Years | 0 (0.0%) | 0 (0.0%) |
| 5 to 17 Years | 0 (0.0%) | 0 (0.0%) |
| 18 to 34 Years | 0 (0.0%) | 0 (0.0%) |
| 35 to 64 Years | 0 (0.0%) | 0 (0.0%) |
| 65 to 74 Years | 0 (0.0%) | 0 (0.0%) |
| 75 Years and over | 0 (0.0%) | 0 (0.0%) |
Disability Class: Cognitive Difficulty
| Age Bracket | Male | Female |
| 5 to 17 Years | 0 (0.0%) | 0 (0.0%) |
| 18 to 34 Years | 0 (0.0%) | 0 (0.0%) |
| 35 to 64 Years | 0 (0.0%) | 0 (0.0%) |
| 65 to 74 Years | 0 (0.0%) | 0 (0.0%) |
| 75 Years and over | 0 (0.0%) | 0 (0.0%) |
Disability Class: Ambulatory Difficulty
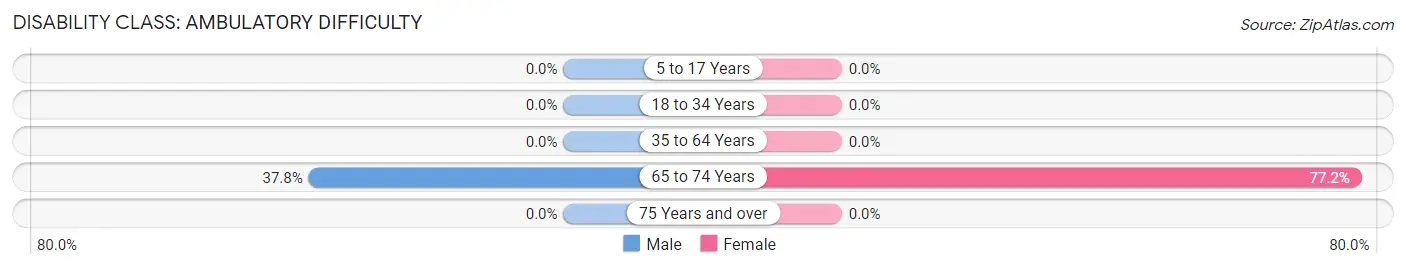
| Age Bracket | Male | Female |
| 5 to 17 Years | 0 (0.0%) | 0 (0.0%) |
| 18 to 34 Years | 0 (0.0%) | 0 (0.0%) |
| 35 to 64 Years | 0 (0.0%) | 0 (0.0%) |
| 65 to 74 Years | 14 (37.8%) | 44 (77.2%) |
| 75 Years and over | 0 (0.0%) | 0 (0.0%) |
Disability Class: Self-Care Difficulty
| Age Bracket | Male | Female |
| 5 to 17 Years | 0 (0.0%) | 0 (0.0%) |
| 18 to 34 Years | 0 (0.0%) | 0 (0.0%) |
| 35 to 64 Years | 0 (0.0%) | 0 (0.0%) |
| 65 to 74 Years | 0 (0.0%) | 0 (0.0%) |
| 75 Years and over | 0 (0.0%) | 0 (0.0%) |
Technology Access in Bluff
Computing Device Access in Bluff
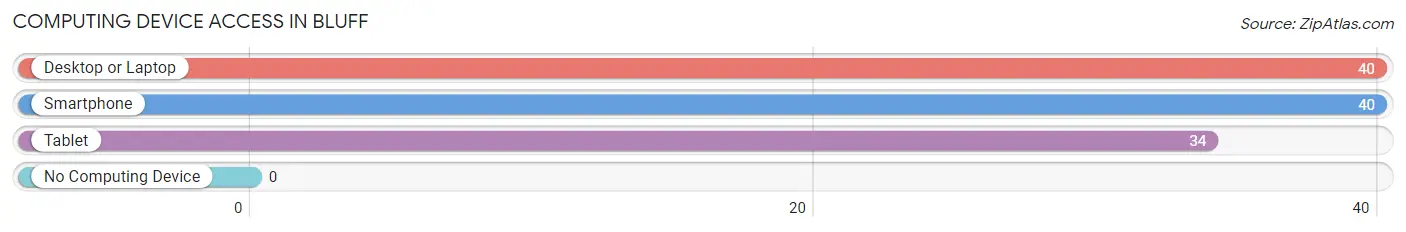
| Device Type | # Households | % Households |
| Desktop or Laptop | 40 | 100.0% |
| Smartphone | 40 | 100.0% |
| Tablet | 34 | 85.0% |
| No Computing Device | 0 | 0.0% |
| Total | 40 | 100.0% |
Internet Access in Bluff
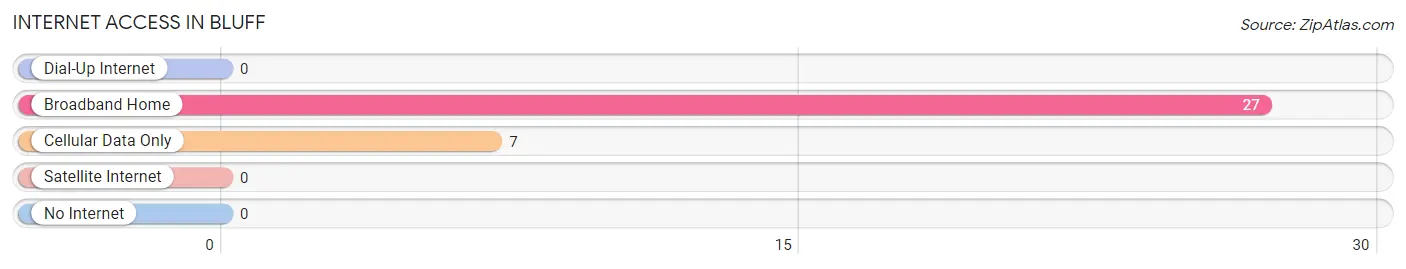
| Internet Type | # Households | % Households |
| Dial-Up Internet | 0 | 0.0% |
| Broadband Home | 27 | 67.5% |
| Cellular Data Only | 7 | 17.5% |
| Satellite Internet | 0 | 0.0% |
| No Internet | 0 | 0.0% |
| Total | 40 | 100.0% |
Bluff Summary
Bluff, Utah is a small town located in the southeastern corner of the state, near the Arizona and New Mexico borders. It is situated on the banks of the San Juan River, and is the gateway to the nearby Monument Valley Navajo Tribal Park. The town has a population of approximately 250 people, and is the largest settlement in San Juan County.
Geography
Bluff is located in the Four Corners region of the United States, and is situated on the banks of the San Juan River. The town is surrounded by the red sandstone cliffs of the Comb Ridge, which is part of the Colorado Plateau. The area is known for its spectacular views of the surrounding landscape, including the Monument Valley Navajo Tribal Park. The town is located at an elevation of 4,800 feet, and has a semi-arid climate with hot summers and cold winters.
History
Bluff was first settled in 1880 by Mormon pioneers, who were sent to the area by the Church of Jesus Christ of Latter-day Saints. The town was named after the nearby bluff, which was used as a landmark by the pioneers. The town quickly grew, and by the early 1900s, it had become a trading post for the local Navajo and Ute tribes. In the 1920s, the town was connected to the outside world by the construction of a railroad line.
Economy
The economy of Bluff is largely based on tourism, as the town is a popular destination for visitors to the nearby Monument Valley Navajo Tribal Park. The town also has a small retail sector, with several stores and restaurants. The town is also home to a number of small businesses, including a gas station, a grocery store, and a post office.
Demographics
As of the 2010 census, the population of Bluff was 250 people. The racial makeup of the town was 95.2% White, 0.8% Native American, 0.4% Asian, 0.4% from other races, and 3.2% from two or more races. The median household income was $31,250, and the median family income was $37,500. The per capita income was $17,500.
Conclusion
Bluff, Utah is a small town located in the southeastern corner of the state, near the Arizona and New Mexico borders. It is situated on the banks of the San Juan River, and is the gateway to the nearby Monument Valley Navajo Tribal Park. The town has a population of approximately 250 people, and is the largest settlement in San Juan County. The economy of Bluff is largely based on tourism, as the town is a popular destination for visitors to the nearby Monument Valley Navajo Tribal Park. The town also has a small retail sector, with several stores and restaurants. The racial makeup of the town is 95.2% White, 0.8% Native American, 0.4% Asian, 0.4% from other races, and 3.2% from two or more races. The median household income was $31,250, and the median family income was $37,500. The per capita income was $17,500.
Common Questions
What is Per Capita Income in Bluff?
Per Capita income in Bluff is $27,985.
What is the Median Family Income in Bluff?
Median Family Income in Bluff is $51,429.
What is the Median Household income in Bluff?
Median Household Income in Bluff is $51,607.
What is Inequality or Gini Index in Bluff?
Inequality or Gini Index in Bluff is 0.18.
What is the Total Population of Bluff?
Total Population of Bluff is 123.
What is the Total Male Population of Bluff?
Total Male Population of Bluff is 41.
What is the Total Female Population of Bluff?
Total Female Population of Bluff is 82.
What is the Ratio of Males per 100 Females in Bluff?
There are 50.00 Males per 100 Females in Bluff.
What is the Ratio of Females per 100 Males in Bluff?
There are 200.00 Females per 100 Males in Bluff.
What is the Median Population Age in Bluff?
Median Population Age in Bluff is 68.1 Years.
What is the Average Family Size in Bluff
Average Family Size in Bluff is 3.5 People.
What is the Average Household Size in Bluff
Average Household Size in Bluff is 3.1 People.
How Large is the Labor Force in Bluff?
There are 27 People in the Labor Forcein in Bluff.
What is the Percentage of People in the Labor Force in Bluff?
22.0% of People are in the Labor Force in Bluff.