Levering, MI Map & Demographics
Levering Map
Levering Overview
$33,638
PER CAPITA INCOME
0.44
INEQUALITY / GINI INDEX
52
TOTAL POPULATION
29
MALE POPULATION
23
FEMALE POPULATION
126.09
MALES / 100 FEMALES
79.31
FEMALES / 100 MALES
60.3
MEDIAN AGE
2.0
AVG FAMILY SIZE
1.4
AVG HOUSEHOLD SIZE
26
LABOR FORCE [ PEOPLE ]
50.0%
PERCENT IN LABOR FORCE
7.7%
UNEMPLOYMENT RATE
Levering Zip Codes
Levering Area Codes
Income in Levering
Income Overview in Levering
| Characteristic | Number | Measure |
| Per Capita Income | 52 | $33,638 |
| Median Family Income | 15 | $0 |
| Mean Family Income | 15 | $85,193 |
| Median Household Income | 37 | $0 |
| Mean Household Income | 37 | $45,449 |
| Income Deficit | 15 | $0 |
| Wage / Income Gap (%) | 52 | 0.00% |
| Wage / Income Gap ($) | 52 | 100.00¢ per $1 |
| Gini / Inequality Index | 52 | 0.44 |
Earnings by Sex in Levering
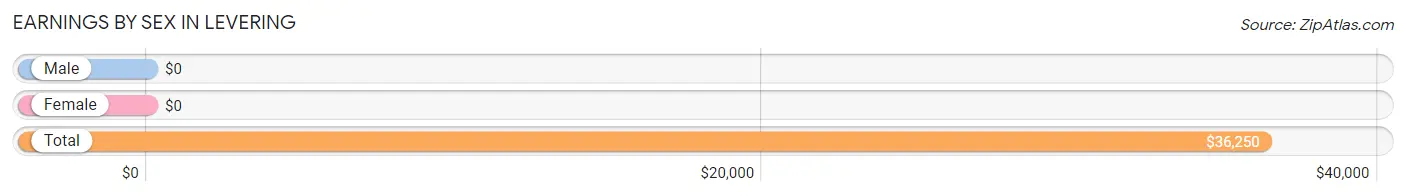
| Sex | Number | Average Earnings |
| Male | 16 (61.5%) | $0 |
| Female | 10 (38.5%) | $0 |
| Total | 26 (100.0%) | $36,250 |
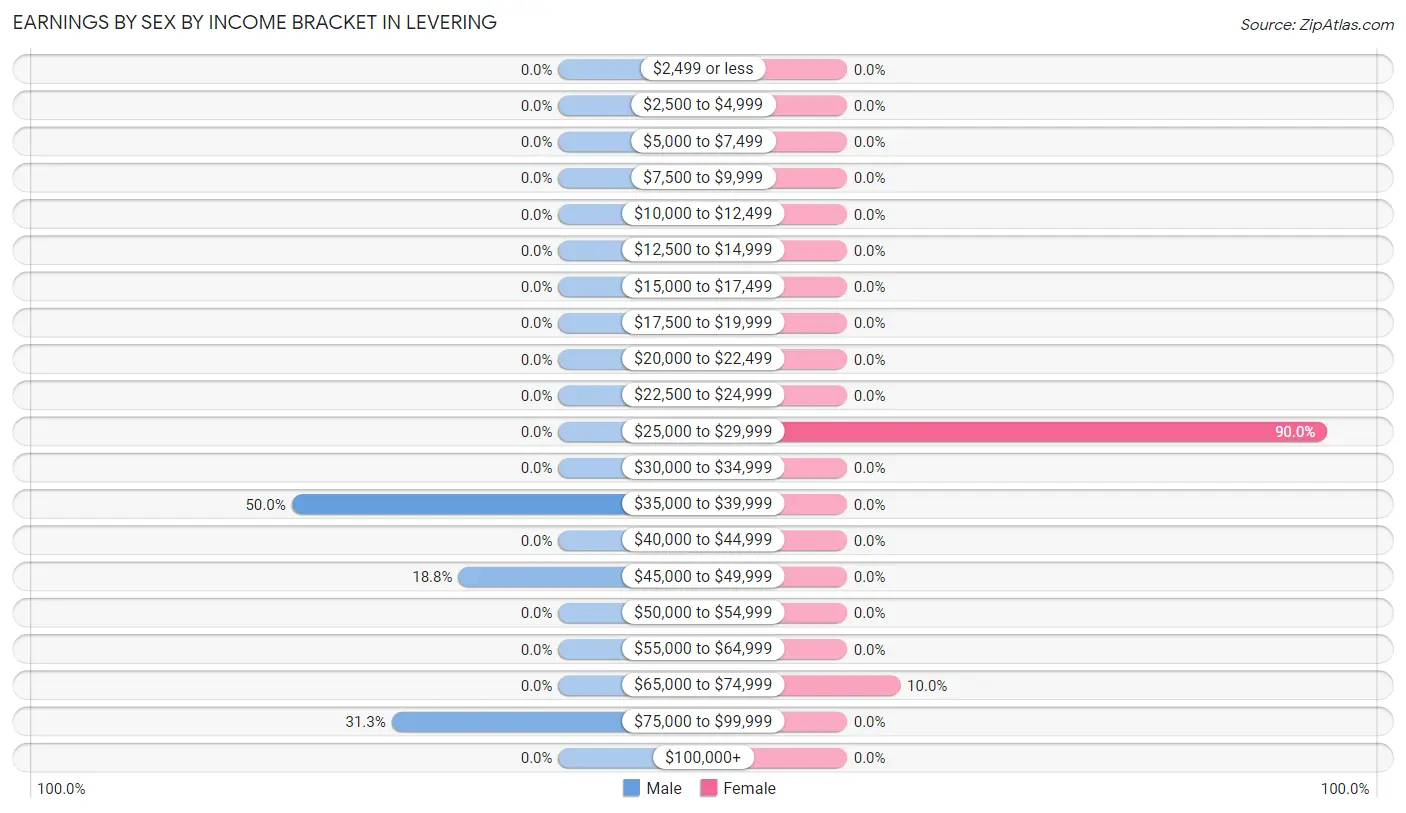
Earnings by Sex by Income Bracket in Levering
The most common earnings brackets in Levering are $35,000 to $39,999 for men (8 | 50.0%) and $25,000 to $29,999 for women (9 | 90.0%).
| Income | Male | Female |
| $2,499 or less | 0 (0.0%) | 0 (0.0%) |
| $2,500 to $4,999 | 0 (0.0%) | 0 (0.0%) |
| $5,000 to $7,499 | 0 (0.0%) | 0 (0.0%) |
| $7,500 to $9,999 | 0 (0.0%) | 0 (0.0%) |
| $10,000 to $12,499 | 0 (0.0%) | 0 (0.0%) |
| $12,500 to $14,999 | 0 (0.0%) | 0 (0.0%) |
| $15,000 to $17,499 | 0 (0.0%) | 0 (0.0%) |
| $17,500 to $19,999 | 0 (0.0%) | 0 (0.0%) |
| $20,000 to $22,499 | 0 (0.0%) | 0 (0.0%) |
| $22,500 to $24,999 | 0 (0.0%) | 0 (0.0%) |
| $25,000 to $29,999 | 0 (0.0%) | 9 (90.0%) |
| $30,000 to $34,999 | 0 (0.0%) | 0 (0.0%) |
| $35,000 to $39,999 | 8 (50.0%) | 0 (0.0%) |
| $40,000 to $44,999 | 0 (0.0%) | 0 (0.0%) |
| $45,000 to $49,999 | 3 (18.8%) | 0 (0.0%) |
| $50,000 to $54,999 | 0 (0.0%) | 0 (0.0%) |
| $55,000 to $64,999 | 0 (0.0%) | 0 (0.0%) |
| $65,000 to $74,999 | 0 (0.0%) | 1 (10.0%) |
| $75,000 to $99,999 | 5 (31.2%) | 0 (0.0%) |
| $100,000+ | 0 (0.0%) | 0 (0.0%) |
| Total | 16 (100.0%) | 10 (100.0%) |
Earnings by Sex by Educational Attainment in Levering
| Educational Attainment | Male Income | Female Income |
| Less than High School | - | - |
| High School Diploma | - | - |
| College or Associate's Degree | - | - |
| Bachelor's Degree | - | - |
| Graduate Degree | - | - |
| Total | - | - |
Family Income in Levering
Family Income Brackets in Levering
According to the Levering family income data, there are 8 families falling into the $50,000 to $74,999 income range, which is the most common income bracket and makes up 53.3% of all families.
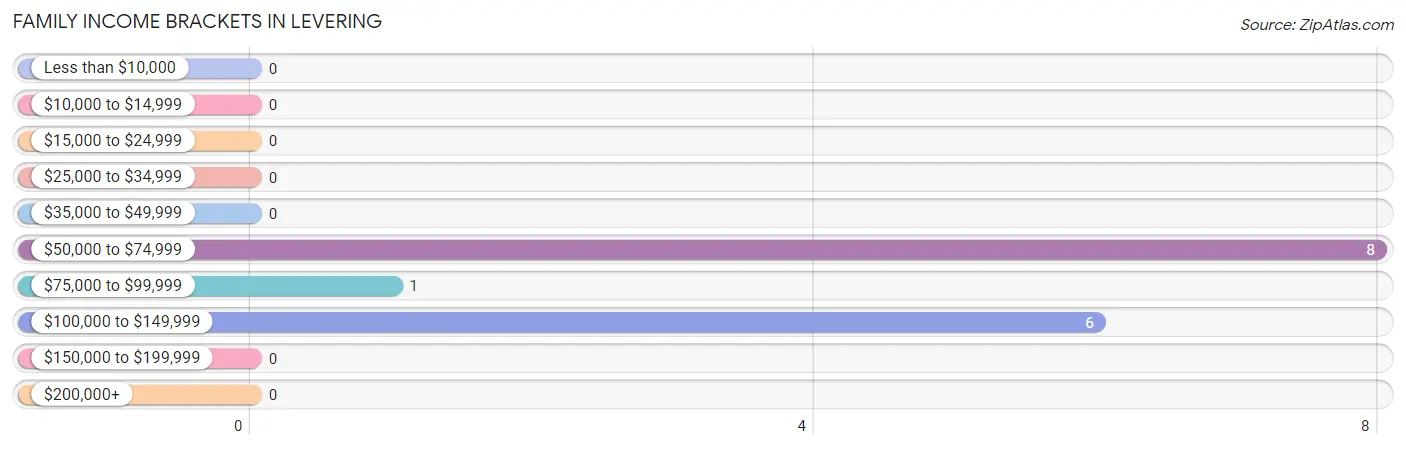
| Income Bracket | # Families | % Families |
| Less than $10,000 | 0 | 0.0% |
| $10,000 to $14,999 | 0 | 0.0% |
| $15,000 to $24,999 | 0 | 0.0% |
| $25,000 to $34,999 | 0 | 0.0% |
| $35,000 to $49,999 | 0 | 0.0% |
| $50,000 to $74,999 | 8 | 53.3% |
| $75,000 to $99,999 | 1 | 6.7% |
| $100,000 to $149,999 | 6 | 40.0% |
| $150,000 to $199,999 | 0 | 0.0% |
| $200,000+ | 0 | 0.0% |
Family Income by Famaliy Size in Levering
| Income Bracket | # Families | Median Income |
| 2-Person Families | 15 (100.0%) | $0 |
| 3-Person Families | 0 (0.0%) | $0 |
| 4-Person Families | 0 (0.0%) | $0 |
| 5-Person Families | 0 (0.0%) | $0 |
| 6-Person Families | 0 (0.0%) | $0 |
| 7+ Person Families | 0 (0.0%) | $0 |
| Total | 15 (100.0%) | $0 |
Family Income by Number of Earners in Levering
| Number of Earners | # Families | Median Income |
| No Earners | 0 (0.0%) | $0 |
| 1 Earner | 14 (93.3%) | $0 |
| 2 Earners | 1 (6.7%) | $0 |
| 3+ Earners | 0 (0.0%) | $0 |
| Total | 15 (100.0%) | $0 |
Household Income in Levering
Household Income Brackets in Levering
With 9 households falling in the category, the $15,000 to $24,999 income range is the most frequent in Levering, accounting for 24.3% of all households.
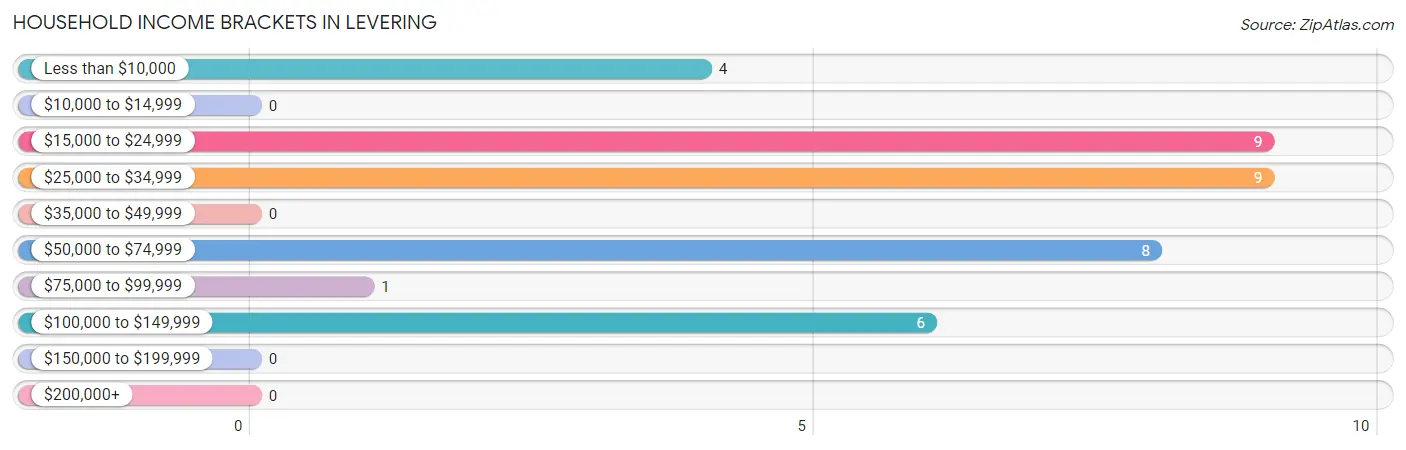
| Income Bracket | # Households | % Households |
| Less than $10,000 | 4 | 10.8% |
| $10,000 to $14,999 | 0 | 0.0% |
| $15,000 to $24,999 | 9 | 24.3% |
| $25,000 to $34,999 | 9 | 24.3% |
| $35,000 to $49,999 | 0 | 0.0% |
| $50,000 to $74,999 | 8 | 21.6% |
| $75,000 to $99,999 | 1 | 2.7% |
| $100,000 to $149,999 | 6 | 16.2% |
| $150,000 to $199,999 | 0 | 0.0% |
| $200,000+ | 0 | 0.0% |
Household Income by Householder Age in Levering
The median household income in Levering is $0, with the highest median household income of $27,778 found in the 45 to 64 years age bracket for the primary householder. A total of 28 households (75.7%) fall into this category.
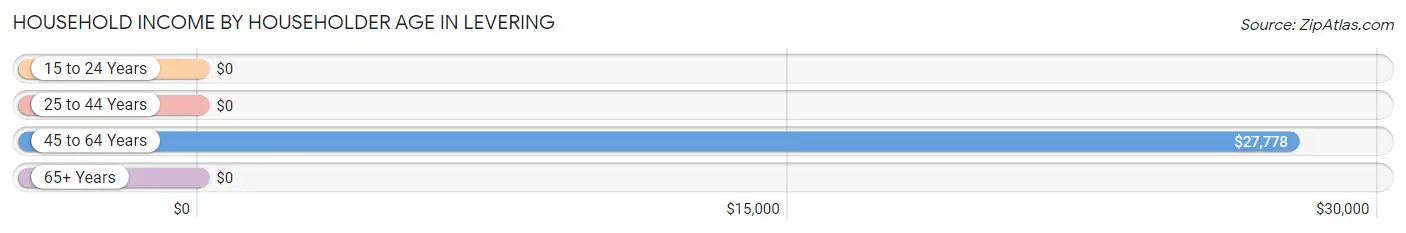
| Income Bracket | # Households | Median Income |
| 15 to 24 Years | 0 (0.0%) | $0 |
| 25 to 44 Years | 0 (0.0%) | $0 |
| 45 to 64 Years | 28 (75.7%) | $27,778 |
| 65+ Years | 9 (24.3%) | $0 |
| Total | 37 (100.0%) | $0 |
Poverty in Levering
Income Below Poverty by Sex and Age in Levering
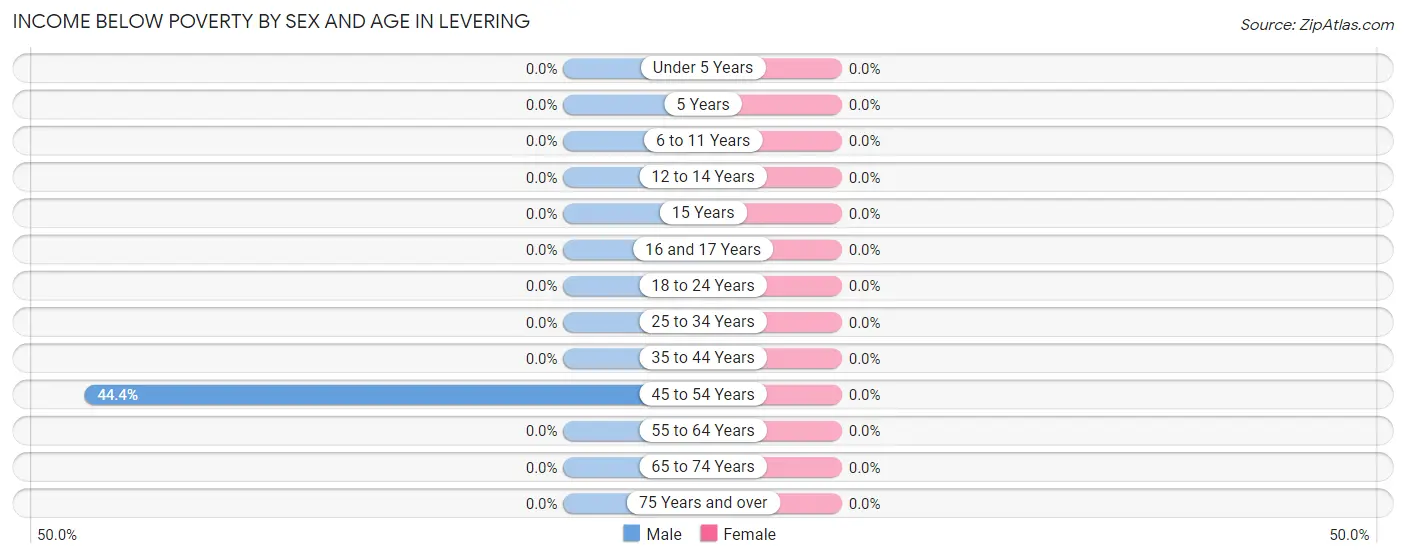
| Age Bracket | Male | Female |
| Under 5 Years | 0 (0.0%) | 0 (0.0%) |
| 5 Years | 0 (0.0%) | 0 (0.0%) |
| 6 to 11 Years | 0 (0.0%) | 0 (0.0%) |
| 12 to 14 Years | 0 (0.0%) | 0 (0.0%) |
| 15 Years | 0 (0.0%) | 0 (0.0%) |
| 16 and 17 Years | 0 (0.0%) | 0 (0.0%) |
| 18 to 24 Years | 0 (0.0%) | 0 (0.0%) |
| 25 to 34 Years | 0 (0.0%) | 0 (0.0%) |
| 35 to 44 Years | 0 (0.0%) | 0 (0.0%) |
| 45 to 54 Years | 4 (44.4%) | 0 (0.0%) |
| 55 to 64 Years | 0 (0.0%) | 0 (0.0%) |
| 65 to 74 Years | 0 (0.0%) | 0 (0.0%) |
| 75 Years and over | 0 (0.0%) | 0 (0.0%) |
| Total | 4 (13.8%) | 0 (0.0%) |
Income Above Poverty by Sex and Age in Levering
According to the poverty statistics in Levering, males aged 55 to 64 years and females aged 45 to 54 years are the age groups that are most secure financially, with 100.0% of males and 100.0% of females in these age groups living above the poverty line.
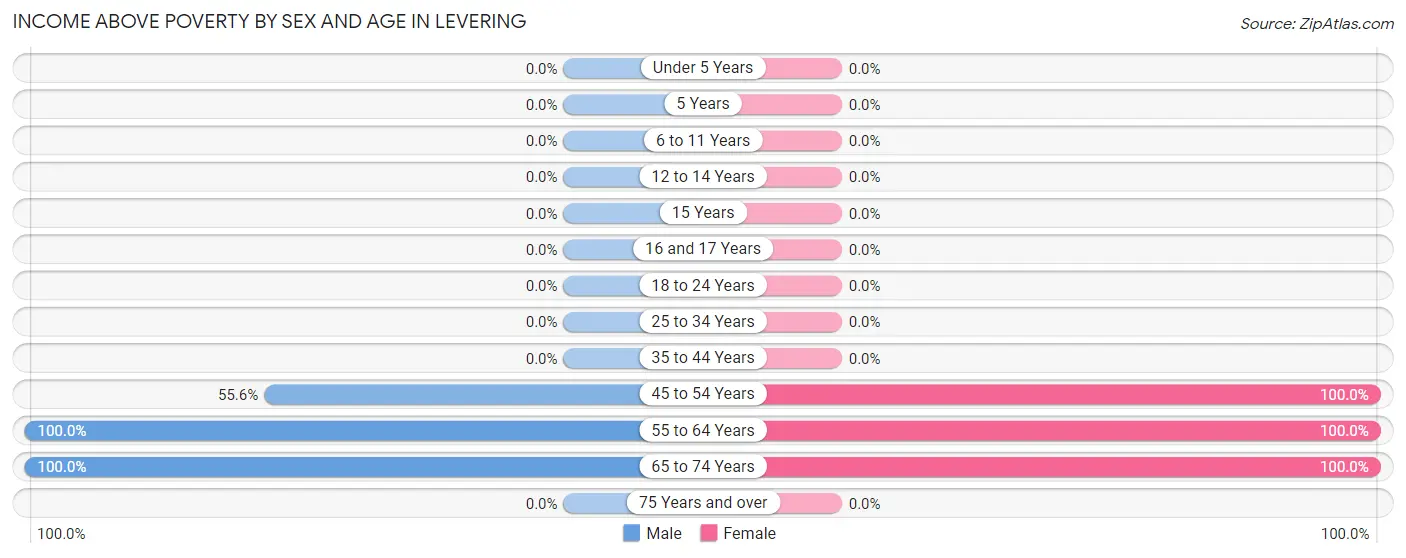
| Age Bracket | Male | Female |
| Under 5 Years | 0 (0.0%) | 0 (0.0%) |
| 5 Years | 0 (0.0%) | 0 (0.0%) |
| 6 to 11 Years | 0 (0.0%) | 0 (0.0%) |
| 12 to 14 Years | 0 (0.0%) | 0 (0.0%) |
| 15 Years | 0 (0.0%) | 0 (0.0%) |
| 16 and 17 Years | 0 (0.0%) | 0 (0.0%) |
| 18 to 24 Years | 0 (0.0%) | 0 (0.0%) |
| 25 to 34 Years | 0 (0.0%) | 0 (0.0%) |
| 35 to 44 Years | 0 (0.0%) | 0 (0.0%) |
| 45 to 54 Years | 5 (55.6%) | 5 (100.0%) |
| 55 to 64 Years | 9 (100.0%) | 10 (100.0%) |
| 65 to 74 Years | 11 (100.0%) | 8 (100.0%) |
| 75 Years and over | 0 (0.0%) | 0 (0.0%) |
| Total | 25 (86.2%) | 23 (100.0%) |
Income Below Poverty Among Married-Couple Families in Levering
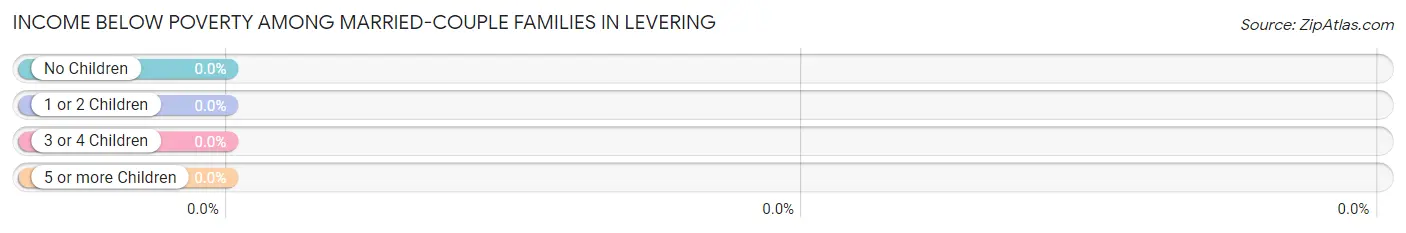
| Children | Above Poverty | Below Poverty |
| No Children | 15 (100.0%) | 0 (0.0%) |
| 1 or 2 Children | 0 (0.0%) | 0 (0.0%) |
| 3 or 4 Children | 0 (0.0%) | 0 (0.0%) |
| 5 or more Children | 0 (0.0%) | 0 (0.0%) |
| Total | 15 (100.0%) | 0 (0.0%) |
Income Below Poverty Among Single-Parent Households in Levering
| Children | Single Father | Single Mother |
| No Children | 0 (0.0%) | 0 (0.0%) |
| 1 or 2 Children | 0 (0.0%) | 0 (0.0%) |
| 3 or 4 Children | 0 (0.0%) | 0 (0.0%) |
| 5 or more Children | 0 (0.0%) | 0 (0.0%) |
| Total | 0 (0.0%) | 0 (0.0%) |
Income Below Poverty Among Married-Couple vs Single-Parent Households in Levering
| Children | Married-Couple Families | Single-Parent Households |
| No Children | 0 (0.0%) | 0 (0.0%) |
| 1 or 2 Children | 0 (0.0%) | 0 (0.0%) |
| 3 or 4 Children | 0 (0.0%) | 0 (0.0%) |
| 5 or more Children | 0 (0.0%) | 0 (0.0%) |
| Total | 0 (0.0%) | 0 (0.0%) |
Race in Levering
The most populous races in Levering are White / Caucasian (48 | 92.3%), Asian (4 | 7.7%), and Hispanic or Latino (4 | 7.7%).
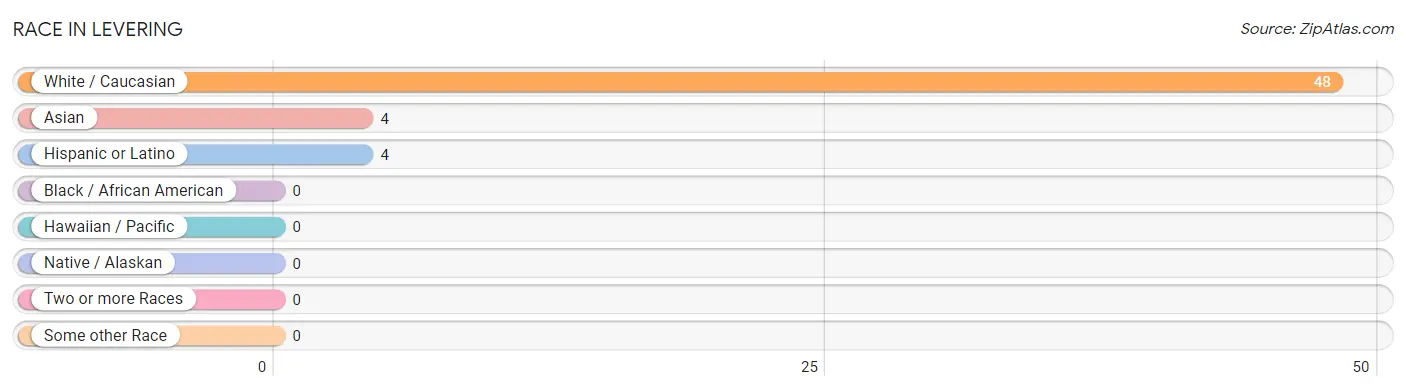
| Race | # Population | % Population |
| Asian | 4 | 7.7% |
| Black / African American | 0 | 0.0% |
| Hawaiian / Pacific | 0 | 0.0% |
| Hispanic or Latino | 4 | 7.7% |
| Native / Alaskan | 0 | 0.0% |
| White / Caucasian | 48 | 92.3% |
| Two or more Races | 0 | 0.0% |
| Some other Race | 0 | 0.0% |
| Total | 52 | 100.0% |
Ancestry in Levering
The most populous ancestries reported in Levering are English (27 | 51.9%), Irish (10 | 19.2%), Dutch (9 | 17.3%), French Canadian (9 | 17.3%), and Polish (9 | 17.3%), together accounting for 123.1% of all Levering residents.
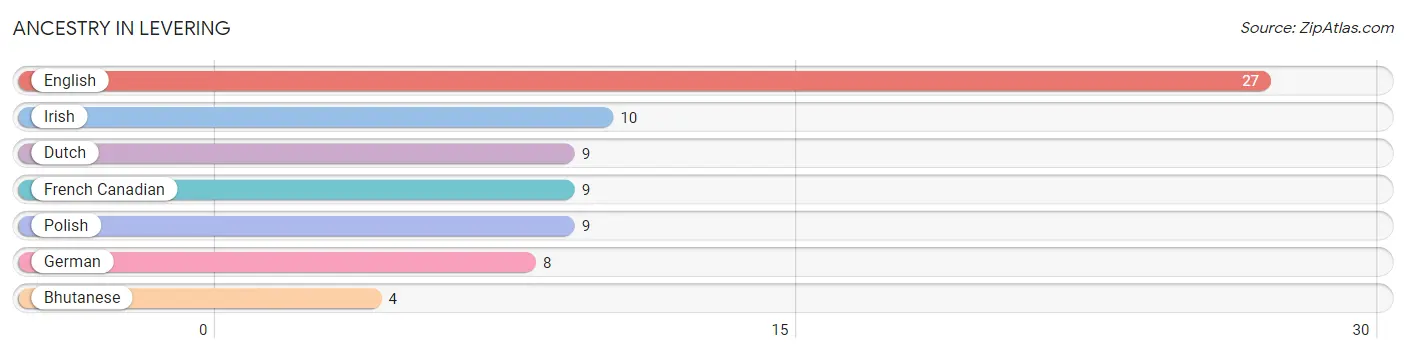
| Ancestry | # Population | % Population |
| Bhutanese | 4 | 7.7% |
| Dutch | 9 | 17.3% |
| English | 27 | 51.9% |
| French Canadian | 9 | 17.3% |
| German | 8 | 15.4% |
| Irish | 10 | 19.2% |
| Polish | 9 | 17.3% | View All 7 Rows |
Immigrants in Levering

| Immigration Origin | # Population | % Population | View All 0 Rows |
Sex and Age in Levering
Sex and Age in Levering
The most populous age groups in Levering are 70 to 74 Years (10 | 34.5%) for men and 55 to 59 Years (9 | 39.1%) for women.
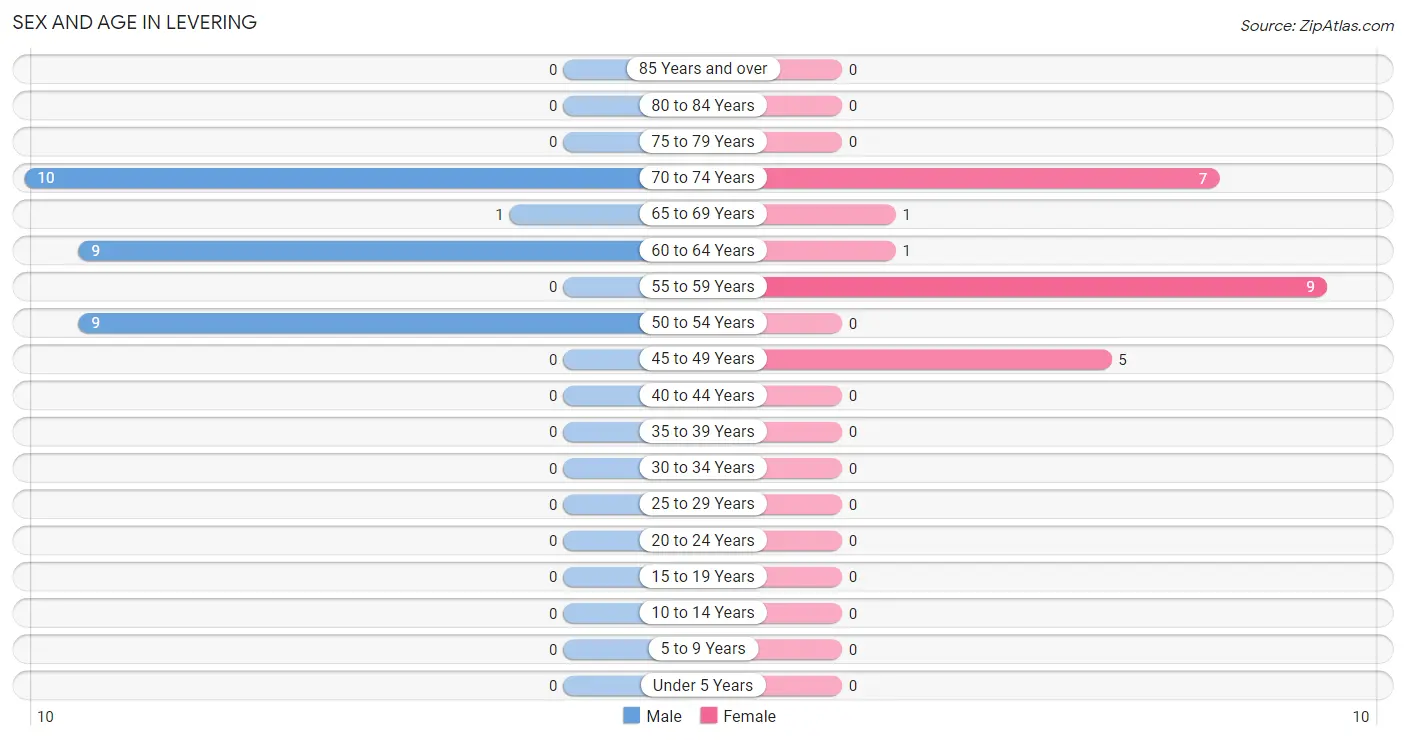
| Age Bracket | Male | Female |
| Under 5 Years | 0 (0.0%) | 0 (0.0%) |
| 5 to 9 Years | 0 (0.0%) | 0 (0.0%) |
| 10 to 14 Years | 0 (0.0%) | 0 (0.0%) |
| 15 to 19 Years | 0 (0.0%) | 0 (0.0%) |
| 20 to 24 Years | 0 (0.0%) | 0 (0.0%) |
| 25 to 29 Years | 0 (0.0%) | 0 (0.0%) |
| 30 to 34 Years | 0 (0.0%) | 0 (0.0%) |
| 35 to 39 Years | 0 (0.0%) | 0 (0.0%) |
| 40 to 44 Years | 0 (0.0%) | 0 (0.0%) |
| 45 to 49 Years | 0 (0.0%) | 5 (21.7%) |
| 50 to 54 Years | 9 (31.0%) | 0 (0.0%) |
| 55 to 59 Years | 0 (0.0%) | 9 (39.1%) |
| 60 to 64 Years | 9 (31.0%) | 1 (4.3%) |
| 65 to 69 Years | 1 (3.5%) | 1 (4.3%) |
| 70 to 74 Years | 10 (34.5%) | 7 (30.4%) |
| 75 to 79 Years | 0 (0.0%) | 0 (0.0%) |
| 80 to 84 Years | 0 (0.0%) | 0 (0.0%) |
| 85 Years and over | 0 (0.0%) | 0 (0.0%) |
| Total | 29 (100.0%) | 23 (100.0%) |
Families and Households in Levering
Median Family Size in Levering
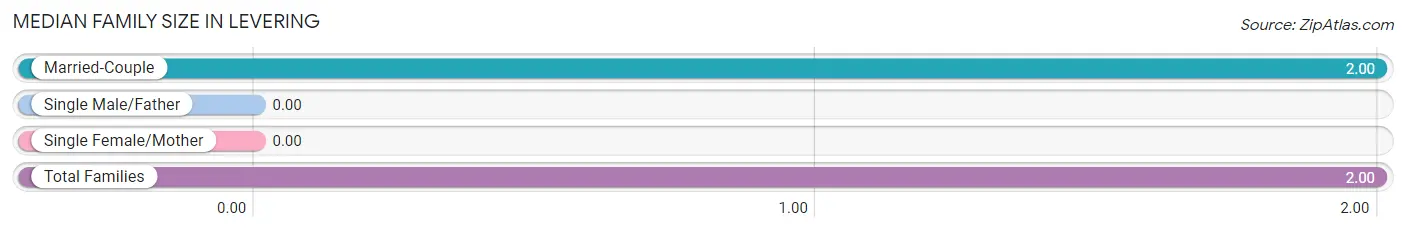
| Family Type | # Families | Family Size |
| Married-Couple | 15 (100.0%) | 2.00 |
| Single Male/Father | 0 (0.0%) | - |
| Single Female/Mother | 0 (0.0%) | - |
| Total Families | 15 (100.0%) | 2.00 |
Median Household Size in Levering
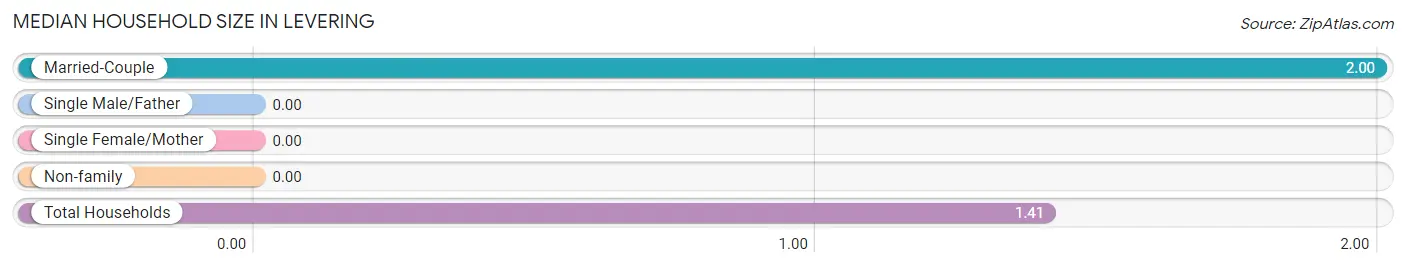
| Household Type | # Households | Household Size |
| Married-Couple | 15 (40.5%) | 2.00 |
| Single Male/Father | 0 (0.0%) | - |
| Single Female/Mother | 0 (0.0%) | - |
| Non-family | 22 (59.5%) | - |
| Total Households | 37 (100.0%) | 1.41 |
Household Size by Marriage Status in Levering
Out of a total of 37 households in Levering, 15 (40.5%) are family households, while 22 (59.5%) are nonfamily households. The most numerous type of family households are 2-person households, comprising 15, and the most common type of nonfamily households are 1-person households, comprising 22.
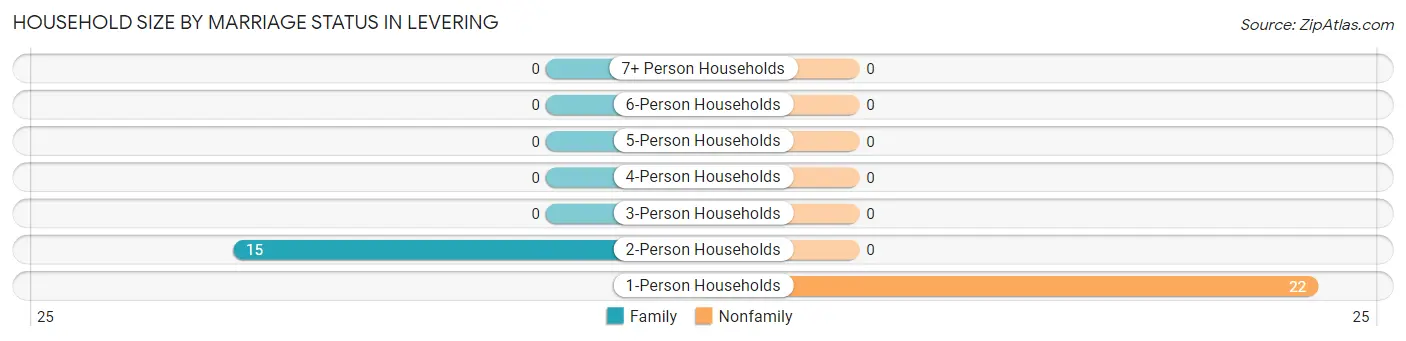
| Household Size | Family Households | Nonfamily Households |
| 1-Person Households | - | 22 (59.5%) |
| 2-Person Households | 15 (40.5%) | 0 (0.0%) |
| 3-Person Households | 0 (0.0%) | 0 (0.0%) |
| 4-Person Households | 0 (0.0%) | 0 (0.0%) |
| 5-Person Households | 0 (0.0%) | 0 (0.0%) |
| 6-Person Households | 0 (0.0%) | 0 (0.0%) |
| 7+ Person Households | 0 (0.0%) | 0 (0.0%) |
| Total | 15 (40.5%) | 22 (59.5%) |
Female Fertility in Levering
Fertility by Age in Levering
| Age Bracket | Women with Births | Births / 1,000 Women |
| 15 to 19 years | 0 (0.0%) | 0.0 |
| 20 to 34 years | 0 (0.0%) | 0.0 |
| 35 to 50 years | 0 (0.0%) | 0.0 |
| Total | 0 (0.0%) | 0.0 |
Fertility by Age by Marriage Status in Levering
| Age Bracket | Married | Unmarried |
| 15 to 19 years | 0 (0.0%) | 0 (0.0%) |
| 20 to 34 years | 0 (0.0%) | 0 (0.0%) |
| 35 to 50 years | 0 (0.0%) | 0 (0.0%) |
| Total | 0 (0.0%) | 0 (0.0%) |
Fertility by Education in Levering
| Educational Attainment | Women with Births | Births / 1,000 Women |
| Less than High School | 0 (0.0%) | 0.0 |
| High School Diploma | 0 (0.0%) | 0.0 |
| College or Associate's Degree | 0 (0.0%) | 0.0 |
| Bachelor's Degree | 0 (0.0%) | 0.0 |
| Graduate Degree | 0 (0.0%) | 0.0 |
| Total | 0 (0.0%) | 0.0 |
Fertility by Education by Marriage Status in Levering
| Educational Attainment | Married | Unmarried |
| Less than High School | 0 (0.0%) | 0 (0.0%) |
| High School Diploma | 0 (0.0%) | 0 (0.0%) |
| College or Associate's Degree | 0 (0.0%) | 0 (0.0%) |
| Bachelor's Degree | 0 (0.0%) | 0 (0.0%) |
| Graduate Degree | 0 (0.0%) | 0 (0.0%) |
| Total | 0 (0.0%) | 0 (0.0%) |
Employment Characteristics in Levering
Employment by Class of Employer in Levering
Among the 24 employed individuals in Levering, private company employees (14 | 58.3%), not-for-profit organizations (9 | 37.5%), and local government employees (1 | 4.2%) make up the most common classes of employment.
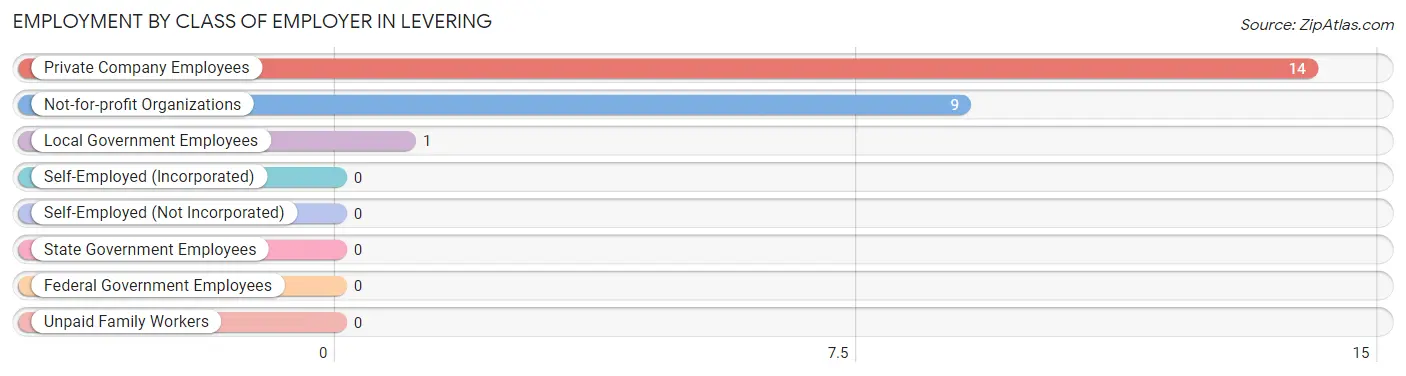
| Employer Class | # Employees | % Employees |
| Private Company Employees | 14 | 58.3% |
| Self-Employed (Incorporated) | 0 | 0.0% |
| Self-Employed (Not Incorporated) | 0 | 0.0% |
| Not-for-profit Organizations | 9 | 37.5% |
| Local Government Employees | 1 | 4.2% |
| State Government Employees | 0 | 0.0% |
| Federal Government Employees | 0 | 0.0% |
| Unpaid Family Workers | 0 | 0.0% |
| Total | 24 | 100.0% |
Employment Status by Age in Levering
According to the labor force statistics for Levering, out of the total population over 16 years of age (52), 50.0% or 26 individuals are in the labor force, with 7.7% or 2 of them unemployed. The age group with the highest labor force participation rate is 55 to 59 years, with 100.0% or 9 individuals in the labor force. Within the labor force, the 65 to 74 years age range has the highest percentage of unemployed individuals, with 18.2% or 2 of them being unemployed.
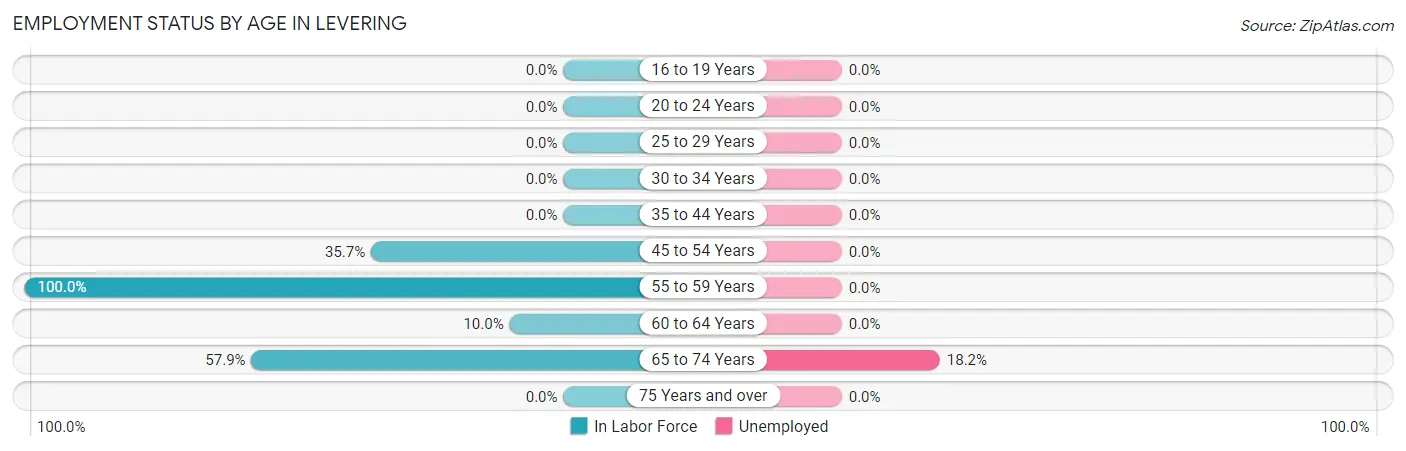
| Age Bracket | In Labor Force | Unemployed |
| 16 to 19 Years | 0 (0.0%) | 0 (0.0%) |
| 20 to 24 Years | 0 (0.0%) | 0 (0.0%) |
| 25 to 29 Years | 0 (0.0%) | 0 (0.0%) |
| 30 to 34 Years | 0 (0.0%) | 0 (0.0%) |
| 35 to 44 Years | 0 (0.0%) | 0 (0.0%) |
| 45 to 54 Years | 5 (35.7%) | 0 (0.0%) |
| 55 to 59 Years | 9 (100.0%) | 0 (0.0%) |
| 60 to 64 Years | 1 (10.0%) | 0 (0.0%) |
| 65 to 74 Years | 11 (57.9%) | 2 (18.2%) |
| 75 Years and over | 0 (0.0%) | 0 (0.0%) |
| Total | 26 (50.0%) | 2 (7.7%) |
Employment Status by Educational Attainment in Levering
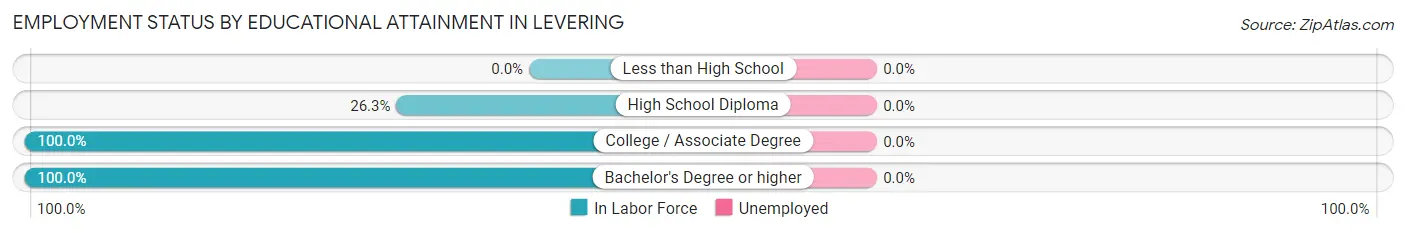
| Educational Attainment | In Labor Force | Unemployed |
| Less than High School | 0 (0.0%) | 0 (0.0%) |
| High School Diploma | 5 (26.3%) | 0 (0.0%) |
| College / Associate Degree | 9 (100.0%) | 0 (0.0%) |
| Bachelor's Degree or higher | 1 (100.0%) | 0 (0.0%) |
| Total | 15 (45.5%) | 0 (0.0%) |
Employment Occupations by Sex in Levering
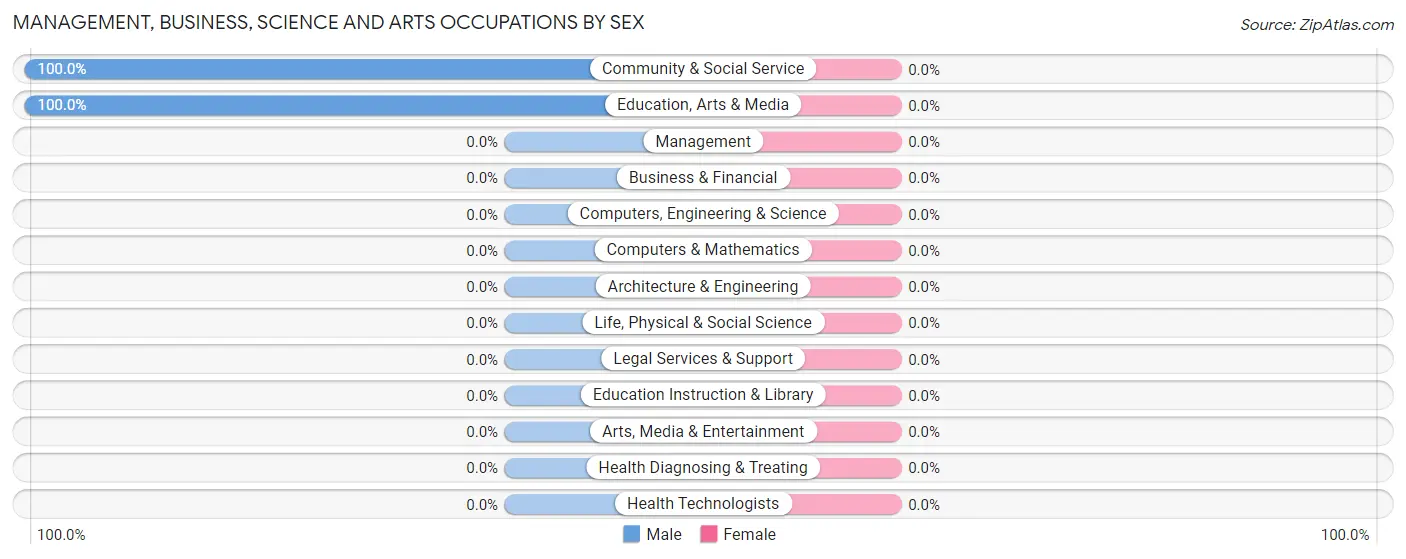
Management, Business, Science and Arts Occupations
The most common Management, Business, Science and Arts occupations in Levering are Community & Social Service (9 | 37.5%), and Education, Arts & Media (9 | 37.5%).
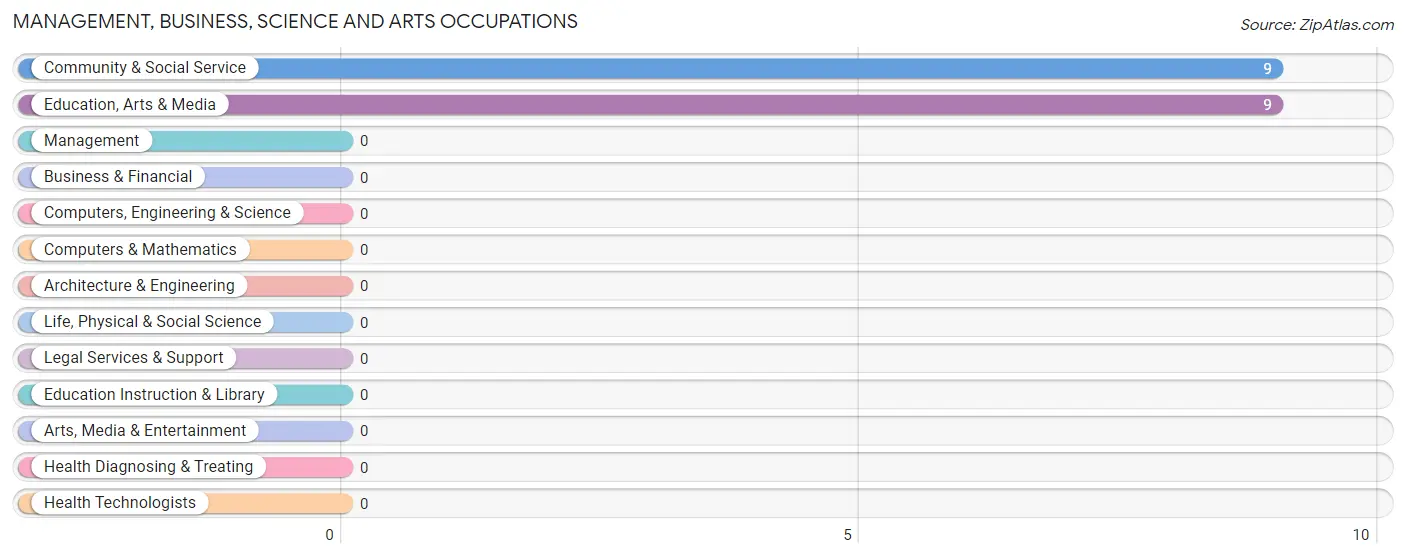
Management, Business, Science and Arts Occupations by Sex
| Occupation | Male | Female |
| Management | 0 (0.0%) | 0 (0.0%) |
| Business & Financial | 0 (0.0%) | 0 (0.0%) |
| Computers, Engineering & Science | 0 (0.0%) | 0 (0.0%) |
| Computers & Mathematics | 0 (0.0%) | 0 (0.0%) |
| Architecture & Engineering | 0 (0.0%) | 0 (0.0%) |
| Life, Physical & Social Science | 0 (0.0%) | 0 (0.0%) |
| Community & Social Service | 9 (100.0%) | 0 (0.0%) |
| Education, Arts & Media | 9 (100.0%) | 0 (0.0%) |
| Legal Services & Support | 0 (0.0%) | 0 (0.0%) |
| Education Instruction & Library | 0 (0.0%) | 0 (0.0%) |
| Arts, Media & Entertainment | 0 (0.0%) | 0 (0.0%) |
| Health Diagnosing & Treating | 0 (0.0%) | 0 (0.0%) |
| Health Technologists | 0 (0.0%) | 0 (0.0%) |
| Total (Category) | 9 (100.0%) | 0 (0.0%) |
| Total (Overall) | 14 (58.3%) | 10 (41.7%) |
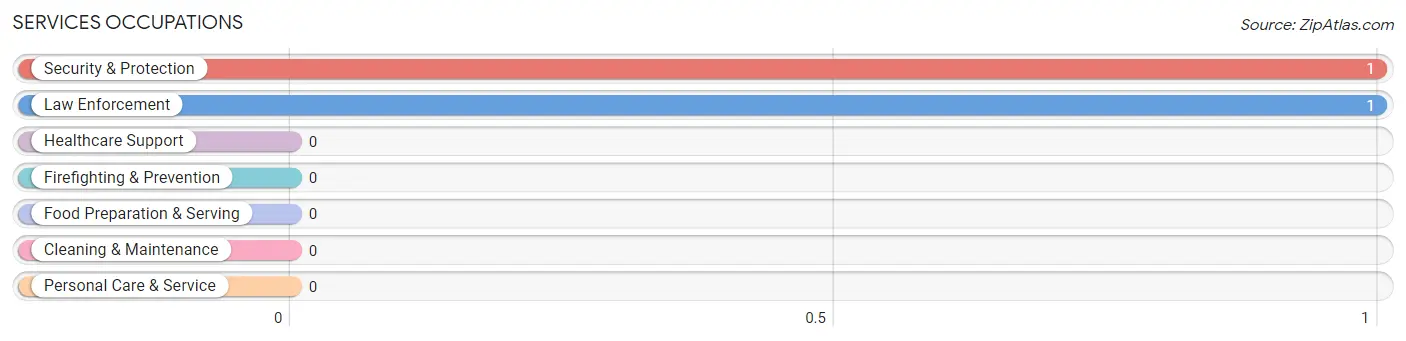
Services Occupations
The most common Services occupations in Levering are Security & Protection (1 | 4.2%), and Law Enforcement (1 | 4.2%).
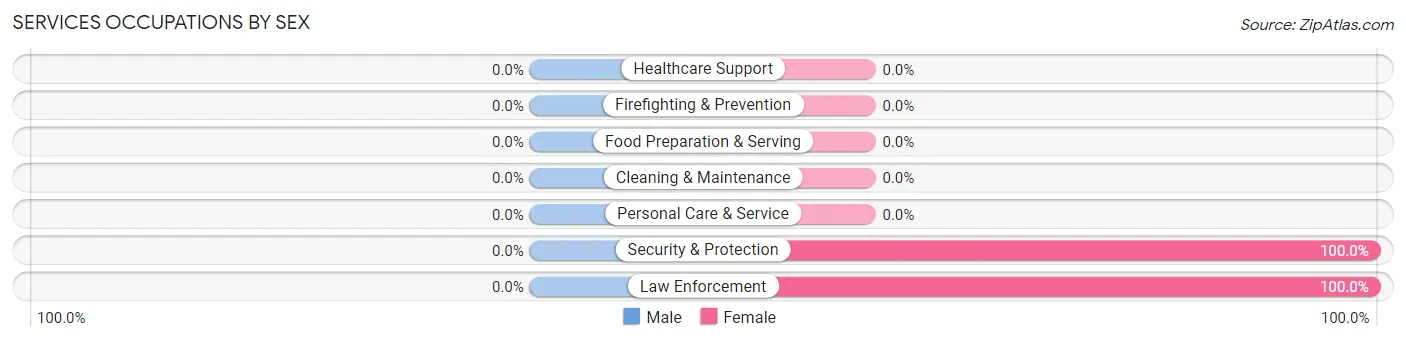
Services Occupations by Sex
| Occupation | Male | Female |
| Healthcare Support | 0 (0.0%) | 0 (0.0%) |
| Security & Protection | 0 (0.0%) | 1 (100.0%) |
| Firefighting & Prevention | 0 (0.0%) | 0 (0.0%) |
| Law Enforcement | 0 (0.0%) | 1 (100.0%) |
| Food Preparation & Serving | 0 (0.0%) | 0 (0.0%) |
| Cleaning & Maintenance | 0 (0.0%) | 0 (0.0%) |
| Personal Care & Service | 0 (0.0%) | 0 (0.0%) |
| Total (Category) | 0 (0.0%) | 1 (100.0%) |
| Total (Overall) | 14 (58.3%) | 10 (41.7%) |
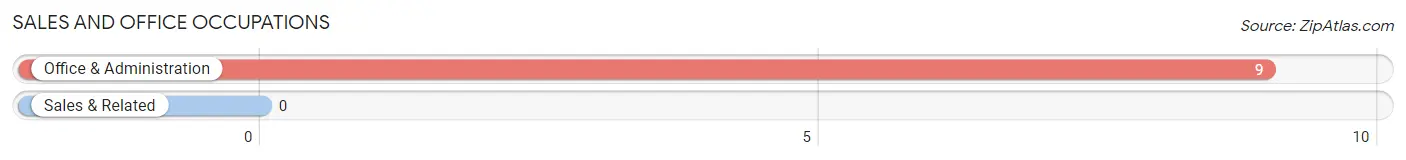
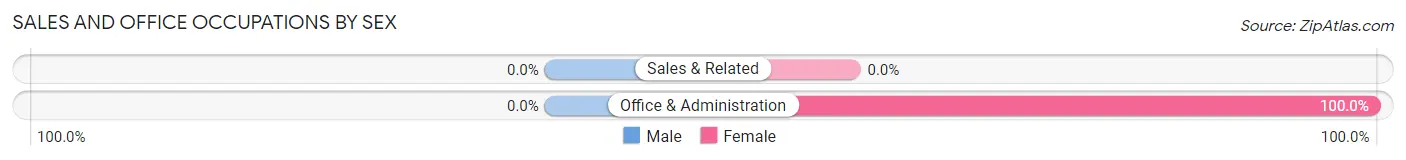
Sales and Office Occupations
The most common Sales and Office occupations in Levering are , and Office & Administration (9 | 37.5%).
Sales and Office Occupations by Sex
| Occupation | Male | Female |
| Sales & Related | 0 (0.0%) | 0 (0.0%) |
| Office & Administration | 0 (0.0%) | 9 (100.0%) |
| Total (Category) | 0 (0.0%) | 9 (100.0%) |
| Total (Overall) | 14 (58.3%) | 10 (41.7%) |
Natural Resources, Construction and Maintenance Occupations
The most common Natural Resources, Construction and Maintenance occupations in Levering are , and Construction & Extraction (5 | 20.8%).
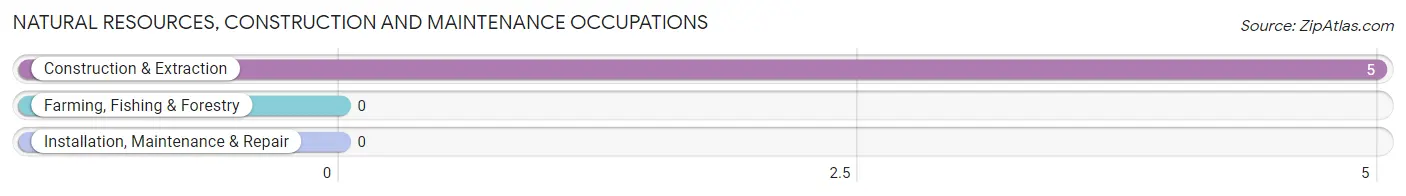
Natural Resources, Construction and Maintenance Occupations by Sex
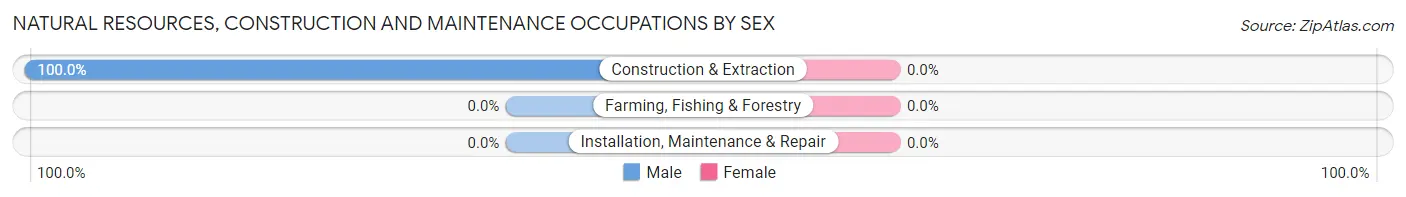
| Occupation | Male | Female |
| Farming, Fishing & Forestry | 0 (0.0%) | 0 (0.0%) |
| Construction & Extraction | 5 (100.0%) | 0 (0.0%) |
| Installation, Maintenance & Repair | 0 (0.0%) | 0 (0.0%) |
| Total (Category) | 5 (100.0%) | 0 (0.0%) |
| Total (Overall) | 14 (58.3%) | 10 (41.7%) |
Production, Transportation and Moving Occupations
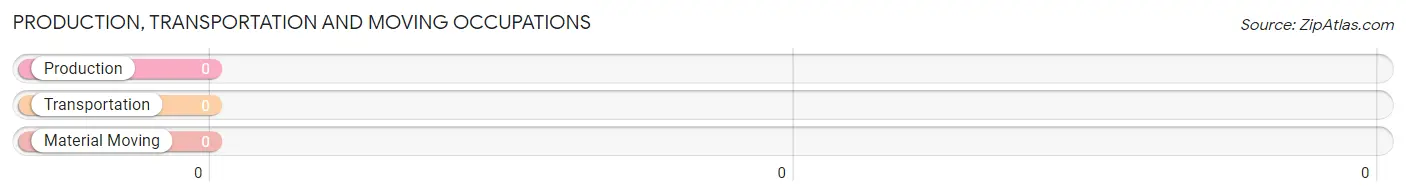
Production, Transportation and Moving Occupations by Sex
| Occupation | Male | Female |
| Production | 0 (0.0%) | 0 (0.0%) |
| Transportation | 0 (0.0%) | 0 (0.0%) |
| Material Moving | 0 (0.0%) | 0 (0.0%) |
| Total (Category) | 0 (0.0%) | 0 (0.0%) |
| Total (Overall) | 14 (58.3%) | 10 (41.7%) |
Employment Industries by Sex in Levering
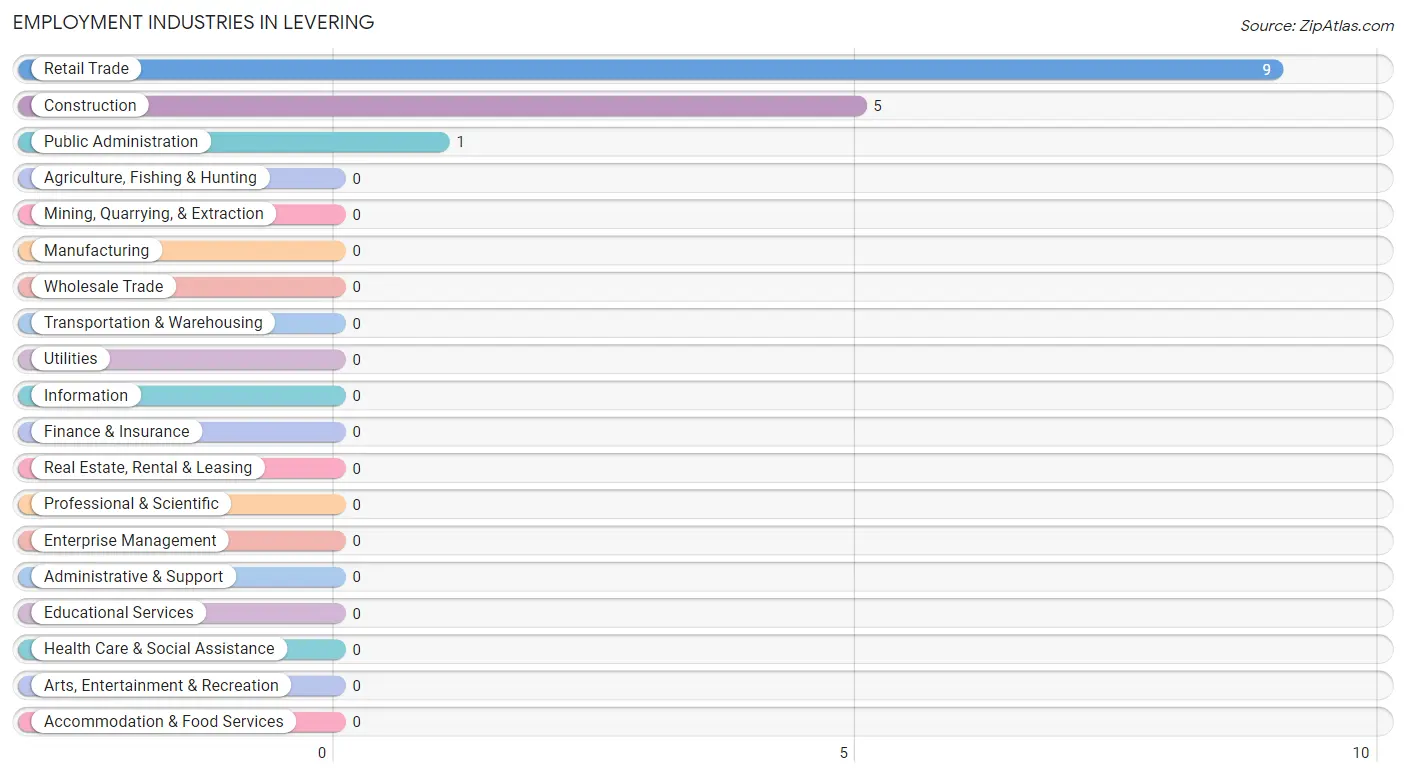
Employment Industries in Levering
The major employment industries in Levering include Retail Trade (9 | 37.5%), Construction (5 | 20.8%), and Public Administration (1 | 4.2%).
Employment Industries by Sex in Levering
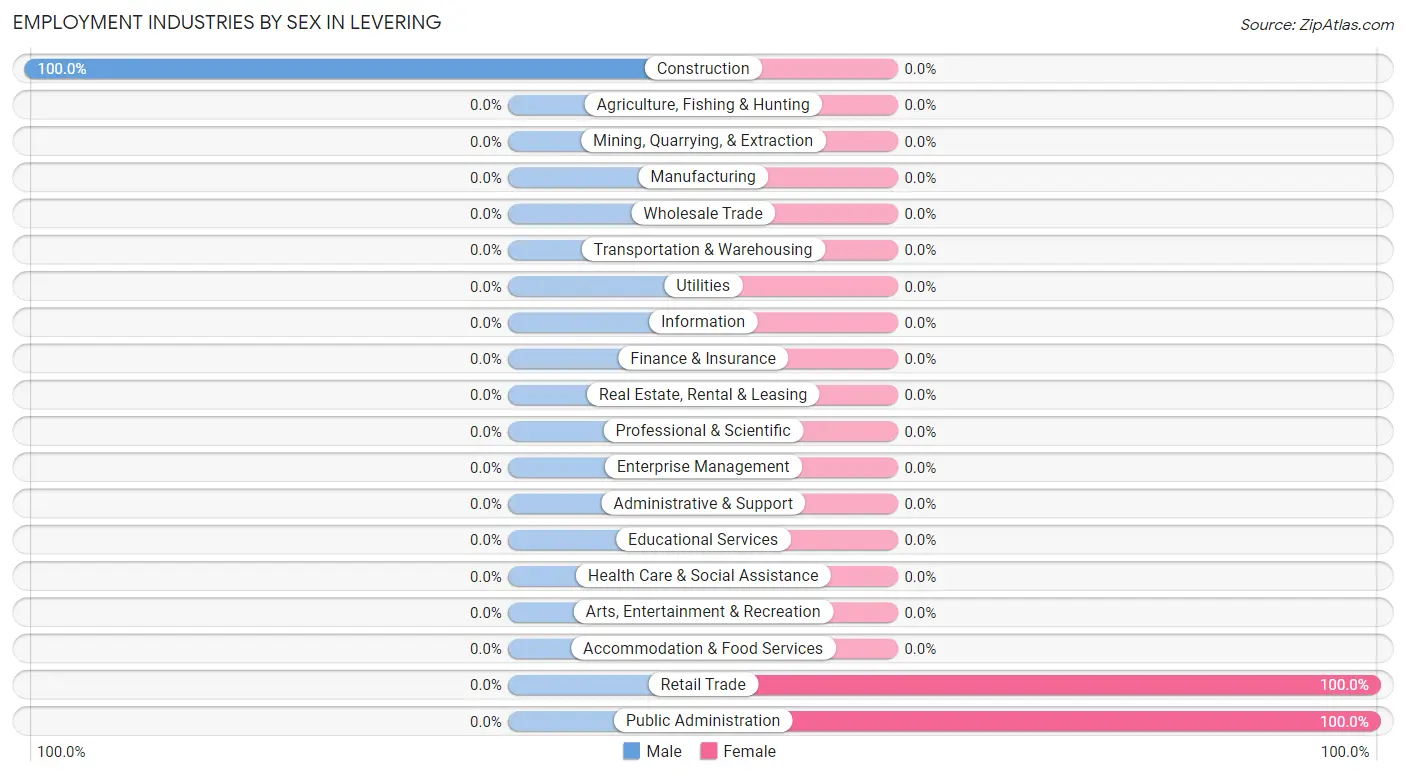
| Industry | Male | Female |
| Agriculture, Fishing & Hunting | 0 (0.0%) | 0 (0.0%) |
| Mining, Quarrying, & Extraction | 0 (0.0%) | 0 (0.0%) |
| Construction | 5 (100.0%) | 0 (0.0%) |
| Manufacturing | 0 (0.0%) | 0 (0.0%) |
| Wholesale Trade | 0 (0.0%) | 0 (0.0%) |
| Retail Trade | 0 (0.0%) | 9 (100.0%) |
| Transportation & Warehousing | 0 (0.0%) | 0 (0.0%) |
| Utilities | 0 (0.0%) | 0 (0.0%) |
| Information | 0 (0.0%) | 0 (0.0%) |
| Finance & Insurance | 0 (0.0%) | 0 (0.0%) |
| Real Estate, Rental & Leasing | 0 (0.0%) | 0 (0.0%) |
| Professional & Scientific | 0 (0.0%) | 0 (0.0%) |
| Enterprise Management | 0 (0.0%) | 0 (0.0%) |
| Administrative & Support | 0 (0.0%) | 0 (0.0%) |
| Educational Services | 0 (0.0%) | 0 (0.0%) |
| Health Care & Social Assistance | 0 (0.0%) | 0 (0.0%) |
| Arts, Entertainment & Recreation | 0 (0.0%) | 0 (0.0%) |
| Accommodation & Food Services | 0 (0.0%) | 0 (0.0%) |
| Public Administration | 0 (0.0%) | 1 (100.0%) |
| Total | 14 (58.3%) | 10 (41.7%) |
Education in Levering
School Enrollment in Levering
| School Level | # Students | % Students |
| Nursery / Preschool | 0 | 0.0% |
| Kindergarten | 0 | 0.0% |
| Elementary School | 0 | 0.0% |
| Middle School | 0 | 0.0% |
| High School | 0 | 0.0% |
| College / Undergraduate | 0 | 0.0% |
| Graduate / Professional | 0 | 0.0% |
| Total | 0 | 0.0% |
School Enrollment by Age by Funding Source in Levering
| Age Bracket | Public School | Private School |
| 3 to 4 Year Olds | 0 (0.0%) | 0 (0.0%) |
| 5 to 9 Year Old | 0 (0.0%) | 0 (0.0%) |
| 10 to 14 Year Olds | 0 (0.0%) | 0 (0.0%) |
| 15 to 17 Year Olds | 0 (0.0%) | 0 (0.0%) |
| 18 to 19 Year Olds | 0 (0.0%) | 0 (0.0%) |
| 20 to 24 Year Olds | 0 (0.0%) | 0 (0.0%) |
| 25 to 34 Year Olds | 0 (0.0%) | 0 (0.0%) |
| 35 Years and over | 0 (0.0%) | 0 (0.0%) |
| Total | 0 (0.0%) | 0 (0.0%) |
Educational Attainment by Field of Study in Levering
, and arts & humanities (1 | 100.0%) are the most common fields of study among 1 individuals in Levering who have obtained a bachelor's degree or higher.
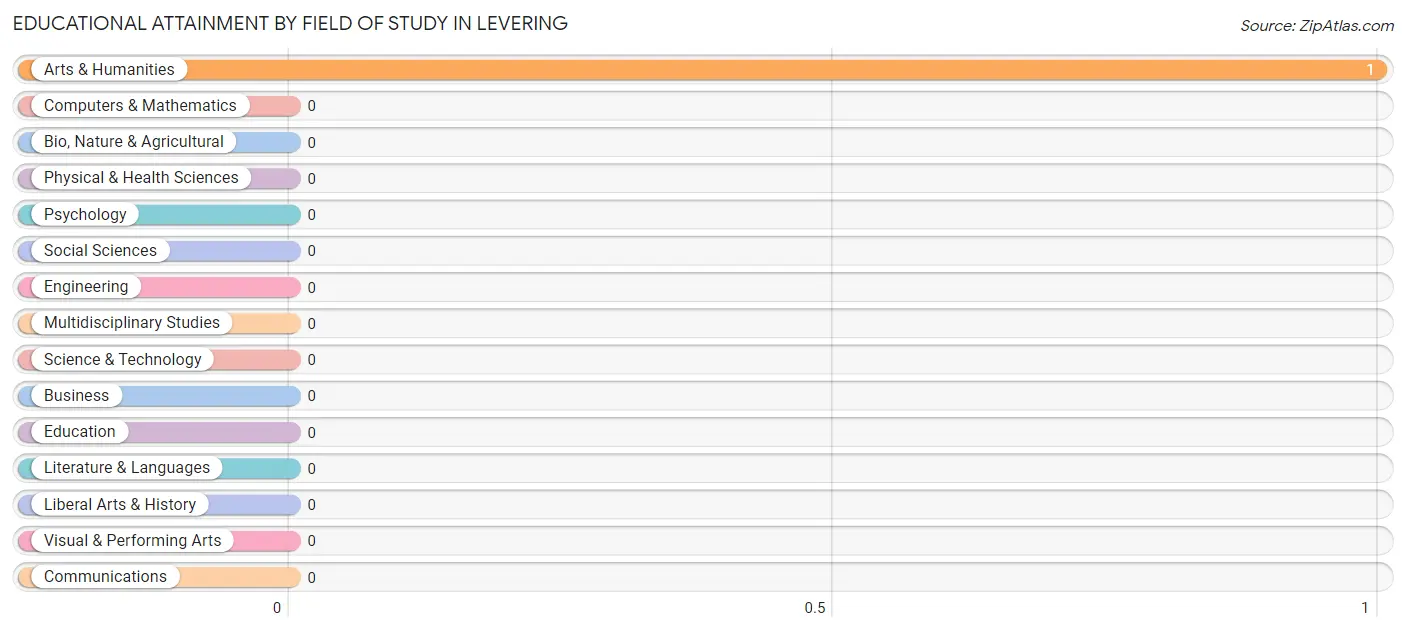
| Field of Study | # Graduates | % Graduates |
| Computers & Mathematics | 0 | 0.0% |
| Bio, Nature & Agricultural | 0 | 0.0% |
| Physical & Health Sciences | 0 | 0.0% |
| Psychology | 0 | 0.0% |
| Social Sciences | 0 | 0.0% |
| Engineering | 0 | 0.0% |
| Multidisciplinary Studies | 0 | 0.0% |
| Science & Technology | 0 | 0.0% |
| Business | 0 | 0.0% |
| Education | 0 | 0.0% |
| Literature & Languages | 0 | 0.0% |
| Liberal Arts & History | 0 | 0.0% |
| Visual & Performing Arts | 0 | 0.0% |
| Communications | 0 | 0.0% |
| Arts & Humanities | 1 | 100.0% |
| Total | 1 | 100.0% |
Transportation & Commute in Levering
Vehicle Availability by Sex in Levering
The most prevalent vehicle ownership categories in Levering are males with 2 vehicles (8, accounting for 57.1%) and females with 2 vehicles (0, making up 80.0%).
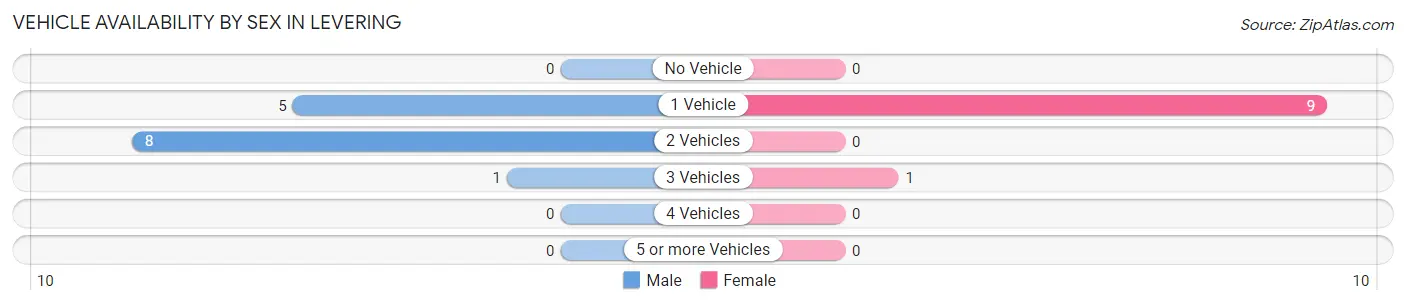
| Vehicles Available | Male | Female |
| No Vehicle | 0 (0.0%) | 0 (0.0%) |
| 1 Vehicle | 5 (35.7%) | 9 (90.0%) |
| 2 Vehicles | 8 (57.1%) | 0 (0.0%) |
| 3 Vehicles | 1 (7.1%) | 1 (10.0%) |
| 4 Vehicles | 0 (0.0%) | 0 (0.0%) |
| 5 or more Vehicles | 0 (0.0%) | 0 (0.0%) |
| Total | 14 (100.0%) | 10 (100.0%) |
Commute Time in Levering
The most frequently occuring commute durations in Levering are 5 to 9 minutes (10 commuters, 41.7%), less than 5 minutes (8 commuters, 33.3%), and 20 to 24 minutes (5 commuters, 20.8%).
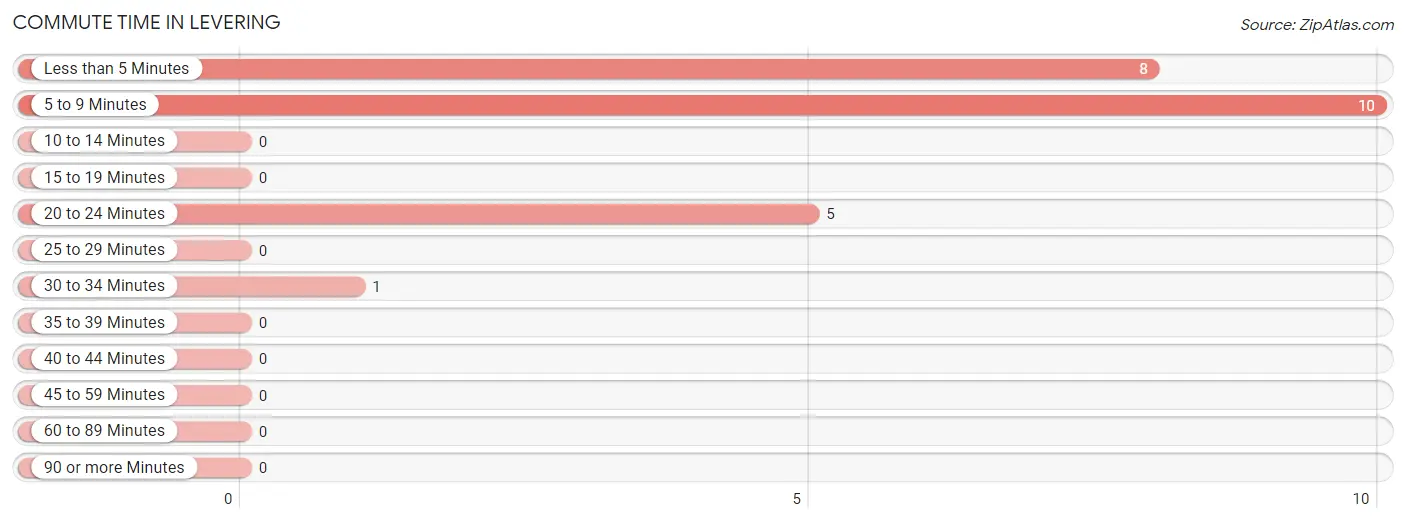
| Commute Time | # Commuters | % Commuters |
| Less than 5 Minutes | 8 | 33.3% |
| 5 to 9 Minutes | 10 | 41.7% |
| 10 to 14 Minutes | 0 | 0.0% |
| 15 to 19 Minutes | 0 | 0.0% |
| 20 to 24 Minutes | 5 | 20.8% |
| 25 to 29 Minutes | 0 | 0.0% |
| 30 to 34 Minutes | 1 | 4.2% |
| 35 to 39 Minutes | 0 | 0.0% |
| 40 to 44 Minutes | 0 | 0.0% |
| 45 to 59 Minutes | 0 | 0.0% |
| 60 to 89 Minutes | 0 | 0.0% |
| 90 or more Minutes | 0 | 0.0% |
Commute Time by Sex in Levering
The most common commute times in Levering are less than 5 minutes (8 commuters, 57.1%) for males and 5 to 9 minutes (9 commuters, 90.0%) for females.
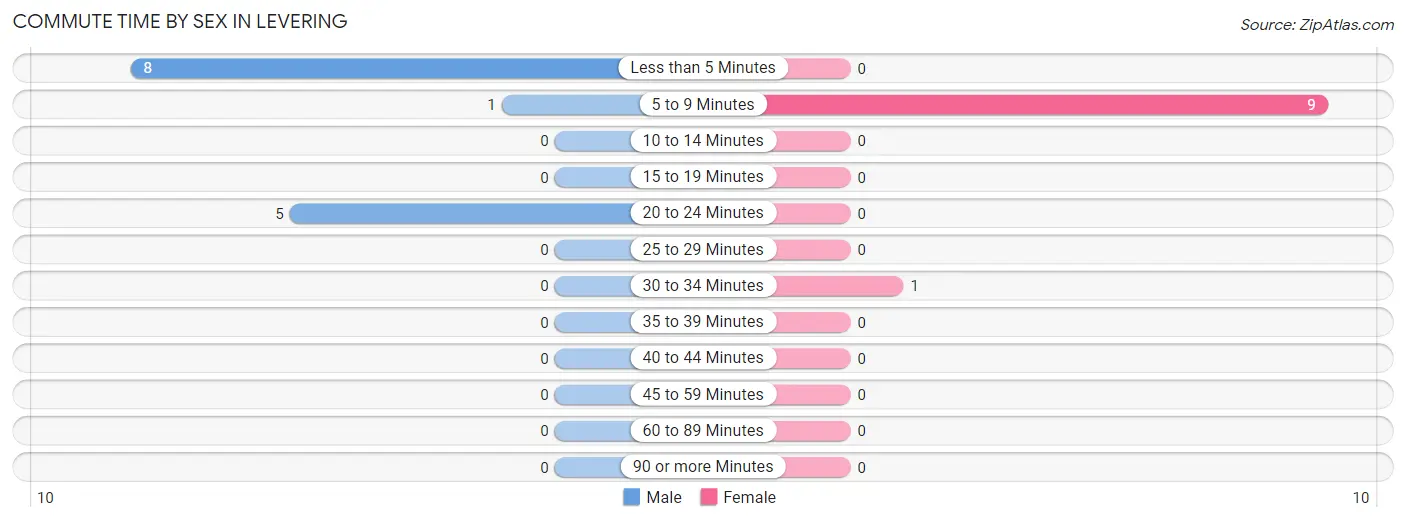
| Commute Time | Male | Female |
| Less than 5 Minutes | 8 (57.1%) | 0 (0.0%) |
| 5 to 9 Minutes | 1 (7.1%) | 9 (90.0%) |
| 10 to 14 Minutes | 0 (0.0%) | 0 (0.0%) |
| 15 to 19 Minutes | 0 (0.0%) | 0 (0.0%) |
| 20 to 24 Minutes | 5 (35.7%) | 0 (0.0%) |
| 25 to 29 Minutes | 0 (0.0%) | 0 (0.0%) |
| 30 to 34 Minutes | 0 (0.0%) | 1 (10.0%) |
| 35 to 39 Minutes | 0 (0.0%) | 0 (0.0%) |
| 40 to 44 Minutes | 0 (0.0%) | 0 (0.0%) |
| 45 to 59 Minutes | 0 (0.0%) | 0 (0.0%) |
| 60 to 89 Minutes | 0 (0.0%) | 0 (0.0%) |
| 90 or more Minutes | 0 (0.0%) | 0 (0.0%) |
Time of Departure to Work by Sex in Levering
The most frequent times of departure to work in Levering are 9:00 AM to 9:59 AM (8, 57.1%) for males and 12:00 AM to 4:59 AM (9, 90.0%) for females.
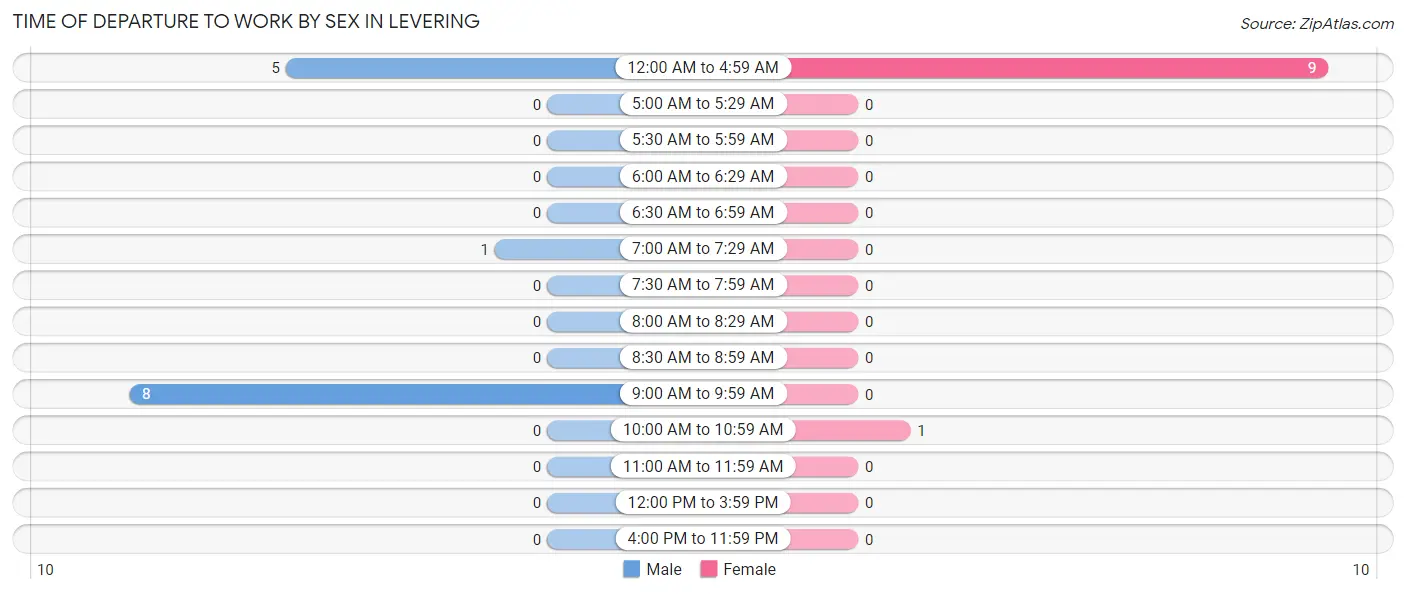
| Time of Departure | Male | Female |
| 12:00 AM to 4:59 AM | 5 (35.7%) | 9 (90.0%) |
| 5:00 AM to 5:29 AM | 0 (0.0%) | 0 (0.0%) |
| 5:30 AM to 5:59 AM | 0 (0.0%) | 0 (0.0%) |
| 6:00 AM to 6:29 AM | 0 (0.0%) | 0 (0.0%) |
| 6:30 AM to 6:59 AM | 0 (0.0%) | 0 (0.0%) |
| 7:00 AM to 7:29 AM | 1 (7.1%) | 0 (0.0%) |
| 7:30 AM to 7:59 AM | 0 (0.0%) | 0 (0.0%) |
| 8:00 AM to 8:29 AM | 0 (0.0%) | 0 (0.0%) |
| 8:30 AM to 8:59 AM | 0 (0.0%) | 0 (0.0%) |
| 9:00 AM to 9:59 AM | 8 (57.1%) | 0 (0.0%) |
| 10:00 AM to 10:59 AM | 0 (0.0%) | 1 (10.0%) |
| 11:00 AM to 11:59 AM | 0 (0.0%) | 0 (0.0%) |
| 12:00 PM to 3:59 PM | 0 (0.0%) | 0 (0.0%) |
| 4:00 PM to 11:59 PM | 0 (0.0%) | 0 (0.0%) |
| Total | 14 (100.0%) | 10 (100.0%) |
Housing Occupancy in Levering
Occupancy by Ownership in Levering
Of the total 37 dwellings in Levering, owner-occupied units account for 25 (67.6%), while renter-occupied units make up 12 (32.4%).
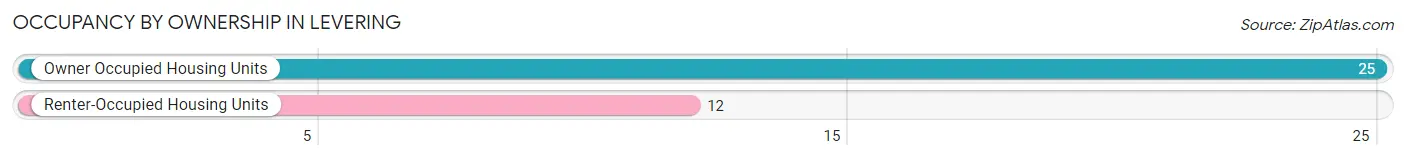
| Occupancy | # Housing Units | % Housing Units |
| Owner Occupied Housing Units | 25 | 67.6% |
| Renter-Occupied Housing Units | 12 | 32.4% |
| Total Occupied Housing Units | 37 | 100.0% |
Occupancy by Household Size in Levering
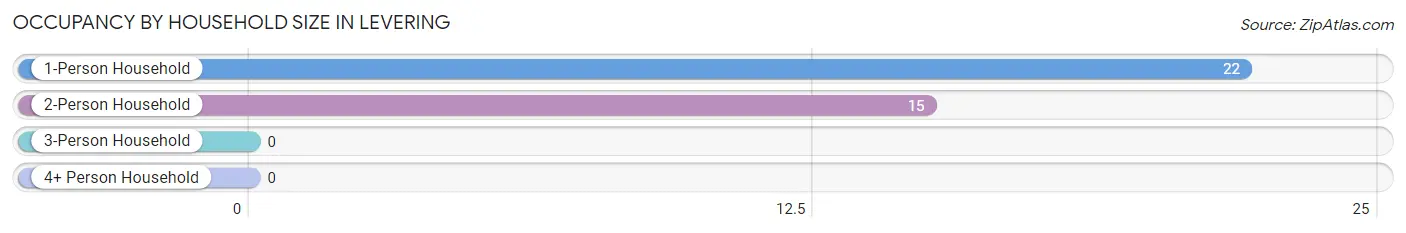
| Household Size | # Housing Units | % Housing Units |
| 1-Person Household | 22 | 59.5% |
| 2-Person Household | 15 | 40.5% |
| 3-Person Household | 0 | 0.0% |
| 4+ Person Household | 0 | 0.0% |
| Total Housing Units | 37 | 100.0% |
Occupancy by Ownership by Household Size in Levering
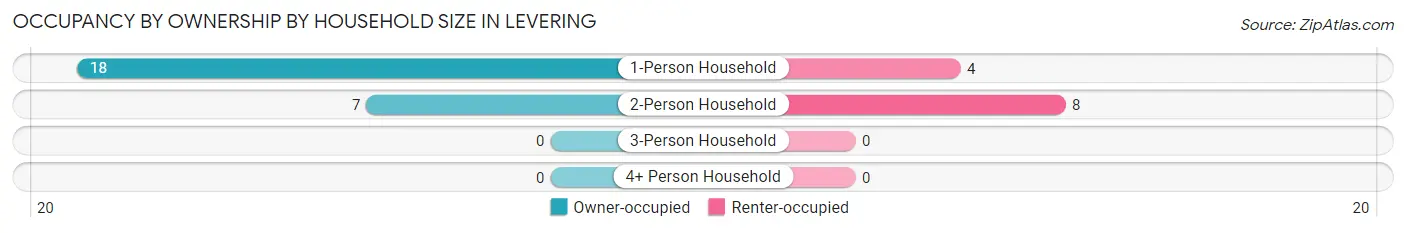
| Household Size | Owner-occupied | Renter-occupied |
| 1-Person Household | 18 (81.8%) | 4 (18.2%) |
| 2-Person Household | 7 (46.7%) | 8 (53.3%) |
| 3-Person Household | 0 (0.0%) | 0 (0.0%) |
| 4+ Person Household | 0 (0.0%) | 0 (0.0%) |
| Total Housing Units | 25 (67.6%) | 12 (32.4%) |
Occupancy by Educational Attainment in Levering
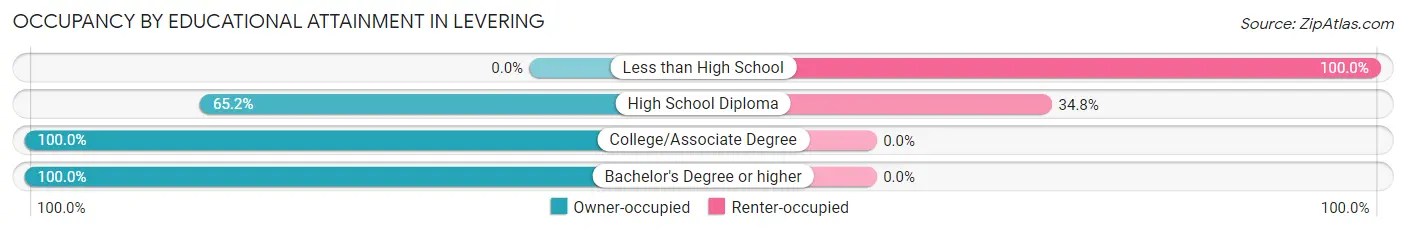
| Household Size | Owner-occupied | Renter-occupied |
| Less than High School | 0 (0.0%) | 4 (100.0%) |
| High School Diploma | 15 (65.2%) | 8 (34.8%) |
| College/Associate Degree | 9 (100.0%) | 0 (0.0%) |
| Bachelor's Degree or higher | 1 (100.0%) | 0 (0.0%) |
Occupancy by Age of Householder in Levering
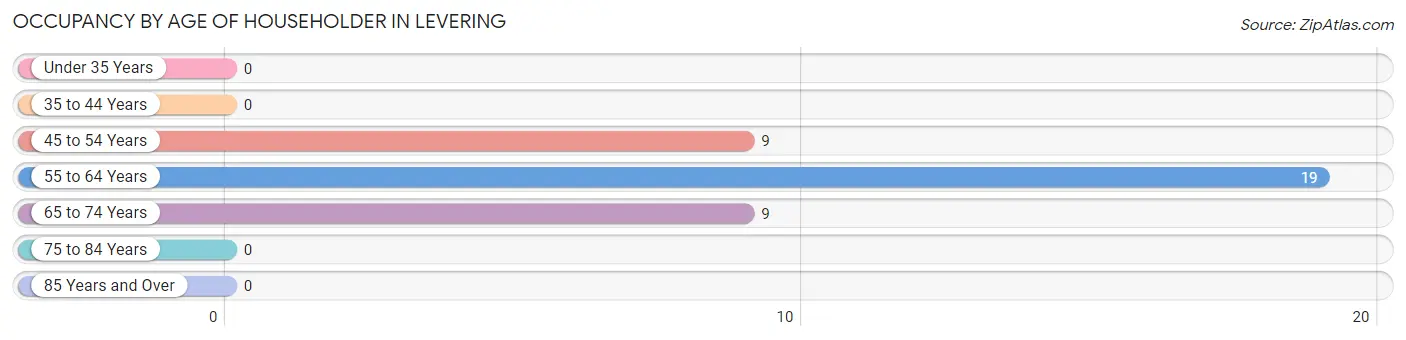
| Age Bracket | # Households | % Households |
| Under 35 Years | 0 | 0.0% |
| 35 to 44 Years | 0 | 0.0% |
| 45 to 54 Years | 9 | 24.3% |
| 55 to 64 Years | 19 | 51.3% |
| 65 to 74 Years | 9 | 24.3% |
| 75 to 84 Years | 0 | 0.0% |
| 85 Years and Over | 0 | 0.0% |
| Total | 37 | 100.0% |
Housing Finances in Levering
Median Income by Occupancy in Levering
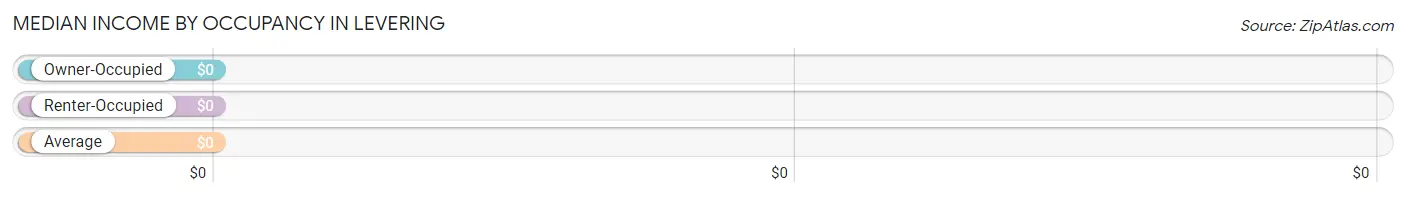
| Occupancy Type | # Households | Median Income |
| Owner-Occupied | 25 (67.6%) | $0 |
| Renter-Occupied | 12 (32.4%) | $0 |
| Average | 37 (100.0%) | $0 |
Occupancy by Householder Income Bracket in Levering
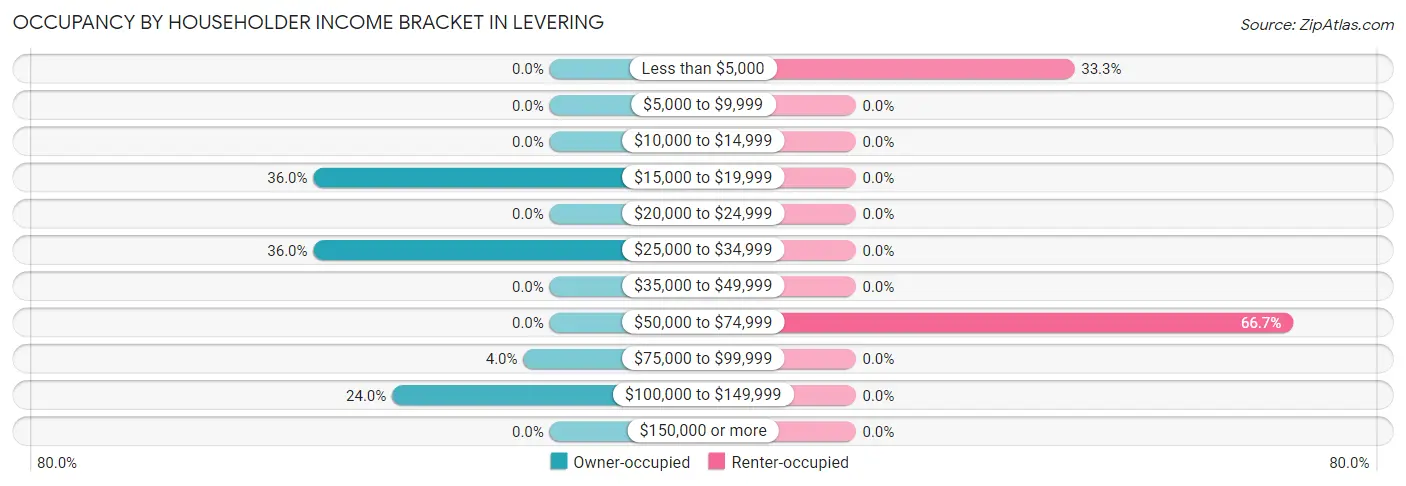
| Income Bracket | Owner-occupied | Renter-occupied |
| Less than $5,000 | 0 (0.0%) | 4 (33.3%) |
| $5,000 to $9,999 | 0 (0.0%) | 0 (0.0%) |
| $10,000 to $14,999 | 0 (0.0%) | 0 (0.0%) |
| $15,000 to $19,999 | 9 (36.0%) | 0 (0.0%) |
| $20,000 to $24,999 | 0 (0.0%) | 0 (0.0%) |
| $25,000 to $34,999 | 9 (36.0%) | 0 (0.0%) |
| $35,000 to $49,999 | 0 (0.0%) | 0 (0.0%) |
| $50,000 to $74,999 | 0 (0.0%) | 8 (66.7%) |
| $75,000 to $99,999 | 1 (4.0%) | 0 (0.0%) |
| $100,000 to $149,999 | 6 (24.0%) | 0 (0.0%) |
| $150,000 or more | 0 (0.0%) | 0 (0.0%) |
| Total | 25 (100.0%) | 12 (100.0%) |
Monthly Housing Cost Tiers in Levering
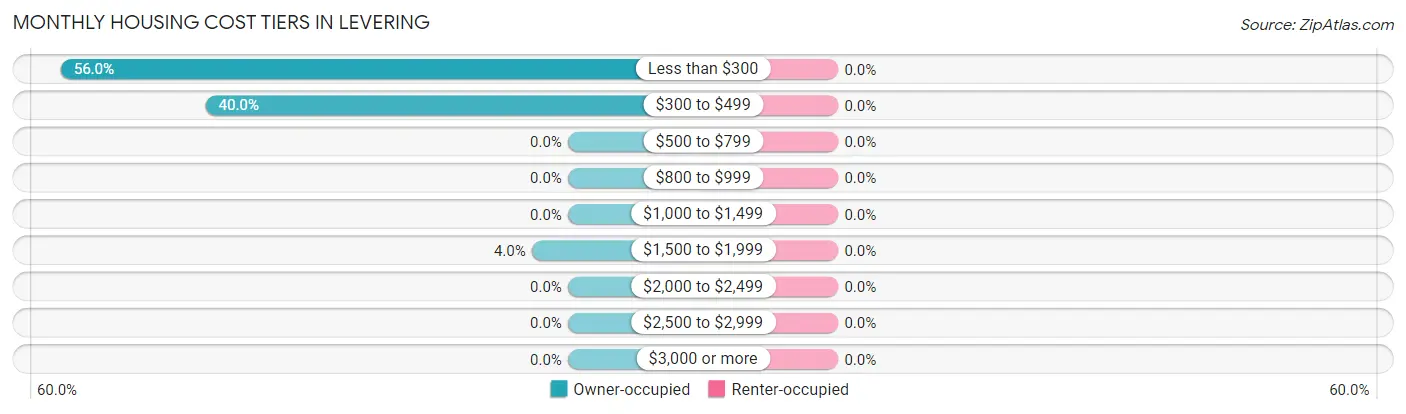
| Monthly Cost | Owner-occupied | Renter-occupied |
| Less than $300 | 14 (56.0%) | 0 (0.0%) |
| $300 to $499 | 10 (40.0%) | 0 (0.0%) |
| $500 to $799 | 0 (0.0%) | 0 (0.0%) |
| $800 to $999 | 0 (0.0%) | 0 (0.0%) |
| $1,000 to $1,499 | 0 (0.0%) | 0 (0.0%) |
| $1,500 to $1,999 | 1 (4.0%) | 0 (0.0%) |
| $2,000 to $2,499 | 0 (0.0%) | 0 (0.0%) |
| $2,500 to $2,999 | 0 (0.0%) | 0 (0.0%) |
| $3,000 or more | 0 (0.0%) | 0 (0.0%) |
| Total | 25 (100.0%) | 12 (100.0%) |
Physical Housing Characteristics in Levering
Housing Structures in Levering
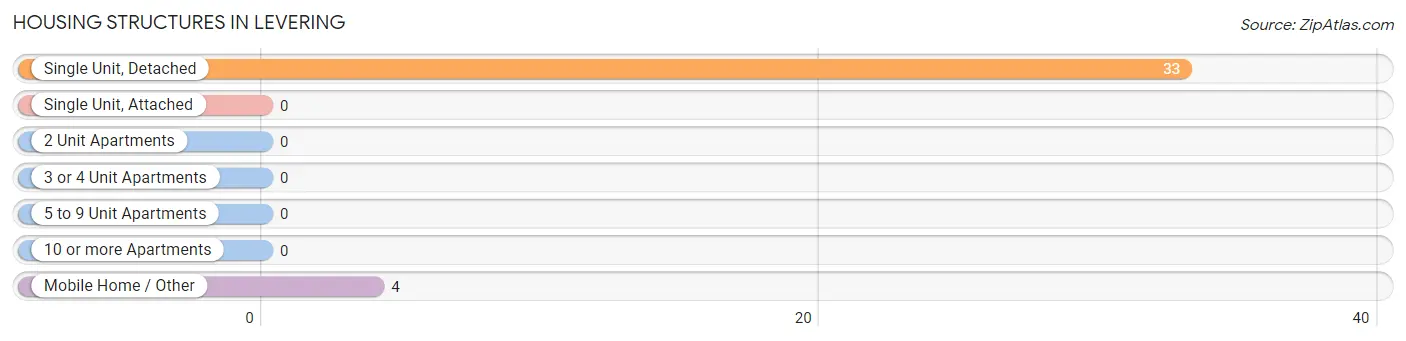
| Structure Type | # Housing Units | % Housing Units |
| Single Unit, Detached | 33 | 89.2% |
| Single Unit, Attached | 0 | 0.0% |
| 2 Unit Apartments | 0 | 0.0% |
| 3 or 4 Unit Apartments | 0 | 0.0% |
| 5 to 9 Unit Apartments | 0 | 0.0% |
| 10 or more Apartments | 0 | 0.0% |
| Mobile Home / Other | 4 | 10.8% |
| Total | 37 | 100.0% |
Housing Structures by Occupancy in Levering
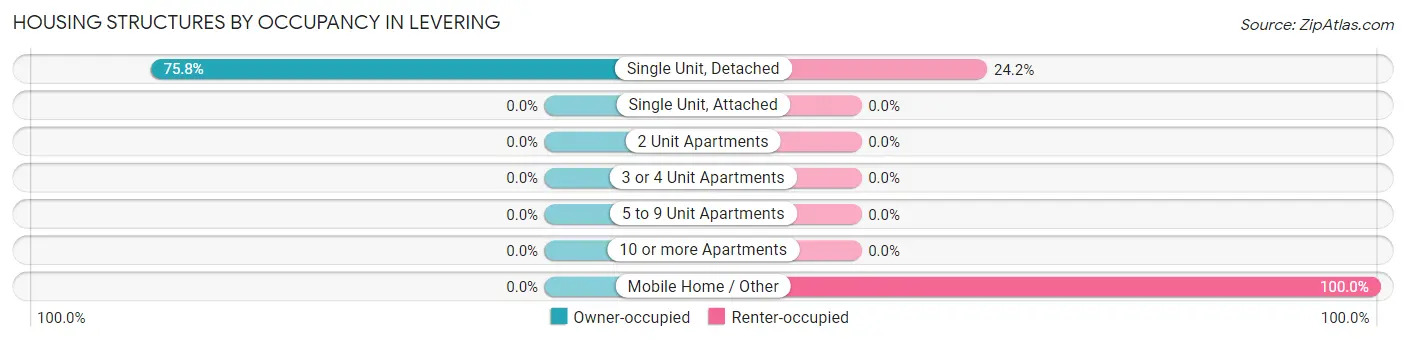
| Structure Type | Owner-occupied | Renter-occupied |
| Single Unit, Detached | 25 (75.8%) | 8 (24.2%) |
| Single Unit, Attached | 0 (0.0%) | 0 (0.0%) |
| 2 Unit Apartments | 0 (0.0%) | 0 (0.0%) |
| 3 or 4 Unit Apartments | 0 (0.0%) | 0 (0.0%) |
| 5 to 9 Unit Apartments | 0 (0.0%) | 0 (0.0%) |
| 10 or more Apartments | 0 (0.0%) | 0 (0.0%) |
| Mobile Home / Other | 0 (0.0%) | 4 (100.0%) |
| Total | 25 (67.6%) | 12 (32.4%) |
Housing Structures by Number of Rooms in Levering
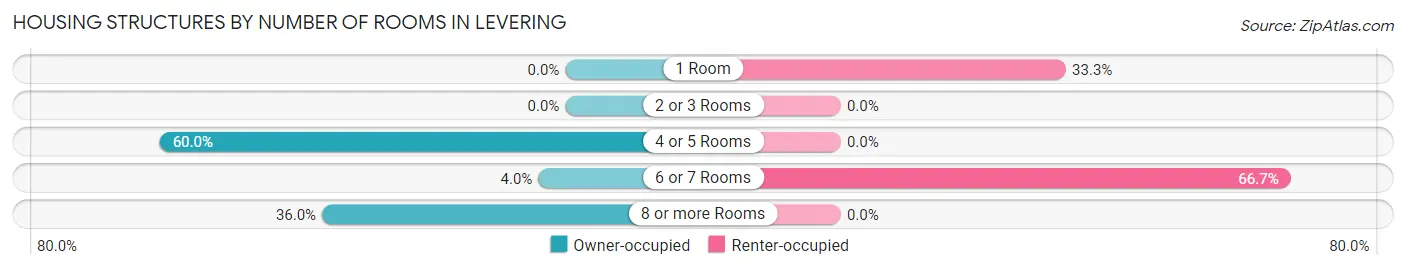
| Number of Rooms | Owner-occupied | Renter-occupied |
| 1 Room | 0 (0.0%) | 4 (33.3%) |
| 2 or 3 Rooms | 0 (0.0%) | 0 (0.0%) |
| 4 or 5 Rooms | 15 (60.0%) | 0 (0.0%) |
| 6 or 7 Rooms | 1 (4.0%) | 8 (66.7%) |
| 8 or more Rooms | 9 (36.0%) | 0 (0.0%) |
| Total | 25 (100.0%) | 12 (100.0%) |
Housing Structure by Heating Type in Levering
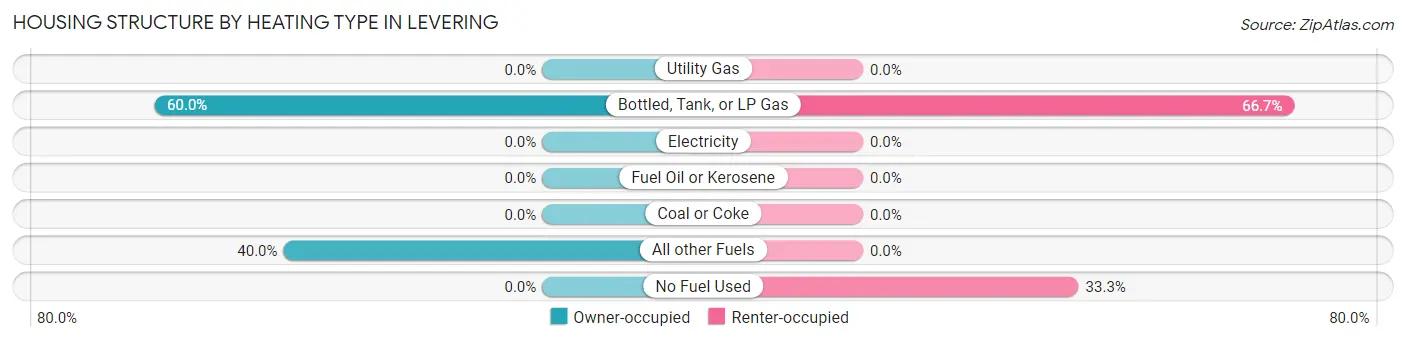
| Heating Type | Owner-occupied | Renter-occupied |
| Utility Gas | 0 (0.0%) | 0 (0.0%) |
| Bottled, Tank, or LP Gas | 15 (60.0%) | 8 (66.7%) |
| Electricity | 0 (0.0%) | 0 (0.0%) |
| Fuel Oil or Kerosene | 0 (0.0%) | 0 (0.0%) |
| Coal or Coke | 0 (0.0%) | 0 (0.0%) |
| All other Fuels | 10 (40.0%) | 0 (0.0%) |
| No Fuel Used | 0 (0.0%) | 4 (33.3%) |
| Total | 25 (100.0%) | 12 (100.0%) |
Household Vehicle Usage in Levering
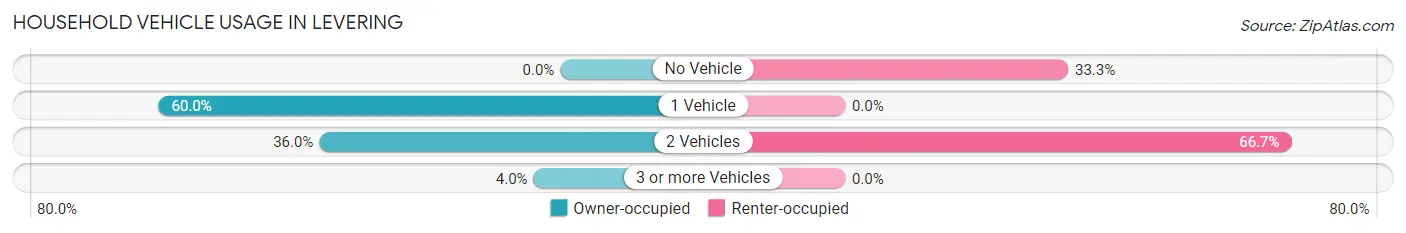
| Vehicles per Household | Owner-occupied | Renter-occupied |
| No Vehicle | 0 (0.0%) | 4 (33.3%) |
| 1 Vehicle | 15 (60.0%) | 0 (0.0%) |
| 2 Vehicles | 9 (36.0%) | 8 (66.7%) |
| 3 or more Vehicles | 1 (4.0%) | 0 (0.0%) |
| Total | 25 (100.0%) | 12 (100.0%) |
Real Estate & Mortgages in Levering
Real Estate and Mortgage Overview in Levering
| Characteristic | Without Mortgage | With Mortgage |
| Housing Units | 15 | 10 |
| Median Property Value | - | - |
| Median Household Income | - | - |
| Monthly Housing Costs | $277 | $0 |
| Real Estate Taxes | $833 | $0 |
Property Value by Mortgage Status in Levering
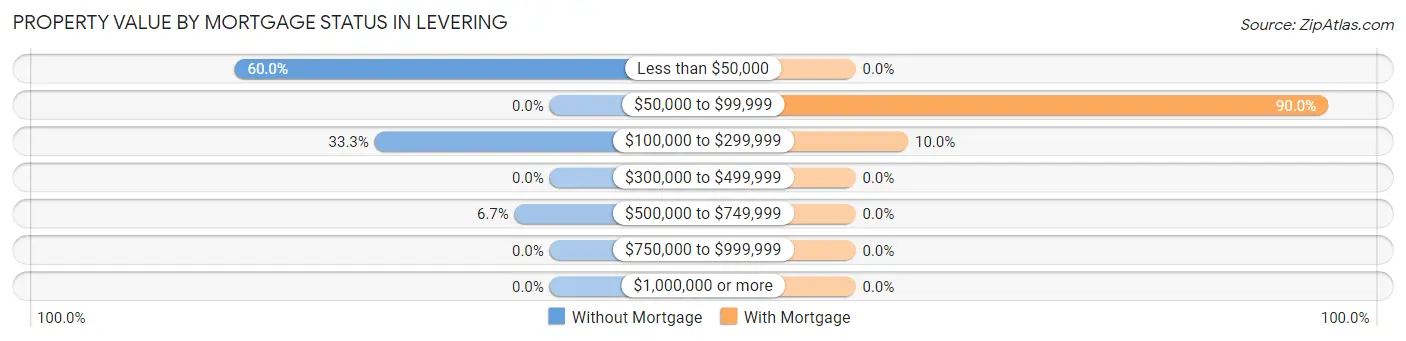
| Property Value | Without Mortgage | With Mortgage |
| Less than $50,000 | 9 (60.0%) | 0 (0.0%) |
| $50,000 to $99,999 | 0 (0.0%) | 9 (90.0%) |
| $100,000 to $299,999 | 5 (33.3%) | 1 (10.0%) |
| $300,000 to $499,999 | 0 (0.0%) | 0 (0.0%) |
| $500,000 to $749,999 | 1 (6.7%) | 0 (0.0%) |
| $750,000 to $999,999 | 0 (0.0%) | 0 (0.0%) |
| $1,000,000 or more | 0 (0.0%) | 0 (0.0%) |
| Total | 15 (100.0%) | 10 (100.0%) |
Household Income by Mortgage Status in Levering

| Household Income | Without Mortgage | With Mortgage |
| Less than $10,000 | 0 (0.0%) | 0 (0.0%) |
| $10,000 to $24,999 | 0 (0.0%) | 0 (0.0%) |
| $25,000 to $34,999 | 9 (60.0%) | 9 (90.0%) |
| $35,000 to $49,999 | 0 (0.0%) | 0 (0.0%) |
| $50,000 to $74,999 | 0 (0.0%) | 0 (0.0%) |
| $75,000 to $99,999 | 0 (0.0%) | 0 (0.0%) |
| $100,000 to $149,999 | 6 (40.0%) | 1 (10.0%) |
| $150,000 or more | 0 (0.0%) | 0 (0.0%) |
| Total | 15 (100.0%) | 10 (100.0%) |
Property Value to Household Income Ratio in Levering
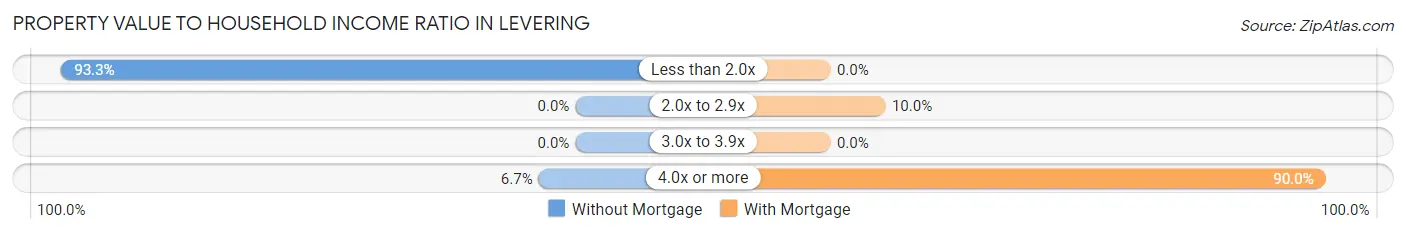
| Value-to-Income Ratio | Without Mortgage | With Mortgage |
| Less than 2.0x | 14 (93.3%) | 0 (0.0%) |
| 2.0x to 2.9x | 0 (0.0%) | 1 (10.0%) |
| 3.0x to 3.9x | 0 (0.0%) | 0 (0.0%) |
| 4.0x or more | 1 (6.7%) | 9 (90.0%) |
| Total | 15 (100.0%) | 10 (100.0%) |
Real Estate Taxes by Mortgage Status in Levering
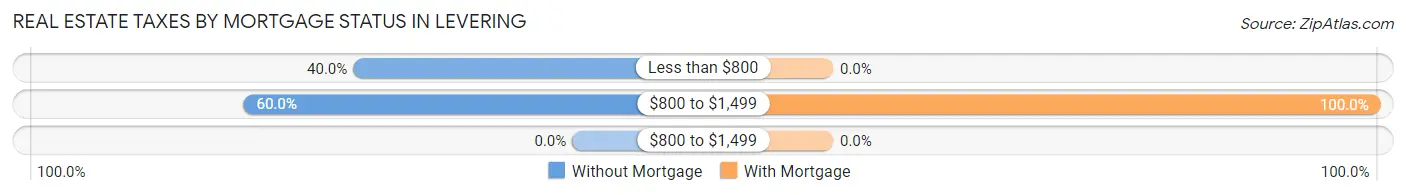
| Property Taxes | Without Mortgage | With Mortgage |
| Less than $800 | 6 (40.0%) | 0 (0.0%) |
| $800 to $1,499 | 9 (60.0%) | 10 (100.0%) |
| $800 to $1,499 | 0 (0.0%) | 0 (0.0%) |
| Total | 15 (100.0%) | 10 (100.0%) |
Health & Disability in Levering
Health Insurance Coverage by Age in Levering
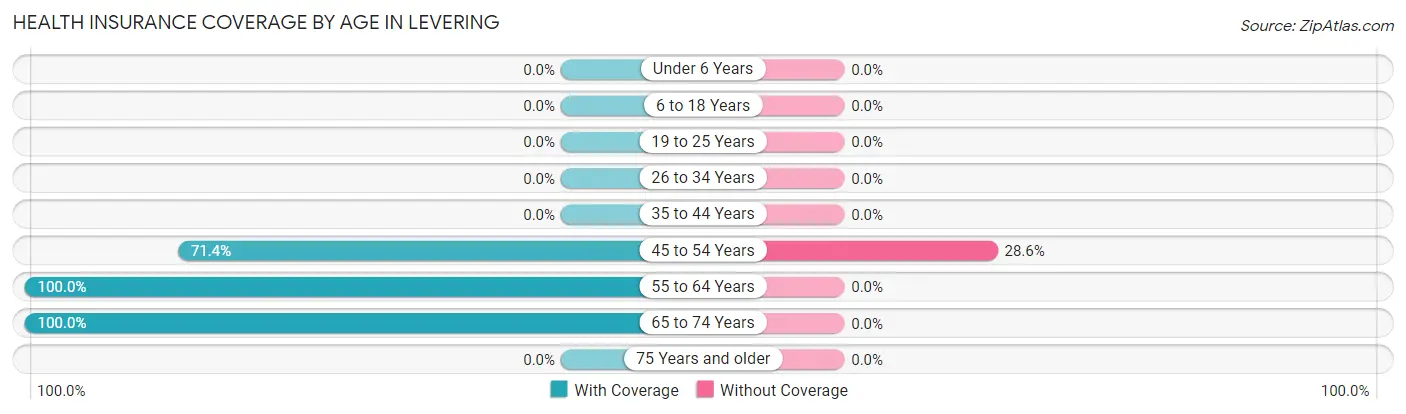
| Age Bracket | With Coverage | Without Coverage |
| Under 6 Years | 0 (0.0%) | 0 (0.0%) |
| 6 to 18 Years | 0 (0.0%) | 0 (0.0%) |
| 19 to 25 Years | 0 (0.0%) | 0 (0.0%) |
| 26 to 34 Years | 0 (0.0%) | 0 (0.0%) |
| 35 to 44 Years | 0 (0.0%) | 0 (0.0%) |
| 45 to 54 Years | 10 (71.4%) | 4 (28.6%) |
| 55 to 64 Years | 19 (100.0%) | 0 (0.0%) |
| 65 to 74 Years | 19 (100.0%) | 0 (0.0%) |
| 75 Years and older | 0 (0.0%) | 0 (0.0%) |
| Total | 48 (92.3%) | 4 (7.7%) |
Health Insurance Coverage by Citizenship Status in Levering
| Citizenship Status | With Coverage | Without Coverage |
| Native Born | 0 (0.0%) | 0 (0.0%) |
| Foreign Born, Citizen | 0 (0.0%) | 0 (0.0%) |
| Foreign Born, not a Citizen | 0 (0.0%) | 0 (0.0%) |
Health Insurance Coverage by Household Income in Levering
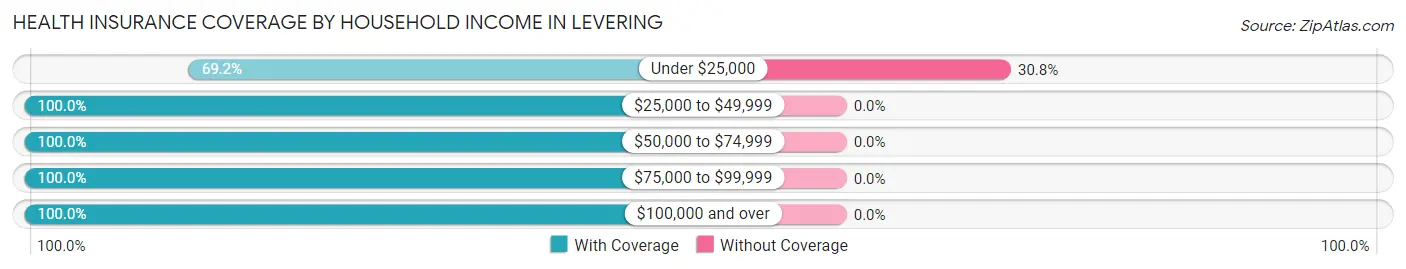
| Household Income | With Coverage | Without Coverage |
| Under $25,000 | 9 (69.2%) | 4 (30.8%) |
| $25,000 to $49,999 | 9 (100.0%) | 0 (0.0%) |
| $50,000 to $74,999 | 15 (100.0%) | 0 (0.0%) |
| $75,000 to $99,999 | 3 (100.0%) | 0 (0.0%) |
| $100,000 and over | 12 (100.0%) | 0 (0.0%) |
Public vs Private Health Insurance Coverage by Age in Levering
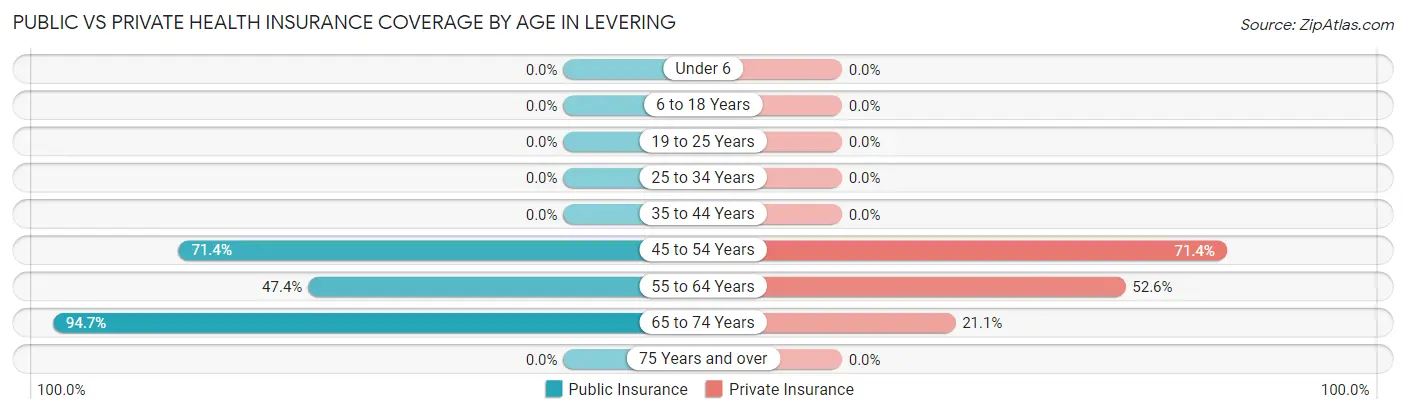
| Age Bracket | Public Insurance | Private Insurance |
| Under 6 | 0 (0.0%) | 0 (0.0%) |
| 6 to 18 Years | 0 (0.0%) | 0 (0.0%) |
| 19 to 25 Years | 0 (0.0%) | 0 (0.0%) |
| 25 to 34 Years | 0 (0.0%) | 0 (0.0%) |
| 35 to 44 Years | 0 (0.0%) | 0 (0.0%) |
| 45 to 54 Years | 10 (71.4%) | 10 (71.4%) |
| 55 to 64 Years | 9 (47.4%) | 10 (52.6%) |
| 65 to 74 Years | 18 (94.7%) | 4 (21.0%) |
| 75 Years and over | 0 (0.0%) | 0 (0.0%) |
| Total | 37 (71.2%) | 24 (46.2%) |
Disability Status by Sex by Age in Levering
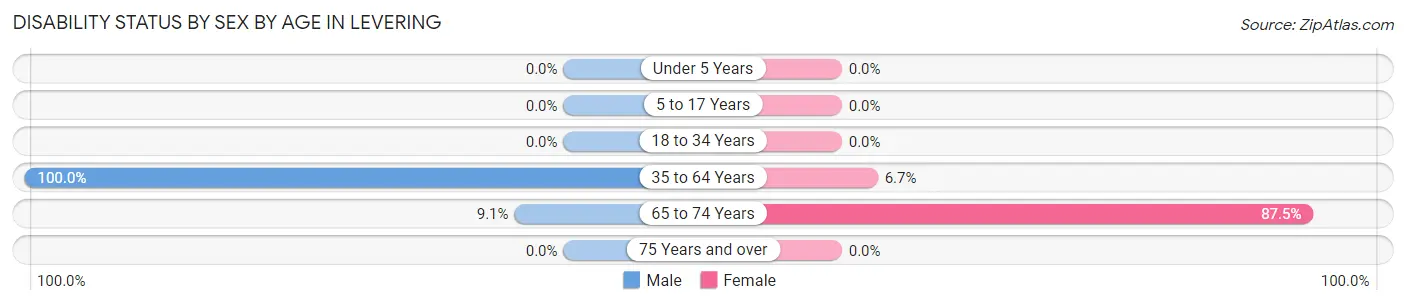
| Age Bracket | Male | Female |
| Under 5 Years | 0 (0.0%) | 0 (0.0%) |
| 5 to 17 Years | 0 (0.0%) | 0 (0.0%) |
| 18 to 34 Years | 0 (0.0%) | 0 (0.0%) |
| 35 to 64 Years | 18 (100.0%) | 1 (6.7%) |
| 65 to 74 Years | 1 (9.1%) | 7 (87.5%) |
| 75 Years and over | 0 (0.0%) | 0 (0.0%) |
Disability Class by Sex by Age in Levering
Disability Class: Hearing Difficulty
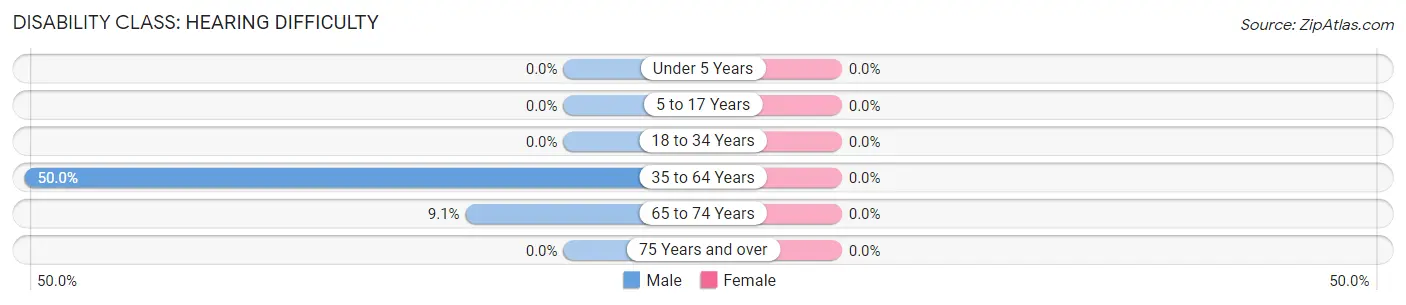
| Age Bracket | Male | Female |
| Under 5 Years | 0 (0.0%) | 0 (0.0%) |
| 5 to 17 Years | 0 (0.0%) | 0 (0.0%) |
| 18 to 34 Years | 0 (0.0%) | 0 (0.0%) |
| 35 to 64 Years | 9 (50.0%) | 0 (0.0%) |
| 65 to 74 Years | 1 (9.1%) | 0 (0.0%) |
| 75 Years and over | 0 (0.0%) | 0 (0.0%) |
Disability Class: Vision Difficulty
| Age Bracket | Male | Female |
| Under 5 Years | 0 (0.0%) | 0 (0.0%) |
| 5 to 17 Years | 0 (0.0%) | 0 (0.0%) |
| 18 to 34 Years | 0 (0.0%) | 0 (0.0%) |
| 35 to 64 Years | 0 (0.0%) | 0 (0.0%) |
| 65 to 74 Years | 0 (0.0%) | 0 (0.0%) |
| 75 Years and over | 0 (0.0%) | 0 (0.0%) |
Disability Class: Cognitive Difficulty
| Age Bracket | Male | Female |
| 5 to 17 Years | 0 (0.0%) | 0 (0.0%) |
| 18 to 34 Years | 0 (0.0%) | 0 (0.0%) |
| 35 to 64 Years | 0 (0.0%) | 0 (0.0%) |
| 65 to 74 Years | 0 (0.0%) | 0 (0.0%) |
| 75 Years and over | 0 (0.0%) | 0 (0.0%) |
Disability Class: Ambulatory Difficulty
| Age Bracket | Male | Female |
| 5 to 17 Years | 0 (0.0%) | 0 (0.0%) |
| 18 to 34 Years | 0 (0.0%) | 0 (0.0%) |
| 35 to 64 Years | 9 (50.0%) | 1 (6.7%) |
| 65 to 74 Years | 0 (0.0%) | 7 (87.5%) |
| 75 Years and over | 0 (0.0%) | 0 (0.0%) |
Disability Class: Self-Care Difficulty
| Age Bracket | Male | Female |
| 5 to 17 Years | 0 (0.0%) | 0 (0.0%) |
| 18 to 34 Years | 0 (0.0%) | 0 (0.0%) |
| 35 to 64 Years | 0 (0.0%) | 0 (0.0%) |
| 65 to 74 Years | 0 (0.0%) | 0 (0.0%) |
| 75 Years and over | 0 (0.0%) | 0 (0.0%) |
Technology Access in Levering
Computing Device Access in Levering
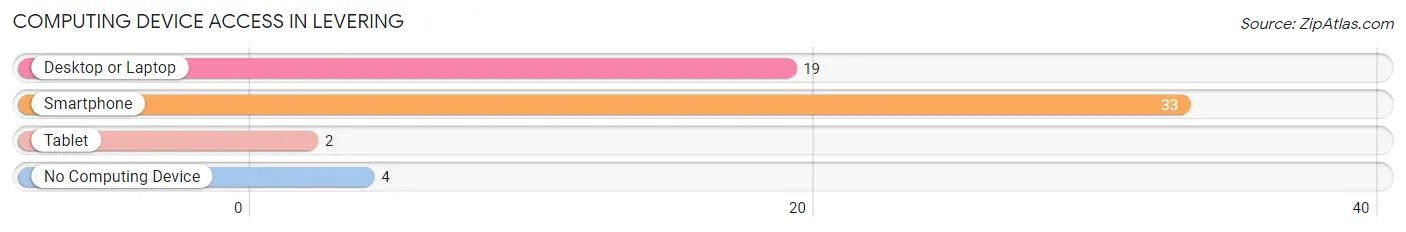
| Device Type | # Households | % Households |
| Desktop or Laptop | 19 | 51.3% |
| Smartphone | 33 | 89.2% |
| Tablet | 2 | 5.4% |
| No Computing Device | 4 | 10.8% |
| Total | 37 | 100.0% |
Internet Access in Levering
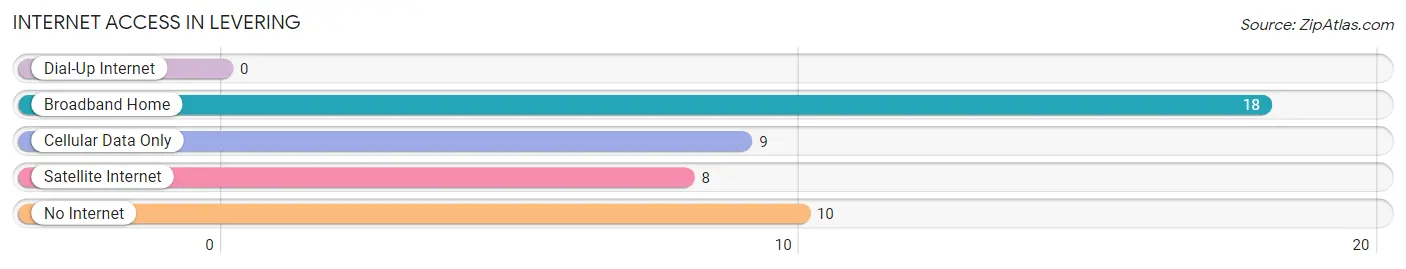
| Internet Type | # Households | % Households |
| Dial-Up Internet | 0 | 0.0% |
| Broadband Home | 18 | 48.6% |
| Cellular Data Only | 9 | 24.3% |
| Satellite Internet | 8 | 21.6% |
| No Internet | 10 | 27.0% |
| Total | 37 | 100.0% |
Levering Summary
Levering is an unincorporated community located in Emmet County, Michigan. It is situated on the northern shore of Little Traverse Bay, on the east side of the Little Traverse Bay. The community is located approximately 8 miles north of Petoskey, Michigan.
History
Levering was first settled in 1875 by a group of settlers from Ohio. The settlement was named after the Levering family, who were among the first settlers. The Levering family was originally from Pennsylvania and had moved to Ohio before settling in Michigan.
The first post office in Levering was established in 1876. The post office was located in the home of the Levering family. The post office was closed in 1883, but reopened in 1891.
The first school in Levering was built in 1877. The school was a one-room schoolhouse and was located on the corner of Levering Road and Main Street. The school was later replaced by a larger school in 1891.
The first church in Levering was established in 1878. The church was a Methodist church and was located on the corner of Levering Road and Main Street. The church was later replaced by a larger church in 1891.
The first store in Levering was established in 1879. The store was located on the corner of Levering Road and Main Street. The store was later replaced by a larger store in 1891.
Geography
Levering is located in Emmet County, Michigan. It is situated on the northern shore of Little Traverse Bay, on the east side of the Little Traverse Bay. The community is located approximately 8 miles north of Petoskey, Michigan.
The terrain in Levering is mostly flat, with some rolling hills. The area is heavily forested, with a mix of deciduous and coniferous trees. The climate in Levering is humid continental, with cold winters and warm summers.
Economy
The economy of Levering is largely based on tourism and agriculture. The area is popular with tourists, who come to enjoy the natural beauty of the area. The area is also home to several farms, which produce a variety of crops, including apples, cherries, and potatoes.
The area is also home to several small businesses, including restaurants, shops, and lodging. The area is also home to several marinas, which provide access to the Little Traverse Bay.
Demographics
As of the 2010 census, the population of Levering was 1,845. The racial makeup of the town was 97.3% White, 0.7% African American, 0.3% Native American, 0.2% Asian, 0.1% Pacific Islander, 0.2% from other races, and 1.2% from two or more races. Hispanic or Latino of any race were 1.2% of the population.
The median household income in Levering was $45,938, and the median family income was $50,938. The per capita income in Levering was $21,938. About 8.3% of families and 10.3% of the population were below the poverty line, including 14.3% of those under age 18 and 5.3% of those age 65 or over.
Common Questions
What is Per Capita Income in Levering?
Per Capita income in Levering is $33,638.
What is Inequality or Gini Index in Levering?
Inequality or Gini Index in Levering is 0.44.
What is the Total Population of Levering?
Total Population of Levering is 52.
What is the Total Male Population of Levering?
Total Male Population of Levering is 29.
What is the Total Female Population of Levering?
Total Female Population of Levering is 23.
What is the Ratio of Males per 100 Females in Levering?
There are 126.09 Males per 100 Females in Levering.
What is the Ratio of Females per 100 Males in Levering?
There are 79.31 Females per 100 Males in Levering.
What is the Median Population Age in Levering?
Median Population Age in Levering is 60.3 Years.
What is the Average Family Size in Levering
Average Family Size in Levering is 2.0 People.
What is the Average Household Size in Levering
Average Household Size in Levering is 1.4 People.
How Large is the Labor Force in Levering?
There are 26 People in the Labor Forcein in Levering.
What is the Percentage of People in the Labor Force in Levering?
50.0% of People are in the Labor Force in Levering.
What is the Unemployment Rate in Levering?
Unemployment Rate in Levering is 7.7%.