Wright, KS Map & Demographics
Wright Map
Wright Overview
$21,395
PER CAPITA INCOME
$18,500
AVG FAMILY INCOME
$30,811
AVG HOUSEHOLD INCOME
0.22
INEQUALITY / GINI INDEX
96
TOTAL POPULATION
68
MALE POPULATION
28
FEMALE POPULATION
242.86
MALES / 100 FEMALES
41.18
FEMALES / 100 MALES
64.6
MEDIAN AGE
3.1
AVG FAMILY SIZE
1.4
AVG HOUSEHOLD SIZE
17
LABOR FORCE [ PEOPLE ]
22.7%
PERCENT IN LABOR FORCE
Wright Zip Codes
Wright Area Codes
Income in Wright
Income Overview in Wright
Per Capita Income in Wright is $21,395, while median incomes of families and households are $18,500 and $30,811 respectively.
| Characteristic | Number | Measure |
| Per Capita Income | 96 | $21,395 |
| Median Family Income | 14 | $18,500 |
| Mean Family Income | 14 | $16,879 |
| Median Household Income | 66 | $30,811 |
| Mean Household Income | 66 | $31,120 |
| Income Deficit | 14 | $0 |
| Wage / Income Gap (%) | 96 | 0.00% |
| Wage / Income Gap ($) | 96 | 100.00¢ per $1 |
| Gini / Inequality Index | 96 | 0.22 |
Earnings by Sex in Wright
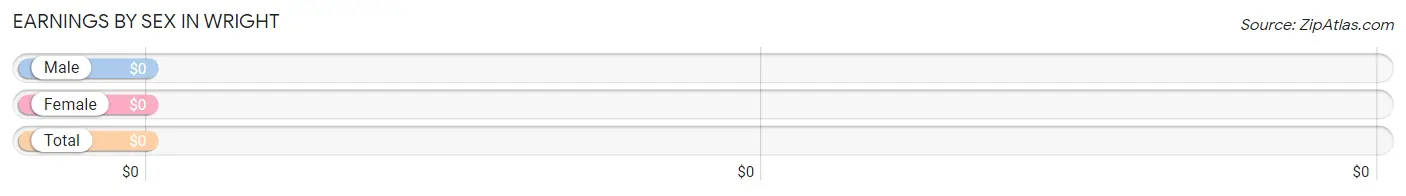
| Sex | Number | Average Earnings |
| Male | 12 (70.6%) | $0 |
| Female | 5 (29.4%) | $0 |
| Total | 17 (100.0%) | $0 |
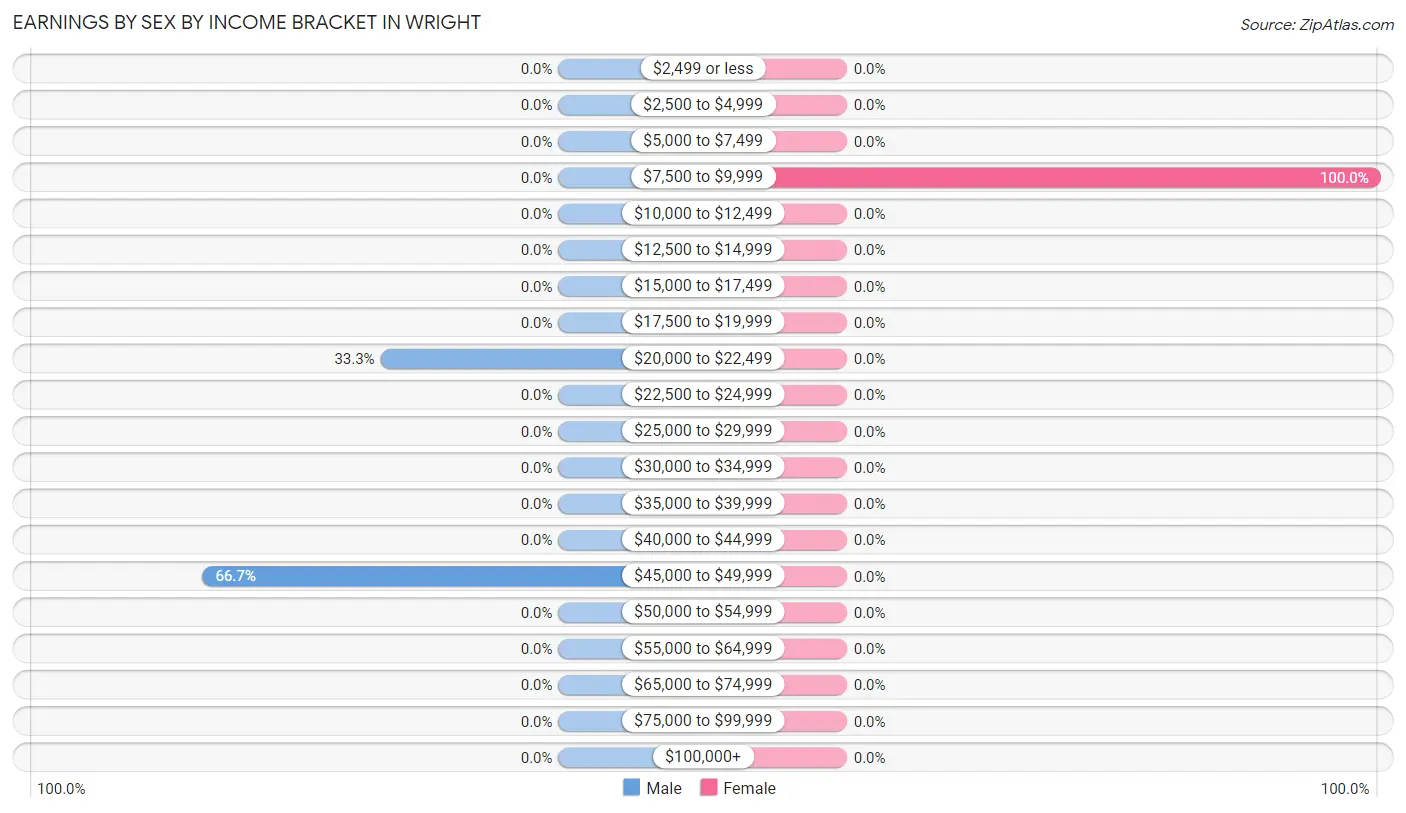
Earnings by Sex by Income Bracket in Wright
The most common earnings brackets in Wright are $45,000 to $49,999 for men (8 | 66.7%) and $7,500 to $9,999 for women (5 | 100.0%).
| Income | Male | Female |
| $2,499 or less | 0 (0.0%) | 0 (0.0%) |
| $2,500 to $4,999 | 0 (0.0%) | 0 (0.0%) |
| $5,000 to $7,499 | 0 (0.0%) | 0 (0.0%) |
| $7,500 to $9,999 | 0 (0.0%) | 5 (100.0%) |
| $10,000 to $12,499 | 0 (0.0%) | 0 (0.0%) |
| $12,500 to $14,999 | 0 (0.0%) | 0 (0.0%) |
| $15,000 to $17,499 | 0 (0.0%) | 0 (0.0%) |
| $17,500 to $19,999 | 0 (0.0%) | 0 (0.0%) |
| $20,000 to $22,499 | 4 (33.3%) | 0 (0.0%) |
| $22,500 to $24,999 | 0 (0.0%) | 0 (0.0%) |
| $25,000 to $29,999 | 0 (0.0%) | 0 (0.0%) |
| $30,000 to $34,999 | 0 (0.0%) | 0 (0.0%) |
| $35,000 to $39,999 | 0 (0.0%) | 0 (0.0%) |
| $40,000 to $44,999 | 0 (0.0%) | 0 (0.0%) |
| $45,000 to $49,999 | 8 (66.7%) | 0 (0.0%) |
| $50,000 to $54,999 | 0 (0.0%) | 0 (0.0%) |
| $55,000 to $64,999 | 0 (0.0%) | 0 (0.0%) |
| $65,000 to $74,999 | 0 (0.0%) | 0 (0.0%) |
| $75,000 to $99,999 | 0 (0.0%) | 0 (0.0%) |
| $100,000+ | 0 (0.0%) | 0 (0.0%) |
| Total | 12 (100.0%) | 5 (100.0%) |
Earnings by Sex by Educational Attainment in Wright
| Educational Attainment | Male Income | Female Income |
| Less than High School | - | - |
| High School Diploma | - | - |
| College or Associate's Degree | - | - |
| Bachelor's Degree | - | - |
| Graduate Degree | - | - |
| Total | - | - |
Family Income in Wright
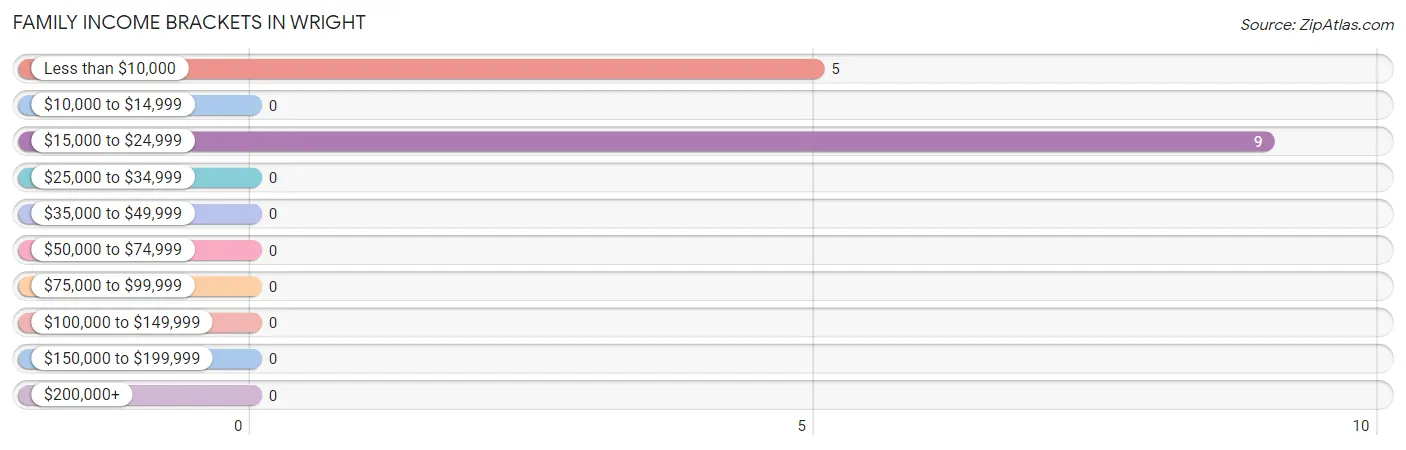
Family Income Brackets in Wright
According to the Wright family income data, there are 9 families falling into the $15,000 to $24,999 income range, which is the most common income bracket and makes up 64.3% of all families.
| Income Bracket | # Families | % Families |
| Less than $10,000 | 5 | 35.7% |
| $10,000 to $14,999 | 0 | 0.0% |
| $15,000 to $24,999 | 9 | 64.3% |
| $25,000 to $34,999 | 0 | 0.0% |
| $35,000 to $49,999 | 0 | 0.0% |
| $50,000 to $74,999 | 0 | 0.0% |
| $75,000 to $99,999 | 0 | 0.0% |
| $100,000 to $149,999 | 0 | 0.0% |
| $150,000 to $199,999 | 0 | 0.0% |
| $200,000+ | 0 | 0.0% |
Family Income by Famaliy Size in Wright
| Income Bracket | # Families | Median Income |
| 2-Person Families | 9 (64.3%) | $0 |
| 3-Person Families | 0 (0.0%) | $0 |
| 4-Person Families | 5 (35.7%) | $0 |
| 5-Person Families | 0 (0.0%) | $0 |
| 6-Person Families | 0 (0.0%) | $0 |
| 7+ Person Families | 0 (0.0%) | $0 |
| Total | 14 (100.0%) | $18,500 |
Family Income by Number of Earners in Wright
| Number of Earners | # Families | Median Income |
| No Earners | 5 (35.7%) | $0 |
| 1 Earner | 9 (64.3%) | $0 |
| 2 Earners | 0 (0.0%) | $0 |
| 3+ Earners | 0 (0.0%) | $0 |
| Total | 14 (100.0%) | $18,500 |
Household Income in Wright
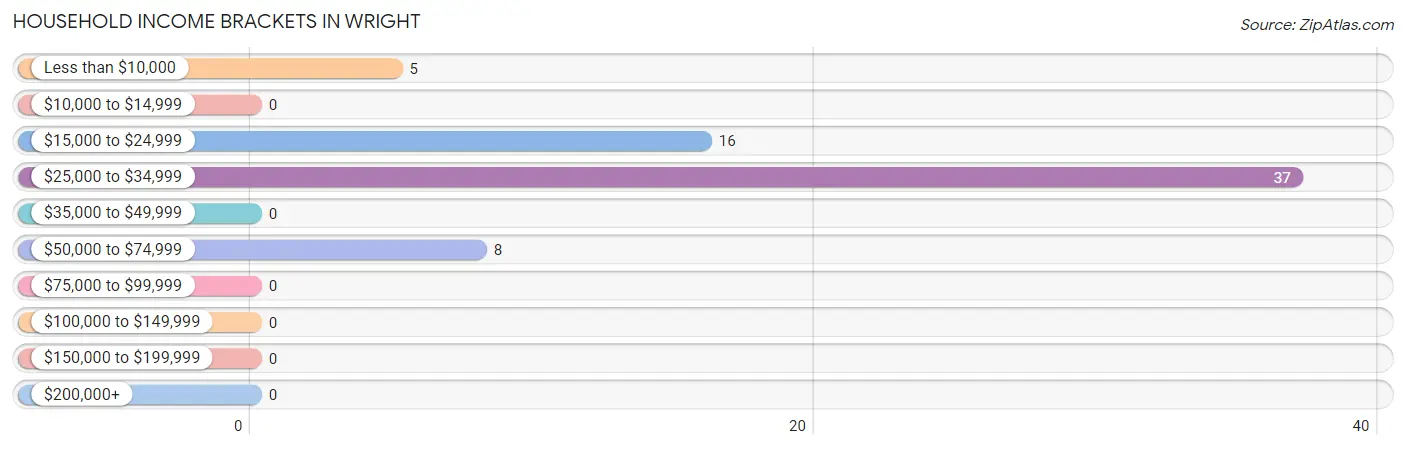
Household Income Brackets in Wright
With 37 households falling in the category, the $25,000 to $34,999 income range is the most frequent in Wright, accounting for 56.1% of all households.
| Income Bracket | # Households | % Households |
| Less than $10,000 | 5 | 7.6% |
| $10,000 to $14,999 | 0 | 0.0% |
| $15,000 to $24,999 | 16 | 24.2% |
| $25,000 to $34,999 | 37 | 56.1% |
| $35,000 to $49,999 | 0 | 0.0% |
| $50,000 to $74,999 | 8 | 12.1% |
| $75,000 to $99,999 | 0 | 0.0% |
| $100,000 to $149,999 | 0 | 0.0% |
| $150,000 to $199,999 | 0 | 0.0% |
| $200,000+ | 0 | 0.0% |
Household Income by Householder Age in Wright
| Income Bracket | # Households | Median Income |
| 15 to 24 Years | 0 (0.0%) | $0 |
| 25 to 44 Years | 5 (7.6%) | $0 |
| 45 to 64 Years | 37 (56.1%) | $0 |
| 65+ Years | 24 (36.4%) | $0 |
| Total | 66 (100.0%) | $30,811 |
Poverty in Wright
Income Below Poverty by Sex and Age in Wright
With 20.6% poverty level for males and 42.9% for females among the residents of Wright, under 5 year old males and under 5 year old females are the most vulnerable to poverty, with 7 males (100.0%) and 7 females (100.0%) in their respective age groups living below the poverty level.
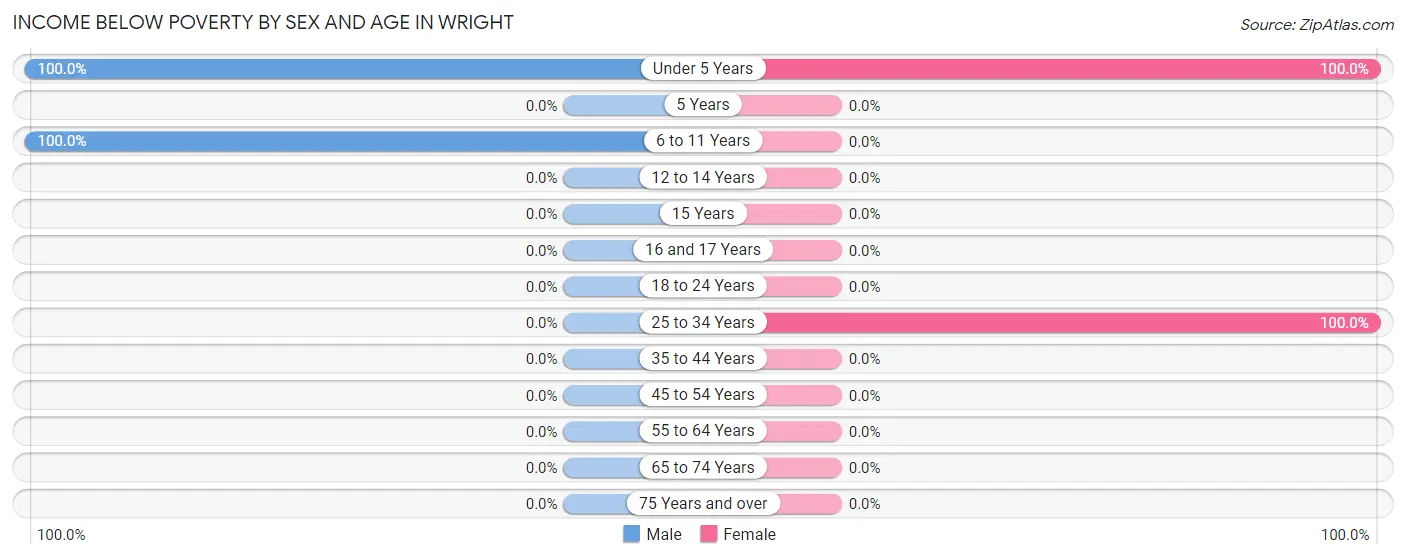
| Age Bracket | Male | Female |
| Under 5 Years | 7 (100.0%) | 7 (100.0%) |
| 5 Years | 0 (0.0%) | 0 (0.0%) |
| 6 to 11 Years | 7 (100.0%) | 0 (0.0%) |
| 12 to 14 Years | 0 (0.0%) | 0 (0.0%) |
| 15 Years | 0 (0.0%) | 0 (0.0%) |
| 16 and 17 Years | 0 (0.0%) | 0 (0.0%) |
| 18 to 24 Years | 0 (0.0%) | 0 (0.0%) |
| 25 to 34 Years | 0 (0.0%) | 5 (100.0%) |
| 35 to 44 Years | 0 (0.0%) | 0 (0.0%) |
| 45 to 54 Years | 0 (0.0%) | 0 (0.0%) |
| 55 to 64 Years | 0 (0.0%) | 0 (0.0%) |
| 65 to 74 Years | 0 (0.0%) | 0 (0.0%) |
| 75 Years and over | 0 (0.0%) | 0 (0.0%) |
| Total | 14 (20.6%) | 12 (42.9%) |
Income Above Poverty by Sex and Age in Wright
According to the poverty statistics in Wright, males aged 55 to 64 years and females aged 65 to 74 years are the age groups that are most secure financially, with 100.0% of males and 100.0% of females in these age groups living above the poverty line.
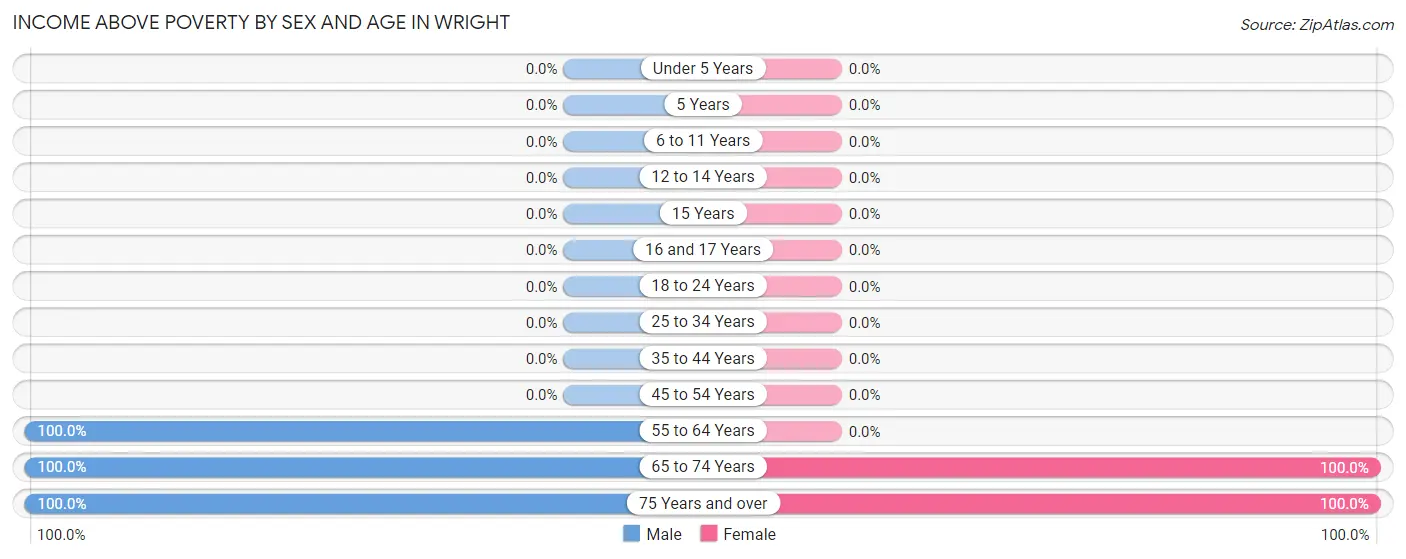
| Age Bracket | Male | Female |
| Under 5 Years | 0 (0.0%) | 0 (0.0%) |
| 5 Years | 0 (0.0%) | 0 (0.0%) |
| 6 to 11 Years | 0 (0.0%) | 0 (0.0%) |
| 12 to 14 Years | 0 (0.0%) | 0 (0.0%) |
| 15 Years | 0 (0.0%) | 0 (0.0%) |
| 16 and 17 Years | 0 (0.0%) | 0 (0.0%) |
| 18 to 24 Years | 0 (0.0%) | 0 (0.0%) |
| 25 to 34 Years | 0 (0.0%) | 0 (0.0%) |
| 35 to 44 Years | 0 (0.0%) | 0 (0.0%) |
| 45 to 54 Years | 0 (0.0%) | 0 (0.0%) |
| 55 to 64 Years | 37 (100.0%) | 0 (0.0%) |
| 65 to 74 Years | 12 (100.0%) | 4 (100.0%) |
| 75 Years and over | 5 (100.0%) | 12 (100.0%) |
| Total | 54 (79.4%) | 16 (57.1%) |
Income Below Poverty Among Married-Couple Families in Wright
| Children | Above Poverty | Below Poverty |
| No Children | 9 (100.0%) | 0 (0.0%) |
| 1 or 2 Children | 0 (0.0%) | 0 (0.0%) |
| 3 or 4 Children | 0 (0.0%) | 0 (0.0%) |
| 5 or more Children | 0 (0.0%) | 0 (0.0%) |
| Total | 9 (100.0%) | 0 (0.0%) |
Income Below Poverty Among Single-Parent Households in Wright
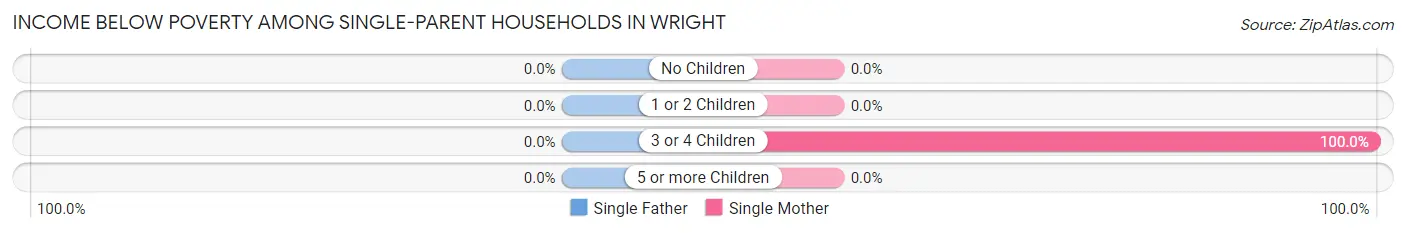
| Children | Single Father | Single Mother |
| No Children | 0 (0.0%) | 0 (0.0%) |
| 1 or 2 Children | 0 (0.0%) | 0 (0.0%) |
| 3 or 4 Children | 0 (0.0%) | 5 (100.0%) |
| 5 or more Children | 0 (0.0%) | 0 (0.0%) |
| Total | 0 (0.0%) | 5 (100.0%) |
Income Below Poverty Among Married-Couple vs Single-Parent Households in Wright
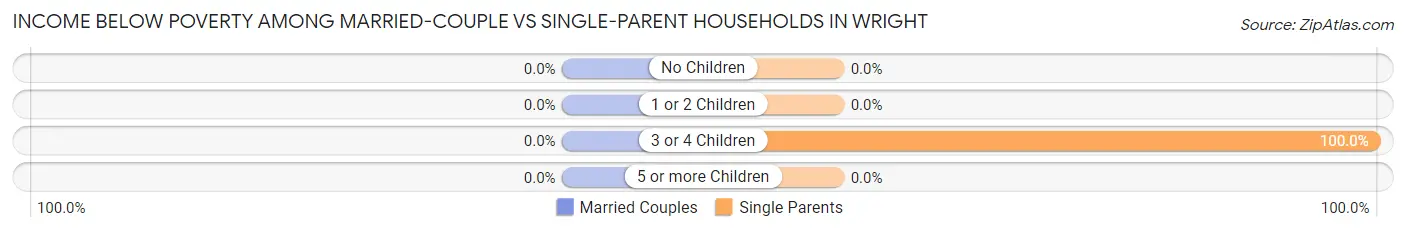
| Children | Married-Couple Families | Single-Parent Households |
| No Children | 0 (0.0%) | 0 (0.0%) |
| 1 or 2 Children | 0 (0.0%) | 0 (0.0%) |
| 3 or 4 Children | 0 (0.0%) | 5 (100.0%) |
| 5 or more Children | 0 (0.0%) | 0 (0.0%) |
| Total | 0 (0.0%) | 5 (100.0%) |
Race in Wright
The most populous races in Wright are White / Caucasian (59 | 61.5%), Two or more Races (37 | 38.5%), and Hispanic or Latino (26 | 27.1%).
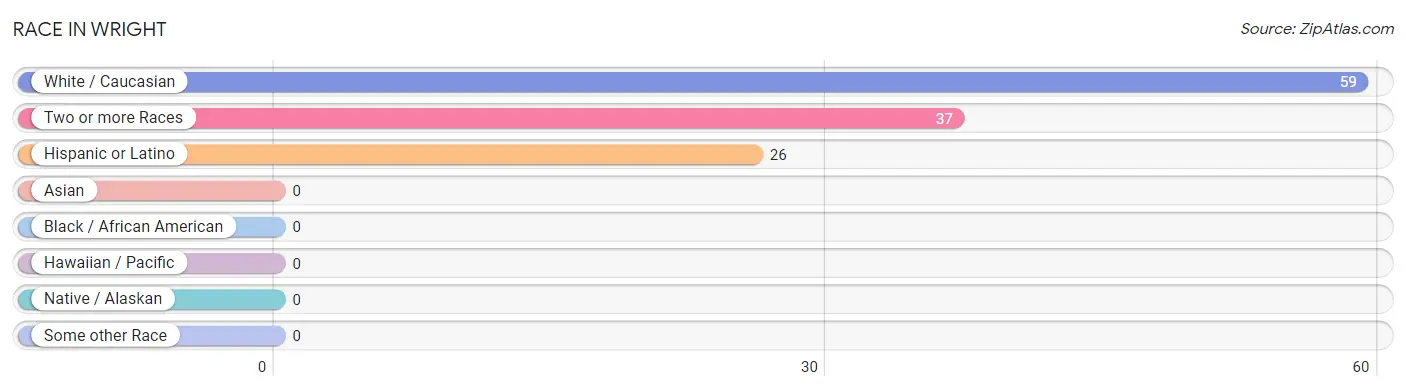
| Race | # Population | % Population |
| Asian | 0 | 0.0% |
| Black / African American | 0 | 0.0% |
| Hawaiian / Pacific | 0 | 0.0% |
| Hispanic or Latino | 26 | 27.1% |
| Native / Alaskan | 0 | 0.0% |
| White / Caucasian | 59 | 61.5% |
| Two or more Races | 37 | 38.5% |
| Some other Race | 0 | 0.0% |
| Total | 96 | 100.0% |
Ancestry in Wright
The most populous ancestries reported in Wright are American (37 | 38.5%), English (12 | 12.5%), German (12 | 12.5%), Irish (9 | 9.4%), and French (7 | 7.3%), together accounting for 80.2% of all Wright residents.
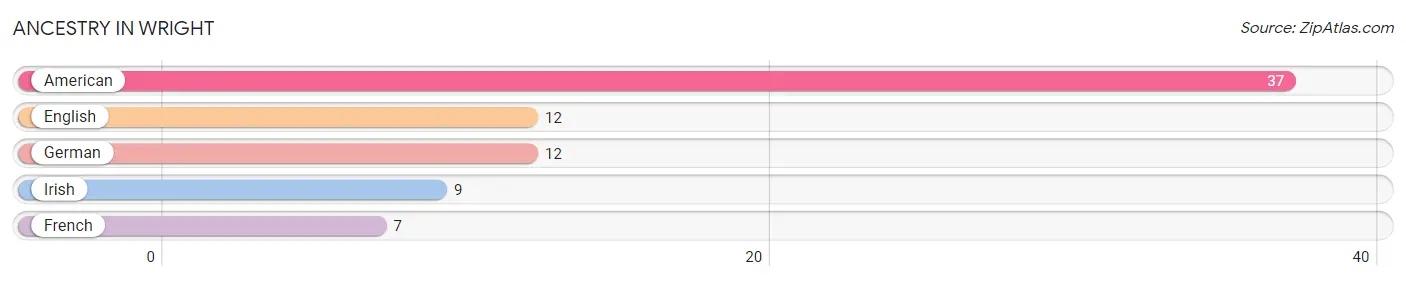
| Ancestry | # Population | % Population |
| American | 37 | 38.5% |
| English | 12 | 12.5% |
| French | 7 | 7.3% |
| German | 12 | 12.5% |
| Irish | 9 | 9.4% | View All 5 Rows |
Immigrants in Wright

| Immigration Origin | # Population | % Population | View All 0 Rows |
Sex and Age in Wright
Sex and Age in Wright
The most populous age groups in Wright are 60 to 64 Years (37 | 54.4%) for men and Under 5 Years (7 | 25.0%) for women.
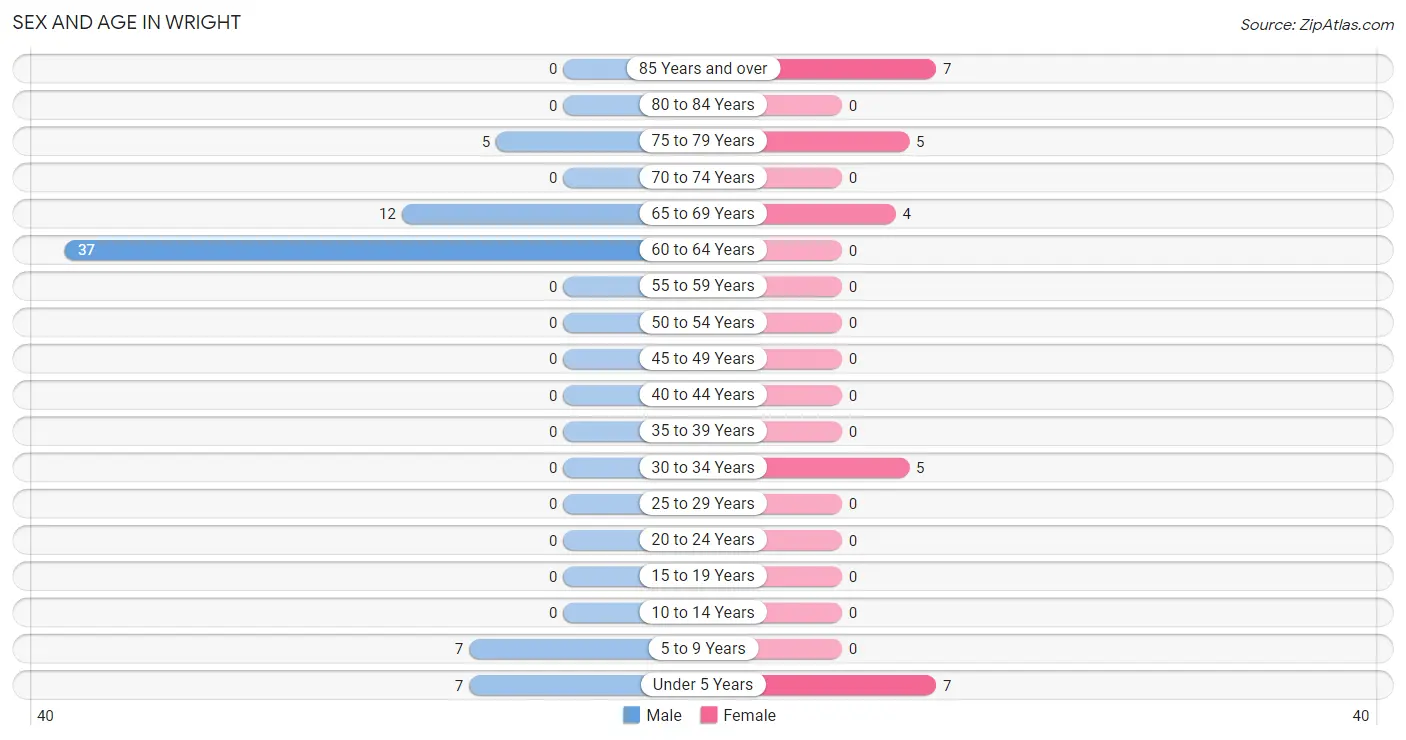
| Age Bracket | Male | Female |
| Under 5 Years | 7 (10.3%) | 7 (25.0%) |
| 5 to 9 Years | 7 (10.3%) | 0 (0.0%) |
| 10 to 14 Years | 0 (0.0%) | 0 (0.0%) |
| 15 to 19 Years | 0 (0.0%) | 0 (0.0%) |
| 20 to 24 Years | 0 (0.0%) | 0 (0.0%) |
| 25 to 29 Years | 0 (0.0%) | 0 (0.0%) |
| 30 to 34 Years | 0 (0.0%) | 5 (17.9%) |
| 35 to 39 Years | 0 (0.0%) | 0 (0.0%) |
| 40 to 44 Years | 0 (0.0%) | 0 (0.0%) |
| 45 to 49 Years | 0 (0.0%) | 0 (0.0%) |
| 50 to 54 Years | 0 (0.0%) | 0 (0.0%) |
| 55 to 59 Years | 0 (0.0%) | 0 (0.0%) |
| 60 to 64 Years | 37 (54.4%) | 0 (0.0%) |
| 65 to 69 Years | 12 (17.6%) | 4 (14.3%) |
| 70 to 74 Years | 0 (0.0%) | 0 (0.0%) |
| 75 to 79 Years | 5 (7.3%) | 5 (17.9%) |
| 80 to 84 Years | 0 (0.0%) | 0 (0.0%) |
| 85 Years and over | 0 (0.0%) | 7 (25.0%) |
| Total | 68 (100.0%) | 28 (100.0%) |
Families and Households in Wright
Median Family Size in Wright
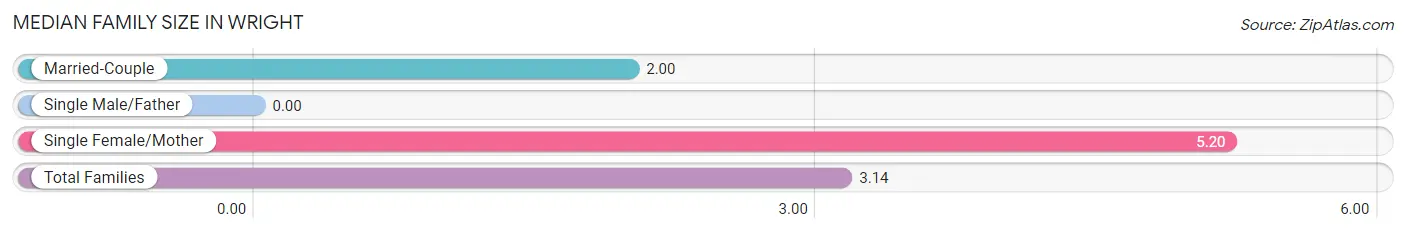
| Family Type | # Families | Family Size |
| Married-Couple | 9 (64.3%) | 2.00 |
| Single Male/Father | 0 (0.0%) | - |
| Single Female/Mother | 5 (35.7%) | 5.20 |
| Total Families | 14 (100.0%) | 3.14 |
Median Household Size in Wright
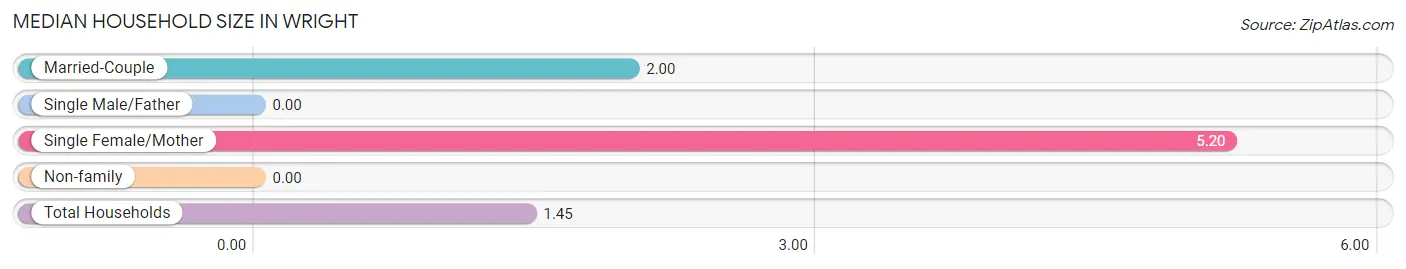
| Household Type | # Households | Household Size |
| Married-Couple | 9 (13.6%) | 2.00 |
| Single Male/Father | 0 (0.0%) | - |
| Single Female/Mother | 5 (7.6%) | 5.20 |
| Non-family | 52 (78.8%) | - |
| Total Households | 66 (100.0%) | 1.45 |
Household Size by Marriage Status in Wright
Out of a total of 66 households in Wright, 14 (21.2%) are family households, while 52 (78.8%) are nonfamily households. The most numerous type of family households are 2-person households, comprising 9, and the most common type of nonfamily households are 1-person households, comprising 52.
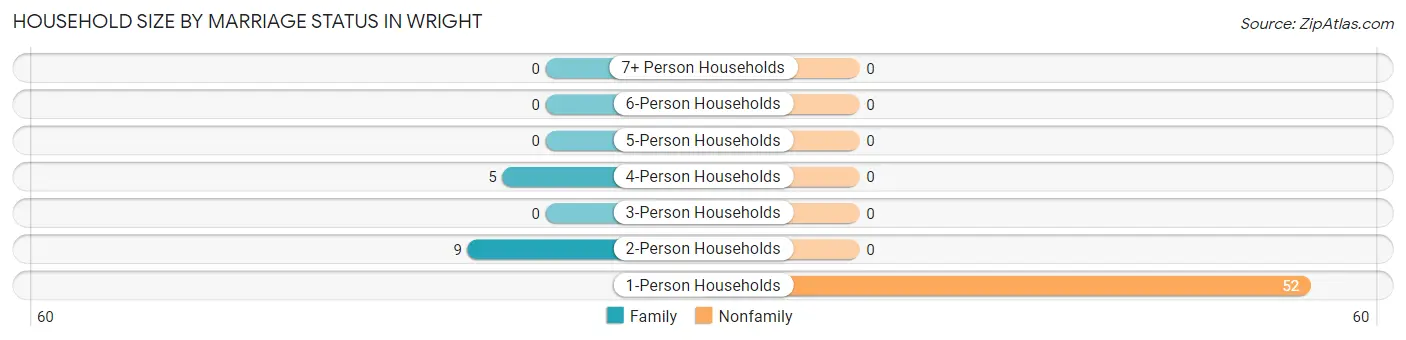
| Household Size | Family Households | Nonfamily Households |
| 1-Person Households | - | 52 (78.8%) |
| 2-Person Households | 9 (13.6%) | 0 (0.0%) |
| 3-Person Households | 0 (0.0%) | 0 (0.0%) |
| 4-Person Households | 5 (7.6%) | 0 (0.0%) |
| 5-Person Households | 0 (0.0%) | 0 (0.0%) |
| 6-Person Households | 0 (0.0%) | 0 (0.0%) |
| 7+ Person Households | 0 (0.0%) | 0 (0.0%) |
| Total | 14 (21.2%) | 52 (78.8%) |
Female Fertility in Wright
Fertility by Age in Wright
| Age Bracket | Women with Births | Births / 1,000 Women |
| 15 to 19 years | 0 (0.0%) | 0.0 |
| 20 to 34 years | 0 (0.0%) | 0.0 |
| 35 to 50 years | 0 (0.0%) | 0.0 |
| Total | 0 (0.0%) | 0.0 |
Fertility by Age by Marriage Status in Wright
| Age Bracket | Married | Unmarried |
| 15 to 19 years | 0 (0.0%) | 0 (0.0%) |
| 20 to 34 years | 0 (0.0%) | 0 (0.0%) |
| 35 to 50 years | 0 (0.0%) | 0 (0.0%) |
| Total | 0 (0.0%) | 0 (0.0%) |
Fertility by Education in Wright
| Educational Attainment | Women with Births | Births / 1,000 Women |
| Less than High School | 0 (0.0%) | 0.0 |
| High School Diploma | 0 (0.0%) | 0.0 |
| College or Associate's Degree | 0 (0.0%) | 0.0 |
| Bachelor's Degree | 0 (0.0%) | 0.0 |
| Graduate Degree | 0 (0.0%) | 0.0 |
| Total | 0 (0.0%) | 0.0 |
Fertility by Education by Marriage Status in Wright
| Educational Attainment | Married | Unmarried |
| Less than High School | 0 (0.0%) | 0 (0.0%) |
| High School Diploma | 0 (0.0%) | 0 (0.0%) |
| College or Associate's Degree | 0 (0.0%) | 0 (0.0%) |
| Bachelor's Degree | 0 (0.0%) | 0 (0.0%) |
| Graduate Degree | 0 (0.0%) | 0 (0.0%) |
| Total | 0 (0.0%) | 0 (0.0%) |
Employment Characteristics in Wright
Employment by Class of Employer in Wright
Among the 17 employed individuals in Wright, not-for-profit organizations (13 | 76.5%), and self-employed (not incorporated) (4 | 23.5%) make up the most common classes of employment.
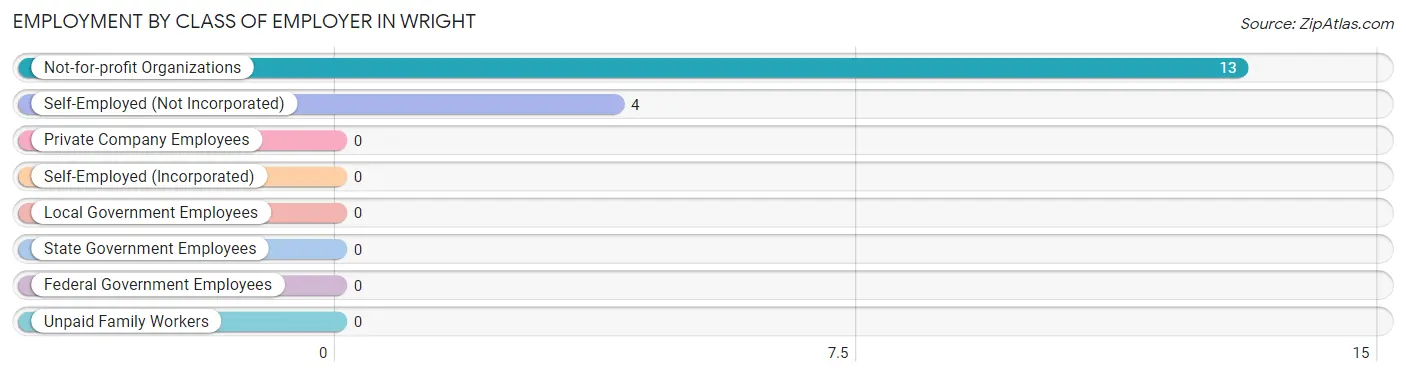
| Employer Class | # Employees | % Employees |
| Private Company Employees | 0 | 0.0% |
| Self-Employed (Incorporated) | 0 | 0.0% |
| Self-Employed (Not Incorporated) | 4 | 23.5% |
| Not-for-profit Organizations | 13 | 76.5% |
| Local Government Employees | 0 | 0.0% |
| State Government Employees | 0 | 0.0% |
| Federal Government Employees | 0 | 0.0% |
| Unpaid Family Workers | 0 | 0.0% |
| Total | 17 | 100.0% |
Employment Status by Age in Wright
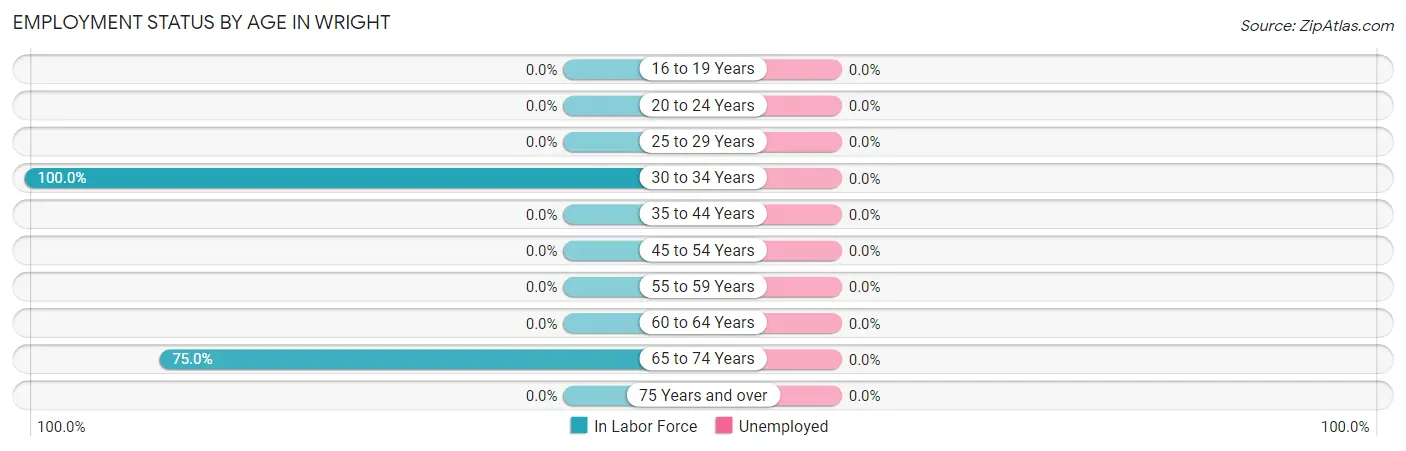
| Age Bracket | In Labor Force | Unemployed |
| 16 to 19 Years | 0 (0.0%) | 0 (0.0%) |
| 20 to 24 Years | 0 (0.0%) | 0 (0.0%) |
| 25 to 29 Years | 0 (0.0%) | 0 (0.0%) |
| 30 to 34 Years | 5 (100.0%) | 0 (0.0%) |
| 35 to 44 Years | 0 (0.0%) | 0 (0.0%) |
| 45 to 54 Years | 0 (0.0%) | 0 (0.0%) |
| 55 to 59 Years | 0 (0.0%) | 0 (0.0%) |
| 60 to 64 Years | 0 (0.0%) | 0 (0.0%) |
| 65 to 74 Years | 12 (75.0%) | 0 (0.0%) |
| 75 Years and over | 0 (0.0%) | 0 (0.0%) |
| Total | 17 (22.7%) | 0 (0.0%) |
Employment Status by Educational Attainment in Wright
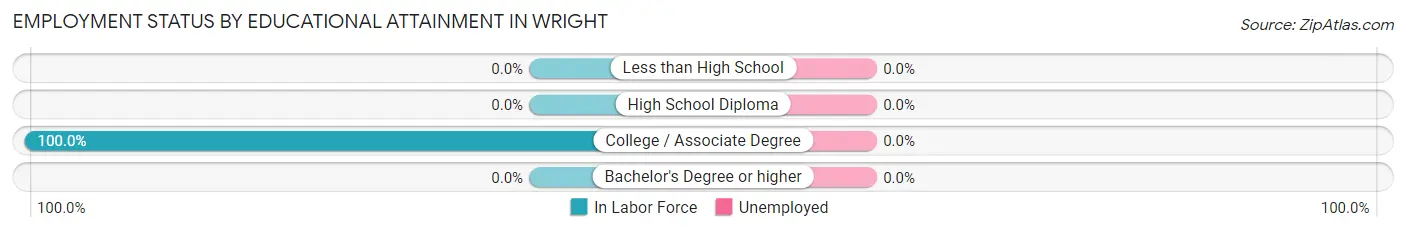
| Educational Attainment | In Labor Force | Unemployed |
| Less than High School | 0 (0.0%) | 0 (0.0%) |
| High School Diploma | 0 (0.0%) | 0 (0.0%) |
| College / Associate Degree | 5 (100.0%) | 0 (0.0%) |
| Bachelor's Degree or higher | 0 (0.0%) | 0 (0.0%) |
| Total | 5 (11.9%) | 0 (0.0%) |
Employment Occupations by Sex in Wright
Management, Business, Science and Arts Occupations
The most common Management, Business, Science and Arts occupations in Wright are Community & Social Service (13 | 76.5%), Education, Arts & Media (8 | 47.1%), and Education Instruction & Library (5 | 29.4%).
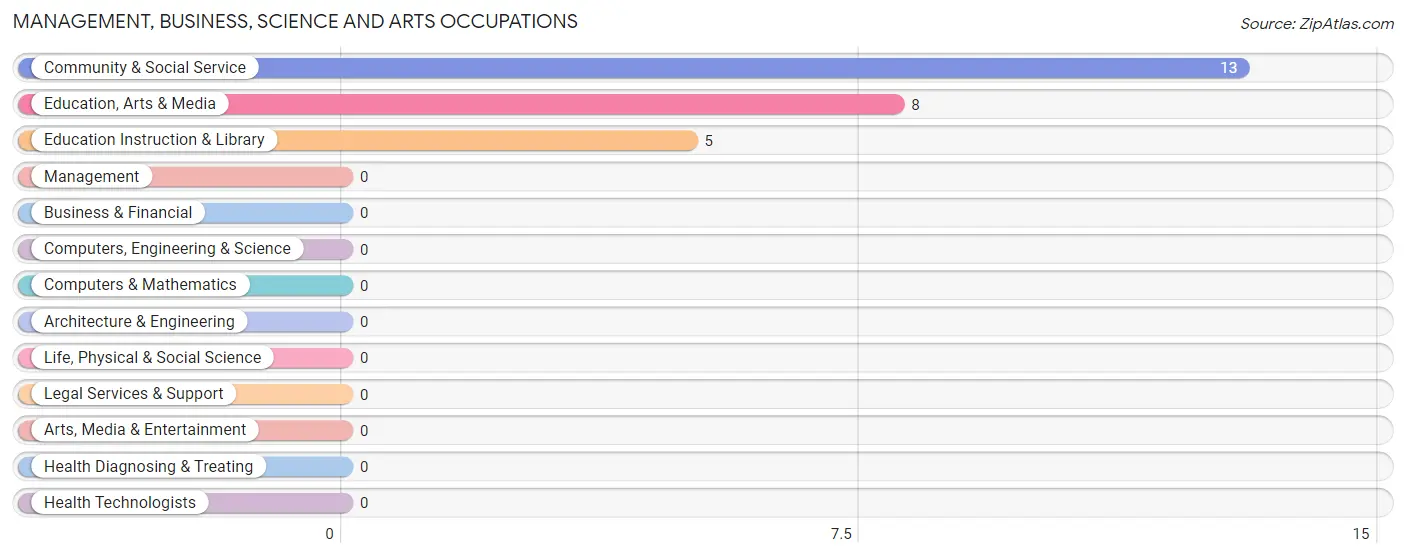
Management, Business, Science and Arts Occupations by Sex
Within the Management, Business, Science and Arts occupations in Wright, the most male-oriented occupations are Education, Arts & Media (100.0%), and Community & Social Service (61.5%), while the most female-oriented occupations are Education Instruction & Library (100.0%), and Community & Social Service (38.5%).
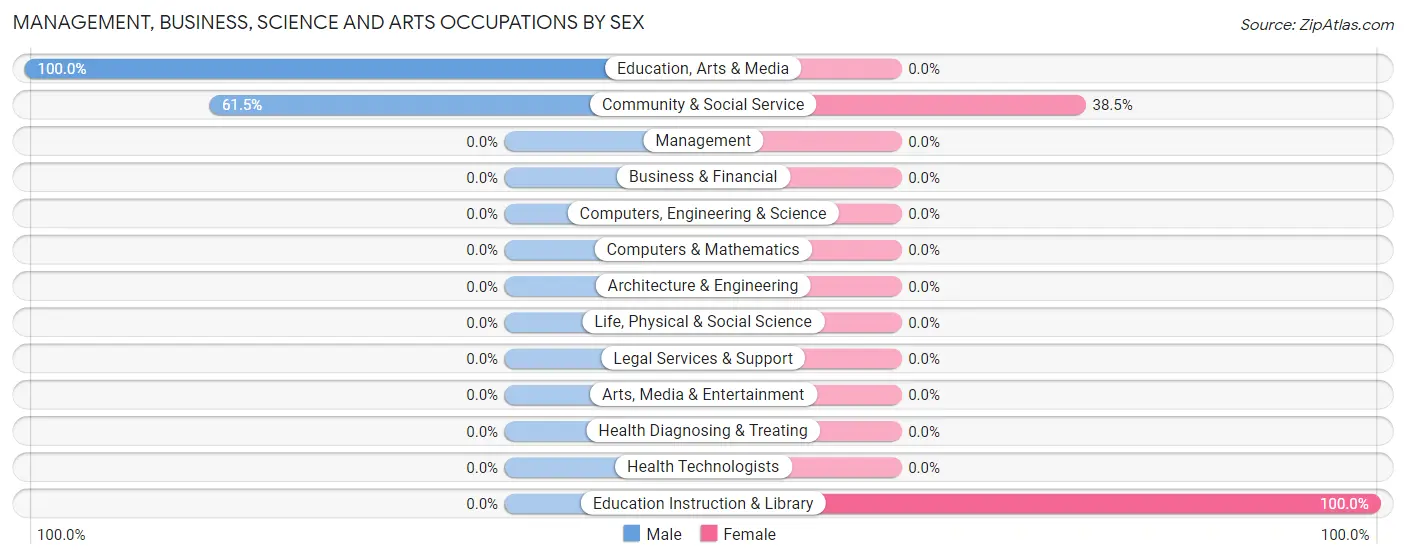
| Occupation | Male | Female |
| Management | 0 (0.0%) | 0 (0.0%) |
| Business & Financial | 0 (0.0%) | 0 (0.0%) |
| Computers, Engineering & Science | 0 (0.0%) | 0 (0.0%) |
| Computers & Mathematics | 0 (0.0%) | 0 (0.0%) |
| Architecture & Engineering | 0 (0.0%) | 0 (0.0%) |
| Life, Physical & Social Science | 0 (0.0%) | 0 (0.0%) |
| Community & Social Service | 8 (61.5%) | 5 (38.5%) |
| Education, Arts & Media | 8 (100.0%) | 0 (0.0%) |
| Legal Services & Support | 0 (0.0%) | 0 (0.0%) |
| Education Instruction & Library | 0 (0.0%) | 5 (100.0%) |
| Arts, Media & Entertainment | 0 (0.0%) | 0 (0.0%) |
| Health Diagnosing & Treating | 0 (0.0%) | 0 (0.0%) |
| Health Technologists | 0 (0.0%) | 0 (0.0%) |
| Total (Category) | 8 (61.5%) | 5 (38.5%) |
| Total (Overall) | 12 (70.6%) | 5 (29.4%) |
Services Occupations
Services Occupations by Sex
| Occupation | Male | Female |
| Healthcare Support | 0 (0.0%) | 0 (0.0%) |
| Security & Protection | 0 (0.0%) | 0 (0.0%) |
| Firefighting & Prevention | 0 (0.0%) | 0 (0.0%) |
| Law Enforcement | 0 (0.0%) | 0 (0.0%) |
| Food Preparation & Serving | 0 (0.0%) | 0 (0.0%) |
| Cleaning & Maintenance | 0 (0.0%) | 0 (0.0%) |
| Personal Care & Service | 0 (0.0%) | 0 (0.0%) |
| Total (Category) | 0 (0.0%) | 0 (0.0%) |
| Total (Overall) | 12 (70.6%) | 5 (29.4%) |
Sales and Office Occupations
The most common Sales and Office occupations in Wright are , and Sales & Related (4 | 23.5%).

Sales and Office Occupations by Sex

| Occupation | Male | Female |
| Sales & Related | 4 (100.0%) | 0 (0.0%) |
| Office & Administration | 0 (0.0%) | 0 (0.0%) |
| Total (Category) | 4 (100.0%) | 0 (0.0%) |
| Total (Overall) | 12 (70.6%) | 5 (29.4%) |
Natural Resources, Construction and Maintenance Occupations
Natural Resources, Construction and Maintenance Occupations by Sex
| Occupation | Male | Female |
| Farming, Fishing & Forestry | 0 (0.0%) | 0 (0.0%) |
| Construction & Extraction | 0 (0.0%) | 0 (0.0%) |
| Installation, Maintenance & Repair | 0 (0.0%) | 0 (0.0%) |
| Total (Category) | 0 (0.0%) | 0 (0.0%) |
| Total (Overall) | 12 (70.6%) | 5 (29.4%) |
Production, Transportation and Moving Occupations
Production, Transportation and Moving Occupations by Sex
| Occupation | Male | Female |
| Production | 0 (0.0%) | 0 (0.0%) |
| Transportation | 0 (0.0%) | 0 (0.0%) |
| Material Moving | 0 (0.0%) | 0 (0.0%) |
| Total (Category) | 0 (0.0%) | 0 (0.0%) |
| Total (Overall) | 12 (70.6%) | 5 (29.4%) |
Employment Industries by Sex in Wright
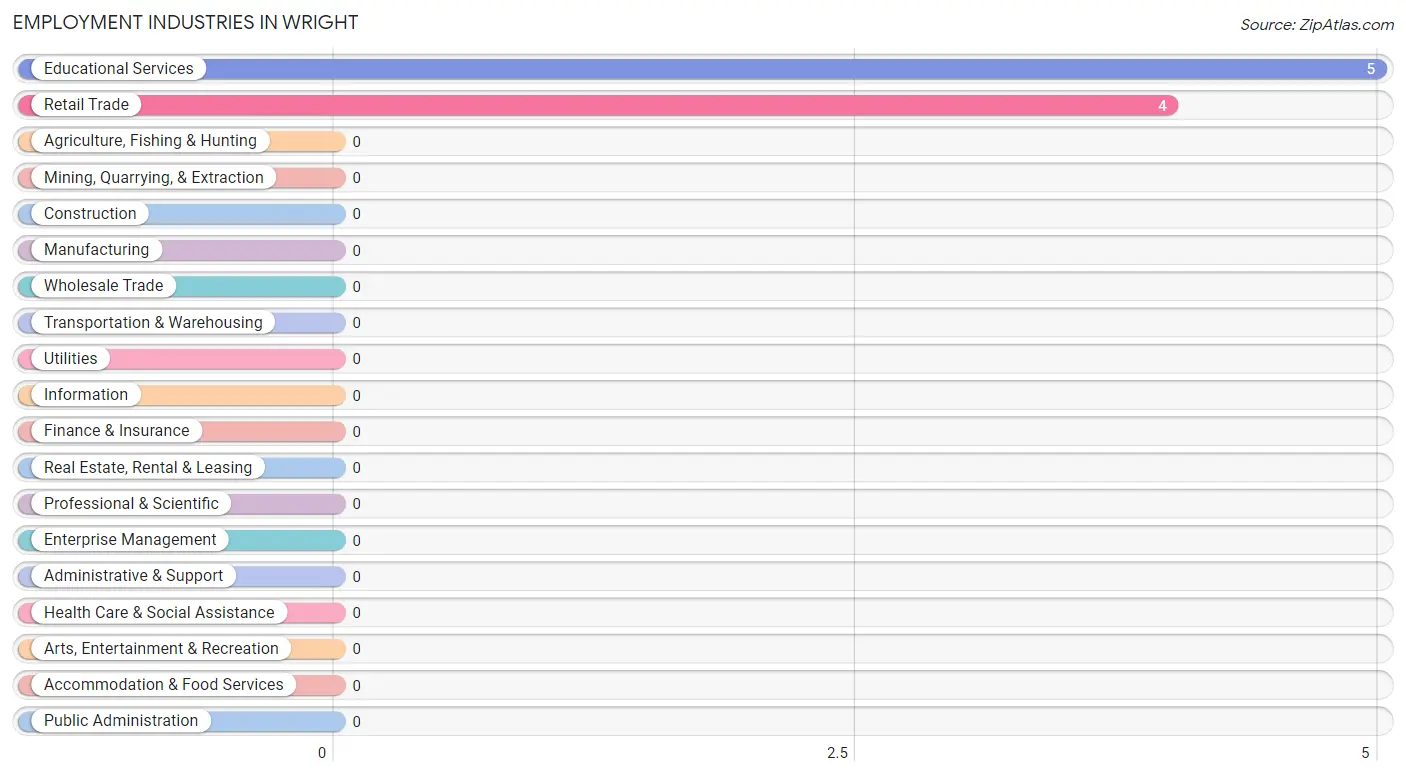
Employment Industries in Wright
The major employment industries in Wright include Educational Services (5 | 29.4%), and Retail Trade (4 | 23.5%).
Employment Industries by Sex in Wright
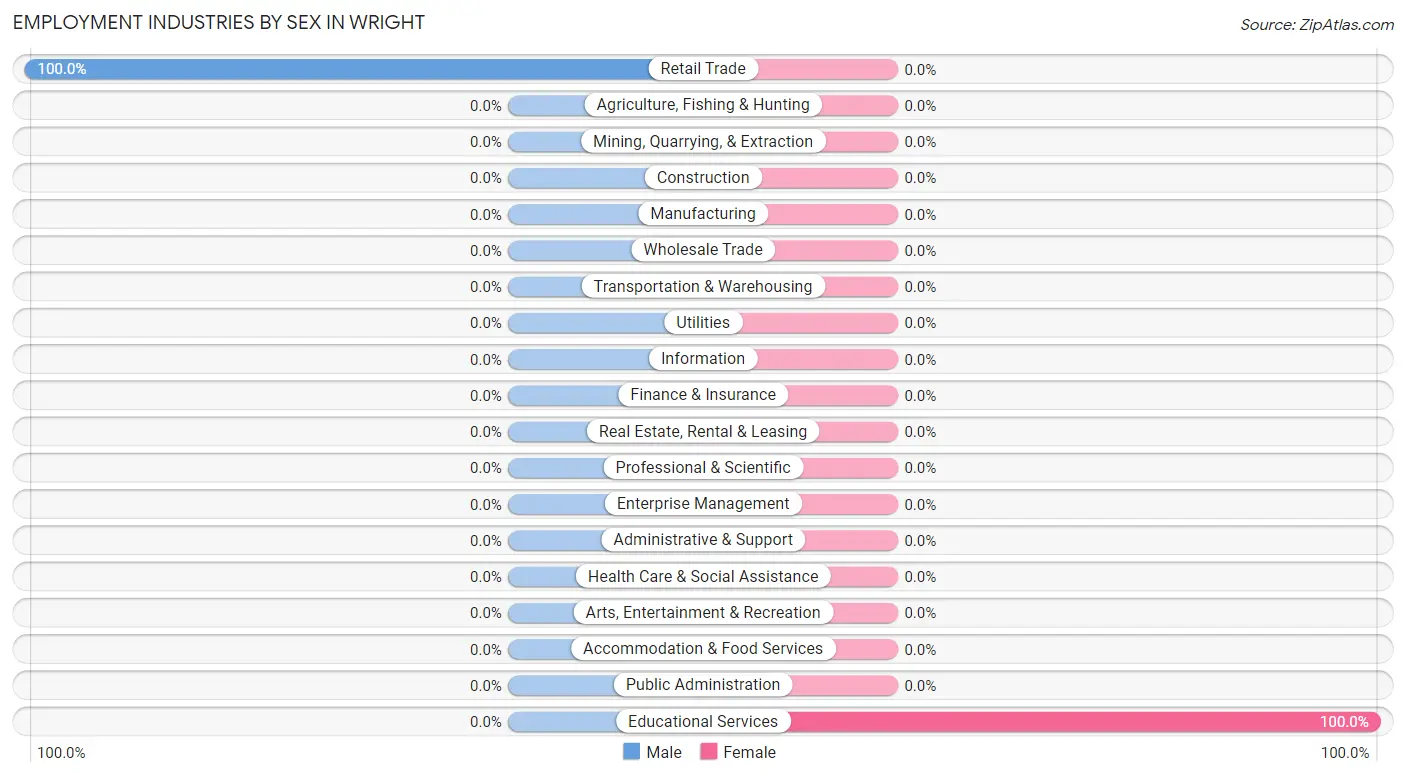
| Industry | Male | Female |
| Agriculture, Fishing & Hunting | 0 (0.0%) | 0 (0.0%) |
| Mining, Quarrying, & Extraction | 0 (0.0%) | 0 (0.0%) |
| Construction | 0 (0.0%) | 0 (0.0%) |
| Manufacturing | 0 (0.0%) | 0 (0.0%) |
| Wholesale Trade | 0 (0.0%) | 0 (0.0%) |
| Retail Trade | 4 (100.0%) | 0 (0.0%) |
| Transportation & Warehousing | 0 (0.0%) | 0 (0.0%) |
| Utilities | 0 (0.0%) | 0 (0.0%) |
| Information | 0 (0.0%) | 0 (0.0%) |
| Finance & Insurance | 0 (0.0%) | 0 (0.0%) |
| Real Estate, Rental & Leasing | 0 (0.0%) | 0 (0.0%) |
| Professional & Scientific | 0 (0.0%) | 0 (0.0%) |
| Enterprise Management | 0 (0.0%) | 0 (0.0%) |
| Administrative & Support | 0 (0.0%) | 0 (0.0%) |
| Educational Services | 0 (0.0%) | 5 (100.0%) |
| Health Care & Social Assistance | 0 (0.0%) | 0 (0.0%) |
| Arts, Entertainment & Recreation | 0 (0.0%) | 0 (0.0%) |
| Accommodation & Food Services | 0 (0.0%) | 0 (0.0%) |
| Public Administration | 0 (0.0%) | 0 (0.0%) |
| Total | 12 (70.6%) | 5 (29.4%) |
Education in Wright
School Enrollment in Wright
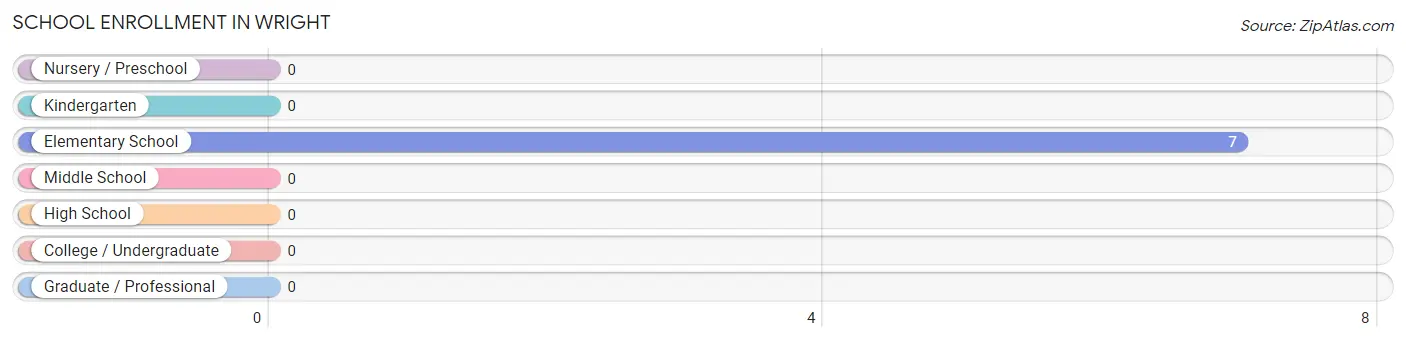
| School Level | # Students | % Students |
| Nursery / Preschool | 0 | 0.0% |
| Kindergarten | 0 | 0.0% |
| Elementary School | 7 | 100.0% |
| Middle School | 0 | 0.0% |
| High School | 0 | 0.0% |
| College / Undergraduate | 0 | 0.0% |
| Graduate / Professional | 0 | 0.0% |
| Total | 7 | 100.0% |
School Enrollment by Age by Funding Source in Wright
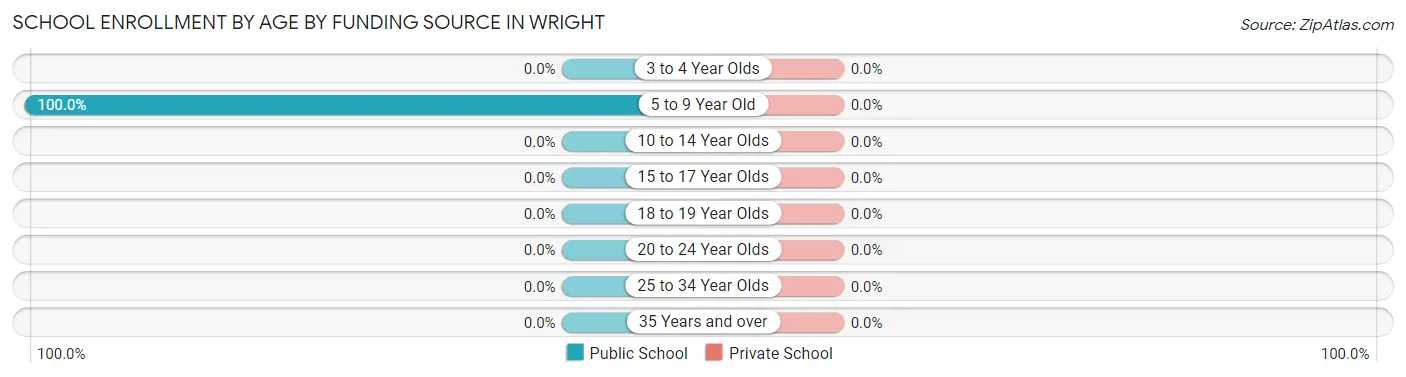
| Age Bracket | Public School | Private School |
| 3 to 4 Year Olds | 0 (0.0%) | 0 (0.0%) |
| 5 to 9 Year Old | 7 (100.0%) | 0 (0.0%) |
| 10 to 14 Year Olds | 0 (0.0%) | 0 (0.0%) |
| 15 to 17 Year Olds | 0 (0.0%) | 0 (0.0%) |
| 18 to 19 Year Olds | 0 (0.0%) | 0 (0.0%) |
| 20 to 24 Year Olds | 0 (0.0%) | 0 (0.0%) |
| 25 to 34 Year Olds | 0 (0.0%) | 0 (0.0%) |
| 35 Years and over | 0 (0.0%) | 0 (0.0%) |
| Total | 7 (100.0%) | 0 (0.0%) |
Educational Attainment by Field of Study in Wright
, and liberal arts & history (8 | 100.0%) are the most common fields of study among 8 individuals in Wright who have obtained a bachelor's degree or higher.
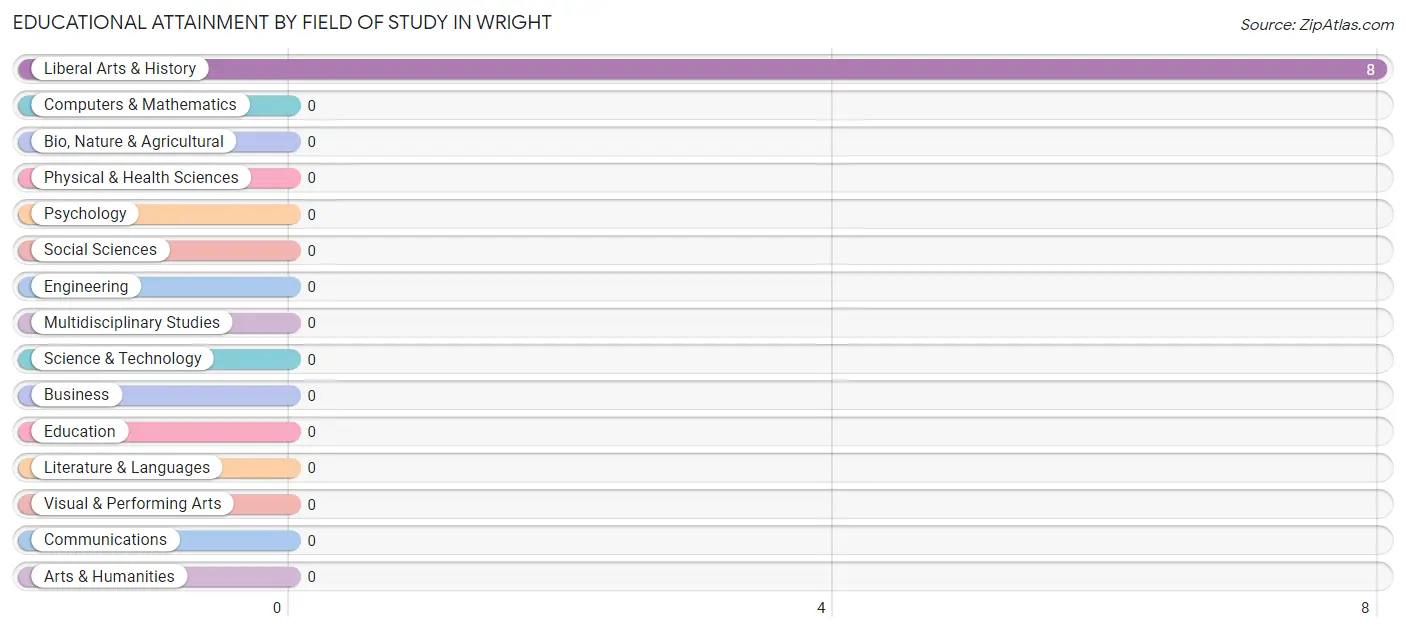
| Field of Study | # Graduates | % Graduates |
| Computers & Mathematics | 0 | 0.0% |
| Bio, Nature & Agricultural | 0 | 0.0% |
| Physical & Health Sciences | 0 | 0.0% |
| Psychology | 0 | 0.0% |
| Social Sciences | 0 | 0.0% |
| Engineering | 0 | 0.0% |
| Multidisciplinary Studies | 0 | 0.0% |
| Science & Technology | 0 | 0.0% |
| Business | 0 | 0.0% |
| Education | 0 | 0.0% |
| Literature & Languages | 0 | 0.0% |
| Liberal Arts & History | 8 | 100.0% |
| Visual & Performing Arts | 0 | 0.0% |
| Communications | 0 | 0.0% |
| Arts & Humanities | 0 | 0.0% |
| Total | 8 | 100.0% |
Transportation & Commute in Wright
Vehicle Availability by Sex in Wright
The most prevalent vehicle ownership categories in Wright are males with 1 vehicle (8, accounting for 66.7%) and females with 1 vehicle (0, making up 160.0%).
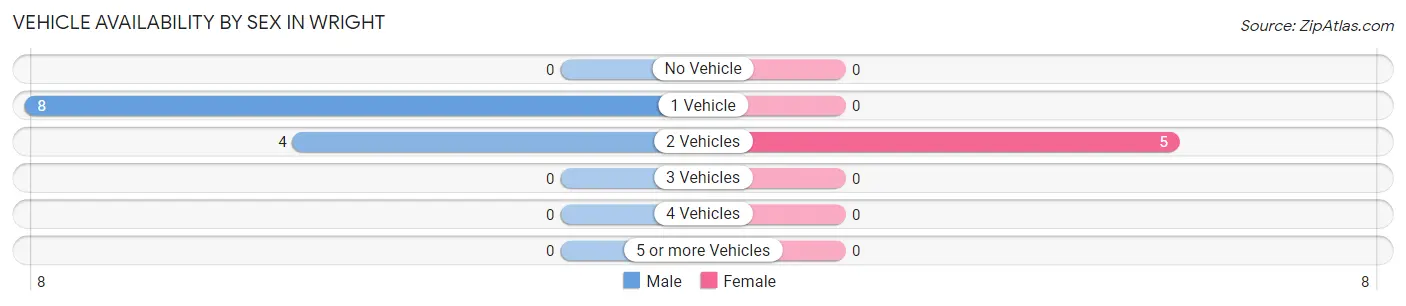
| Vehicles Available | Male | Female |
| No Vehicle | 0 (0.0%) | 0 (0.0%) |
| 1 Vehicle | 8 (66.7%) | 0 (0.0%) |
| 2 Vehicles | 4 (33.3%) | 5 (100.0%) |
| 3 Vehicles | 0 (0.0%) | 0 (0.0%) |
| 4 Vehicles | 0 (0.0%) | 0 (0.0%) |
| 5 or more Vehicles | 0 (0.0%) | 0 (0.0%) |
| Total | 12 (100.0%) | 5 (100.0%) |
Commute Time in Wright
The most frequently occuring commute durations in Wright are 10 to 14 minutes (13 commuters, 76.5%), 90 or more minutes (4 commuters, 23.5%), and less than 5 minutes (0 commuters, 0.0%).
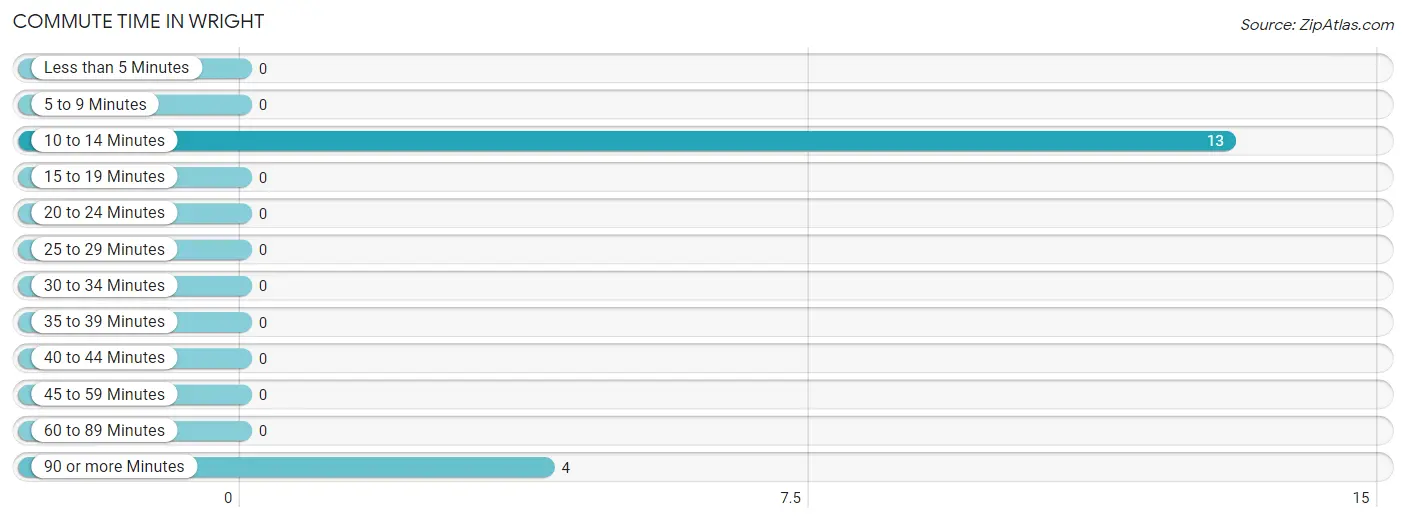
| Commute Time | # Commuters | % Commuters |
| Less than 5 Minutes | 0 | 0.0% |
| 5 to 9 Minutes | 0 | 0.0% |
| 10 to 14 Minutes | 13 | 76.5% |
| 15 to 19 Minutes | 0 | 0.0% |
| 20 to 24 Minutes | 0 | 0.0% |
| 25 to 29 Minutes | 0 | 0.0% |
| 30 to 34 Minutes | 0 | 0.0% |
| 35 to 39 Minutes | 0 | 0.0% |
| 40 to 44 Minutes | 0 | 0.0% |
| 45 to 59 Minutes | 0 | 0.0% |
| 60 to 89 Minutes | 0 | 0.0% |
| 90 or more Minutes | 4 | 23.5% |
Commute Time by Sex in Wright
The most common commute times in Wright are 10 to 14 minutes (8 commuters, 66.7%) for males and 10 to 14 minutes (5 commuters, 100.0%) for females.
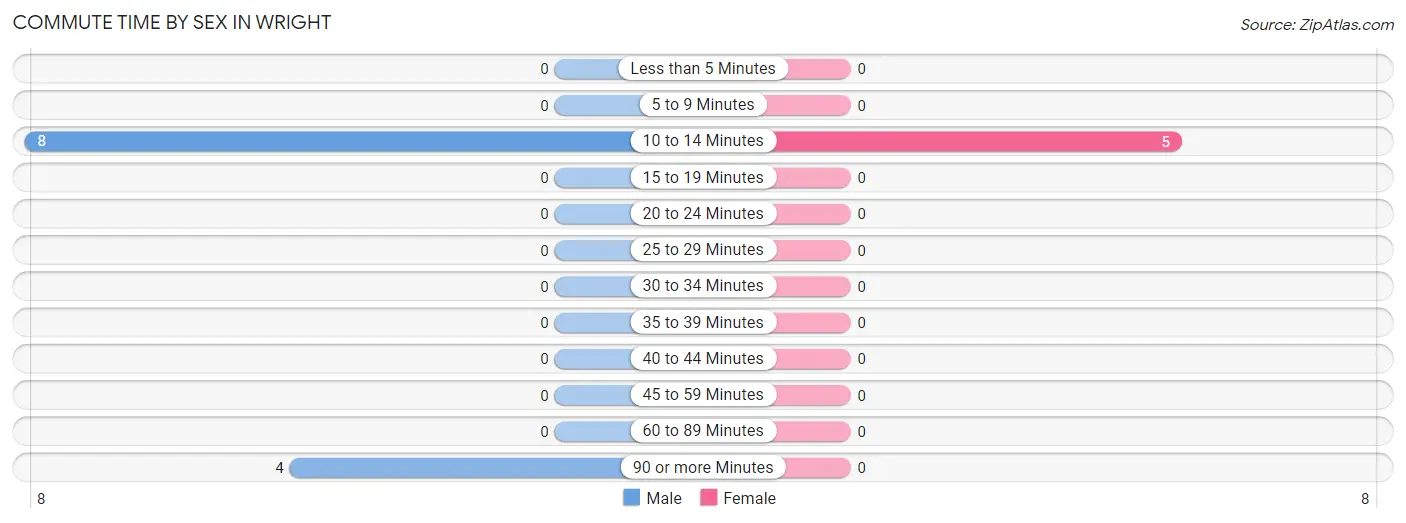
| Commute Time | Male | Female |
| Less than 5 Minutes | 0 (0.0%) | 0 (0.0%) |
| 5 to 9 Minutes | 0 (0.0%) | 0 (0.0%) |
| 10 to 14 Minutes | 8 (66.7%) | 5 (100.0%) |
| 15 to 19 Minutes | 0 (0.0%) | 0 (0.0%) |
| 20 to 24 Minutes | 0 (0.0%) | 0 (0.0%) |
| 25 to 29 Minutes | 0 (0.0%) | 0 (0.0%) |
| 30 to 34 Minutes | 0 (0.0%) | 0 (0.0%) |
| 35 to 39 Minutes | 0 (0.0%) | 0 (0.0%) |
| 40 to 44 Minutes | 0 (0.0%) | 0 (0.0%) |
| 45 to 59 Minutes | 0 (0.0%) | 0 (0.0%) |
| 60 to 89 Minutes | 0 (0.0%) | 0 (0.0%) |
| 90 or more Minutes | 4 (33.3%) | 0 (0.0%) |
Time of Departure to Work by Sex in Wright
The most frequent times of departure to work in Wright are 8:00 AM to 8:29 AM (12, 100.0%) for males and 4:00 PM to 11:59 PM (5, 100.0%) for females.
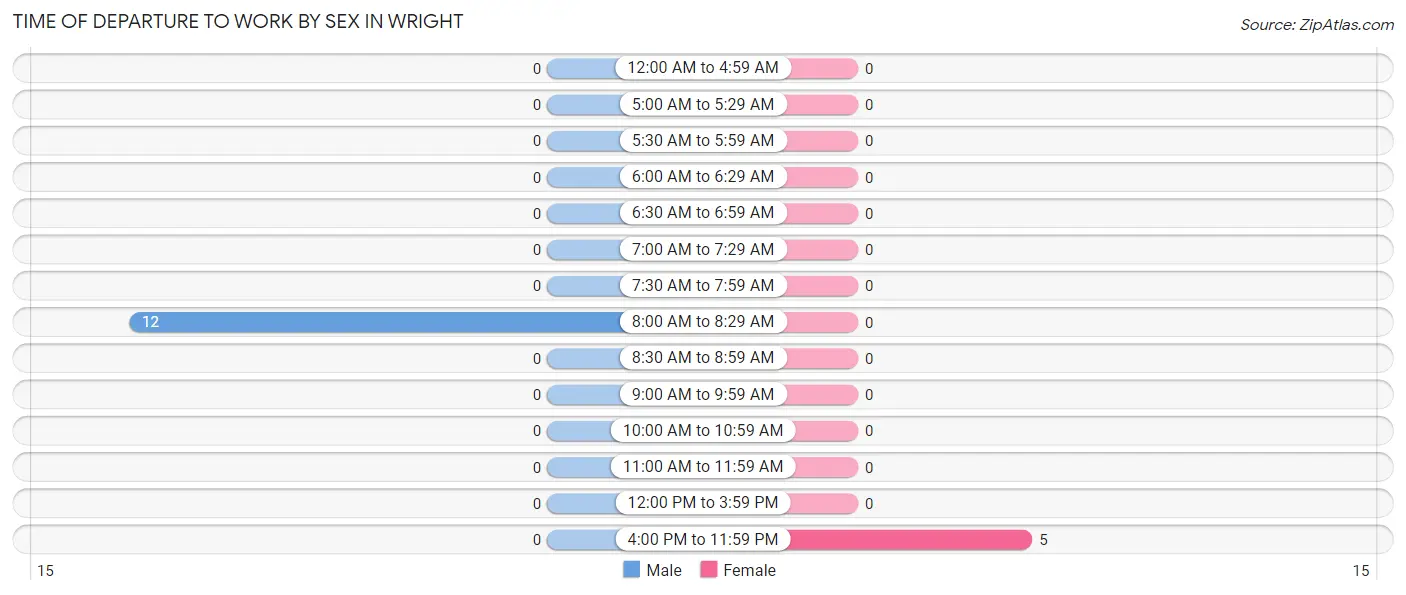
| Time of Departure | Male | Female |
| 12:00 AM to 4:59 AM | 0 (0.0%) | 0 (0.0%) |
| 5:00 AM to 5:29 AM | 0 (0.0%) | 0 (0.0%) |
| 5:30 AM to 5:59 AM | 0 (0.0%) | 0 (0.0%) |
| 6:00 AM to 6:29 AM | 0 (0.0%) | 0 (0.0%) |
| 6:30 AM to 6:59 AM | 0 (0.0%) | 0 (0.0%) |
| 7:00 AM to 7:29 AM | 0 (0.0%) | 0 (0.0%) |
| 7:30 AM to 7:59 AM | 0 (0.0%) | 0 (0.0%) |
| 8:00 AM to 8:29 AM | 12 (100.0%) | 0 (0.0%) |
| 8:30 AM to 8:59 AM | 0 (0.0%) | 0 (0.0%) |
| 9:00 AM to 9:59 AM | 0 (0.0%) | 0 (0.0%) |
| 10:00 AM to 10:59 AM | 0 (0.0%) | 0 (0.0%) |
| 11:00 AM to 11:59 AM | 0 (0.0%) | 0 (0.0%) |
| 12:00 PM to 3:59 PM | 0 (0.0%) | 0 (0.0%) |
| 4:00 PM to 11:59 PM | 0 (0.0%) | 5 (100.0%) |
| Total | 12 (100.0%) | 5 (100.0%) |
Housing Occupancy in Wright
Occupancy by Ownership in Wright
Of the total 66 dwellings in Wright, owner-occupied units account for 58 (87.9%), while renter-occupied units make up 8 (12.1%).
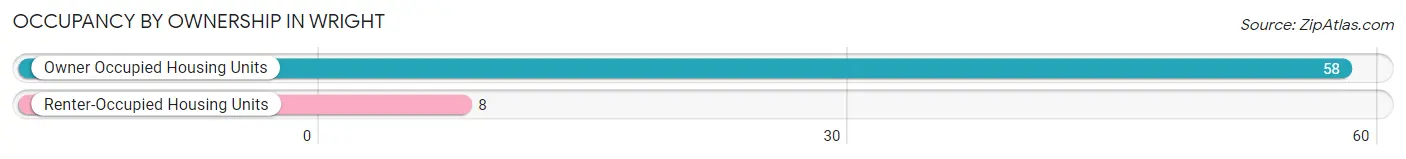
| Occupancy | # Housing Units | % Housing Units |
| Owner Occupied Housing Units | 58 | 87.9% |
| Renter-Occupied Housing Units | 8 | 12.1% |
| Total Occupied Housing Units | 66 | 100.0% |
Occupancy by Household Size in Wright
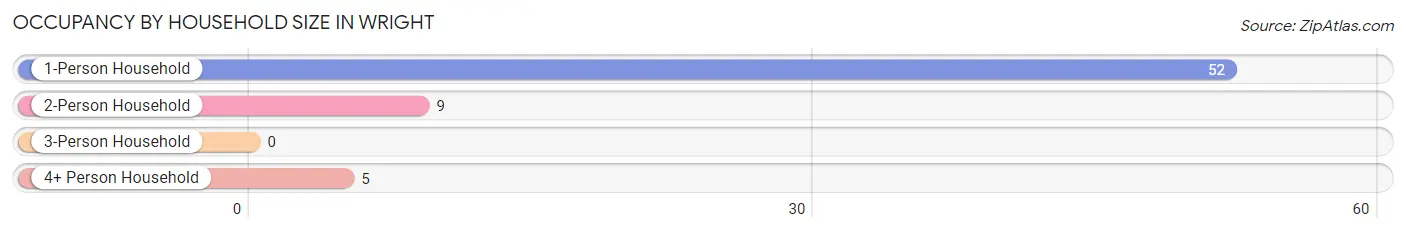
| Household Size | # Housing Units | % Housing Units |
| 1-Person Household | 52 | 78.8% |
| 2-Person Household | 9 | 13.6% |
| 3-Person Household | 0 | 0.0% |
| 4+ Person Household | 5 | 7.6% |
| Total Housing Units | 66 | 100.0% |
Occupancy by Ownership by Household Size in Wright
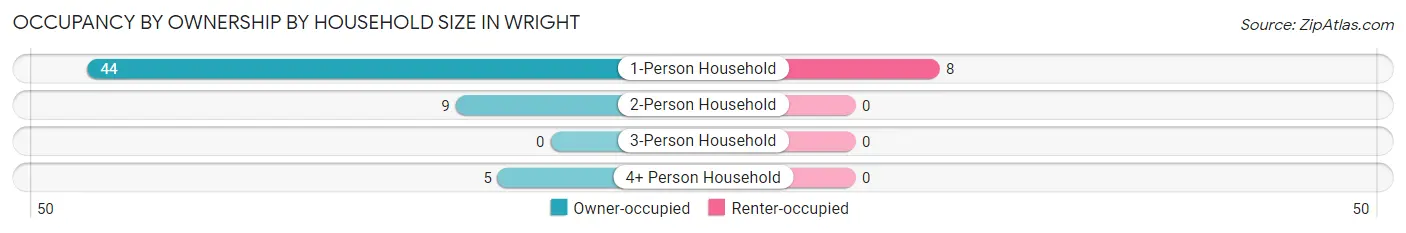
| Household Size | Owner-occupied | Renter-occupied |
| 1-Person Household | 44 (84.6%) | 8 (15.4%) |
| 2-Person Household | 9 (100.0%) | 0 (0.0%) |
| 3-Person Household | 0 (0.0%) | 0 (0.0%) |
| 4+ Person Household | 5 (100.0%) | 0 (0.0%) |
| Total Housing Units | 58 (87.9%) | 8 (12.1%) |
Occupancy by Educational Attainment in Wright
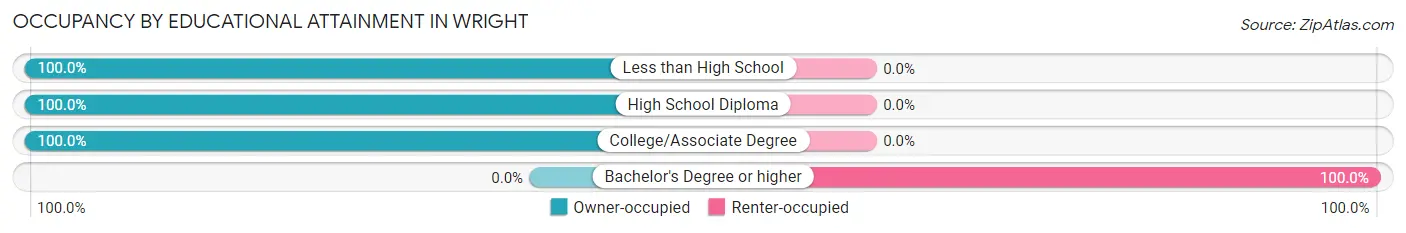
| Household Size | Owner-occupied | Renter-occupied |
| Less than High School | 37 (100.0%) | 0 (0.0%) |
| High School Diploma | 7 (100.0%) | 0 (0.0%) |
| College/Associate Degree | 14 (100.0%) | 0 (0.0%) |
| Bachelor's Degree or higher | 0 (0.0%) | 8 (100.0%) |
Occupancy by Age of Householder in Wright
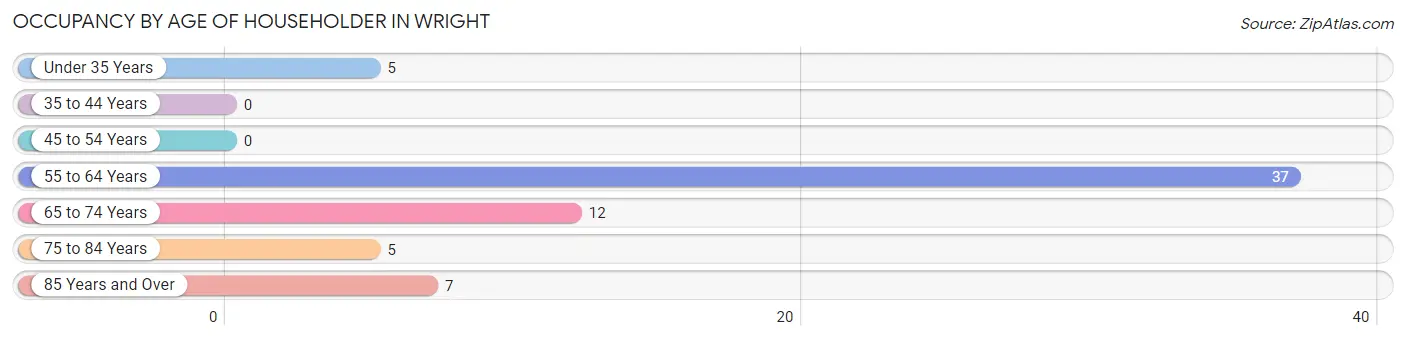
| Age Bracket | # Households | % Households |
| Under 35 Years | 5 | 7.6% |
| 35 to 44 Years | 0 | 0.0% |
| 45 to 54 Years | 0 | 0.0% |
| 55 to 64 Years | 37 | 56.1% |
| 65 to 74 Years | 12 | 18.2% |
| 75 to 84 Years | 5 | 7.6% |
| 85 Years and Over | 7 | 10.6% |
| Total | 66 | 100.0% |
Housing Finances in Wright
Median Income by Occupancy in Wright
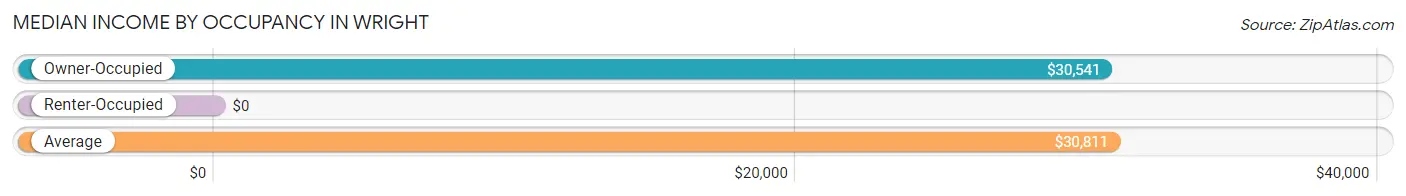
| Occupancy Type | # Households | Median Income |
| Owner-Occupied | 58 (87.9%) | $30,541 |
| Renter-Occupied | 8 (12.1%) | $0 |
| Average | 66 (100.0%) | $30,811 |
Occupancy by Householder Income Bracket in Wright
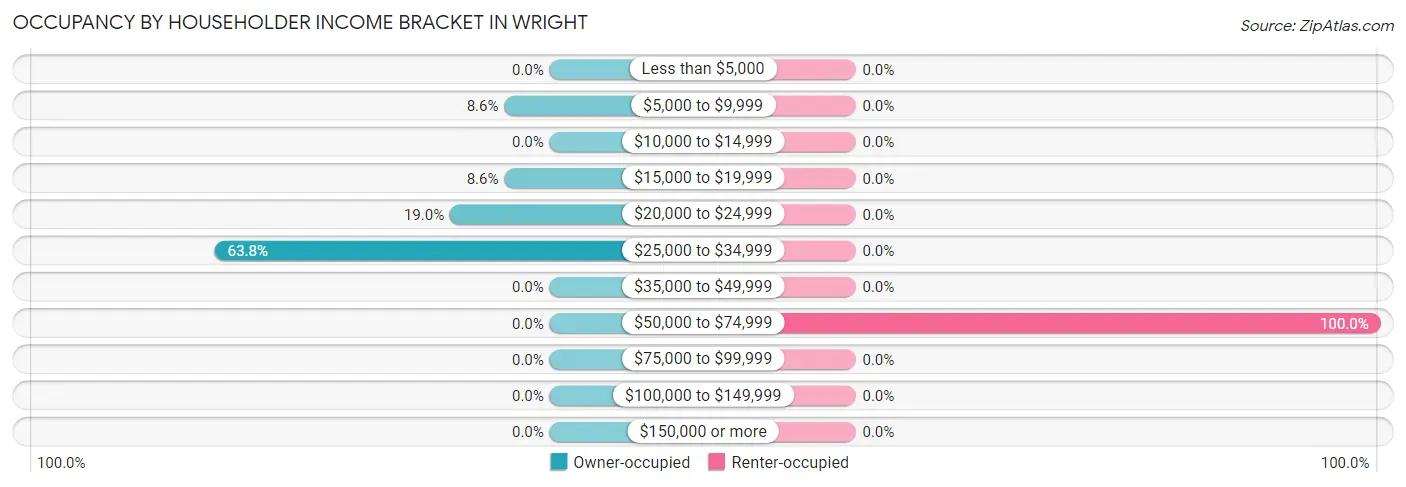
| Income Bracket | Owner-occupied | Renter-occupied |
| Less than $5,000 | 0 (0.0%) | 0 (0.0%) |
| $5,000 to $9,999 | 5 (8.6%) | 0 (0.0%) |
| $10,000 to $14,999 | 0 (0.0%) | 0 (0.0%) |
| $15,000 to $19,999 | 5 (8.6%) | 0 (0.0%) |
| $20,000 to $24,999 | 11 (19.0%) | 0 (0.0%) |
| $25,000 to $34,999 | 37 (63.8%) | 0 (0.0%) |
| $35,000 to $49,999 | 0 (0.0%) | 0 (0.0%) |
| $50,000 to $74,999 | 0 (0.0%) | 8 (100.0%) |
| $75,000 to $99,999 | 0 (0.0%) | 0 (0.0%) |
| $100,000 to $149,999 | 0 (0.0%) | 0 (0.0%) |
| $150,000 or more | 0 (0.0%) | 0 (0.0%) |
| Total | 58 (100.0%) | 8 (100.0%) |
Monthly Housing Cost Tiers in Wright
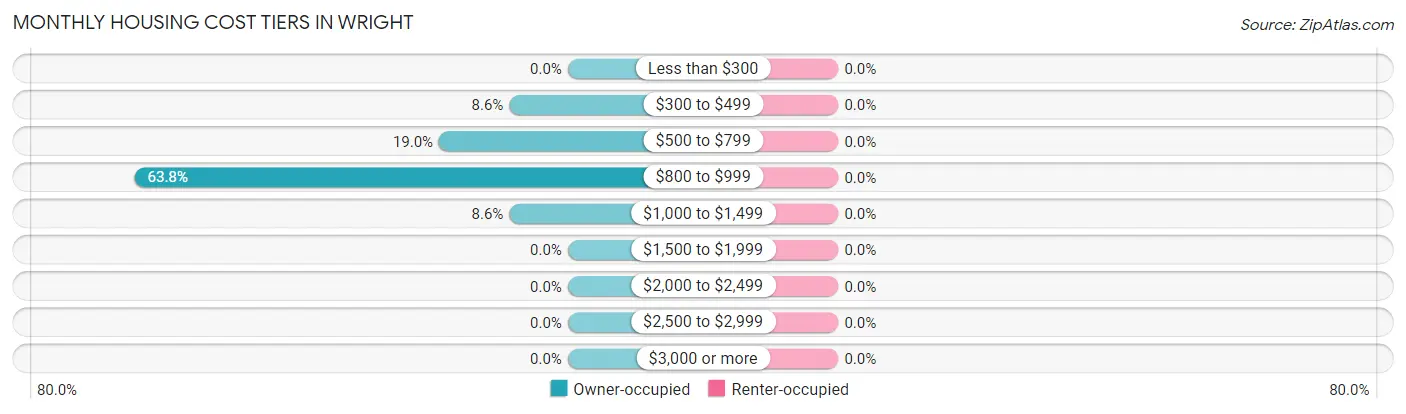
| Monthly Cost | Owner-occupied | Renter-occupied |
| Less than $300 | 0 (0.0%) | 0 (0.0%) |
| $300 to $499 | 5 (8.6%) | 0 (0.0%) |
| $500 to $799 | 11 (19.0%) | 0 (0.0%) |
| $800 to $999 | 37 (63.8%) | 0 (0.0%) |
| $1,000 to $1,499 | 5 (8.6%) | 0 (0.0%) |
| $1,500 to $1,999 | 0 (0.0%) | 0 (0.0%) |
| $2,000 to $2,499 | 0 (0.0%) | 0 (0.0%) |
| $2,500 to $2,999 | 0 (0.0%) | 0 (0.0%) |
| $3,000 or more | 0 (0.0%) | 0 (0.0%) |
| Total | 58 (100.0%) | 8 (100.0%) |
Physical Housing Characteristics in Wright
Housing Structures in Wright
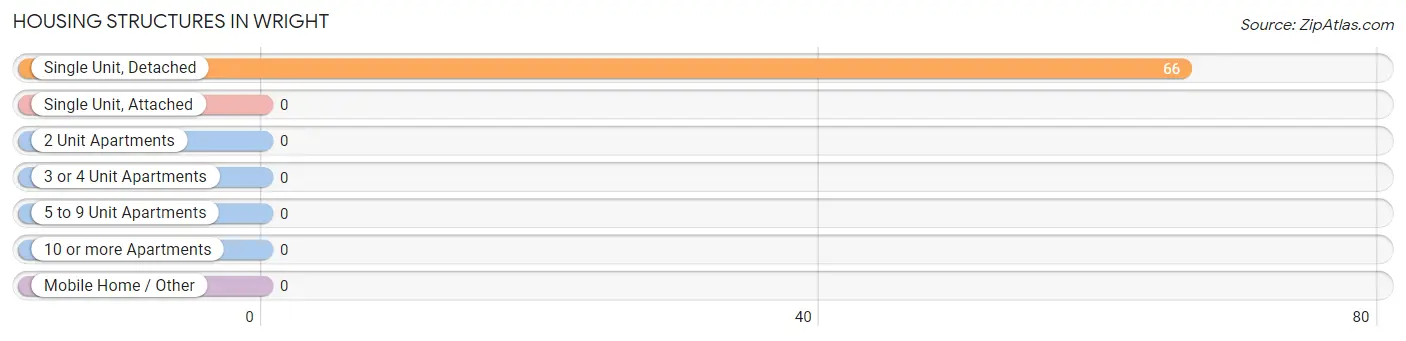
| Structure Type | # Housing Units | % Housing Units |
| Single Unit, Detached | 66 | 100.0% |
| Single Unit, Attached | 0 | 0.0% |
| 2 Unit Apartments | 0 | 0.0% |
| 3 or 4 Unit Apartments | 0 | 0.0% |
| 5 to 9 Unit Apartments | 0 | 0.0% |
| 10 or more Apartments | 0 | 0.0% |
| Mobile Home / Other | 0 | 0.0% |
| Total | 66 | 100.0% |
Housing Structures by Occupancy in Wright
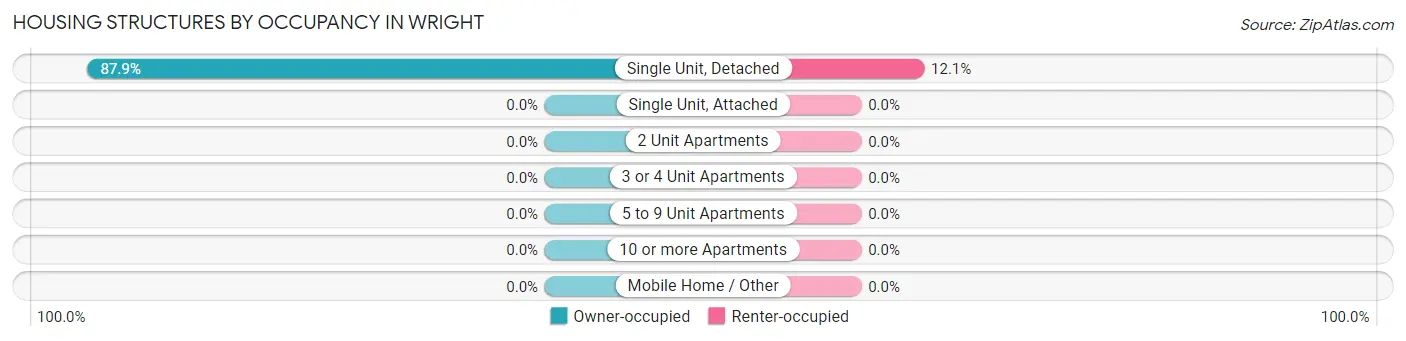
| Structure Type | Owner-occupied | Renter-occupied |
| Single Unit, Detached | 58 (87.9%) | 8 (12.1%) |
| Single Unit, Attached | 0 (0.0%) | 0 (0.0%) |
| 2 Unit Apartments | 0 (0.0%) | 0 (0.0%) |
| 3 or 4 Unit Apartments | 0 (0.0%) | 0 (0.0%) |
| 5 to 9 Unit Apartments | 0 (0.0%) | 0 (0.0%) |
| 10 or more Apartments | 0 (0.0%) | 0 (0.0%) |
| Mobile Home / Other | 0 (0.0%) | 0 (0.0%) |
| Total | 58 (87.9%) | 8 (12.1%) |
Housing Structures by Number of Rooms in Wright
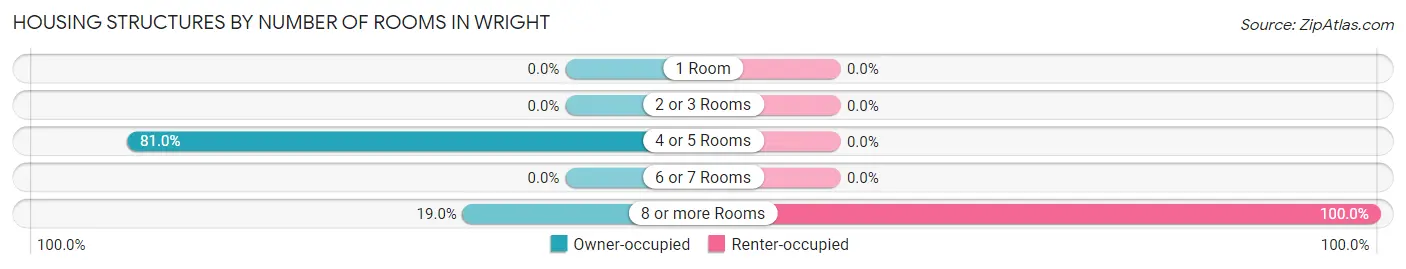
| Number of Rooms | Owner-occupied | Renter-occupied |
| 1 Room | 0 (0.0%) | 0 (0.0%) |
| 2 or 3 Rooms | 0 (0.0%) | 0 (0.0%) |
| 4 or 5 Rooms | 47 (81.0%) | 0 (0.0%) |
| 6 or 7 Rooms | 0 (0.0%) | 0 (0.0%) |
| 8 or more Rooms | 11 (19.0%) | 8 (100.0%) |
| Total | 58 (100.0%) | 8 (100.0%) |
Housing Structure by Heating Type in Wright
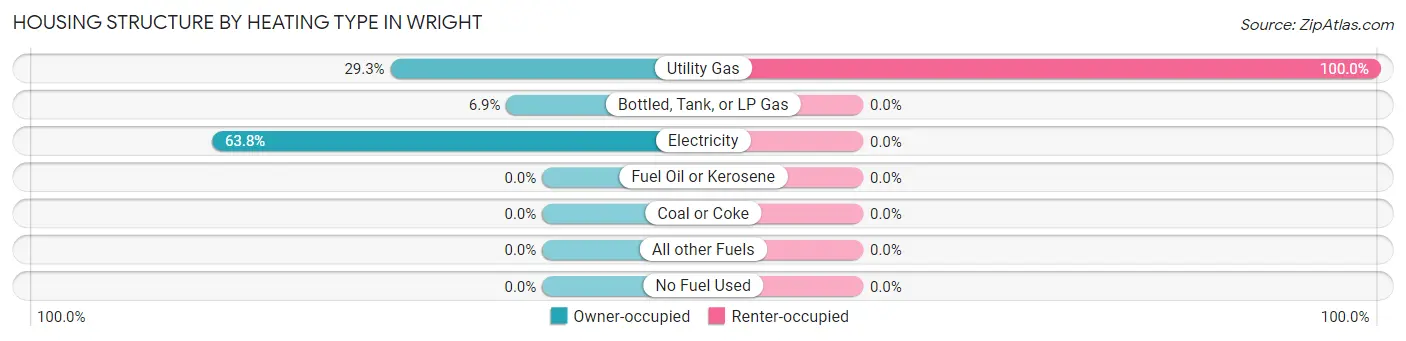
| Heating Type | Owner-occupied | Renter-occupied |
| Utility Gas | 17 (29.3%) | 8 (100.0%) |
| Bottled, Tank, or LP Gas | 4 (6.9%) | 0 (0.0%) |
| Electricity | 37 (63.8%) | 0 (0.0%) |
| Fuel Oil or Kerosene | 0 (0.0%) | 0 (0.0%) |
| Coal or Coke | 0 (0.0%) | 0 (0.0%) |
| All other Fuels | 0 (0.0%) | 0 (0.0%) |
| No Fuel Used | 0 (0.0%) | 0 (0.0%) |
| Total | 58 (100.0%) | 8 (100.0%) |
Household Vehicle Usage in Wright
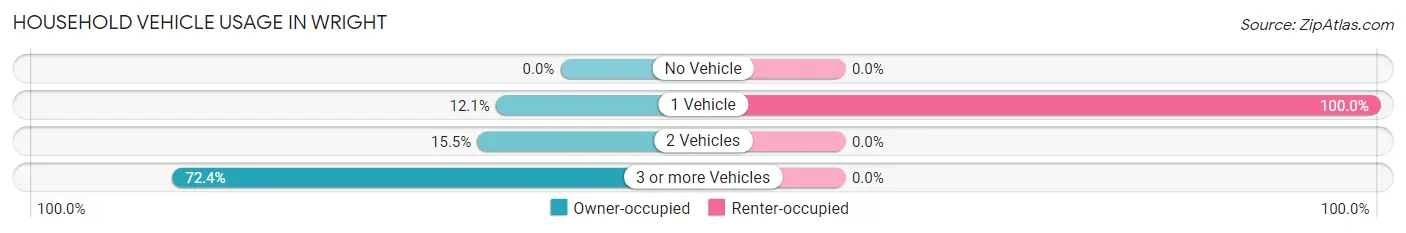
| Vehicles per Household | Owner-occupied | Renter-occupied |
| No Vehicle | 0 (0.0%) | 0 (0.0%) |
| 1 Vehicle | 7 (12.1%) | 8 (100.0%) |
| 2 Vehicles | 9 (15.5%) | 0 (0.0%) |
| 3 or more Vehicles | 42 (72.4%) | 0 (0.0%) |
| Total | 58 (100.0%) | 8 (100.0%) |
Real Estate & Mortgages in Wright
Real Estate and Mortgage Overview in Wright
| Characteristic | Without Mortgage | With Mortgage |
| Housing Units | 16 | 42 |
| Median Property Value | $143,800 | $0 |
| Median Household Income | $21,071 | $0 |
| Monthly Housing Costs | $575 | $0 |
| Real Estate Taxes | $2,273 | $0 |
Property Value by Mortgage Status in Wright
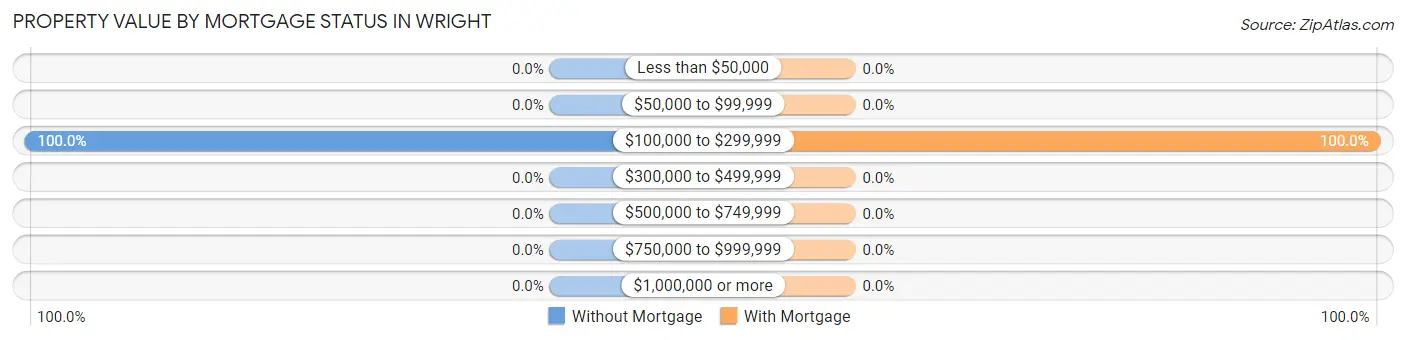
| Property Value | Without Mortgage | With Mortgage |
| Less than $50,000 | 0 (0.0%) | 0 (0.0%) |
| $50,000 to $99,999 | 0 (0.0%) | 0 (0.0%) |
| $100,000 to $299,999 | 16 (100.0%) | 42 (100.0%) |
| $300,000 to $499,999 | 0 (0.0%) | 0 (0.0%) |
| $500,000 to $749,999 | 0 (0.0%) | 0 (0.0%) |
| $750,000 to $999,999 | 0 (0.0%) | 0 (0.0%) |
| $1,000,000 or more | 0 (0.0%) | 0 (0.0%) |
| Total | 16 (100.0%) | 42 (100.0%) |
Household Income by Mortgage Status in Wright
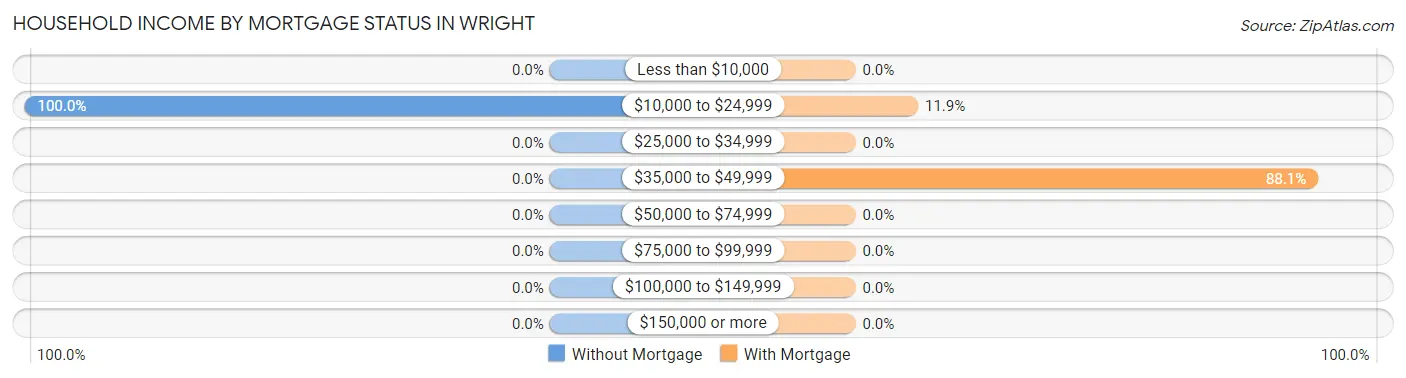
| Household Income | Without Mortgage | With Mortgage |
| Less than $10,000 | 0 (0.0%) | 0 (0.0%) |
| $10,000 to $24,999 | 16 (100.0%) | 5 (11.9%) |
| $25,000 to $34,999 | 0 (0.0%) | 0 (0.0%) |
| $35,000 to $49,999 | 0 (0.0%) | 37 (88.1%) |
| $50,000 to $74,999 | 0 (0.0%) | 0 (0.0%) |
| $75,000 to $99,999 | 0 (0.0%) | 0 (0.0%) |
| $100,000 to $149,999 | 0 (0.0%) | 0 (0.0%) |
| $150,000 or more | 0 (0.0%) | 0 (0.0%) |
| Total | 16 (100.0%) | 42 (100.0%) |
Property Value to Household Income Ratio in Wright
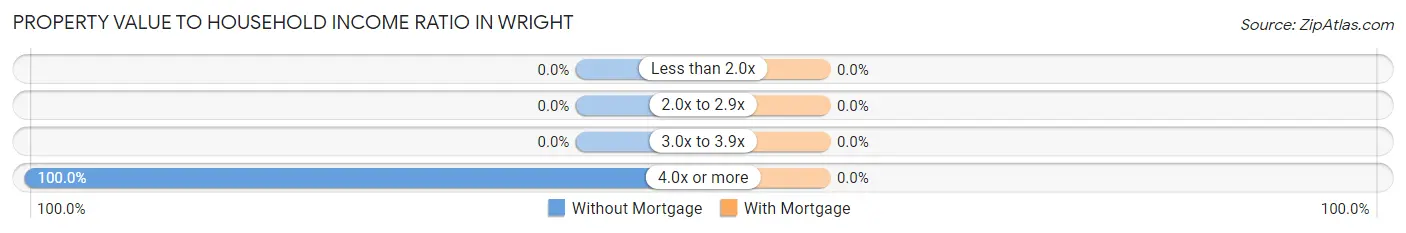
| Value-to-Income Ratio | Without Mortgage | With Mortgage |
| Less than 2.0x | 0 (0.0%) | 0 (0.0%) |
| 2.0x to 2.9x | 0 (0.0%) | 0 (0.0%) |
| 3.0x to 3.9x | 0 (0.0%) | 0 (0.0%) |
| 4.0x or more | 16 (100.0%) | 0 (0.0%) |
| Total | 16 (100.0%) | 42 (100.0%) |
Real Estate Taxes by Mortgage Status in Wright
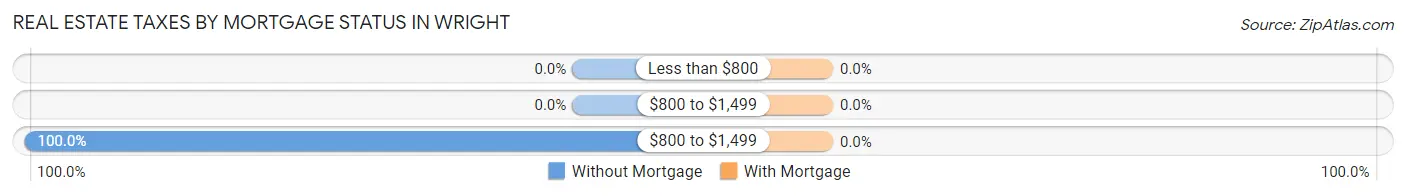
| Property Taxes | Without Mortgage | With Mortgage |
| Less than $800 | 0 (0.0%) | 0 (0.0%) |
| $800 to $1,499 | 0 (0.0%) | 0 (0.0%) |
| $800 to $1,499 | 16 (100.0%) | 0 (0.0%) |
| Total | 16 (100.0%) | 42 (100.0%) |
Health & Disability in Wright
Health Insurance Coverage by Age in Wright
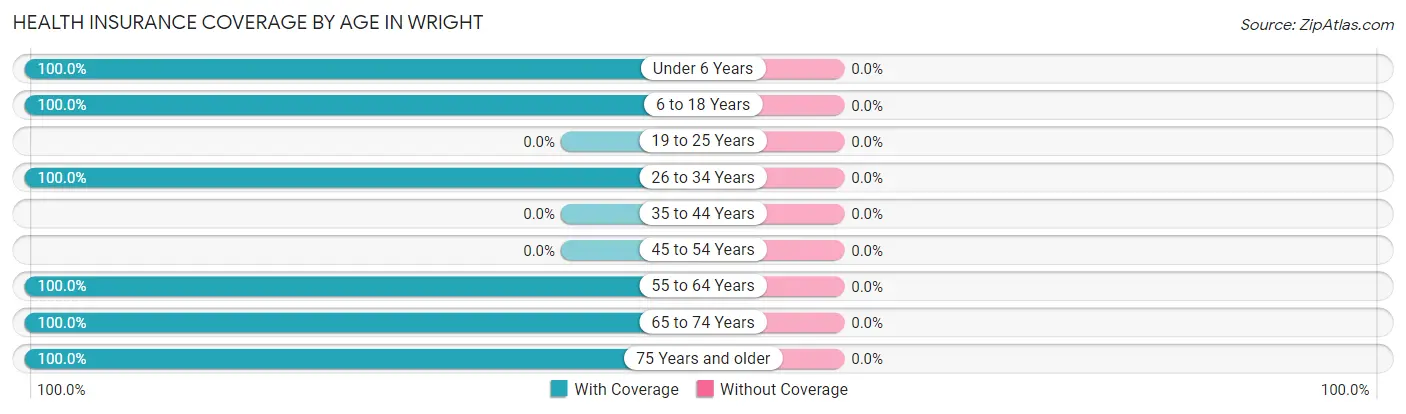
| Age Bracket | With Coverage | Without Coverage |
| Under 6 Years | 14 (100.0%) | 0 (0.0%) |
| 6 to 18 Years | 7 (100.0%) | 0 (0.0%) |
| 19 to 25 Years | 0 (0.0%) | 0 (0.0%) |
| 26 to 34 Years | 5 (100.0%) | 0 (0.0%) |
| 35 to 44 Years | 0 (0.0%) | 0 (0.0%) |
| 45 to 54 Years | 0 (0.0%) | 0 (0.0%) |
| 55 to 64 Years | 37 (100.0%) | 0 (0.0%) |
| 65 to 74 Years | 16 (100.0%) | 0 (0.0%) |
| 75 Years and older | 17 (100.0%) | 0 (0.0%) |
| Total | 96 (100.0%) | 0 (0.0%) |
Health Insurance Coverage by Citizenship Status in Wright

| Citizenship Status | With Coverage | Without Coverage |
| Native Born | 14 (100.0%) | 0 (0.0%) |
| Foreign Born, Citizen | 7 (100.0%) | 0 (0.0%) |
| Foreign Born, not a Citizen | 0 (0.0%) | 0 (0.0%) |
Health Insurance Coverage by Household Income in Wright
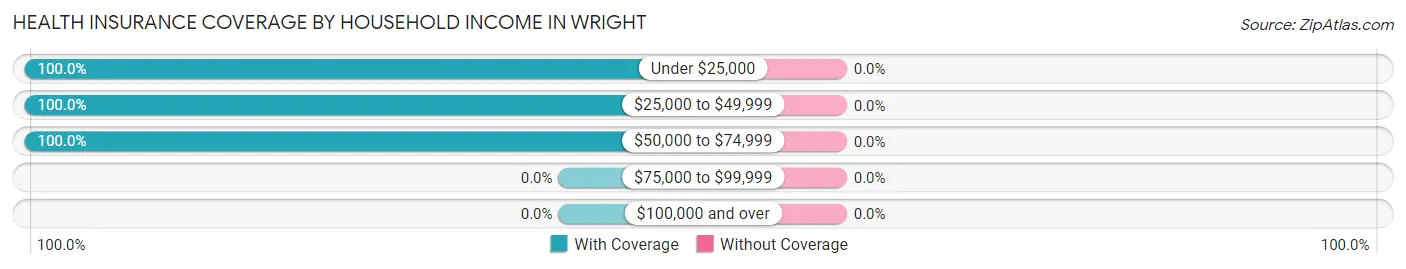
| Household Income | With Coverage | Without Coverage |
| Under $25,000 | 51 (100.0%) | 0 (0.0%) |
| $25,000 to $49,999 | 37 (100.0%) | 0 (0.0%) |
| $50,000 to $74,999 | 8 (100.0%) | 0 (0.0%) |
| $75,000 to $99,999 | 0 (0.0%) | 0 (0.0%) |
| $100,000 and over | 0 (0.0%) | 0 (0.0%) |
Public vs Private Health Insurance Coverage by Age in Wright
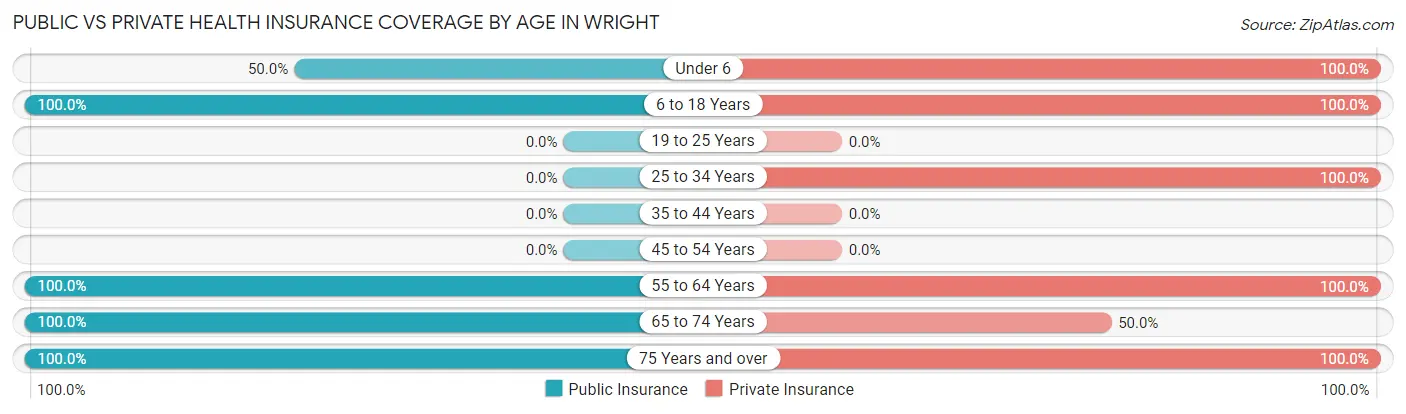
| Age Bracket | Public Insurance | Private Insurance |
| Under 6 | 7 (50.0%) | 14 (100.0%) |
| 6 to 18 Years | 7 (100.0%) | 7 (100.0%) |
| 19 to 25 Years | 0 (0.0%) | 0 (0.0%) |
| 25 to 34 Years | 0 (0.0%) | 5 (100.0%) |
| 35 to 44 Years | 0 (0.0%) | 0 (0.0%) |
| 45 to 54 Years | 0 (0.0%) | 0 (0.0%) |
| 55 to 64 Years | 37 (100.0%) | 37 (100.0%) |
| 65 to 74 Years | 16 (100.0%) | 8 (50.0%) |
| 75 Years and over | 17 (100.0%) | 17 (100.0%) |
| Total | 84 (87.5%) | 88 (91.7%) |
Disability Status by Sex by Age in Wright
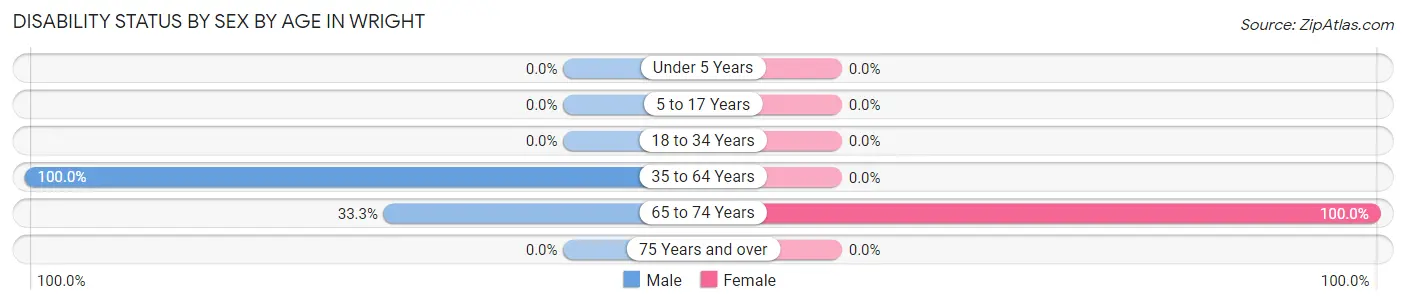
| Age Bracket | Male | Female |
| Under 5 Years | 0 (0.0%) | 0 (0.0%) |
| 5 to 17 Years | 0 (0.0%) | 0 (0.0%) |
| 18 to 34 Years | 0 (0.0%) | 0 (0.0%) |
| 35 to 64 Years | 37 (100.0%) | 0 (0.0%) |
| 65 to 74 Years | 4 (33.3%) | 4 (100.0%) |
| 75 Years and over | 0 (0.0%) | 0 (0.0%) |
Disability Class by Sex by Age in Wright
Disability Class: Hearing Difficulty
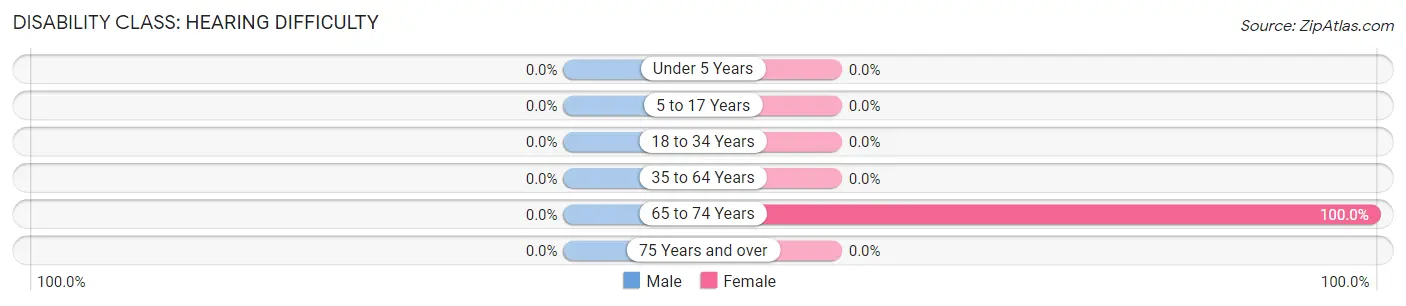
| Age Bracket | Male | Female |
| Under 5 Years | 0 (0.0%) | 0 (0.0%) |
| 5 to 17 Years | 0 (0.0%) | 0 (0.0%) |
| 18 to 34 Years | 0 (0.0%) | 0 (0.0%) |
| 35 to 64 Years | 0 (0.0%) | 0 (0.0%) |
| 65 to 74 Years | 0 (0.0%) | 4 (100.0%) |
| 75 Years and over | 0 (0.0%) | 0 (0.0%) |
Disability Class: Vision Difficulty
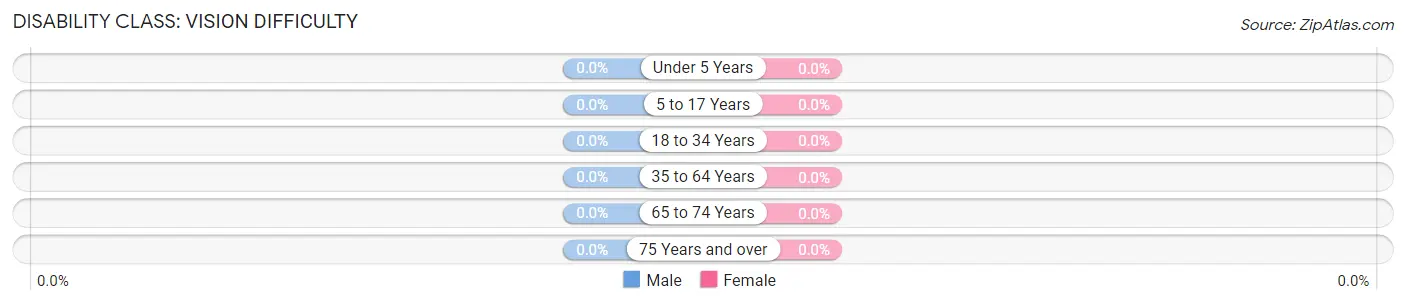
| Age Bracket | Male | Female |
| Under 5 Years | 0 (0.0%) | 0 (0.0%) |
| 5 to 17 Years | 0 (0.0%) | 0 (0.0%) |
| 18 to 34 Years | 0 (0.0%) | 0 (0.0%) |
| 35 to 64 Years | 0 (0.0%) | 0 (0.0%) |
| 65 to 74 Years | 0 (0.0%) | 0 (0.0%) |
| 75 Years and over | 0 (0.0%) | 0 (0.0%) |
Disability Class: Cognitive Difficulty
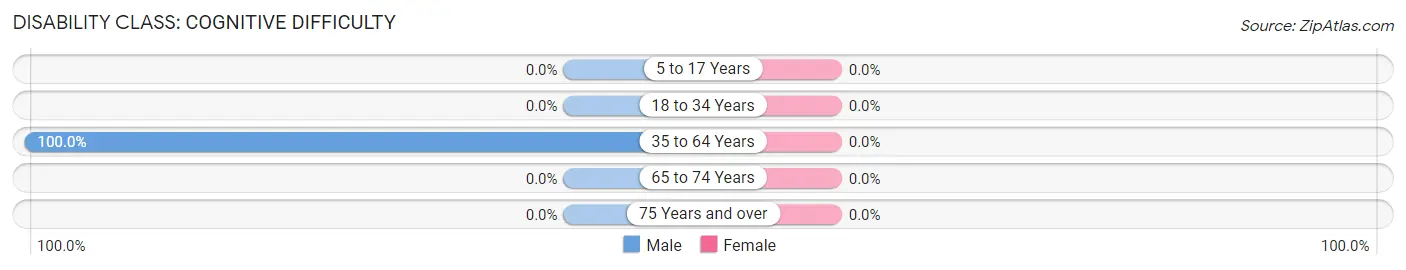
| Age Bracket | Male | Female |
| 5 to 17 Years | 0 (0.0%) | 0 (0.0%) |
| 18 to 34 Years | 0 (0.0%) | 0 (0.0%) |
| 35 to 64 Years | 37 (100.0%) | 0 (0.0%) |
| 65 to 74 Years | 0 (0.0%) | 0 (0.0%) |
| 75 Years and over | 0 (0.0%) | 0 (0.0%) |
Disability Class: Ambulatory Difficulty
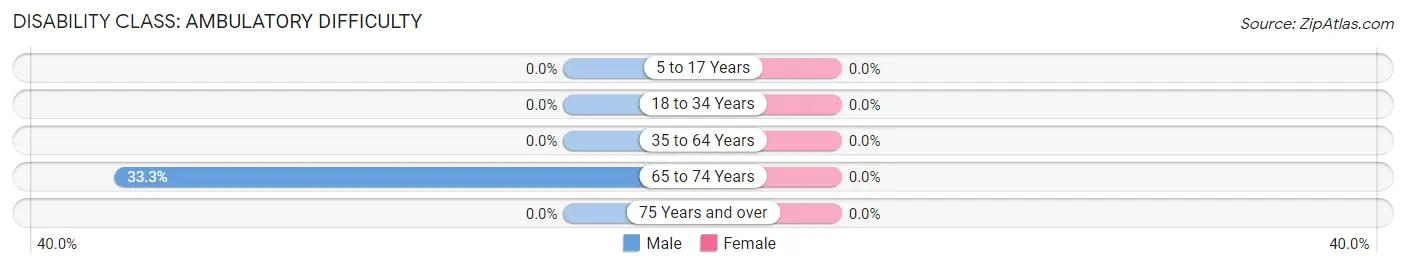
| Age Bracket | Male | Female |
| 5 to 17 Years | 0 (0.0%) | 0 (0.0%) |
| 18 to 34 Years | 0 (0.0%) | 0 (0.0%) |
| 35 to 64 Years | 0 (0.0%) | 0 (0.0%) |
| 65 to 74 Years | 4 (33.3%) | 0 (0.0%) |
| 75 Years and over | 0 (0.0%) | 0 (0.0%) |
Disability Class: Self-Care Difficulty
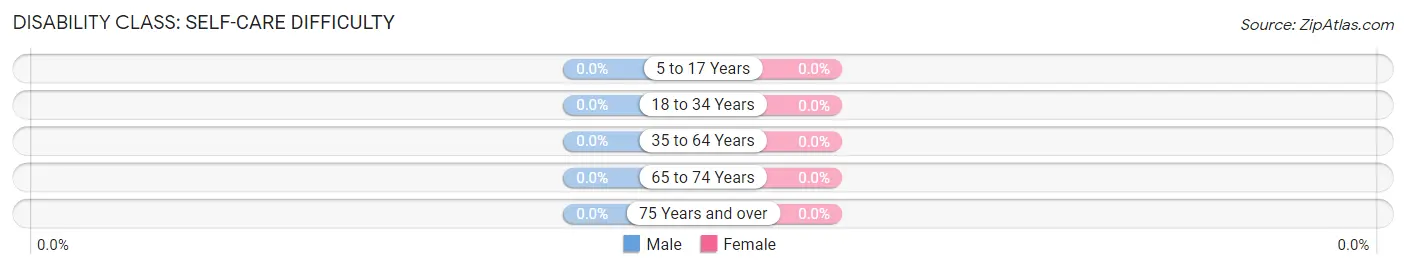
| Age Bracket | Male | Female |
| 5 to 17 Years | 0 (0.0%) | 0 (0.0%) |
| 18 to 34 Years | 0 (0.0%) | 0 (0.0%) |
| 35 to 64 Years | 0 (0.0%) | 0 (0.0%) |
| 65 to 74 Years | 0 (0.0%) | 0 (0.0%) |
| 75 Years and over | 0 (0.0%) | 0 (0.0%) |
Technology Access in Wright
Computing Device Access in Wright
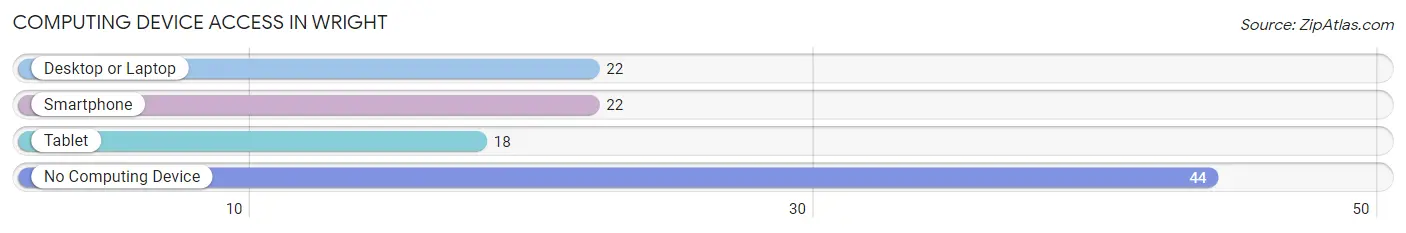
| Device Type | # Households | % Households |
| Desktop or Laptop | 22 | 33.3% |
| Smartphone | 22 | 33.3% |
| Tablet | 18 | 27.3% |
| No Computing Device | 44 | 66.7% |
| Total | 66 | 100.0% |
Internet Access in Wright
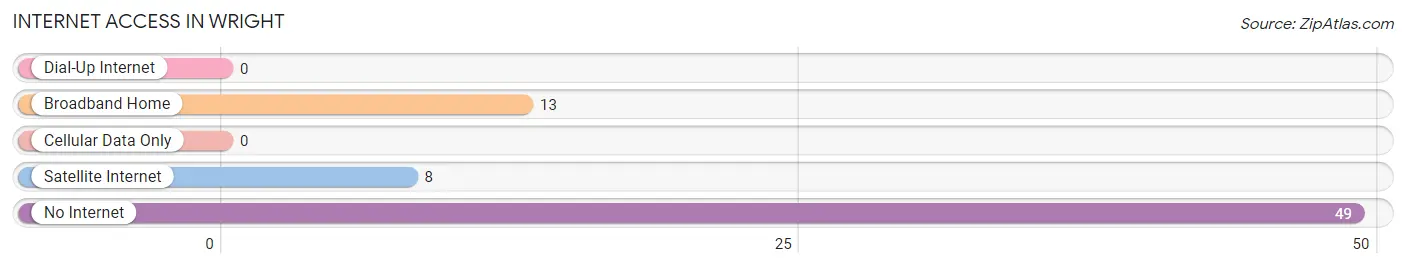
| Internet Type | # Households | % Households |
| Dial-Up Internet | 0 | 0.0% |
| Broadband Home | 13 | 19.7% |
| Cellular Data Only | 0 | 0.0% |
| Satellite Internet | 8 | 12.1% |
| No Internet | 49 | 74.2% |
| Total | 66 | 100.0% |
Wright Summary
Wright, Kansas is a small town located in the northeastern corner of the state, in the county of Clay. It is situated on the banks of the Republican River, and is surrounded by rolling hills and farmland. The town was founded in 1887, and has a population of just over 500 people.
Geography
Wright is located in the northeastern corner of Kansas, in Clay County. It is situated on the banks of the Republican River, and is surrounded by rolling hills and farmland. The town is located at an elevation of 1,068 feet above sea level. The climate in Wright is characterized by hot, humid summers and cold, dry winters. The average annual temperature is around 54 degrees Fahrenheit, and the average annual precipitation is around 28 inches.
Economy
The economy of Wright is largely based on agriculture. The town is home to several farms, which produce a variety of crops, including corn, wheat, soybeans, and hay. The town also has a few small businesses, including a grocery store, a hardware store, and a few restaurants.
Demographics
As of the 2010 census, the population of Wright was 514 people. The racial makeup of the town was 97.3% White, 0.6% African American, 0.2% Native American, 0.2% Asian, 0.2% from other races, and 1.6% from two or more races. The median household income was $41,250, and the median family income was $50,625. The per capita income was $19,945.
History
Wright was founded in 1887 by a group of settlers from Iowa. The town was named after the Wright family, who were among the first settlers. The town grew slowly, and by the early 1900s, it had a population of around 200 people. The town was incorporated in 1910, and the population continued to grow, reaching a peak of around 500 people in the 1950s.
In the late 20th century, the population of Wright began to decline, as many of the town's residents moved away in search of better job opportunities. Today, the town is home to just over 500 people, and the economy is largely based on agriculture. Despite its small size, Wright is a vibrant community, with a strong sense of community and pride.
Common Questions
What is Per Capita Income in Wright?
Per Capita income in Wright is $21,395.
What is the Median Family Income in Wright?
Median Family Income in Wright is $18,500.
What is the Median Household income in Wright?
Median Household Income in Wright is $30,811.
What is Inequality or Gini Index in Wright?
Inequality or Gini Index in Wright is 0.22.
What is the Total Population of Wright?
Total Population of Wright is 96.
What is the Total Male Population of Wright?
Total Male Population of Wright is 68.
What is the Total Female Population of Wright?
Total Female Population of Wright is 28.
What is the Ratio of Males per 100 Females in Wright?
There are 242.86 Males per 100 Females in Wright.
What is the Ratio of Females per 100 Males in Wright?
There are 41.18 Females per 100 Males in Wright.
What is the Median Population Age in Wright?
Median Population Age in Wright is 64.6 Years.
What is the Average Family Size in Wright
Average Family Size in Wright is 3.1 People.
What is the Average Household Size in Wright
Average Household Size in Wright is 1.4 People.
How Large is the Labor Force in Wright?
There are 17 People in the Labor Forcein in Wright.
What is the Percentage of People in the Labor Force in Wright?
22.7% of People are in the Labor Force in Wright.