Cities with the Highest Percentage of Population Employed in Education, Arts & Media in Utah
RELATED REPORTS & OPTIONS
Education, Arts & Media
Utah
Compare Cities
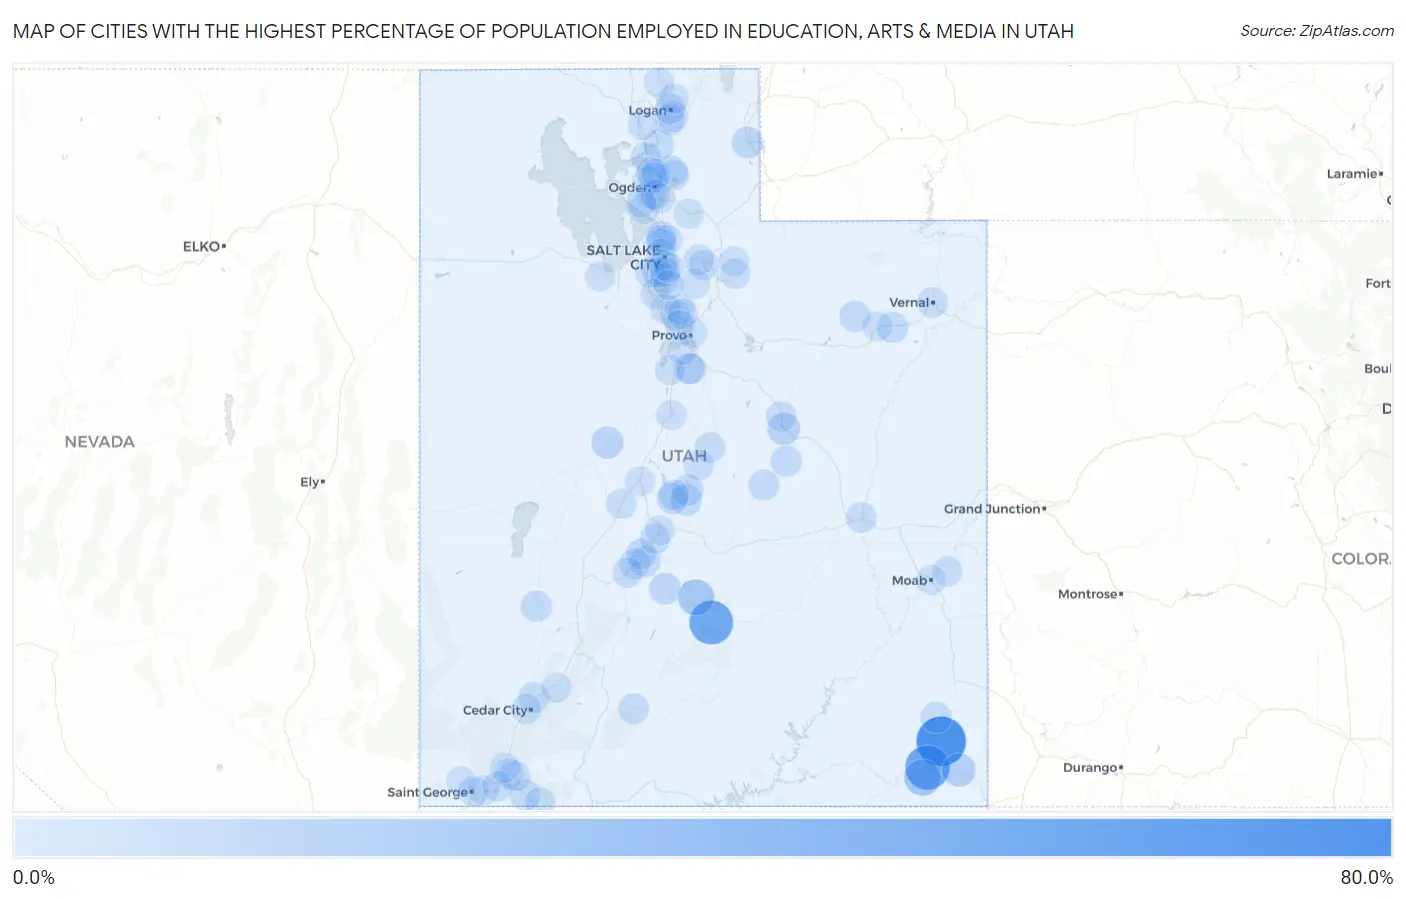
Map of Cities with the Highest Percentage of Population Employed in Education, Arts & Media in Utah
0.0%
80.0%
Cities with the Highest Percentage of Population Employed in Education, Arts & Media in Utah
| City | % Employed | vs State | vs National | |
| 1. | White Mesa | 65.4% | 1.5%(+63.9)#1 | 1.8%(+63.6)#29 |
| 2. | Bluff | 48.1% | 1.5%(+46.7)#2 | 1.8%(+46.4)#48 |
| 3. | Teasdale | 45.9% | 1.5%(+44.4)#3 | 1.8%(+44.1)#55 |
| 4. | Tselakai Dezza | 21.1% | 1.5%(+19.6)#4 | 1.8%(+19.3)#191 |
| 5. | Fremont | 20.0% | 1.5%(+18.5)#5 | 1.8%(+18.2)#216 |
| 6. | Montezuma Creek | 11.9% | 1.5%(+10.5)#6 | 1.8%(+10.2)#482 |
| 7. | West Wood | 9.6% | 1.5%(+8.11)#7 | 1.8%(+7.80)#684 |
| 8. | Lynndyl | 8.0% | 1.5%(+6.52)#8 | 1.8%(+6.21)#977 |
| 9. | Woodruff | 6.8% | 1.5%(+5.34)#9 | 1.8%(+5.03)#1,296 |
| 10. | Koosharem | 6.8% | 1.5%(+5.28)#10 | 1.8%(+4.97)#1,317 |
| 11. | Mayfield | 6.3% | 1.5%(+4.81)#11 | 1.8%(+4.50)#1,516 |
| 12. | Wolf Creek | 6.1% | 1.5%(+4.61)#12 | 1.8%(+4.30)#1,606 |
| 13. | Sterling | 5.6% | 1.5%(+4.08)#13 | 1.8%(+3.77)#1,862 |
| 14. | Centerfield | 5.4% | 1.5%(+3.88)#14 | 1.8%(+3.57)#1,991 |
| 15. | Bluebell | 5.3% | 1.5%(+3.83)#15 | 1.8%(+3.52)#2,017 |
| 16. | Milford | 5.3% | 1.5%(+3.82)#16 | 1.8%(+3.51)#2,021 |
| 17. | Annabella | 5.2% | 1.5%(+3.75)#17 | 1.8%(+3.44)#2,076 |
| 18. | Fort Duchesne | 5.2% | 1.5%(+3.71)#18 | 1.8%(+3.40)#2,106 |
| 19. | Elmo | 5.0% | 1.5%(+3.56)#19 | 1.8%(+3.25)#2,227 |
| 20. | Blanding | 4.9% | 1.5%(+3.46)#20 | 1.8%(+3.15)#2,308 |
| 21. | Apple Valley | 4.8% | 1.5%(+3.34)#21 | 1.8%(+3.03)#2,416 |
| 22. | Mantua | 4.6% | 1.5%(+3.16)#22 | 1.8%(+2.85)#2,593 |
| 23. | Enoch | 4.6% | 1.5%(+3.09)#23 | 1.8%(+2.78)#2,660 |
| 24. | Castle Dale | 4.5% | 1.5%(+3.07)#24 | 1.8%(+2.76)#2,679 |
| 25. | Eden | 4.0% | 1.5%(+2.50)#25 | 1.8%(+2.19)#3,356 |
| 26. | Millville | 3.9% | 1.5%(+2.47)#26 | 1.8%(+2.16)#3,404 |
| 27. | Elsinore | 3.7% | 1.5%(+2.20)#27 | 1.8%(+1.89)#3,821 |
| 28. | Bryce Canyon City | 3.5% | 1.5%(+1.99)#28 | 1.8%(+1.68)#4,193 |
| 29. | Elk Ridge | 3.4% | 1.5%(+1.90)#29 | 1.8%(+1.59)#4,374 |
| 30. | Green River | 3.3% | 1.5%(+1.83)#30 | 1.8%(+1.52)#4,506 |
| 31. | Gunnison | 3.3% | 1.5%(+1.81)#31 | 1.8%(+1.50)#4,556 |
| 32. | Vernal | 3.3% | 1.5%(+1.81)#32 | 1.8%(+1.50)#4,557 |
| 33. | Richfield | 3.3% | 1.5%(+1.80)#33 | 1.8%(+1.49)#4,576 |
| 34. | Willard | 3.2% | 1.5%(+1.70)#34 | 1.8%(+1.39)#4,773 |
| 35. | Spring City | 3.2% | 1.5%(+1.69)#35 | 1.8%(+1.38)#4,827 |
| 36. | Sigurd | 3.1% | 1.5%(+1.59)#36 | 1.8%(+1.28)#5,051 |
| 37. | Helper | 2.8% | 1.5%(+1.31)#37 | 1.8%(+1.00)#5,884 |
| 38. | Ephraim | 2.7% | 1.5%(+1.27)#38 | 1.8%(+0.959)#6,011 |
| 39. | Woodland Hills | 2.7% | 1.5%(+1.21)#39 | 1.8%(+0.899)#6,214 |
| 40. | Nibley | 2.7% | 1.5%(+1.21)#40 | 1.8%(+0.896)#6,227 |
| 41. | Virgin | 2.6% | 1.5%(+1.16)#41 | 1.8%(+0.846)#6,403 |
| 42. | Snyderville | 2.6% | 1.5%(+1.13)#42 | 1.8%(+0.820)#6,493 |
| 43. | Marriott Slaterville | 2.6% | 1.5%(+1.09)#43 | 1.8%(+0.783)#6,632 |
| 44. | West Bountiful | 2.5% | 1.5%(+1.04)#44 | 1.8%(+0.727)#6,851 |
| 45. | Pleasant View | 2.4% | 1.5%(+0.920)#45 | 1.8%(+0.610)#7,278 |
| 46. | Holden | 2.4% | 1.5%(+0.905)#46 | 1.8%(+0.595)#7,327 |
| 47. | Riverdale | 2.4% | 1.5%(+0.888)#47 | 1.8%(+0.579)#7,396 |
| 48. | Morgan | 2.4% | 1.5%(+0.887)#48 | 1.8%(+0.577)#7,402 |
| 49. | Kamas | 2.3% | 1.5%(+0.844)#49 | 1.8%(+0.534)#7,572 |
| 50. | Harrisville | 2.3% | 1.5%(+0.784)#50 | 1.8%(+0.474)#7,834 |
| 51. | Joseph | 2.2% | 1.5%(+0.771)#51 | 1.8%(+0.461)#7,902 |
| 52. | Riverton | 2.2% | 1.5%(+0.700)#52 | 1.8%(+0.390)#8,215 |
| 53. | Summit Park | 2.2% | 1.5%(+0.676)#53 | 1.8%(+0.366)#8,326 |
| 54. | Kearns | 2.1% | 1.5%(+0.670)#54 | 1.8%(+0.360)#8,359 |
| 55. | Logan | 2.1% | 1.5%(+0.670)#55 | 1.8%(+0.360)#8,361 |
| 56. | Castle Valley | 2.1% | 1.5%(+0.663)#56 | 1.8%(+0.353)#8,390 |
| 57. | White | 2.1% | 1.5%(+0.634)#57 | 1.8%(+0.324)#8,508 |
| 58. | Cedar City | 2.1% | 1.5%(+0.579)#58 | 1.8%(+0.269)#8,783 |
| 59. | Ivins | 2.0% | 1.5%(+0.566)#59 | 1.8%(+0.256)#8,860 |
| 60. | Hildale | 2.0% | 1.5%(+0.549)#60 | 1.8%(+0.239)#8,966 |
| 61. | Trenton | 2.0% | 1.5%(+0.524)#61 | 1.8%(+0.214)#9,094 |
| 62. | North Salt Lake | 2.0% | 1.5%(+0.517)#62 | 1.8%(+0.208)#9,121 |
| 63. | Scipio | 2.0% | 1.5%(+0.514)#63 | 1.8%(+0.204)#9,140 |
| 64. | Syracuse | 2.0% | 1.5%(+0.497)#64 | 1.8%(+0.188)#9,212 |
| 65. | Bountiful | 2.0% | 1.5%(+0.491)#65 | 1.8%(+0.181)#9,253 |
| 66. | Oakley | 2.0% | 1.5%(+0.482)#66 | 1.8%(+0.172)#9,315 |
| 67. | Salt Lake City | 1.9% | 1.5%(+0.463)#67 | 1.8%(+0.153)#9,393 |
| 68. | Provo | 1.9% | 1.5%(+0.429)#68 | 1.8%(+0.119)#9,582 |
| 69. | Lehi | 1.9% | 1.5%(+0.428)#69 | 1.8%(+0.118)#9,593 |
| 70. | Genola | 1.9% | 1.5%(+0.408)#70 | 1.8%(+0.098)#9,699 |
| 71. | Washington Terrace | 1.9% | 1.5%(+0.398)#71 | 1.8%(+0.088)#9,749 |
| 72. | Midvale | 1.9% | 1.5%(+0.395)#72 | 1.8%(+0.085)#9,762 |
| 73. | Grantsville | 1.9% | 1.5%(+0.387)#73 | 1.8%(+0.078)#9,805 |
| 74. | Lake Shore | 1.9% | 1.5%(+0.383)#74 | 1.8%(+0.073)#9,833 |
| 75. | American Fork | 1.9% | 1.5%(+0.380)#75 | 1.8%(+0.070)#9,854 |
| 76. | Alta | 1.8% | 1.5%(+0.358)#76 | 1.8%(+0.049)#9,994 |
| 77. | Moab | 1.8% | 1.5%(+0.333)#77 | 1.8%(+0.024)#10,138 |
| 78. | Uintah | 1.8% | 1.5%(+0.309)#78 | 1.8%(-0.000)#10,278 |
| 79. | Washington | 1.8% | 1.5%(+0.308)#79 | 1.8%(-0.002)#10,292 |
| 80. | Nephi | 1.8% | 1.5%(+0.306)#80 | 1.8%(-0.004)#10,307 |
| 81. | Cedar Hills | 1.8% | 1.5%(+0.300)#81 | 1.8%(-0.010)#10,338 |
| 82. | West Point | 1.8% | 1.5%(+0.292)#82 | 1.8%(-0.017)#10,384 |
| 83. | Pleasant Grove | 1.7% | 1.5%(+0.252)#83 | 1.8%(-0.058)#10,623 |
| 84. | Honeyville | 1.7% | 1.5%(+0.250)#84 | 1.8%(-0.059)#10,631 |
| 85. | La Verkin | 1.7% | 1.5%(+0.211)#85 | 1.8%(-0.099)#10,841 |
| 86. | Woods Cross | 1.7% | 1.5%(+0.196)#86 | 1.8%(-0.113)#10,939 |
| 87. | Vineyard | 1.7% | 1.5%(+0.192)#87 | 1.8%(-0.118)#10,968 |
| 88. | St George | 1.7% | 1.5%(+0.187)#88 | 1.8%(-0.123)#11,003 |
| 89. | Murray | 1.7% | 1.5%(+0.180)#89 | 1.8%(-0.130)#11,041 |
| 90. | Taylorsville | 1.7% | 1.5%(+0.178)#90 | 1.8%(-0.132)#11,051 |
| 91. | Aurora | 1.6% | 1.5%(+0.170)#91 | 1.8%(-0.140)#11,108 |
| 92. | South Salt Lake | 1.6% | 1.5%(+0.169)#92 | 1.8%(-0.140)#11,111 |
| 93. | Toquerville | 1.6% | 1.5%(+0.158)#93 | 1.8%(-0.152)#11,188 |
| 94. | Parowan | 1.6% | 1.5%(+0.117)#94 | 1.8%(-0.193)#11,481 |
| 95. | Roosevelt | 1.6% | 1.5%(+0.110)#95 | 1.8%(-0.200)#11,533 |
| 96. | Sandy | 1.6% | 1.5%(+0.102)#96 | 1.8%(-0.208)#11,580 |
| 97. | Millcreek | 1.6% | 1.5%(+0.075)#97 | 1.8%(-0.235)#11,735 |
| 98. | North Ogden | 1.5% | 1.5%(+0.070)#98 | 1.8%(-0.239)#11,767 |
| 99. | Hyde Park | 1.5% | 1.5%(+0.068)#99 | 1.8%(-0.241)#11,781 |
| 100. | Hurricane | 1.5% | 1.5%(+0.054)#100 | 1.8%(-0.256)#11,869 |
Common Questions
What are the Top 10 Cities with the Highest Percentage of Population Employed in Education, Arts & Media in Utah?
Top 10 Cities with the Highest Percentage of Population Employed in Education, Arts & Media in Utah are:
#1
65.4%
#2
48.1%
#3
45.9%
#4
21.1%
#5
20.0%
#6
11.9%
#7
9.6%
#8
8.0%
#9
6.8%
#10
6.8%
What city has the Highest Percentage of Population Employed in Education, Arts & Media in Utah?
White Mesa has the Highest Percentage of Population Employed in Education, Arts & Media in Utah with 65.4%.
What is the Percentage of Population Employed in Education, Arts & Media in the State of Utah?
Percentage of Population Employed in Education, Arts & Media in Utah is 1.5%.
What is the Percentage of Population Employed in Education, Arts & Media in the United States?
Percentage of Population Employed in Education, Arts & Media in the United States is 1.8%.