Heron, MT Map & Demographics
Heron Map
Heron Overview
$18,754
PER CAPITA INCOME
$29,474
AVG FAMILY INCOME
$29,901
AVG HOUSEHOLD INCOME
$6,990
FAMILY INCOME DEFICIT
0.41
INEQUALITY / GINI INDEX
299
TOTAL POPULATION
137
MALE POPULATION
162
FEMALE POPULATION
84.57
MALES / 100 FEMALES
118.25
FEMALES / 100 MALES
31.8
MEDIAN AGE
3.3
AVG FAMILY SIZE
3.0
AVG HOUSEHOLD SIZE
80
LABOR FORCE [ PEOPLE ]
37.6%
PERCENT IN LABOR FORCE
Heron Zip Codes
Heron Area Codes
Income in Heron
Income Overview in Heron
Per Capita Income in Heron is $18,754, while median incomes of families and households are $29,474 and $29,901 respectively.
| Characteristic | Number | Measure |
| Per Capita Income | 299 | $18,754 |
| Median Family Income | 86 | $29,474 |
| Mean Family Income | 86 | $47,519 |
| Median Household Income | 99 | $29,901 |
| Mean Household Income | 99 | $54,754 |
| Income Deficit | 86 | $6,990 |
| Wage / Income Gap (%) | 299 | 0.00% |
| Wage / Income Gap ($) | 299 | 100.00¢ per $1 |
| Gini / Inequality Index | 299 | 0.41 |
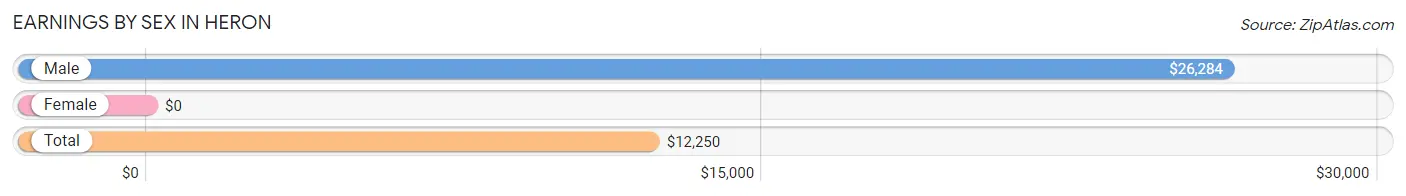
Earnings by Sex in Heron
| Sex | Number | Average Earnings |
| Male | 68 (51.1%) | $26,284 |
| Female | 65 (48.9%) | $0 |
| Total | 133 (100.0%) | $12,250 |
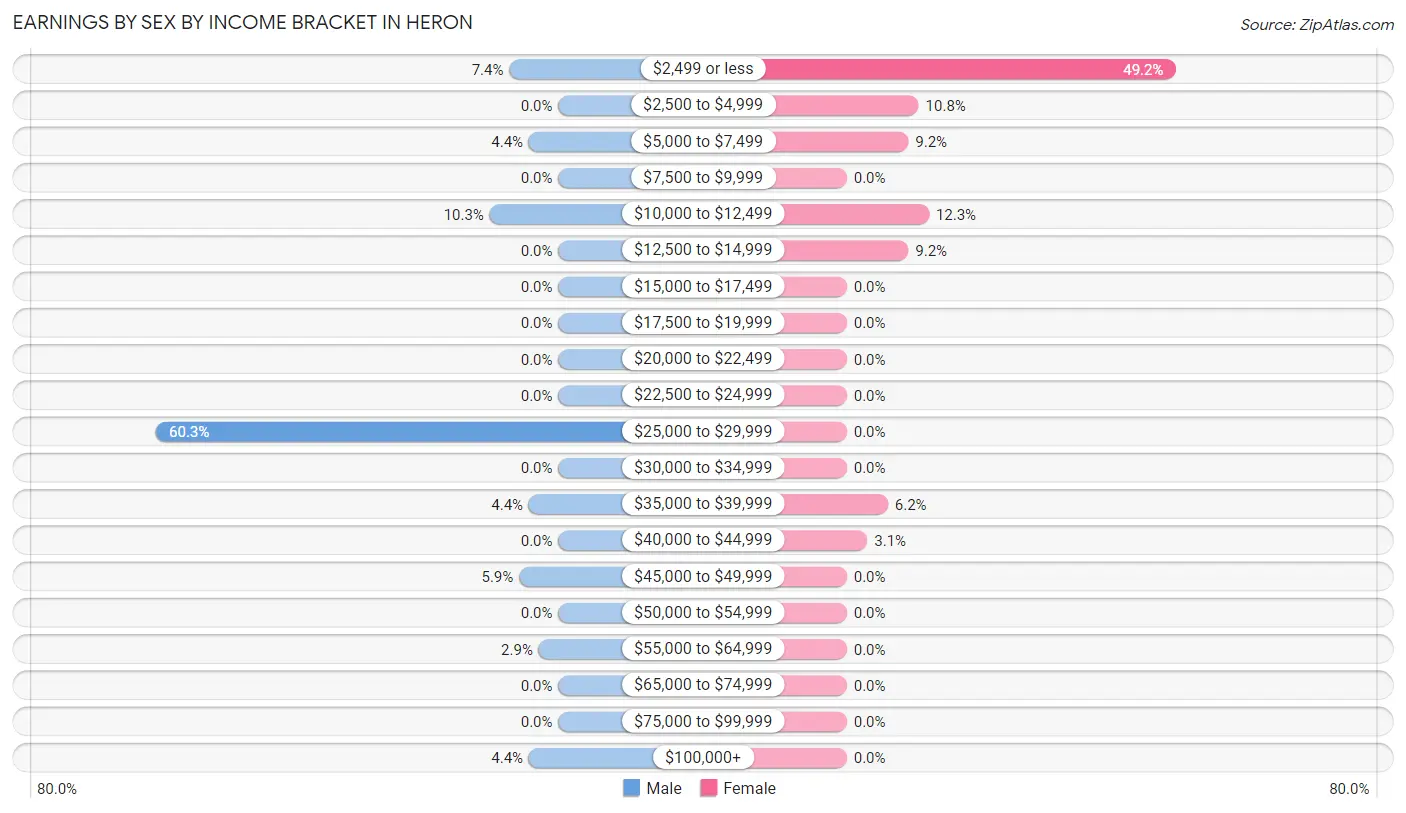
Earnings by Sex by Income Bracket in Heron
The most common earnings brackets in Heron are $25,000 to $29,999 for men (41 | 60.3%) and $2,499 or less for women (32 | 49.2%).
| Income | Male | Female |
| $2,499 or less | 5 (7.3%) | 32 (49.2%) |
| $2,500 to $4,999 | 0 (0.0%) | 7 (10.8%) |
| $5,000 to $7,499 | 3 (4.4%) | 6 (9.2%) |
| $7,500 to $9,999 | 0 (0.0%) | 0 (0.0%) |
| $10,000 to $12,499 | 7 (10.3%) | 8 (12.3%) |
| $12,500 to $14,999 | 0 (0.0%) | 6 (9.2%) |
| $15,000 to $17,499 | 0 (0.0%) | 0 (0.0%) |
| $17,500 to $19,999 | 0 (0.0%) | 0 (0.0%) |
| $20,000 to $22,499 | 0 (0.0%) | 0 (0.0%) |
| $22,500 to $24,999 | 0 (0.0%) | 0 (0.0%) |
| $25,000 to $29,999 | 41 (60.3%) | 0 (0.0%) |
| $30,000 to $34,999 | 0 (0.0%) | 0 (0.0%) |
| $35,000 to $39,999 | 3 (4.4%) | 4 (6.1%) |
| $40,000 to $44,999 | 0 (0.0%) | 2 (3.1%) |
| $45,000 to $49,999 | 4 (5.9%) | 0 (0.0%) |
| $50,000 to $54,999 | 0 (0.0%) | 0 (0.0%) |
| $55,000 to $64,999 | 2 (2.9%) | 0 (0.0%) |
| $65,000 to $74,999 | 0 (0.0%) | 0 (0.0%) |
| $75,000 to $99,999 | 0 (0.0%) | 0 (0.0%) |
| $100,000+ | 3 (4.4%) | 0 (0.0%) |
| Total | 68 (100.0%) | 65 (100.0%) |
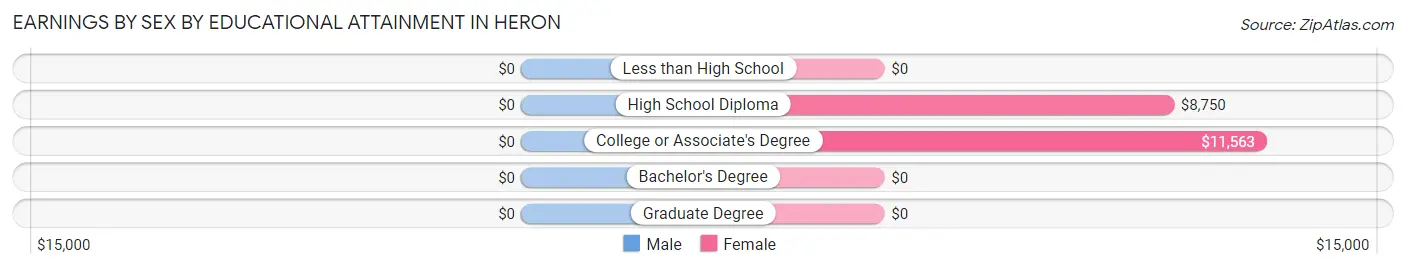
Earnings by Sex by Educational Attainment in Heron
| Educational Attainment | Male Income | Female Income |
| Less than High School | - | - |
| High School Diploma | - | - |
| College or Associate's Degree | - | - |
| Bachelor's Degree | - | - |
| Graduate Degree | - | - |
| Total | $26,284 | $0 |
Family Income in Heron
Family Income Brackets in Heron
According to the Heron family income data, there are 41 families falling into the $25,000 to $34,999 income range, which is the most common income bracket and makes up 47.7% of all families.
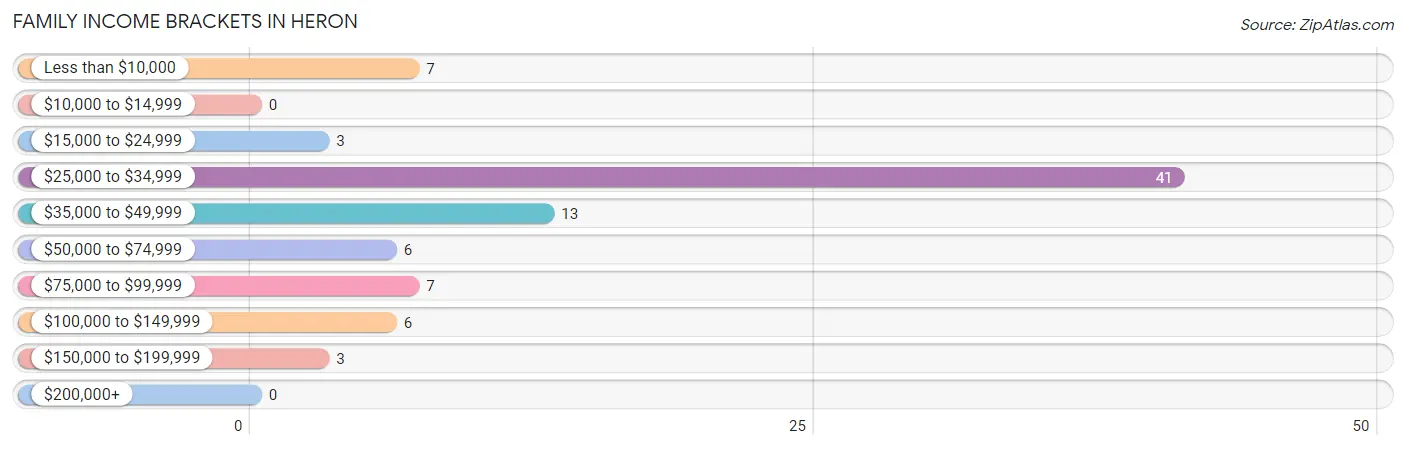
| Income Bracket | # Families | % Families |
| Less than $10,000 | 7 | 8.1% |
| $10,000 to $14,999 | 0 | 0.0% |
| $15,000 to $24,999 | 3 | 3.5% |
| $25,000 to $34,999 | 41 | 47.7% |
| $35,000 to $49,999 | 13 | 15.1% |
| $50,000 to $74,999 | 6 | 7.0% |
| $75,000 to $99,999 | 7 | 8.1% |
| $100,000 to $149,999 | 6 | 7.0% |
| $150,000 to $199,999 | 3 | 3.5% |
| $200,000+ | 0 | 0.0% |
Family Income by Famaliy Size in Heron
2-person families (49 | 57.0%) account for the highest median family income in Heron with $41,563 per family, while 2-person families (49 | 57.0%) have the highest median income of $20,782 per family member.
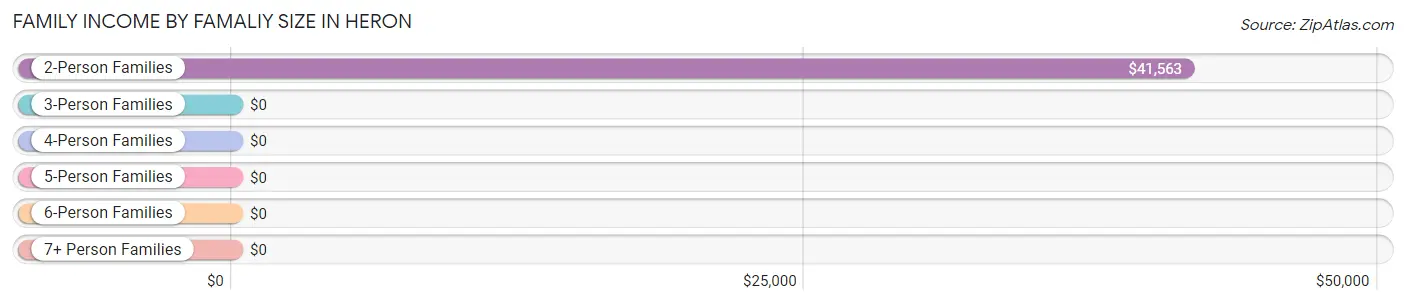
| Income Bracket | # Families | Median Income |
| 2-Person Families | 49 (57.0%) | $41,563 |
| 3-Person Families | 8 (9.3%) | $0 |
| 4-Person Families | 0 (0.0%) | $0 |
| 5-Person Families | 29 (33.7%) | $0 |
| 6-Person Families | 0 (0.0%) | $0 |
| 7+ Person Families | 0 (0.0%) | $0 |
| Total | 86 (100.0%) | $29,474 |
Family Income by Number of Earners in Heron
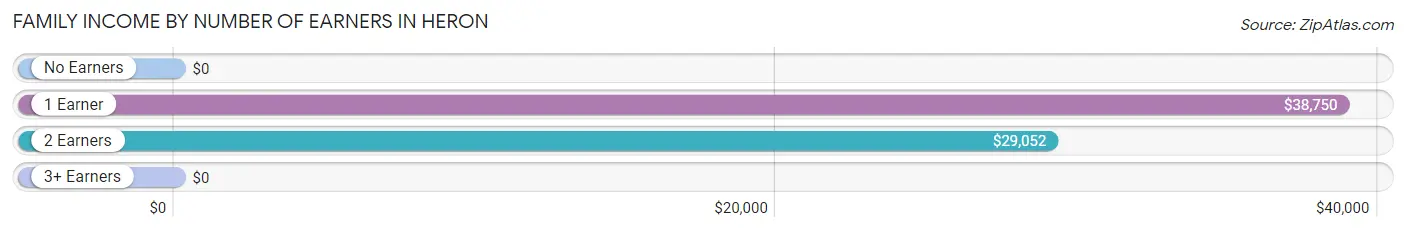
| Number of Earners | # Families | Median Income |
| No Earners | 7 (8.1%) | $0 |
| 1 Earner | 34 (39.5%) | $38,750 |
| 2 Earners | 42 (48.8%) | $29,052 |
| 3+ Earners | 3 (3.5%) | $0 |
| Total | 86 (100.0%) | $29,474 |
Household Income in Heron
Household Income Brackets in Heron
With 41 households falling in the category, the $25,000 to $34,999 income range is the most frequent in Heron, accounting for 41.4% of all households.
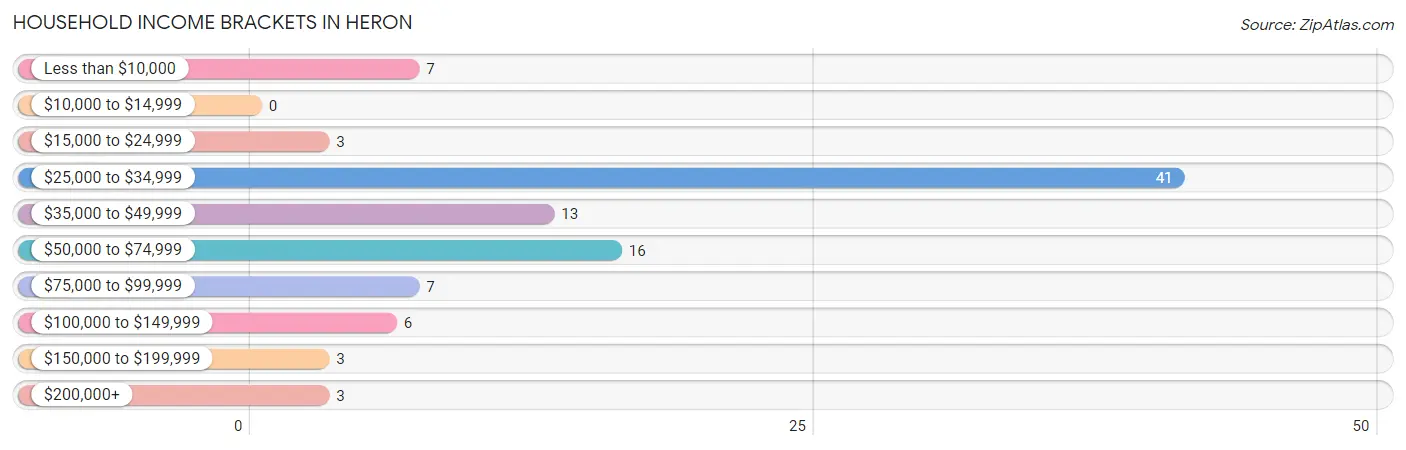
| Income Bracket | # Households | % Households |
| Less than $10,000 | 7 | 7.1% |
| $10,000 to $14,999 | 0 | 0.0% |
| $15,000 to $24,999 | 3 | 3.0% |
| $25,000 to $34,999 | 41 | 41.4% |
| $35,000 to $49,999 | 13 | 13.1% |
| $50,000 to $74,999 | 16 | 16.2% |
| $75,000 to $99,999 | 7 | 7.1% |
| $100,000 to $149,999 | 6 | 6.1% |
| $150,000 to $199,999 | 3 | 3.0% |
| $200,000+ | 3 | 3.0% |
Household Income by Householder Age in Heron
The median household income in Heron is $29,901, with the highest median household income of $63,438 found in the 65+ years age bracket for the primary householder. A total of 40 households (40.4%) fall into this category.
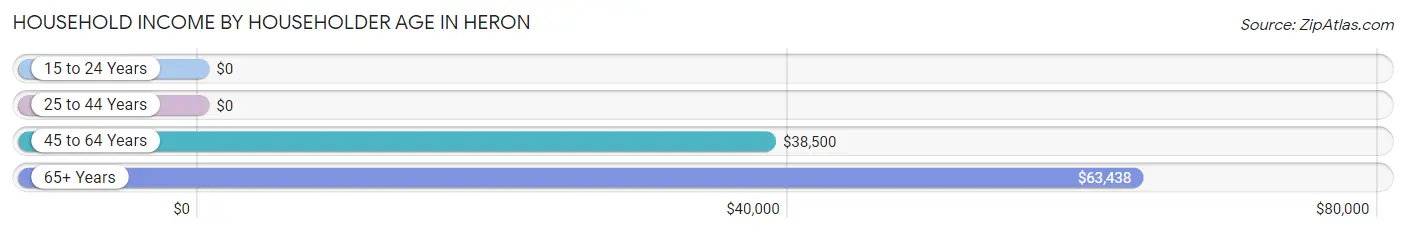
| Income Bracket | # Households | Median Income |
| 15 to 24 Years | 0 (0.0%) | $0 |
| 25 to 44 Years | 31 (31.3%) | $0 |
| 45 to 64 Years | 28 (28.3%) | $38,500 |
| 65+ Years | 40 (40.4%) | $63,438 |
| Total | 99 (100.0%) | $29,901 |
Poverty in Heron
Income Below Poverty by Sex and Age in Heron
With 67.9% poverty level for males and 60.5% for females among the residents of Heron, under 5 year old males and under 5 year old females are the most vulnerable to poverty, with 33 males (100.0%) and 27 females (100.0%) in their respective age groups living below the poverty level.
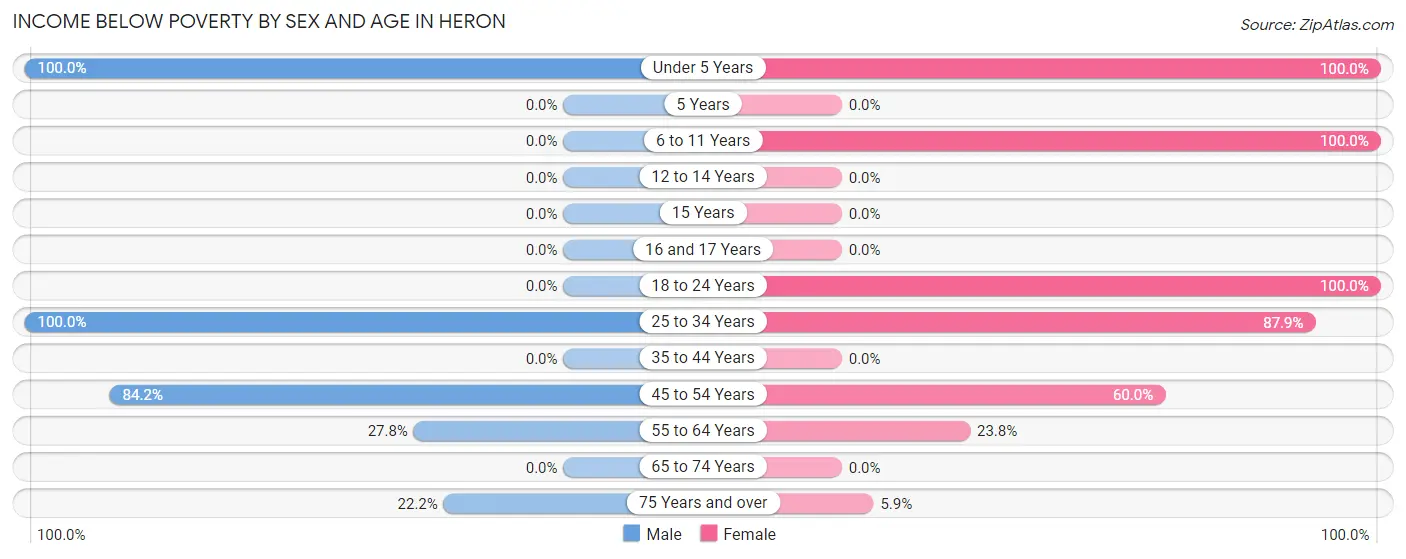
| Age Bracket | Male | Female |
| Under 5 Years | 33 (100.0%) | 27 (100.0%) |
| 5 Years | 0 (0.0%) | 0 (0.0%) |
| 6 to 11 Years | 0 (0.0%) | 26 (100.0%) |
| 12 to 14 Years | 0 (0.0%) | 0 (0.0%) |
| 15 Years | 0 (0.0%) | 0 (0.0%) |
| 16 and 17 Years | 0 (0.0%) | 0 (0.0%) |
| 18 to 24 Years | 0 (0.0%) | 7 (100.0%) |
| 25 to 34 Years | 37 (100.0%) | 29 (87.9%) |
| 35 to 44 Years | 0 (0.0%) | 0 (0.0%) |
| 45 to 54 Years | 16 (84.2%) | 3 (60.0%) |
| 55 to 64 Years | 5 (27.8%) | 5 (23.8%) |
| 65 to 74 Years | 0 (0.0%) | 0 (0.0%) |
| 75 Years and over | 2 (22.2%) | 1 (5.9%) |
| Total | 93 (67.9%) | 98 (60.5%) |
Income Above Poverty by Sex and Age in Heron
According to the poverty statistics in Heron, males aged 35 to 44 years and females aged 16 and 17 years are the age groups that are most secure financially, with 100.0% of males and 100.0% of females in these age groups living above the poverty line.
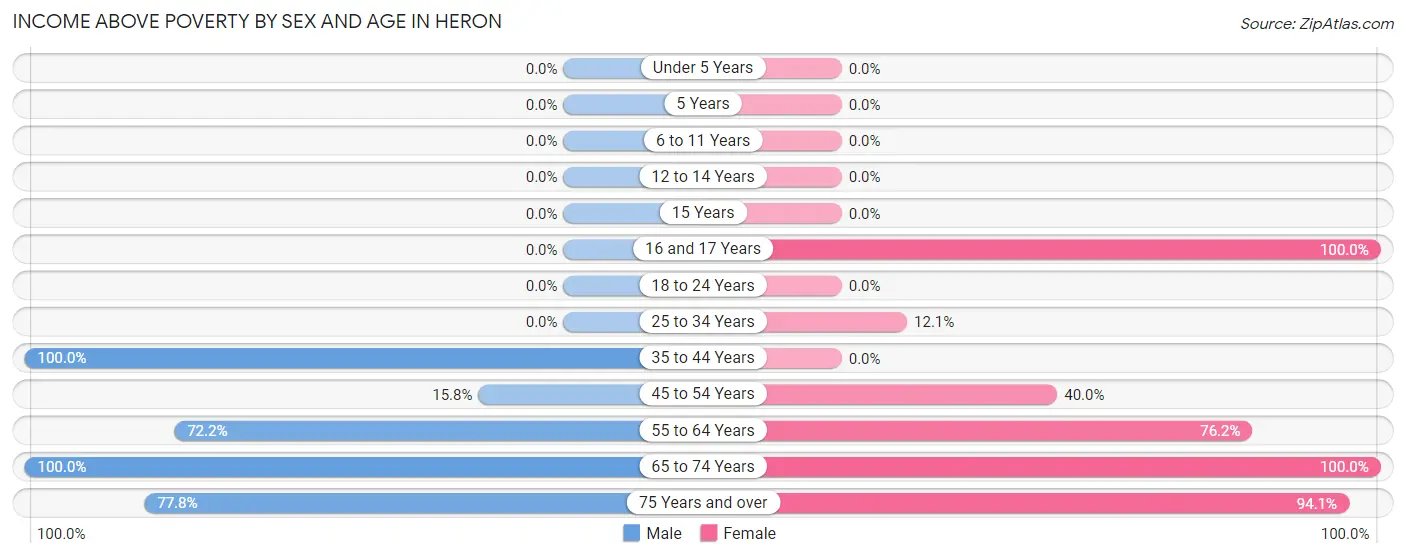
| Age Bracket | Male | Female |
| Under 5 Years | 0 (0.0%) | 0 (0.0%) |
| 5 Years | 0 (0.0%) | 0 (0.0%) |
| 6 to 11 Years | 0 (0.0%) | 0 (0.0%) |
| 12 to 14 Years | 0 (0.0%) | 0 (0.0%) |
| 15 Years | 0 (0.0%) | 0 (0.0%) |
| 16 and 17 Years | 0 (0.0%) | 3 (100.0%) |
| 18 to 24 Years | 0 (0.0%) | 0 (0.0%) |
| 25 to 34 Years | 0 (0.0%) | 4 (12.1%) |
| 35 to 44 Years | 2 (100.0%) | 0 (0.0%) |
| 45 to 54 Years | 3 (15.8%) | 2 (40.0%) |
| 55 to 64 Years | 13 (72.2%) | 16 (76.2%) |
| 65 to 74 Years | 19 (100.0%) | 23 (100.0%) |
| 75 Years and over | 7 (77.8%) | 16 (94.1%) |
| Total | 44 (32.1%) | 64 (39.5%) |
Income Below Poverty Among Married-Couple Families in Heron
The poverty statistics for married-couple families in Heron show that 47.6% or 39 of the total 82 families live below the poverty line. Families with 3 or 4 children have the highest poverty rate of 100.0%, comprising of 29 families. On the other hand, families with no children have the lowest poverty rate of 18.9%, which includes 10 families.
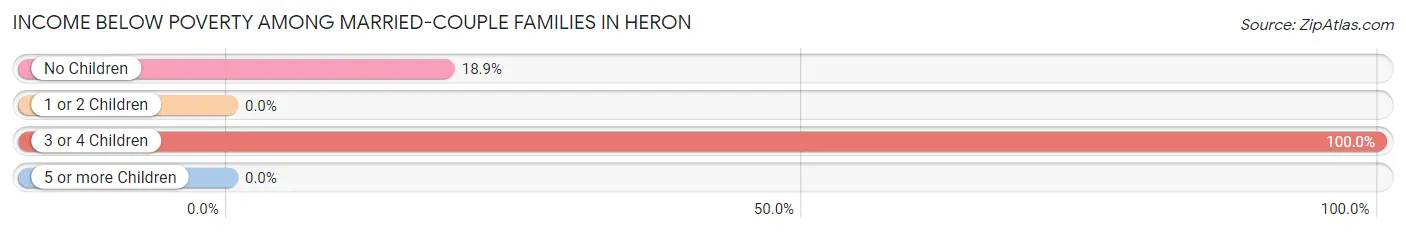
| Children | Above Poverty | Below Poverty |
| No Children | 43 (81.1%) | 10 (18.9%) |
| 1 or 2 Children | 0 (0.0%) | 0 (0.0%) |
| 3 or 4 Children | 0 (0.0%) | 29 (100.0%) |
| 5 or more Children | 0 (0.0%) | 0 (0.0%) |
| Total | 43 (52.4%) | 39 (47.6%) |
Income Below Poverty Among Single-Parent Households in Heron
| Children | Single Father | Single Mother |
| No Children | 0 (0.0%) | 0 (0.0%) |
| 1 or 2 Children | 0 (0.0%) | 0 (0.0%) |
| 3 or 4 Children | 0 (0.0%) | 0 (0.0%) |
| 5 or more Children | 0 (0.0%) | 0 (0.0%) |
| Total | 0 (0.0%) | 0 (0.0%) |
Income Below Poverty Among Married-Couple vs Single-Parent Households in Heron
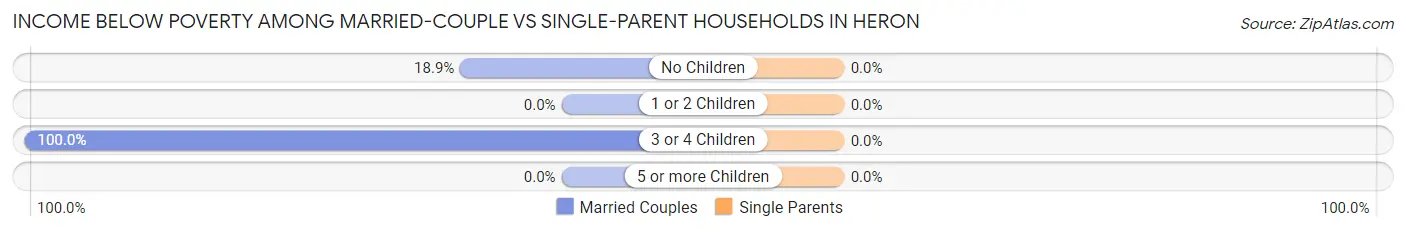
| Children | Married-Couple Families | Single-Parent Households |
| No Children | 10 (18.9%) | 0 (0.0%) |
| 1 or 2 Children | 0 (0.0%) | 0 (0.0%) |
| 3 or 4 Children | 29 (100.0%) | 0 (0.0%) |
| 5 or more Children | 0 (0.0%) | 0 (0.0%) |
| Total | 39 (47.6%) | 0 (0.0%) |
Race in Heron
The most populous races in Heron are White / Caucasian (297 | 99.3%), Hispanic or Latino (3 | 1.0%), and Two or more Races (2 | 0.7%).
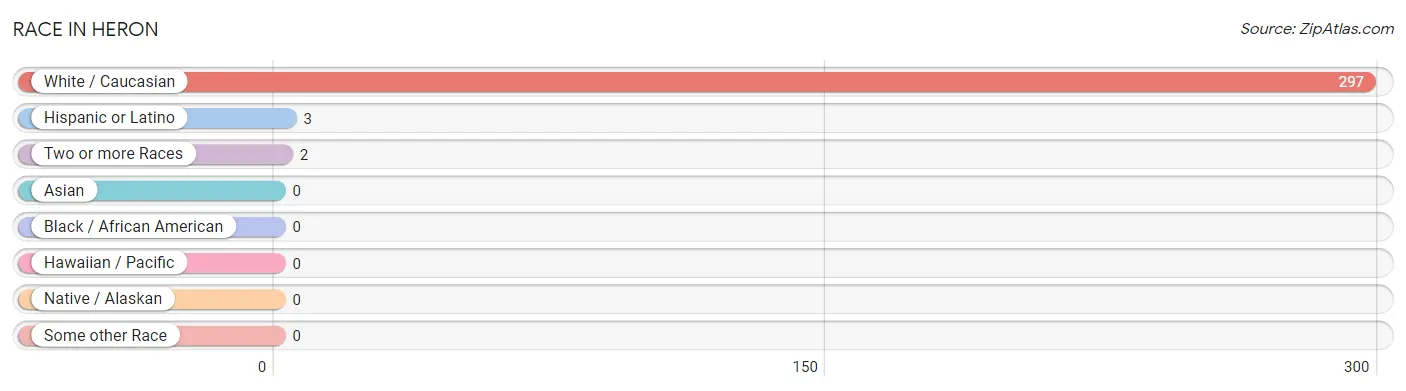
| Race | # Population | % Population |
| Asian | 0 | 0.0% |
| Black / African American | 0 | 0.0% |
| Hawaiian / Pacific | 0 | 0.0% |
| Hispanic or Latino | 3 | 1.0% |
| Native / Alaskan | 0 | 0.0% |
| White / Caucasian | 297 | 99.3% |
| Two or more Races | 2 | 0.7% |
| Some other Race | 0 | 0.0% |
| Total | 299 | 100.0% |
Ancestry in Heron
The most populous ancestries reported in Heron are Scotch-Irish (160 | 53.5%), Norwegian (130 | 43.5%), German (27 | 9.0%), English (23 | 7.7%), and Swedish (19 | 6.4%), together accounting for 120.1% of all Heron residents.
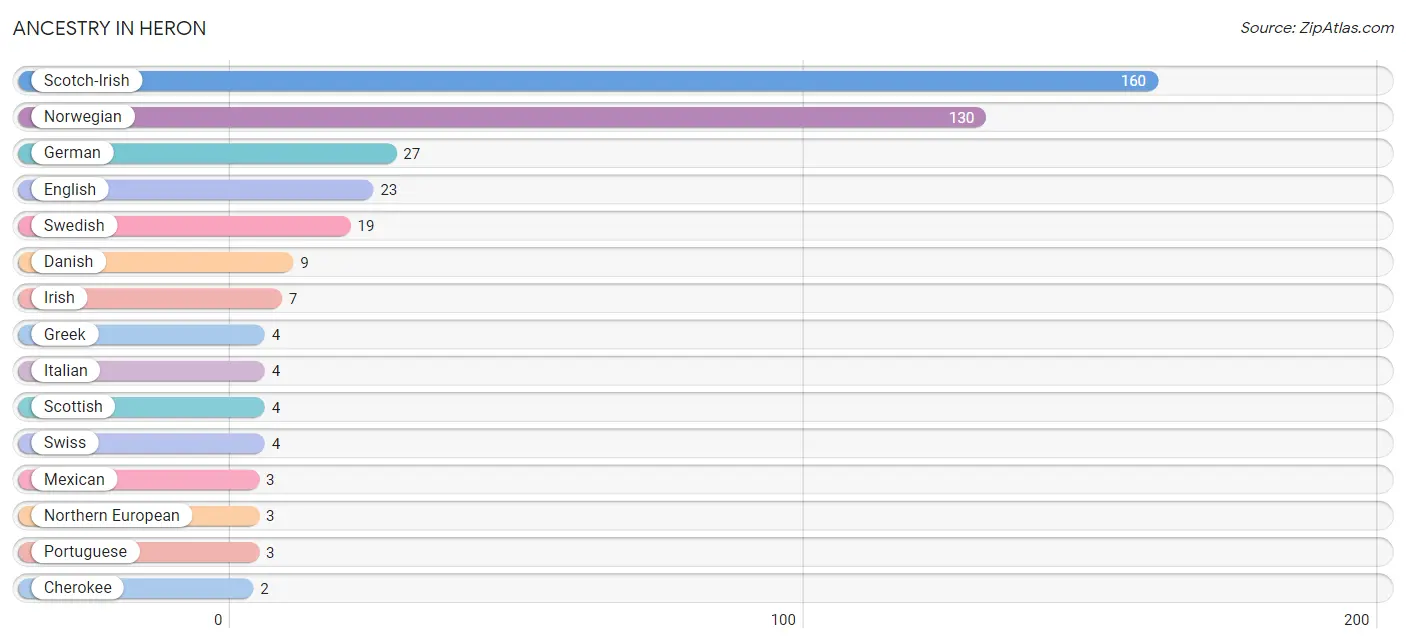
| Ancestry | # Population | % Population |
| Cherokee | 2 | 0.7% |
| Danish | 9 | 3.0% |
| English | 23 | 7.7% |
| German | 27 | 9.0% |
| Greek | 4 | 1.3% |
| Irish | 7 | 2.3% |
| Italian | 4 | 1.3% |
| Mexican | 3 | 1.0% |
| Northern European | 3 | 1.0% |
| Norwegian | 130 | 43.5% |
| Portuguese | 3 | 1.0% |
| Scotch-Irish | 160 | 53.5% |
| Scottish | 4 | 1.3% |
| Swedish | 19 | 6.4% |
| Swiss | 4 | 1.3% |
| Welsh | 1 | 0.3% | View All 16 Rows |
Immigrants in Heron

| Immigration Origin | # Population | % Population | View All 0 Rows |
Sex and Age in Heron
Sex and Age in Heron
The most populous age groups in Heron are 30 to 34 Years (37 | 27.0%) for men and 30 to 34 Years (29 | 17.9%) for women.
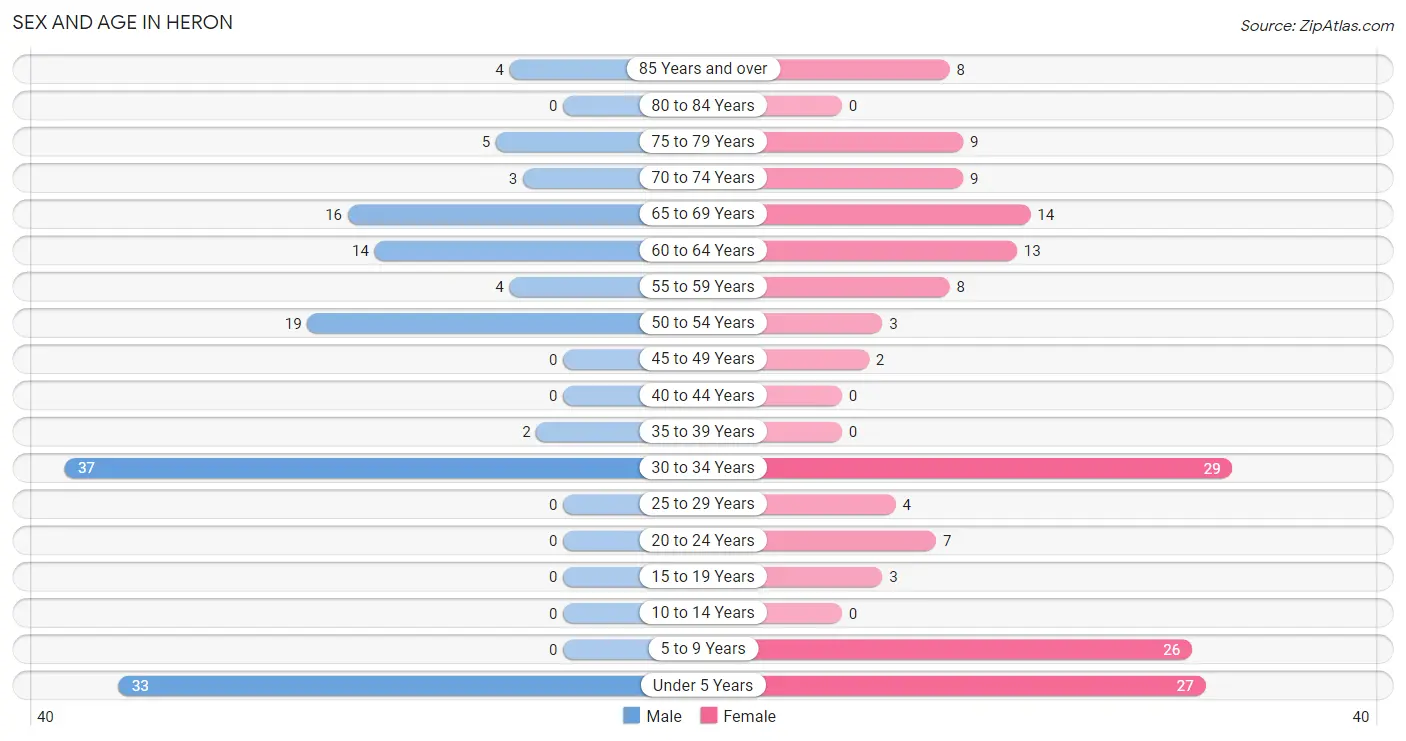
| Age Bracket | Male | Female |
| Under 5 Years | 33 (24.1%) | 27 (16.7%) |
| 5 to 9 Years | 0 (0.0%) | 26 (16.1%) |
| 10 to 14 Years | 0 (0.0%) | 0 (0.0%) |
| 15 to 19 Years | 0 (0.0%) | 3 (1.8%) |
| 20 to 24 Years | 0 (0.0%) | 7 (4.3%) |
| 25 to 29 Years | 0 (0.0%) | 4 (2.5%) |
| 30 to 34 Years | 37 (27.0%) | 29 (17.9%) |
| 35 to 39 Years | 2 (1.5%) | 0 (0.0%) |
| 40 to 44 Years | 0 (0.0%) | 0 (0.0%) |
| 45 to 49 Years | 0 (0.0%) | 2 (1.2%) |
| 50 to 54 Years | 19 (13.9%) | 3 (1.8%) |
| 55 to 59 Years | 4 (2.9%) | 8 (4.9%) |
| 60 to 64 Years | 14 (10.2%) | 13 (8.0%) |
| 65 to 69 Years | 16 (11.7%) | 14 (8.6%) |
| 70 to 74 Years | 3 (2.2%) | 9 (5.6%) |
| 75 to 79 Years | 5 (3.6%) | 9 (5.6%) |
| 80 to 84 Years | 0 (0.0%) | 0 (0.0%) |
| 85 Years and over | 4 (2.9%) | 8 (4.9%) |
| Total | 137 (100.0%) | 162 (100.0%) |
Families and Households in Heron
Median Family Size in Heron
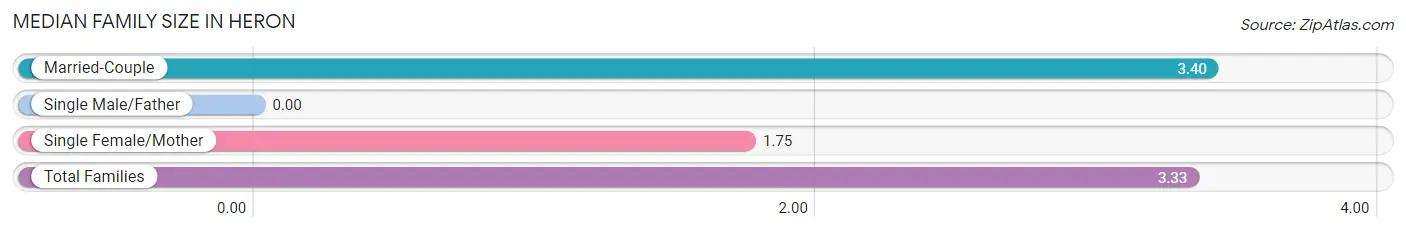
| Family Type | # Families | Family Size |
| Married-Couple | 82 (95.4%) | 3.40 |
| Single Male/Father | 0 (0.0%) | - |
| Single Female/Mother | 4 (4.6%) | 1.75 |
| Total Families | 86 (100.0%) | 3.33 |
Median Household Size in Heron
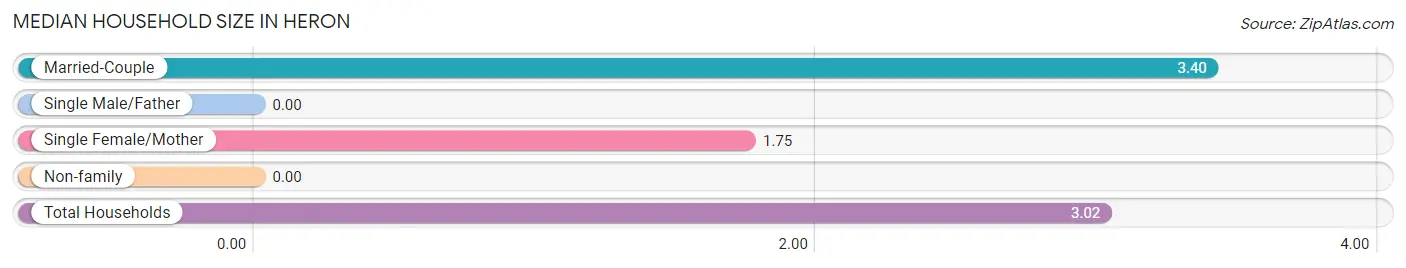
| Household Type | # Households | Household Size |
| Married-Couple | 82 (82.8%) | 3.40 |
| Single Male/Father | 0 (0.0%) | - |
| Single Female/Mother | 4 (4.0%) | 1.75 |
| Non-family | 13 (13.1%) | - |
| Total Households | 99 (100.0%) | 3.02 |
Household Size by Marriage Status in Heron
Out of a total of 99 households in Heron, 86 (86.9%) are family households, while 13 (13.1%) are nonfamily households. The most numerous type of family households are 2-person households, comprising 49, and the most common type of nonfamily households are 1-person households, comprising 13.
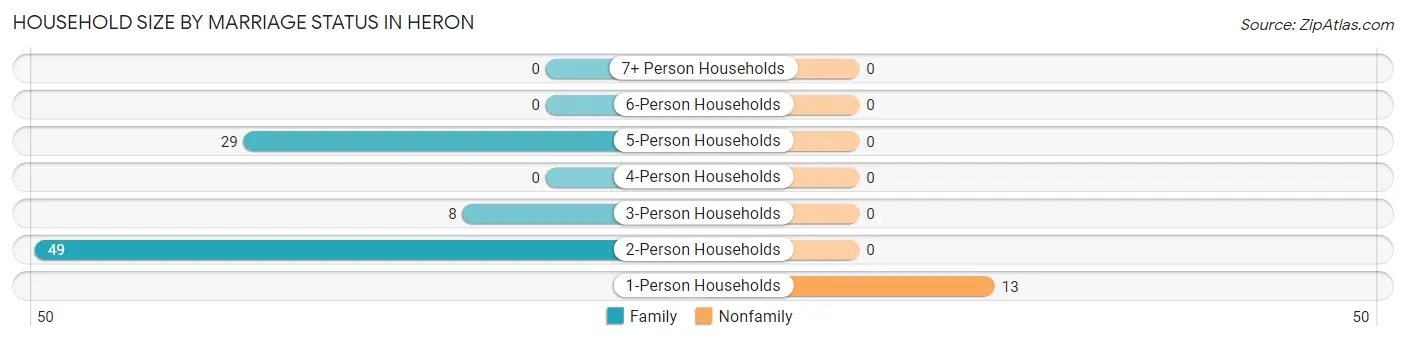
| Household Size | Family Households | Nonfamily Households |
| 1-Person Households | - | 13 (13.1%) |
| 2-Person Households | 49 (49.5%) | 0 (0.0%) |
| 3-Person Households | 8 (8.1%) | 0 (0.0%) |
| 4-Person Households | 0 (0.0%) | 0 (0.0%) |
| 5-Person Households | 29 (29.3%) | 0 (0.0%) |
| 6-Person Households | 0 (0.0%) | 0 (0.0%) |
| 7+ Person Households | 0 (0.0%) | 0 (0.0%) |
| Total | 86 (86.9%) | 13 (13.1%) |
Female Fertility in Heron
Fertility by Age in Heron
| Age Bracket | Women with Births | Births / 1,000 Women |
| 15 to 19 years | 0 (0.0%) | 0.0 |
| 20 to 34 years | 0 (0.0%) | 0.0 |
| 35 to 50 years | 0 (0.0%) | 0.0 |
| Total | 0 (0.0%) | 0.0 |
Fertility by Age by Marriage Status in Heron
| Age Bracket | Married | Unmarried |
| 15 to 19 years | 0 (0.0%) | 0 (0.0%) |
| 20 to 34 years | 0 (0.0%) | 0 (0.0%) |
| 35 to 50 years | 0 (0.0%) | 0 (0.0%) |
| Total | 0 (0.0%) | 0 (0.0%) |
Fertility by Education in Heron
| Educational Attainment | Women with Births | Births / 1,000 Women |
| Less than High School | 0 (0.0%) | 0.0 |
| High School Diploma | 0 (0.0%) | 0.0 |
| College or Associate's Degree | 0 (0.0%) | 0.0 |
| Bachelor's Degree | 0 (0.0%) | 0.0 |
| Graduate Degree | 0 (0.0%) | 0.0 |
| Total | 0 (0.0%) | 0.0 |
Fertility by Education by Marriage Status in Heron
| Educational Attainment | Married | Unmarried |
| Less than High School | 0 (0.0%) | 0 (0.0%) |
| High School Diploma | 0 (0.0%) | 0 (0.0%) |
| College or Associate's Degree | 0 (0.0%) | 0 (0.0%) |
| Bachelor's Degree | 0 (0.0%) | 0 (0.0%) |
| Graduate Degree | 0 (0.0%) | 0 (0.0%) |
| Total | 0 (0.0%) | 0 (0.0%) |
Employment Characteristics in Heron
Employment by Class of Employer in Heron
Among the 80 employed individuals in Heron, not-for-profit organizations (43 | 53.7%), self-employed (incorporated) (16 | 20.0%), and private company employees (12 | 15.0%) make up the most common classes of employment.
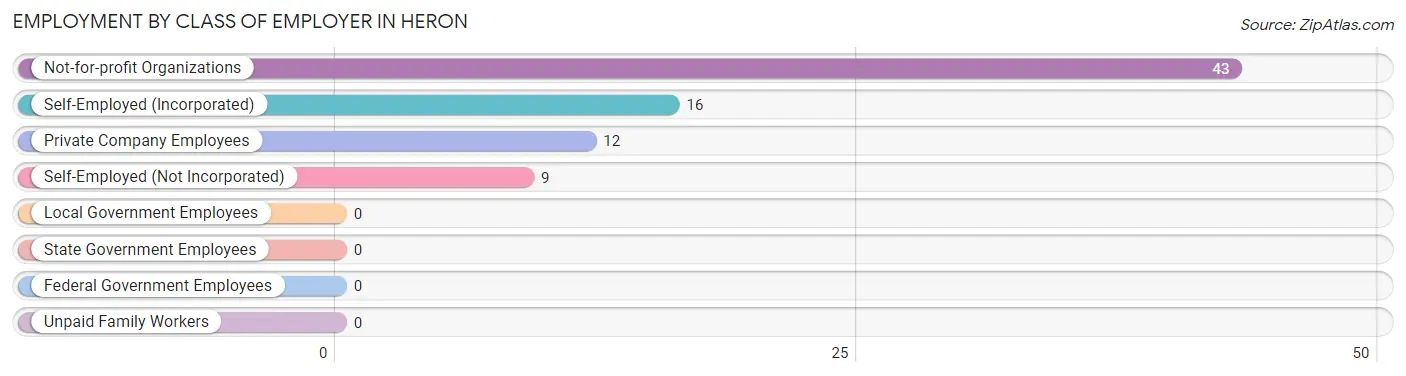
| Employer Class | # Employees | % Employees |
| Private Company Employees | 12 | 15.0% |
| Self-Employed (Incorporated) | 16 | 20.0% |
| Self-Employed (Not Incorporated) | 9 | 11.3% |
| Not-for-profit Organizations | 43 | 53.7% |
| Local Government Employees | 0 | 0.0% |
| State Government Employees | 0 | 0.0% |
| Federal Government Employees | 0 | 0.0% |
| Unpaid Family Workers | 0 | 0.0% |
| Total | 80 | 100.0% |
Employment Status by Age in Heron
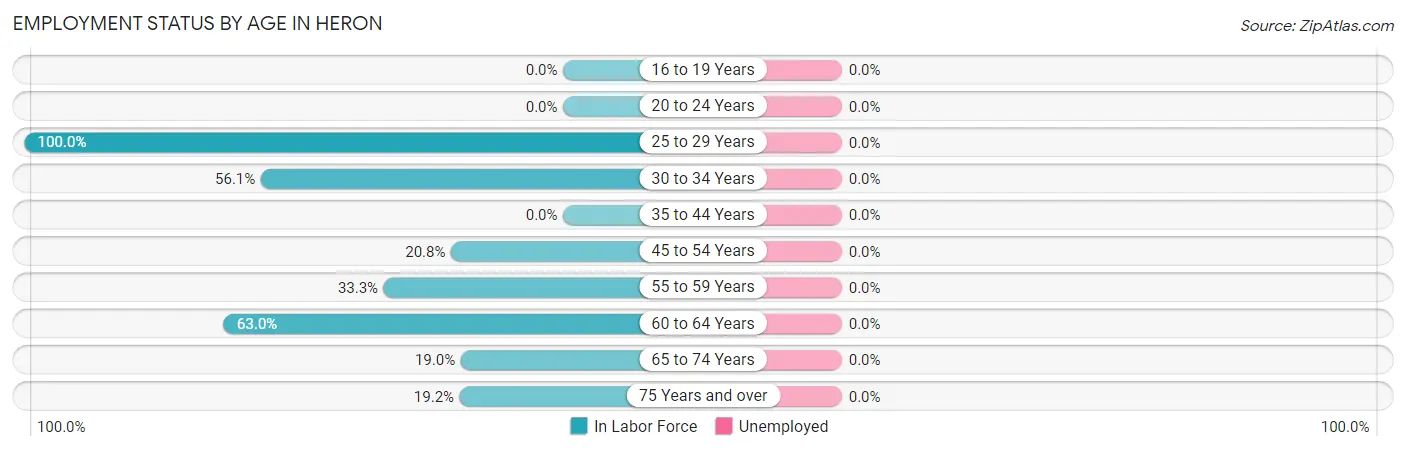
| Age Bracket | In Labor Force | Unemployed |
| 16 to 19 Years | 0 (0.0%) | 0 (0.0%) |
| 20 to 24 Years | 0 (0.0%) | 0 (0.0%) |
| 25 to 29 Years | 4 (100.0%) | 0 (0.0%) |
| 30 to 34 Years | 37 (56.1%) | 0 (0.0%) |
| 35 to 44 Years | 0 (0.0%) | 0 (0.0%) |
| 45 to 54 Years | 5 (20.8%) | 0 (0.0%) |
| 55 to 59 Years | 4 (33.3%) | 0 (0.0%) |
| 60 to 64 Years | 17 (63.0%) | 0 (0.0%) |
| 65 to 74 Years | 8 (19.0%) | 0 (0.0%) |
| 75 Years and over | 5 (19.2%) | 0 (0.0%) |
| Total | 80 (37.6%) | 0 (0.0%) |
Employment Status by Educational Attainment in Heron
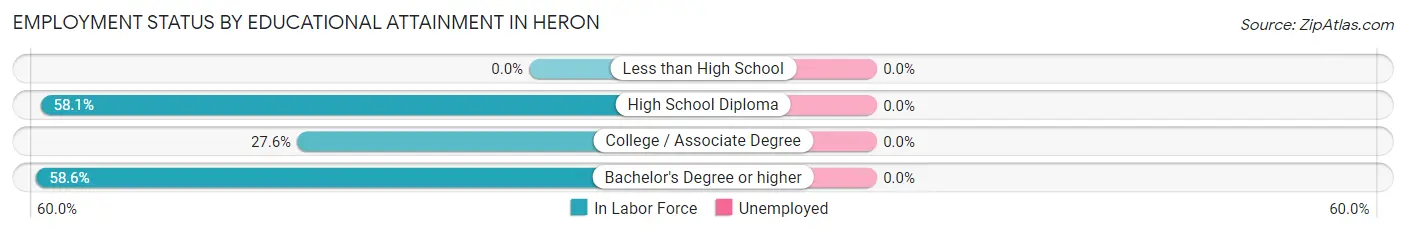
| Educational Attainment | In Labor Force | Unemployed |
| Less than High School | 0 (0.0%) | 0 (0.0%) |
| High School Diploma | 18 (58.1%) | 0 (0.0%) |
| College / Associate Degree | 8 (27.6%) | 0 (0.0%) |
| Bachelor's Degree or higher | 41 (58.6%) | 0 (0.0%) |
| Total | 67 (49.6%) | 0 (0.0%) |
Employment Occupations by Sex in Heron
Management, Business, Science and Arts Occupations
The most common Management, Business, Science and Arts occupations in Heron are Community & Social Service (44 | 55.0%), Education, Arts & Media (40 | 50.0%), Management (6 | 7.5%), and Arts, Media & Entertainment (4 | 5.0%).
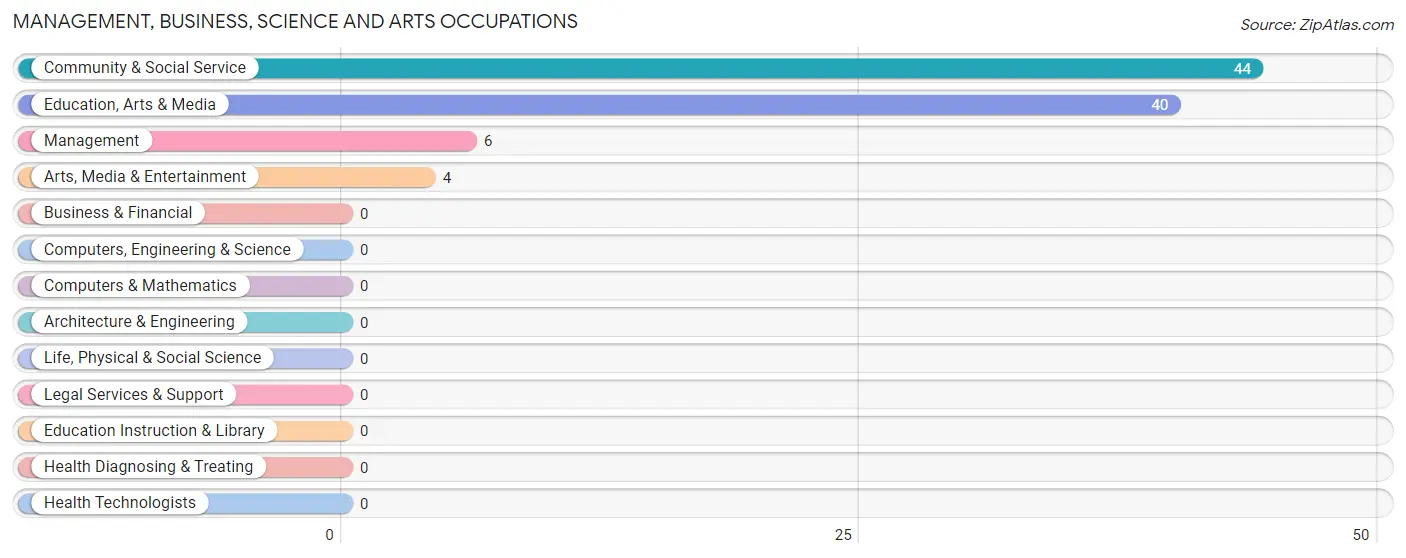
Management, Business, Science and Arts Occupations by Sex
Within the Management, Business, Science and Arts occupations in Heron, the most male-oriented occupations are Education, Arts & Media (92.5%), Community & Social Service (84.1%), and Management (66.7%), while the most female-oriented occupations are Arts, Media & Entertainment (100.0%), Management (33.3%), and Community & Social Service (15.9%).
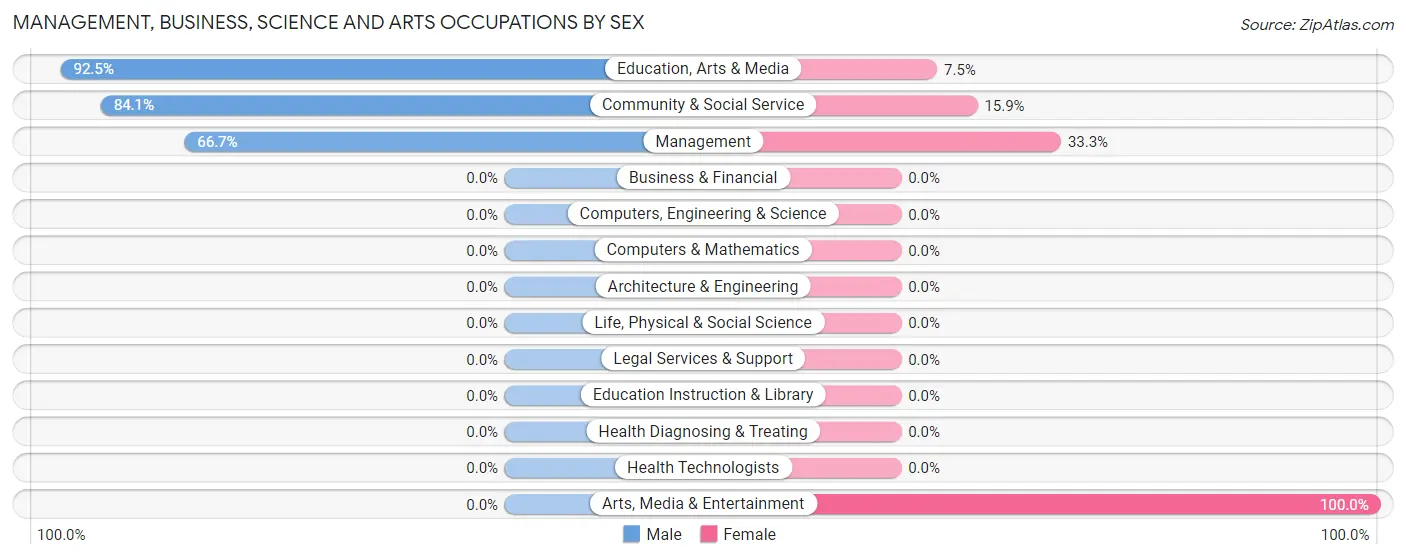
| Occupation | Male | Female |
| Management | 4 (66.7%) | 2 (33.3%) |
| Business & Financial | 0 (0.0%) | 0 (0.0%) |
| Computers, Engineering & Science | 0 (0.0%) | 0 (0.0%) |
| Computers & Mathematics | 0 (0.0%) | 0 (0.0%) |
| Architecture & Engineering | 0 (0.0%) | 0 (0.0%) |
| Life, Physical & Social Science | 0 (0.0%) | 0 (0.0%) |
| Community & Social Service | 37 (84.1%) | 7 (15.9%) |
| Education, Arts & Media | 37 (92.5%) | 3 (7.5%) |
| Legal Services & Support | 0 (0.0%) | 0 (0.0%) |
| Education Instruction & Library | 0 (0.0%) | 0 (0.0%) |
| Arts, Media & Entertainment | 0 (0.0%) | 4 (100.0%) |
| Health Diagnosing & Treating | 0 (0.0%) | 0 (0.0%) |
| Health Technologists | 0 (0.0%) | 0 (0.0%) |
| Total (Category) | 41 (82.0%) | 9 (18.0%) |
| Total (Overall) | 52 (65.0%) | 28 (35.0%) |
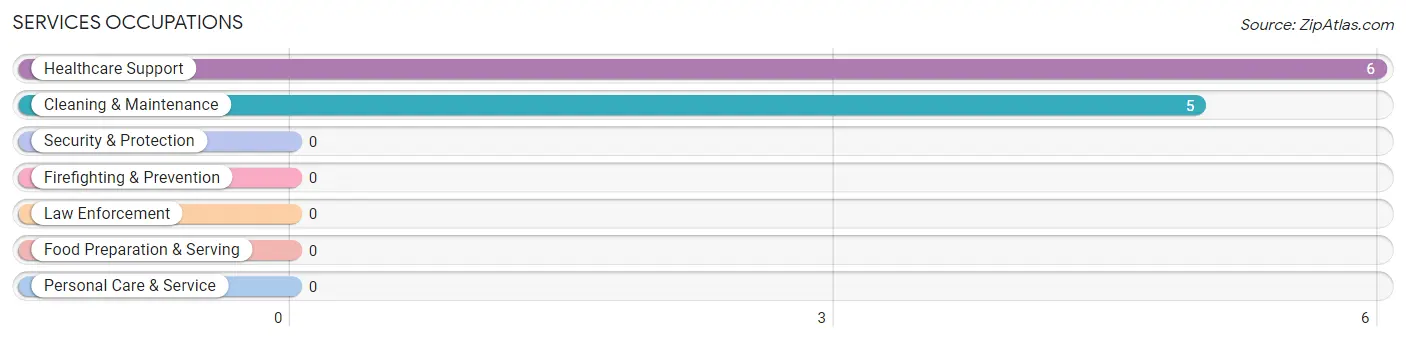
Services Occupations
The most common Services occupations in Heron are Healthcare Support (6 | 7.5%), and Cleaning & Maintenance (5 | 6.2%).
Services Occupations by Sex
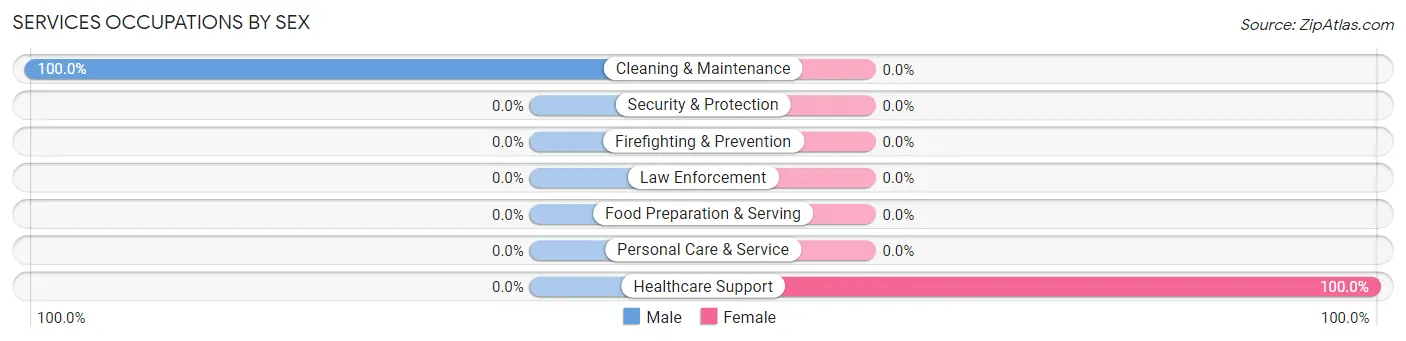
| Occupation | Male | Female |
| Healthcare Support | 0 (0.0%) | 6 (100.0%) |
| Security & Protection | 0 (0.0%) | 0 (0.0%) |
| Firefighting & Prevention | 0 (0.0%) | 0 (0.0%) |
| Law Enforcement | 0 (0.0%) | 0 (0.0%) |
| Food Preparation & Serving | 0 (0.0%) | 0 (0.0%) |
| Cleaning & Maintenance | 5 (100.0%) | 0 (0.0%) |
| Personal Care & Service | 0 (0.0%) | 0 (0.0%) |
| Total (Category) | 5 (45.5%) | 6 (54.5%) |
| Total (Overall) | 52 (65.0%) | 28 (35.0%) |
Sales and Office Occupations
The most common Sales and Office occupations in Heron are Office & Administration (9 | 11.3%), and Sales & Related (3 | 3.7%).

Sales and Office Occupations by Sex

| Occupation | Male | Female |
| Sales & Related | 3 (100.0%) | 0 (0.0%) |
| Office & Administration | 0 (0.0%) | 9 (100.0%) |
| Total (Category) | 3 (25.0%) | 9 (75.0%) |
| Total (Overall) | 52 (65.0%) | 28 (35.0%) |
Natural Resources, Construction and Maintenance Occupations
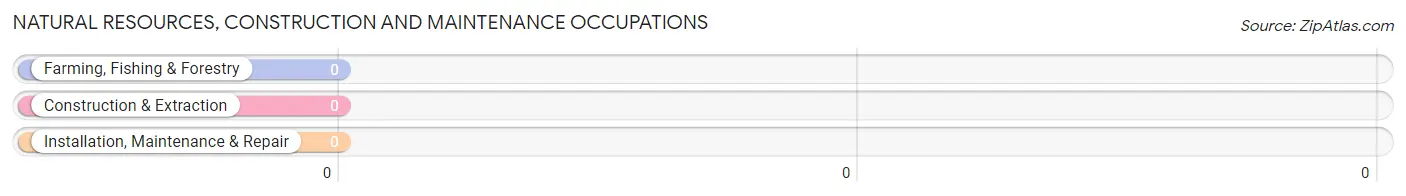
Natural Resources, Construction and Maintenance Occupations by Sex
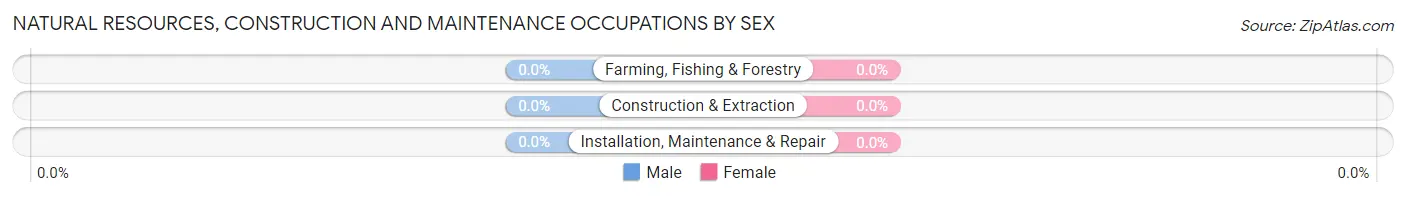
| Occupation | Male | Female |
| Farming, Fishing & Forestry | 0 (0.0%) | 0 (0.0%) |
| Construction & Extraction | 0 (0.0%) | 0 (0.0%) |
| Installation, Maintenance & Repair | 0 (0.0%) | 0 (0.0%) |
| Total (Category) | 0 (0.0%) | 0 (0.0%) |
| Total (Overall) | 52 (65.0%) | 28 (35.0%) |
Production, Transportation and Moving Occupations
The most common Production, Transportation and Moving occupations in Heron are Material Moving (4 | 5.0%), and Production (3 | 3.7%).
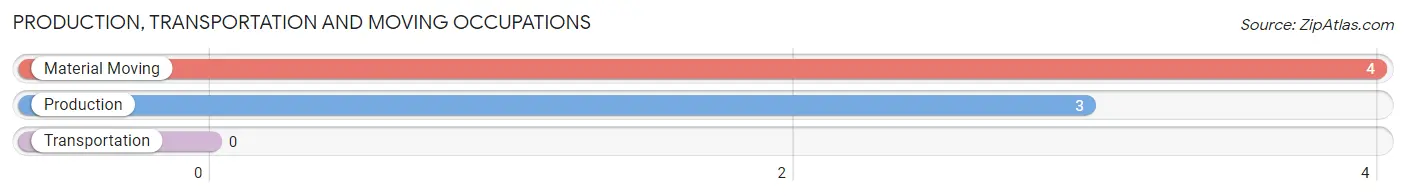
Production, Transportation and Moving Occupations by Sex
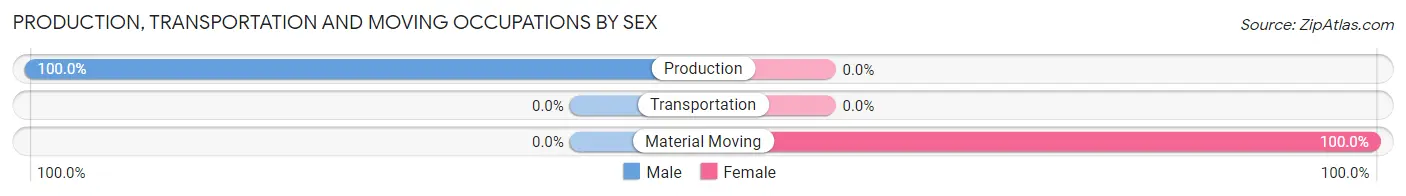
| Occupation | Male | Female |
| Production | 3 (100.0%) | 0 (0.0%) |
| Transportation | 0 (0.0%) | 0 (0.0%) |
| Material Moving | 0 (0.0%) | 4 (100.0%) |
| Total (Category) | 3 (42.9%) | 4 (57.1%) |
| Total (Overall) | 52 (65.0%) | 28 (35.0%) |
Employment Industries by Sex in Heron
Employment Industries in Heron
The major employment industries in Heron include Educational Services (9 | 11.3%), Construction (8 | 10.0%), Professional & Scientific (8 | 10.0%), Administrative & Support (5 | 6.2%), and Retail Trade (4 | 5.0%).
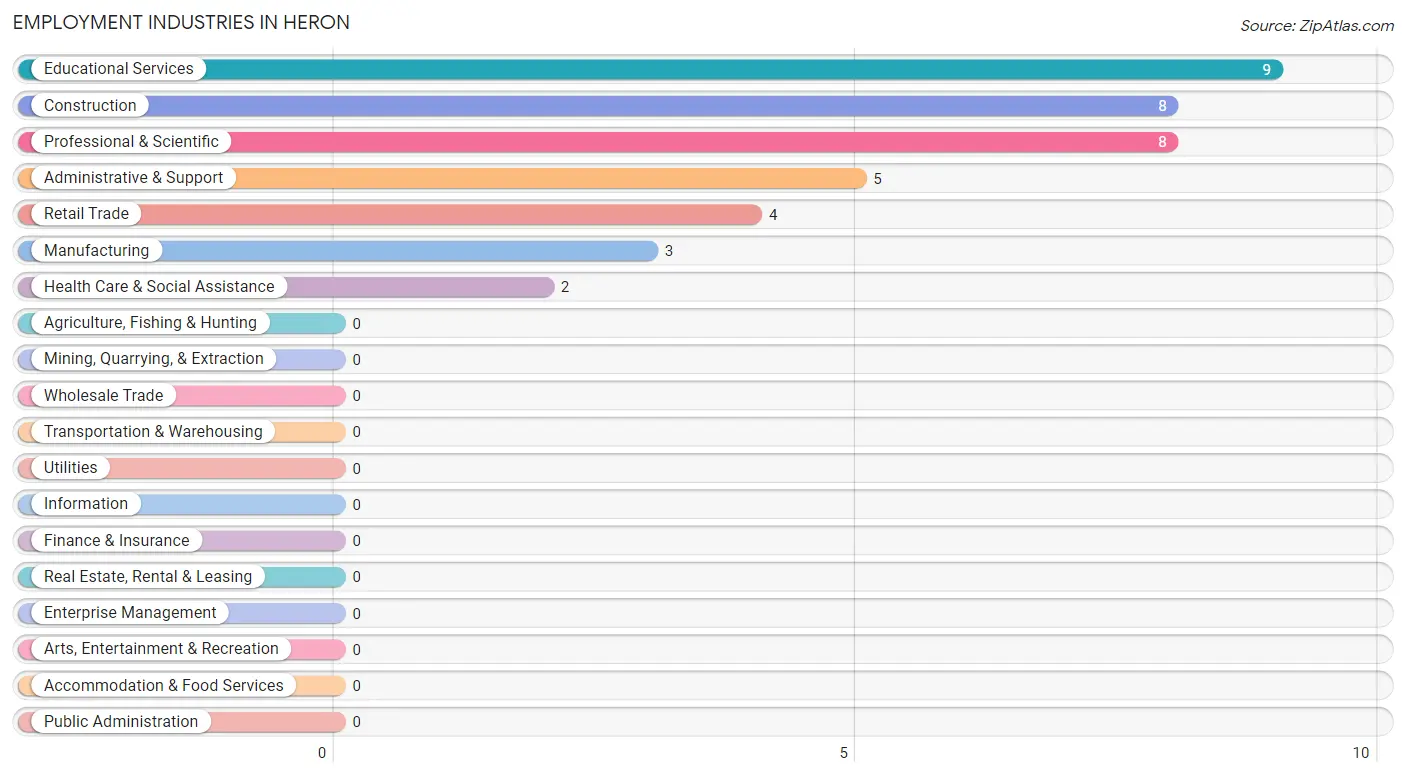
Employment Industries by Sex in Heron
The Heron industries that see more men than women are Manufacturing (100.0%), Administrative & Support (100.0%), and Construction (50.0%), whereas the industries that tend to have a higher number of women are Retail Trade (100.0%), Educational Services (100.0%), and Health Care & Social Assistance (100.0%).
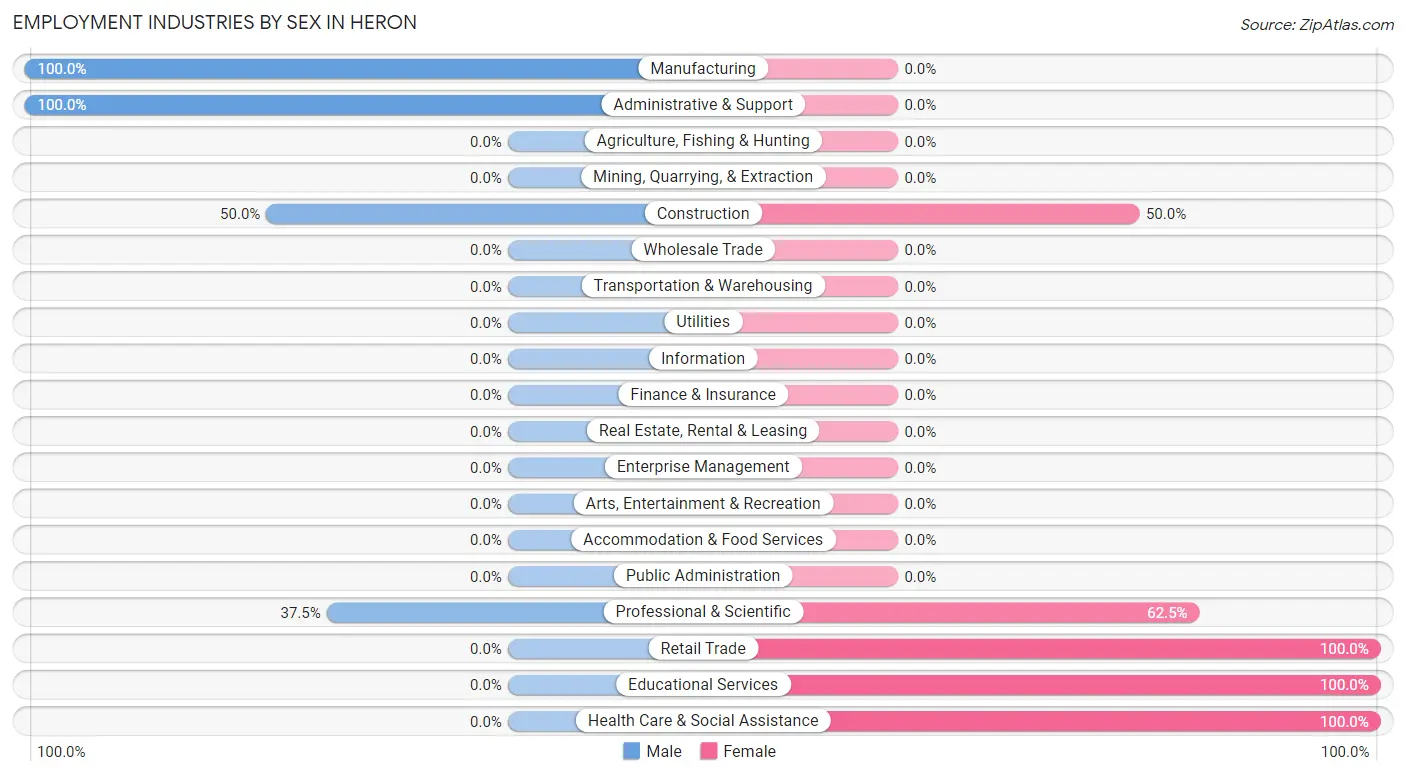
| Industry | Male | Female |
| Agriculture, Fishing & Hunting | 0 (0.0%) | 0 (0.0%) |
| Mining, Quarrying, & Extraction | 0 (0.0%) | 0 (0.0%) |
| Construction | 4 (50.0%) | 4 (50.0%) |
| Manufacturing | 3 (100.0%) | 0 (0.0%) |
| Wholesale Trade | 0 (0.0%) | 0 (0.0%) |
| Retail Trade | 0 (0.0%) | 4 (100.0%) |
| Transportation & Warehousing | 0 (0.0%) | 0 (0.0%) |
| Utilities | 0 (0.0%) | 0 (0.0%) |
| Information | 0 (0.0%) | 0 (0.0%) |
| Finance & Insurance | 0 (0.0%) | 0 (0.0%) |
| Real Estate, Rental & Leasing | 0 (0.0%) | 0 (0.0%) |
| Professional & Scientific | 3 (37.5%) | 5 (62.5%) |
| Enterprise Management | 0 (0.0%) | 0 (0.0%) |
| Administrative & Support | 5 (100.0%) | 0 (0.0%) |
| Educational Services | 0 (0.0%) | 9 (100.0%) |
| Health Care & Social Assistance | 0 (0.0%) | 2 (100.0%) |
| Arts, Entertainment & Recreation | 0 (0.0%) | 0 (0.0%) |
| Accommodation & Food Services | 0 (0.0%) | 0 (0.0%) |
| Public Administration | 0 (0.0%) | 0 (0.0%) |
| Total | 52 (65.0%) | 28 (35.0%) |
Education in Heron
School Enrollment in Heron
The most common levels of schooling among the 89 students in Heron are nursery / preschool (60 | 67.4%), elementary school (26 | 29.2%), and high school (3 | 3.4%).
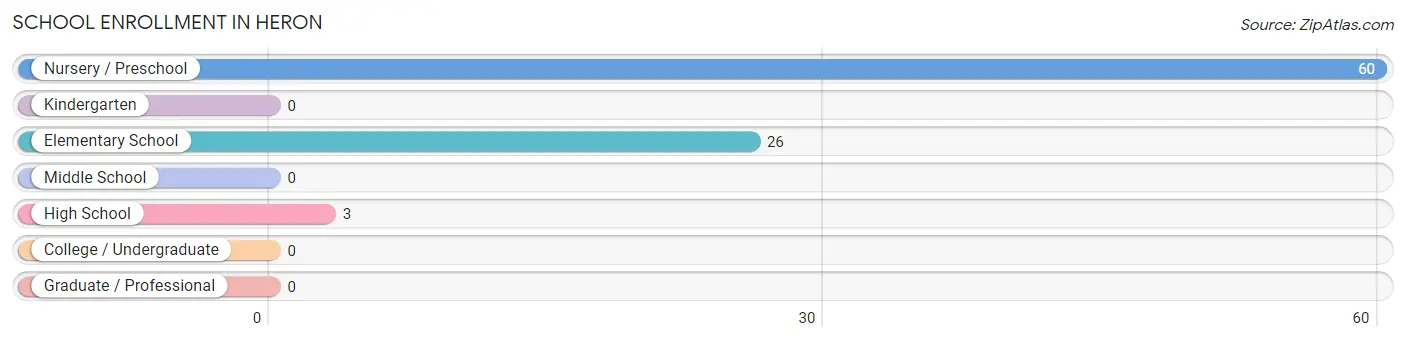
| School Level | # Students | % Students |
| Nursery / Preschool | 60 | 67.4% |
| Kindergarten | 0 | 0.0% |
| Elementary School | 26 | 29.2% |
| Middle School | 0 | 0.0% |
| High School | 3 | 3.4% |
| College / Undergraduate | 0 | 0.0% |
| Graduate / Professional | 0 | 0.0% |
| Total | 89 | 100.0% |
School Enrollment by Age by Funding Source in Heron
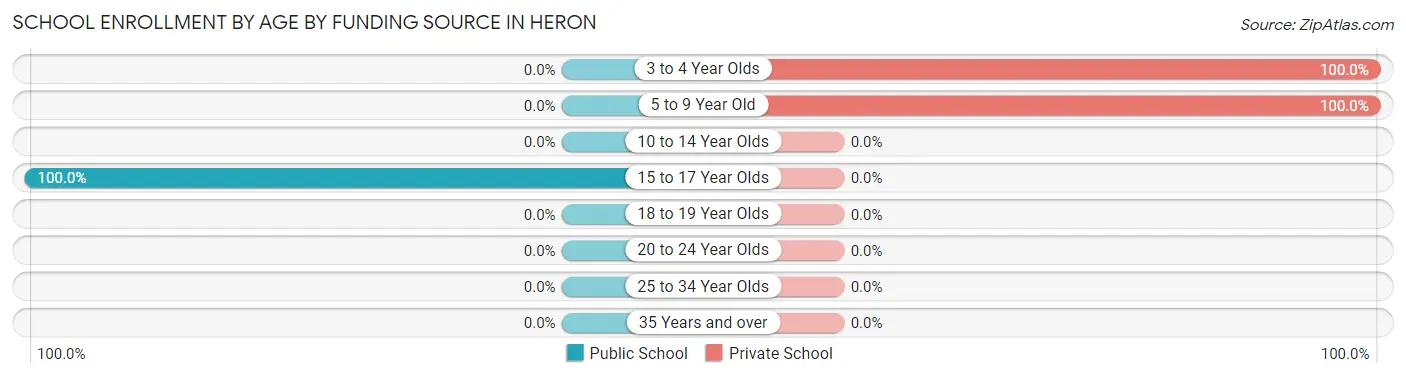
Out of a total of 89 students who are enrolled in schools in Heron, 86 (96.6%) attend a private institution, while the remaining 3 (3.4%) are enrolled in public schools. The age group of 3 to 4 year olds has the highest likelihood of being enrolled in private schools, with 60 (100.0% in the age bracket) enrolled. Conversely, the age group of 15 to 17 year olds has the lowest likelihood of being enrolled in a private school, with 3 (100.0% in the age bracket) attending a public institution.
| Age Bracket | Public School | Private School |
| 3 to 4 Year Olds | 0 (0.0%) | 60 (100.0%) |
| 5 to 9 Year Old | 0 (0.0%) | 26 (100.0%) |
| 10 to 14 Year Olds | 0 (0.0%) | 0 (0.0%) |
| 15 to 17 Year Olds | 3 (100.0%) | 0 (0.0%) |
| 18 to 19 Year Olds | 0 (0.0%) | 0 (0.0%) |
| 20 to 24 Year Olds | 0 (0.0%) | 0 (0.0%) |
| 25 to 34 Year Olds | 0 (0.0%) | 0 (0.0%) |
| 35 Years and over | 0 (0.0%) | 0 (0.0%) |
| Total | 3 (3.4%) | 86 (96.6%) |
Educational Attainment by Field of Study in Heron
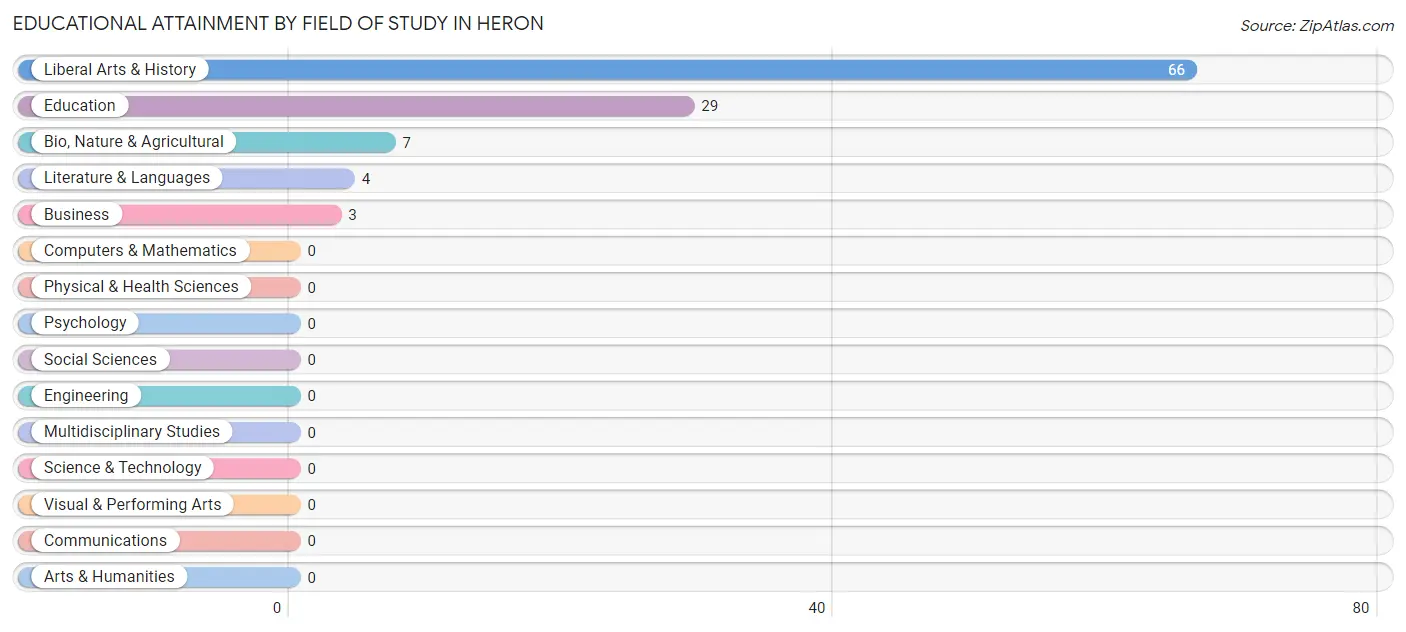
Liberal arts & history (66 | 60.6%), education (29 | 26.6%), bio, nature & agricultural (7 | 6.4%), literature & languages (4 | 3.7%), and business (3 | 2.8%) are the most common fields of study among 109 individuals in Heron who have obtained a bachelor's degree or higher.
| Field of Study | # Graduates | % Graduates |
| Computers & Mathematics | 0 | 0.0% |
| Bio, Nature & Agricultural | 7 | 6.4% |
| Physical & Health Sciences | 0 | 0.0% |
| Psychology | 0 | 0.0% |
| Social Sciences | 0 | 0.0% |
| Engineering | 0 | 0.0% |
| Multidisciplinary Studies | 0 | 0.0% |
| Science & Technology | 0 | 0.0% |
| Business | 3 | 2.8% |
| Education | 29 | 26.6% |
| Literature & Languages | 4 | 3.7% |
| Liberal Arts & History | 66 | 60.6% |
| Visual & Performing Arts | 0 | 0.0% |
| Communications | 0 | 0.0% |
| Arts & Humanities | 0 | 0.0% |
| Total | 109 | 100.0% |
Transportation & Commute in Heron
Vehicle Availability by Sex in Heron
The most prevalent vehicle ownership categories in Heron are males with 2 vehicles (37, accounting for 71.2%) and females with 2 vehicles (8, making up 132.1%).
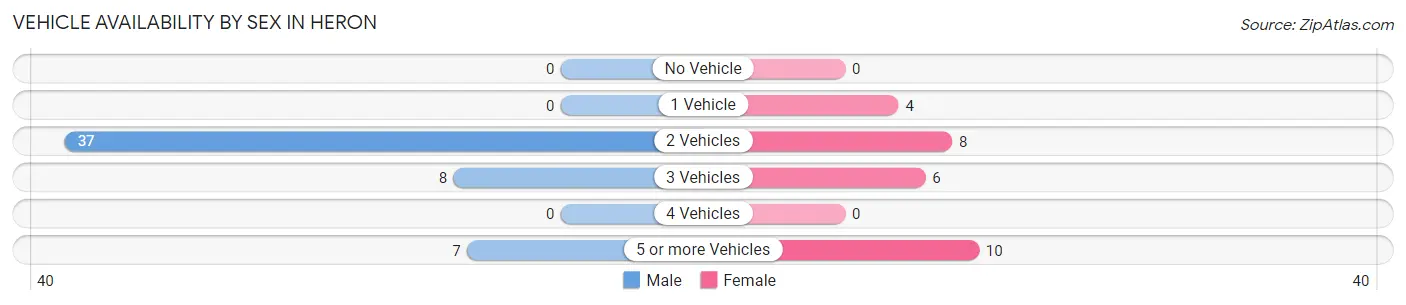
| Vehicles Available | Male | Female |
| No Vehicle | 0 (0.0%) | 0 (0.0%) |
| 1 Vehicle | 0 (0.0%) | 4 (14.3%) |
| 2 Vehicles | 37 (71.2%) | 8 (28.6%) |
| 3 Vehicles | 8 (15.4%) | 6 (21.4%) |
| 4 Vehicles | 0 (0.0%) | 0 (0.0%) |
| 5 or more Vehicles | 7 (13.5%) | 10 (35.7%) |
| Total | 52 (100.0%) | 28 (100.0%) |
Commute Time in Heron
The most frequently occuring commute durations in Heron are 20 to 24 minutes (37 commuters, 62.7%), 10 to 14 minutes (9 commuters, 15.2%), and 45 to 59 minutes (7 commuters, 11.9%).
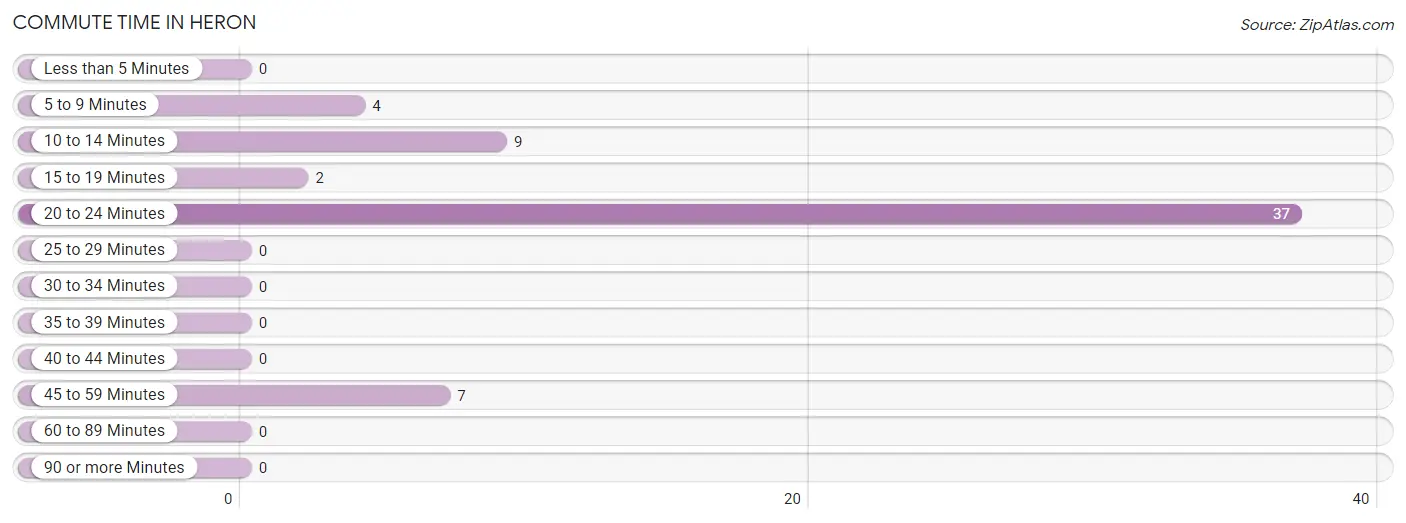
| Commute Time | # Commuters | % Commuters |
| Less than 5 Minutes | 0 | 0.0% |
| 5 to 9 Minutes | 4 | 6.8% |
| 10 to 14 Minutes | 9 | 15.2% |
| 15 to 19 Minutes | 2 | 3.4% |
| 20 to 24 Minutes | 37 | 62.7% |
| 25 to 29 Minutes | 0 | 0.0% |
| 30 to 34 Minutes | 0 | 0.0% |
| 35 to 39 Minutes | 0 | 0.0% |
| 40 to 44 Minutes | 0 | 0.0% |
| 45 to 59 Minutes | 7 | 11.9% |
| 60 to 89 Minutes | 0 | 0.0% |
| 90 or more Minutes | 0 | 0.0% |
Commute Time by Sex in Heron
The most common commute times in Heron are 20 to 24 minutes (37 commuters, 75.5%) for males and 10 to 14 minutes (4 commuters, 40.0%) for females.
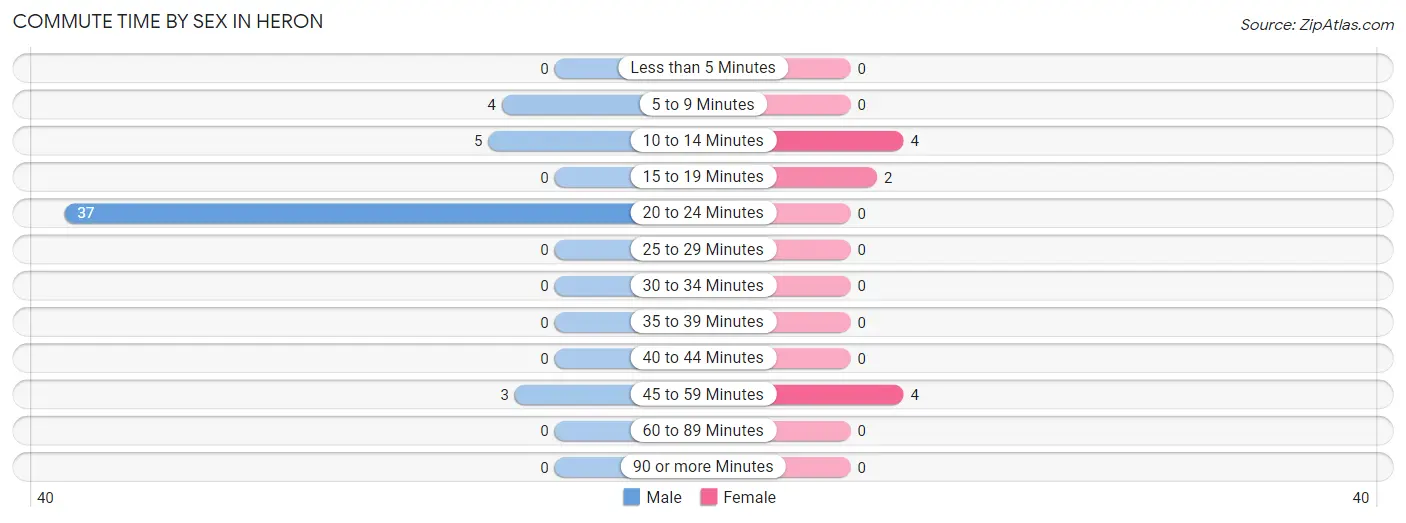
| Commute Time | Male | Female |
| Less than 5 Minutes | 0 (0.0%) | 0 (0.0%) |
| 5 to 9 Minutes | 4 (8.2%) | 0 (0.0%) |
| 10 to 14 Minutes | 5 (10.2%) | 4 (40.0%) |
| 15 to 19 Minutes | 0 (0.0%) | 2 (20.0%) |
| 20 to 24 Minutes | 37 (75.5%) | 0 (0.0%) |
| 25 to 29 Minutes | 0 (0.0%) | 0 (0.0%) |
| 30 to 34 Minutes | 0 (0.0%) | 0 (0.0%) |
| 35 to 39 Minutes | 0 (0.0%) | 0 (0.0%) |
| 40 to 44 Minutes | 0 (0.0%) | 0 (0.0%) |
| 45 to 59 Minutes | 3 (6.1%) | 4 (40.0%) |
| 60 to 89 Minutes | 0 (0.0%) | 0 (0.0%) |
| 90 or more Minutes | 0 (0.0%) | 0 (0.0%) |
Time of Departure to Work by Sex in Heron
The most frequent times of departure to work in Heron are 8:00 AM to 8:29 AM (37, 75.5%) for males and 6:30 AM to 6:59 AM (6, 60.0%) for females.
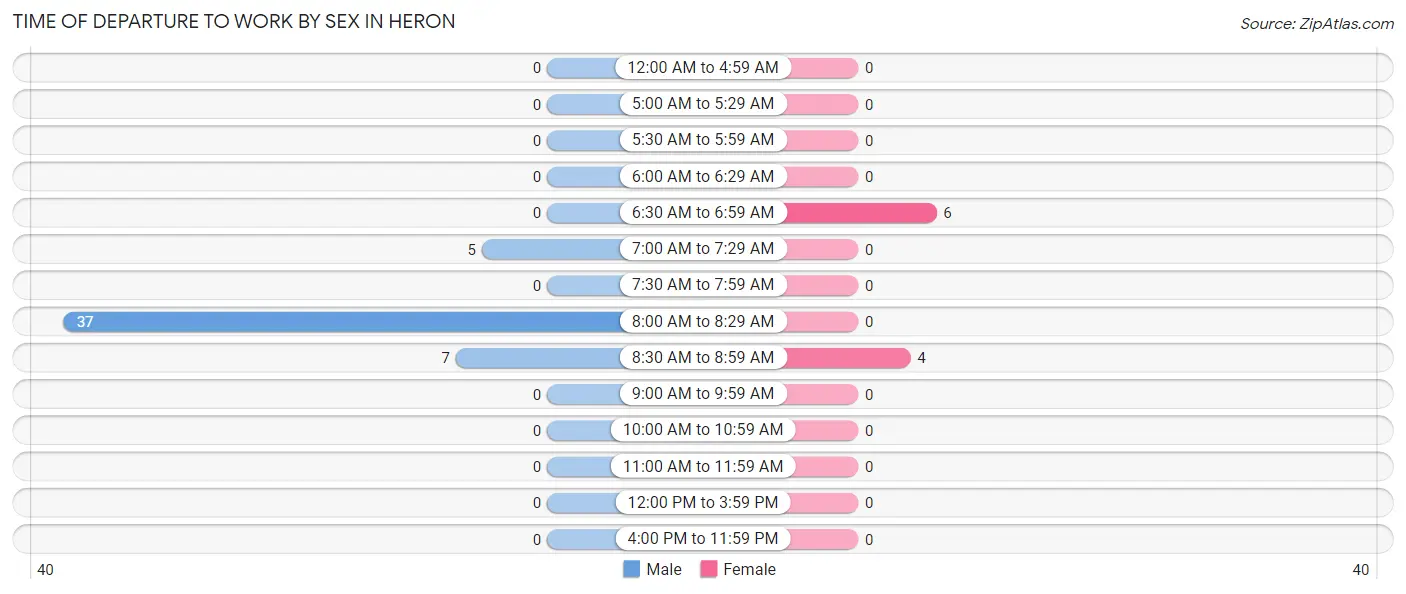
| Time of Departure | Male | Female |
| 12:00 AM to 4:59 AM | 0 (0.0%) | 0 (0.0%) |
| 5:00 AM to 5:29 AM | 0 (0.0%) | 0 (0.0%) |
| 5:30 AM to 5:59 AM | 0 (0.0%) | 0 (0.0%) |
| 6:00 AM to 6:29 AM | 0 (0.0%) | 0 (0.0%) |
| 6:30 AM to 6:59 AM | 0 (0.0%) | 6 (60.0%) |
| 7:00 AM to 7:29 AM | 5 (10.2%) | 0 (0.0%) |
| 7:30 AM to 7:59 AM | 0 (0.0%) | 0 (0.0%) |
| 8:00 AM to 8:29 AM | 37 (75.5%) | 0 (0.0%) |
| 8:30 AM to 8:59 AM | 7 (14.3%) | 4 (40.0%) |
| 9:00 AM to 9:59 AM | 0 (0.0%) | 0 (0.0%) |
| 10:00 AM to 10:59 AM | 0 (0.0%) | 0 (0.0%) |
| 11:00 AM to 11:59 AM | 0 (0.0%) | 0 (0.0%) |
| 12:00 PM to 3:59 PM | 0 (0.0%) | 0 (0.0%) |
| 4:00 PM to 11:59 PM | 0 (0.0%) | 0 (0.0%) |
| Total | 49 (100.0%) | 10 (100.0%) |
Housing Occupancy in Heron
Occupancy by Ownership in Heron
Of the total 99 dwellings in Heron, owner-occupied units account for 63 (63.6%), while renter-occupied units make up 36 (36.4%).
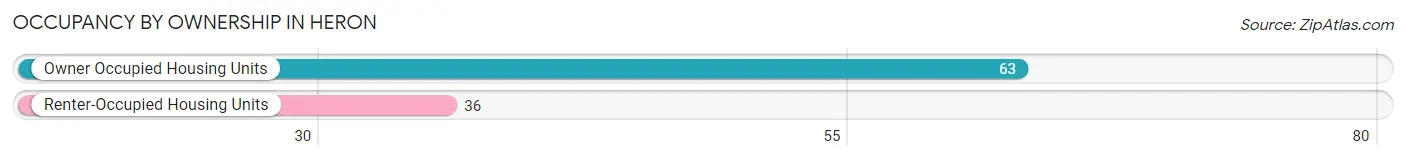
| Occupancy | # Housing Units | % Housing Units |
| Owner Occupied Housing Units | 63 | 63.6% |
| Renter-Occupied Housing Units | 36 | 36.4% |
| Total Occupied Housing Units | 99 | 100.0% |
Occupancy by Household Size in Heron
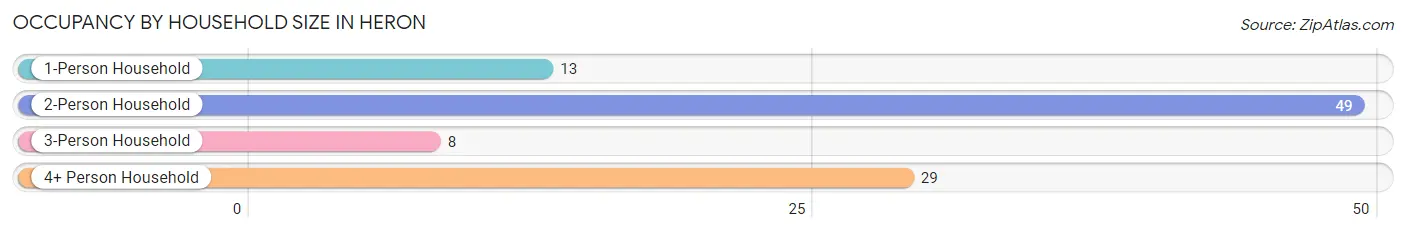
| Household Size | # Housing Units | % Housing Units |
| 1-Person Household | 13 | 13.1% |
| 2-Person Household | 49 | 49.5% |
| 3-Person Household | 8 | 8.1% |
| 4+ Person Household | 29 | 29.3% |
| Total Housing Units | 99 | 100.0% |
Occupancy by Ownership by Household Size in Heron
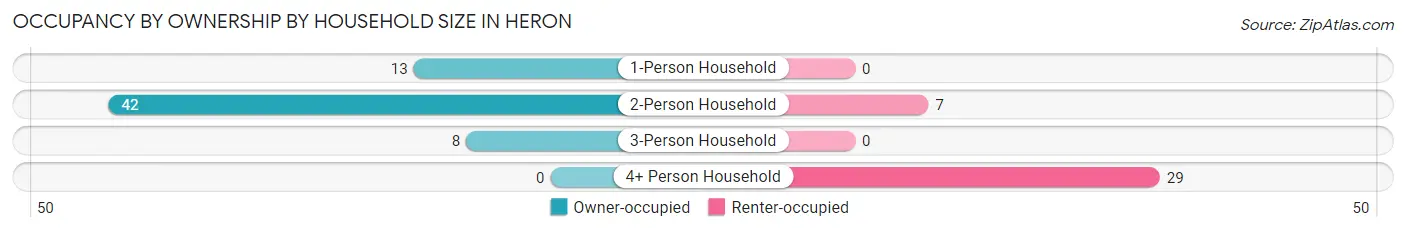
| Household Size | Owner-occupied | Renter-occupied |
| 1-Person Household | 13 (100.0%) | 0 (0.0%) |
| 2-Person Household | 42 (85.7%) | 7 (14.3%) |
| 3-Person Household | 8 (100.0%) | 0 (0.0%) |
| 4+ Person Household | 0 (0.0%) | 29 (100.0%) |
| Total Housing Units | 63 (63.6%) | 36 (36.4%) |
Occupancy by Educational Attainment in Heron
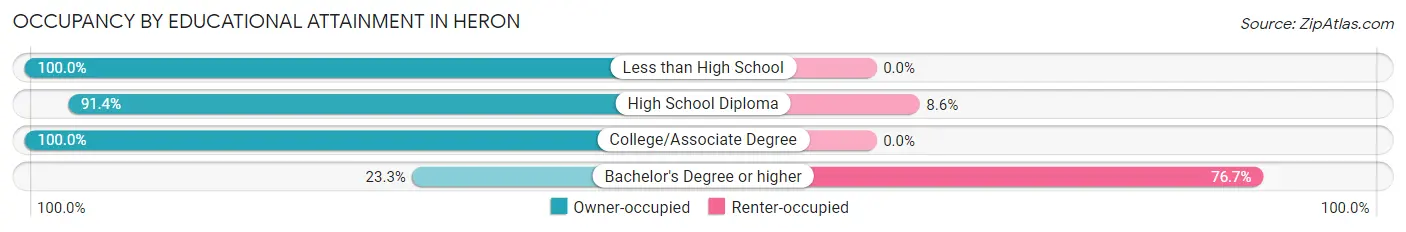
| Household Size | Owner-occupied | Renter-occupied |
| Less than High School | 2 (100.0%) | 0 (0.0%) |
| High School Diploma | 32 (91.4%) | 3 (8.6%) |
| College/Associate Degree | 19 (100.0%) | 0 (0.0%) |
| Bachelor's Degree or higher | 10 (23.3%) | 33 (76.7%) |
Occupancy by Age of Householder in Heron
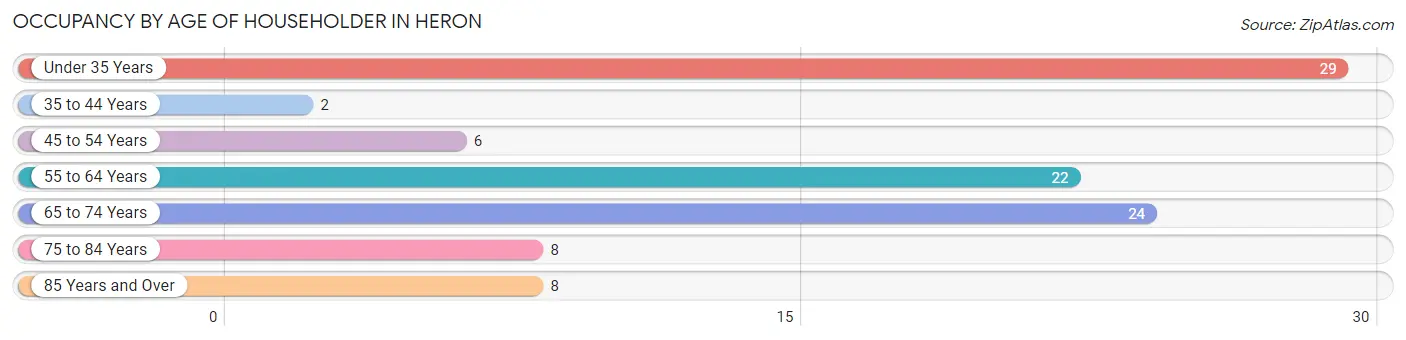
| Age Bracket | # Households | % Households |
| Under 35 Years | 29 | 29.3% |
| 35 to 44 Years | 2 | 2.0% |
| 45 to 54 Years | 6 | 6.1% |
| 55 to 64 Years | 22 | 22.2% |
| 65 to 74 Years | 24 | 24.2% |
| 75 to 84 Years | 8 | 8.1% |
| 85 Years and Over | 8 | 8.1% |
| Total | 99 | 100.0% |
Housing Finances in Heron
Median Income by Occupancy in Heron
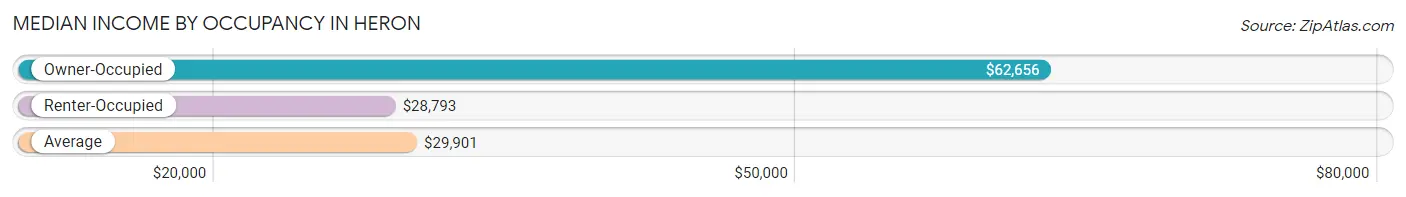
| Occupancy Type | # Households | Median Income |
| Owner-Occupied | 63 (63.6%) | $62,656 |
| Renter-Occupied | 36 (36.4%) | $28,793 |
| Average | 99 (100.0%) | $29,901 |
Occupancy by Householder Income Bracket in Heron
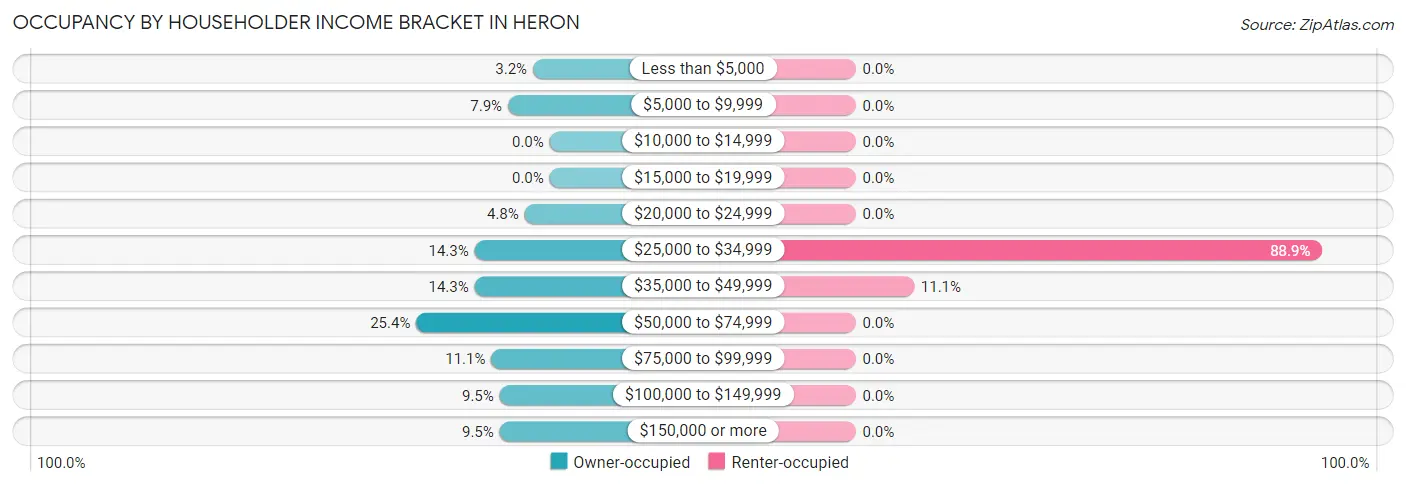
| Income Bracket | Owner-occupied | Renter-occupied |
| Less than $5,000 | 2 (3.2%) | 0 (0.0%) |
| $5,000 to $9,999 | 5 (7.9%) | 0 (0.0%) |
| $10,000 to $14,999 | 0 (0.0%) | 0 (0.0%) |
| $15,000 to $19,999 | 0 (0.0%) | 0 (0.0%) |
| $20,000 to $24,999 | 3 (4.8%) | 0 (0.0%) |
| $25,000 to $34,999 | 9 (14.3%) | 32 (88.9%) |
| $35,000 to $49,999 | 9 (14.3%) | 4 (11.1%) |
| $50,000 to $74,999 | 16 (25.4%) | 0 (0.0%) |
| $75,000 to $99,999 | 7 (11.1%) | 0 (0.0%) |
| $100,000 to $149,999 | 6 (9.5%) | 0 (0.0%) |
| $150,000 or more | 6 (9.5%) | 0 (0.0%) |
| Total | 63 (100.0%) | 36 (100.0%) |
Monthly Housing Cost Tiers in Heron
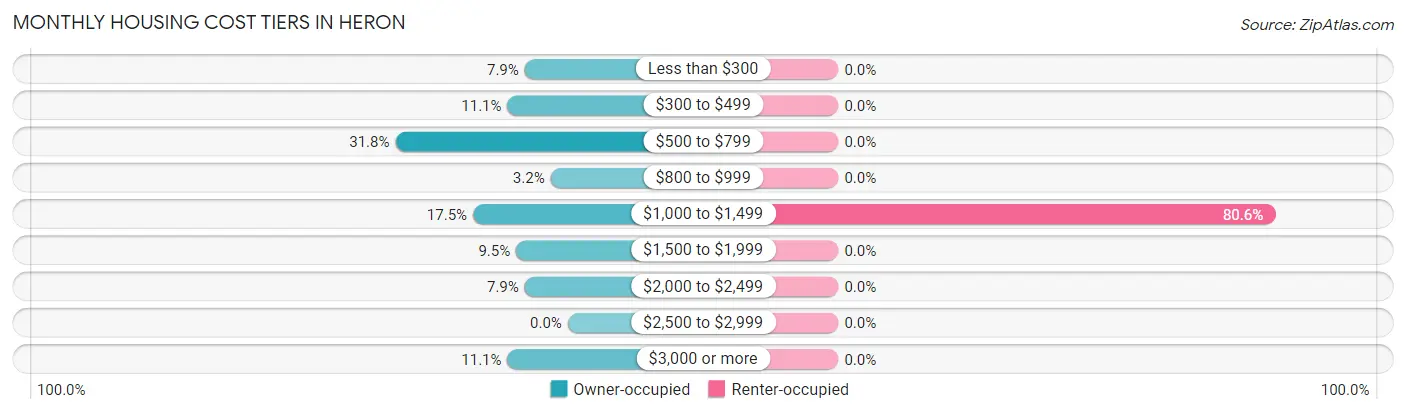
| Monthly Cost | Owner-occupied | Renter-occupied |
| Less than $300 | 5 (7.9%) | 0 (0.0%) |
| $300 to $499 | 7 (11.1%) | 0 (0.0%) |
| $500 to $799 | 20 (31.8%) | 0 (0.0%) |
| $800 to $999 | 2 (3.2%) | 0 (0.0%) |
| $1,000 to $1,499 | 11 (17.5%) | 29 (80.6%) |
| $1,500 to $1,999 | 6 (9.5%) | 0 (0.0%) |
| $2,000 to $2,499 | 5 (7.9%) | 0 (0.0%) |
| $2,500 to $2,999 | 0 (0.0%) | 0 (0.0%) |
| $3,000 or more | 7 (11.1%) | 0 (0.0%) |
| Total | 63 (100.0%) | 36 (100.0%) |
Physical Housing Characteristics in Heron
Housing Structures in Heron
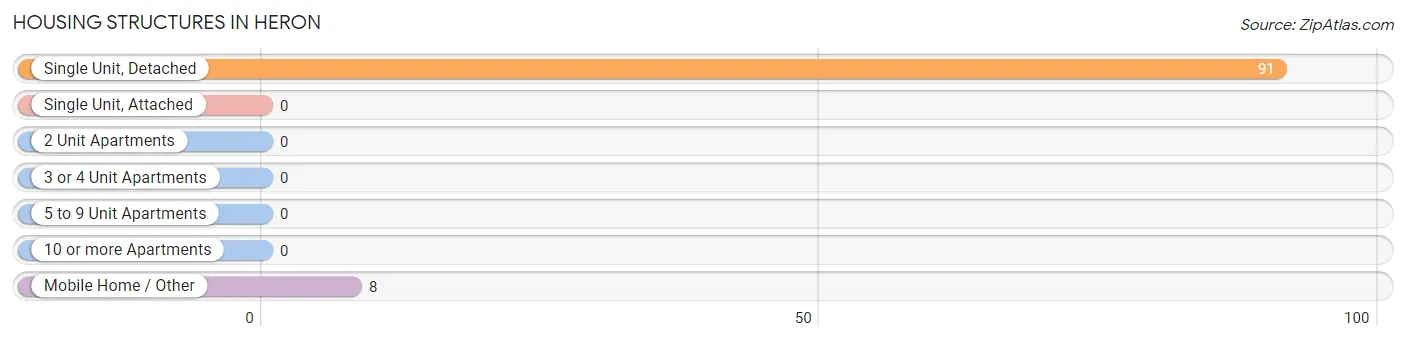
| Structure Type | # Housing Units | % Housing Units |
| Single Unit, Detached | 91 | 91.9% |
| Single Unit, Attached | 0 | 0.0% |
| 2 Unit Apartments | 0 | 0.0% |
| 3 or 4 Unit Apartments | 0 | 0.0% |
| 5 to 9 Unit Apartments | 0 | 0.0% |
| 10 or more Apartments | 0 | 0.0% |
| Mobile Home / Other | 8 | 8.1% |
| Total | 99 | 100.0% |
Housing Structures by Occupancy in Heron
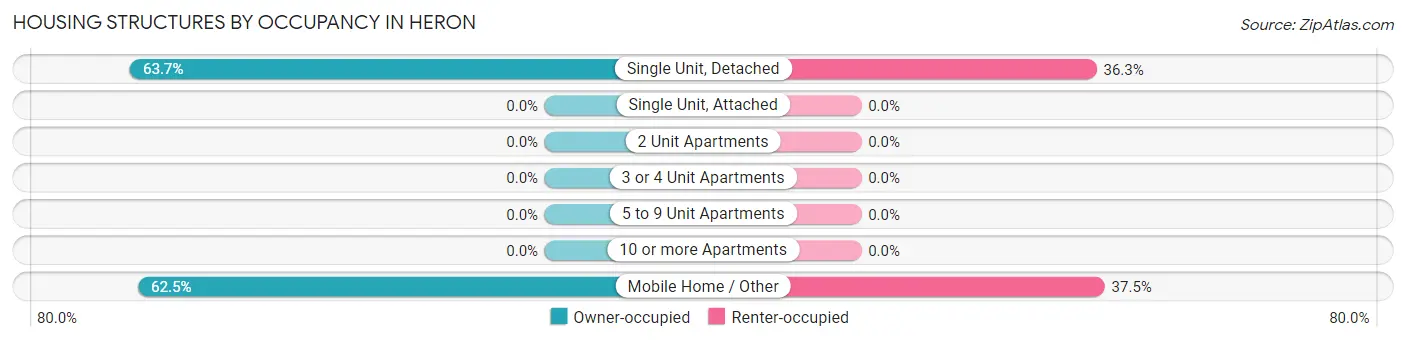
| Structure Type | Owner-occupied | Renter-occupied |
| Single Unit, Detached | 58 (63.7%) | 33 (36.3%) |
| Single Unit, Attached | 0 (0.0%) | 0 (0.0%) |
| 2 Unit Apartments | 0 (0.0%) | 0 (0.0%) |
| 3 or 4 Unit Apartments | 0 (0.0%) | 0 (0.0%) |
| 5 to 9 Unit Apartments | 0 (0.0%) | 0 (0.0%) |
| 10 or more Apartments | 0 (0.0%) | 0 (0.0%) |
| Mobile Home / Other | 5 (62.5%) | 3 (37.5%) |
| Total | 63 (63.6%) | 36 (36.4%) |
Housing Structures by Number of Rooms in Heron
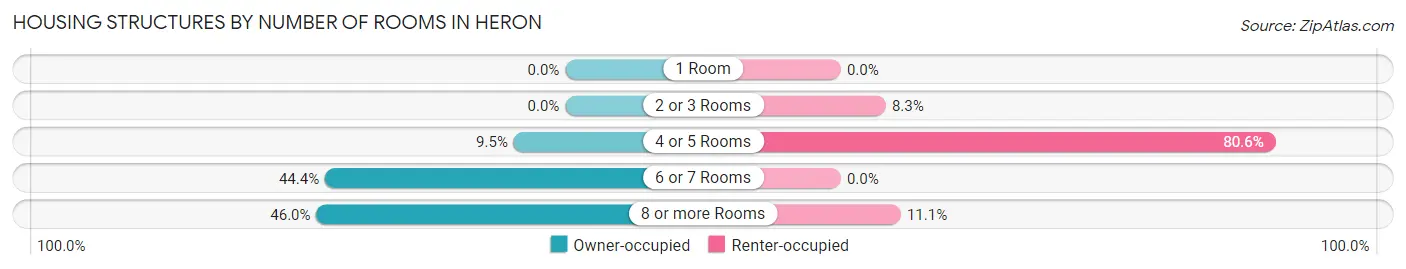
| Number of Rooms | Owner-occupied | Renter-occupied |
| 1 Room | 0 (0.0%) | 0 (0.0%) |
| 2 or 3 Rooms | 0 (0.0%) | 3 (8.3%) |
| 4 or 5 Rooms | 6 (9.5%) | 29 (80.6%) |
| 6 or 7 Rooms | 28 (44.4%) | 0 (0.0%) |
| 8 or more Rooms | 29 (46.0%) | 4 (11.1%) |
| Total | 63 (100.0%) | 36 (100.0%) |
Housing Structure by Heating Type in Heron
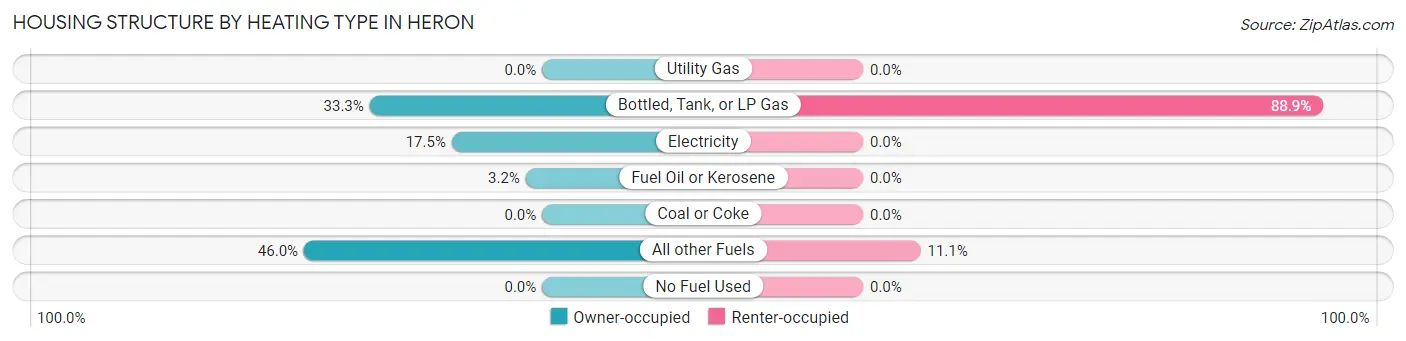
| Heating Type | Owner-occupied | Renter-occupied |
| Utility Gas | 0 (0.0%) | 0 (0.0%) |
| Bottled, Tank, or LP Gas | 21 (33.3%) | 32 (88.9%) |
| Electricity | 11 (17.5%) | 0 (0.0%) |
| Fuel Oil or Kerosene | 2 (3.2%) | 0 (0.0%) |
| Coal or Coke | 0 (0.0%) | 0 (0.0%) |
| All other Fuels | 29 (46.0%) | 4 (11.1%) |
| No Fuel Used | 0 (0.0%) | 0 (0.0%) |
| Total | 63 (100.0%) | 36 (100.0%) |
Household Vehicle Usage in Heron
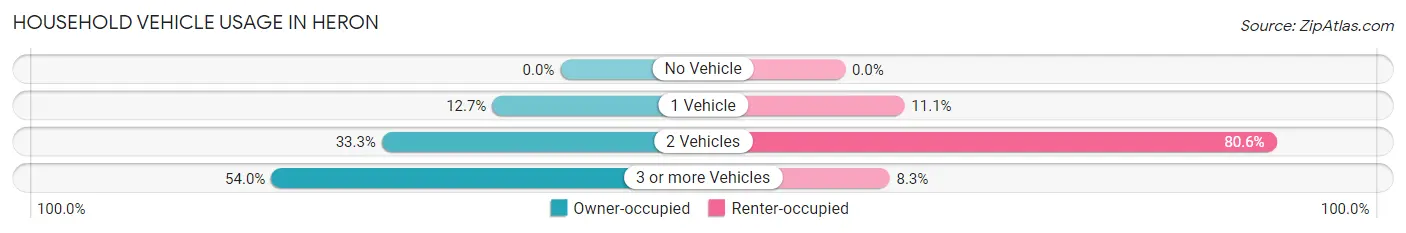
| Vehicles per Household | Owner-occupied | Renter-occupied |
| No Vehicle | 0 (0.0%) | 0 (0.0%) |
| 1 Vehicle | 8 (12.7%) | 4 (11.1%) |
| 2 Vehicles | 21 (33.3%) | 29 (80.6%) |
| 3 or more Vehicles | 34 (54.0%) | 3 (8.3%) |
| Total | 63 (100.0%) | 36 (100.0%) |
Real Estate & Mortgages in Heron
Real Estate and Mortgage Overview in Heron
| Characteristic | Without Mortgage | With Mortgage |
| Housing Units | 37 | 26 |
| Median Property Value | $275,000 | $292,900 |
| Median Household Income | $52,083 | $3 |
| Monthly Housing Costs | $533 | $7 |
| Real Estate Taxes | $1,775 | $5 |
Property Value by Mortgage Status in Heron
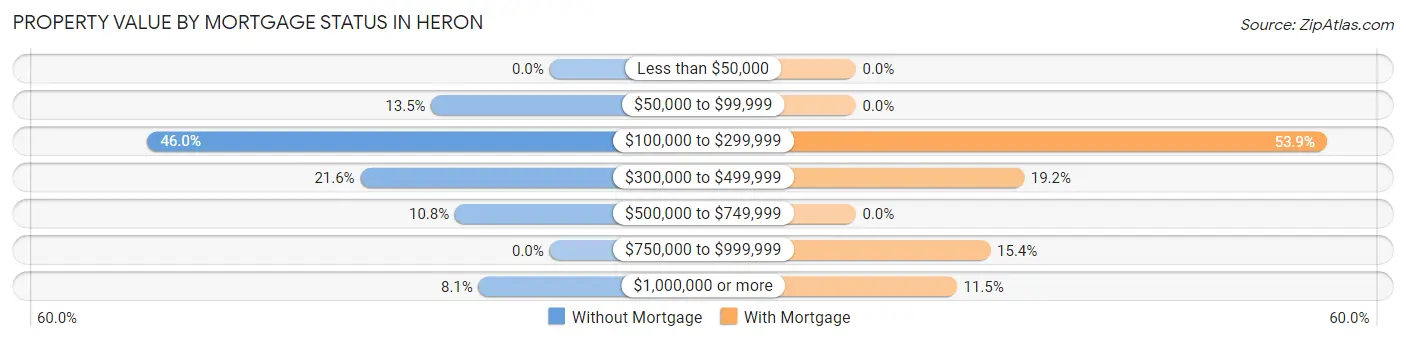
| Property Value | Without Mortgage | With Mortgage |
| Less than $50,000 | 0 (0.0%) | 0 (0.0%) |
| $50,000 to $99,999 | 5 (13.5%) | 0 (0.0%) |
| $100,000 to $299,999 | 17 (46.0%) | 14 (53.8%) |
| $300,000 to $499,999 | 8 (21.6%) | 5 (19.2%) |
| $500,000 to $749,999 | 4 (10.8%) | 0 (0.0%) |
| $750,000 to $999,999 | 0 (0.0%) | 4 (15.4%) |
| $1,000,000 or more | 3 (8.1%) | 3 (11.5%) |
| Total | 37 (100.0%) | 26 (100.0%) |
Household Income by Mortgage Status in Heron
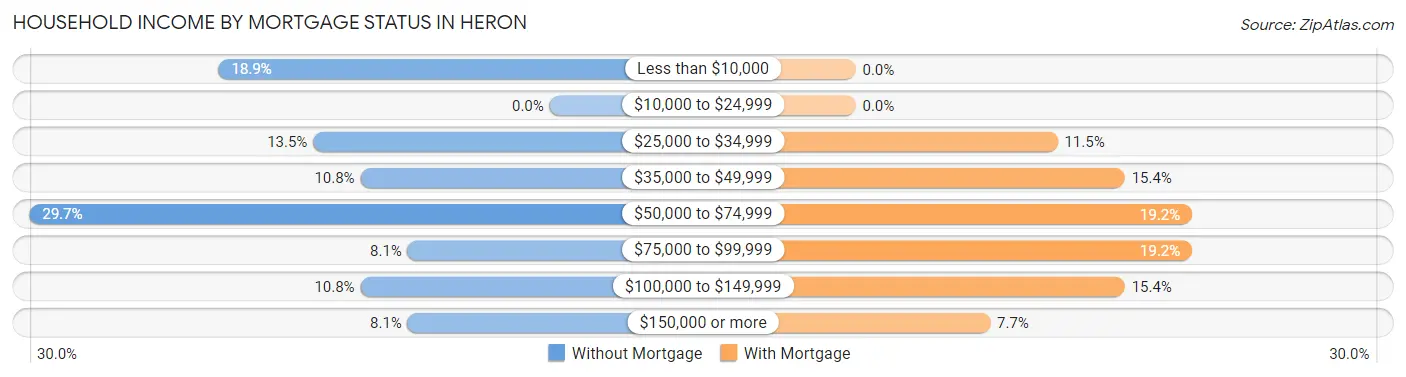
| Household Income | Without Mortgage | With Mortgage |
| Less than $10,000 | 7 (18.9%) | 0 (0.0%) |
| $10,000 to $24,999 | 0 (0.0%) | 0 (0.0%) |
| $25,000 to $34,999 | 5 (13.5%) | 3 (11.5%) |
| $35,000 to $49,999 | 4 (10.8%) | 4 (15.4%) |
| $50,000 to $74,999 | 11 (29.7%) | 5 (19.2%) |
| $75,000 to $99,999 | 3 (8.1%) | 5 (19.2%) |
| $100,000 to $149,999 | 4 (10.8%) | 4 (15.4%) |
| $150,000 or more | 3 (8.1%) | 2 (7.7%) |
| Total | 37 (100.0%) | 26 (100.0%) |
Property Value to Household Income Ratio in Heron
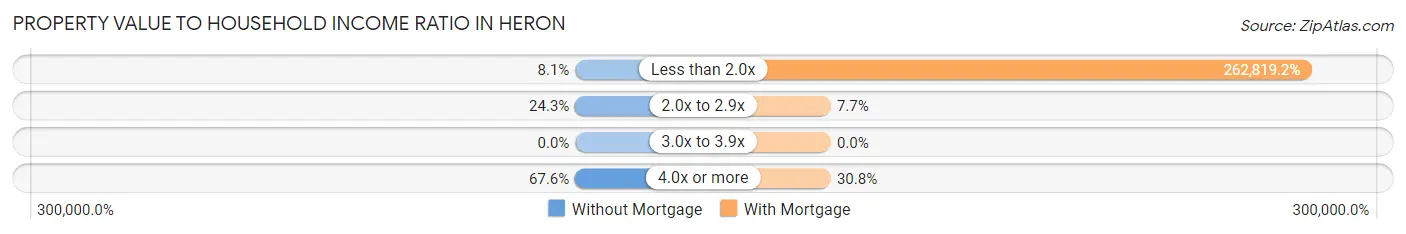
| Value-to-Income Ratio | Without Mortgage | With Mortgage |
| Less than 2.0x | 3 (8.1%) | 68,333 (262,819.2%) |
| 2.0x to 2.9x | 9 (24.3%) | 2 (7.7%) |
| 3.0x to 3.9x | 0 (0.0%) | 0 (0.0%) |
| 4.0x or more | 25 (67.6%) | 8 (30.8%) |
| Total | 37 (100.0%) | 26 (100.0%) |
Real Estate Taxes by Mortgage Status in Heron
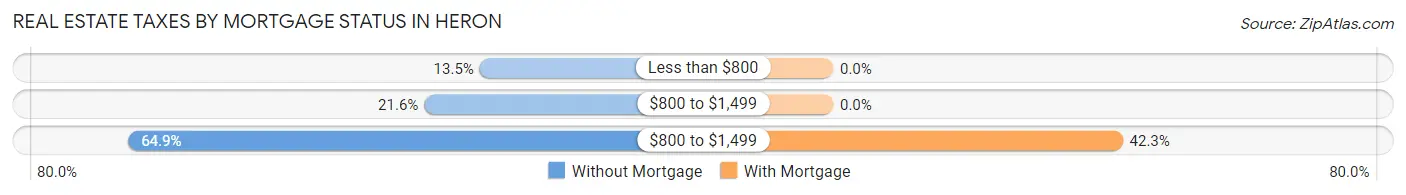
| Property Taxes | Without Mortgage | With Mortgage |
| Less than $800 | 5 (13.5%) | 0 (0.0%) |
| $800 to $1,499 | 8 (21.6%) | 0 (0.0%) |
| $800 to $1,499 | 24 (64.9%) | 11 (42.3%) |
| Total | 37 (100.0%) | 26 (100.0%) |
Health & Disability in Heron
Health Insurance Coverage by Age in Heron
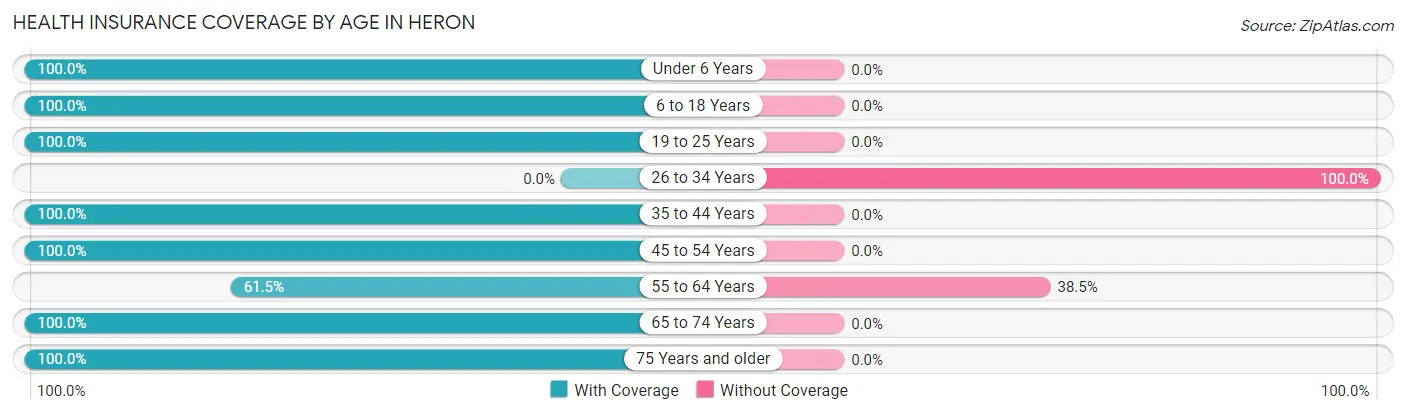
| Age Bracket | With Coverage | Without Coverage |
| Under 6 Years | 60 (100.0%) | 0 (0.0%) |
| 6 to 18 Years | 29 (100.0%) | 0 (0.0%) |
| 19 to 25 Years | 11 (100.0%) | 0 (0.0%) |
| 26 to 34 Years | 0 (0.0%) | 66 (100.0%) |
| 35 to 44 Years | 2 (100.0%) | 0 (0.0%) |
| 45 to 54 Years | 24 (100.0%) | 0 (0.0%) |
| 55 to 64 Years | 24 (61.5%) | 15 (38.5%) |
| 65 to 74 Years | 42 (100.0%) | 0 (0.0%) |
| 75 Years and older | 26 (100.0%) | 0 (0.0%) |
| Total | 218 (72.9%) | 81 (27.1%) |
Health Insurance Coverage by Citizenship Status in Heron
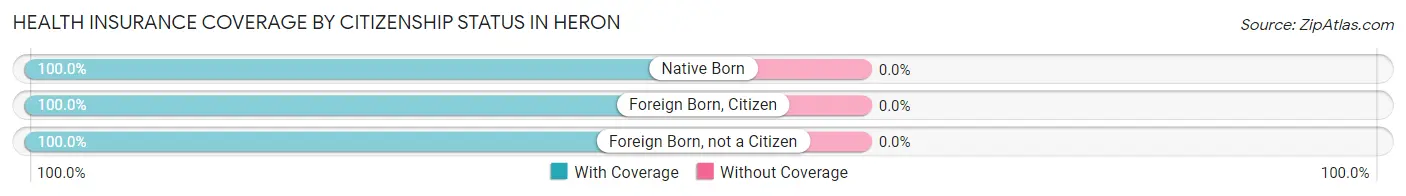
| Citizenship Status | With Coverage | Without Coverage |
| Native Born | 60 (100.0%) | 0 (0.0%) |
| Foreign Born, Citizen | 29 (100.0%) | 0 (0.0%) |
| Foreign Born, not a Citizen | 11 (100.0%) | 0 (0.0%) |
Health Insurance Coverage by Household Income in Heron
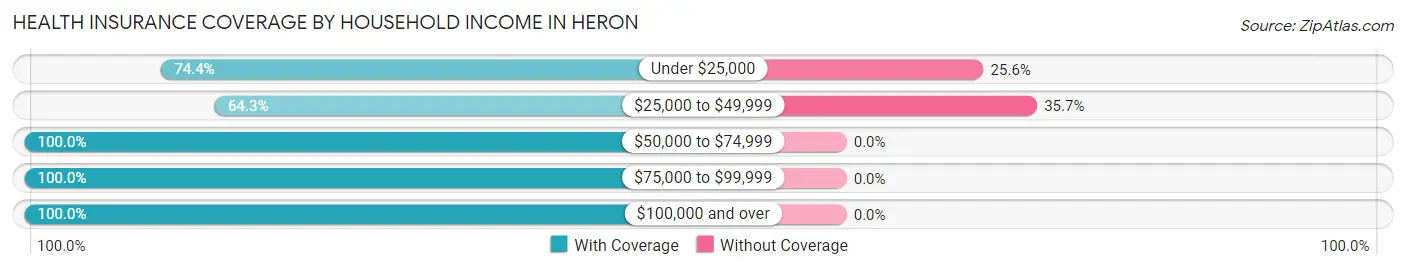
| Household Income | With Coverage | Without Coverage |
| Under $25,000 | 29 (74.4%) | 10 (25.6%) |
| $25,000 to $49,999 | 128 (64.3%) | 71 (35.7%) |
| $50,000 to $74,999 | 22 (100.0%) | 0 (0.0%) |
| $75,000 to $99,999 | 16 (100.0%) | 0 (0.0%) |
| $100,000 and over | 23 (100.0%) | 0 (0.0%) |
Public vs Private Health Insurance Coverage by Age in Heron
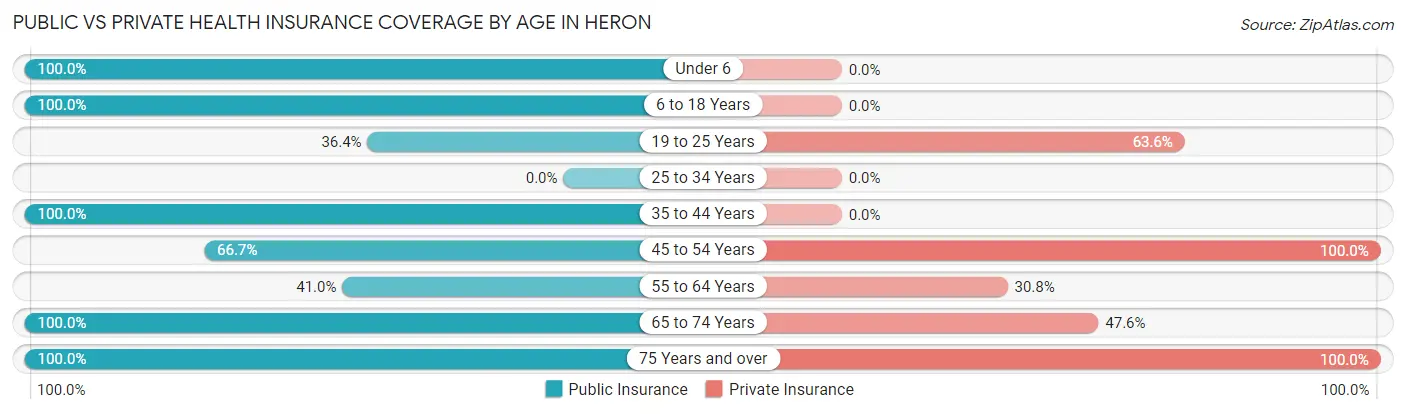
| Age Bracket | Public Insurance | Private Insurance |
| Under 6 | 60 (100.0%) | 0 (0.0%) |
| 6 to 18 Years | 29 (100.0%) | 0 (0.0%) |
| 19 to 25 Years | 4 (36.4%) | 7 (63.6%) |
| 25 to 34 Years | 0 (0.0%) | 0 (0.0%) |
| 35 to 44 Years | 2 (100.0%) | 0 (0.0%) |
| 45 to 54 Years | 16 (66.7%) | 24 (100.0%) |
| 55 to 64 Years | 16 (41.0%) | 12 (30.8%) |
| 65 to 74 Years | 42 (100.0%) | 20 (47.6%) |
| 75 Years and over | 26 (100.0%) | 26 (100.0%) |
| Total | 195 (65.2%) | 89 (29.8%) |
Disability Status by Sex by Age in Heron
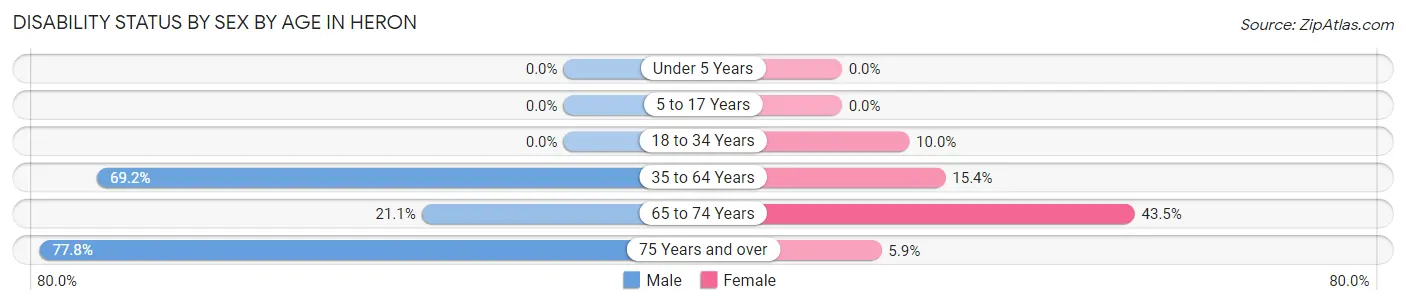
| Age Bracket | Male | Female |
| Under 5 Years | 0 (0.0%) | 0 (0.0%) |
| 5 to 17 Years | 0 (0.0%) | 0 (0.0%) |
| 18 to 34 Years | 0 (0.0%) | 4 (10.0%) |
| 35 to 64 Years | 27 (69.2%) | 4 (15.4%) |
| 65 to 74 Years | 4 (21.0%) | 10 (43.5%) |
| 75 Years and over | 7 (77.8%) | 1 (5.9%) |
Disability Class by Sex by Age in Heron
Disability Class: Hearing Difficulty
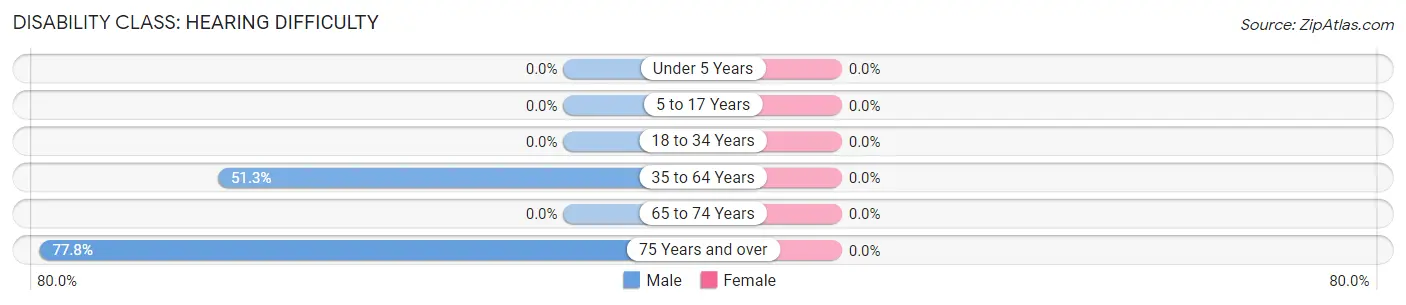
| Age Bracket | Male | Female |
| Under 5 Years | 0 (0.0%) | 0 (0.0%) |
| 5 to 17 Years | 0 (0.0%) | 0 (0.0%) |
| 18 to 34 Years | 0 (0.0%) | 0 (0.0%) |
| 35 to 64 Years | 20 (51.3%) | 0 (0.0%) |
| 65 to 74 Years | 0 (0.0%) | 0 (0.0%) |
| 75 Years and over | 7 (77.8%) | 0 (0.0%) |
Disability Class: Vision Difficulty
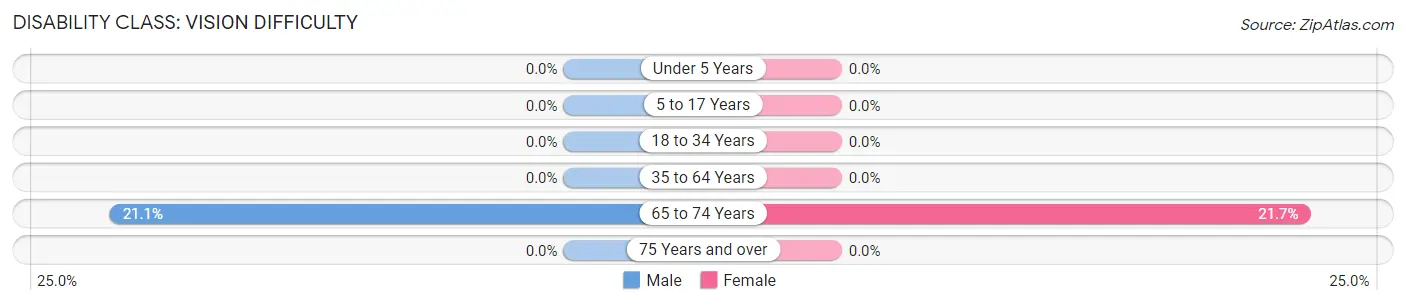
| Age Bracket | Male | Female |
| Under 5 Years | 0 (0.0%) | 0 (0.0%) |
| 5 to 17 Years | 0 (0.0%) | 0 (0.0%) |
| 18 to 34 Years | 0 (0.0%) | 0 (0.0%) |
| 35 to 64 Years | 0 (0.0%) | 0 (0.0%) |
| 65 to 74 Years | 4 (21.0%) | 5 (21.7%) |
| 75 Years and over | 0 (0.0%) | 0 (0.0%) |
Disability Class: Cognitive Difficulty
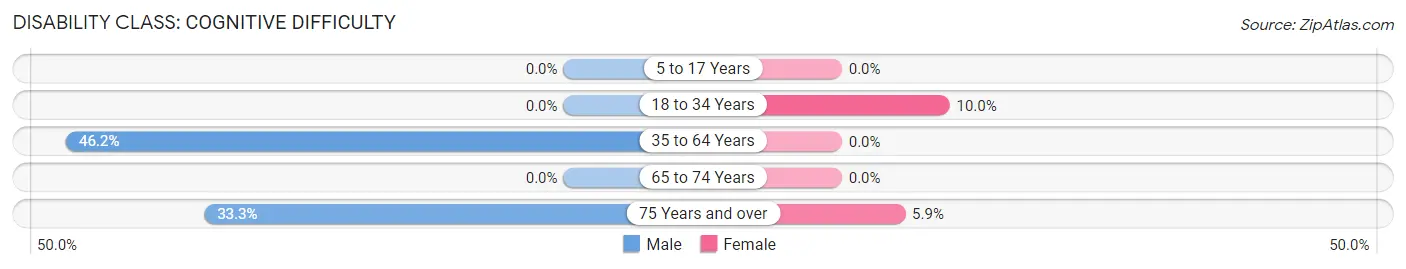
| Age Bracket | Male | Female |
| 5 to 17 Years | 0 (0.0%) | 0 (0.0%) |
| 18 to 34 Years | 0 (0.0%) | 4 (10.0%) |
| 35 to 64 Years | 18 (46.2%) | 0 (0.0%) |
| 65 to 74 Years | 0 (0.0%) | 0 (0.0%) |
| 75 Years and over | 3 (33.3%) | 1 (5.9%) |
Disability Class: Ambulatory Difficulty
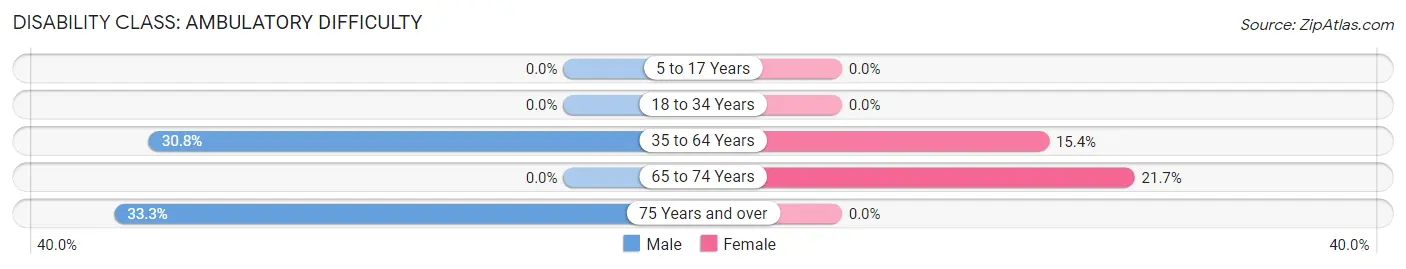
| Age Bracket | Male | Female |
| 5 to 17 Years | 0 (0.0%) | 0 (0.0%) |
| 18 to 34 Years | 0 (0.0%) | 0 (0.0%) |
| 35 to 64 Years | 12 (30.8%) | 4 (15.4%) |
| 65 to 74 Years | 0 (0.0%) | 5 (21.7%) |
| 75 Years and over | 3 (33.3%) | 0 (0.0%) |
Disability Class: Self-Care Difficulty
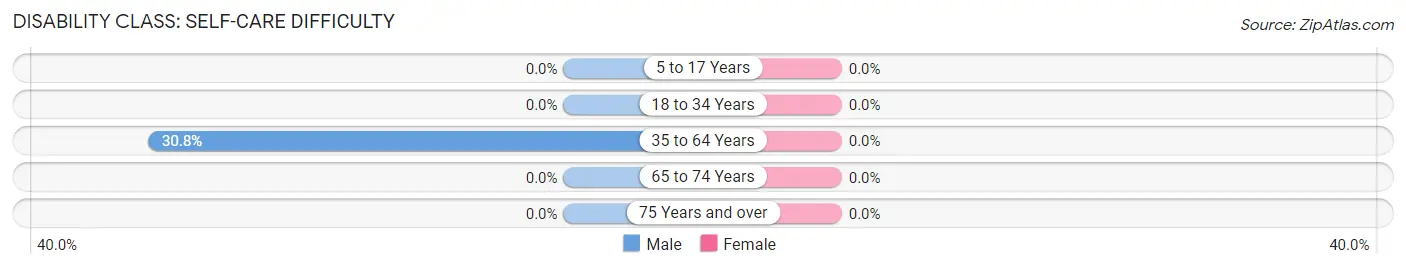
| Age Bracket | Male | Female |
| 5 to 17 Years | 0 (0.0%) | 0 (0.0%) |
| 18 to 34 Years | 0 (0.0%) | 0 (0.0%) |
| 35 to 64 Years | 12 (30.8%) | 0 (0.0%) |
| 65 to 74 Years | 0 (0.0%) | 0 (0.0%) |
| 75 Years and over | 0 (0.0%) | 0 (0.0%) |
Technology Access in Heron
Computing Device Access in Heron
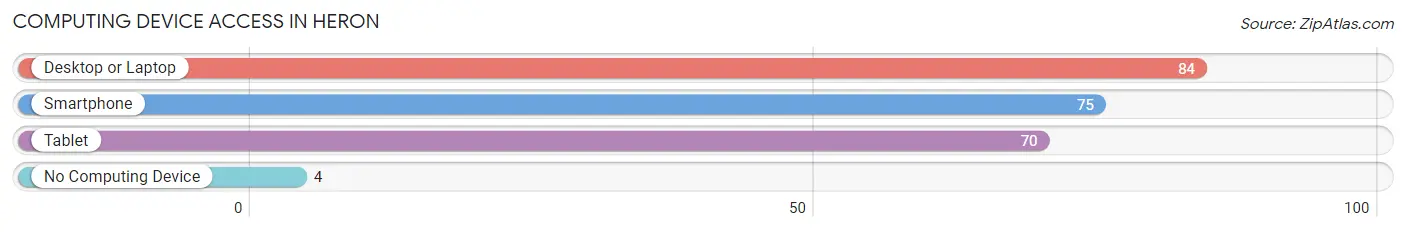
| Device Type | # Households | % Households |
| Desktop or Laptop | 84 | 84.9% |
| Smartphone | 75 | 75.8% |
| Tablet | 70 | 70.7% |
| No Computing Device | 4 | 4.0% |
| Total | 99 | 100.0% |
Internet Access in Heron
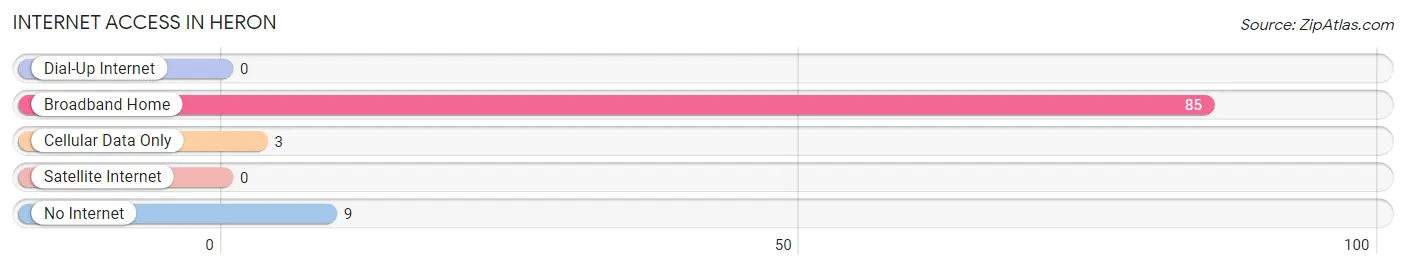
| Internet Type | # Households | % Households |
| Dial-Up Internet | 0 | 0.0% |
| Broadband Home | 85 | 85.9% |
| Cellular Data Only | 3 | 3.0% |
| Satellite Internet | 0 | 0.0% |
| No Internet | 9 | 9.1% |
| Total | 99 | 100.0% |
Heron Summary
Heron, Montana is a small town located in Sanders County, in the northwestern corner of the state. It is situated on the banks of the Clark Fork River, near the Idaho border. The town was founded in 1883 and has a population of approximately 500 people.
Geography
Heron is located in the Rocky Mountain region of Montana, in the northwestern corner of the state. It is situated on the banks of the Clark Fork River, near the Idaho border. The town is surrounded by mountains, forests, and rivers, and is known for its scenic beauty. The climate in Heron is generally mild, with cold winters and warm summers.
Economy
Heron’s economy is largely based on agriculture and tourism. The town is home to several small farms, which produce a variety of crops, including wheat, barley, and hay. The town also has a few small businesses, such as a grocery store, a hardware store, and a restaurant. Tourism is an important part of the local economy, as the town is a popular destination for outdoor recreation, such as fishing, hunting, and camping.
Demographics
As of the 2010 census, Heron had a population of 500 people. The racial makeup of the town was 95.2% White, 0.6% Native American, 0.2% Asian, 0.2% from other races, and 3.8% from two or more races. The median household income was $31,250, and the median family income was $37,500. The per capita income was $17,818.
Conclusion
Heron, Montana is a small town located in Sanders County, in the northwestern corner of the state. It is situated on the banks of the Clark Fork River, near the Idaho border. The town was founded in 1883 and has a population of approximately 500 people. The economy of Heron is largely based on agriculture and tourism, and the town is known for its scenic beauty and outdoor recreation opportunities. The population of Heron is predominantly White, with a median household income of $31,250 and a median family income of $37,500.
Common Questions
What is Per Capita Income in Heron?
Per Capita income in Heron is $18,754.
What is the Median Family Income in Heron?
Median Family Income in Heron is $29,474.
What is the Median Household income in Heron?
Median Household Income in Heron is $29,901.
What is Family Income Deficit in Heron?
Family Income Deficit in Heron is $6,990.
Families that are below poverty line in Heron earn $6,990 less on average than the poverty threshold level.
What is Inequality or Gini Index in Heron?
Inequality or Gini Index in Heron is 0.41.
What is the Total Population of Heron?
Total Population of Heron is 299.
What is the Total Male Population of Heron?
Total Male Population of Heron is 137.
What is the Total Female Population of Heron?
Total Female Population of Heron is 162.
What is the Ratio of Males per 100 Females in Heron?
There are 84.57 Males per 100 Females in Heron.
What is the Ratio of Females per 100 Males in Heron?
There are 118.25 Females per 100 Males in Heron.
What is the Median Population Age in Heron?
Median Population Age in Heron is 31.8 Years.
What is the Average Family Size in Heron
Average Family Size in Heron is 3.3 People.
What is the Average Household Size in Heron
Average Household Size in Heron is 3.0 People.
How Large is the Labor Force in Heron?
There are 80 People in the Labor Forcein in Heron.
What is the Percentage of People in the Labor Force in Heron?
37.6% of People are in the Labor Force in Heron.