Circle, AK Map & Demographics
Circle Map
Circle Overview
$19,402
PER CAPITA INCOME
$18,750
AVG HOUSEHOLD INCOME
0.39
INEQUALITY / GINI INDEX
45
TOTAL POPULATION
15
MALE POPULATION
30
FEMALE POPULATION
50.00
MALES / 100 FEMALES
200.00
FEMALES / 100 MALES
52.7
MEDIAN AGE
3.0
AVG FAMILY SIZE
1.6
AVG HOUSEHOLD SIZE
15
LABOR FORCE [ PEOPLE ]
51.7%
PERCENT IN LABOR FORCE
20.0%
UNEMPLOYMENT RATE
Circle Zip Codes
Circle Area Codes
Income in Circle
Income Overview in Circle
| Characteristic | Number | Measure |
| Per Capita Income | 45 | $19,402 |
| Median Family Income | 8 | $0 |
| Mean Family Income | 8 | $0 |
| Median Household Income | 29 | $18,750 |
| Mean Household Income | 29 | $30,107 |
| Income Deficit | 8 | $0 |
| Wage / Income Gap (%) | 45 | 0.00% |
| Wage / Income Gap ($) | 45 | 100.00¢ per $1 |
| Gini / Inequality Index | 45 | 0.39 |
Earnings by Sex in Circle
| Sex | Number | Average Earnings |
| Male | 5 (33.3%) | $0 |
| Female | 10 (66.7%) | $0 |
| Total | 15 (100.0%) | $0 |
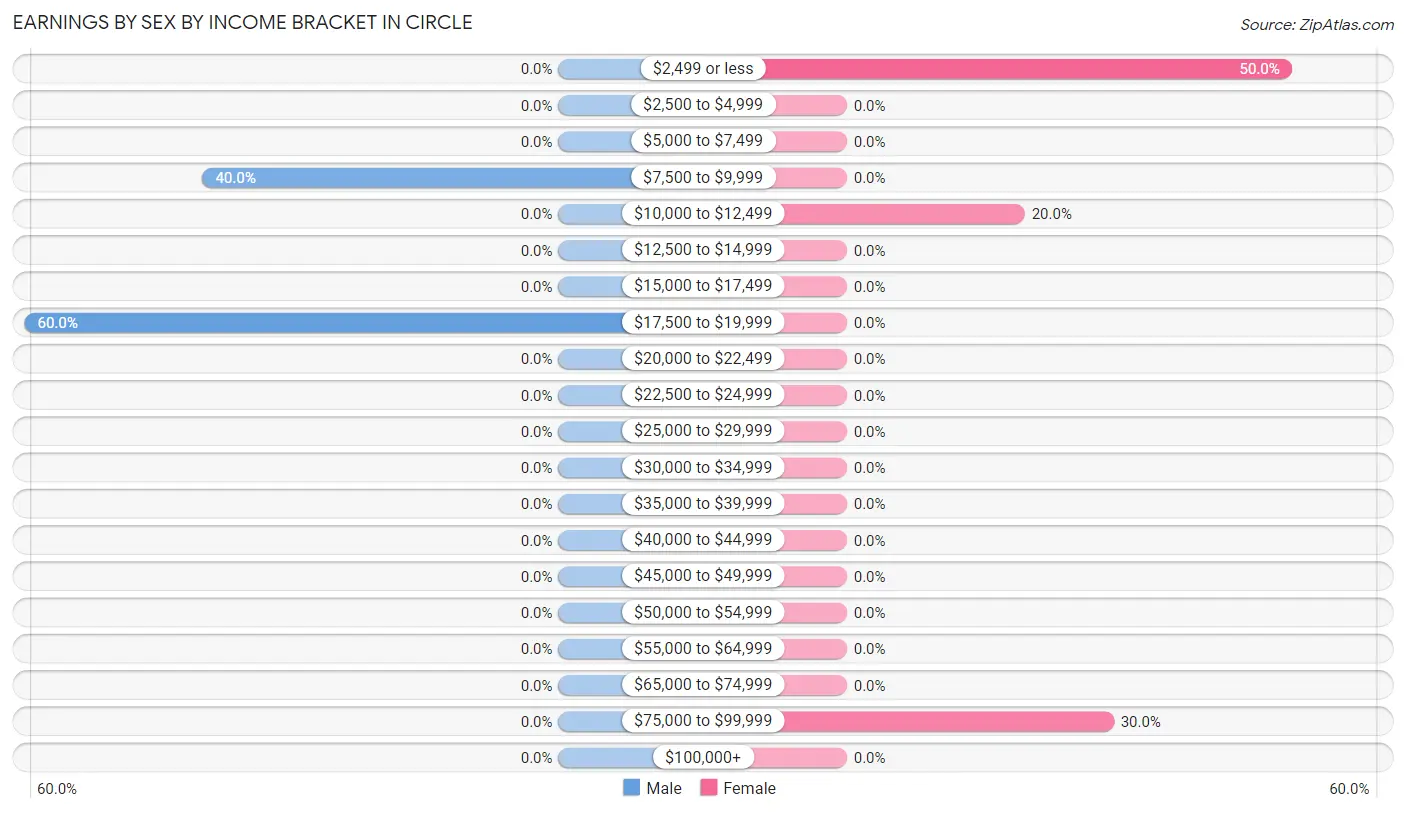
Earnings by Sex by Income Bracket in Circle
The most common earnings brackets in Circle are $17,500 to $19,999 for men (3 | 60.0%) and $2,499 or less for women (5 | 50.0%).
| Income | Male | Female |
| $2,499 or less | 0 (0.0%) | 5 (50.0%) |
| $2,500 to $4,999 | 0 (0.0%) | 0 (0.0%) |
| $5,000 to $7,499 | 0 (0.0%) | 0 (0.0%) |
| $7,500 to $9,999 | 2 (40.0%) | 0 (0.0%) |
| $10,000 to $12,499 | 0 (0.0%) | 2 (20.0%) |
| $12,500 to $14,999 | 0 (0.0%) | 0 (0.0%) |
| $15,000 to $17,499 | 0 (0.0%) | 0 (0.0%) |
| $17,500 to $19,999 | 3 (60.0%) | 0 (0.0%) |
| $20,000 to $22,499 | 0 (0.0%) | 0 (0.0%) |
| $22,500 to $24,999 | 0 (0.0%) | 0 (0.0%) |
| $25,000 to $29,999 | 0 (0.0%) | 0 (0.0%) |
| $30,000 to $34,999 | 0 (0.0%) | 0 (0.0%) |
| $35,000 to $39,999 | 0 (0.0%) | 0 (0.0%) |
| $40,000 to $44,999 | 0 (0.0%) | 0 (0.0%) |
| $45,000 to $49,999 | 0 (0.0%) | 0 (0.0%) |
| $50,000 to $54,999 | 0 (0.0%) | 0 (0.0%) |
| $55,000 to $64,999 | 0 (0.0%) | 0 (0.0%) |
| $65,000 to $74,999 | 0 (0.0%) | 0 (0.0%) |
| $75,000 to $99,999 | 0 (0.0%) | 3 (30.0%) |
| $100,000+ | 0 (0.0%) | 0 (0.0%) |
| Total | 5 (100.0%) | 10 (100.0%) |
Earnings by Sex by Educational Attainment in Circle
| Educational Attainment | Male Income | Female Income |
| Less than High School | - | - |
| High School Diploma | - | - |
| College or Associate's Degree | - | - |
| Bachelor's Degree | - | - |
| Graduate Degree | - | - |
| Total | - | - |
Family Income in Circle
Family Income Brackets in Circle
According to the Circle family income data, there are 5 families falling into the $15,000 to $24,999 income range, which is the most common income bracket and makes up 62.5% of all families.
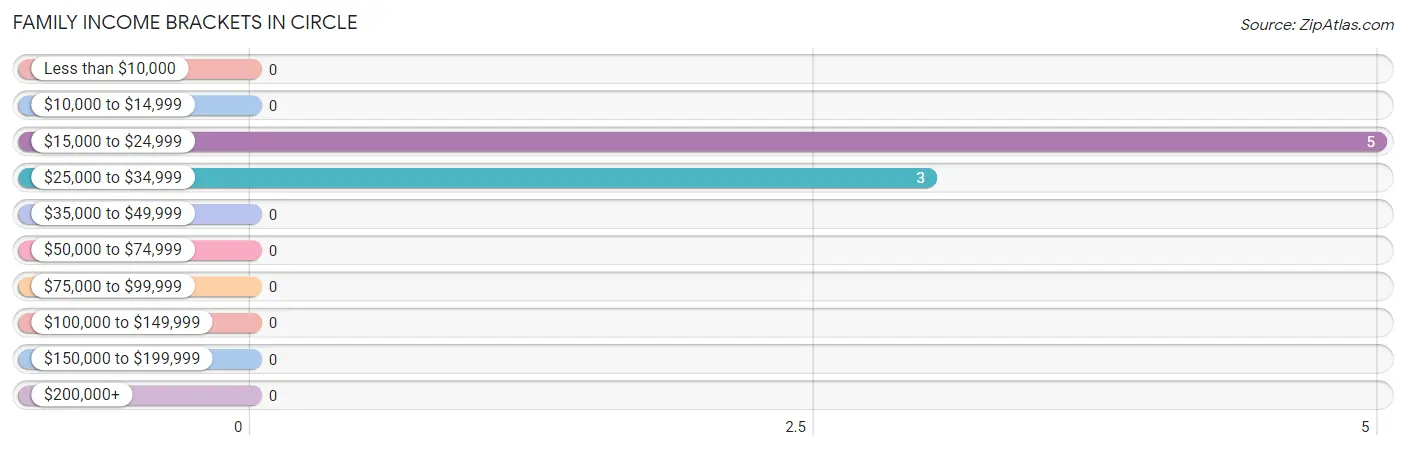
| Income Bracket | # Families | % Families |
| Less than $10,000 | 0 | 0.0% |
| $10,000 to $14,999 | 0 | 0.0% |
| $15,000 to $24,999 | 5 | 62.5% |
| $25,000 to $34,999 | 3 | 37.5% |
| $35,000 to $49,999 | 0 | 0.0% |
| $50,000 to $74,999 | 0 | 0.0% |
| $75,000 to $99,999 | 0 | 0.0% |
| $100,000 to $149,999 | 0 | 0.0% |
| $150,000 to $199,999 | 0 | 0.0% |
| $200,000+ | 0 | 0.0% |
Family Income by Famaliy Size in Circle
| Income Bracket | # Families | Median Income |
| 2-Person Families | 5 (62.5%) | $0 |
| 3-Person Families | 0 (0.0%) | $0 |
| 4-Person Families | 3 (37.5%) | $0 |
| 5-Person Families | 0 (0.0%) | $0 |
| 6-Person Families | 0 (0.0%) | $0 |
| 7+ Person Families | 0 (0.0%) | $0 |
| Total | 8 (100.0%) | $0 |
Family Income by Number of Earners in Circle
| Number of Earners | # Families | Median Income |
| No Earners | 3 (37.5%) | $0 |
| 1 Earner | 5 (62.5%) | $0 |
| 2 Earners | 0 (0.0%) | $0 |
| 3+ Earners | 0 (0.0%) | $0 |
| Total | 8 (100.0%) | $0 |
Household Income in Circle
Household Income Brackets in Circle
With 10 households falling in the category, the $15,000 to $24,999 income range is the most frequent in Circle, accounting for 34.5% of all households.
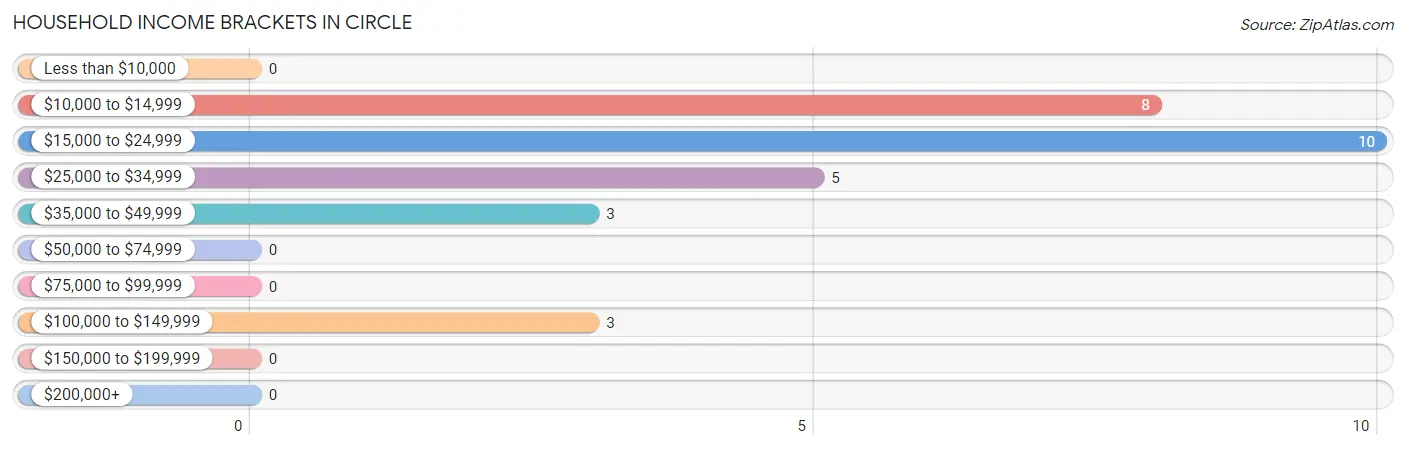
| Income Bracket | # Households | % Households |
| Less than $10,000 | 0 | 0.0% |
| $10,000 to $14,999 | 8 | 27.6% |
| $15,000 to $24,999 | 10 | 34.5% |
| $25,000 to $34,999 | 5 | 17.2% |
| $35,000 to $49,999 | 3 | 10.3% |
| $50,000 to $74,999 | 0 | 0.0% |
| $75,000 to $99,999 | 0 | 0.0% |
| $100,000 to $149,999 | 3 | 10.3% |
| $150,000 to $199,999 | 0 | 0.0% |
| $200,000+ | 0 | 0.0% |
Household Income by Householder Age in Circle
The median household income in Circle is $18,750, with the highest median household income of $15,500 found in the 65+ years age bracket for the primary householder. A total of 18 households (62.1%) fall into this category.
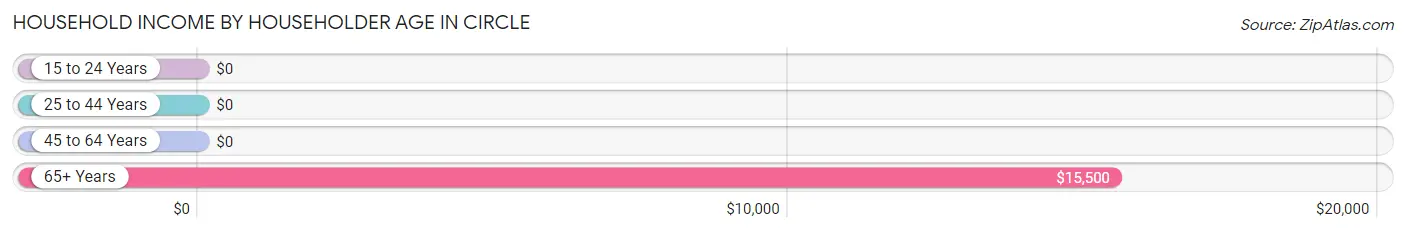
| Income Bracket | # Households | Median Income |
| 15 to 24 Years | 0 (0.0%) | $0 |
| 25 to 44 Years | 3 (10.3%) | $0 |
| 45 to 64 Years | 8 (27.6%) | $0 |
| 65+ Years | 18 (62.1%) | $15,500 |
| Total | 29 (100.0%) | $18,750 |
Poverty in Circle
Income Below Poverty by Sex and Age in Circle
With 20.0% poverty level for males and 50.0% for females among the residents of Circle, 75 year old and over males and 6 to 11 year old females are the most vulnerable to poverty, with 3 males (60.0%) and 5 females (100.0%) in their respective age groups living below the poverty level.
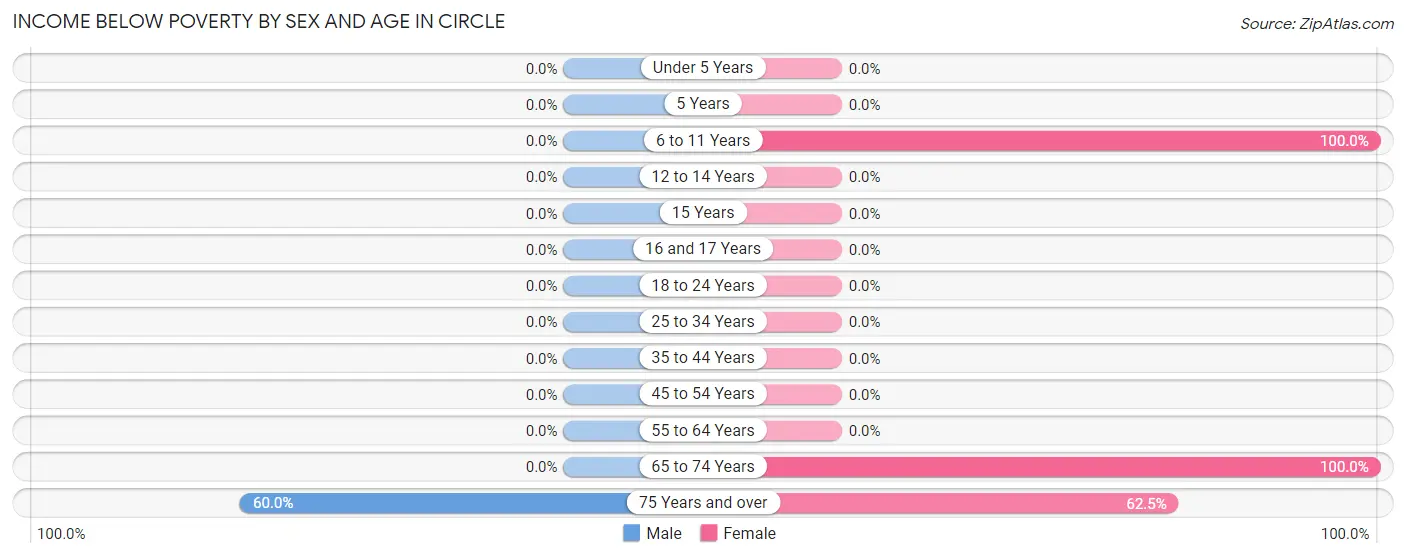
| Age Bracket | Male | Female |
| Under 5 Years | 0 (0.0%) | 0 (0.0%) |
| 5 Years | 0 (0.0%) | 0 (0.0%) |
| 6 to 11 Years | 0 (0.0%) | 5 (100.0%) |
| 12 to 14 Years | 0 (0.0%) | 0 (0.0%) |
| 15 Years | 0 (0.0%) | 0 (0.0%) |
| 16 and 17 Years | 0 (0.0%) | 0 (0.0%) |
| 18 to 24 Years | 0 (0.0%) | 0 (0.0%) |
| 25 to 34 Years | 0 (0.0%) | 0 (0.0%) |
| 35 to 44 Years | 0 (0.0%) | 0 (0.0%) |
| 45 to 54 Years | 0 (0.0%) | 0 (0.0%) |
| 55 to 64 Years | 0 (0.0%) | 0 (0.0%) |
| 65 to 74 Years | 0 (0.0%) | 5 (100.0%) |
| 75 Years and over | 3 (60.0%) | 5 (62.5%) |
| Total | 3 (20.0%) | 15 (50.0%) |
Income Above Poverty by Sex and Age in Circle
According to the poverty statistics in Circle, males aged 6 to 11 years and females aged 12 to 14 years are the age groups that are most secure financially, with 100.0% of males and 100.0% of females in these age groups living above the poverty line.
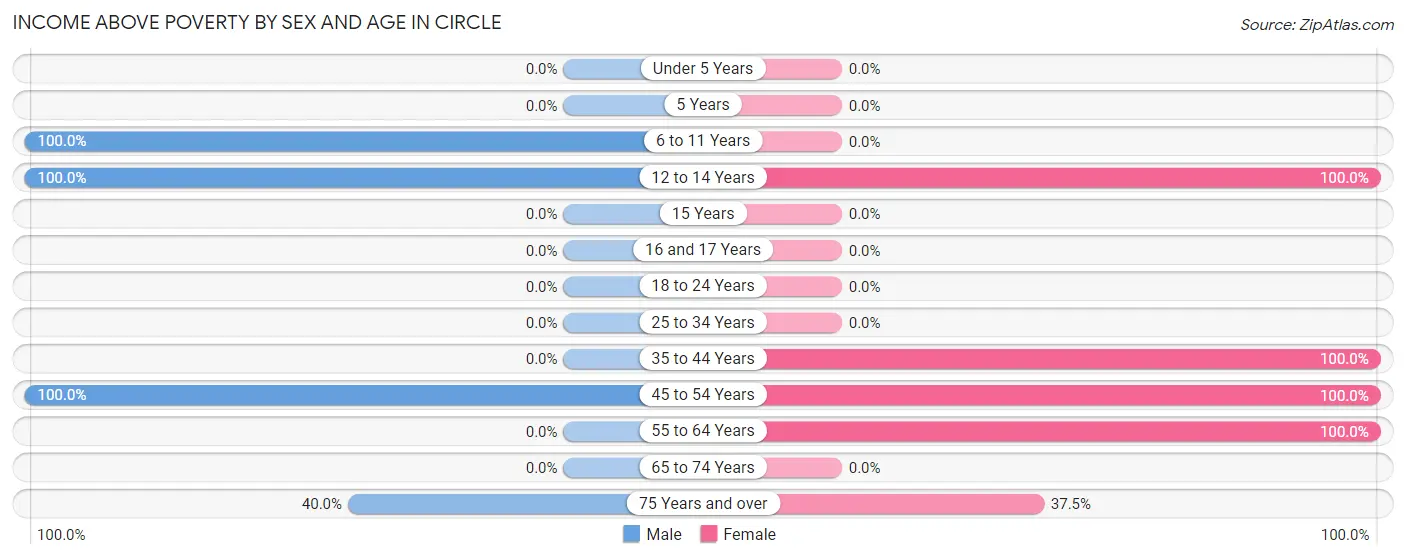
| Age Bracket | Male | Female |
| Under 5 Years | 0 (0.0%) | 0 (0.0%) |
| 5 Years | 0 (0.0%) | 0 (0.0%) |
| 6 to 11 Years | 4 (100.0%) | 0 (0.0%) |
| 12 to 14 Years | 3 (100.0%) | 4 (100.0%) |
| 15 Years | 0 (0.0%) | 0 (0.0%) |
| 16 and 17 Years | 0 (0.0%) | 0 (0.0%) |
| 18 to 24 Years | 0 (0.0%) | 0 (0.0%) |
| 25 to 34 Years | 0 (0.0%) | 0 (0.0%) |
| 35 to 44 Years | 0 (0.0%) | 3 (100.0%) |
| 45 to 54 Years | 3 (100.0%) | 2 (100.0%) |
| 55 to 64 Years | 0 (0.0%) | 3 (100.0%) |
| 65 to 74 Years | 0 (0.0%) | 0 (0.0%) |
| 75 Years and over | 2 (40.0%) | 3 (37.5%) |
| Total | 12 (80.0%) | 15 (50.0%) |
Income Below Poverty Among Married-Couple Families in Circle
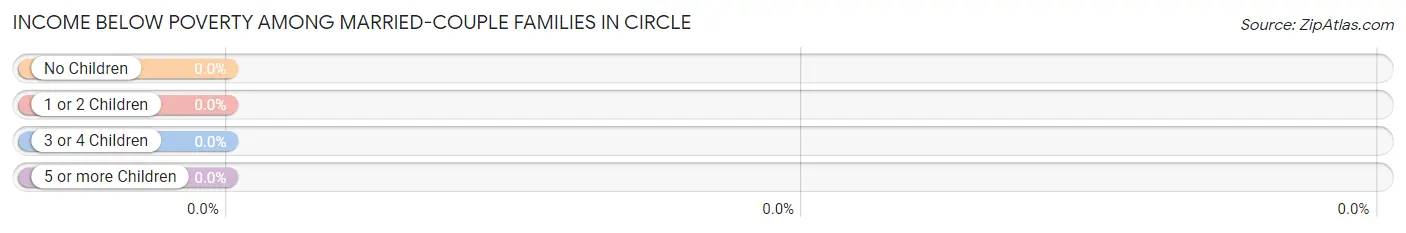
| Children | Above Poverty | Below Poverty |
| No Children | 0 (0.0%) | 0 (0.0%) |
| 1 or 2 Children | 0 (0.0%) | 0 (0.0%) |
| 3 or 4 Children | 0 (0.0%) | 0 (0.0%) |
| 5 or more Children | 0 (0.0%) | 0 (0.0%) |
| Total | 0 (0.0%) | 0 (0.0%) |
Income Below Poverty Among Single-Parent Households in Circle
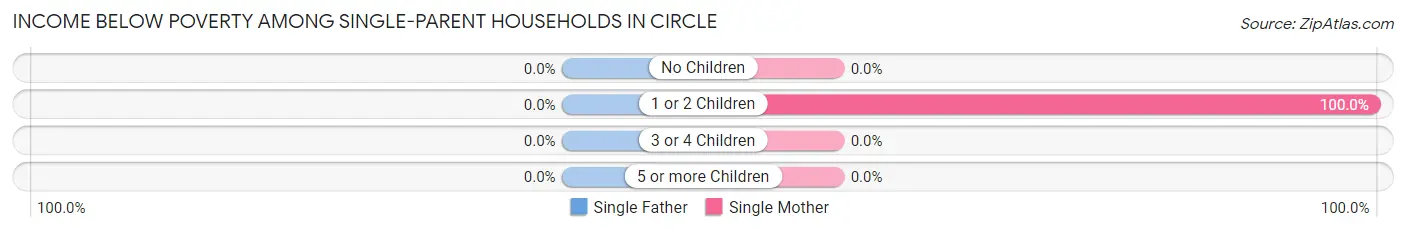
| Children | Single Father | Single Mother |
| No Children | 0 (0.0%) | 0 (0.0%) |
| 1 or 2 Children | 0 (0.0%) | 5 (100.0%) |
| 3 or 4 Children | 0 (0.0%) | 0 (0.0%) |
| 5 or more Children | 0 (0.0%) | 0 (0.0%) |
| Total | 0 (0.0%) | 5 (62.5%) |
Income Below Poverty Among Married-Couple vs Single-Parent Households in Circle
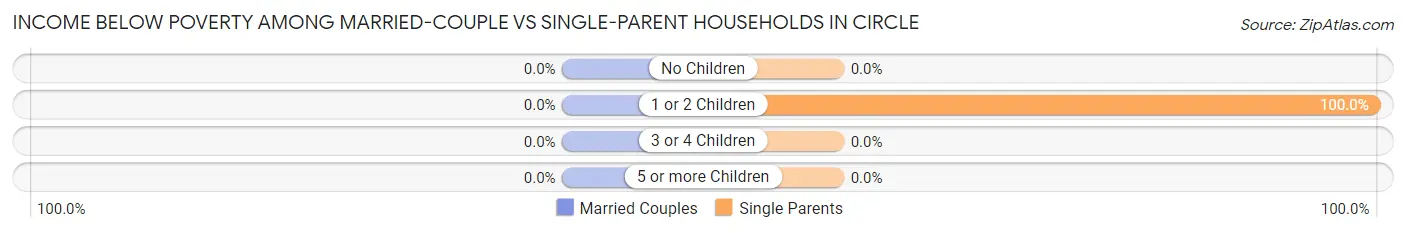
| Children | Married-Couple Families | Single-Parent Households |
| No Children | 0 (0.0%) | 0 (0.0%) |
| 1 or 2 Children | 0 (0.0%) | 5 (100.0%) |
| 3 or 4 Children | 0 (0.0%) | 0 (0.0%) |
| 5 or more Children | 0 (0.0%) | 0 (0.0%) |
| Total | 0 (0.0%) | 5 (62.5%) |
Race in Circle
The most populous races in Circle are Native / Alaskan (37 | 82.2%), and Two or more Races (8 | 17.8%).
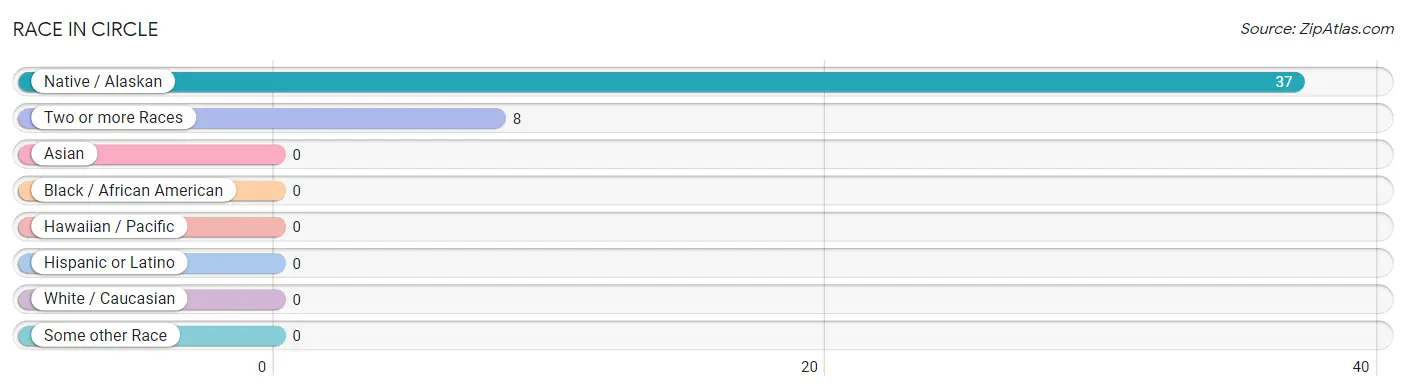
| Race | # Population | % Population |
| Asian | 0 | 0.0% |
| Black / African American | 0 | 0.0% |
| Hawaiian / Pacific | 0 | 0.0% |
| Hispanic or Latino | 0 | 0.0% |
| Native / Alaskan | 37 | 82.2% |
| White / Caucasian | 0 | 0.0% |
| Two or more Races | 8 | 17.8% |
| Some other Race | 0 | 0.0% |
| Total | 45 | 100.0% |
Ancestry in Circle
The most populous ancestries reported in Circle are Alaskan Athabascan (42 | 93.3%), Aleut (3 | 6.7%), Inupiat (3 | 6.7%), Irish (3 | 6.7%), and Swedish (3 | 6.7%), together accounting for 120.0% of all Circle residents.
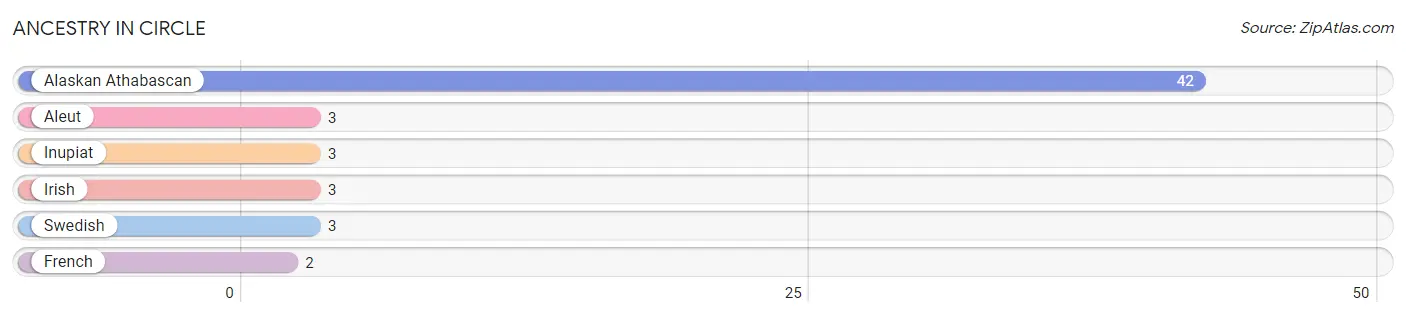
| Ancestry | # Population | % Population |
| Alaskan Athabascan | 42 | 93.3% |
| Aleut | 3 | 6.7% |
| French | 2 | 4.4% |
| Inupiat | 3 | 6.7% |
| Irish | 3 | 6.7% |
| Swedish | 3 | 6.7% | View All 6 Rows |
Immigrants in Circle

| Immigration Origin | # Population | % Population | View All 0 Rows |
Sex and Age in Circle
Sex and Age in Circle
The most populous age groups in Circle are 75 to 79 Years (5 | 33.3%) for men and 10 to 14 Years (9 | 30.0%) for women.
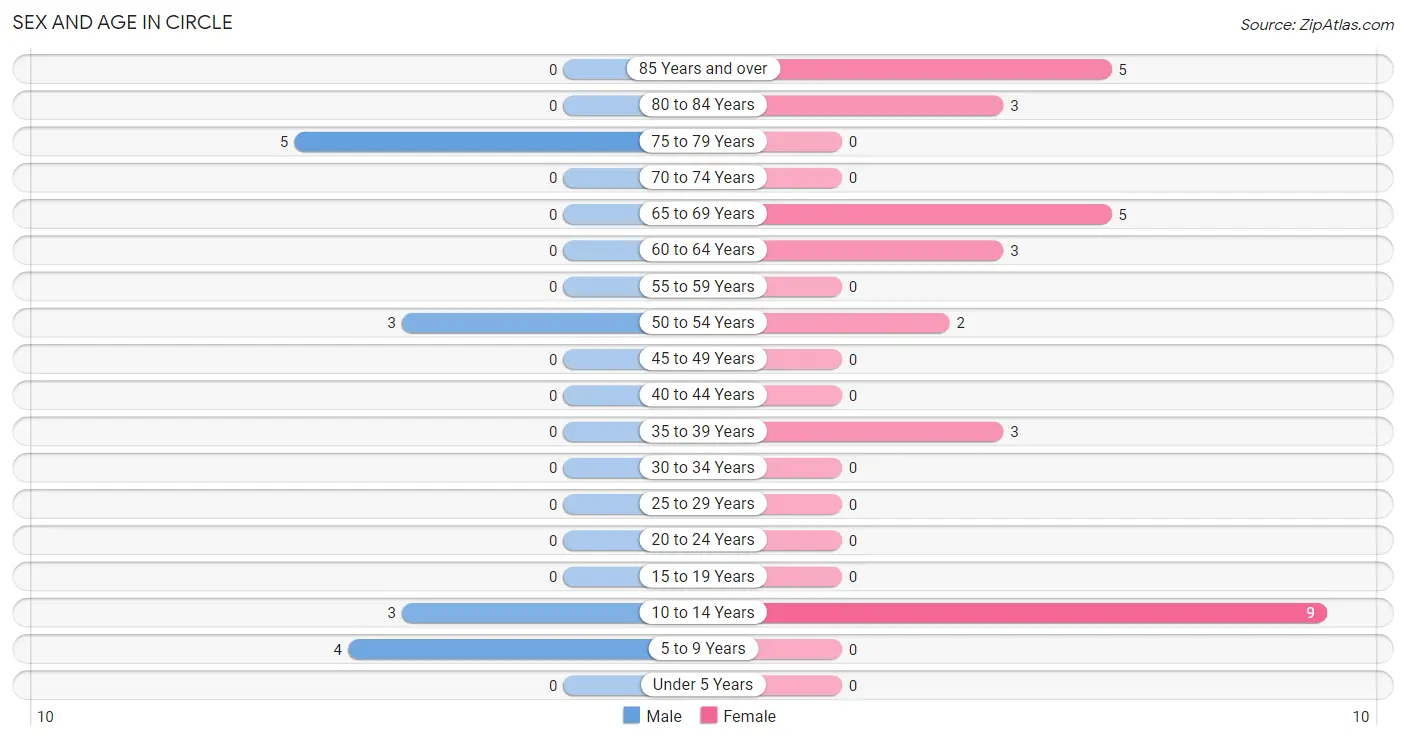
| Age Bracket | Male | Female |
| Under 5 Years | 0 (0.0%) | 0 (0.0%) |
| 5 to 9 Years | 4 (26.7%) | 0 (0.0%) |
| 10 to 14 Years | 3 (20.0%) | 9 (30.0%) |
| 15 to 19 Years | 0 (0.0%) | 0 (0.0%) |
| 20 to 24 Years | 0 (0.0%) | 0 (0.0%) |
| 25 to 29 Years | 0 (0.0%) | 0 (0.0%) |
| 30 to 34 Years | 0 (0.0%) | 0 (0.0%) |
| 35 to 39 Years | 0 (0.0%) | 3 (10.0%) |
| 40 to 44 Years | 0 (0.0%) | 0 (0.0%) |
| 45 to 49 Years | 0 (0.0%) | 0 (0.0%) |
| 50 to 54 Years | 3 (20.0%) | 2 (6.7%) |
| 55 to 59 Years | 0 (0.0%) | 0 (0.0%) |
| 60 to 64 Years | 0 (0.0%) | 3 (10.0%) |
| 65 to 69 Years | 0 (0.0%) | 5 (16.7%) |
| 70 to 74 Years | 0 (0.0%) | 0 (0.0%) |
| 75 to 79 Years | 5 (33.3%) | 0 (0.0%) |
| 80 to 84 Years | 0 (0.0%) | 3 (10.0%) |
| 85 Years and over | 0 (0.0%) | 5 (16.7%) |
| Total | 15 (100.0%) | 30 (100.0%) |
Families and Households in Circle
Median Family Size in Circle
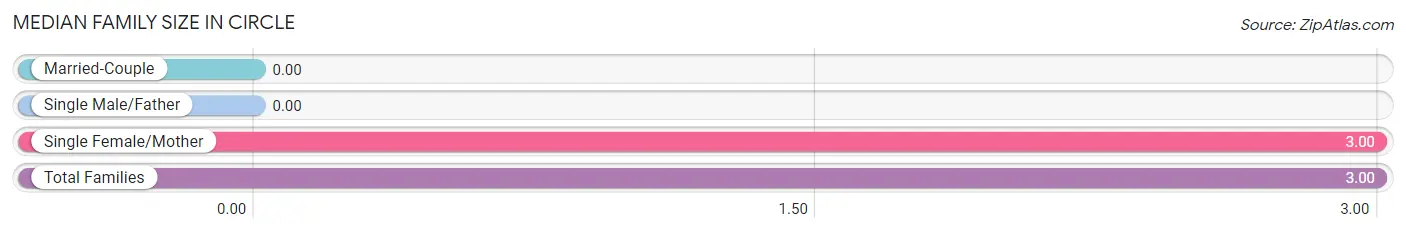
| Family Type | # Families | Family Size |
| Married-Couple | 0 (0.0%) | - |
| Single Male/Father | 0 (0.0%) | - |
| Single Female/Mother | 8 (100.0%) | 3.00 |
| Total Families | 8 (100.0%) | 3.00 |
Median Household Size in Circle
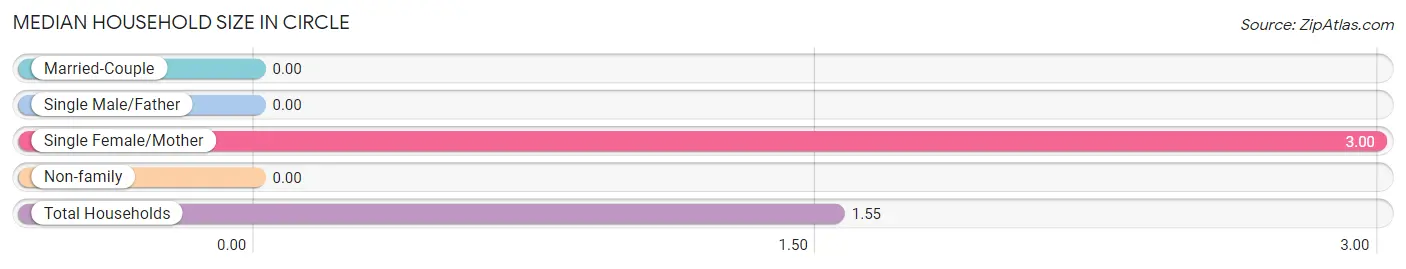
| Household Type | # Households | Household Size |
| Married-Couple | 0 (0.0%) | - |
| Single Male/Father | 0 (0.0%) | - |
| Single Female/Mother | 8 (27.6%) | 3.00 |
| Non-family | 21 (72.4%) | - |
| Total Households | 29 (100.0%) | 1.55 |
Household Size by Marriage Status in Circle
Out of a total of 29 households in Circle, 8 (27.6%) are family households, while 21 (72.4%) are nonfamily households. The most numerous type of family households are 2-person households, comprising 5, and the most common type of nonfamily households are 1-person households, comprising 21.
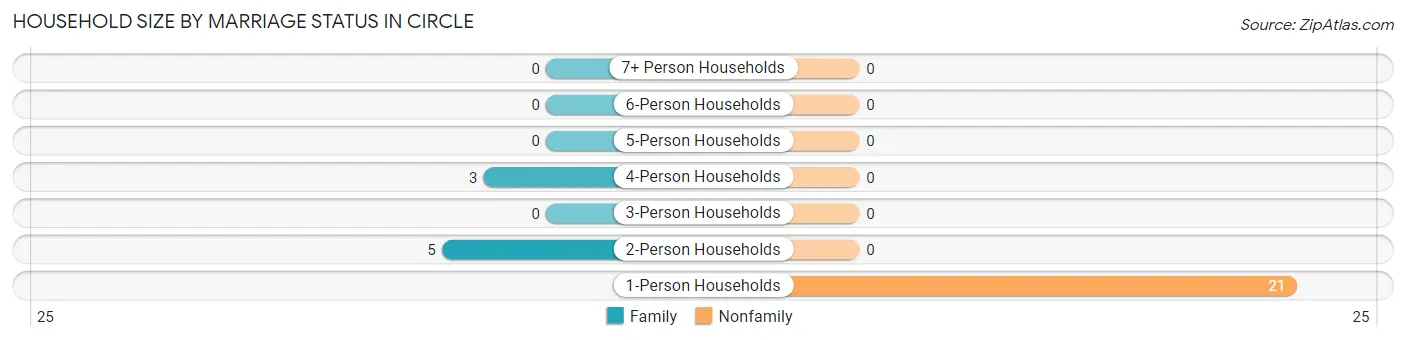
| Household Size | Family Households | Nonfamily Households |
| 1-Person Households | - | 21 (72.4%) |
| 2-Person Households | 5 (17.2%) | 0 (0.0%) |
| 3-Person Households | 0 (0.0%) | 0 (0.0%) |
| 4-Person Households | 3 (10.3%) | 0 (0.0%) |
| 5-Person Households | 0 (0.0%) | 0 (0.0%) |
| 6-Person Households | 0 (0.0%) | 0 (0.0%) |
| 7+ Person Households | 0 (0.0%) | 0 (0.0%) |
| Total | 8 (27.6%) | 21 (72.4%) |
Female Fertility in Circle
Fertility by Age in Circle
| Age Bracket | Women with Births | Births / 1,000 Women |
| 15 to 19 years | 0 (0.0%) | 0.0 |
| 20 to 34 years | 0 (0.0%) | 0.0 |
| 35 to 50 years | 0 (0.0%) | 0.0 |
| Total | 0 (0.0%) | 0.0 |
Fertility by Age by Marriage Status in Circle
| Age Bracket | Married | Unmarried |
| 15 to 19 years | 0 (0.0%) | 0 (0.0%) |
| 20 to 34 years | 0 (0.0%) | 0 (0.0%) |
| 35 to 50 years | 0 (0.0%) | 0 (0.0%) |
| Total | 0 (0.0%) | 0 (0.0%) |
Fertility by Education in Circle
| Educational Attainment | Women with Births | Births / 1,000 Women |
| Less than High School | 0 (0.0%) | 0.0 |
| High School Diploma | 0 (0.0%) | 0.0 |
| College or Associate's Degree | 0 (0.0%) | 0.0 |
| Bachelor's Degree | 0 (0.0%) | 0.0 |
| Graduate Degree | 0 (0.0%) | 0.0 |
| Total | 0 (0.0%) | 0.0 |
Fertility by Education by Marriage Status in Circle
| Educational Attainment | Married | Unmarried |
| Less than High School | 0 (0.0%) | 0 (0.0%) |
| High School Diploma | 0 (0.0%) | 0 (0.0%) |
| College or Associate's Degree | 0 (0.0%) | 0 (0.0%) |
| Bachelor's Degree | 0 (0.0%) | 0 (0.0%) |
| Graduate Degree | 0 (0.0%) | 0 (0.0%) |
| Total | 0 (0.0%) | 0 (0.0%) |
Employment Characteristics in Circle
Employment by Class of Employer in Circle
Among the 10 employed individuals in Circle, local government employees (7 | 70.0%), and state government employees (3 | 30.0%) make up the most common classes of employment.
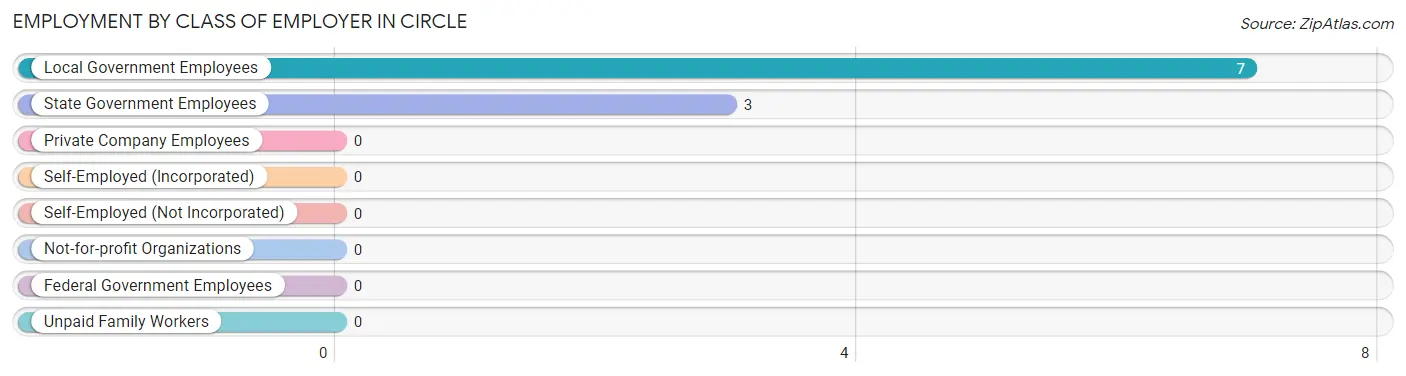
| Employer Class | # Employees | % Employees |
| Private Company Employees | 0 | 0.0% |
| Self-Employed (Incorporated) | 0 | 0.0% |
| Self-Employed (Not Incorporated) | 0 | 0.0% |
| Not-for-profit Organizations | 0 | 0.0% |
| Local Government Employees | 7 | 70.0% |
| State Government Employees | 3 | 30.0% |
| Federal Government Employees | 0 | 0.0% |
| Unpaid Family Workers | 0 | 0.0% |
| Total | 10 | 100.0% |
Employment Status by Age in Circle
According to the labor force statistics for Circle, out of the total population over 16 years of age (29), 51.7% or 15 individuals are in the labor force, with 20.0% or 3 of them unemployed. The age group with the highest labor force participation rate is 45 to 54 years, with 100.0% or 5 individuals in the labor force. Within the labor force, the 45 to 54 years age range has the highest percentage of unemployed individuals, with 60.0% or 3 of them being unemployed.
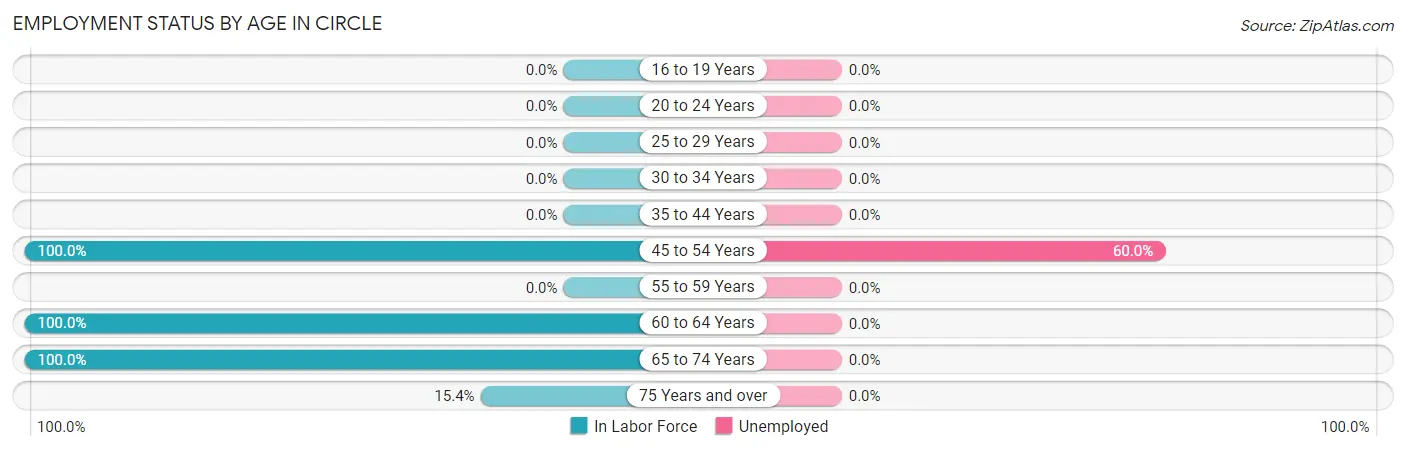
| Age Bracket | In Labor Force | Unemployed |
| 16 to 19 Years | 0 (0.0%) | 0 (0.0%) |
| 20 to 24 Years | 0 (0.0%) | 0 (0.0%) |
| 25 to 29 Years | 0 (0.0%) | 0 (0.0%) |
| 30 to 34 Years | 0 (0.0%) | 0 (0.0%) |
| 35 to 44 Years | 0 (0.0%) | 0 (0.0%) |
| 45 to 54 Years | 5 (100.0%) | 3 (60.0%) |
| 55 to 59 Years | 0 (0.0%) | 0 (0.0%) |
| 60 to 64 Years | 3 (100.0%) | 0 (0.0%) |
| 65 to 74 Years | 5 (100.0%) | 0 (0.0%) |
| 75 Years and over | 2 (15.4%) | 0 (0.0%) |
| Total | 15 (51.7%) | 3 (20.0%) |
Employment Status by Educational Attainment in Circle
According to labor force statistics for Circle, 72.7% of individuals (8) out of the total population between 25 and 64 years of age (11) are in the labor force, with 37.5% or 3 of them being unemployed. The group with the highest labor force participation rate are those with the educational attainment of less than high school, with 100.0% or 3 individuals in the labor force. Within the labor force, individuals with less than high school education have the highest percentage of unemployment, with 100.0% or 3 of them being unemployed.
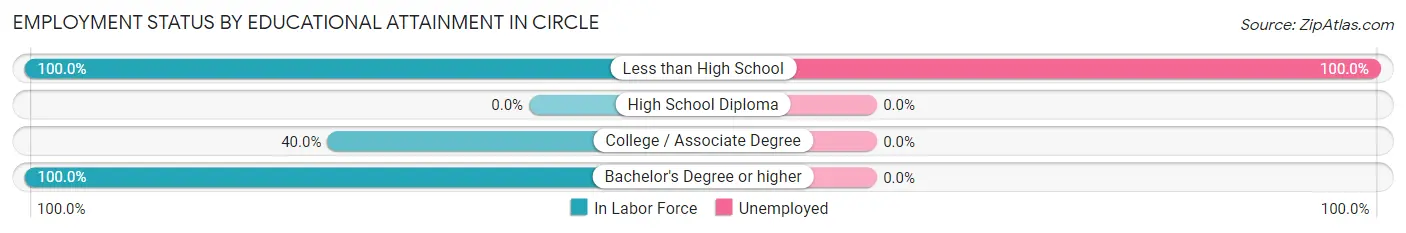
| Educational Attainment | In Labor Force | Unemployed |
| Less than High School | 3 (100.0%) | 3 (100.0%) |
| High School Diploma | 0 (0.0%) | 0 (0.0%) |
| College / Associate Degree | 2 (40.0%) | 0 (0.0%) |
| Bachelor's Degree or higher | 3 (100.0%) | 0 (0.0%) |
| Total | 8 (72.7%) | 4 (37.5%) |
Employment Occupations by Sex in Circle
Management, Business, Science and Arts Occupations
The most common Management, Business, Science and Arts occupations in Circle are Community & Social Service (10 | 83.3%), Education, Arts & Media (7 | 58.3%), and Education Instruction & Library (3 | 25.0%).
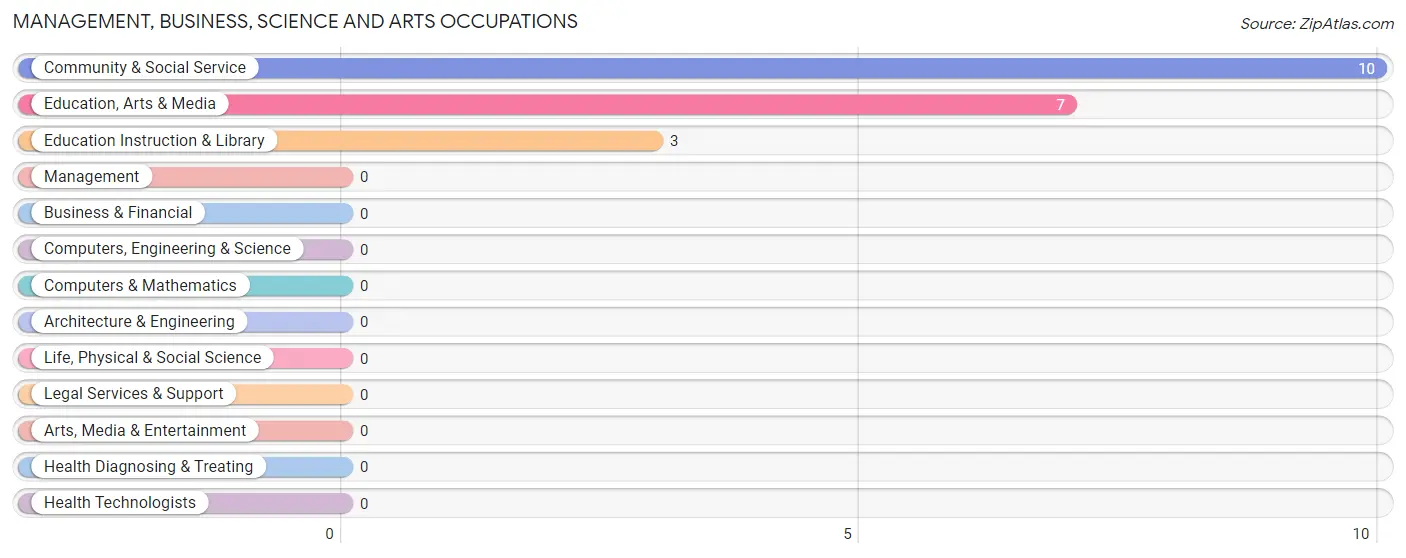
Management, Business, Science and Arts Occupations by Sex
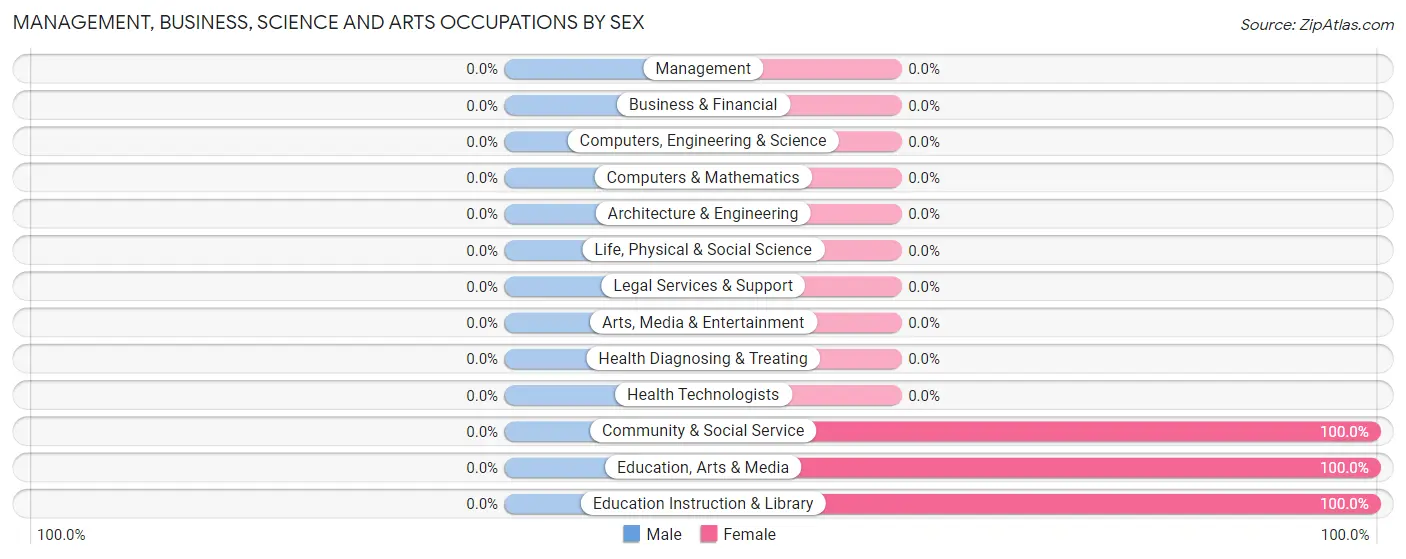
| Occupation | Male | Female |
| Management | 0 (0.0%) | 0 (0.0%) |
| Business & Financial | 0 (0.0%) | 0 (0.0%) |
| Computers, Engineering & Science | 0 (0.0%) | 0 (0.0%) |
| Computers & Mathematics | 0 (0.0%) | 0 (0.0%) |
| Architecture & Engineering | 0 (0.0%) | 0 (0.0%) |
| Life, Physical & Social Science | 0 (0.0%) | 0 (0.0%) |
| Community & Social Service | 0 (0.0%) | 10 (100.0%) |
| Education, Arts & Media | 0 (0.0%) | 7 (100.0%) |
| Legal Services & Support | 0 (0.0%) | 0 (0.0%) |
| Education Instruction & Library | 0 (0.0%) | 3 (100.0%) |
| Arts, Media & Entertainment | 0 (0.0%) | 0 (0.0%) |
| Health Diagnosing & Treating | 0 (0.0%) | 0 (0.0%) |
| Health Technologists | 0 (0.0%) | 0 (0.0%) |
| Total (Category) | 0 (0.0%) | 10 (100.0%) |
| Total (Overall) | 2 (16.7%) | 10 (83.3%) |
Services Occupations
Services Occupations by Sex
| Occupation | Male | Female |
| Healthcare Support | 0 (0.0%) | 0 (0.0%) |
| Security & Protection | 0 (0.0%) | 0 (0.0%) |
| Firefighting & Prevention | 0 (0.0%) | 0 (0.0%) |
| Law Enforcement | 0 (0.0%) | 0 (0.0%) |
| Food Preparation & Serving | 0 (0.0%) | 0 (0.0%) |
| Cleaning & Maintenance | 0 (0.0%) | 0 (0.0%) |
| Personal Care & Service | 0 (0.0%) | 0 (0.0%) |
| Total (Category) | 0 (0.0%) | 0 (0.0%) |
| Total (Overall) | 2 (16.7%) | 10 (83.3%) |
Sales and Office Occupations
Sales and Office Occupations by Sex
| Occupation | Male | Female |
| Sales & Related | 0 (0.0%) | 0 (0.0%) |
| Office & Administration | 0 (0.0%) | 0 (0.0%) |
| Total (Category) | 0 (0.0%) | 0 (0.0%) |
| Total (Overall) | 2 (16.7%) | 10 (83.3%) |
Natural Resources, Construction and Maintenance Occupations
Natural Resources, Construction and Maintenance Occupations by Sex
| Occupation | Male | Female |
| Farming, Fishing & Forestry | 0 (0.0%) | 0 (0.0%) |
| Construction & Extraction | 0 (0.0%) | 0 (0.0%) |
| Installation, Maintenance & Repair | 0 (0.0%) | 0 (0.0%) |
| Total (Category) | 0 (0.0%) | 0 (0.0%) |
| Total (Overall) | 2 (16.7%) | 10 (83.3%) |
Production, Transportation and Moving Occupations
The most common Production, Transportation and Moving occupations in Circle are , and Transportation (2 | 16.7%).
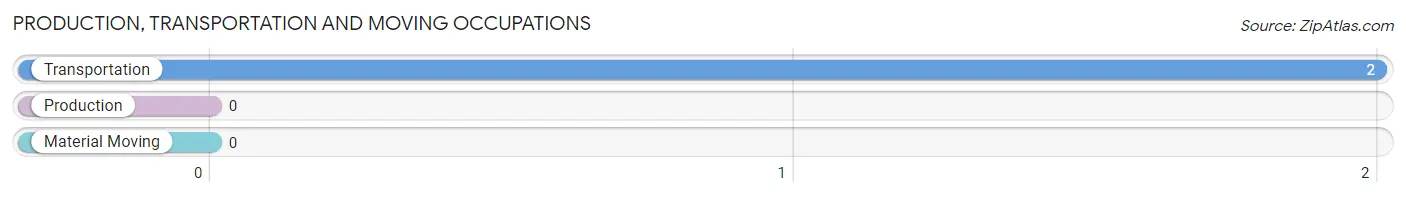
Production, Transportation and Moving Occupations by Sex
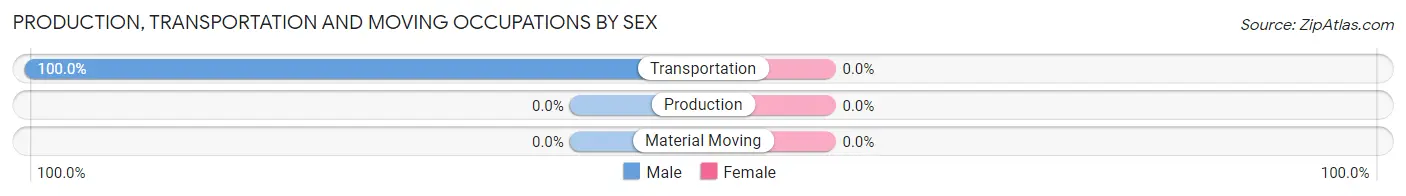
| Occupation | Male | Female |
| Production | 0 (0.0%) | 0 (0.0%) |
| Transportation | 2 (100.0%) | 0 (0.0%) |
| Material Moving | 0 (0.0%) | 0 (0.0%) |
| Total (Category) | 2 (100.0%) | 0 (0.0%) |
| Total (Overall) | 2 (16.7%) | 10 (83.3%) |
Employment Industries by Sex in Circle
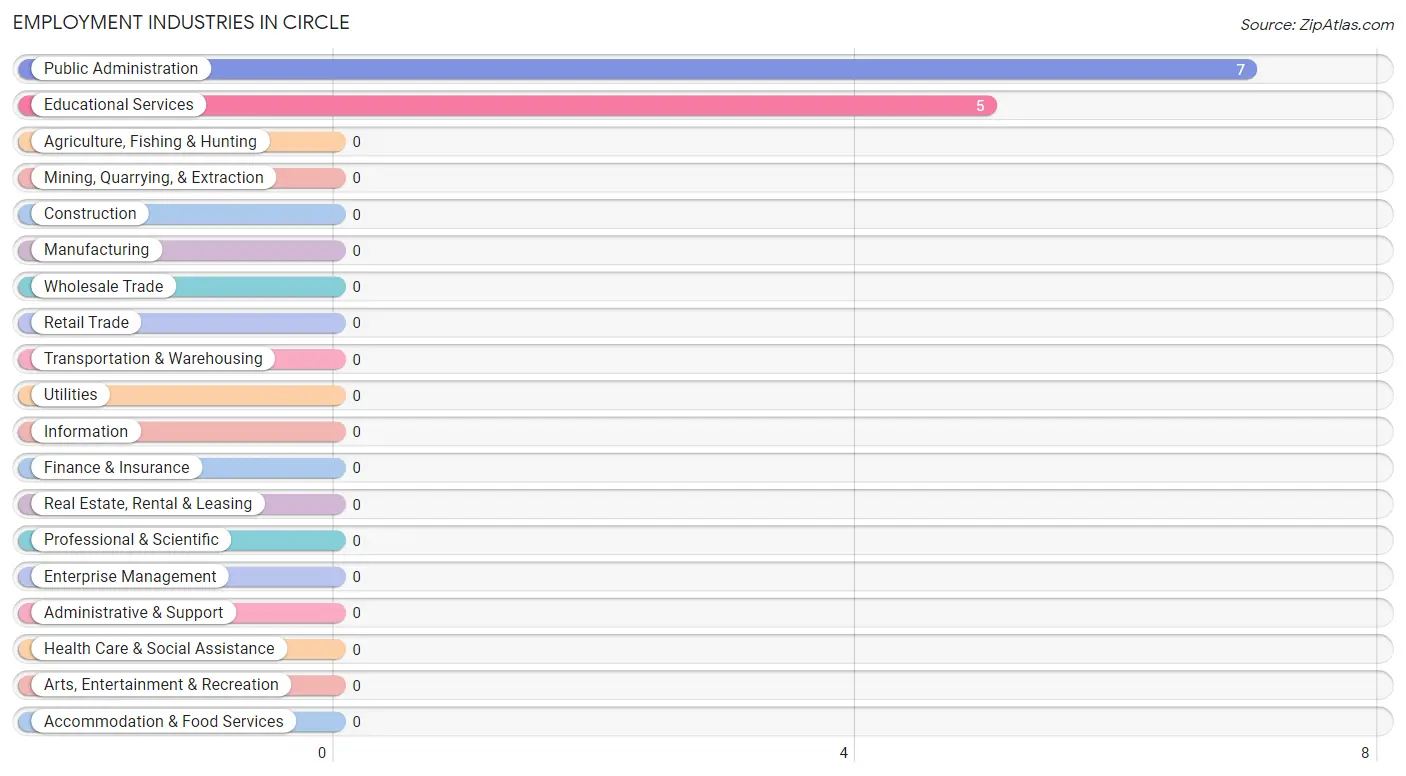
Employment Industries in Circle
The major employment industries in Circle include Public Administration (7 | 58.3%), and Educational Services (5 | 41.7%).
Employment Industries by Sex in Circle
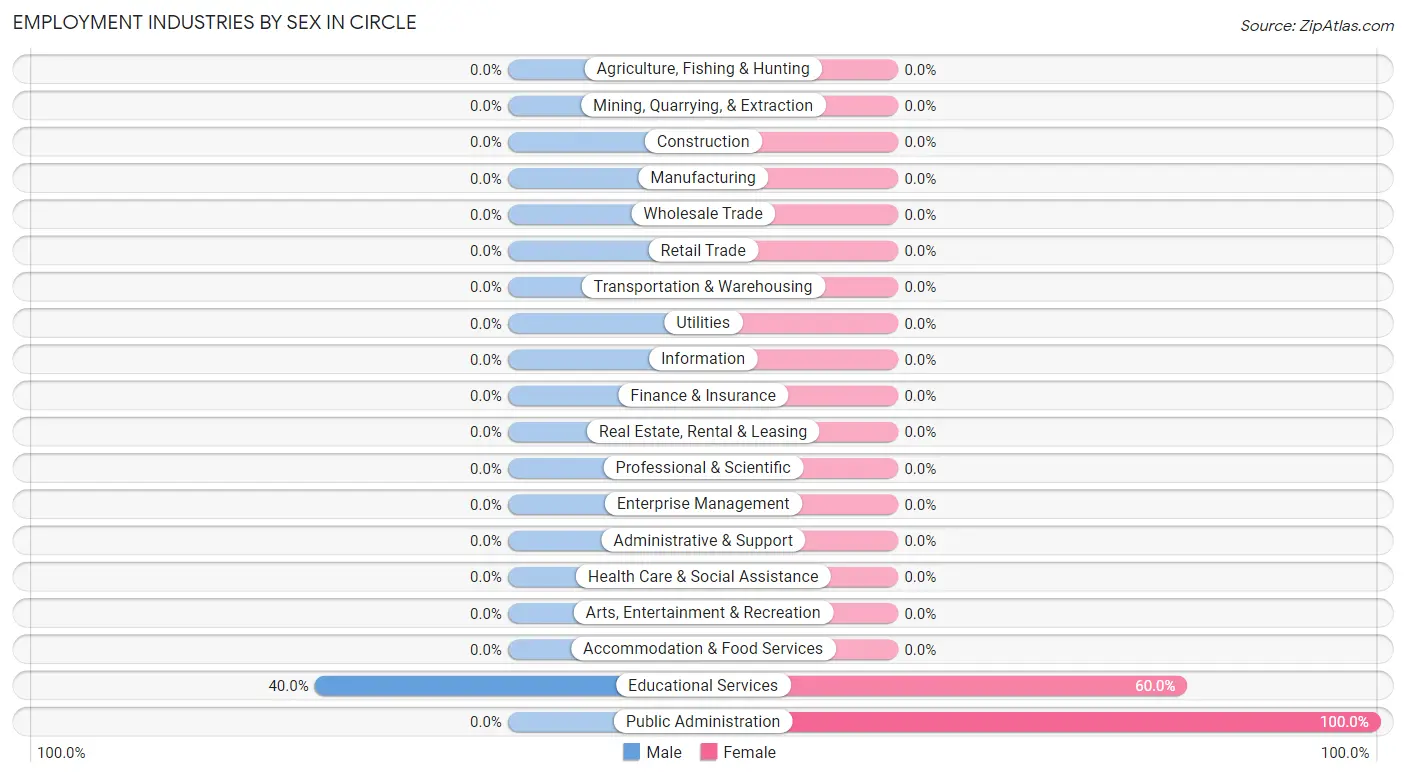
| Industry | Male | Female |
| Agriculture, Fishing & Hunting | 0 (0.0%) | 0 (0.0%) |
| Mining, Quarrying, & Extraction | 0 (0.0%) | 0 (0.0%) |
| Construction | 0 (0.0%) | 0 (0.0%) |
| Manufacturing | 0 (0.0%) | 0 (0.0%) |
| Wholesale Trade | 0 (0.0%) | 0 (0.0%) |
| Retail Trade | 0 (0.0%) | 0 (0.0%) |
| Transportation & Warehousing | 0 (0.0%) | 0 (0.0%) |
| Utilities | 0 (0.0%) | 0 (0.0%) |
| Information | 0 (0.0%) | 0 (0.0%) |
| Finance & Insurance | 0 (0.0%) | 0 (0.0%) |
| Real Estate, Rental & Leasing | 0 (0.0%) | 0 (0.0%) |
| Professional & Scientific | 0 (0.0%) | 0 (0.0%) |
| Enterprise Management | 0 (0.0%) | 0 (0.0%) |
| Administrative & Support | 0 (0.0%) | 0 (0.0%) |
| Educational Services | 2 (40.0%) | 3 (60.0%) |
| Health Care & Social Assistance | 0 (0.0%) | 0 (0.0%) |
| Arts, Entertainment & Recreation | 0 (0.0%) | 0 (0.0%) |
| Accommodation & Food Services | 0 (0.0%) | 0 (0.0%) |
| Public Administration | 0 (0.0%) | 7 (100.0%) |
| Total | 2 (16.7%) | 10 (83.3%) |
Education in Circle
School Enrollment in Circle
The most common levels of schooling among the 16 students in Circle are middle school (8 | 50.0%), elementary school (4 | 25.0%), and high school (4 | 25.0%).
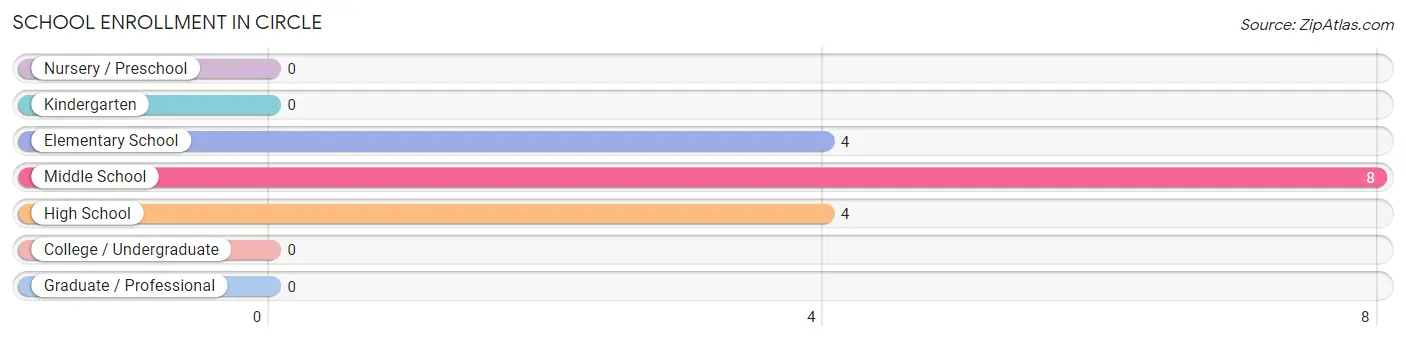
| School Level | # Students | % Students |
| Nursery / Preschool | 0 | 0.0% |
| Kindergarten | 0 | 0.0% |
| Elementary School | 4 | 25.0% |
| Middle School | 8 | 50.0% |
| High School | 4 | 25.0% |
| College / Undergraduate | 0 | 0.0% |
| Graduate / Professional | 0 | 0.0% |
| Total | 16 | 100.0% |
School Enrollment by Age by Funding Source in Circle
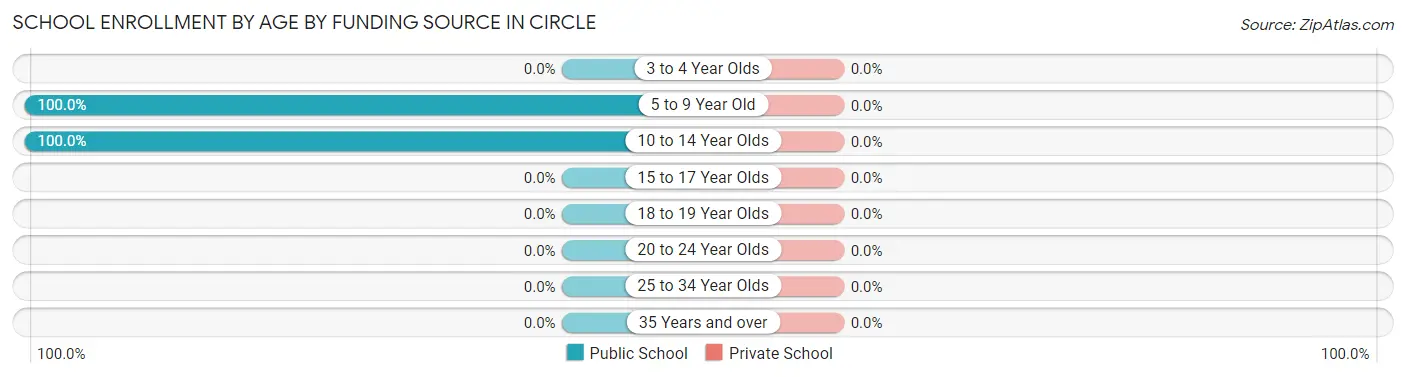
| Age Bracket | Public School | Private School |
| 3 to 4 Year Olds | 0 (0.0%) | 0 (0.0%) |
| 5 to 9 Year Old | 4 (100.0%) | 0 (0.0%) |
| 10 to 14 Year Olds | 12 (100.0%) | 0 (0.0%) |
| 15 to 17 Year Olds | 0 (0.0%) | 0 (0.0%) |
| 18 to 19 Year Olds | 0 (0.0%) | 0 (0.0%) |
| 20 to 24 Year Olds | 0 (0.0%) | 0 (0.0%) |
| 25 to 34 Year Olds | 0 (0.0%) | 0 (0.0%) |
| 35 Years and over | 0 (0.0%) | 0 (0.0%) |
| Total | 16 (100.0%) | 0 (0.0%) |
Educational Attainment by Field of Study in Circle
, and education (3 | 100.0%) are the most common fields of study among 3 individuals in Circle who have obtained a bachelor's degree or higher.
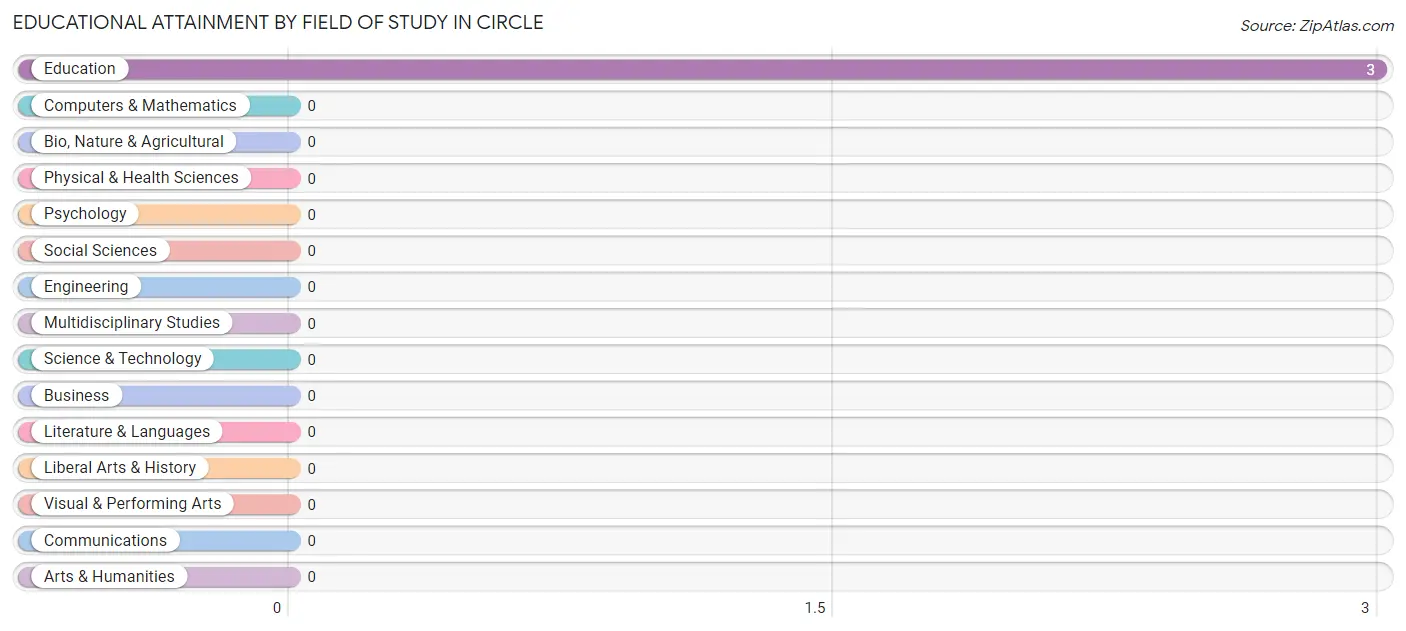
| Field of Study | # Graduates | % Graduates |
| Computers & Mathematics | 0 | 0.0% |
| Bio, Nature & Agricultural | 0 | 0.0% |
| Physical & Health Sciences | 0 | 0.0% |
| Psychology | 0 | 0.0% |
| Social Sciences | 0 | 0.0% |
| Engineering | 0 | 0.0% |
| Multidisciplinary Studies | 0 | 0.0% |
| Science & Technology | 0 | 0.0% |
| Business | 0 | 0.0% |
| Education | 3 | 100.0% |
| Literature & Languages | 0 | 0.0% |
| Liberal Arts & History | 0 | 0.0% |
| Visual & Performing Arts | 0 | 0.0% |
| Communications | 0 | 0.0% |
| Arts & Humanities | 0 | 0.0% |
| Total | 3 | 100.0% |
Transportation & Commute in Circle
Vehicle Availability by Sex in Circle
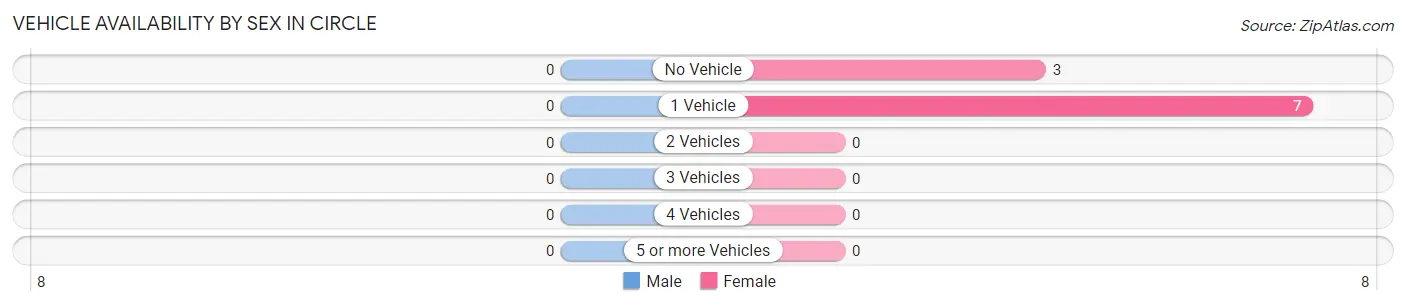
| Vehicles Available | Male | Female |
| No Vehicle | 0 (0.0%) | 3 (30.0%) |
| 1 Vehicle | 0 (0.0%) | 7 (70.0%) |
| 2 Vehicles | 0 (0.0%) | 0 (0.0%) |
| 3 Vehicles | 0 (0.0%) | 0 (0.0%) |
| 4 Vehicles | 0 (0.0%) | 0 (0.0%) |
| 5 or more Vehicles | 0 (0.0%) | 0 (0.0%) |
| Total | 0 (0.0%) | 10 (100.0%) |
Commute Time in Circle
The most frequently occuring commute durations in Circle are 10 to 14 minutes (5 commuters, 62.5%), less than 5 minutes (3 commuters, 37.5%), and 5 to 9 minutes (0 commuters, 0.0%).
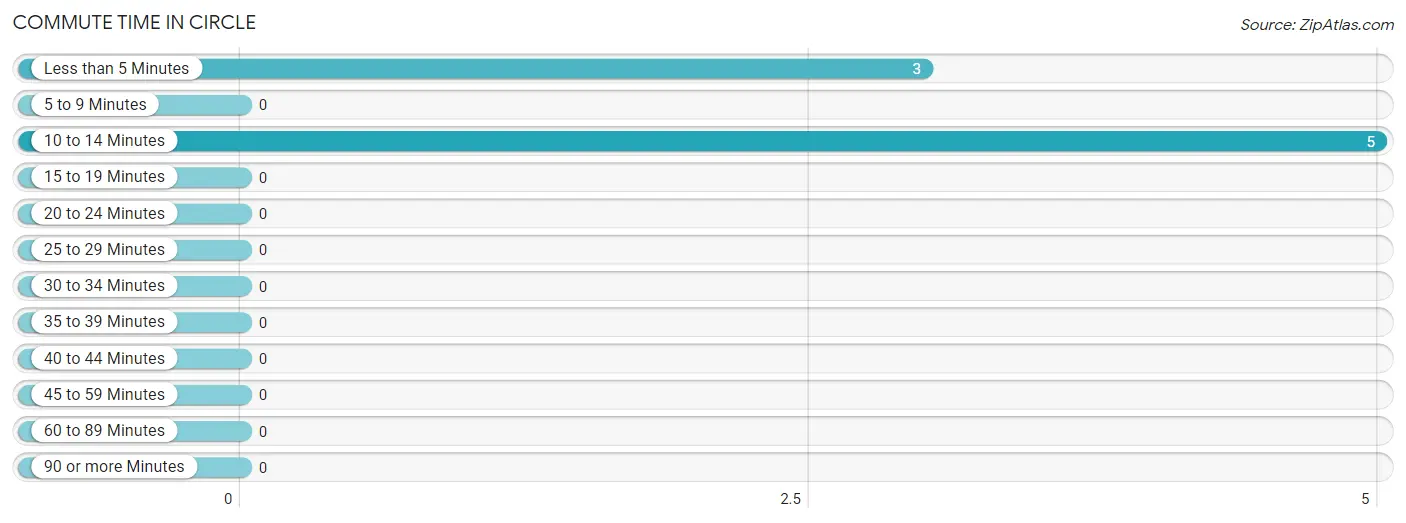
| Commute Time | # Commuters | % Commuters |
| Less than 5 Minutes | 3 | 37.5% |
| 5 to 9 Minutes | 0 | 0.0% |
| 10 to 14 Minutes | 5 | 62.5% |
| 15 to 19 Minutes | 0 | 0.0% |
| 20 to 24 Minutes | 0 | 0.0% |
| 25 to 29 Minutes | 0 | 0.0% |
| 30 to 34 Minutes | 0 | 0.0% |
| 35 to 39 Minutes | 0 | 0.0% |
| 40 to 44 Minutes | 0 | 0.0% |
| 45 to 59 Minutes | 0 | 0.0% |
| 60 to 89 Minutes | 0 | 0.0% |
| 90 or more Minutes | 0 | 0.0% |
Commute Time by Sex in Circle
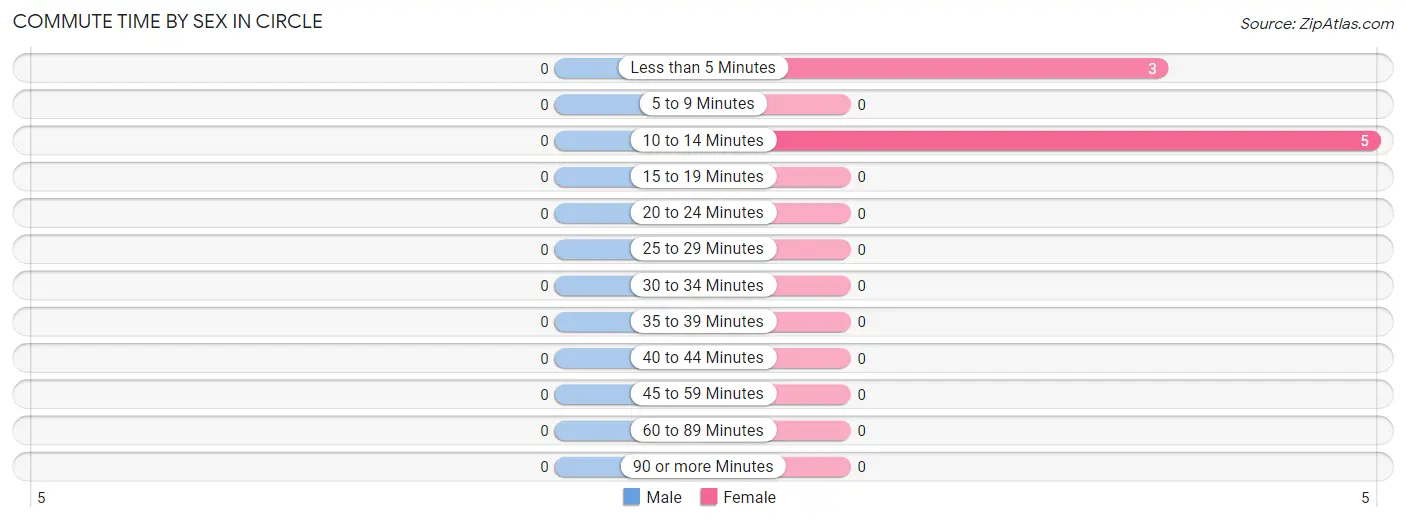
| Commute Time | Male | Female |
| Less than 5 Minutes | 0 (0.0%) | 3 (37.5%) |
| 5 to 9 Minutes | 0 (0.0%) | 0 (0.0%) |
| 10 to 14 Minutes | 0 (0.0%) | 5 (62.5%) |
| 15 to 19 Minutes | 0 (0.0%) | 0 (0.0%) |
| 20 to 24 Minutes | 0 (0.0%) | 0 (0.0%) |
| 25 to 29 Minutes | 0 (0.0%) | 0 (0.0%) |
| 30 to 34 Minutes | 0 (0.0%) | 0 (0.0%) |
| 35 to 39 Minutes | 0 (0.0%) | 0 (0.0%) |
| 40 to 44 Minutes | 0 (0.0%) | 0 (0.0%) |
| 45 to 59 Minutes | 0 (0.0%) | 0 (0.0%) |
| 60 to 89 Minutes | 0 (0.0%) | 0 (0.0%) |
| 90 or more Minutes | 0 (0.0%) | 0 (0.0%) |
Time of Departure to Work by Sex in Circle
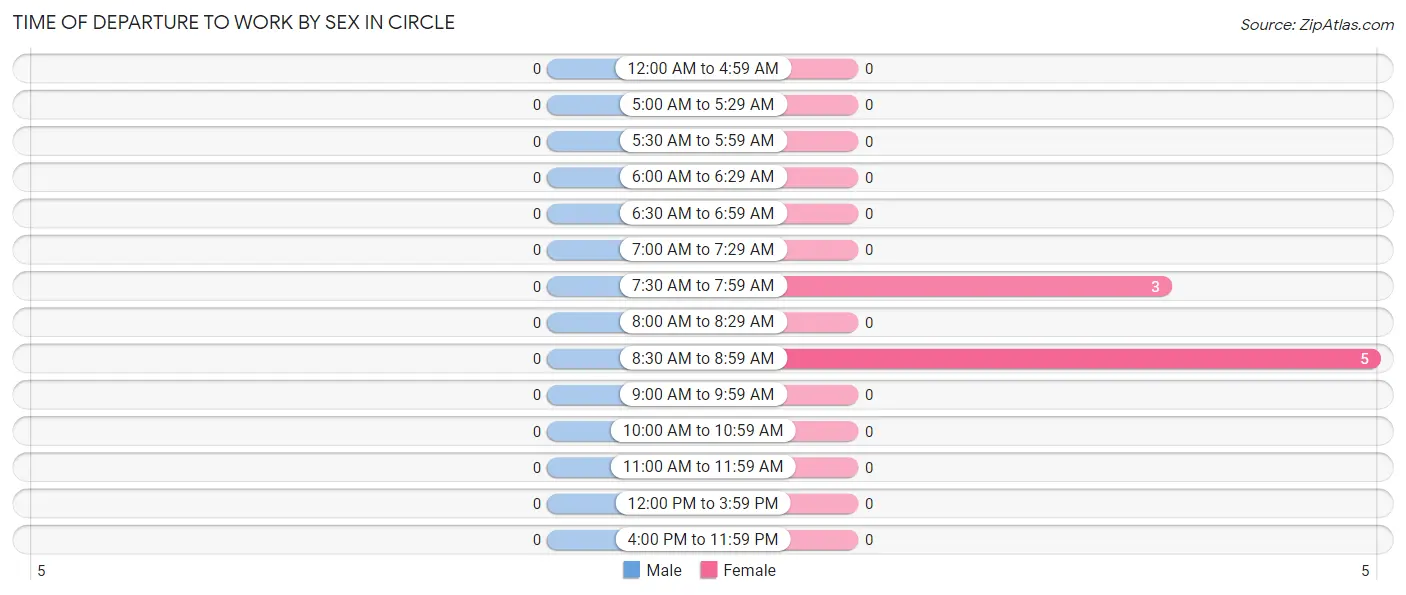
| Time of Departure | Male | Female |
| 12:00 AM to 4:59 AM | 0 (0.0%) | 0 (0.0%) |
| 5:00 AM to 5:29 AM | 0 (0.0%) | 0 (0.0%) |
| 5:30 AM to 5:59 AM | 0 (0.0%) | 0 (0.0%) |
| 6:00 AM to 6:29 AM | 0 (0.0%) | 0 (0.0%) |
| 6:30 AM to 6:59 AM | 0 (0.0%) | 0 (0.0%) |
| 7:00 AM to 7:29 AM | 0 (0.0%) | 0 (0.0%) |
| 7:30 AM to 7:59 AM | 0 (0.0%) | 3 (37.5%) |
| 8:00 AM to 8:29 AM | 0 (0.0%) | 0 (0.0%) |
| 8:30 AM to 8:59 AM | 0 (0.0%) | 5 (62.5%) |
| 9:00 AM to 9:59 AM | 0 (0.0%) | 0 (0.0%) |
| 10:00 AM to 10:59 AM | 0 (0.0%) | 0 (0.0%) |
| 11:00 AM to 11:59 AM | 0 (0.0%) | 0 (0.0%) |
| 12:00 PM to 3:59 PM | 0 (0.0%) | 0 (0.0%) |
| 4:00 PM to 11:59 PM | 0 (0.0%) | 0 (0.0%) |
| Total | 0 (0.0%) | 8 (100.0%) |
Housing Occupancy in Circle
Occupancy by Ownership in Circle
Of the total 29 dwellings in Circle, owner-occupied units account for 23 (79.3%), while renter-occupied units make up 6 (20.7%).
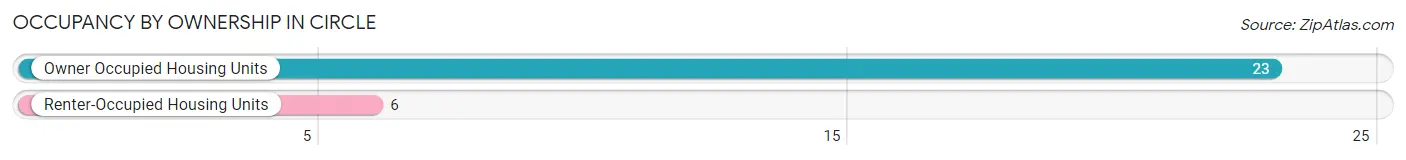
| Occupancy | # Housing Units | % Housing Units |
| Owner Occupied Housing Units | 23 | 79.3% |
| Renter-Occupied Housing Units | 6 | 20.7% |
| Total Occupied Housing Units | 29 | 100.0% |
Occupancy by Household Size in Circle
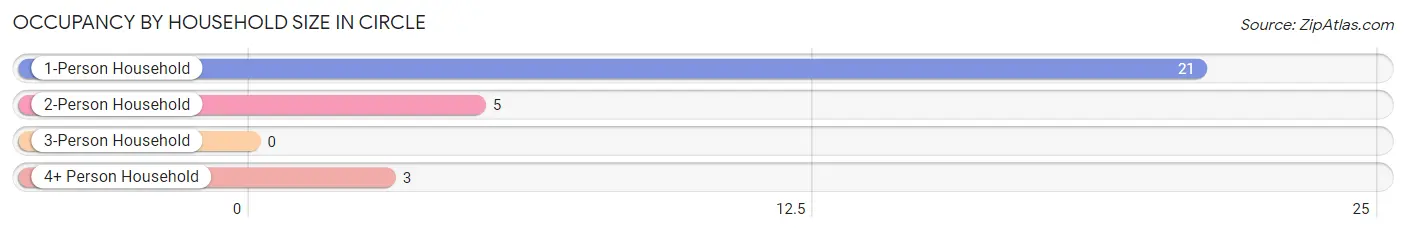
| Household Size | # Housing Units | % Housing Units |
| 1-Person Household | 21 | 72.4% |
| 2-Person Household | 5 | 17.2% |
| 3-Person Household | 0 | 0.0% |
| 4+ Person Household | 3 | 10.3% |
| Total Housing Units | 29 | 100.0% |
Occupancy by Ownership by Household Size in Circle
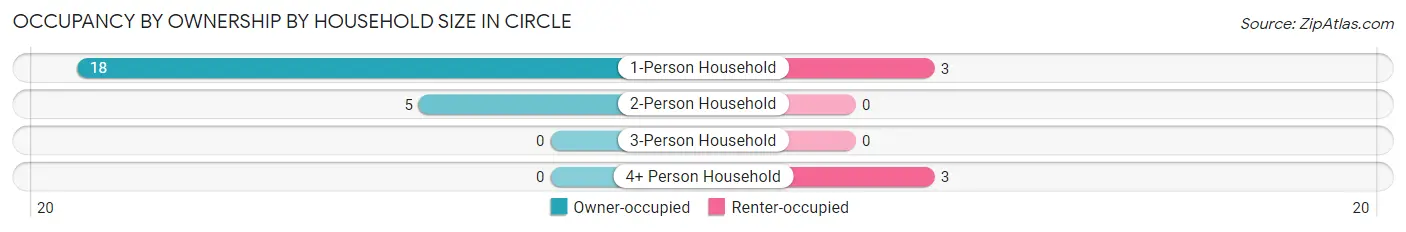
| Household Size | Owner-occupied | Renter-occupied |
| 1-Person Household | 18 (85.7%) | 3 (14.3%) |
| 2-Person Household | 5 (100.0%) | 0 (0.0%) |
| 3-Person Household | 0 (0.0%) | 0 (0.0%) |
| 4+ Person Household | 0 (0.0%) | 3 (100.0%) |
| Total Housing Units | 23 (79.3%) | 6 (20.7%) |
Occupancy by Educational Attainment in Circle
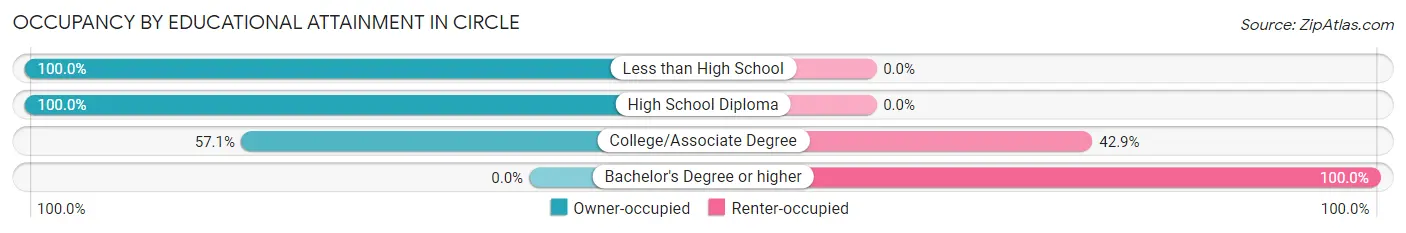
| Household Size | Owner-occupied | Renter-occupied |
| Less than High School | 16 (100.0%) | 0 (0.0%) |
| High School Diploma | 3 (100.0%) | 0 (0.0%) |
| College/Associate Degree | 4 (57.1%) | 3 (42.9%) |
| Bachelor's Degree or higher | 0 (0.0%) | 3 (100.0%) |
Occupancy by Age of Householder in Circle
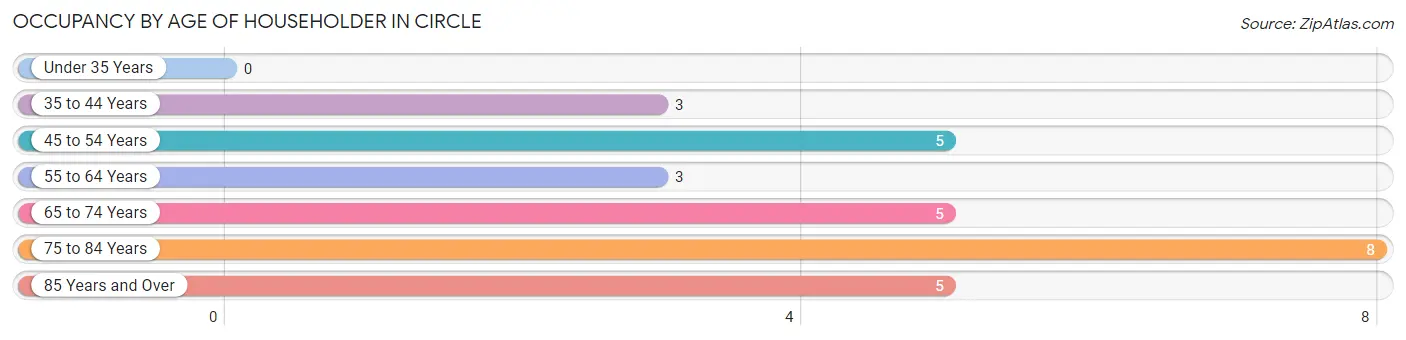
| Age Bracket | # Households | % Households |
| Under 35 Years | 0 | 0.0% |
| 35 to 44 Years | 3 | 10.3% |
| 45 to 54 Years | 5 | 17.2% |
| 55 to 64 Years | 3 | 10.3% |
| 65 to 74 Years | 5 | 17.2% |
| 75 to 84 Years | 8 | 27.6% |
| 85 Years and Over | 5 | 17.2% |
| Total | 29 | 100.0% |
Housing Finances in Circle
Median Income by Occupancy in Circle
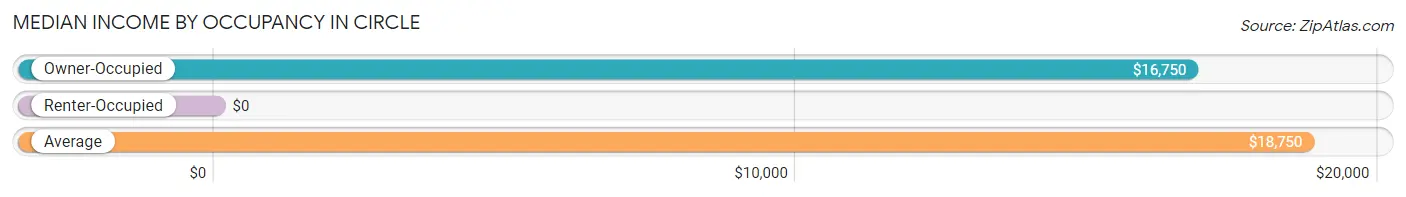
| Occupancy Type | # Households | Median Income |
| Owner-Occupied | 23 (79.3%) | $16,750 |
| Renter-Occupied | 6 (20.7%) | $0 |
| Average | 29 (100.0%) | $18,750 |
Occupancy by Householder Income Bracket in Circle
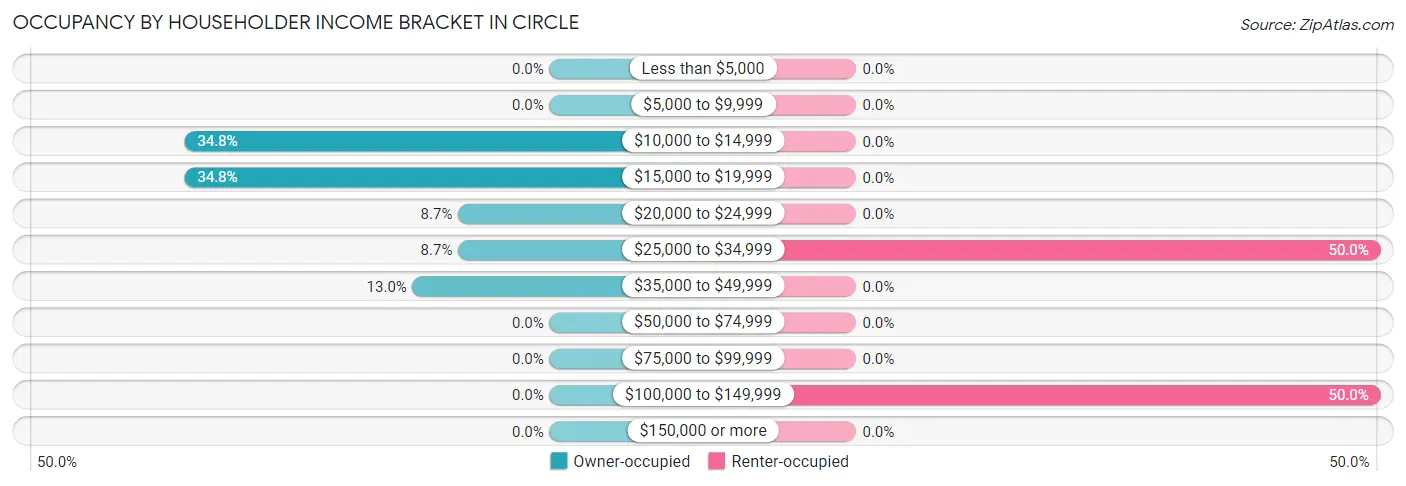
| Income Bracket | Owner-occupied | Renter-occupied |
| Less than $5,000 | 0 (0.0%) | 0 (0.0%) |
| $5,000 to $9,999 | 0 (0.0%) | 0 (0.0%) |
| $10,000 to $14,999 | 8 (34.8%) | 0 (0.0%) |
| $15,000 to $19,999 | 8 (34.8%) | 0 (0.0%) |
| $20,000 to $24,999 | 2 (8.7%) | 0 (0.0%) |
| $25,000 to $34,999 | 2 (8.7%) | 3 (50.0%) |
| $35,000 to $49,999 | 3 (13.0%) | 0 (0.0%) |
| $50,000 to $74,999 | 0 (0.0%) | 0 (0.0%) |
| $75,000 to $99,999 | 0 (0.0%) | 0 (0.0%) |
| $100,000 to $149,999 | 0 (0.0%) | 3 (50.0%) |
| $150,000 or more | 0 (0.0%) | 0 (0.0%) |
| Total | 23 (100.0%) | 6 (100.0%) |
Monthly Housing Cost Tiers in Circle
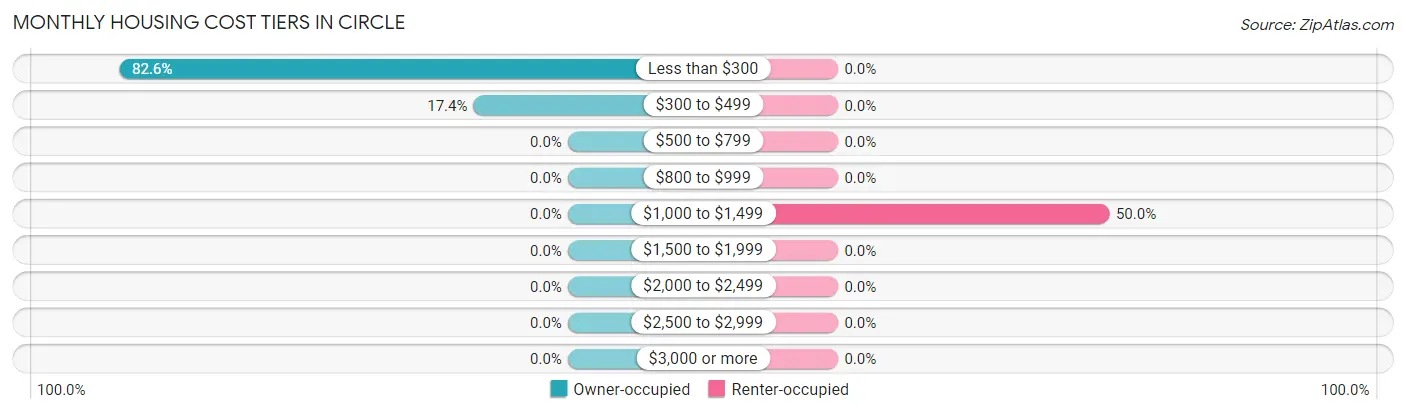
| Monthly Cost | Owner-occupied | Renter-occupied |
| Less than $300 | 19 (82.6%) | 0 (0.0%) |
| $300 to $499 | 4 (17.4%) | 0 (0.0%) |
| $500 to $799 | 0 (0.0%) | 0 (0.0%) |
| $800 to $999 | 0 (0.0%) | 0 (0.0%) |
| $1,000 to $1,499 | 0 (0.0%) | 3 (50.0%) |
| $1,500 to $1,999 | 0 (0.0%) | 0 (0.0%) |
| $2,000 to $2,499 | 0 (0.0%) | 0 (0.0%) |
| $2,500 to $2,999 | 0 (0.0%) | 0 (0.0%) |
| $3,000 or more | 0 (0.0%) | 0 (0.0%) |
| Total | 23 (100.0%) | 6 (100.0%) |
Physical Housing Characteristics in Circle
Housing Structures in Circle
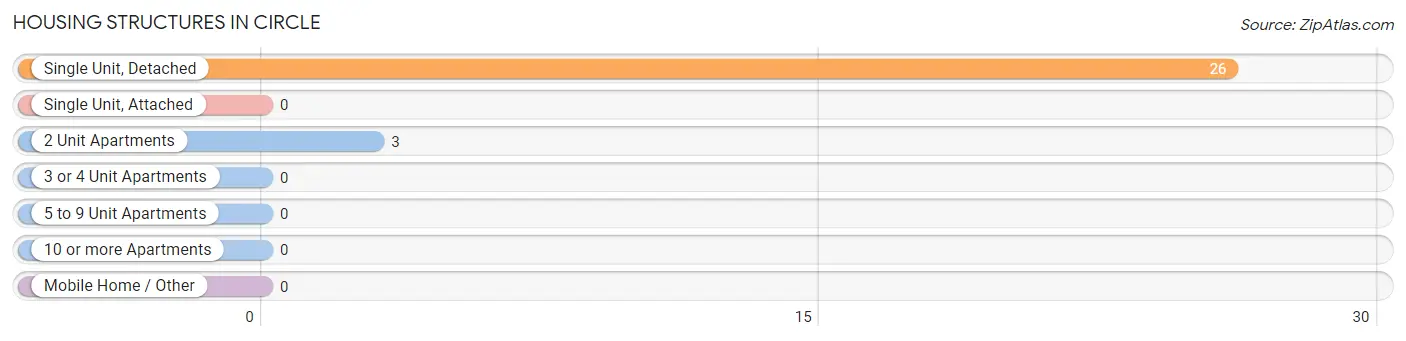
| Structure Type | # Housing Units | % Housing Units |
| Single Unit, Detached | 26 | 89.7% |
| Single Unit, Attached | 0 | 0.0% |
| 2 Unit Apartments | 3 | 10.3% |
| 3 or 4 Unit Apartments | 0 | 0.0% |
| 5 to 9 Unit Apartments | 0 | 0.0% |
| 10 or more Apartments | 0 | 0.0% |
| Mobile Home / Other | 0 | 0.0% |
| Total | 29 | 100.0% |
Housing Structures by Occupancy in Circle
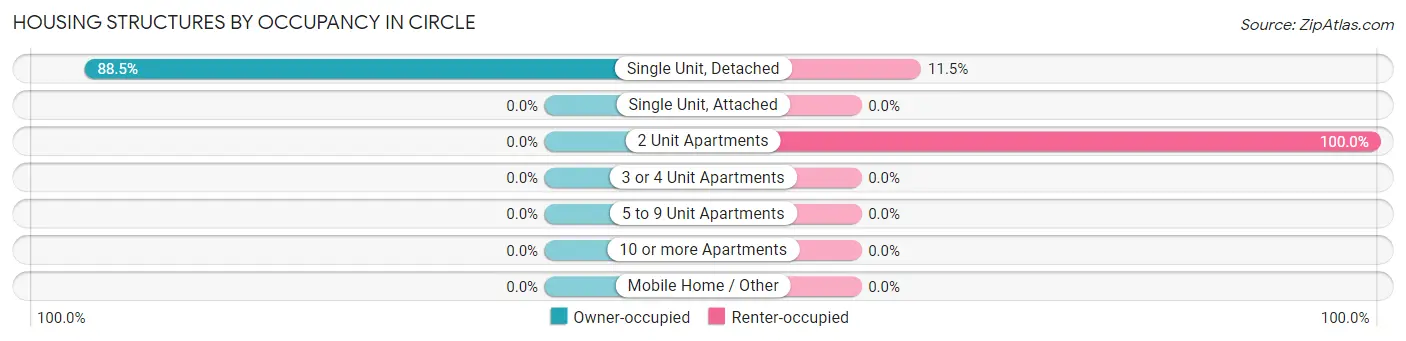
| Structure Type | Owner-occupied | Renter-occupied |
| Single Unit, Detached | 23 (88.5%) | 3 (11.5%) |
| Single Unit, Attached | 0 (0.0%) | 0 (0.0%) |
| 2 Unit Apartments | 0 (0.0%) | 3 (100.0%) |
| 3 or 4 Unit Apartments | 0 (0.0%) | 0 (0.0%) |
| 5 to 9 Unit Apartments | 0 (0.0%) | 0 (0.0%) |
| 10 or more Apartments | 0 (0.0%) | 0 (0.0%) |
| Mobile Home / Other | 0 (0.0%) | 0 (0.0%) |
| Total | 23 (79.3%) | 6 (20.7%) |
Housing Structures by Number of Rooms in Circle
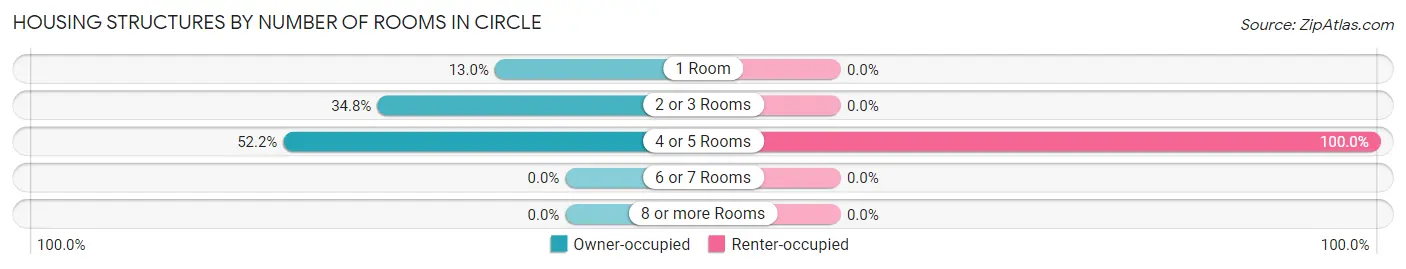
| Number of Rooms | Owner-occupied | Renter-occupied |
| 1 Room | 3 (13.0%) | 0 (0.0%) |
| 2 or 3 Rooms | 8 (34.8%) | 0 (0.0%) |
| 4 or 5 Rooms | 12 (52.2%) | 6 (100.0%) |
| 6 or 7 Rooms | 0 (0.0%) | 0 (0.0%) |
| 8 or more Rooms | 0 (0.0%) | 0 (0.0%) |
| Total | 23 (100.0%) | 6 (100.0%) |
Housing Structure by Heating Type in Circle
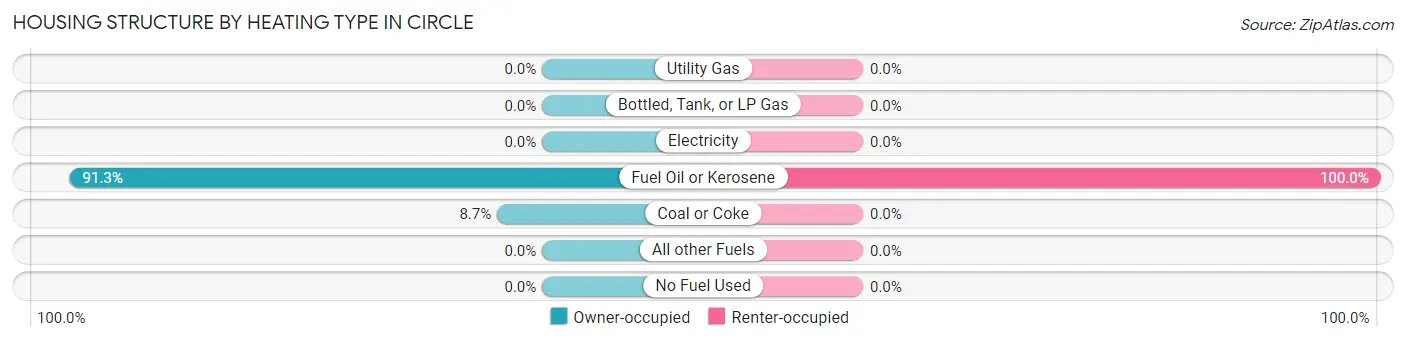
| Heating Type | Owner-occupied | Renter-occupied |
| Utility Gas | 0 (0.0%) | 0 (0.0%) |
| Bottled, Tank, or LP Gas | 0 (0.0%) | 0 (0.0%) |
| Electricity | 0 (0.0%) | 0 (0.0%) |
| Fuel Oil or Kerosene | 21 (91.3%) | 6 (100.0%) |
| Coal or Coke | 2 (8.7%) | 0 (0.0%) |
| All other Fuels | 0 (0.0%) | 0 (0.0%) |
| No Fuel Used | 0 (0.0%) | 0 (0.0%) |
| Total | 23 (100.0%) | 6 (100.0%) |
Household Vehicle Usage in Circle
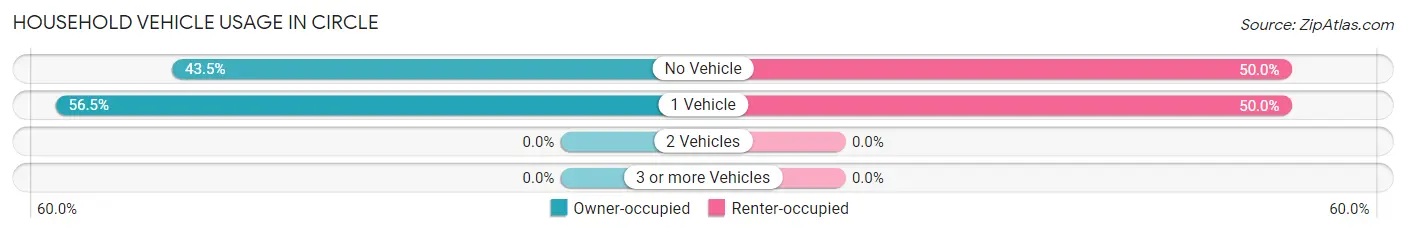
| Vehicles per Household | Owner-occupied | Renter-occupied |
| No Vehicle | 10 (43.5%) | 3 (50.0%) |
| 1 Vehicle | 13 (56.5%) | 3 (50.0%) |
| 2 Vehicles | 0 (0.0%) | 0 (0.0%) |
| 3 or more Vehicles | 0 (0.0%) | 0 (0.0%) |
| Total | 23 (100.0%) | 6 (100.0%) |
Real Estate & Mortgages in Circle
Real Estate and Mortgage Overview in Circle
| Characteristic | Without Mortgage | With Mortgage |
| Housing Units | 23 | 0 |
| Median Property Value | $94,400 | $0 |
| Median Household Income | $16,750 | $0 |
| Monthly Housing Costs | $105 | $0 |
| Real Estate Taxes | - | - |
Property Value by Mortgage Status in Circle
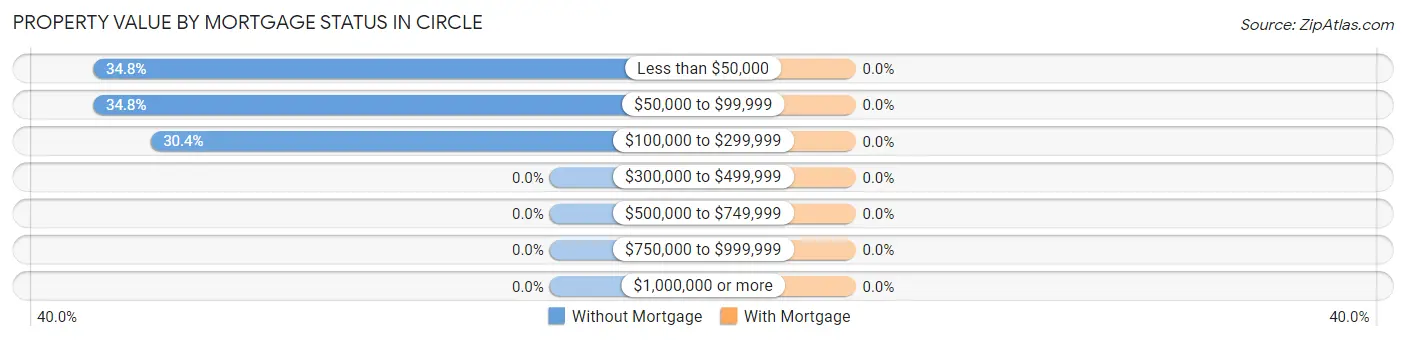
| Property Value | Without Mortgage | With Mortgage |
| Less than $50,000 | 8 (34.8%) | 0 (0.0%) |
| $50,000 to $99,999 | 8 (34.8%) | 0 (0.0%) |
| $100,000 to $299,999 | 7 (30.4%) | 0 (0.0%) |
| $300,000 to $499,999 | 0 (0.0%) | 0 (0.0%) |
| $500,000 to $749,999 | 0 (0.0%) | 0 (0.0%) |
| $750,000 to $999,999 | 0 (0.0%) | 0 (0.0%) |
| $1,000,000 or more | 0 (0.0%) | 0 (0.0%) |
| Total | 23 (100.0%) | 0 (0.0%) |
Household Income by Mortgage Status in Circle
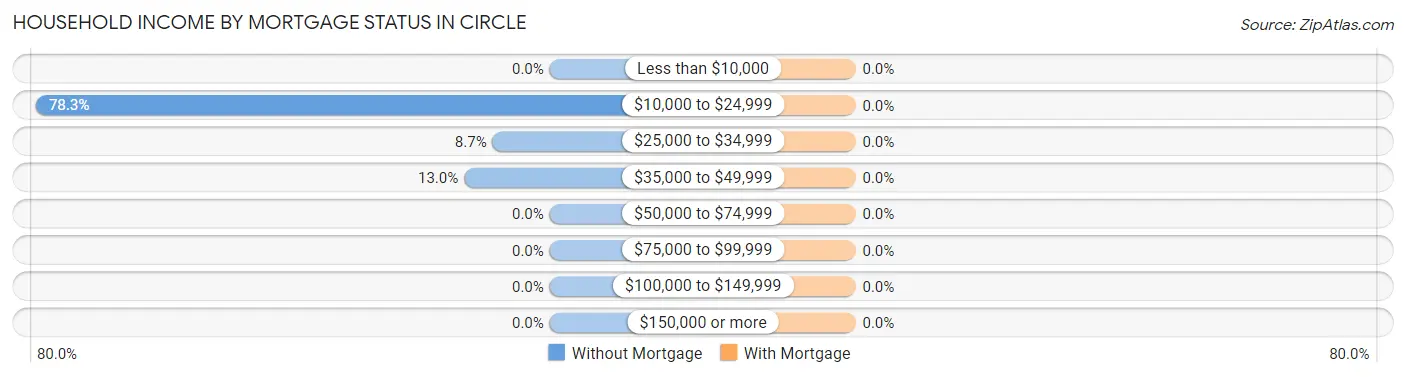
| Household Income | Without Mortgage | With Mortgage |
| Less than $10,000 | 0 (0.0%) | 0 (0.0%) |
| $10,000 to $24,999 | 18 (78.3%) | 0 (0.0%) |
| $25,000 to $34,999 | 2 (8.7%) | 0 (0.0%) |
| $35,000 to $49,999 | 3 (13.0%) | 0 (0.0%) |
| $50,000 to $74,999 | 0 (0.0%) | 0 (0.0%) |
| $75,000 to $99,999 | 0 (0.0%) | 0 (0.0%) |
| $100,000 to $149,999 | 0 (0.0%) | 0 (0.0%) |
| $150,000 or more | 0 (0.0%) | 0 (0.0%) |
| Total | 23 (100.0%) | 0 (0.0%) |
Property Value to Household Income Ratio in Circle
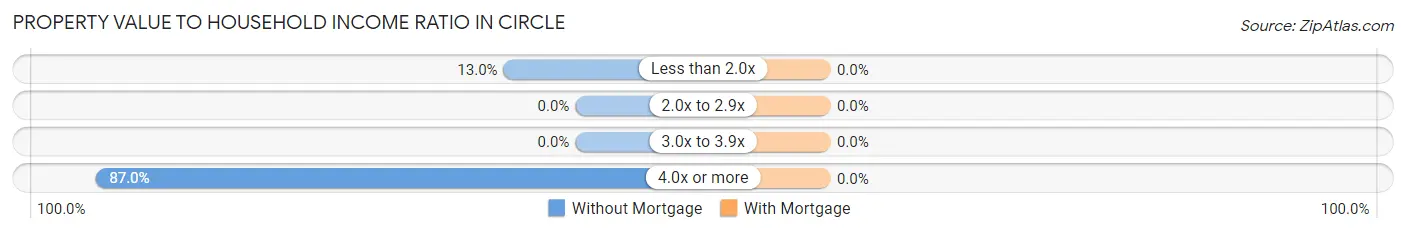
| Value-to-Income Ratio | Without Mortgage | With Mortgage |
| Less than 2.0x | 3 (13.0%) | 0 (0.0%) |
| 2.0x to 2.9x | 0 (0.0%) | 0 (0.0%) |
| 3.0x to 3.9x | 0 (0.0%) | 0 (0.0%) |
| 4.0x or more | 20 (87.0%) | 0 (0.0%) |
| Total | 23 (100.0%) | 0 (0.0%) |
Real Estate Taxes by Mortgage Status in Circle
| Property Taxes | Without Mortgage | With Mortgage |
| Less than $800 | 0 (0.0%) | 0 (0.0%) |
| $800 to $1,499 | 0 (0.0%) | 0 (0.0%) |
| $800 to $1,499 | 0 (0.0%) | 0 (0.0%) |
| Total | 23 (100.0%) | 0 (0.0%) |
Health & Disability in Circle
Health Insurance Coverage by Age in Circle
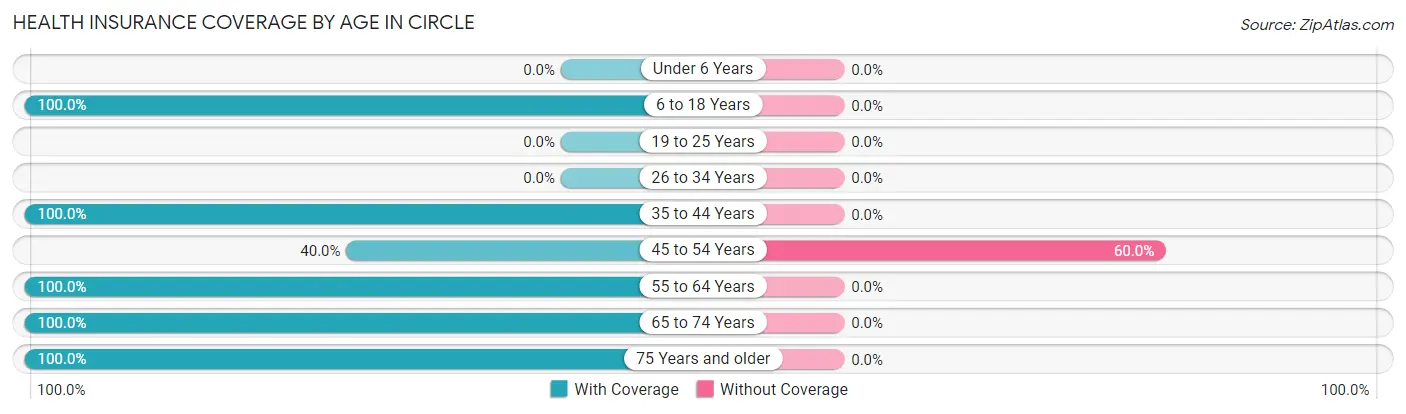
| Age Bracket | With Coverage | Without Coverage |
| Under 6 Years | 0 (0.0%) | 0 (0.0%) |
| 6 to 18 Years | 16 (100.0%) | 0 (0.0%) |
| 19 to 25 Years | 0 (0.0%) | 0 (0.0%) |
| 26 to 34 Years | 0 (0.0%) | 0 (0.0%) |
| 35 to 44 Years | 3 (100.0%) | 0 (0.0%) |
| 45 to 54 Years | 2 (40.0%) | 3 (60.0%) |
| 55 to 64 Years | 3 (100.0%) | 0 (0.0%) |
| 65 to 74 Years | 5 (100.0%) | 0 (0.0%) |
| 75 Years and older | 13 (100.0%) | 0 (0.0%) |
| Total | 42 (93.3%) | 3 (6.7%) |
Health Insurance Coverage by Citizenship Status in Circle
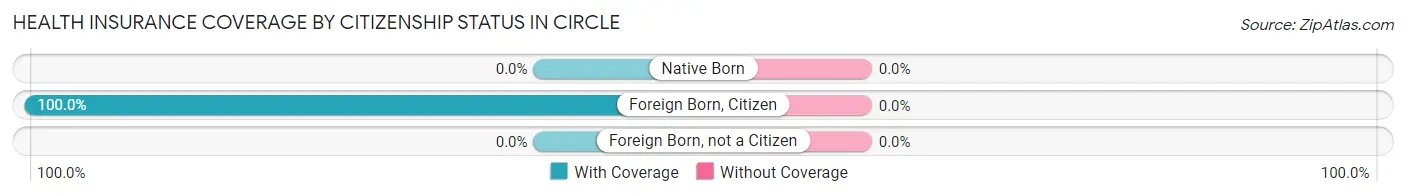
| Citizenship Status | With Coverage | Without Coverage |
| Native Born | 0 (0.0%) | 0 (0.0%) |
| Foreign Born, Citizen | 16 (100.0%) | 0 (0.0%) |
| Foreign Born, not a Citizen | 0 (0.0%) | 0 (0.0%) |
Health Insurance Coverage by Household Income in Circle
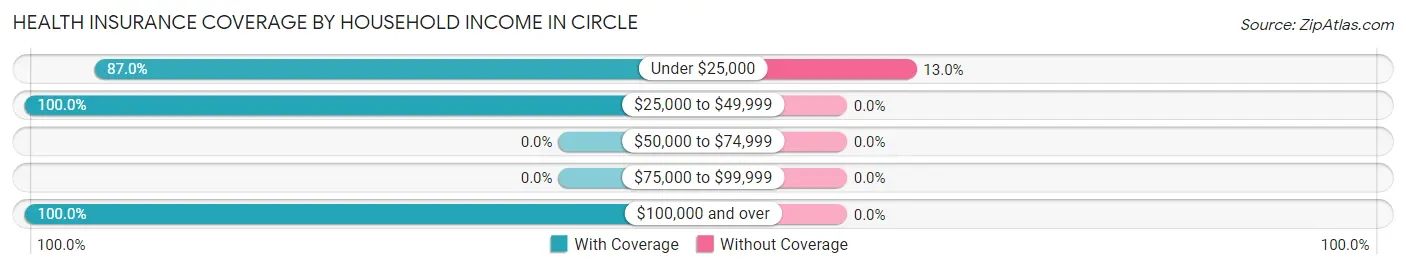
| Household Income | With Coverage | Without Coverage |
| Under $25,000 | 20 (87.0%) | 3 (13.0%) |
| $25,000 to $49,999 | 19 (100.0%) | 0 (0.0%) |
| $50,000 to $74,999 | 0 (0.0%) | 0 (0.0%) |
| $75,000 to $99,999 | 0 (0.0%) | 0 (0.0%) |
| $100,000 and over | 3 (100.0%) | 0 (0.0%) |
Public vs Private Health Insurance Coverage by Age in Circle
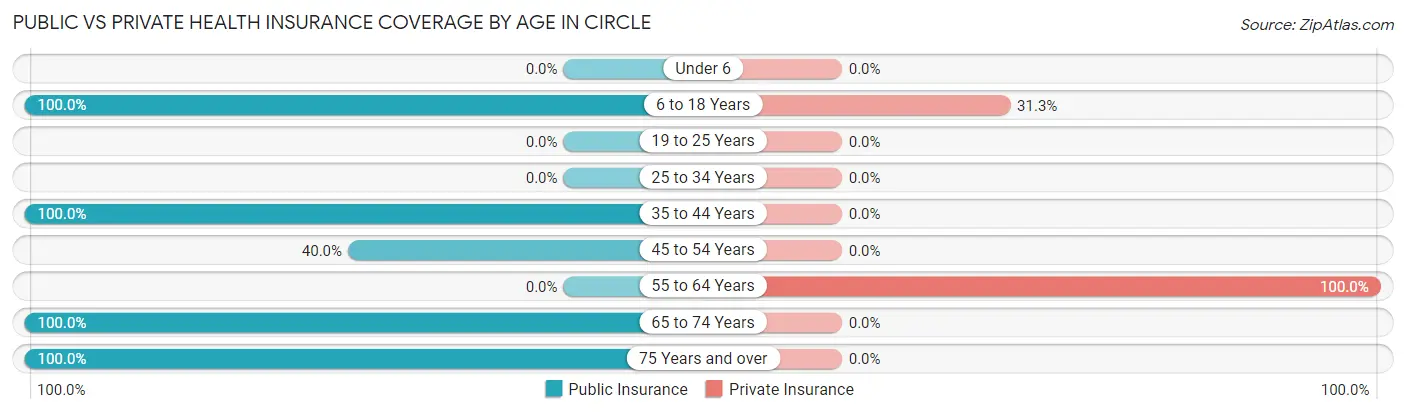
| Age Bracket | Public Insurance | Private Insurance |
| Under 6 | 0 (0.0%) | 0 (0.0%) |
| 6 to 18 Years | 16 (100.0%) | 5 (31.2%) |
| 19 to 25 Years | 0 (0.0%) | 0 (0.0%) |
| 25 to 34 Years | 0 (0.0%) | 0 (0.0%) |
| 35 to 44 Years | 3 (100.0%) | 0 (0.0%) |
| 45 to 54 Years | 2 (40.0%) | 0 (0.0%) |
| 55 to 64 Years | 0 (0.0%) | 3 (100.0%) |
| 65 to 74 Years | 5 (100.0%) | 0 (0.0%) |
| 75 Years and over | 13 (100.0%) | 0 (0.0%) |
| Total | 39 (86.7%) | 8 (17.8%) |
Disability Status by Sex by Age in Circle
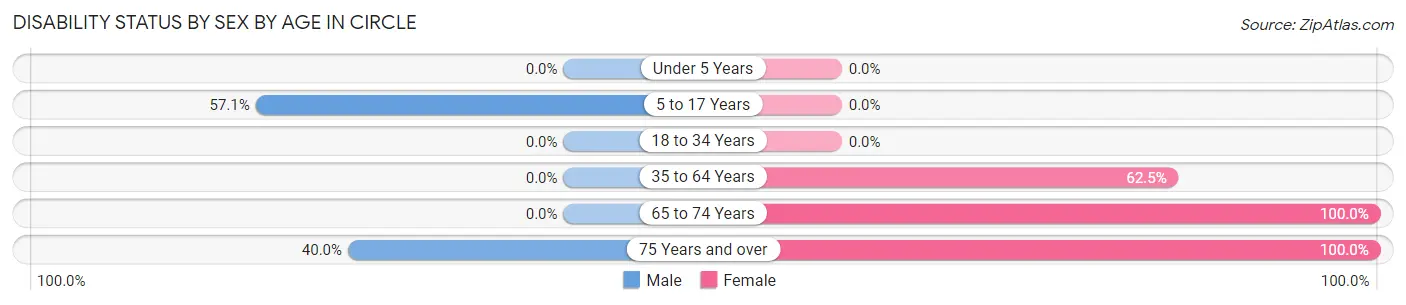
| Age Bracket | Male | Female |
| Under 5 Years | 0 (0.0%) | 0 (0.0%) |
| 5 to 17 Years | 4 (57.1%) | 0 (0.0%) |
| 18 to 34 Years | 0 (0.0%) | 0 (0.0%) |
| 35 to 64 Years | 0 (0.0%) | 5 (62.5%) |
| 65 to 74 Years | 0 (0.0%) | 5 (100.0%) |
| 75 Years and over | 2 (40.0%) | 8 (100.0%) |
Disability Class by Sex by Age in Circle
Disability Class: Hearing Difficulty
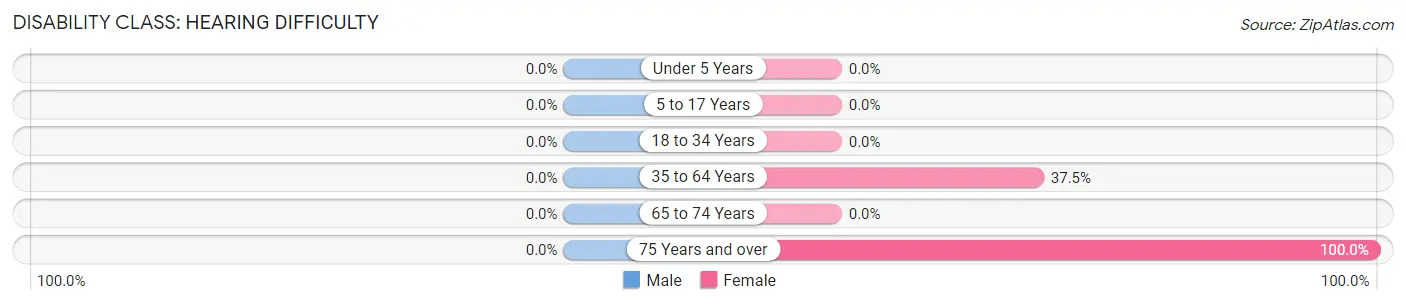
| Age Bracket | Male | Female |
| Under 5 Years | 0 (0.0%) | 0 (0.0%) |
| 5 to 17 Years | 0 (0.0%) | 0 (0.0%) |
| 18 to 34 Years | 0 (0.0%) | 0 (0.0%) |
| 35 to 64 Years | 0 (0.0%) | 3 (37.5%) |
| 65 to 74 Years | 0 (0.0%) | 0 (0.0%) |
| 75 Years and over | 0 (0.0%) | 8 (100.0%) |
Disability Class: Vision Difficulty
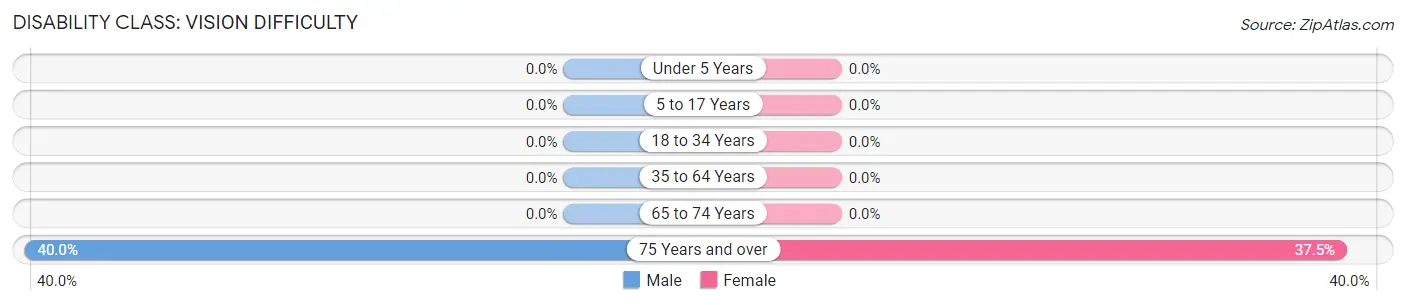
| Age Bracket | Male | Female |
| Under 5 Years | 0 (0.0%) | 0 (0.0%) |
| 5 to 17 Years | 0 (0.0%) | 0 (0.0%) |
| 18 to 34 Years | 0 (0.0%) | 0 (0.0%) |
| 35 to 64 Years | 0 (0.0%) | 0 (0.0%) |
| 65 to 74 Years | 0 (0.0%) | 0 (0.0%) |
| 75 Years and over | 2 (40.0%) | 3 (37.5%) |
Disability Class: Cognitive Difficulty

| Age Bracket | Male | Female |
| 5 to 17 Years | 4 (57.1%) | 0 (0.0%) |
| 18 to 34 Years | 0 (0.0%) | 0 (0.0%) |
| 35 to 64 Years | 0 (0.0%) | 2 (25.0%) |
| 65 to 74 Years | 0 (0.0%) | 0 (0.0%) |
| 75 Years and over | 0 (0.0%) | 3 (37.5%) |
Disability Class: Ambulatory Difficulty
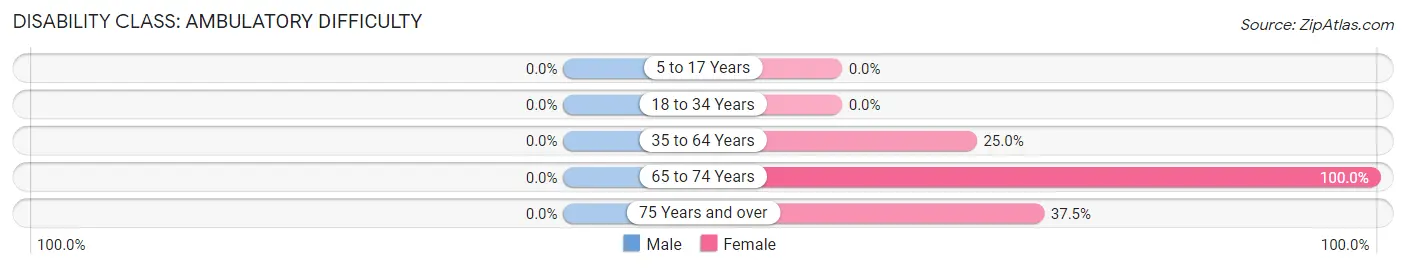
| Age Bracket | Male | Female |
| 5 to 17 Years | 0 (0.0%) | 0 (0.0%) |
| 18 to 34 Years | 0 (0.0%) | 0 (0.0%) |
| 35 to 64 Years | 0 (0.0%) | 2 (25.0%) |
| 65 to 74 Years | 0 (0.0%) | 5 (100.0%) |
| 75 Years and over | 0 (0.0%) | 3 (37.5%) |
Disability Class: Self-Care Difficulty
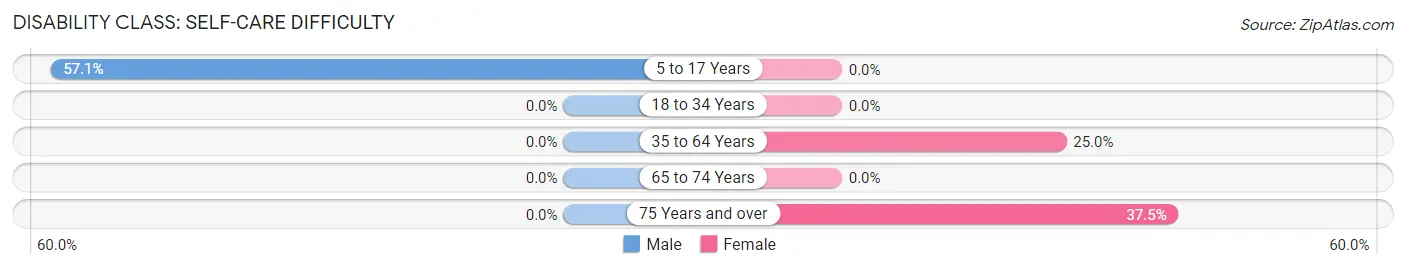
| Age Bracket | Male | Female |
| 5 to 17 Years | 4 (57.1%) | 0 (0.0%) |
| 18 to 34 Years | 0 (0.0%) | 0 (0.0%) |
| 35 to 64 Years | 0 (0.0%) | 2 (25.0%) |
| 65 to 74 Years | 0 (0.0%) | 0 (0.0%) |
| 75 Years and over | 0 (0.0%) | 3 (37.5%) |
Technology Access in Circle
Computing Device Access in Circle
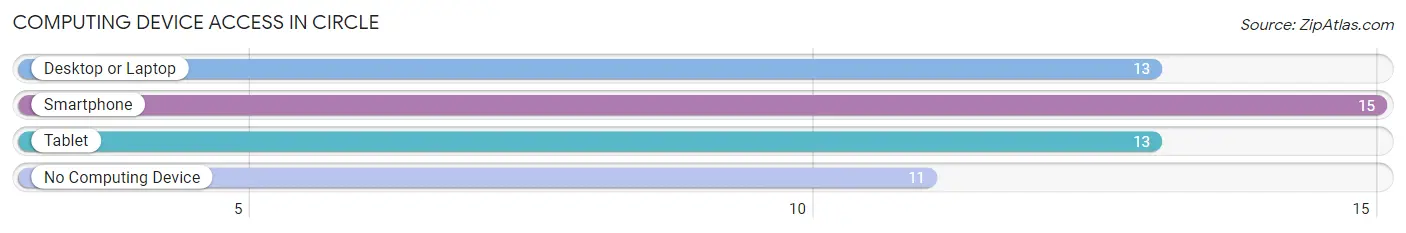
| Device Type | # Households | % Households |
| Desktop or Laptop | 13 | 44.8% |
| Smartphone | 15 | 51.7% |
| Tablet | 13 | 44.8% |
| No Computing Device | 11 | 37.9% |
| Total | 29 | 100.0% |
Internet Access in Circle
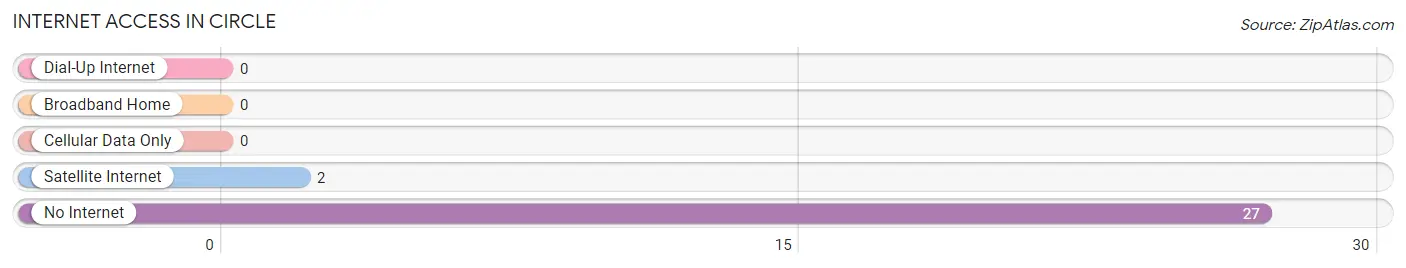
| Internet Type | # Households | % Households |
| Dial-Up Internet | 0 | 0.0% |
| Broadband Home | 0 | 0.0% |
| Cellular Data Only | 0 | 0.0% |
| Satellite Internet | 2 | 6.9% |
| No Internet | 27 | 93.1% |
| Total | 29 | 100.0% |
Circle Summary
Circle is a small city located in the Yukon-Koyukuk Census Area of Alaska. It is situated on the Yukon River, approximately 100 miles northeast of Fairbanks. The city has a population of approximately 200 people, and is the only incorporated city in the Yukon-Koyukuk Census Area.
History
Circle was originally inhabited by the Koyukon Athabascan people, who have lived in the area for thousands of years. The first non-native settlers arrived in the area in the late 1800s, and the town was officially established in 1901. The town was named after the nearby Circle Mining District, which was established in 1898.
The town was originally a trading post for miners and trappers, and was also a supply point for riverboats traveling up and down the Yukon River. In the early 1900s, Circle was a bustling town with a population of over 1,000 people.
The town began to decline in the 1920s, as the gold rush ended and the riverboats stopped running. By the 1950s, the population had dropped to just over 200 people.
Geography
Circle is located in the Yukon-Koyukuk Census Area of Alaska, approximately 100 miles northeast of Fairbanks. The city is situated on the Yukon River, and is surrounded by the Yukon Flats National Wildlife Refuge. The city is located in a subarctic climate zone, with cold winters and mild summers.
The city is located in a flat, low-lying area, with the Yukon River to the east and the Yukon Flats to the west. The terrain is mostly tundra, with some areas of boreal forest.
Economy
The economy of Circle is largely based on subsistence activities, such as hunting, fishing, and trapping. The city also has a small tourism industry, with visitors coming to the area to fish, hunt, and explore the nearby wildlife refuge.
The city also has a small commercial fishing industry, with fishermen catching salmon, whitefish, and other species in the Yukon River. The city also has a small mining industry, with gold, silver, and other minerals being mined in the area.
Demographics
As of the 2010 census, the population of Circle was 200 people. The racial makeup of the city was 95.5% Native American, 2.5% White, and 2% other. The median household income was $25,000, and the median age was 33.
The city is served by the Circle City School District, which has one elementary school and one high school. The city also has a public library, a post office, and a health clinic.
Common Questions
What is Per Capita Income in Circle?
Per Capita income in Circle is $19,402.
What is the Median Household income in Circle?
Median Household Income in Circle is $18,750.
What is Inequality or Gini Index in Circle?
Inequality or Gini Index in Circle is 0.39.
What is the Total Population of Circle?
Total Population of Circle is 45.
What is the Total Male Population of Circle?
Total Male Population of Circle is 15.
What is the Total Female Population of Circle?
Total Female Population of Circle is 30.
What is the Ratio of Males per 100 Females in Circle?
There are 50.00 Males per 100 Females in Circle.
What is the Ratio of Females per 100 Males in Circle?
There are 200.00 Females per 100 Males in Circle.
What is the Median Population Age in Circle?
Median Population Age in Circle is 52.7 Years.
What is the Average Family Size in Circle
Average Family Size in Circle is 3.0 People.
What is the Average Household Size in Circle
Average Household Size in Circle is 1.6 People.
How Large is the Labor Force in Circle?
There are 15 People in the Labor Forcein in Circle.
What is the Percentage of People in the Labor Force in Circle?
51.7% of People are in the Labor Force in Circle.
What is the Unemployment Rate in Circle?
Unemployment Rate in Circle is 20.0%.