Zip Codes with the Highest Percentage of Households Without a Vehicle in Layton, UT
RELATED REPORTS & OPTIONS
Households without a Cars
Layton
Compare Zip Codes
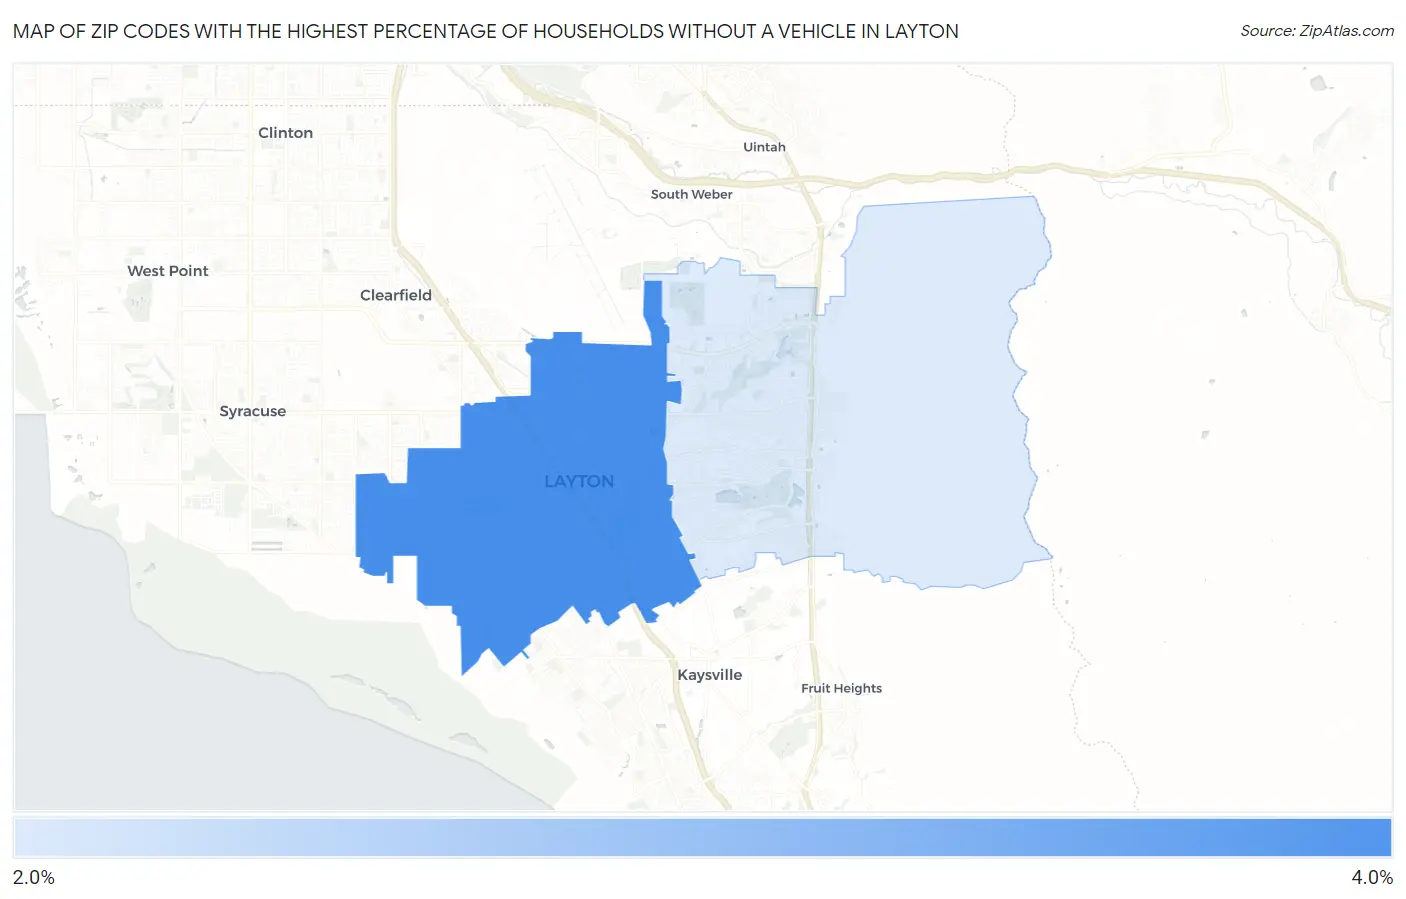
Map of Zip Codes with the Highest Percentage of Households Without a Vehicle in Layton
2.0%
3.4%
Zip Codes with the Highest Percentage of Households Without a Vehicle in Layton, UT
| Zip Code | Housholds Without a Car | vs State | vs National | |
| 1. | 84041 | 3.4% | 3.9%(-0.500)#81 | 8.3%(-4.90)#17,604 |
| 2. | 84040 | 2.0% | 3.9%(-1.90)#136 | 8.3%(-6.30)#22,454 |
1
Common Questions
What are the Top Zip Codes with the Highest Percentage of Households Without a Vehicle in Layton, UT?
Top Zip Codes with the Highest Percentage of Households Without a Vehicle in Layton, UT are:
What zip code has the Highest Percentage of Households Without a Vehicle in Layton, UT?
84041 has the Highest Percentage of Households Without a Vehicle in Layton, UT with 3.4%.
What is the Percentage of Households Without a Vehicle in Layton, UT?
Percentage of Households Without a Vehicle in Layton is 3.0%.
What is the Percentage of Households Without a Vehicle in Utah?
Percentage of Households Without a Vehicle in Utah is 3.9%.
What is the Percentage of Households Without a Vehicle in the United States?
Percentage of Households Without a Vehicle in the United States is 8.3%.