Citrus City, TX Map & Demographics
Citrus City Map
Citrus City Overview
$8,316
PER CAPITA INCOME
$26,779
AVG FAMILY INCOME
$26,971
AVG HOUSEHOLD INCOME
0.40
INEQUALITY / GINI INDEX
2,920
TOTAL POPULATION
1,344
MALE POPULATION
1,576
FEMALE POPULATION
85.28
MALES / 100 FEMALES
117.26
FEMALES / 100 MALES
22.9
MEDIAN AGE
5.0
AVG FAMILY SIZE
4.7
AVG HOUSEHOLD SIZE
1,256
LABOR FORCE [ PEOPLE ]
59.8%
PERCENT IN LABOR FORCE
28.2%
UNEMPLOYMENT RATE
Income in Citrus City
Income Overview in Citrus City
Per Capita Income in Citrus City is $8,316, while median incomes of families and households are $26,779 and $26,971 respectively.
| Characteristic | Number | Measure |
| Per Capita Income | 2,920 | $8,316 |
| Median Family Income | 563 | $26,779 |
| Mean Family Income | 563 | $38,288 |
| Median Household Income | 617 | $26,971 |
| Mean Household Income | 617 | $36,686 |
| Income Deficit | 563 | $0 |
| Wage / Income Gap (%) | 2,920 | 0.00% |
| Wage / Income Gap ($) | 2,920 | 100.00¢ per $1 |
| Gini / Inequality Index | 2,920 | 0.40 |
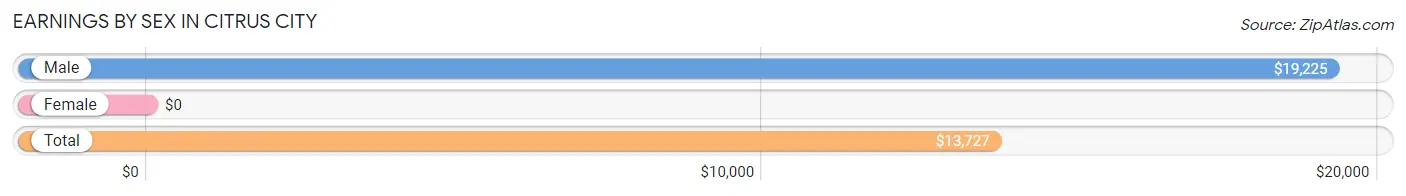
Earnings by Sex in Citrus City
| Sex | Number | Average Earnings |
| Male | 759 (68.8%) | $19,225 |
| Female | 345 (31.2%) | $0 |
| Total | 1,104 (100.0%) | $13,727 |
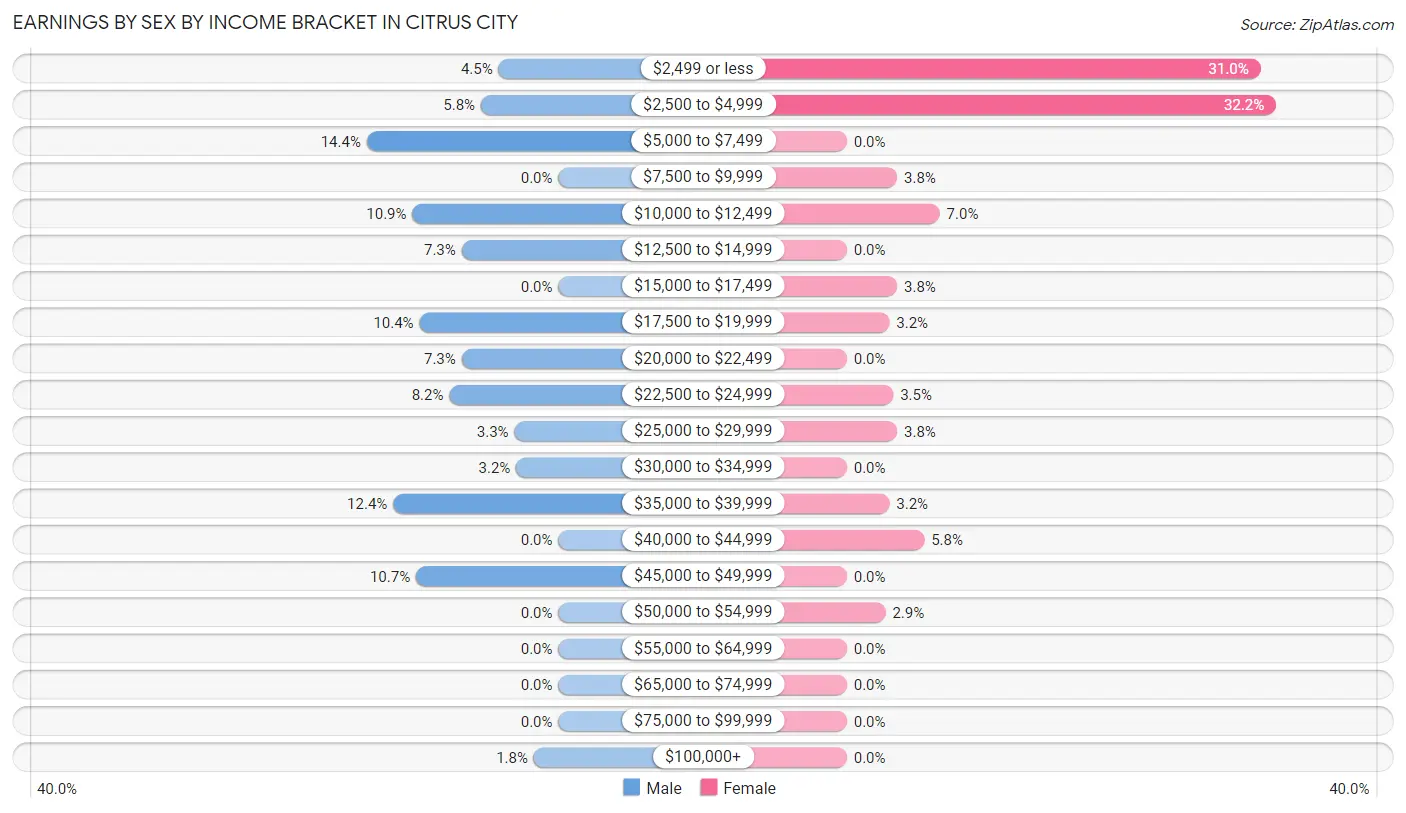
Earnings by Sex by Income Bracket in Citrus City
The most common earnings brackets in Citrus City are $5,000 to $7,499 for men (109 | 14.4%) and $2,500 to $4,999 for women (111 | 32.2%).
| Income | Male | Female |
| $2,499 or less | 34 (4.5%) | 107 (31.0%) |
| $2,500 to $4,999 | 44 (5.8%) | 111 (32.2%) |
| $5,000 to $7,499 | 109 (14.4%) | 0 (0.0%) |
| $7,500 to $9,999 | 0 (0.0%) | 13 (3.8%) |
| $10,000 to $12,499 | 83 (10.9%) | 24 (7.0%) |
| $12,500 to $14,999 | 55 (7.2%) | 0 (0.0%) |
| $15,000 to $17,499 | 0 (0.0%) | 13 (3.8%) |
| $17,500 to $19,999 | 79 (10.4%) | 11 (3.2%) |
| $20,000 to $22,499 | 55 (7.2%) | 0 (0.0%) |
| $22,500 to $24,999 | 62 (8.2%) | 12 (3.5%) |
| $25,000 to $29,999 | 25 (3.3%) | 13 (3.8%) |
| $30,000 to $34,999 | 24 (3.2%) | 0 (0.0%) |
| $35,000 to $39,999 | 94 (12.4%) | 11 (3.2%) |
| $40,000 to $44,999 | 0 (0.0%) | 20 (5.8%) |
| $45,000 to $49,999 | 81 (10.7%) | 0 (0.0%) |
| $50,000 to $54,999 | 0 (0.0%) | 10 (2.9%) |
| $55,000 to $64,999 | 0 (0.0%) | 0 (0.0%) |
| $65,000 to $74,999 | 0 (0.0%) | 0 (0.0%) |
| $75,000 to $99,999 | 0 (0.0%) | 0 (0.0%) |
| $100,000+ | 14 (1.8%) | 0 (0.0%) |
| Total | 759 (100.0%) | 345 (100.0%) |
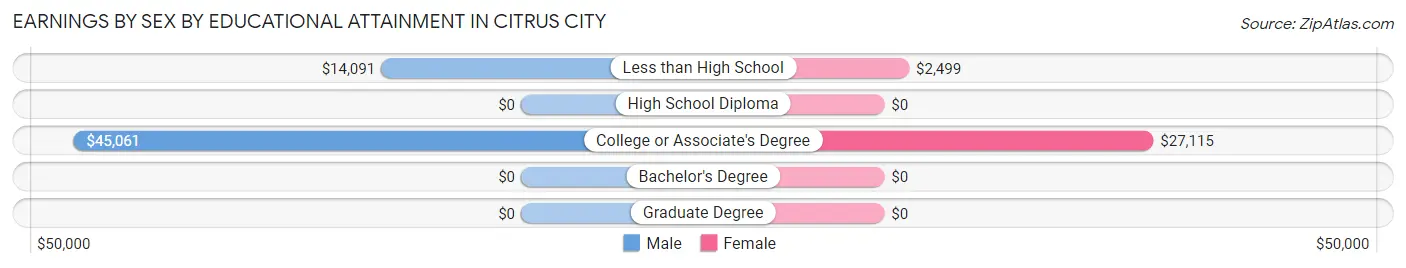
Earnings by Sex by Educational Attainment in Citrus City
| Educational Attainment | Male Income | Female Income |
| Less than High School | $14,091 | $2,499 |
| High School Diploma | - | - |
| College or Associate's Degree | $45,061 | $27,115 |
| Bachelor's Degree | - | - |
| Graduate Degree | - | - |
| Total | $18,117 | $0 |
Family Income in Citrus City
Family Income Brackets in Citrus City
According to the Citrus City family income data, there are 193 families falling into the $50,000 to $74,999 income range, which is the most common income bracket and makes up 34.3% of all families.
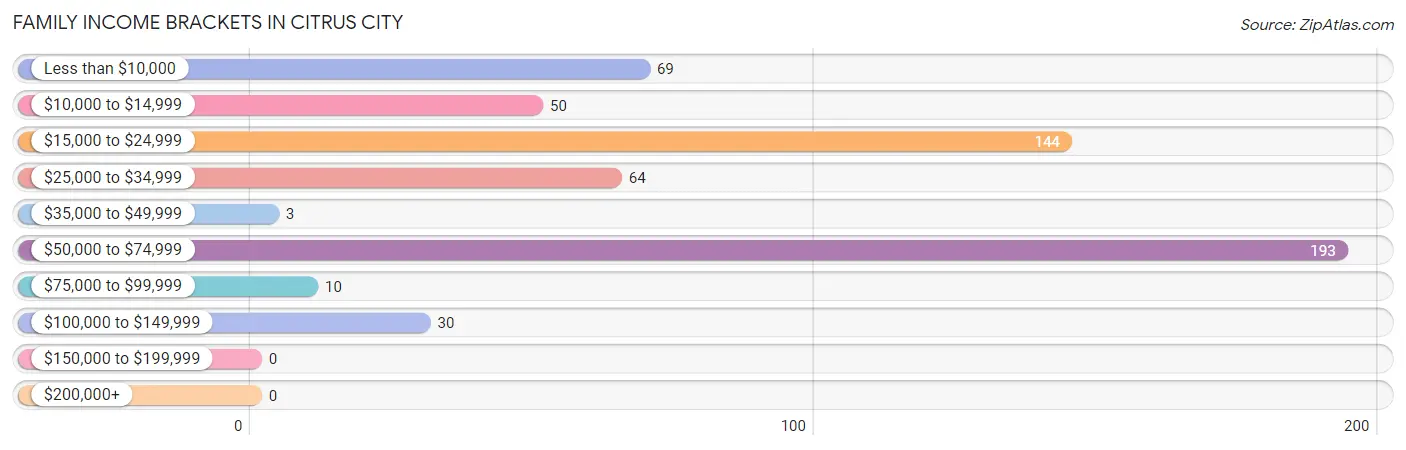
| Income Bracket | # Families | % Families |
| Less than $10,000 | 69 | 12.3% |
| $10,000 to $14,999 | 50 | 8.9% |
| $15,000 to $24,999 | 144 | 25.6% |
| $25,000 to $34,999 | 64 | 11.4% |
| $35,000 to $49,999 | 3 | 0.5% |
| $50,000 to $74,999 | 193 | 34.3% |
| $75,000 to $99,999 | 10 | 1.8% |
| $100,000 to $149,999 | 30 | 5.3% |
| $150,000 to $199,999 | 0 | 0.0% |
| $200,000+ | 0 | 0.0% |
Family Income by Famaliy Size in Citrus City
6-person families (176 | 31.3%) account for the highest median family income in Citrus City with $55,732 per family, while 4-person families (35 | 6.2%) have the highest median income of $12,860 per family member.
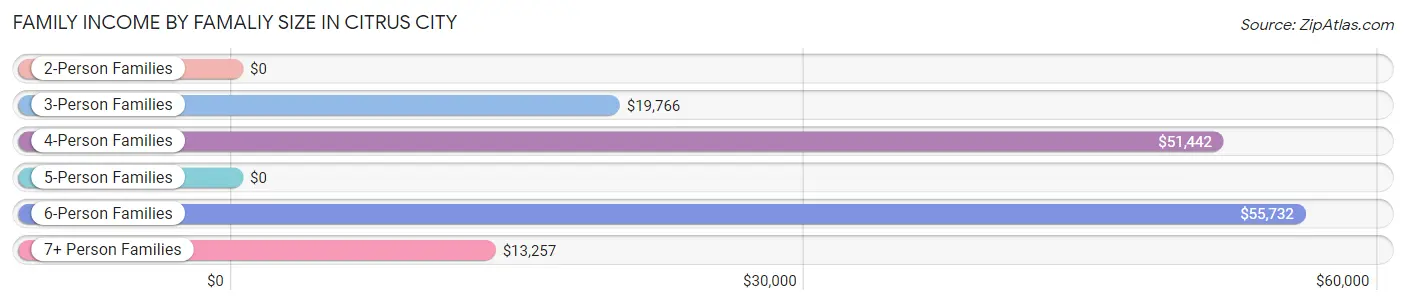
| Income Bracket | # Families | Median Income |
| 2-Person Families | 84 (14.9%) | $0 |
| 3-Person Families | 111 (19.7%) | $19,766 |
| 4-Person Families | 35 (6.2%) | $51,442 |
| 5-Person Families | 60 (10.7%) | $0 |
| 6-Person Families | 176 (31.3%) | $55,732 |
| 7+ Person Families | 97 (17.2%) | $13,257 |
| Total | 563 (100.0%) | $26,779 |
Family Income by Number of Earners in Citrus City
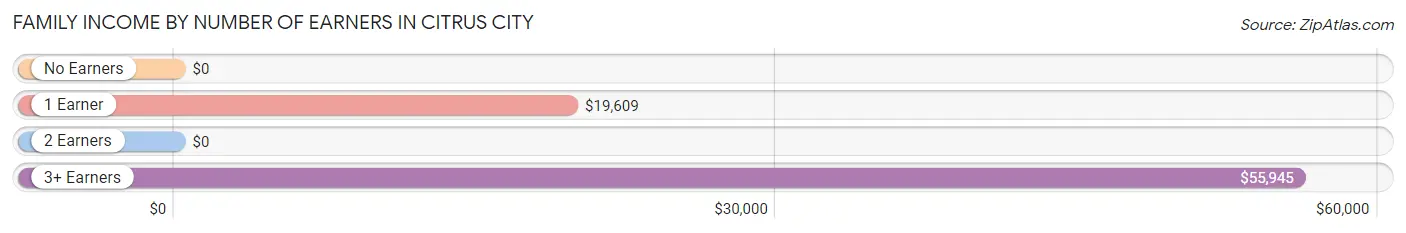
| Number of Earners | # Families | Median Income |
| No Earners | 54 (9.6%) | $0 |
| 1 Earner | 225 (40.0%) | $19,609 |
| 2 Earners | 158 (28.1%) | $0 |
| 3+ Earners | 126 (22.4%) | $55,945 |
| Total | 563 (100.0%) | $26,779 |
Household Income in Citrus City
Household Income Brackets in Citrus City
With 193 households falling in the category, the $50,000 to $74,999 income range is the most frequent in Citrus City, accounting for 31.3% of all households.
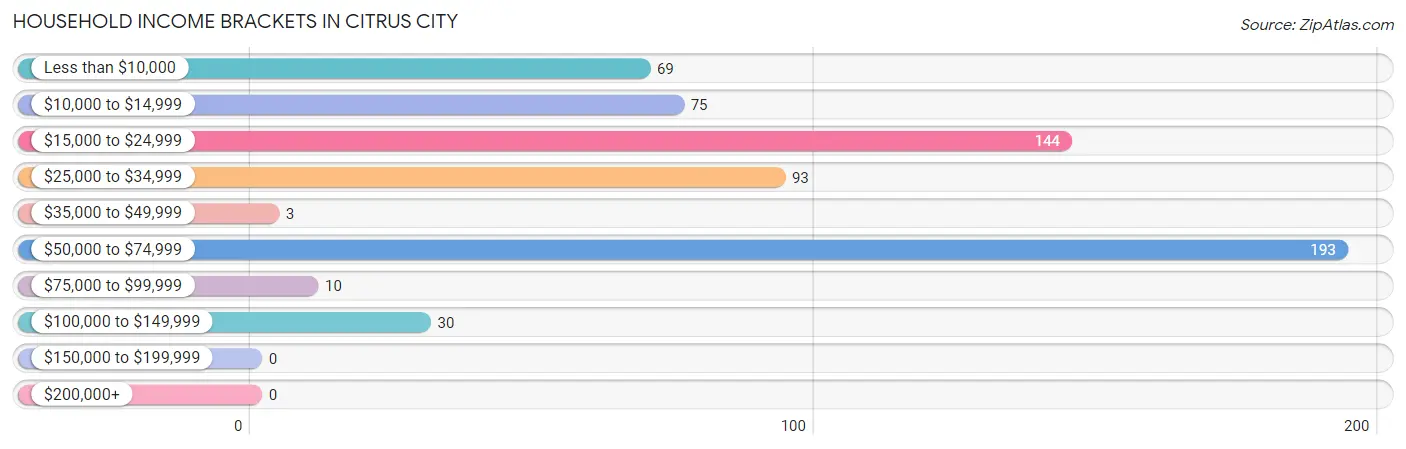
| Income Bracket | # Households | % Households |
| Less than $10,000 | 69 | 11.2% |
| $10,000 to $14,999 | 75 | 12.2% |
| $15,000 to $24,999 | 144 | 23.3% |
| $25,000 to $34,999 | 93 | 15.1% |
| $35,000 to $49,999 | 3 | 0.5% |
| $50,000 to $74,999 | 193 | 31.3% |
| $75,000 to $99,999 | 10 | 1.6% |
| $100,000 to $149,999 | 30 | 4.9% |
| $150,000 to $199,999 | 0 | 0.0% |
| $200,000+ | 0 | 0.0% |
Household Income by Householder Age in Citrus City
The median household income in Citrus City is $26,971, with the highest median household income of $22,857 found in the 25 to 44 years age bracket for the primary householder. A total of 270 households (43.8%) fall into this category.
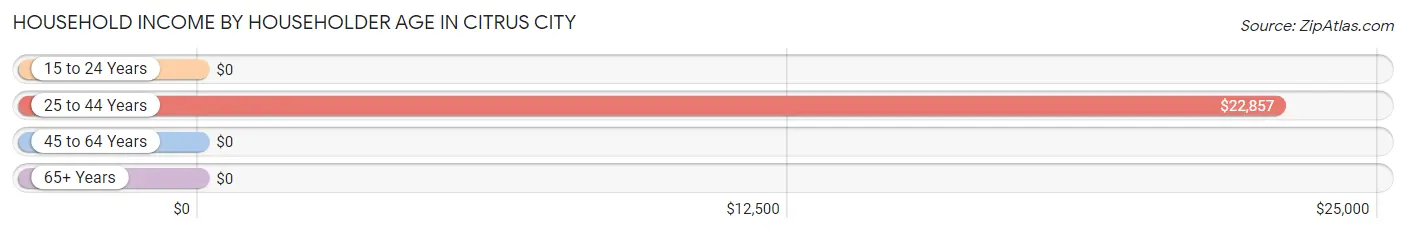
| Income Bracket | # Households | Median Income |
| 15 to 24 Years | 0 (0.0%) | $0 |
| 25 to 44 Years | 270 (43.8%) | $22,857 |
| 45 to 64 Years | 288 (46.7%) | $0 |
| 65+ Years | 59 (9.6%) | $0 |
| Total | 617 (100.0%) | $26,971 |
Poverty in Citrus City
Income Below Poverty by Sex and Age in Citrus City
With 42.6% poverty level for males and 53.7% for females among the residents of Citrus City, 15 year old males and 5 year old females are the most vulnerable to poverty, with 26 males (100.0%) and 40 females (100.0%) in their respective age groups living below the poverty level.
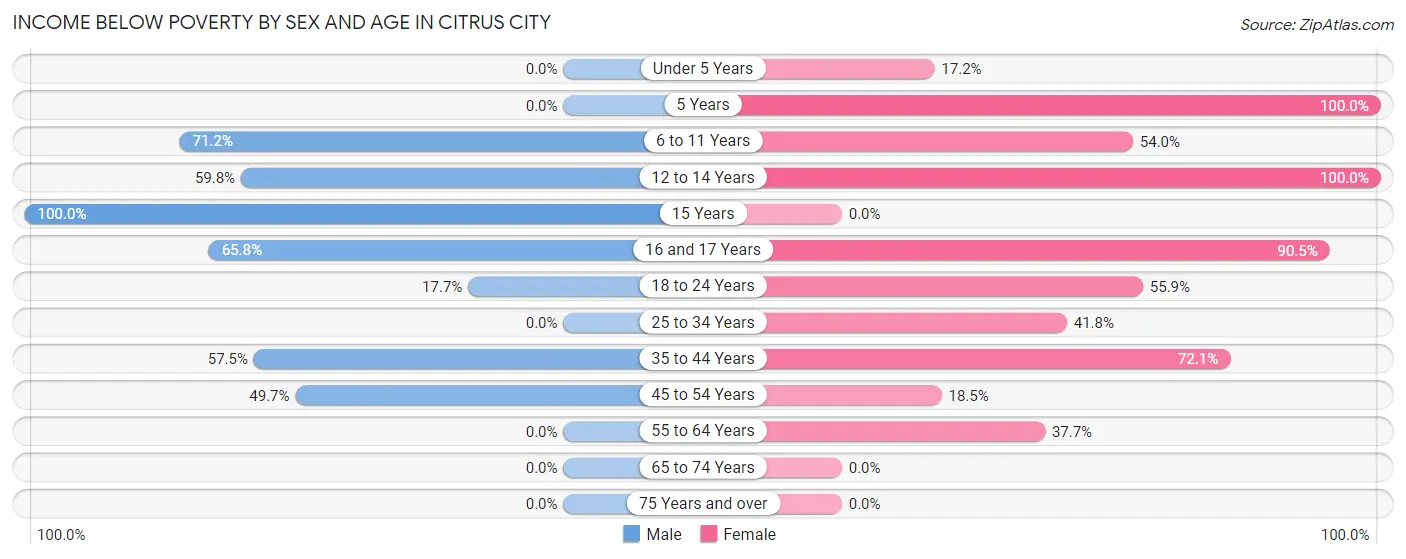
| Age Bracket | Male | Female |
| Under 5 Years | 0 (0.0%) | 11 (17.2%) |
| 5 Years | 0 (0.0%) | 40 (100.0%) |
| 6 to 11 Years | 109 (71.2%) | 161 (54.0%) |
| 12 to 14 Years | 76 (59.8%) | 112 (100.0%) |
| 15 Years | 26 (100.0%) | 0 (0.0%) |
| 16 and 17 Years | 77 (65.8%) | 105 (90.5%) |
| 18 to 24 Years | 56 (17.7%) | 76 (55.9%) |
| 25 to 34 Years | 0 (0.0%) | 104 (41.8%) |
| 35 to 44 Years | 135 (57.5%) | 129 (72.1%) |
| 45 to 54 Years | 94 (49.7%) | 20 (18.5%) |
| 55 to 64 Years | 0 (0.0%) | 89 (37.7%) |
| 65 to 74 Years | 0 (0.0%) | 0 (0.0%) |
| 75 Years and over | 0 (0.0%) | 0 (0.0%) |
| Total | 573 (42.6%) | 847 (53.7%) |
Income Above Poverty by Sex and Age in Citrus City
According to the poverty statistics in Citrus City, males aged 25 to 34 years and females aged 65 to 74 years are the age groups that are most secure financially, with 100.0% of males and 100.0% of females in these age groups living above the poverty line.
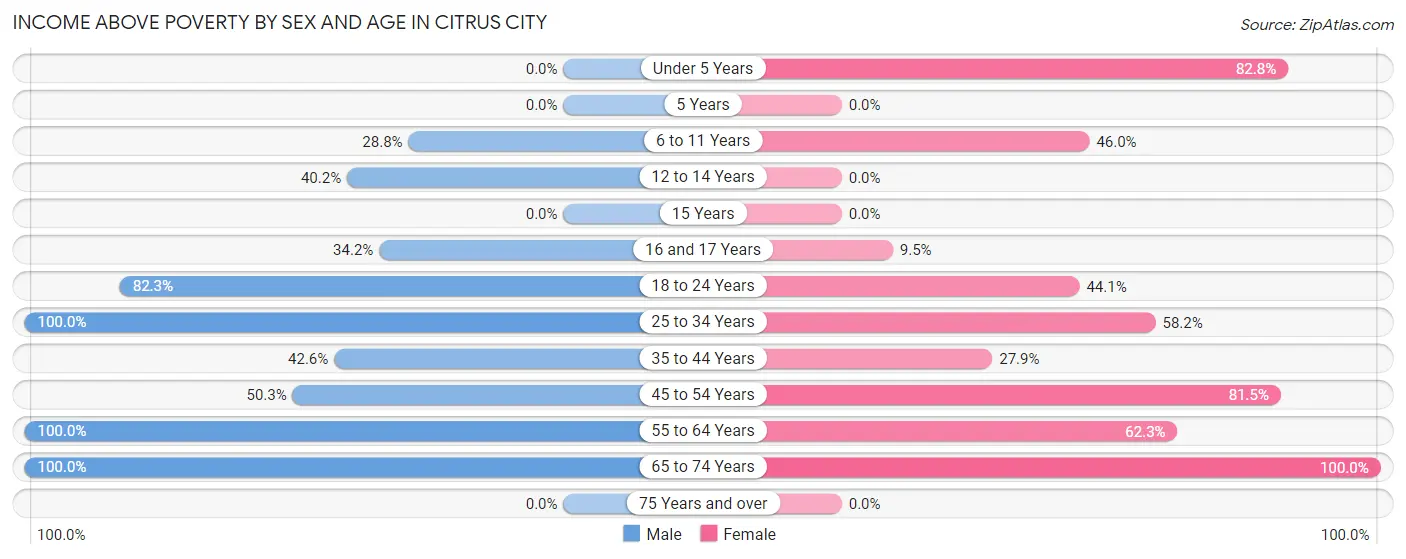
| Age Bracket | Male | Female |
| Under 5 Years | 0 (0.0%) | 53 (82.8%) |
| 5 Years | 0 (0.0%) | 0 (0.0%) |
| 6 to 11 Years | 44 (28.8%) | 137 (46.0%) |
| 12 to 14 Years | 51 (40.2%) | 0 (0.0%) |
| 15 Years | 0 (0.0%) | 0 (0.0%) |
| 16 and 17 Years | 40 (34.2%) | 11 (9.5%) |
| 18 to 24 Years | 261 (82.3%) | 60 (44.1%) |
| 25 to 34 Years | 82 (100.0%) | 145 (58.2%) |
| 35 to 44 Years | 100 (42.5%) | 50 (27.9%) |
| 45 to 54 Years | 95 (50.3%) | 88 (81.5%) |
| 55 to 64 Years | 57 (100.0%) | 147 (62.3%) |
| 65 to 74 Years | 41 (100.0%) | 38 (100.0%) |
| 75 Years and over | 0 (0.0%) | 0 (0.0%) |
| Total | 771 (57.4%) | 729 (46.3%) |
Income Below Poverty Among Married-Couple Families in Citrus City
The poverty statistics for married-couple families in Citrus City show that 55.2% or 213 of the total 386 families live below the poverty line. Families with 3 or 4 children have the highest poverty rate of 100.0%, comprising of 73 families. On the other hand, families with no children have the lowest poverty rate of 15.6%, which includes 12 families.
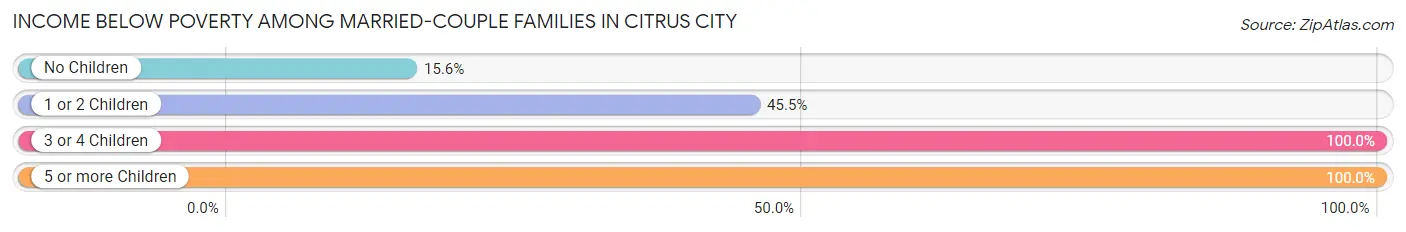
| Children | Above Poverty | Below Poverty |
| No Children | 65 (84.4%) | 12 (15.6%) |
| 1 or 2 Children | 108 (54.5%) | 90 (45.5%) |
| 3 or 4 Children | 0 (0.0%) | 73 (100.0%) |
| 5 or more Children | 0 (0.0%) | 38 (100.0%) |
| Total | 173 (44.8%) | 213 (55.2%) |
Income Below Poverty Among Single-Parent Households in Citrus City
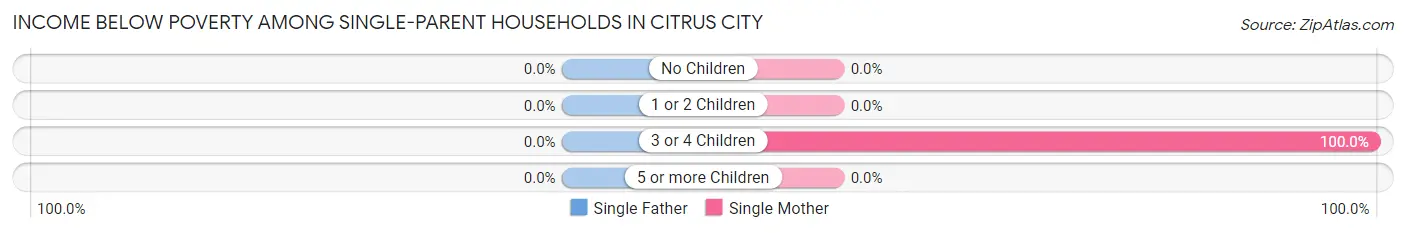
| Children | Single Father | Single Mother |
| No Children | 0 (0.0%) | 0 (0.0%) |
| 1 or 2 Children | 0 (0.0%) | 0 (0.0%) |
| 3 or 4 Children | 0 (0.0%) | 22 (100.0%) |
| 5 or more Children | 0 (0.0%) | 0 (0.0%) |
| Total | 0 (0.0%) | 22 (15.0%) |
Income Below Poverty Among Married-Couple vs Single-Parent Households in Citrus City
The poverty data for Citrus City shows that 213 of the married-couple family households (55.2%) and 22 of the single-parent households (12.4%) are living below the poverty level. Within the married-couple family households, those with 3 or 4 children have the highest poverty rate, with 73 households (100.0%) falling below the poverty line. Among the single-parent households, those with 3 or 4 children have the highest poverty rate, with 22 household (100.0%) living below poverty.
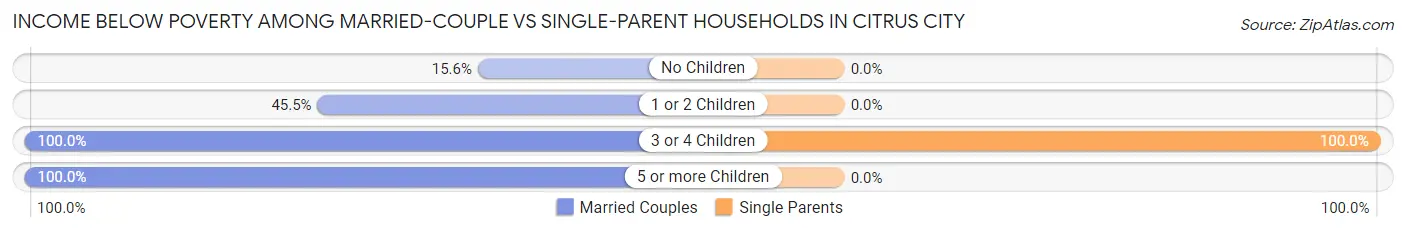
| Children | Married-Couple Families | Single-Parent Households |
| No Children | 12 (15.6%) | 0 (0.0%) |
| 1 or 2 Children | 90 (45.5%) | 0 (0.0%) |
| 3 or 4 Children | 73 (100.0%) | 22 (100.0%) |
| 5 or more Children | 38 (100.0%) | 0 (0.0%) |
| Total | 213 (55.2%) | 22 (12.4%) |
Race in Citrus City
The most populous races in Citrus City are Hispanic or Latino (2,848 | 97.5%), White / Caucasian (1,481 | 50.7%), and Two or more Races (1,335 | 45.7%).
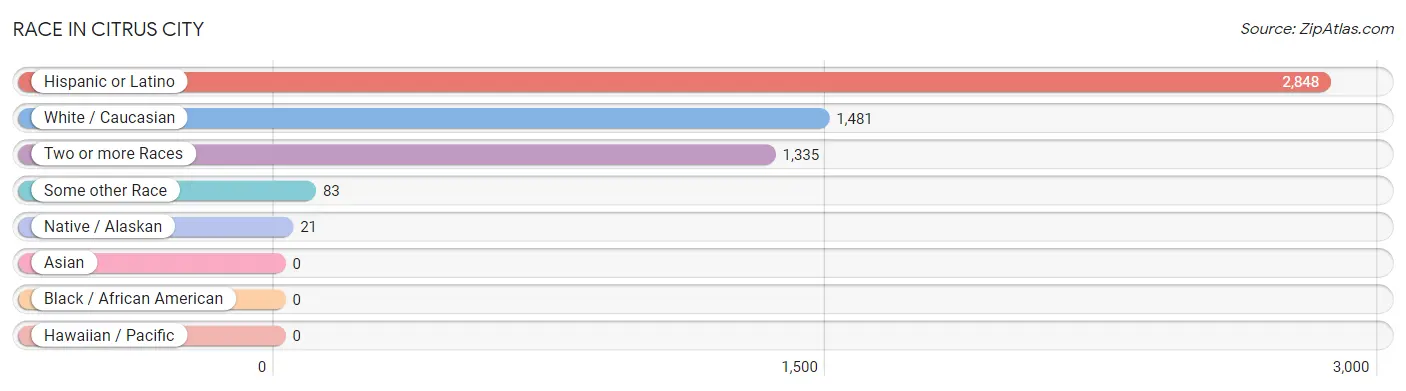
| Race | # Population | % Population |
| Asian | 0 | 0.0% |
| Black / African American | 0 | 0.0% |
| Hawaiian / Pacific | 0 | 0.0% |
| Hispanic or Latino | 2,848 | 97.5% |
| Native / Alaskan | 21 | 0.7% |
| White / Caucasian | 1,481 | 50.7% |
| Two or more Races | 1,335 | 45.7% |
| Some other Race | 83 | 2.8% |
| Total | 2,920 | 100.0% |
Ancestry in Citrus City
The most populous ancestries reported in Citrus City are Mexican (2,814 | 96.4%), and Mexican American Indian (21 | 0.7%), together accounting for 97.1% of all Citrus City residents.
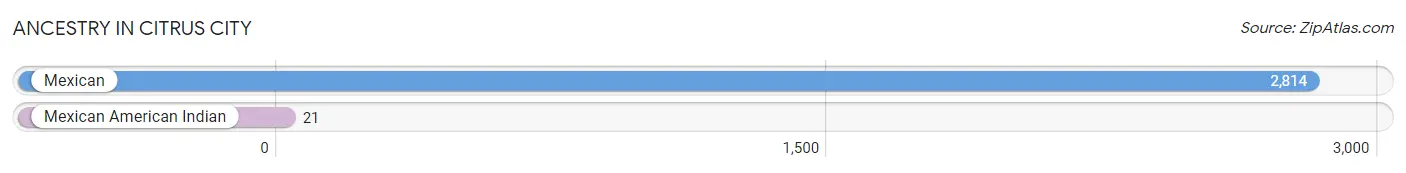
| Ancestry | # Population | % Population |
| Mexican | 2,814 | 96.4% |
| Mexican American Indian | 21 | 0.7% | View All 2 Rows |
Immigrants in Citrus City
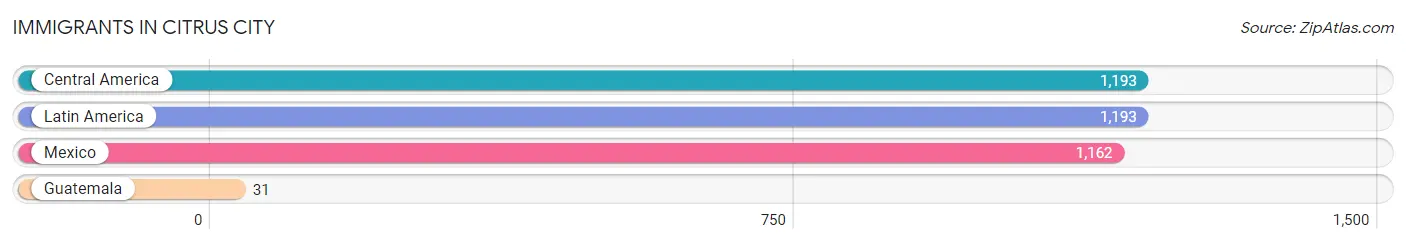
The most numerous immigrant groups reported in Citrus City came from Central America (1,193 | 40.9%), Latin America (1,193 | 40.9%), Mexico (1,162 | 39.8%), and Guatemala (31 | 1.1%), together accounting for 122.6% of all Citrus City residents.
| Immigration Origin | # Population | % Population |
| Central America | 1,193 | 40.9% |
| Guatemala | 31 | 1.1% |
| Latin America | 1,193 | 40.9% |
| Mexico | 1,162 | 39.8% | View All 4 Rows |
Sex and Age in Citrus City
Sex and Age in Citrus City
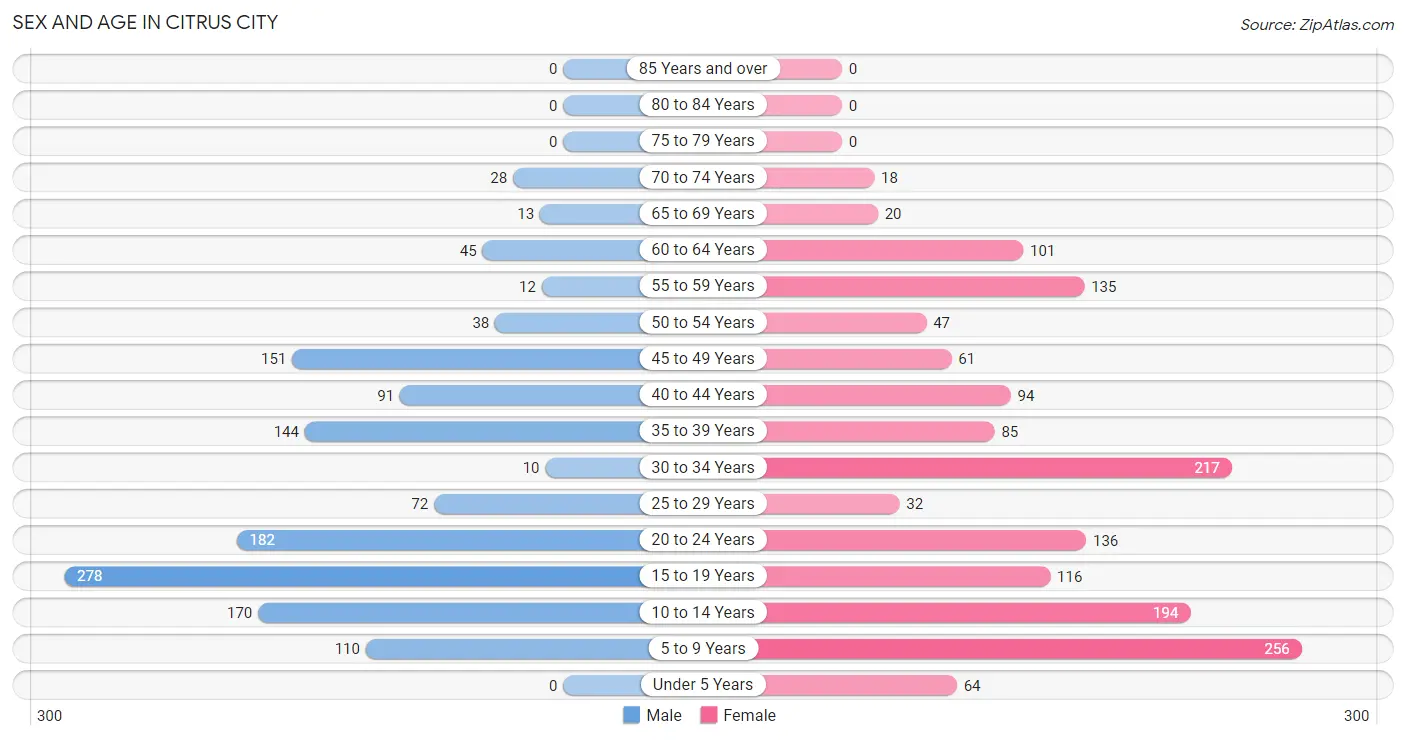
The most populous age groups in Citrus City are 15 to 19 Years (278 | 20.7%) for men and 5 to 9 Years (256 | 16.2%) for women.
| Age Bracket | Male | Female |
| Under 5 Years | 0 (0.0%) | 64 (4.1%) |
| 5 to 9 Years | 110 (8.2%) | 256 (16.2%) |
| 10 to 14 Years | 170 (12.7%) | 194 (12.3%) |
| 15 to 19 Years | 278 (20.7%) | 116 (7.4%) |
| 20 to 24 Years | 182 (13.5%) | 136 (8.6%) |
| 25 to 29 Years | 72 (5.4%) | 32 (2.0%) |
| 30 to 34 Years | 10 (0.7%) | 217 (13.8%) |
| 35 to 39 Years | 144 (10.7%) | 85 (5.4%) |
| 40 to 44 Years | 91 (6.8%) | 94 (6.0%) |
| 45 to 49 Years | 151 (11.2%) | 61 (3.9%) |
| 50 to 54 Years | 38 (2.8%) | 47 (3.0%) |
| 55 to 59 Years | 12 (0.9%) | 135 (8.6%) |
| 60 to 64 Years | 45 (3.4%) | 101 (6.4%) |
| 65 to 69 Years | 13 (1.0%) | 20 (1.3%) |
| 70 to 74 Years | 28 (2.1%) | 18 (1.1%) |
| 75 to 79 Years | 0 (0.0%) | 0 (0.0%) |
| 80 to 84 Years | 0 (0.0%) | 0 (0.0%) |
| 85 Years and over | 0 (0.0%) | 0 (0.0%) |
| Total | 1,344 (100.0%) | 1,576 (100.0%) |
Families and Households in Citrus City
Median Family Size in Citrus City
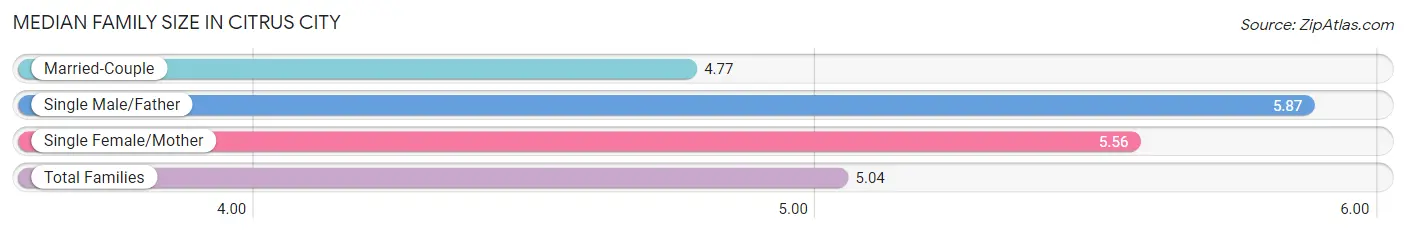
The median family size in Citrus City is 5.04 persons per family, with single male/father families (30 | 5.3%) accounting for the largest median family size of 5.87 persons per family. On the other hand, married-couple families (386 | 68.6%) represent the smallest median family size with 4.77 persons per family.
| Family Type | # Families | Family Size |
| Married-Couple | 386 (68.6%) | 4.77 |
| Single Male/Father | 30 (5.3%) | 5.87 |
| Single Female/Mother | 147 (26.1%) | 5.56 |
| Total Families | 563 (100.0%) | 5.04 |
Median Household Size in Citrus City
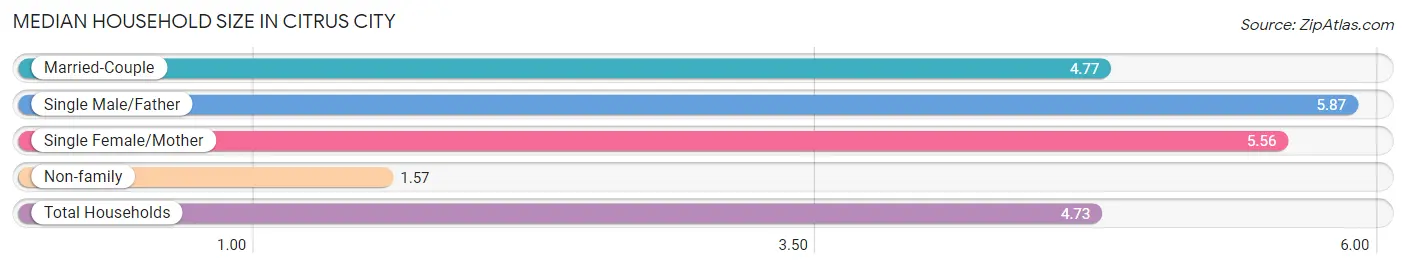
The median household size in Citrus City is 4.73 persons per household, with single male/father households (30 | 4.9%) accounting for the largest median household size of 5.87 persons per household. non-family households (54 | 8.7%) represent the smallest median household size with 1.57 persons per household.
| Household Type | # Households | Household Size |
| Married-Couple | 386 (62.6%) | 4.77 |
| Single Male/Father | 30 (4.9%) | 5.87 |
| Single Female/Mother | 147 (23.8%) | 5.56 |
| Non-family | 54 (8.7%) | 1.57 |
| Total Households | 617 (100.0%) | 4.73 |
Household Size by Marriage Status in Citrus City
Out of a total of 617 households in Citrus City, 563 (91.2%) are family households, while 54 (8.7%) are nonfamily households. The most numerous type of family households are 6-person households, comprising 176, and the most common type of nonfamily households are 2-person households, comprising 29.
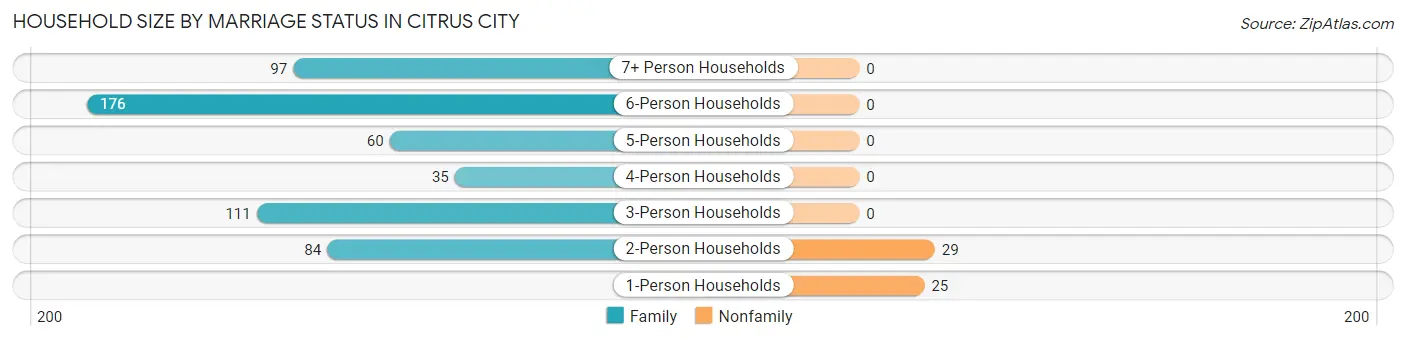
| Household Size | Family Households | Nonfamily Households |
| 1-Person Households | - | 25 (4.1%) |
| 2-Person Households | 84 (13.6%) | 29 (4.7%) |
| 3-Person Households | 111 (18.0%) | 0 (0.0%) |
| 4-Person Households | 35 (5.7%) | 0 (0.0%) |
| 5-Person Households | 60 (9.7%) | 0 (0.0%) |
| 6-Person Households | 176 (28.5%) | 0 (0.0%) |
| 7+ Person Households | 97 (15.7%) | 0 (0.0%) |
| Total | 563 (91.2%) | 54 (8.7%) |
Female Fertility in Citrus City
Fertility by Age in Citrus City
Average fertility rate in Citrus City is 50.0 births per 1,000 women. Women in the age bracket of 20 to 34 years have the highest fertility rate with 101.0 births per 1,000 women. Women in the age bracket of 20 to 34 years acount for 100.0% of all women with births.
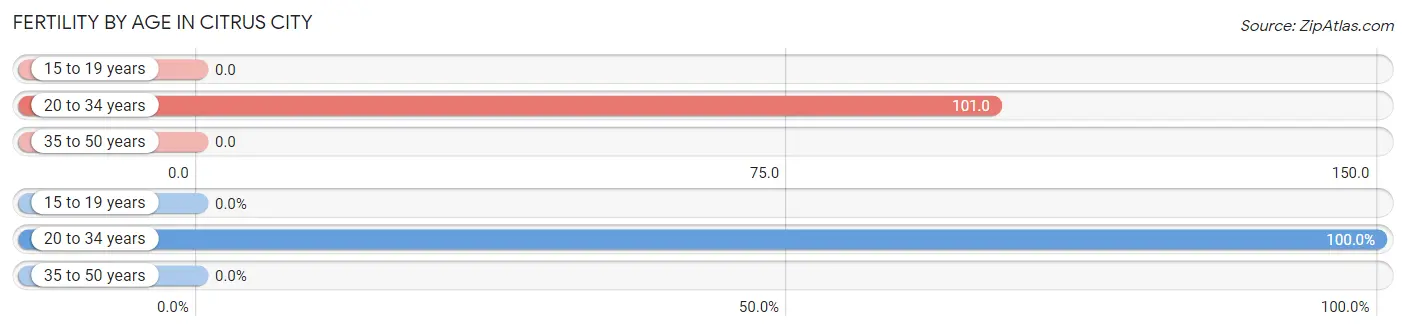
| Age Bracket | Women with Births | Births / 1,000 Women |
| 15 to 19 years | 0 (0.0%) | 0.0 |
| 20 to 34 years | 39 (100.0%) | 101.0 |
| 35 to 50 years | 0 (0.0%) | 0.0 |
| Total | 39 (100.0%) | 50.0 |
Fertility by Age by Marriage Status in Citrus City
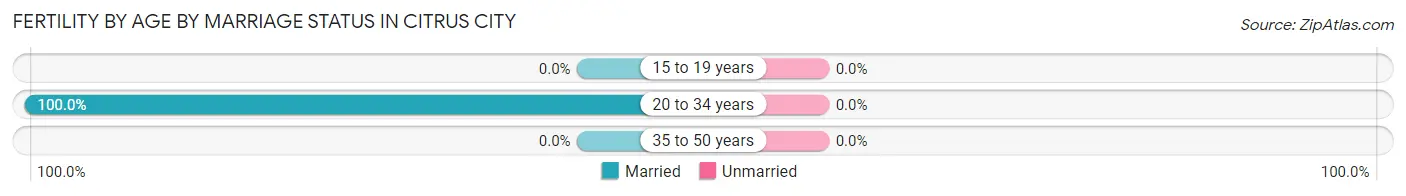
| Age Bracket | Married | Unmarried |
| 15 to 19 years | 0 (0.0%) | 0 (0.0%) |
| 20 to 34 years | 39 (100.0%) | 0 (0.0%) |
| 35 to 50 years | 0 (0.0%) | 0 (0.0%) |
| Total | 39 (100.0%) | 0 (0.0%) |
Fertility by Education in Citrus City
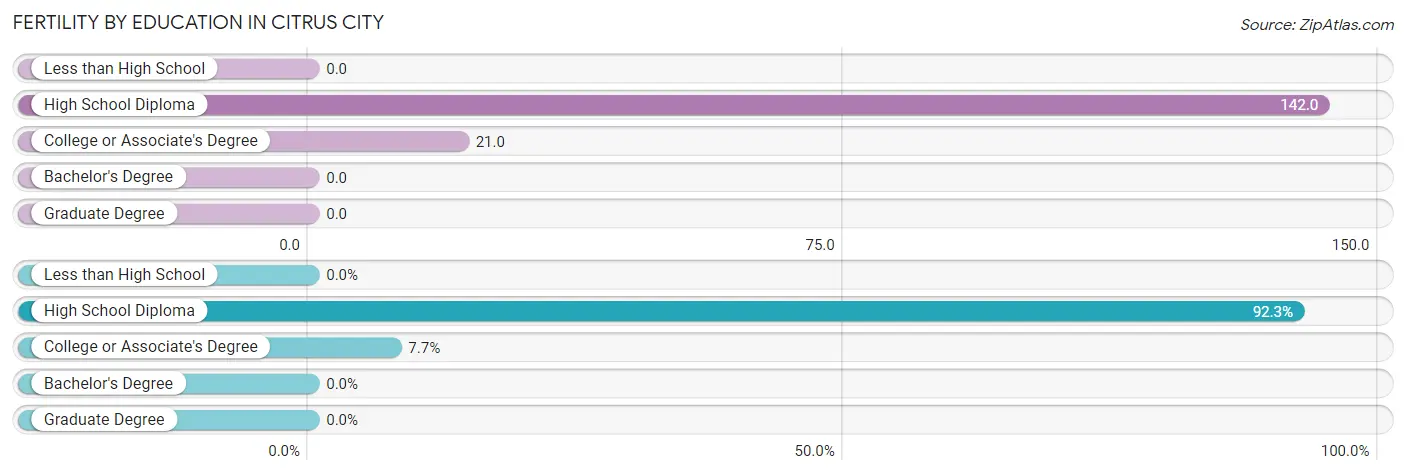
| Educational Attainment | Women with Births | Births / 1,000 Women |
| Less than High School | 0 (0.0%) | 0.0 |
| High School Diploma | 36 (92.3%) | 142.0 |
| College or Associate's Degree | 3 (7.7%) | 21.0 |
| Bachelor's Degree | 0 (0.0%) | 0.0 |
| Graduate Degree | 0 (0.0%) | 0.0 |
| Total | 39 (100.0%) | 50.0 |
Fertility by Education by Marriage Status in Citrus City
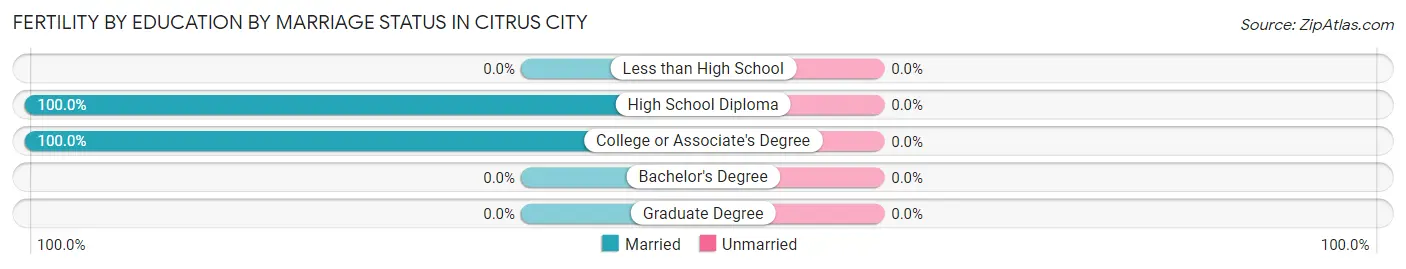
| Educational Attainment | Married | Unmarried |
| Less than High School | 0 (0.0%) | 0 (0.0%) |
| High School Diploma | 36 (100.0%) | 0 (0.0%) |
| College or Associate's Degree | 3 (100.0%) | 0 (0.0%) |
| Bachelor's Degree | 0 (0.0%) | 0 (0.0%) |
| Graduate Degree | 0 (0.0%) | 0 (0.0%) |
| Total | 39 (100.0%) | 0 (0.0%) |
Employment Characteristics in Citrus City
Employment by Class of Employer in Citrus City
Among the 901 employed individuals in Citrus City, private company employees (555 | 61.6%), self-employed (not incorporated) (290 | 32.2%), and local government employees (53 | 5.9%) make up the most common classes of employment.
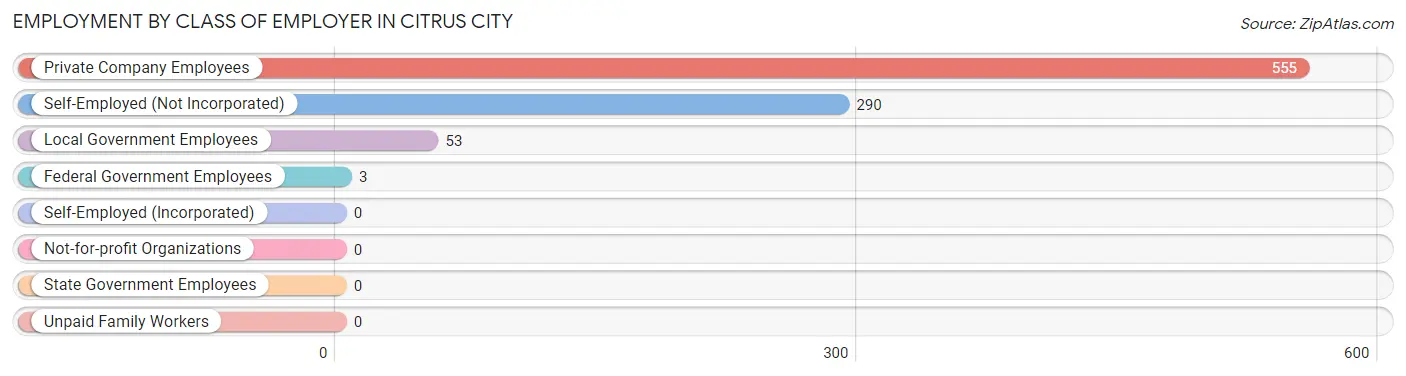
| Employer Class | # Employees | % Employees |
| Private Company Employees | 555 | 61.6% |
| Self-Employed (Incorporated) | 0 | 0.0% |
| Self-Employed (Not Incorporated) | 290 | 32.2% |
| Not-for-profit Organizations | 0 | 0.0% |
| Local Government Employees | 53 | 5.9% |
| State Government Employees | 0 | 0.0% |
| Federal Government Employees | 3 | 0.3% |
| Unpaid Family Workers | 0 | 0.0% |
| Total | 901 | 100.0% |
Employment Status by Age in Citrus City
According to the labor force statistics for Citrus City, out of the total population over 16 years of age (2,100), 59.8% or 1,256 individuals are in the labor force, with 28.2% or 354 of them unemployed. The age group with the highest labor force participation rate is 20 to 24 years, with 100.0% or 318 individuals in the labor force. Within the labor force, the 30 to 34 years age range has the highest percentage of unemployed individuals, with 83.3% or 100 of them being unemployed.
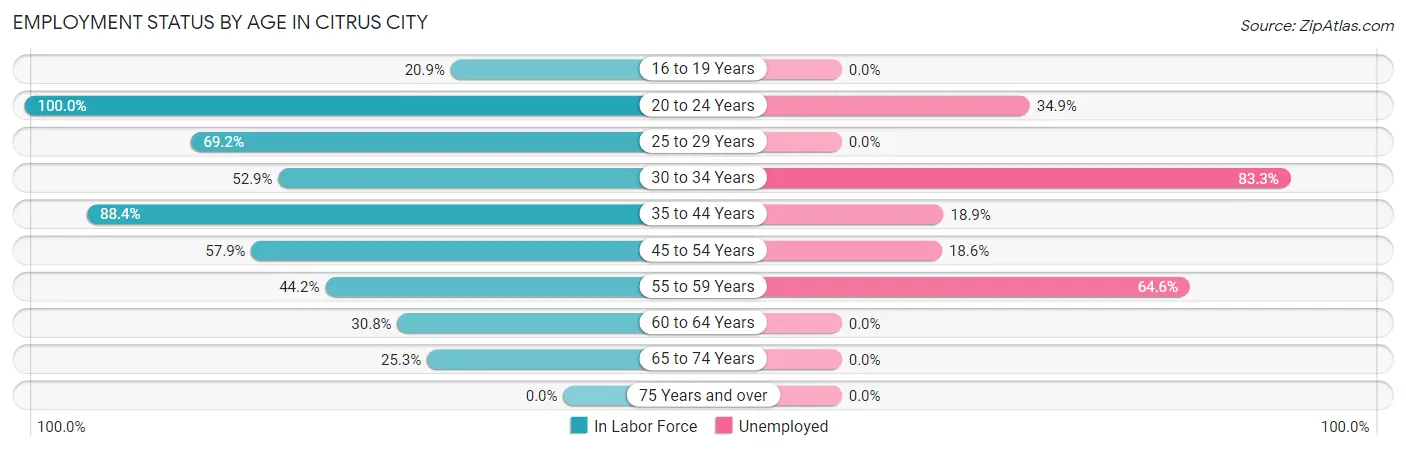
| Age Bracket | In Labor Force | Unemployed |
| 16 to 19 Years | 77 (20.9%) | 0 (0.0%) |
| 20 to 24 Years | 318 (100.0%) | 111 (34.9%) |
| 25 to 29 Years | 72 (69.2%) | 0 (0.0%) |
| 30 to 34 Years | 120 (52.9%) | 100 (83.3%) |
| 35 to 44 Years | 366 (88.4%) | 69 (18.9%) |
| 45 to 54 Years | 172 (57.9%) | 32 (18.6%) |
| 55 to 59 Years | 65 (44.2%) | 42 (64.6%) |
| 60 to 64 Years | 45 (30.8%) | 0 (0.0%) |
| 65 to 74 Years | 20 (25.3%) | 0 (0.0%) |
| 75 Years and over | 0 (0.0%) | 0 (0.0%) |
| Total | 1,256 (59.8%) | 354 (28.2%) |
Employment Status by Educational Attainment in Citrus City
According to labor force statistics for Citrus City, 62.9% of individuals (840) out of the total population between 25 and 64 years of age (1,335) are in the labor force, with 28.9% or 243 of them being unemployed. The group with the highest labor force participation rate are those with the educational attainment of college / associate degree, with 87.8% or 166 individuals in the labor force. Within the labor force, individuals with high school diploma education have the highest percentage of unemployment, with 41.4% or 132 of them being unemployed.
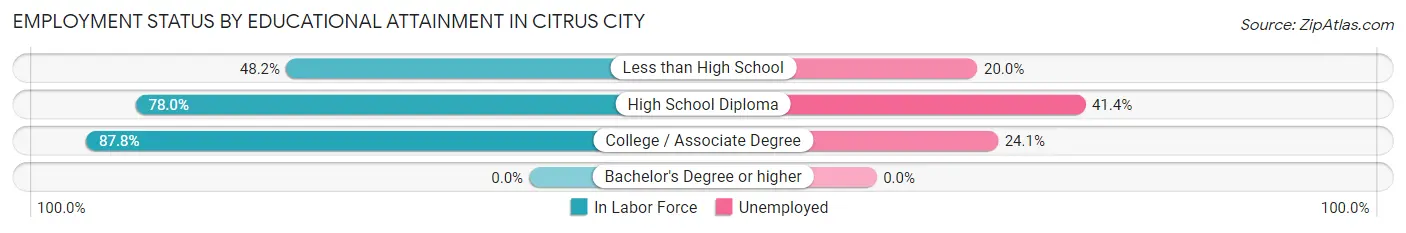
| Educational Attainment | In Labor Force | Unemployed |
| Less than High School | 355 (48.2%) | 147 (20.0%) |
| High School Diploma | 319 (78.0%) | 169 (41.4%) |
| College / Associate Degree | 166 (87.8%) | 46 (24.1%) |
| Bachelor's Degree or higher | 0 (0.0%) | 0 (0.0%) |
| Total | 840 (62.9%) | 386 (28.9%) |
Employment Occupations by Sex in Citrus City
Management, Business, Science and Arts Occupations
The most common Management, Business, Science and Arts occupations in Citrus City are Management (38 | 4.2%), Community & Social Service (20 | 2.2%), and Education Instruction & Library (20 | 2.2%).
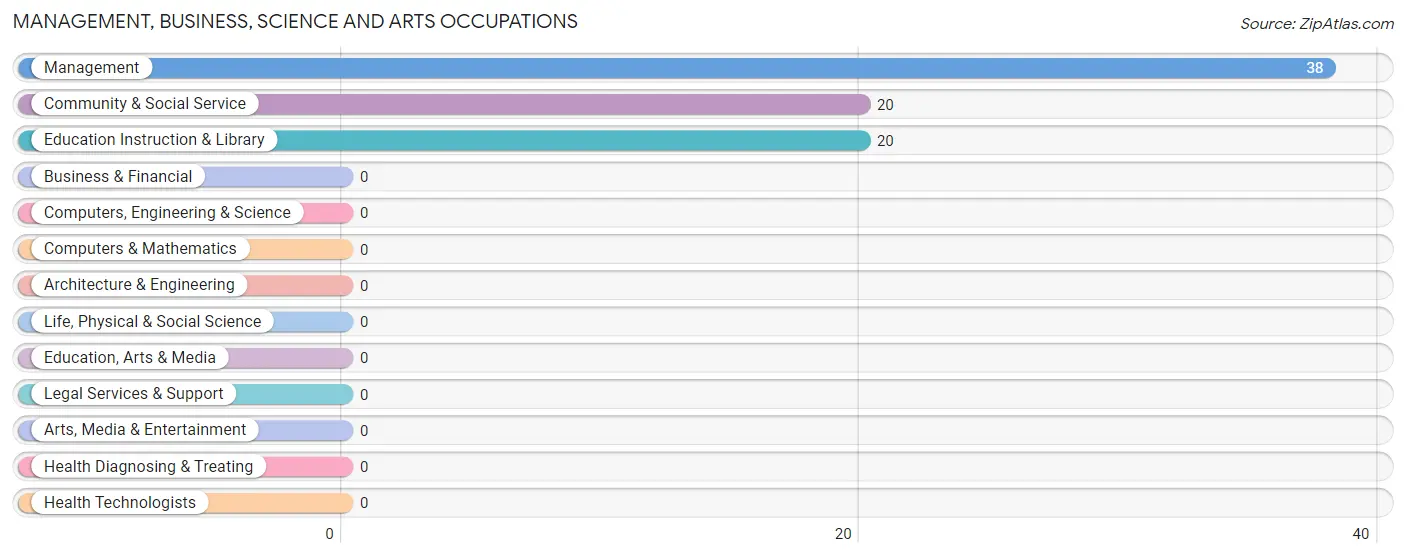
Management, Business, Science and Arts Occupations by Sex
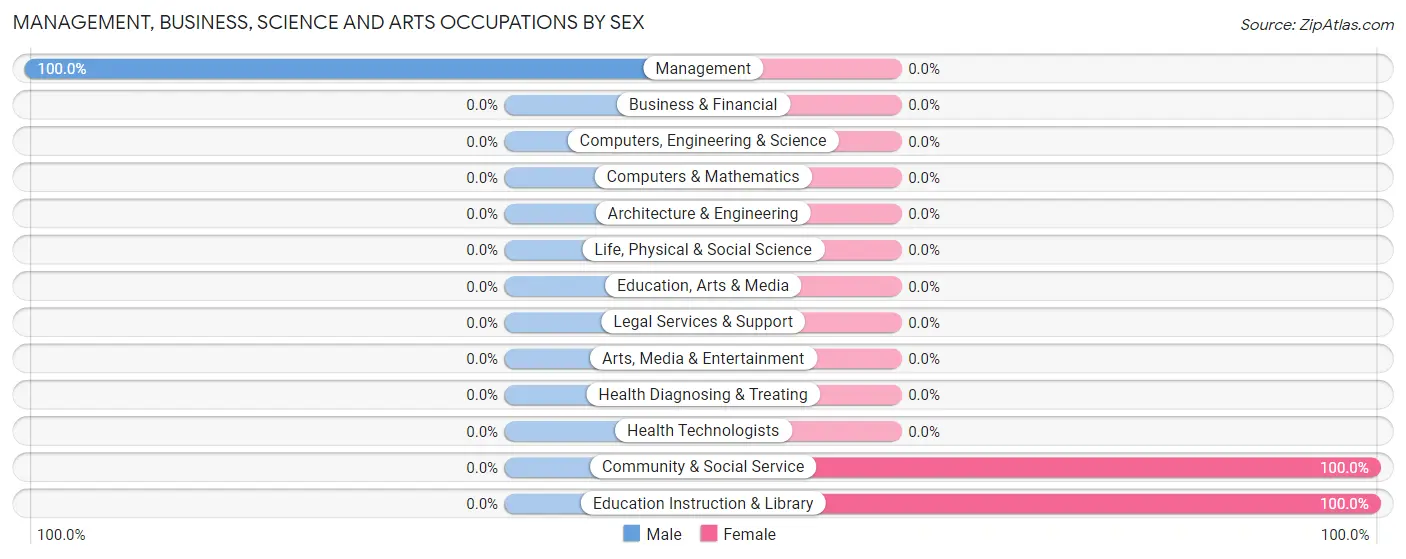
| Occupation | Male | Female |
| Management | 38 (100.0%) | 0 (0.0%) |
| Business & Financial | 0 (0.0%) | 0 (0.0%) |
| Computers, Engineering & Science | 0 (0.0%) | 0 (0.0%) |
| Computers & Mathematics | 0 (0.0%) | 0 (0.0%) |
| Architecture & Engineering | 0 (0.0%) | 0 (0.0%) |
| Life, Physical & Social Science | 0 (0.0%) | 0 (0.0%) |
| Community & Social Service | 0 (0.0%) | 20 (100.0%) |
| Education, Arts & Media | 0 (0.0%) | 0 (0.0%) |
| Legal Services & Support | 0 (0.0%) | 0 (0.0%) |
| Education Instruction & Library | 0 (0.0%) | 20 (100.0%) |
| Arts, Media & Entertainment | 0 (0.0%) | 0 (0.0%) |
| Health Diagnosing & Treating | 0 (0.0%) | 0 (0.0%) |
| Health Technologists | 0 (0.0%) | 0 (0.0%) |
| Total (Category) | 38 (65.5%) | 20 (34.5%) |
| Total (Overall) | 727 (80.7%) | 174 (19.3%) |
Services Occupations
The most common Services occupations in Citrus City are Healthcare Support (138 | 15.3%), and Cleaning & Maintenance (78 | 8.7%).
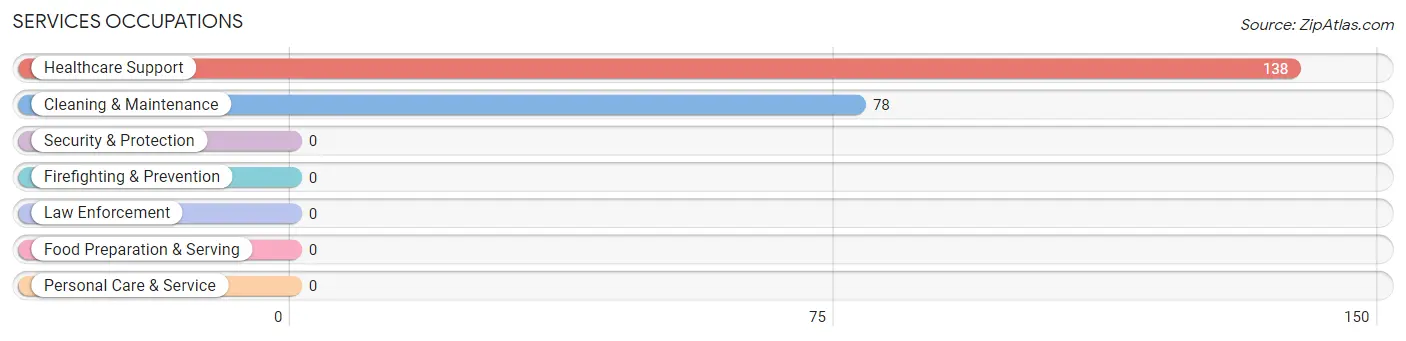
Services Occupations by Sex
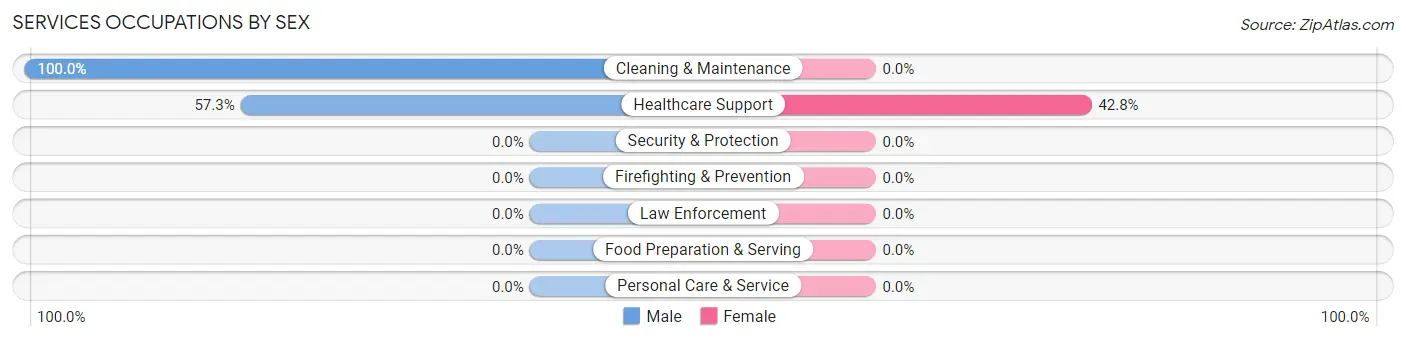
| Occupation | Male | Female |
| Healthcare Support | 79 (57.3%) | 59 (42.7%) |
| Security & Protection | 0 (0.0%) | 0 (0.0%) |
| Firefighting & Prevention | 0 (0.0%) | 0 (0.0%) |
| Law Enforcement | 0 (0.0%) | 0 (0.0%) |
| Food Preparation & Serving | 0 (0.0%) | 0 (0.0%) |
| Cleaning & Maintenance | 78 (100.0%) | 0 (0.0%) |
| Personal Care & Service | 0 (0.0%) | 0 (0.0%) |
| Total (Category) | 157 (72.7%) | 59 (27.3%) |
| Total (Overall) | 727 (80.7%) | 174 (19.3%) |
Sales and Office Occupations
The most common Sales and Office occupations in Citrus City are Sales & Related (113 | 12.5%), and Office & Administration (59 | 6.6%).
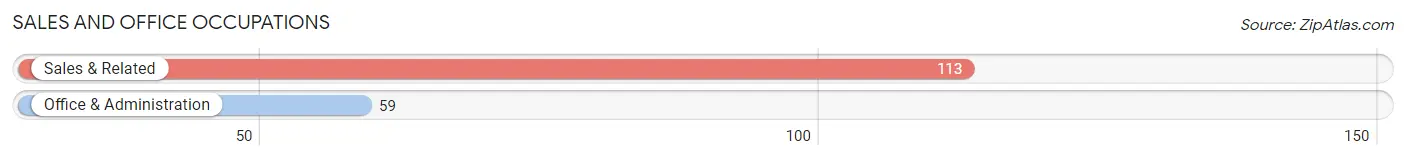
Sales and Office Occupations by Sex
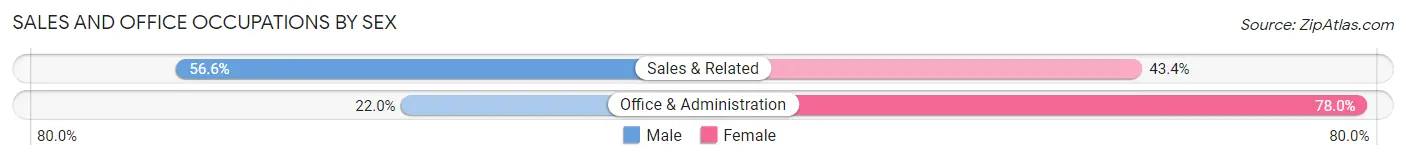
| Occupation | Male | Female |
| Sales & Related | 64 (56.6%) | 49 (43.4%) |
| Office & Administration | 13 (22.0%) | 46 (78.0%) |
| Total (Category) | 77 (44.8%) | 95 (55.2%) |
| Total (Overall) | 727 (80.7%) | 174 (19.3%) |
Natural Resources, Construction and Maintenance Occupations
The most common Natural Resources, Construction and Maintenance occupations in Citrus City are Construction & Extraction (293 | 32.5%), and Farming, Fishing & Forestry (12 | 1.3%).
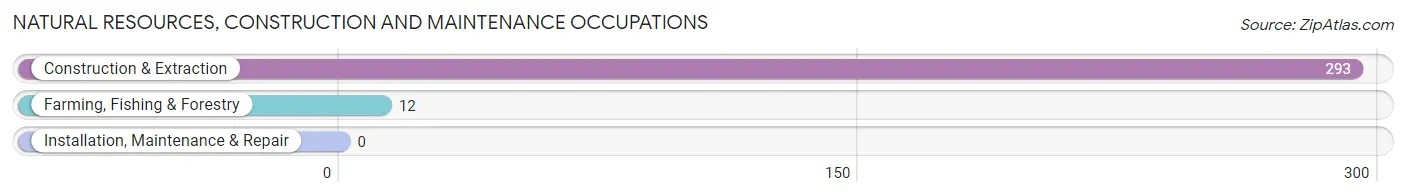
Natural Resources, Construction and Maintenance Occupations by Sex
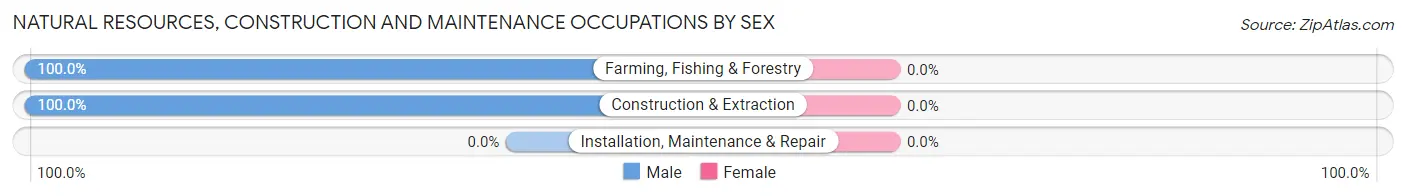
| Occupation | Male | Female |
| Farming, Fishing & Forestry | 12 (100.0%) | 0 (0.0%) |
| Construction & Extraction | 293 (100.0%) | 0 (0.0%) |
| Installation, Maintenance & Repair | 0 (0.0%) | 0 (0.0%) |
| Total (Category) | 305 (100.0%) | 0 (0.0%) |
| Total (Overall) | 727 (80.7%) | 174 (19.3%) |
Production, Transportation and Moving Occupations
The most common Production, Transportation and Moving occupations in Citrus City are Production (94 | 10.4%), Transportation (46 | 5.1%), and Material Moving (10 | 1.1%).
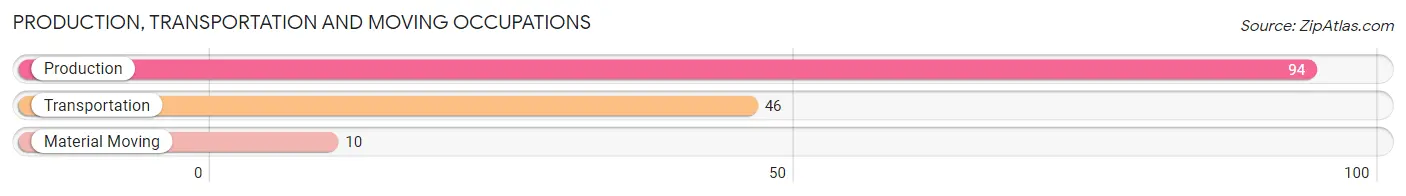
Production, Transportation and Moving Occupations by Sex
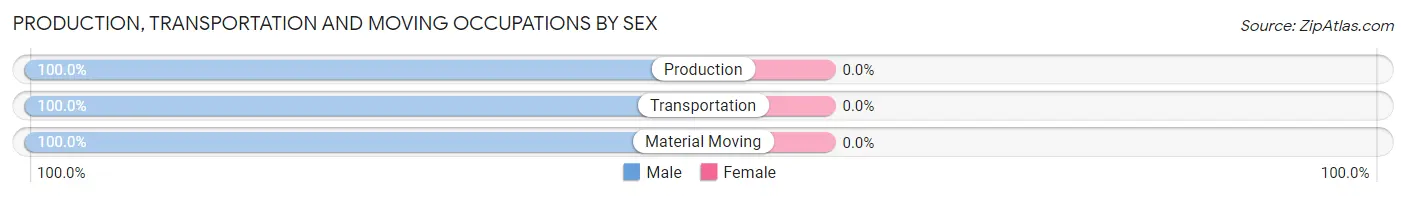
| Occupation | Male | Female |
| Production | 94 (100.0%) | 0 (0.0%) |
| Transportation | 46 (100.0%) | 0 (0.0%) |
| Material Moving | 10 (100.0%) | 0 (0.0%) |
| Total (Category) | 150 (100.0%) | 0 (0.0%) |
| Total (Overall) | 727 (80.7%) | 174 (19.3%) |
Employment Industries by Sex in Citrus City
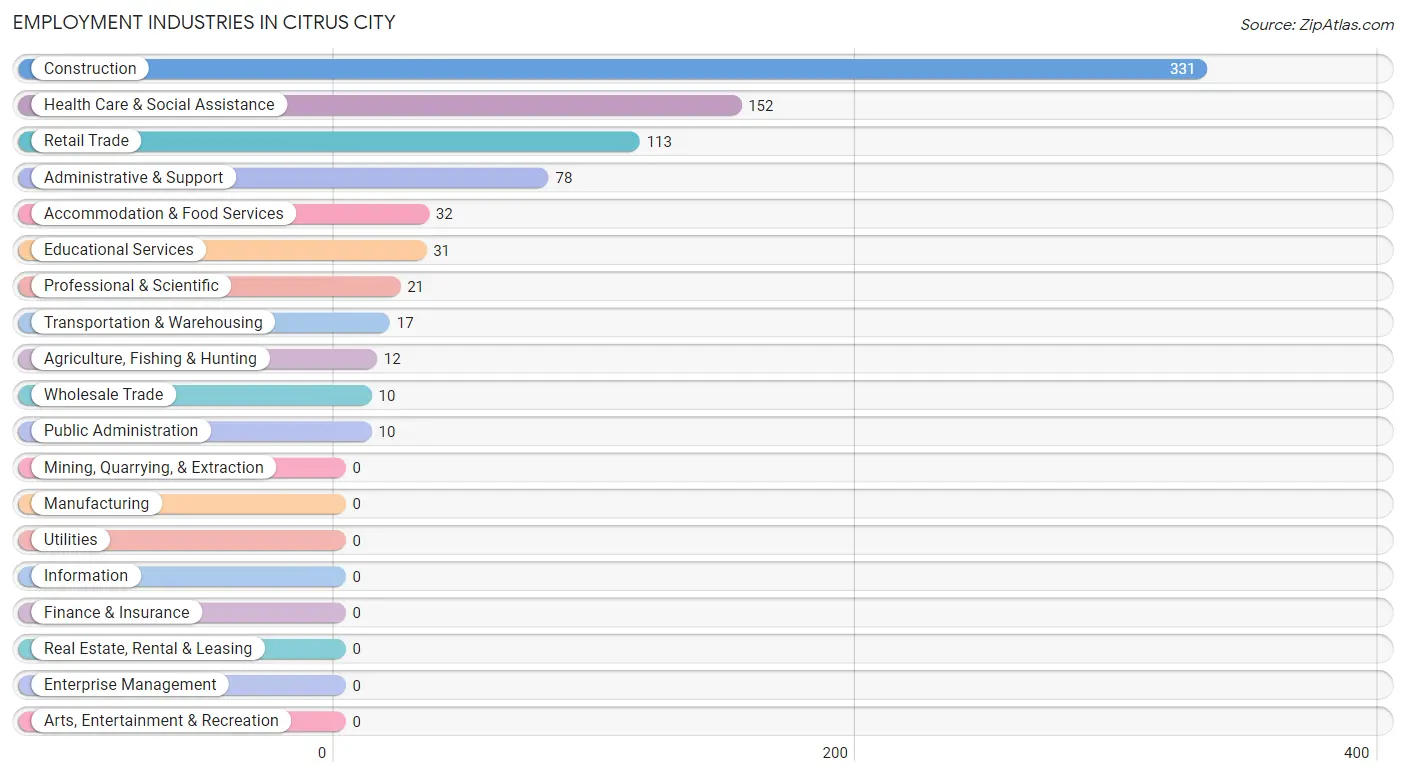
Employment Industries in Citrus City
The major employment industries in Citrus City include Construction (331 | 36.7%), Health Care & Social Assistance (152 | 16.9%), Retail Trade (113 | 12.5%), Administrative & Support (78 | 8.7%), and Accommodation & Food Services (32 | 3.5%).
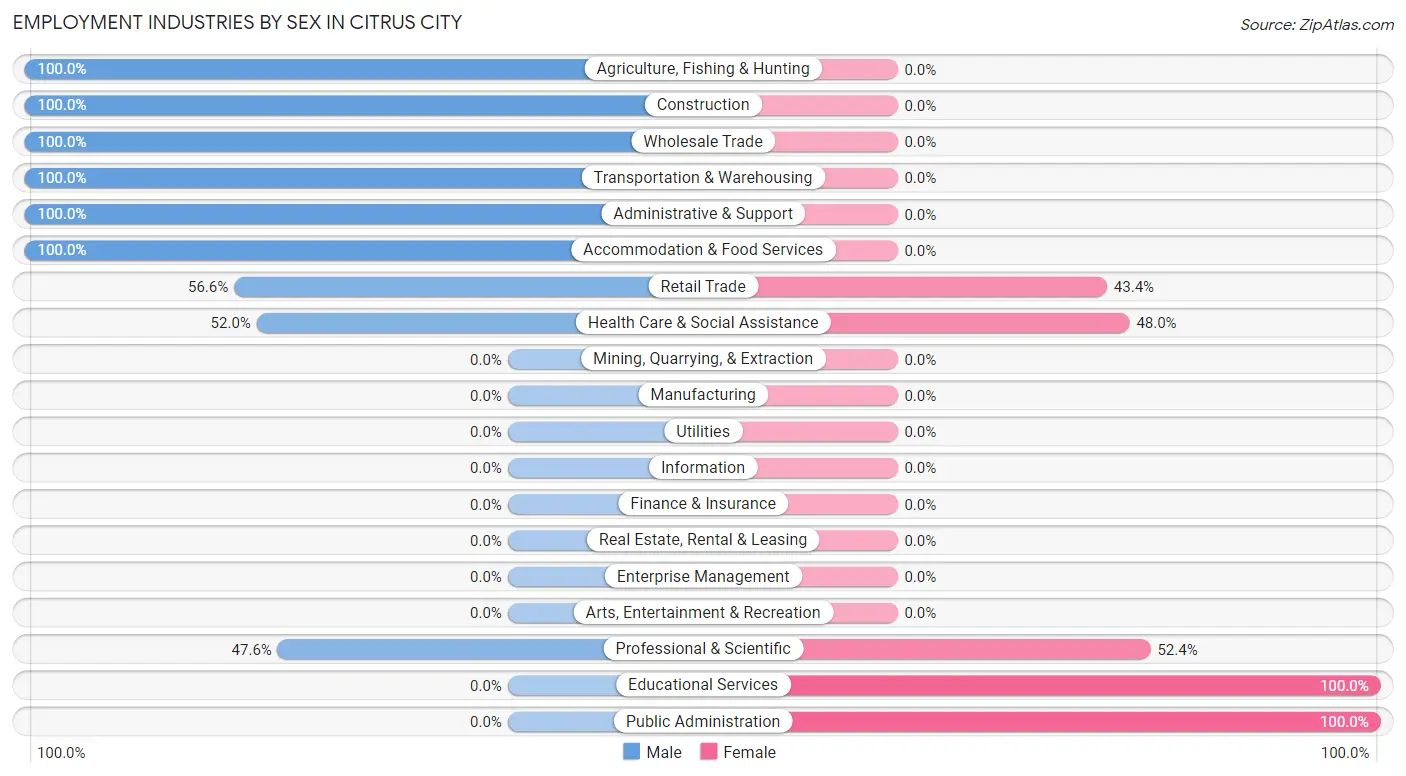
Employment Industries by Sex in Citrus City
The Citrus City industries that see more men than women are Agriculture, Fishing & Hunting (100.0%), Construction (100.0%), and Wholesale Trade (100.0%), whereas the industries that tend to have a higher number of women are Educational Services (100.0%), Public Administration (100.0%), and Professional & Scientific (52.4%).
| Industry | Male | Female |
| Agriculture, Fishing & Hunting | 12 (100.0%) | 0 (0.0%) |
| Mining, Quarrying, & Extraction | 0 (0.0%) | 0 (0.0%) |
| Construction | 331 (100.0%) | 0 (0.0%) |
| Manufacturing | 0 (0.0%) | 0 (0.0%) |
| Wholesale Trade | 10 (100.0%) | 0 (0.0%) |
| Retail Trade | 64 (56.6%) | 49 (43.4%) |
| Transportation & Warehousing | 17 (100.0%) | 0 (0.0%) |
| Utilities | 0 (0.0%) | 0 (0.0%) |
| Information | 0 (0.0%) | 0 (0.0%) |
| Finance & Insurance | 0 (0.0%) | 0 (0.0%) |
| Real Estate, Rental & Leasing | 0 (0.0%) | 0 (0.0%) |
| Professional & Scientific | 10 (47.6%) | 11 (52.4%) |
| Enterprise Management | 0 (0.0%) | 0 (0.0%) |
| Administrative & Support | 78 (100.0%) | 0 (0.0%) |
| Educational Services | 0 (0.0%) | 31 (100.0%) |
| Health Care & Social Assistance | 79 (52.0%) | 73 (48.0%) |
| Arts, Entertainment & Recreation | 0 (0.0%) | 0 (0.0%) |
| Accommodation & Food Services | 32 (100.0%) | 0 (0.0%) |
| Public Administration | 0 (0.0%) | 10 (100.0%) |
| Total | 727 (80.7%) | 174 (19.3%) |
Education in Citrus City
School Enrollment in Citrus City
The most common levels of schooling among the 965 students in Citrus City are middle school (311 | 32.2%), elementary school (264 | 27.4%), and high school (224 | 23.2%).
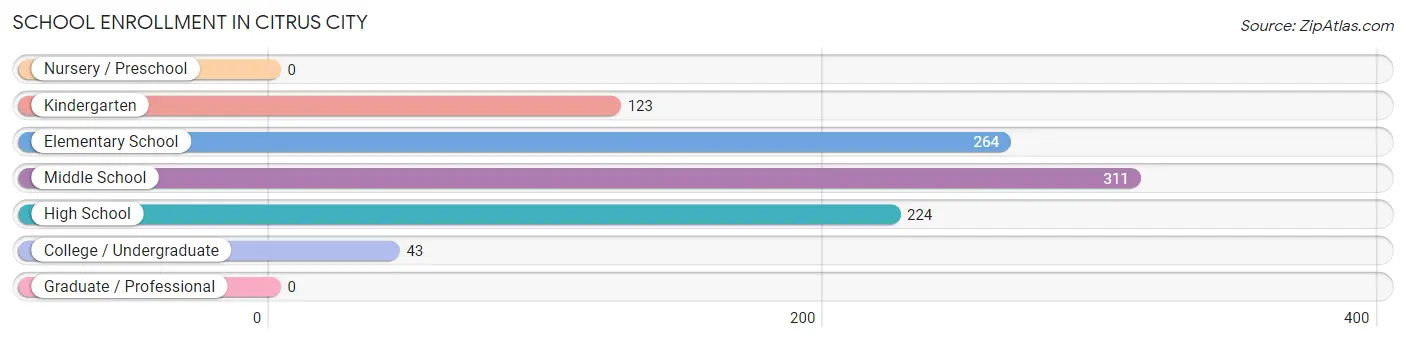
| School Level | # Students | % Students |
| Nursery / Preschool | 0 | 0.0% |
| Kindergarten | 123 | 12.8% |
| Elementary School | 264 | 27.4% |
| Middle School | 311 | 32.2% |
| High School | 224 | 23.2% |
| College / Undergraduate | 43 | 4.5% |
| Graduate / Professional | 0 | 0.0% |
| Total | 965 | 100.0% |
School Enrollment by Age by Funding Source in Citrus City
Out of a total of 965 students who are enrolled in schools in Citrus City, 32 (3.3%) attend a private institution, while the remaining 933 (96.7%) are enrolled in public schools. The age group of 20 to 24 year olds has the highest likelihood of being enrolled in private schools, with 21 (65.6% in the age bracket) enrolled. Conversely, the age group of 5 to 9 year old has the lowest likelihood of being enrolled in a private school, with 334 (100.0% in the age bracket) attending a public institution.
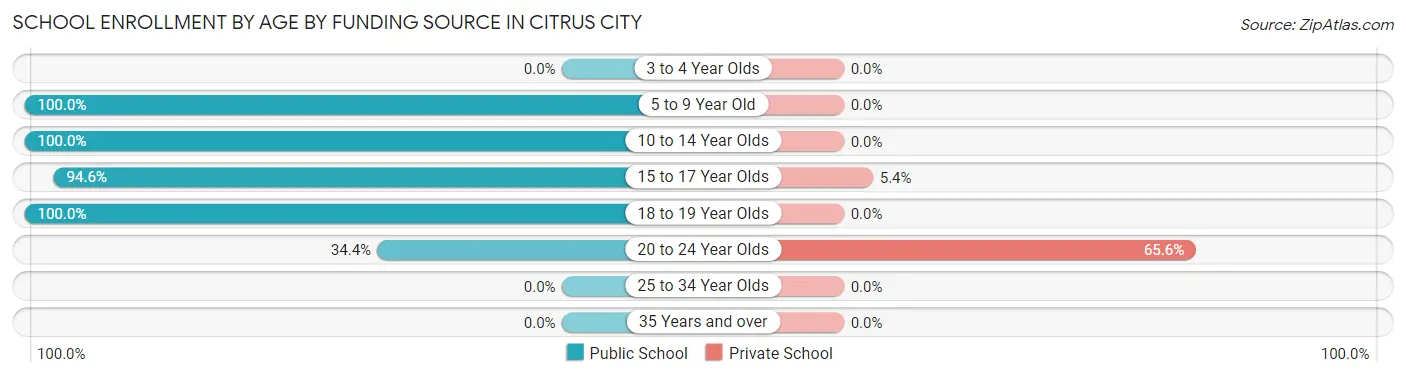
| Age Bracket | Public School | Private School |
| 3 to 4 Year Olds | 0 (0.0%) | 0 (0.0%) |
| 5 to 9 Year Old | 334 (100.0%) | 0 (0.0%) |
| 10 to 14 Year Olds | 364 (100.0%) | 0 (0.0%) |
| 15 to 17 Year Olds | 192 (94.6%) | 11 (5.4%) |
| 18 to 19 Year Olds | 32 (100.0%) | 0 (0.0%) |
| 20 to 24 Year Olds | 11 (34.4%) | 21 (65.6%) |
| 25 to 34 Year Olds | 0 (0.0%) | 0 (0.0%) |
| 35 Years and over | 0 (0.0%) | 0 (0.0%) |
| Total | 933 (96.7%) | 32 (3.3%) |
Educational Attainment by Field of Study in Citrus City
Physical & health sciences (28 | 58.3%), and education (20 | 41.7%) are the most common fields of study among 48 individuals in Citrus City who have obtained a bachelor's degree or higher.
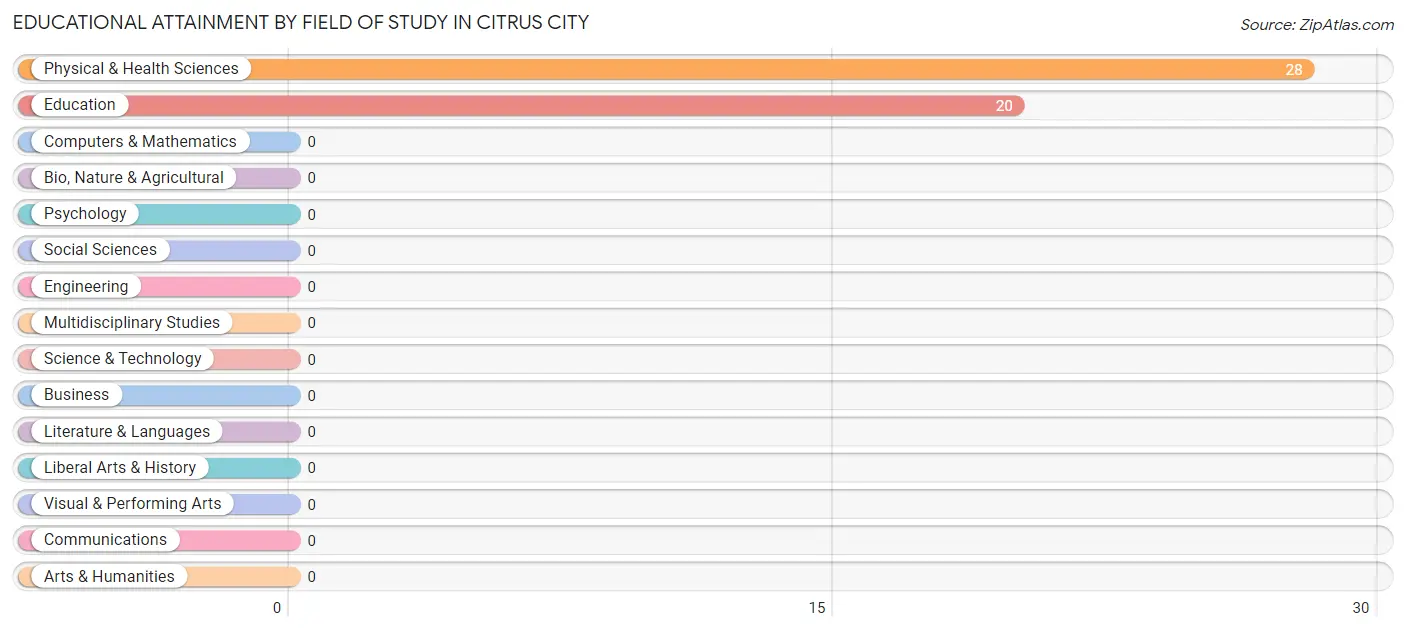
| Field of Study | # Graduates | % Graduates |
| Computers & Mathematics | 0 | 0.0% |
| Bio, Nature & Agricultural | 0 | 0.0% |
| Physical & Health Sciences | 28 | 58.3% |
| Psychology | 0 | 0.0% |
| Social Sciences | 0 | 0.0% |
| Engineering | 0 | 0.0% |
| Multidisciplinary Studies | 0 | 0.0% |
| Science & Technology | 0 | 0.0% |
| Business | 0 | 0.0% |
| Education | 20 | 41.7% |
| Literature & Languages | 0 | 0.0% |
| Liberal Arts & History | 0 | 0.0% |
| Visual & Performing Arts | 0 | 0.0% |
| Communications | 0 | 0.0% |
| Arts & Humanities | 0 | 0.0% |
| Total | 48 | 100.0% |
Transportation & Commute in Citrus City
Vehicle Availability by Sex in Citrus City
The most prevalent vehicle ownership categories in Citrus City are males with 3 vehicles (304, accounting for 41.8%) and females with 3 vehicles (44, making up 174.7%).
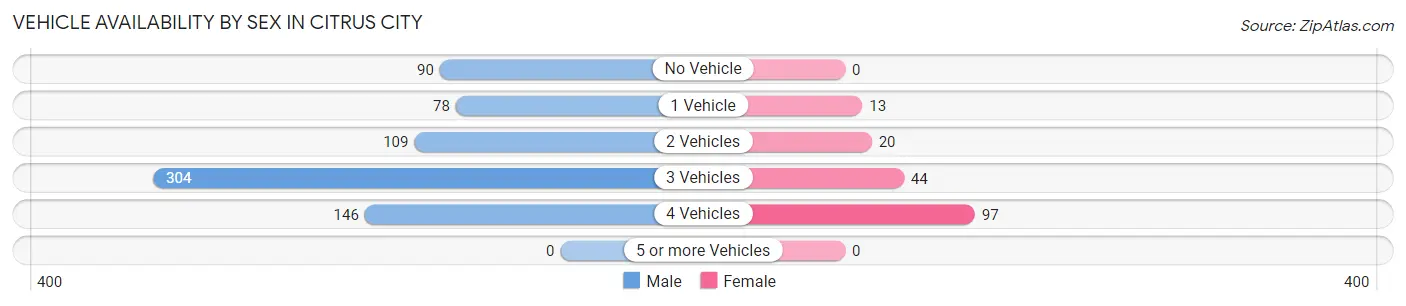
| Vehicles Available | Male | Female |
| No Vehicle | 90 (12.4%) | 0 (0.0%) |
| 1 Vehicle | 78 (10.7%) | 13 (7.5%) |
| 2 Vehicles | 109 (15.0%) | 20 (11.5%) |
| 3 Vehicles | 304 (41.8%) | 44 (25.3%) |
| 4 Vehicles | 146 (20.1%) | 97 (55.7%) |
| 5 or more Vehicles | 0 (0.0%) | 0 (0.0%) |
| Total | 727 (100.0%) | 174 (100.0%) |
Commute Time in Citrus City
The most frequently occuring commute durations in Citrus City are 30 to 34 minutes (282 commuters, 32.2%), 25 to 29 minutes (138 commuters, 15.7%), and less than 5 minutes (117 commuters, 13.3%).
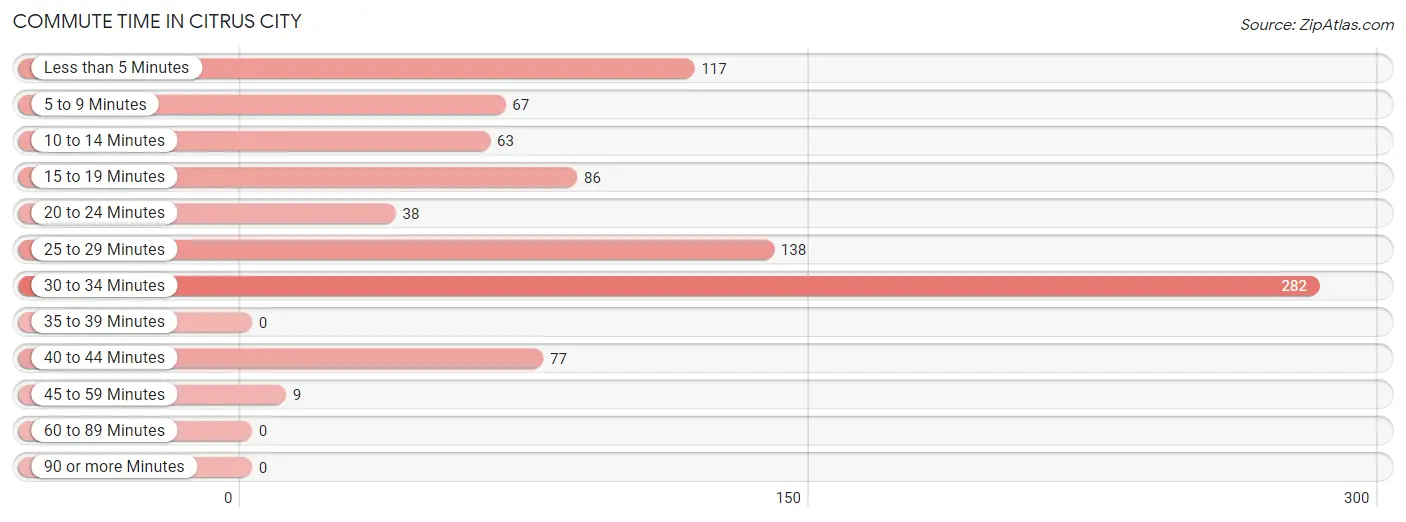
| Commute Time | # Commuters | % Commuters |
| Less than 5 Minutes | 117 | 13.3% |
| 5 to 9 Minutes | 67 | 7.6% |
| 10 to 14 Minutes | 63 | 7.2% |
| 15 to 19 Minutes | 86 | 9.8% |
| 20 to 24 Minutes | 38 | 4.3% |
| 25 to 29 Minutes | 138 | 15.7% |
| 30 to 34 Minutes | 282 | 32.2% |
| 35 to 39 Minutes | 0 | 0.0% |
| 40 to 44 Minutes | 77 | 8.8% |
| 45 to 59 Minutes | 9 | 1.0% |
| 60 to 89 Minutes | 0 | 0.0% |
| 90 or more Minutes | 0 | 0.0% |
Commute Time by Sex in Citrus City
The most common commute times in Citrus City are 30 to 34 minutes (222 commuters, 30.5%) for males and 30 to 34 minutes (60 commuters, 40.0%) for females.
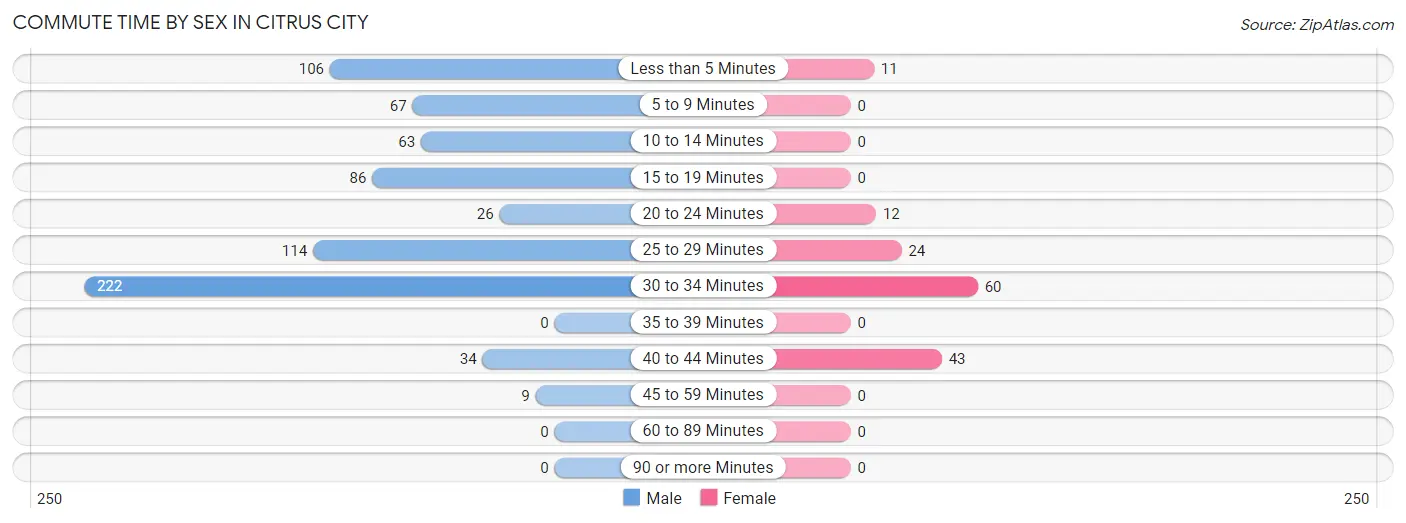
| Commute Time | Male | Female |
| Less than 5 Minutes | 106 (14.6%) | 11 (7.3%) |
| 5 to 9 Minutes | 67 (9.2%) | 0 (0.0%) |
| 10 to 14 Minutes | 63 (8.7%) | 0 (0.0%) |
| 15 to 19 Minutes | 86 (11.8%) | 0 (0.0%) |
| 20 to 24 Minutes | 26 (3.6%) | 12 (8.0%) |
| 25 to 29 Minutes | 114 (15.7%) | 24 (16.0%) |
| 30 to 34 Minutes | 222 (30.5%) | 60 (40.0%) |
| 35 to 39 Minutes | 0 (0.0%) | 0 (0.0%) |
| 40 to 44 Minutes | 34 (4.7%) | 43 (28.7%) |
| 45 to 59 Minutes | 9 (1.2%) | 0 (0.0%) |
| 60 to 89 Minutes | 0 (0.0%) | 0 (0.0%) |
| 90 or more Minutes | 0 (0.0%) | 0 (0.0%) |
Time of Departure to Work by Sex in Citrus City
The most frequent times of departure to work in Citrus City are 7:00 AM to 7:29 AM (164, 22.6%) for males and 9:00 AM to 9:59 AM (47, 31.3%) for females.
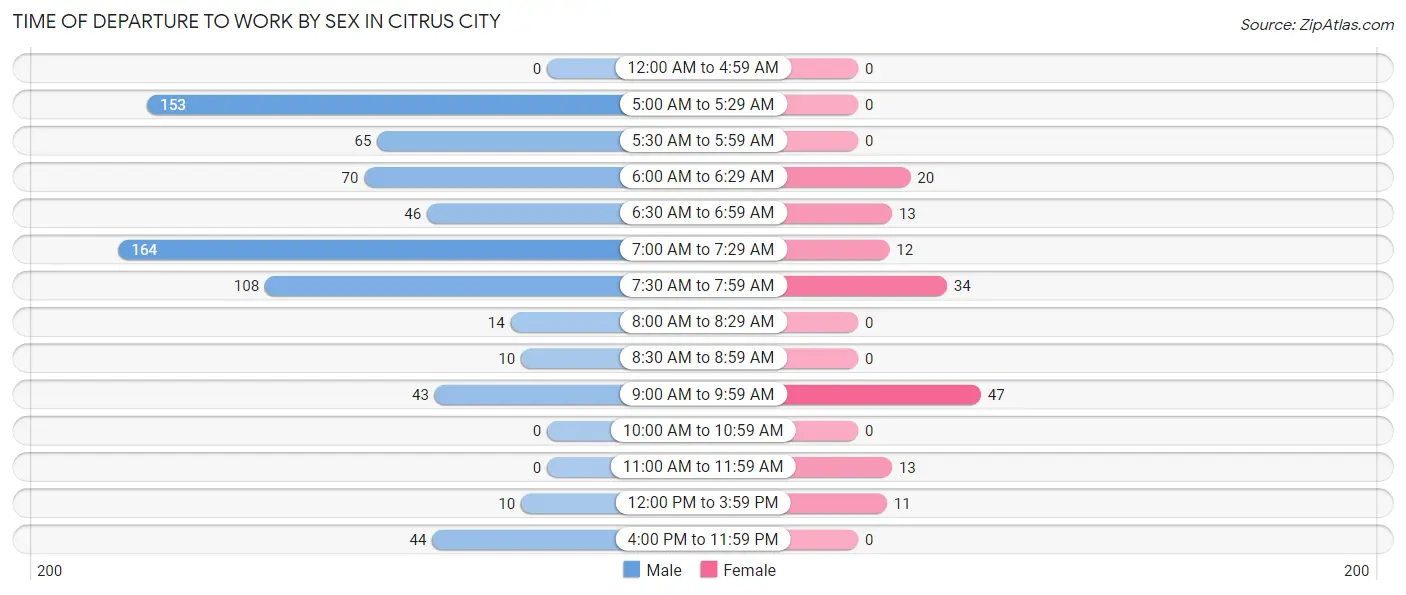
| Time of Departure | Male | Female |
| 12:00 AM to 4:59 AM | 0 (0.0%) | 0 (0.0%) |
| 5:00 AM to 5:29 AM | 153 (21.0%) | 0 (0.0%) |
| 5:30 AM to 5:59 AM | 65 (8.9%) | 0 (0.0%) |
| 6:00 AM to 6:29 AM | 70 (9.6%) | 20 (13.3%) |
| 6:30 AM to 6:59 AM | 46 (6.3%) | 13 (8.7%) |
| 7:00 AM to 7:29 AM | 164 (22.6%) | 12 (8.0%) |
| 7:30 AM to 7:59 AM | 108 (14.9%) | 34 (22.7%) |
| 8:00 AM to 8:29 AM | 14 (1.9%) | 0 (0.0%) |
| 8:30 AM to 8:59 AM | 10 (1.4%) | 0 (0.0%) |
| 9:00 AM to 9:59 AM | 43 (5.9%) | 47 (31.3%) |
| 10:00 AM to 10:59 AM | 0 (0.0%) | 0 (0.0%) |
| 11:00 AM to 11:59 AM | 0 (0.0%) | 13 (8.7%) |
| 12:00 PM to 3:59 PM | 10 (1.4%) | 11 (7.3%) |
| 4:00 PM to 11:59 PM | 44 (6.0%) | 0 (0.0%) |
| Total | 727 (100.0%) | 150 (100.0%) |
Housing Occupancy in Citrus City
Occupancy by Ownership in Citrus City
Of the total 617 dwellings in Citrus City, owner-occupied units account for 498 (80.7%), while renter-occupied units make up 119 (19.3%).
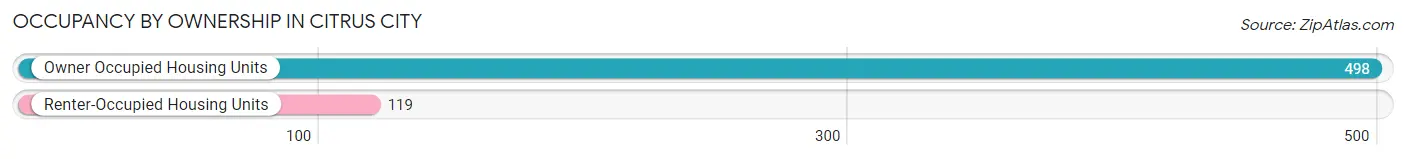
| Occupancy | # Housing Units | % Housing Units |
| Owner Occupied Housing Units | 498 | 80.7% |
| Renter-Occupied Housing Units | 119 | 19.3% |
| Total Occupied Housing Units | 617 | 100.0% |
Occupancy by Household Size in Citrus City
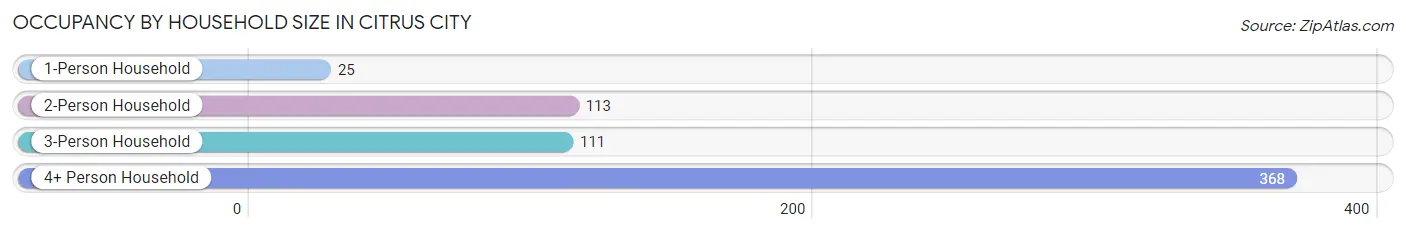
| Household Size | # Housing Units | % Housing Units |
| 1-Person Household | 25 | 4.1% |
| 2-Person Household | 113 | 18.3% |
| 3-Person Household | 111 | 18.0% |
| 4+ Person Household | 368 | 59.6% |
| Total Housing Units | 617 | 100.0% |
Occupancy by Ownership by Household Size in Citrus City
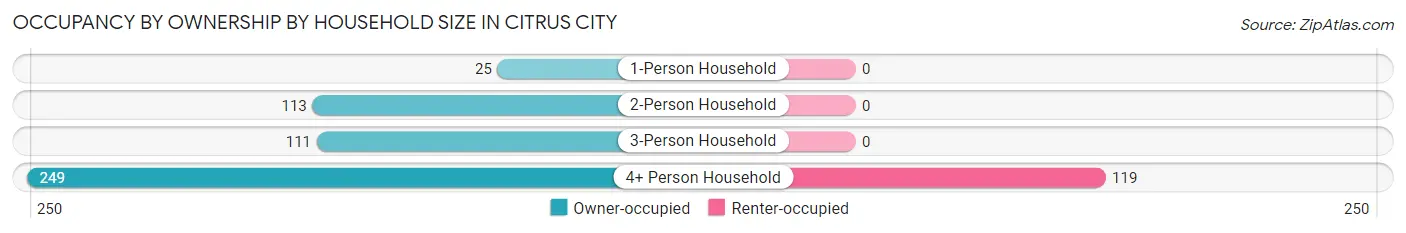
| Household Size | Owner-occupied | Renter-occupied |
| 1-Person Household | 25 (100.0%) | 0 (0.0%) |
| 2-Person Household | 113 (100.0%) | 0 (0.0%) |
| 3-Person Household | 111 (100.0%) | 0 (0.0%) |
| 4+ Person Household | 249 (67.7%) | 119 (32.3%) |
| Total Housing Units | 498 (80.7%) | 119 (19.3%) |
Occupancy by Educational Attainment in Citrus City
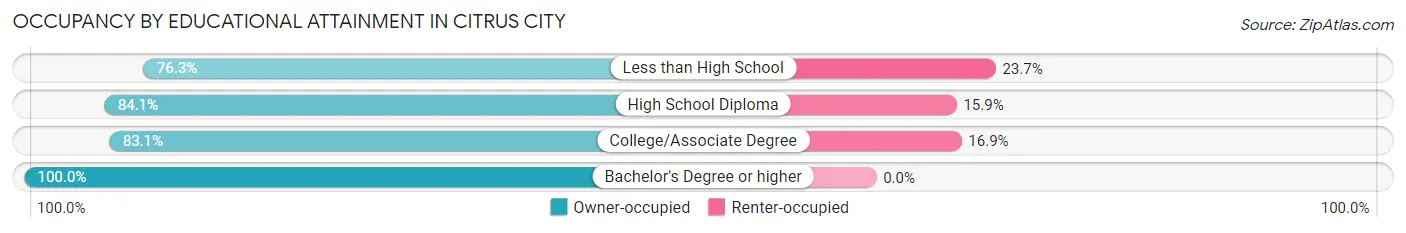
| Household Size | Owner-occupied | Renter-occupied |
| Less than High School | 242 (76.3%) | 75 (23.7%) |
| High School Diploma | 169 (84.1%) | 32 (15.9%) |
| College/Associate Degree | 59 (83.1%) | 12 (16.9%) |
| Bachelor's Degree or higher | 28 (100.0%) | 0 (0.0%) |
Occupancy by Age of Householder in Citrus City
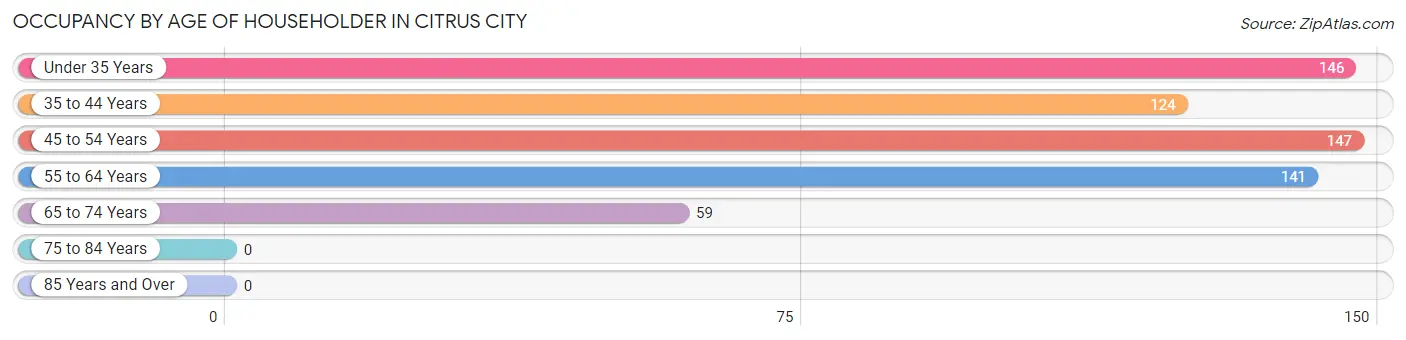
| Age Bracket | # Households | % Households |
| Under 35 Years | 146 | 23.7% |
| 35 to 44 Years | 124 | 20.1% |
| 45 to 54 Years | 147 | 23.8% |
| 55 to 64 Years | 141 | 22.9% |
| 65 to 74 Years | 59 | 9.6% |
| 75 to 84 Years | 0 | 0.0% |
| 85 Years and Over | 0 | 0.0% |
| Total | 617 | 100.0% |
Housing Finances in Citrus City
Median Income by Occupancy in Citrus City
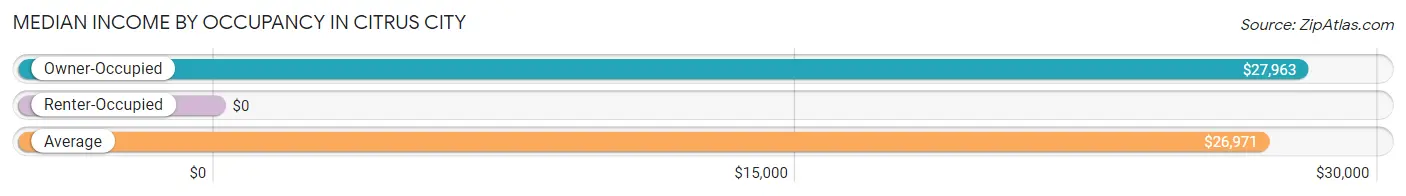
| Occupancy Type | # Households | Median Income |
| Owner-Occupied | 498 (80.7%) | $27,963 |
| Renter-Occupied | 119 (19.3%) | $0 |
| Average | 617 (100.0%) | $26,971 |
Occupancy by Householder Income Bracket in Citrus City
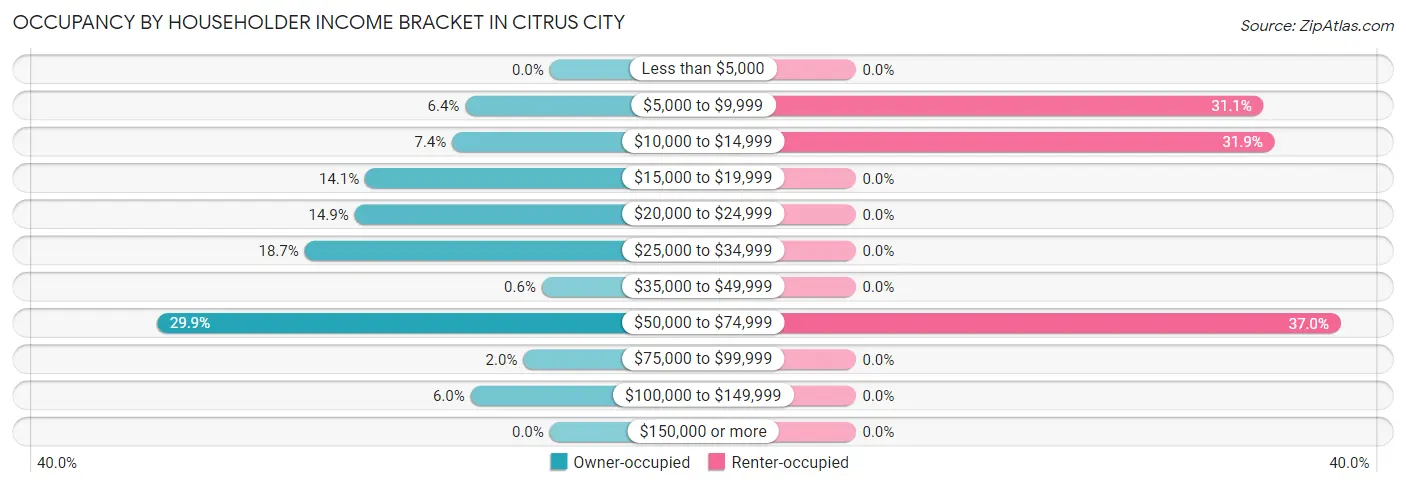
| Income Bracket | Owner-occupied | Renter-occupied |
| Less than $5,000 | 0 (0.0%) | 0 (0.0%) |
| $5,000 to $9,999 | 32 (6.4%) | 37 (31.1%) |
| $10,000 to $14,999 | 37 (7.4%) | 38 (31.9%) |
| $15,000 to $19,999 | 70 (14.1%) | 0 (0.0%) |
| $20,000 to $24,999 | 74 (14.9%) | 0 (0.0%) |
| $25,000 to $34,999 | 93 (18.7%) | 0 (0.0%) |
| $35,000 to $49,999 | 3 (0.6%) | 0 (0.0%) |
| $50,000 to $74,999 | 149 (29.9%) | 44 (37.0%) |
| $75,000 to $99,999 | 10 (2.0%) | 0 (0.0%) |
| $100,000 to $149,999 | 30 (6.0%) | 0 (0.0%) |
| $150,000 or more | 0 (0.0%) | 0 (0.0%) |
| Total | 498 (100.0%) | 119 (100.0%) |
Monthly Housing Cost Tiers in Citrus City
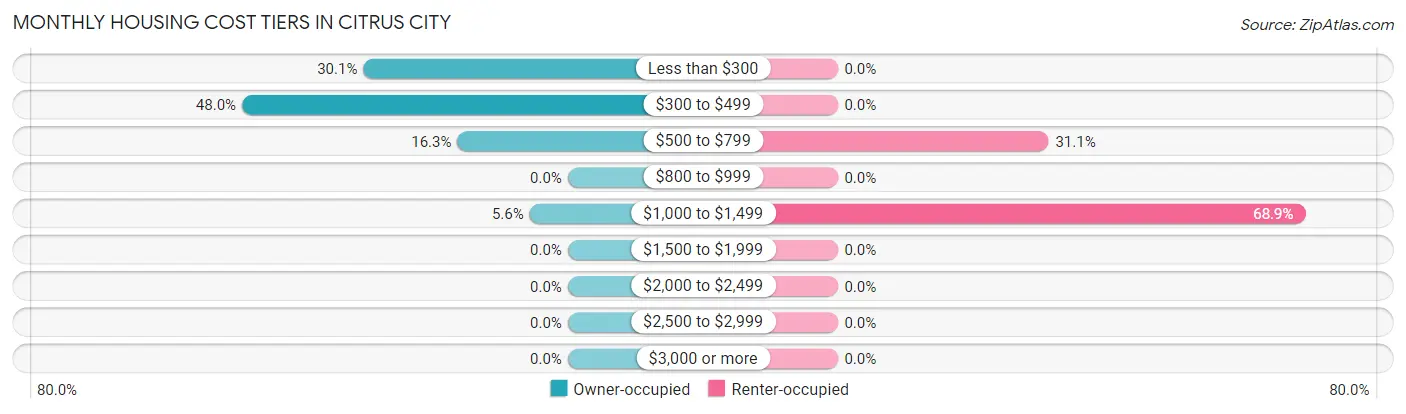
| Monthly Cost | Owner-occupied | Renter-occupied |
| Less than $300 | 150 (30.1%) | 0 (0.0%) |
| $300 to $499 | 239 (48.0%) | 0 (0.0%) |
| $500 to $799 | 81 (16.3%) | 37 (31.1%) |
| $800 to $999 | 0 (0.0%) | 0 (0.0%) |
| $1,000 to $1,499 | 28 (5.6%) | 82 (68.9%) |
| $1,500 to $1,999 | 0 (0.0%) | 0 (0.0%) |
| $2,000 to $2,499 | 0 (0.0%) | 0 (0.0%) |
| $2,500 to $2,999 | 0 (0.0%) | 0 (0.0%) |
| $3,000 or more | 0 (0.0%) | 0 (0.0%) |
| Total | 498 (100.0%) | 119 (100.0%) |
Physical Housing Characteristics in Citrus City
Housing Structures in Citrus City
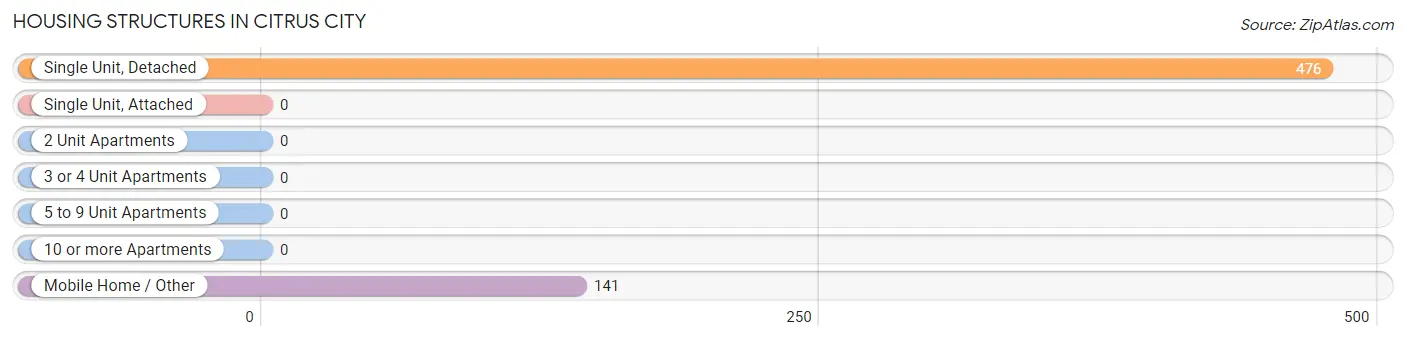
| Structure Type | # Housing Units | % Housing Units |
| Single Unit, Detached | 476 | 77.1% |
| Single Unit, Attached | 0 | 0.0% |
| 2 Unit Apartments | 0 | 0.0% |
| 3 or 4 Unit Apartments | 0 | 0.0% |
| 5 to 9 Unit Apartments | 0 | 0.0% |
| 10 or more Apartments | 0 | 0.0% |
| Mobile Home / Other | 141 | 22.9% |
| Total | 617 | 100.0% |
Housing Structures by Occupancy in Citrus City
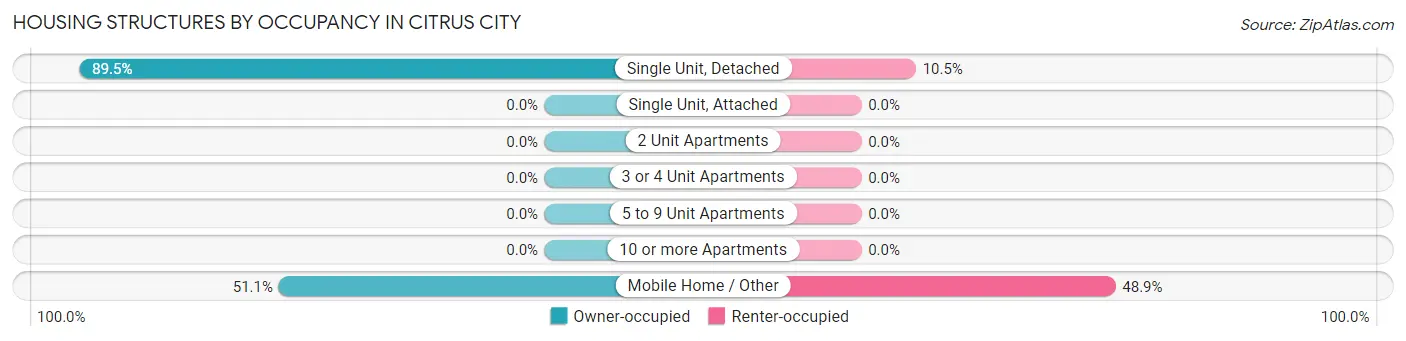
| Structure Type | Owner-occupied | Renter-occupied |
| Single Unit, Detached | 426 (89.5%) | 50 (10.5%) |
| Single Unit, Attached | 0 (0.0%) | 0 (0.0%) |
| 2 Unit Apartments | 0 (0.0%) | 0 (0.0%) |
| 3 or 4 Unit Apartments | 0 (0.0%) | 0 (0.0%) |
| 5 to 9 Unit Apartments | 0 (0.0%) | 0 (0.0%) |
| 10 or more Apartments | 0 (0.0%) | 0 (0.0%) |
| Mobile Home / Other | 72 (51.1%) | 69 (48.9%) |
| Total | 498 (80.7%) | 119 (19.3%) |
Housing Structures by Number of Rooms in Citrus City
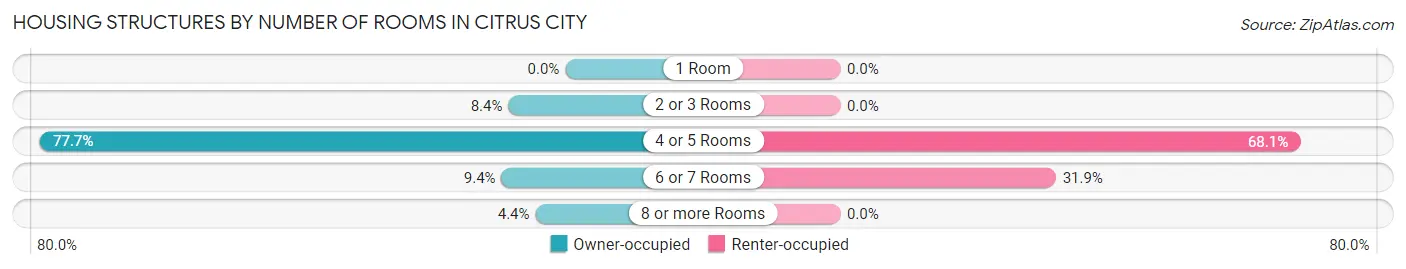
| Number of Rooms | Owner-occupied | Renter-occupied |
| 1 Room | 0 (0.0%) | 0 (0.0%) |
| 2 or 3 Rooms | 42 (8.4%) | 0 (0.0%) |
| 4 or 5 Rooms | 387 (77.7%) | 81 (68.1%) |
| 6 or 7 Rooms | 47 (9.4%) | 38 (31.9%) |
| 8 or more Rooms | 22 (4.4%) | 0 (0.0%) |
| Total | 498 (100.0%) | 119 (100.0%) |
Housing Structure by Heating Type in Citrus City
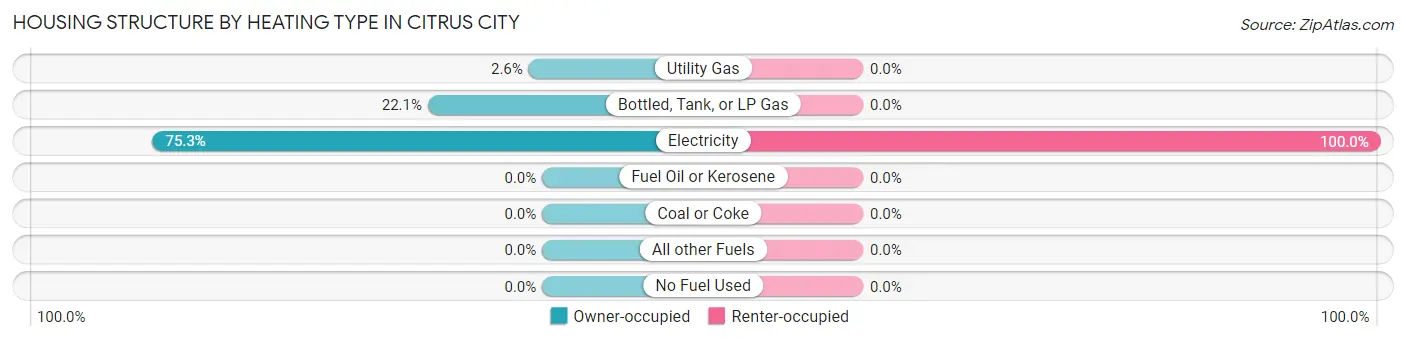
| Heating Type | Owner-occupied | Renter-occupied |
| Utility Gas | 13 (2.6%) | 0 (0.0%) |
| Bottled, Tank, or LP Gas | 110 (22.1%) | 0 (0.0%) |
| Electricity | 375 (75.3%) | 119 (100.0%) |
| Fuel Oil or Kerosene | 0 (0.0%) | 0 (0.0%) |
| Coal or Coke | 0 (0.0%) | 0 (0.0%) |
| All other Fuels | 0 (0.0%) | 0 (0.0%) |
| No Fuel Used | 0 (0.0%) | 0 (0.0%) |
| Total | 498 (100.0%) | 119 (100.0%) |
Household Vehicle Usage in Citrus City
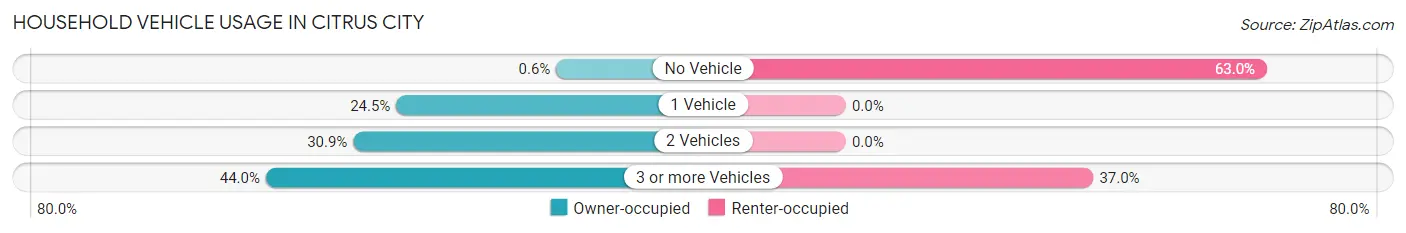
| Vehicles per Household | Owner-occupied | Renter-occupied |
| No Vehicle | 3 (0.6%) | 75 (63.0%) |
| 1 Vehicle | 122 (24.5%) | 0 (0.0%) |
| 2 Vehicles | 154 (30.9%) | 0 (0.0%) |
| 3 or more Vehicles | 219 (44.0%) | 44 (37.0%) |
| Total | 498 (100.0%) | 119 (100.0%) |
Real Estate & Mortgages in Citrus City
Real Estate and Mortgage Overview in Citrus City
| Characteristic | Without Mortgage | With Mortgage |
| Housing Units | 389 | 109 |
| Median Property Value | $92,800 | $98,300 |
| Median Household Income | - | - |
| Monthly Housing Costs | $334 | $0 |
| Real Estate Taxes | $1,040 | $0 |
Property Value by Mortgage Status in Citrus City
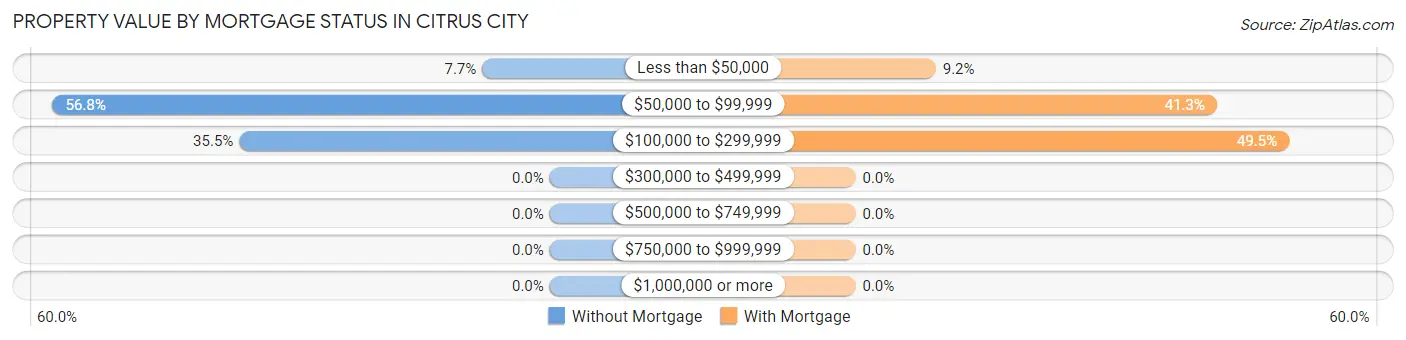
| Property Value | Without Mortgage | With Mortgage |
| Less than $50,000 | 30 (7.7%) | 10 (9.2%) |
| $50,000 to $99,999 | 221 (56.8%) | 45 (41.3%) |
| $100,000 to $299,999 | 138 (35.5%) | 54 (49.5%) |
| $300,000 to $499,999 | 0 (0.0%) | 0 (0.0%) |
| $500,000 to $749,999 | 0 (0.0%) | 0 (0.0%) |
| $750,000 to $999,999 | 0 (0.0%) | 0 (0.0%) |
| $1,000,000 or more | 0 (0.0%) | 0 (0.0%) |
| Total | 389 (100.0%) | 109 (100.0%) |
Household Income by Mortgage Status in Citrus City
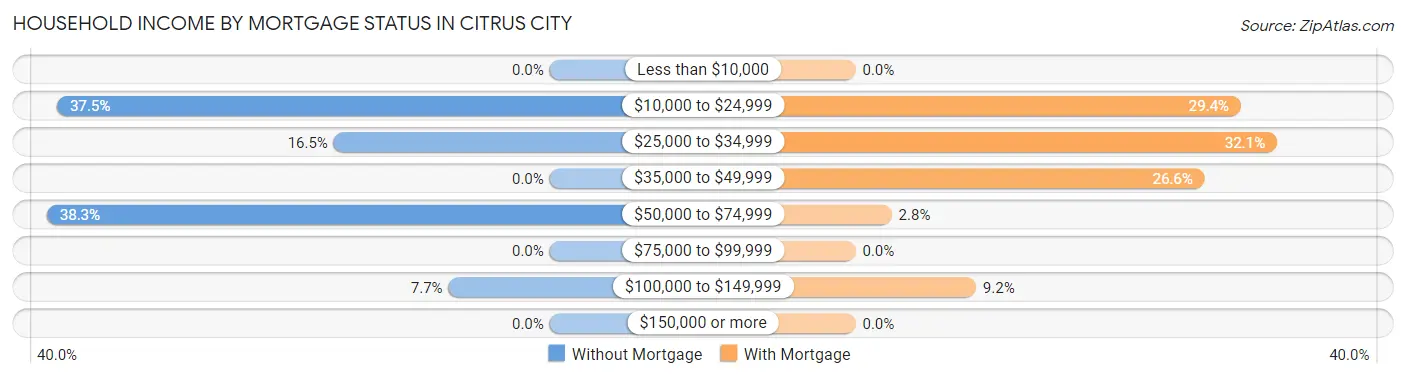
| Household Income | Without Mortgage | With Mortgage |
| Less than $10,000 | 0 (0.0%) | 0 (0.0%) |
| $10,000 to $24,999 | 146 (37.5%) | 32 (29.4%) |
| $25,000 to $34,999 | 64 (16.5%) | 35 (32.1%) |
| $35,000 to $49,999 | 0 (0.0%) | 29 (26.6%) |
| $50,000 to $74,999 | 149 (38.3%) | 3 (2.8%) |
| $75,000 to $99,999 | 0 (0.0%) | 0 (0.0%) |
| $100,000 to $149,999 | 30 (7.7%) | 10 (9.2%) |
| $150,000 or more | 0 (0.0%) | 0 (0.0%) |
| Total | 389 (100.0%) | 109 (100.0%) |
Property Value to Household Income Ratio in Citrus City
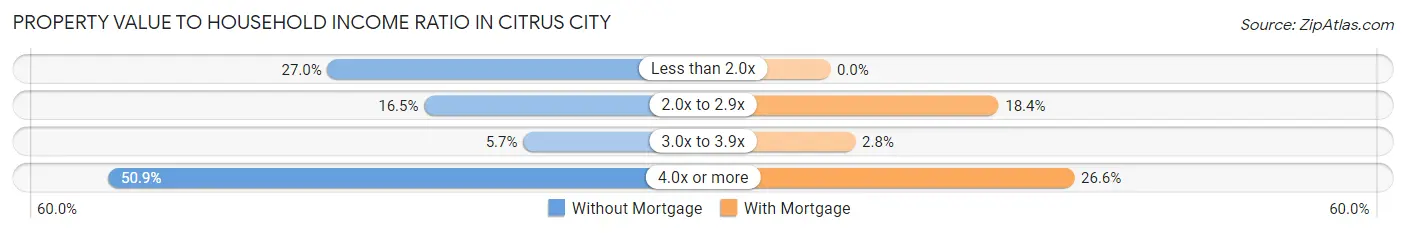
| Value-to-Income Ratio | Without Mortgage | With Mortgage |
| Less than 2.0x | 105 (27.0%) | 0 (0.0%) |
| 2.0x to 2.9x | 64 (16.5%) | 20 (18.3%) |
| 3.0x to 3.9x | 22 (5.7%) | 3 (2.8%) |
| 4.0x or more | 198 (50.9%) | 29 (26.6%) |
| Total | 389 (100.0%) | 109 (100.0%) |
Real Estate Taxes by Mortgage Status in Citrus City
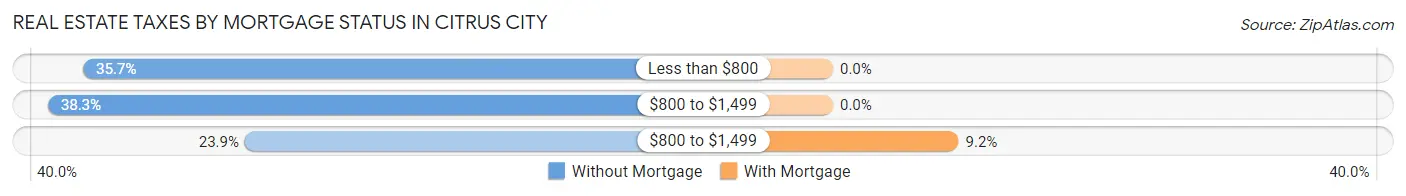
| Property Taxes | Without Mortgage | With Mortgage |
| Less than $800 | 139 (35.7%) | 0 (0.0%) |
| $800 to $1,499 | 149 (38.3%) | 0 (0.0%) |
| $800 to $1,499 | 93 (23.9%) | 10 (9.2%) |
| Total | 389 (100.0%) | 109 (100.0%) |
Health & Disability in Citrus City
Health Insurance Coverage by Age in Citrus City
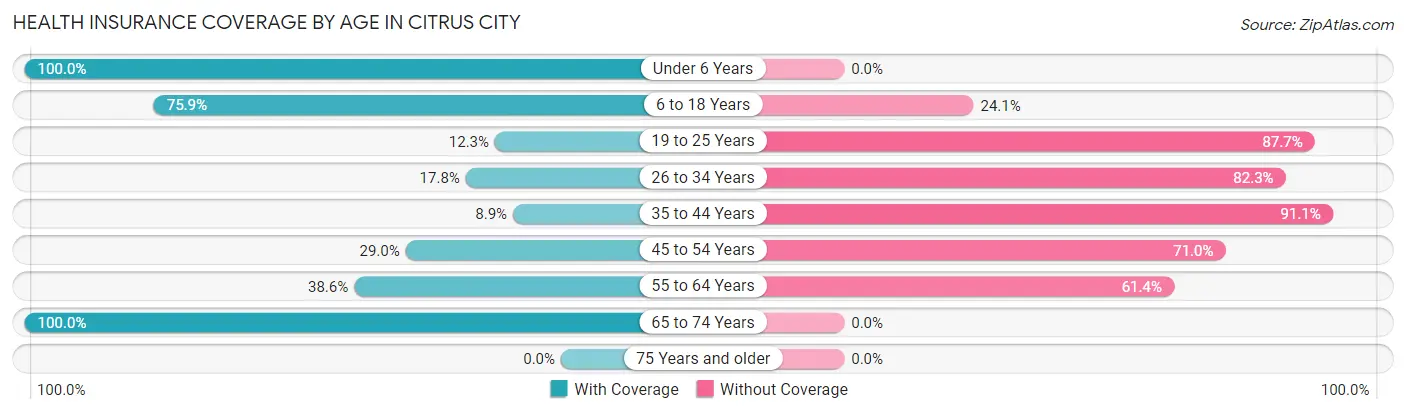
| Age Bracket | With Coverage | Without Coverage |
| Under 6 Years | 104 (100.0%) | 0 (0.0%) |
| 6 to 18 Years | 803 (75.9%) | 255 (24.1%) |
| 19 to 25 Years | 47 (12.3%) | 335 (87.7%) |
| 26 to 34 Years | 52 (17.7%) | 241 (82.3%) |
| 35 to 44 Years | 37 (8.9%) | 377 (91.1%) |
| 45 to 54 Years | 86 (29.0%) | 211 (71.0%) |
| 55 to 64 Years | 113 (38.6%) | 180 (61.4%) |
| 65 to 74 Years | 79 (100.0%) | 0 (0.0%) |
| 75 Years and older | 0 (0.0%) | 0 (0.0%) |
| Total | 1,321 (45.2%) | 1,599 (54.8%) |
Health Insurance Coverage by Citizenship Status in Citrus City
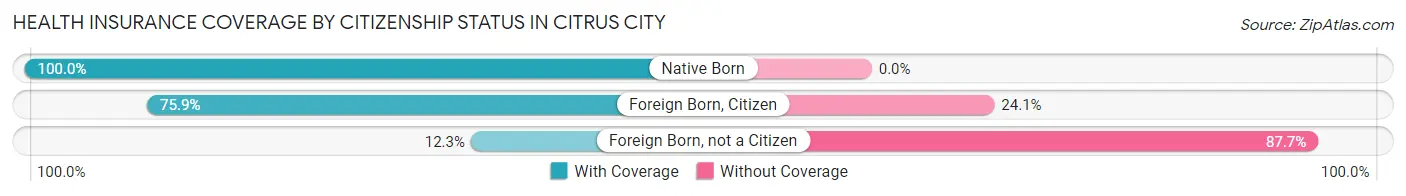
| Citizenship Status | With Coverage | Without Coverage |
| Native Born | 104 (100.0%) | 0 (0.0%) |
| Foreign Born, Citizen | 803 (75.9%) | 255 (24.1%) |
| Foreign Born, not a Citizen | 47 (12.3%) | 335 (87.7%) |
Health Insurance Coverage by Household Income in Citrus City
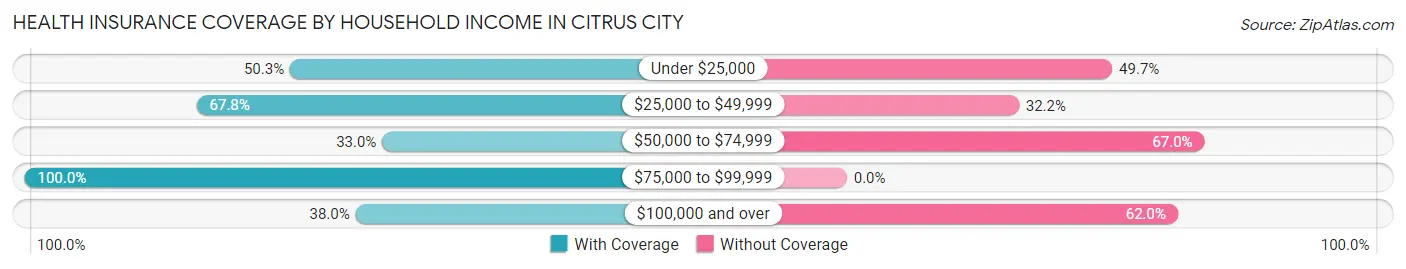
| Household Income | With Coverage | Without Coverage |
| Under $25,000 | 728 (50.3%) | 720 (49.7%) |
| $25,000 to $49,999 | 164 (67.8%) | 78 (32.2%) |
| $50,000 to $74,999 | 364 (33.0%) | 739 (67.0%) |
| $75,000 to $99,999 | 27 (100.0%) | 0 (0.0%) |
| $100,000 and over | 38 (38.0%) | 62 (62.0%) |
Public vs Private Health Insurance Coverage by Age in Citrus City
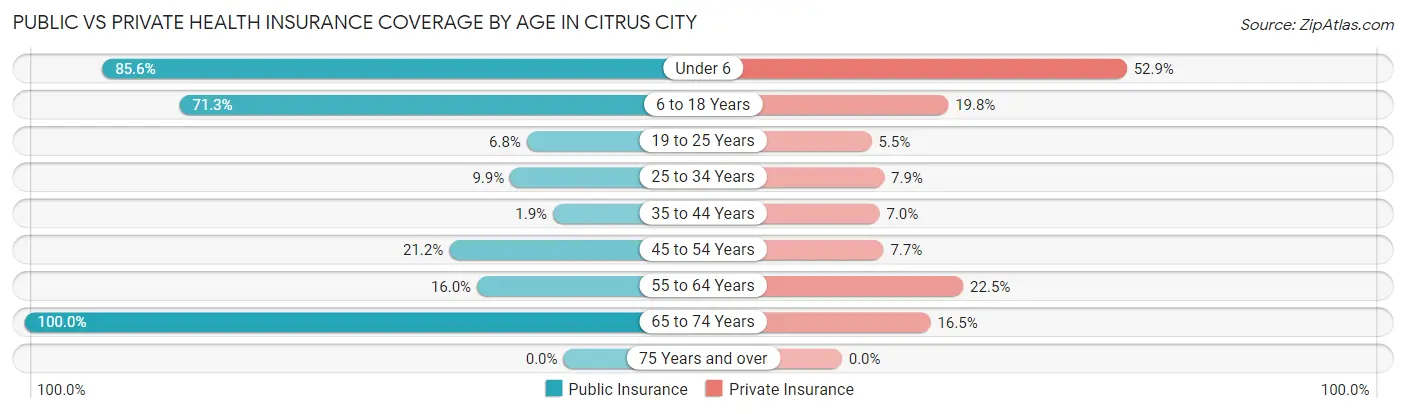
| Age Bracket | Public Insurance | Private Insurance |
| Under 6 | 89 (85.6%) | 55 (52.9%) |
| 6 to 18 Years | 754 (71.3%) | 209 (19.8%) |
| 19 to 25 Years | 26 (6.8%) | 21 (5.5%) |
| 25 to 34 Years | 29 (9.9%) | 23 (7.9%) |
| 35 to 44 Years | 8 (1.9%) | 29 (7.0%) |
| 45 to 54 Years | 63 (21.2%) | 23 (7.7%) |
| 55 to 64 Years | 47 (16.0%) | 66 (22.5%) |
| 65 to 74 Years | 79 (100.0%) | 13 (16.5%) |
| 75 Years and over | 0 (0.0%) | 0 (0.0%) |
| Total | 1,095 (37.5%) | 439 (15.0%) |
Disability Status by Sex by Age in Citrus City
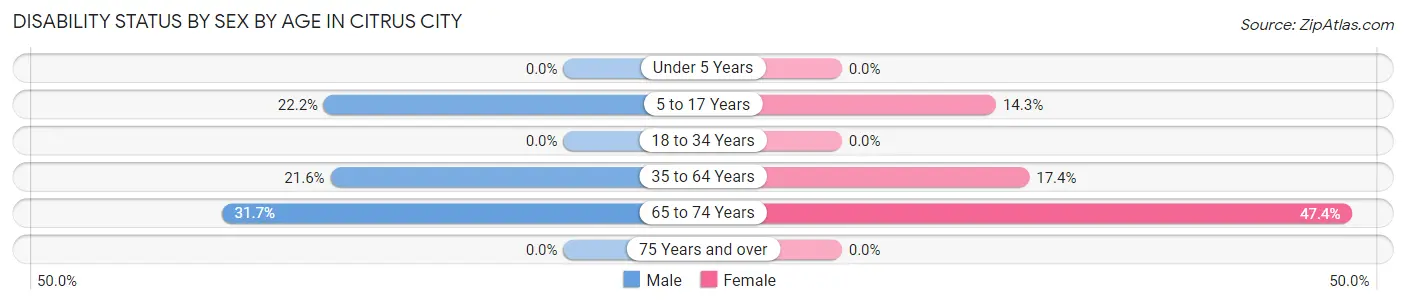
| Age Bracket | Male | Female |
| Under 5 Years | 0 (0.0%) | 0 (0.0%) |
| 5 to 17 Years | 94 (22.2%) | 81 (14.3%) |
| 18 to 34 Years | 0 (0.0%) | 0 (0.0%) |
| 35 to 64 Years | 104 (21.6%) | 91 (17.4%) |
| 65 to 74 Years | 13 (31.7%) | 18 (47.4%) |
| 75 Years and over | 0 (0.0%) | 0 (0.0%) |
Disability Class by Sex by Age in Citrus City
Disability Class: Hearing Difficulty
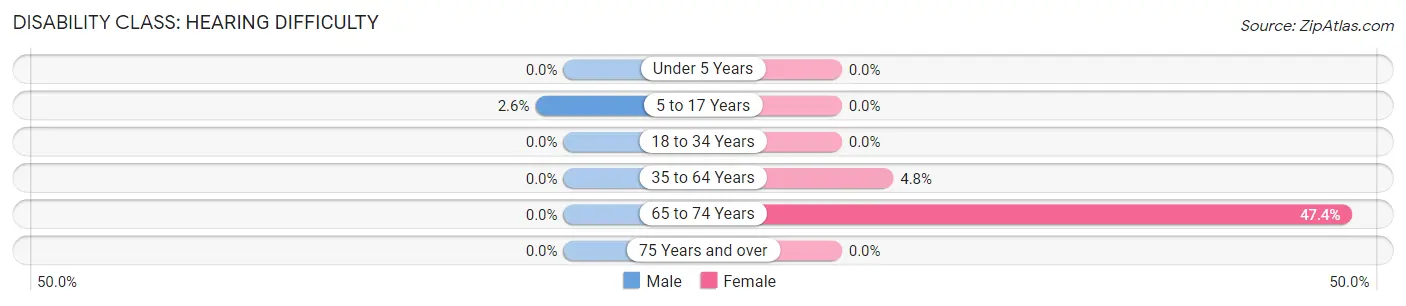
| Age Bracket | Male | Female |
| Under 5 Years | 0 (0.0%) | 0 (0.0%) |
| 5 to 17 Years | 11 (2.6%) | 0 (0.0%) |
| 18 to 34 Years | 0 (0.0%) | 0 (0.0%) |
| 35 to 64 Years | 0 (0.0%) | 25 (4.8%) |
| 65 to 74 Years | 0 (0.0%) | 18 (47.4%) |
| 75 Years and over | 0 (0.0%) | 0 (0.0%) |
Disability Class: Vision Difficulty
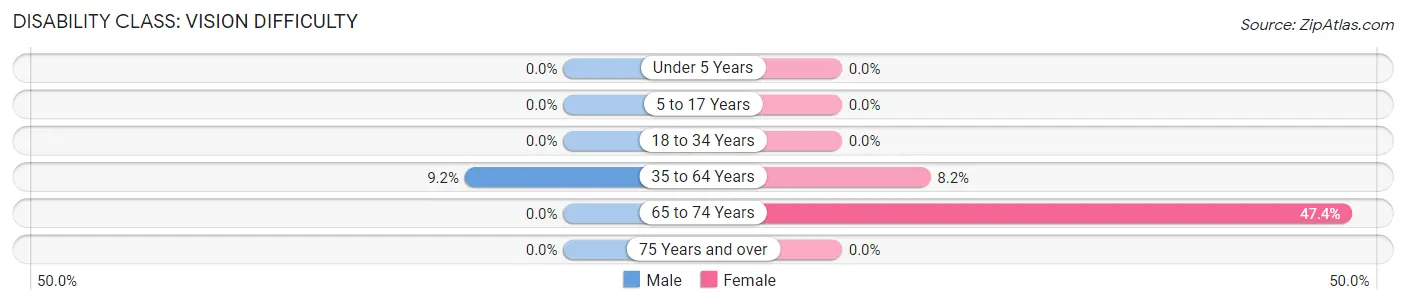
| Age Bracket | Male | Female |
| Under 5 Years | 0 (0.0%) | 0 (0.0%) |
| 5 to 17 Years | 0 (0.0%) | 0 (0.0%) |
| 18 to 34 Years | 0 (0.0%) | 0 (0.0%) |
| 35 to 64 Years | 44 (9.1%) | 43 (8.2%) |
| 65 to 74 Years | 0 (0.0%) | 18 (47.4%) |
| 75 Years and over | 0 (0.0%) | 0 (0.0%) |
Disability Class: Cognitive Difficulty
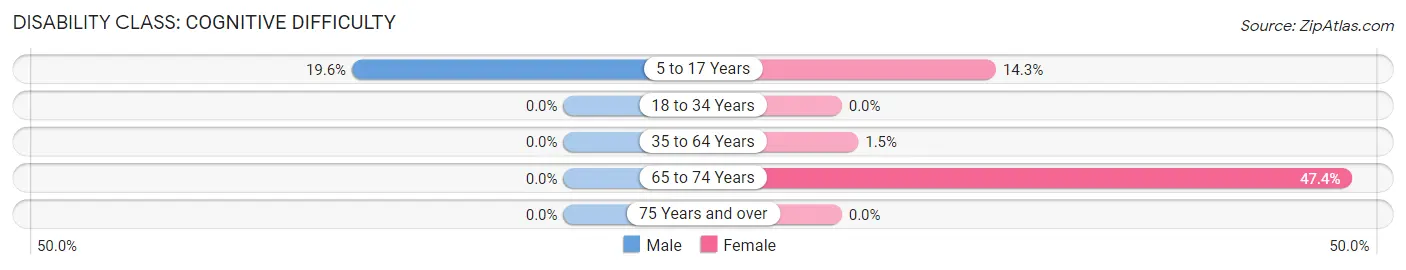
| Age Bracket | Male | Female |
| 5 to 17 Years | 83 (19.6%) | 81 (14.3%) |
| 18 to 34 Years | 0 (0.0%) | 0 (0.0%) |
| 35 to 64 Years | 0 (0.0%) | 8 (1.5%) |
| 65 to 74 Years | 0 (0.0%) | 18 (47.4%) |
| 75 Years and over | 0 (0.0%) | 0 (0.0%) |
Disability Class: Ambulatory Difficulty
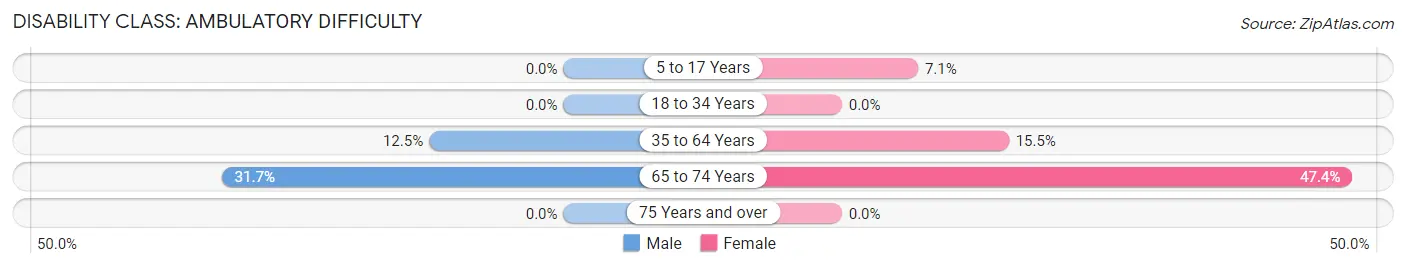
| Age Bracket | Male | Female |
| 5 to 17 Years | 0 (0.0%) | 40 (7.1%) |
| 18 to 34 Years | 0 (0.0%) | 0 (0.0%) |
| 35 to 64 Years | 60 (12.5%) | 81 (15.5%) |
| 65 to 74 Years | 13 (31.7%) | 18 (47.4%) |
| 75 Years and over | 0 (0.0%) | 0 (0.0%) |
Disability Class: Self-Care Difficulty
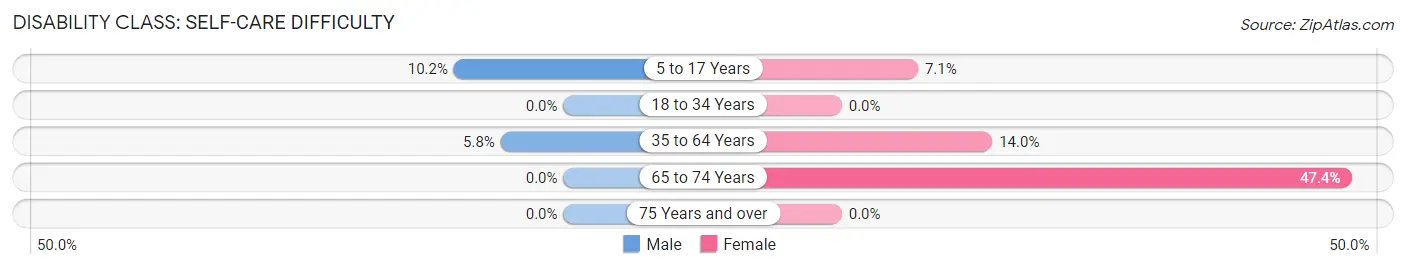
| Age Bracket | Male | Female |
| 5 to 17 Years | 43 (10.2%) | 40 (7.1%) |
| 18 to 34 Years | 0 (0.0%) | 0 (0.0%) |
| 35 to 64 Years | 28 (5.8%) | 73 (14.0%) |
| 65 to 74 Years | 0 (0.0%) | 18 (47.4%) |
| 75 Years and over | 0 (0.0%) | 0 (0.0%) |
Technology Access in Citrus City
Computing Device Access in Citrus City
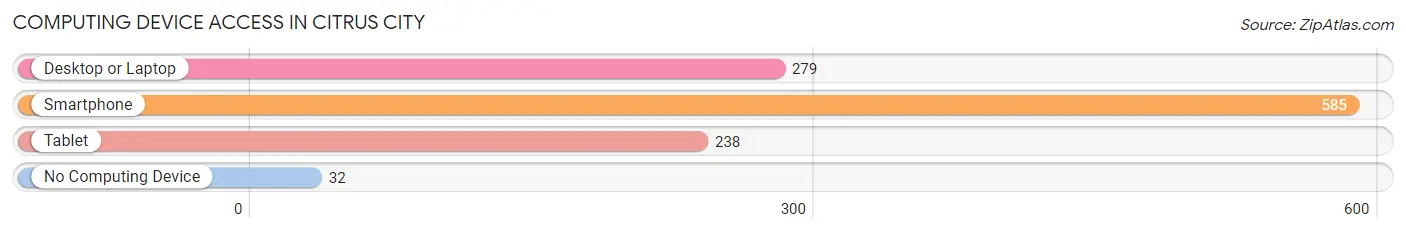
| Device Type | # Households | % Households |
| Desktop or Laptop | 279 | 45.2% |
| Smartphone | 585 | 94.8% |
| Tablet | 238 | 38.6% |
| No Computing Device | 32 | 5.2% |
| Total | 617 | 100.0% |
Internet Access in Citrus City
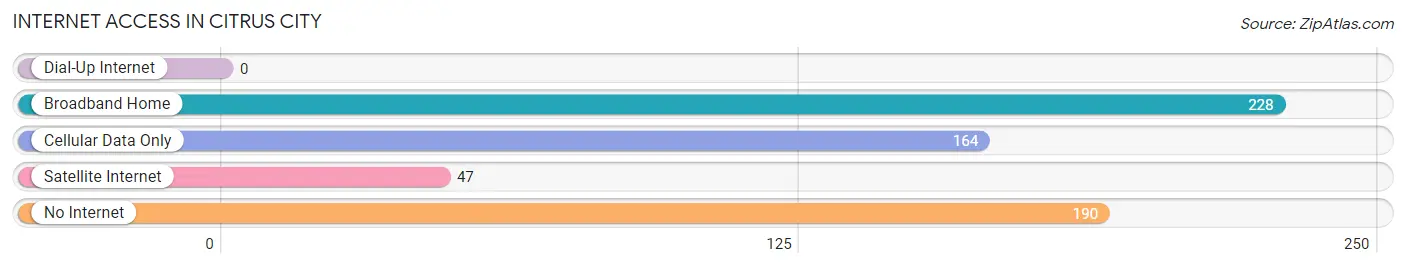
| Internet Type | # Households | % Households |
| Dial-Up Internet | 0 | 0.0% |
| Broadband Home | 228 | 36.9% |
| Cellular Data Only | 164 | 26.6% |
| Satellite Internet | 47 | 7.6% |
| No Internet | 190 | 30.8% |
| Total | 617 | 100.0% |
Citrus City Summary
Citrus City is a small city located in the state of Texas, United States. It is situated in the southeastern part of the state, in the county of Nueces. The city has a population of approximately 8,000 people, and is part of the Corpus Christi metropolitan area.
History
Citrus City was founded in 1883 by a group of settlers from the nearby town of Corpus Christi. The settlers were looking for a place to grow citrus fruits, and they chose the area around Citrus City for its fertile soil and abundant water supply. The city was officially incorporated in 1885, and the first mayor was elected in 1886.
The city grew slowly over the next few decades, and by the early 1900s, it had become a thriving agricultural center. Citrus fruits were the main crop, but other crops such as cotton, corn, and sugar cane were also grown. The city also had a thriving lumber industry, and several sawmills were built in the area.
In the 1920s, the city began to diversify its economy. The discovery of oil in the area led to the development of several oil refineries, and the city became a major center for the oil industry. The city also became a popular tourist destination, and several hotels and resorts were built in the area.
Geography
Citrus City is located in the southeastern part of Texas, in the county of Nueces. The city is situated on the Gulf Coast, and is bordered by the cities of Corpus Christi, Port Aransas, and Aransas Pass. The city is located on the Nueces River, and is surrounded by several small lakes and wetlands.
The city has a humid subtropical climate, with hot summers and mild winters. The average annual temperature is around 70 degrees Fahrenheit, and the average annual precipitation is around 40 inches.
Economy
Citrus City’s economy is largely based on the oil industry. The city is home to several oil refineries, and is a major center for the oil industry in the region. The city also has a thriving tourism industry, and several hotels and resorts are located in the area.
The city is also home to several manufacturing companies, and is a major center for the production of furniture, clothing, and other goods. The city also has a thriving agricultural sector, and is a major producer of citrus fruits, cotton, corn, and sugar cane.
Demographics
As of the 2010 census, the population of Citrus City was 8,000. The racial makeup of the city was 79.3% White, 14.2% Hispanic or Latino, 4.2% African American, 0.7% Native American, 0.3% Asian, and 1.5% from other races.
The median household income in Citrus City was $37,000, and the median family income was $41,000. The per capita income was $17,000. The poverty rate was 17.3%, and the unemployment rate was 8.2%.
Conclusion
Citrus City is a small city located in the southeastern part of Texas. The city has a population of 8,000 people, and is part of the Corpus Christi metropolitan area. The city’s economy is largely based on the oil industry, and it is also a major center for the production of furniture, clothing, and other goods. The city also has a thriving tourism industry, and several hotels and resorts are located in the area. The racial makeup of the city is 79.3% White, 14.2% Hispanic or Latino, 4.2% African American, 0.7% Native American, 0.3% Asian, and 1.5% from other races. The median household income in Citrus City was $37,000, and the median family income was $41,000. The poverty rate was 17.3%, and the unemployment rate was 8.2%.
Common Questions
What is Per Capita Income in Citrus City?
Per Capita income in Citrus City is $8,316.
What is the Median Family Income in Citrus City?
Median Family Income in Citrus City is $26,779.
What is the Median Household income in Citrus City?
Median Household Income in Citrus City is $26,971.
What is Inequality or Gini Index in Citrus City?
Inequality or Gini Index in Citrus City is 0.40.
What is the Total Population of Citrus City?
Total Population of Citrus City is 2,920.
What is the Total Male Population of Citrus City?
Total Male Population of Citrus City is 1,344.
What is the Total Female Population of Citrus City?
Total Female Population of Citrus City is 1,576.
What is the Ratio of Males per 100 Females in Citrus City?
There are 85.28 Males per 100 Females in Citrus City.
What is the Ratio of Females per 100 Males in Citrus City?
There are 117.26 Females per 100 Males in Citrus City.
What is the Median Population Age in Citrus City?
Median Population Age in Citrus City is 22.9 Years.
What is the Average Family Size in Citrus City
Average Family Size in Citrus City is 5.0 People.
What is the Average Household Size in Citrus City
Average Household Size in Citrus City is 4.7 People.
How Large is the Labor Force in Citrus City?
There are 1,256 People in the Labor Forcein in Citrus City.
What is the Percentage of People in the Labor Force in Citrus City?
59.8% of People are in the Labor Force in Citrus City.
What is the Unemployment Rate in Citrus City?
Unemployment Rate in Citrus City is 28.2%.