Sparks, TX Map & Demographics
Sparks Map
Sparks Overview
$11,517
PER CAPITA INCOME
$35,281
AVG FAMILY INCOME
$30,848
AVG HOUSEHOLD INCOME
30.1%
WAGE / INCOME GAP [ % ]
69.9¢/ $1
WAGE / INCOME GAP [ $ ]
$9,645
FAMILY INCOME DEFICIT
0.43
INEQUALITY / GINI INDEX
5,212
TOTAL POPULATION
2,739
MALE POPULATION
2,473
FEMALE POPULATION
110.76
MALES / 100 FEMALES
90.29
FEMALES / 100 MALES
25.3
MEDIAN AGE
4.3
AVG FAMILY SIZE
3.9
AVG HOUSEHOLD SIZE
2,290
LABOR FORCE [ PEOPLE ]
60.7%
PERCENT IN LABOR FORCE
10.7%
UNEMPLOYMENT RATE
Income in Sparks
Income Overview in Sparks
Per Capita Income in Sparks is $11,517, while median incomes of families and households are $35,281 and $30,848 respectively.
| Characteristic | Number | Measure |
| Per Capita Income | 5,212 | $11,517 |
| Median Family Income | 1,137 | $35,281 |
| Mean Family Income | 1,137 | $41,322 |
| Median Household Income | 1,345 | $30,848 |
| Mean Household Income | 1,345 | $41,341 |
| Income Deficit | 1,137 | $9,645 |
| Wage / Income Gap (%) | 5,212 | 30.10% |
| Wage / Income Gap ($) | 5,212 | 69.90¢ per $1 |
| Gini / Inequality Index | 5,212 | 0.43 |
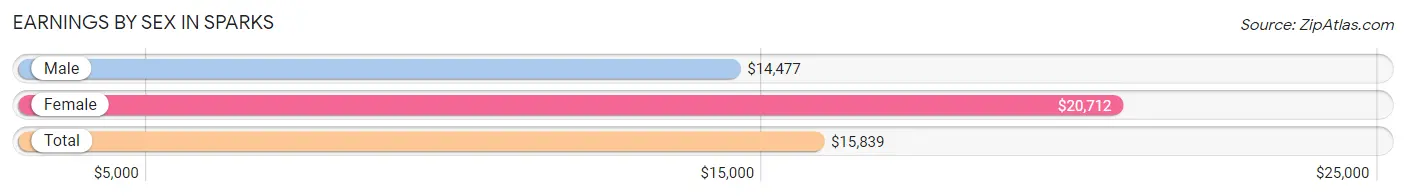
Earnings by Sex in Sparks
Average Earnings in Sparks are $15,839, $14,477 for men and $20,712 for women, a difference of 30.1%.
| Sex | Number | Average Earnings |
| Male | 1,531 (65.2%) | $14,477 |
| Female | 817 (34.8%) | $20,712 |
| Total | 2,348 (100.0%) | $15,839 |
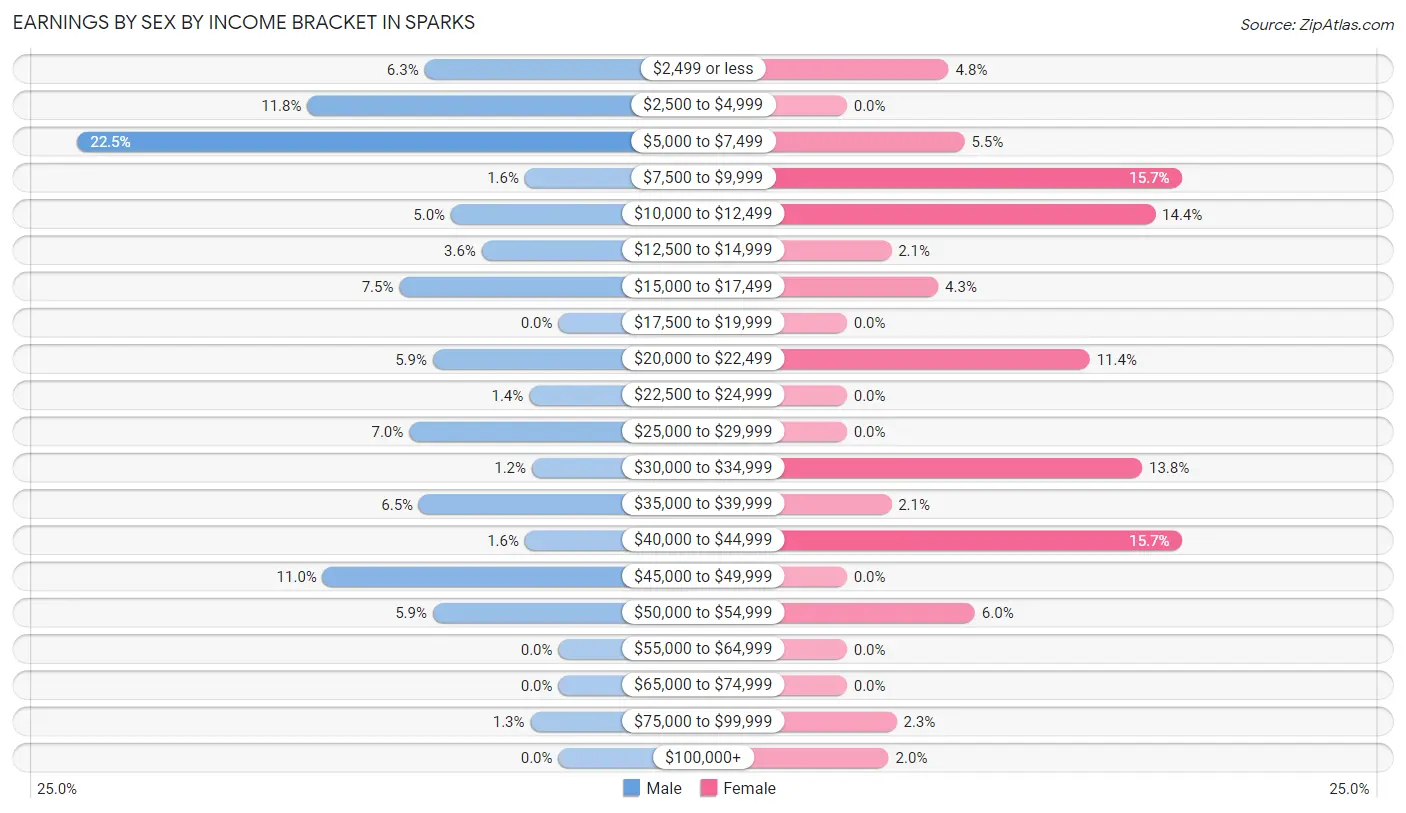
Earnings by Sex by Income Bracket in Sparks
The most common earnings brackets in Sparks are $5,000 to $7,499 for men (345 | 22.5%) and $7,500 to $9,999 for women (128 | 15.7%).
| Income | Male | Female |
| $2,499 or less | 96 (6.3%) | 39 (4.8%) |
| $2,500 to $4,999 | 180 (11.8%) | 0 (0.0%) |
| $5,000 to $7,499 | 345 (22.5%) | 45 (5.5%) |
| $7,500 to $9,999 | 24 (1.6%) | 128 (15.7%) |
| $10,000 to $12,499 | 77 (5.0%) | 118 (14.4%) |
| $12,500 to $14,999 | 55 (3.6%) | 17 (2.1%) |
| $15,000 to $17,499 | 114 (7.4%) | 35 (4.3%) |
| $17,500 to $19,999 | 0 (0.0%) | 0 (0.0%) |
| $20,000 to $22,499 | 90 (5.9%) | 93 (11.4%) |
| $22,500 to $24,999 | 21 (1.4%) | 0 (0.0%) |
| $25,000 to $29,999 | 107 (7.0%) | 0 (0.0%) |
| $30,000 to $34,999 | 19 (1.2%) | 113 (13.8%) |
| $35,000 to $39,999 | 100 (6.5%) | 17 (2.1%) |
| $40,000 to $44,999 | 24 (1.6%) | 128 (15.7%) |
| $45,000 to $49,999 | 169 (11.0%) | 0 (0.0%) |
| $50,000 to $54,999 | 90 (5.9%) | 49 (6.0%) |
| $55,000 to $64,999 | 0 (0.0%) | 0 (0.0%) |
| $65,000 to $74,999 | 0 (0.0%) | 0 (0.0%) |
| $75,000 to $99,999 | 20 (1.3%) | 19 (2.3%) |
| $100,000+ | 0 (0.0%) | 16 (2.0%) |
| Total | 1,531 (100.0%) | 817 (100.0%) |
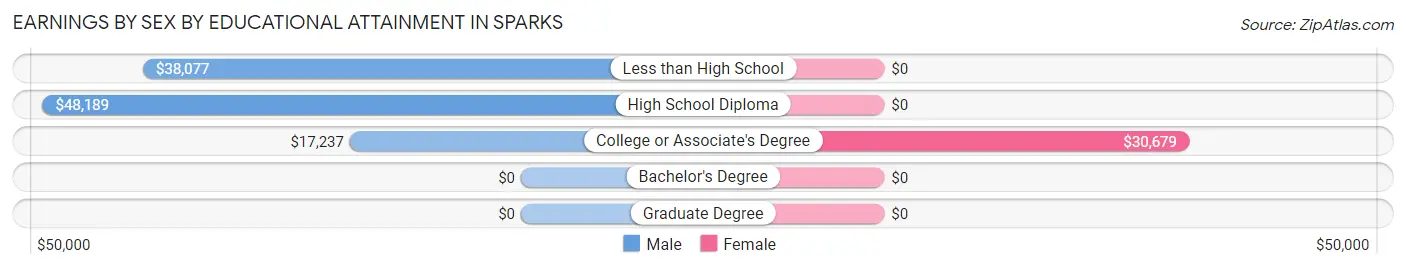
Earnings by Sex by Educational Attainment in Sparks
Average earnings in Sparks are $26,716 for men and $21,075 for women, a difference of 21.1%. Men with an educational attainment of high school diploma enjoy the highest average annual earnings of $48,189, while those with college or associate's degree education earn the least with $17,237. Women with an educational attainment of college or associate's degree earn the most with the average annual earnings of $30,679, while those with college or associate's degree education have the smallest earnings of $30,679.
| Educational Attainment | Male Income | Female Income |
| Less than High School | $38,077 | $0 |
| High School Diploma | $48,189 | $0 |
| College or Associate's Degree | $17,237 | $30,679 |
| Bachelor's Degree | - | - |
| Graduate Degree | - | - |
| Total | $26,716 | $21,075 |
Family Income in Sparks
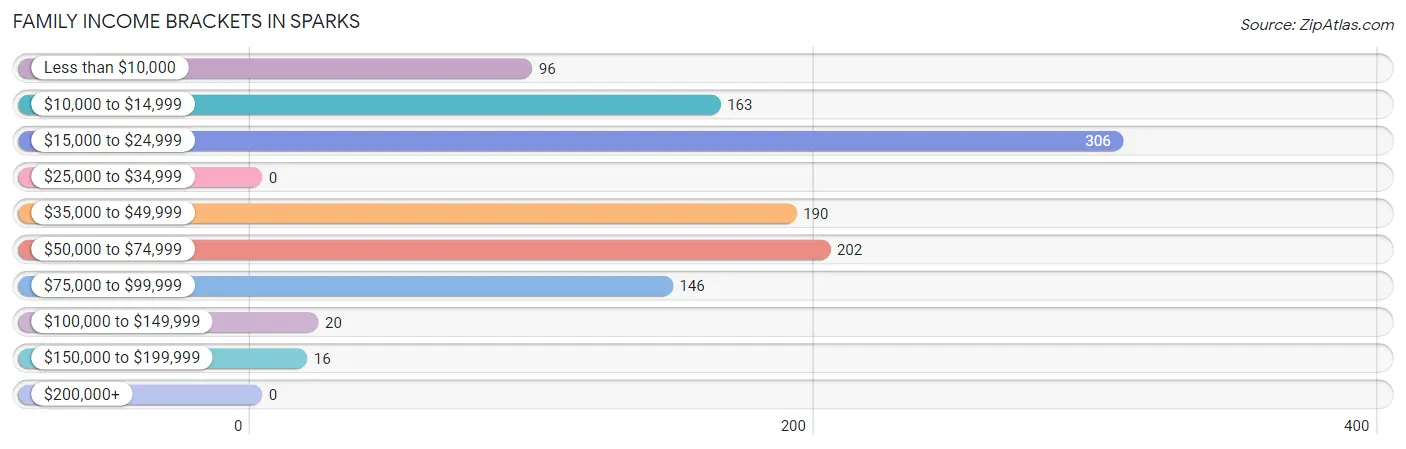
Family Income Brackets in Sparks
According to the Sparks family income data, there are 306 families falling into the $15,000 to $24,999 income range, which is the most common income bracket and makes up 26.9% of all families.
| Income Bracket | # Families | % Families |
| Less than $10,000 | 96 | 8.4% |
| $10,000 to $14,999 | 163 | 14.3% |
| $15,000 to $24,999 | 306 | 26.9% |
| $25,000 to $34,999 | 0 | 0.0% |
| $35,000 to $49,999 | 190 | 16.7% |
| $50,000 to $74,999 | 202 | 17.8% |
| $75,000 to $99,999 | 146 | 12.8% |
| $100,000 to $149,999 | 20 | 1.8% |
| $150,000 to $199,999 | 16 | 1.4% |
| $200,000+ | 0 | 0.0% |
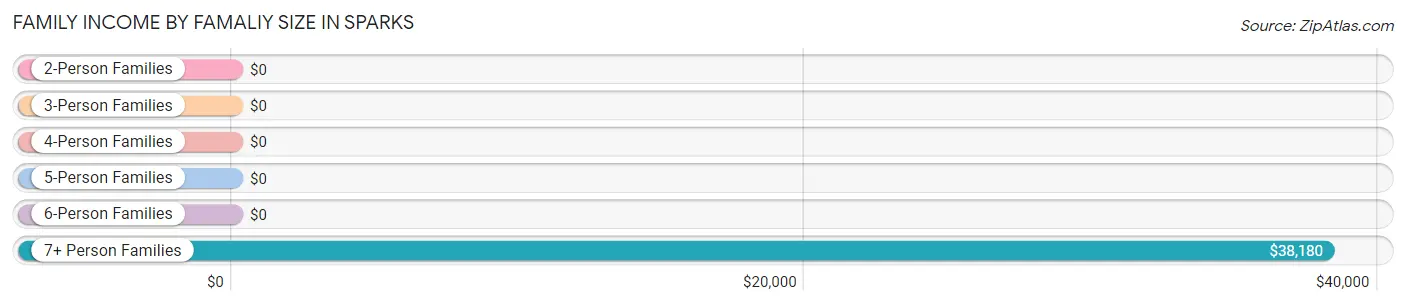
Family Income by Famaliy Size in Sparks
7+ person families (111 | 9.8%) account for the highest median family income in Sparks with $38,180 per family, while 7+ person families (111 | 9.8%) have the highest median income of $5,454 per family member.
| Income Bracket | # Families | Median Income |
| 2-Person Families | 186 (16.4%) | $0 |
| 3-Person Families | 364 (32.0%) | $0 |
| 4-Person Families | 211 (18.6%) | $0 |
| 5-Person Families | 233 (20.5%) | $0 |
| 6-Person Families | 32 (2.8%) | $0 |
| 7+ Person Families | 111 (9.8%) | $38,180 |
| Total | 1,137 (100.0%) | $35,281 |
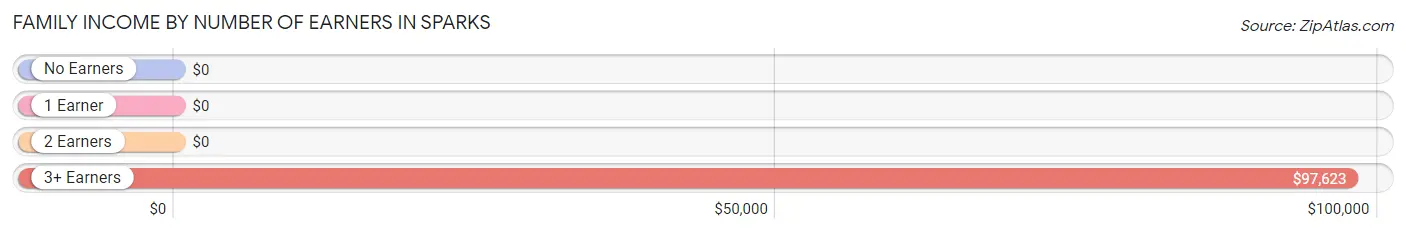
Family Income by Number of Earners in Sparks
| Number of Earners | # Families | Median Income |
| No Earners | 153 (13.5%) | $0 |
| 1 Earner | 415 (36.5%) | $0 |
| 2 Earners | 432 (38.0%) | $0 |
| 3+ Earners | 137 (12.0%) | $97,623 |
| Total | 1,137 (100.0%) | $35,281 |
Household Income in Sparks
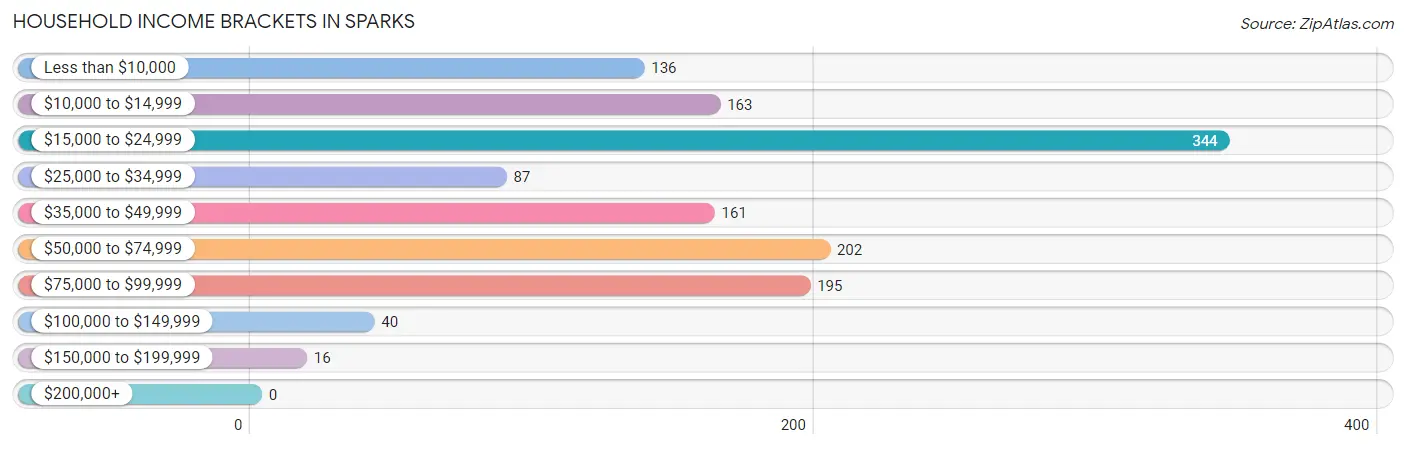
Household Income Brackets in Sparks
With 344 households falling in the category, the $15,000 to $24,999 income range is the most frequent in Sparks, accounting for 25.6% of all households.
| Income Bracket | # Households | % Households |
| Less than $10,000 | 136 | 10.1% |
| $10,000 to $14,999 | 163 | 12.1% |
| $15,000 to $24,999 | 344 | 25.6% |
| $25,000 to $34,999 | 87 | 6.5% |
| $35,000 to $49,999 | 161 | 12.0% |
| $50,000 to $74,999 | 202 | 15.0% |
| $75,000 to $99,999 | 195 | 14.5% |
| $100,000 to $149,999 | 40 | 3.0% |
| $150,000 to $199,999 | 16 | 1.2% |
| $200,000+ | 0 | 0.0% |
Household Income by Householder Age in Sparks
The median household income in Sparks is $30,848, with the highest median household income of $42,260 found in the 45 to 64 years age bracket for the primary householder. A total of 663 households (49.3%) fall into this category.
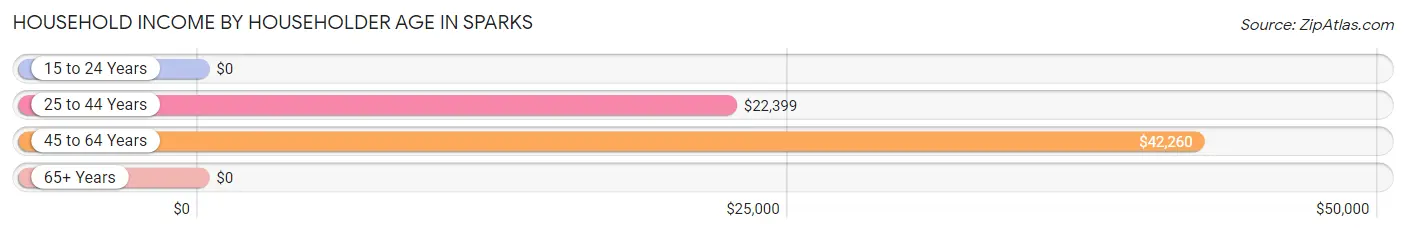
| Income Bracket | # Households | Median Income |
| 15 to 24 Years | 0 (0.0%) | $0 |
| 25 to 44 Years | 552 (41.0%) | $22,399 |
| 45 to 64 Years | 663 (49.3%) | $42,260 |
| 65+ Years | 130 (9.7%) | $0 |
| Total | 1,345 (100.0%) | $30,848 |
Poverty in Sparks
Income Below Poverty by Sex and Age in Sparks
With 53.4% poverty level for males and 63.5% for females among the residents of Sparks, 6 to 11 year old males and 5 year old females are the most vulnerable to poverty, with 47 males (100.0%) and 127 females (100.0%) in their respective age groups living below the poverty level.
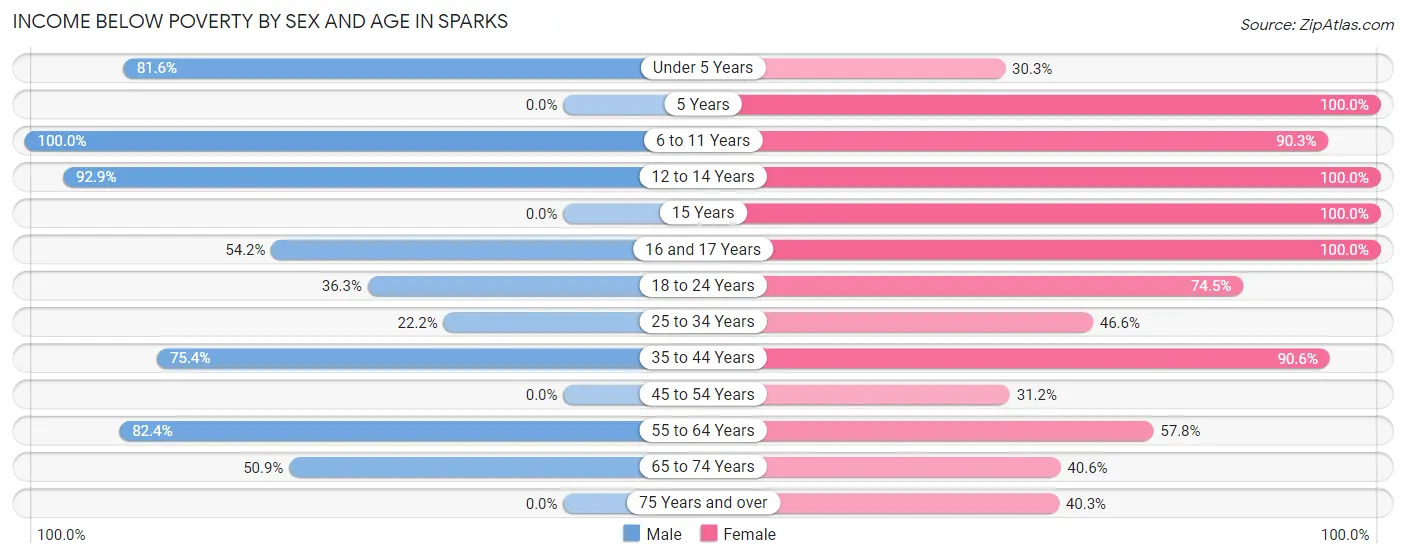
| Age Bracket | Male | Female |
| Under 5 Years | 102 (81.6%) | 67 (30.3%) |
| 5 Years | 0 (0.0%) | 127 (100.0%) |
| 6 to 11 Years | 47 (100.0%) | 149 (90.3%) |
| 12 to 14 Years | 455 (92.9%) | 213 (100.0%) |
| 15 Years | 0 (0.0%) | 14 (100.0%) |
| 16 and 17 Years | 155 (54.2%) | 142 (100.0%) |
| 18 to 24 Years | 221 (36.3%) | 73 (74.5%) |
| 25 to 34 Years | 50 (22.2%) | 130 (46.6%) |
| 35 to 44 Years | 178 (75.4%) | 307 (90.6%) |
| 45 to 54 Years | 0 (0.0%) | 131 (31.2%) |
| 55 to 64 Years | 197 (82.4%) | 96 (57.8%) |
| 65 to 74 Years | 57 (50.9%) | 56 (40.6%) |
| 75 Years and over | 0 (0.0%) | 54 (40.3%) |
| Total | 1,462 (53.4%) | 1,559 (63.5%) |
Income Above Poverty by Sex and Age in Sparks
According to the poverty statistics in Sparks, males aged 15 years and females aged under 5 years are the age groups that are most secure financially, with 100.0% of males and 69.7% of females in these age groups living above the poverty line.
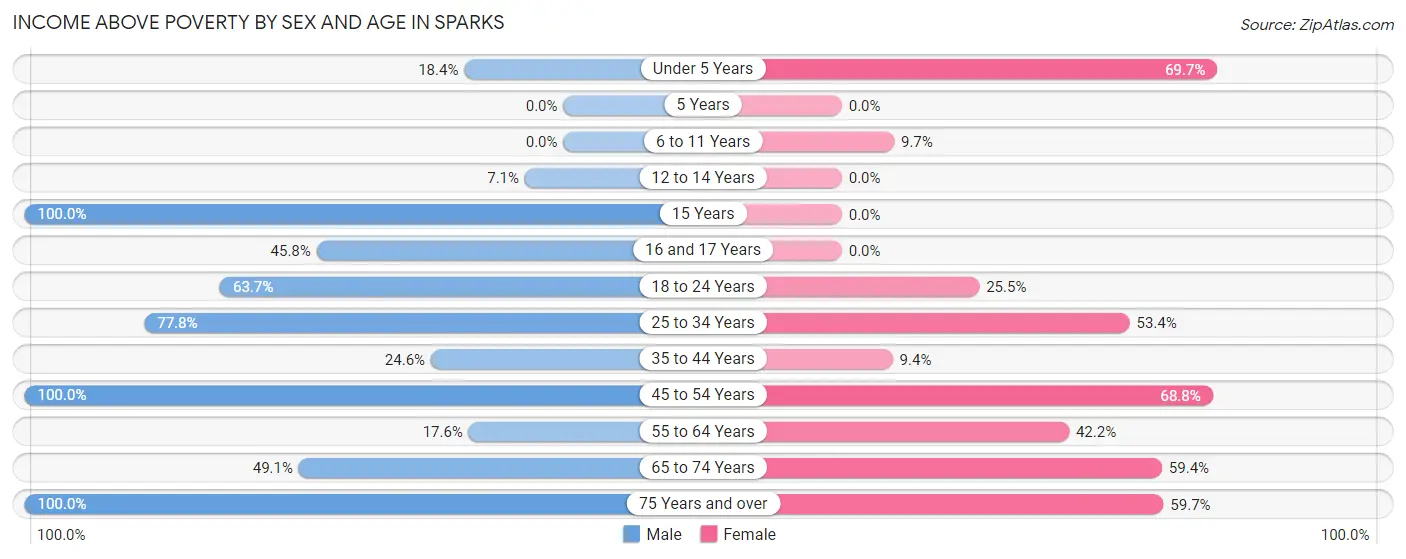
| Age Bracket | Male | Female |
| Under 5 Years | 23 (18.4%) | 154 (69.7%) |
| 5 Years | 0 (0.0%) | 0 (0.0%) |
| 6 to 11 Years | 0 (0.0%) | 16 (9.7%) |
| 12 to 14 Years | 35 (7.1%) | 0 (0.0%) |
| 15 Years | 21 (100.0%) | 0 (0.0%) |
| 16 and 17 Years | 131 (45.8%) | 0 (0.0%) |
| 18 to 24 Years | 388 (63.7%) | 25 (25.5%) |
| 25 to 34 Years | 175 (77.8%) | 149 (53.4%) |
| 35 to 44 Years | 58 (24.6%) | 32 (9.4%) |
| 45 to 54 Years | 279 (100.0%) | 289 (68.8%) |
| 55 to 64 Years | 42 (17.6%) | 70 (42.2%) |
| 65 to 74 Years | 55 (49.1%) | 82 (59.4%) |
| 75 Years and over | 70 (100.0%) | 80 (59.7%) |
| Total | 1,277 (46.6%) | 897 (36.5%) |
Income Below Poverty Among Married-Couple Families in Sparks
The poverty statistics for married-couple families in Sparks show that 61.8% or 435 of the total 704 families live below the poverty line. Families with 5 or more children have the highest poverty rate of 100.0%, comprising of 57 families. On the other hand, families with 1 or 2 children have the lowest poverty rate of 50.5%, which includes 104 families.
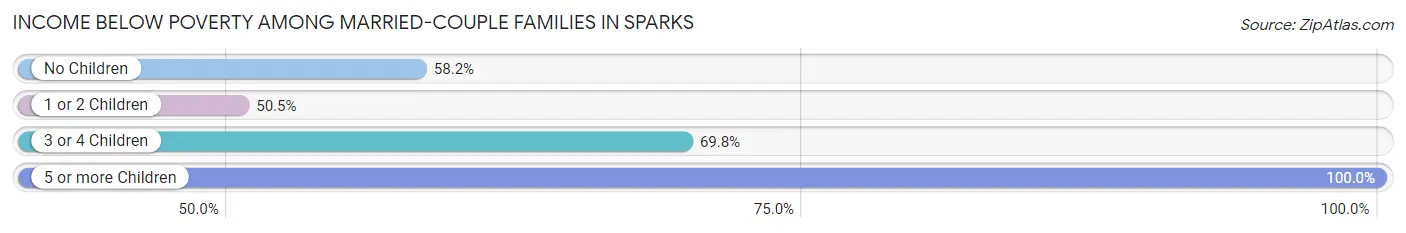
| Children | Above Poverty | Below Poverty |
| No Children | 122 (41.8%) | 170 (58.2%) |
| 1 or 2 Children | 102 (49.5%) | 104 (50.5%) |
| 3 or 4 Children | 45 (30.2%) | 104 (69.8%) |
| 5 or more Children | 0 (0.0%) | 57 (100.0%) |
| Total | 269 (38.2%) | 435 (61.8%) |
Income Below Poverty Among Single-Parent Households in Sparks
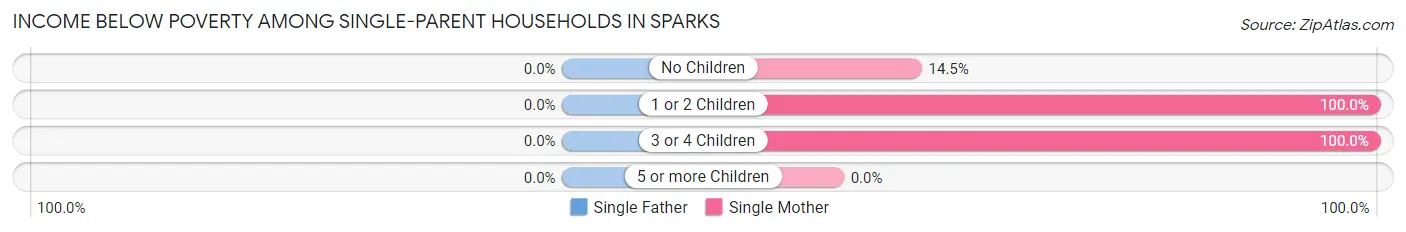
| Children | Single Father | Single Mother |
| No Children | 0 (0.0%) | 18 (14.5%) |
| 1 or 2 Children | 0 (0.0%) | 104 (100.0%) |
| 3 or 4 Children | 0 (0.0%) | 118 (100.0%) |
| 5 or more Children | 0 (0.0%) | 0 (0.0%) |
| Total | 0 (0.0%) | 240 (69.4%) |
Income Below Poverty Among Married-Couple vs Single-Parent Households in Sparks
The poverty data for Sparks shows that 435 of the married-couple family households (61.8%) and 240 of the single-parent households (55.4%) are living below the poverty level. Within the married-couple family households, those with 5 or more children have the highest poverty rate, with 57 households (100.0%) falling below the poverty line. Among the single-parent households, those with 3 or 4 children have the highest poverty rate, with 118 household (100.0%) living below poverty.
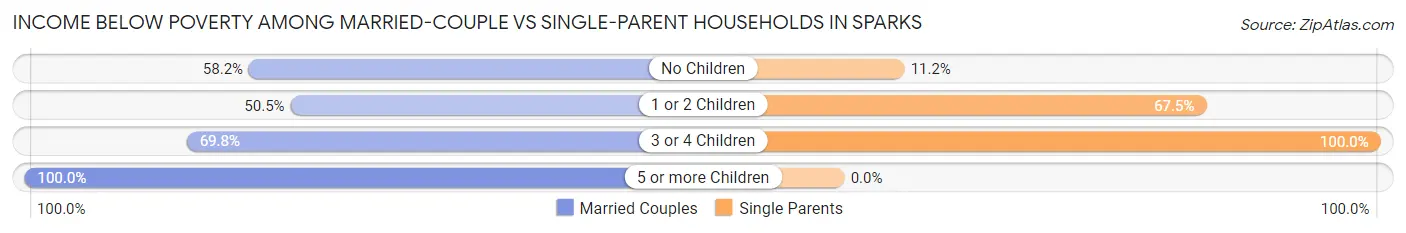
| Children | Married-Couple Families | Single-Parent Households |
| No Children | 170 (58.2%) | 18 (11.2%) |
| 1 or 2 Children | 104 (50.5%) | 104 (67.5%) |
| 3 or 4 Children | 104 (69.8%) | 118 (100.0%) |
| 5 or more Children | 57 (100.0%) | 0 (0.0%) |
| Total | 435 (61.8%) | 240 (55.4%) |
Race in Sparks
The most populous races in Sparks are Hispanic or Latino (5,195 | 99.7%), White / Caucasian (2,421 | 46.5%), and Some other Race (1,880 | 36.1%).
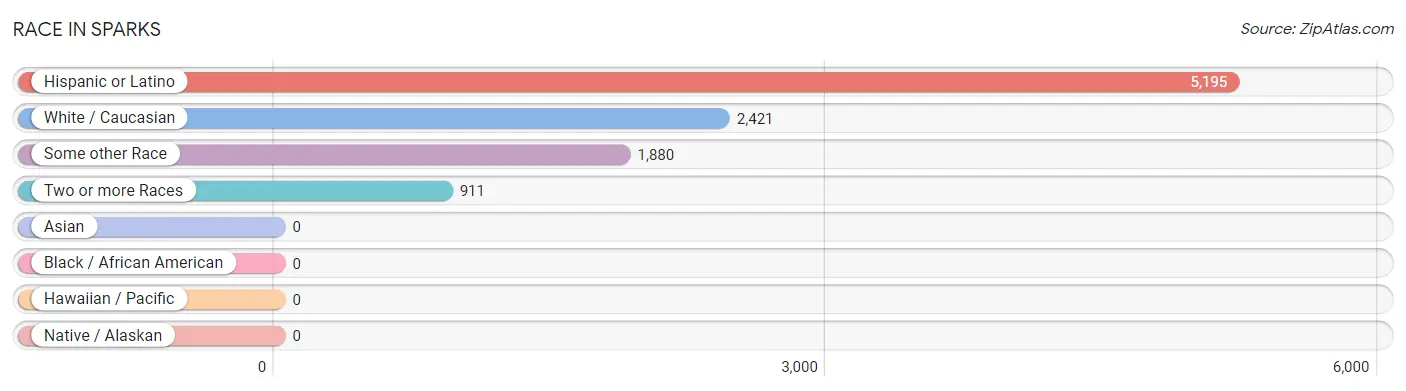
| Race | # Population | % Population |
| Asian | 0 | 0.0% |
| Black / African American | 0 | 0.0% |
| Hawaiian / Pacific | 0 | 0.0% |
| Hispanic or Latino | 5,195 | 99.7% |
| Native / Alaskan | 0 | 0.0% |
| White / Caucasian | 2,421 | 46.5% |
| Two or more Races | 911 | 17.5% |
| Some other Race | 1,880 | 36.1% |
| Total | 5,212 | 100.0% |
Ancestry in Sparks
The most populous ancestries reported in Sparks are , and Mexican (5,195 | 99.7%), together accounting for 99.7% of all Sparks residents.

| Ancestry | # Population | % Population |
| Mexican | 5,195 | 99.7% | View All 1 Rows |
Immigrants in Sparks
The most numerous immigrant groups reported in Sparks came from Central America (2,117 | 40.6%), Latin America (2,117 | 40.6%), and Mexico (2,117 | 40.6%), together accounting for 121.9% of all Sparks residents.
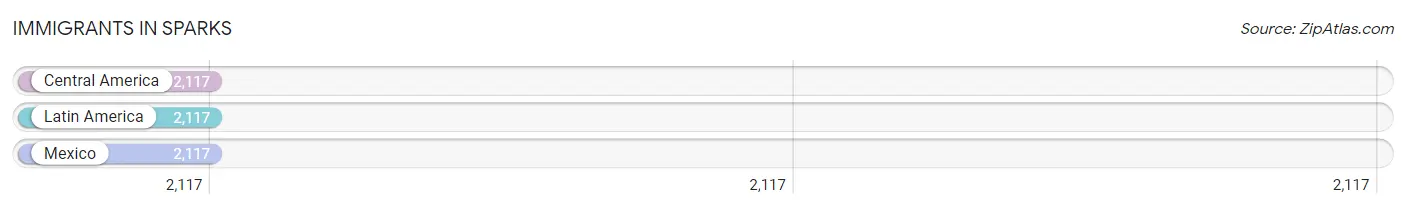
| Immigration Origin | # Population | % Population |
| Central America | 2,117 | 40.6% |
| Latin America | 2,117 | 40.6% |
| Mexico | 2,117 | 40.6% | View All 3 Rows |
Sex and Age in Sparks
Sex and Age in Sparks
The most populous age groups in Sparks are 10 to 14 Years (537 | 19.6%) for men and 50 to 54 Years (288 | 11.7%) for women.
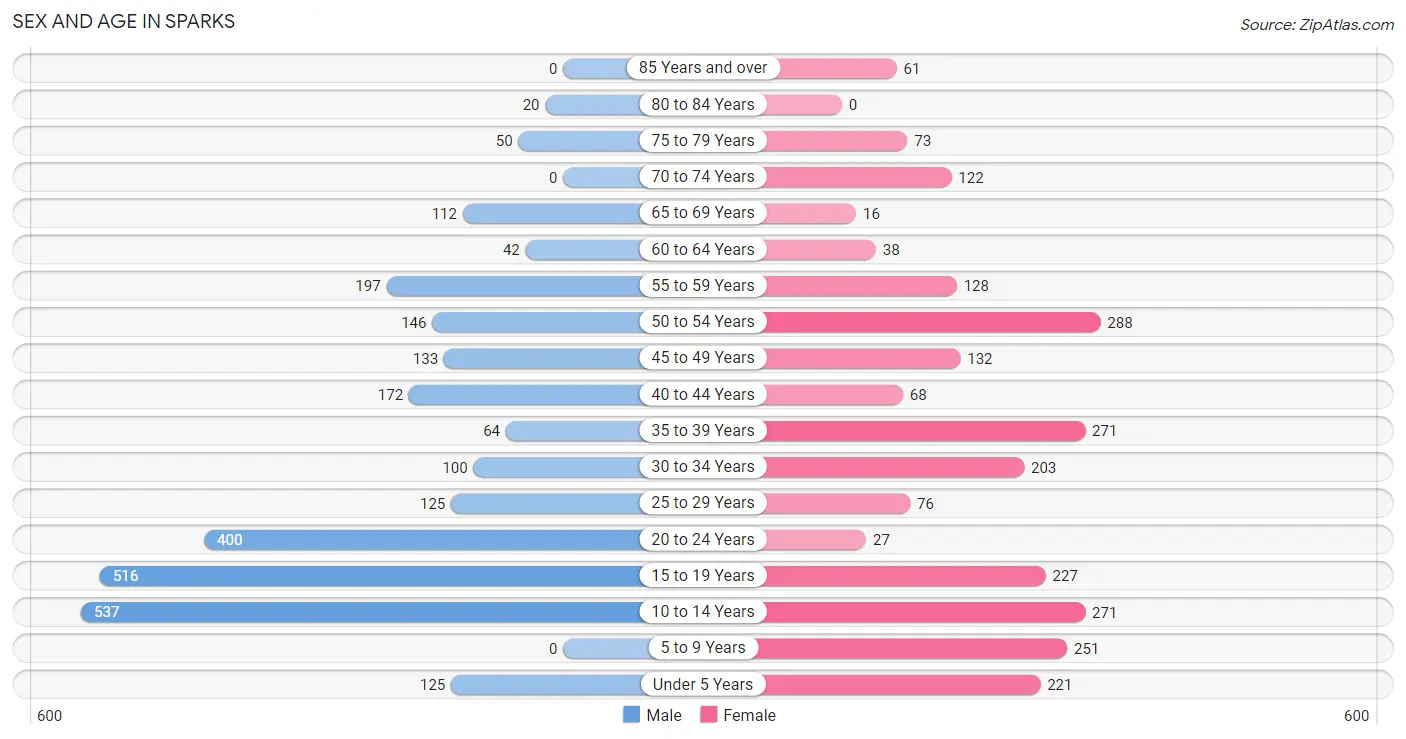
| Age Bracket | Male | Female |
| Under 5 Years | 125 (4.6%) | 221 (8.9%) |
| 5 to 9 Years | 0 (0.0%) | 251 (10.2%) |
| 10 to 14 Years | 537 (19.6%) | 271 (11.0%) |
| 15 to 19 Years | 516 (18.8%) | 227 (9.2%) |
| 20 to 24 Years | 400 (14.6%) | 27 (1.1%) |
| 25 to 29 Years | 125 (4.6%) | 76 (3.1%) |
| 30 to 34 Years | 100 (3.6%) | 203 (8.2%) |
| 35 to 39 Years | 64 (2.3%) | 271 (11.0%) |
| 40 to 44 Years | 172 (6.3%) | 68 (2.8%) |
| 45 to 49 Years | 133 (4.9%) | 132 (5.3%) |
| 50 to 54 Years | 146 (5.3%) | 288 (11.7%) |
| 55 to 59 Years | 197 (7.2%) | 128 (5.2%) |
| 60 to 64 Years | 42 (1.5%) | 38 (1.5%) |
| 65 to 69 Years | 112 (4.1%) | 16 (0.6%) |
| 70 to 74 Years | 0 (0.0%) | 122 (4.9%) |
| 75 to 79 Years | 50 (1.8%) | 73 (2.9%) |
| 80 to 84 Years | 20 (0.7%) | 0 (0.0%) |
| 85 Years and over | 0 (0.0%) | 61 (2.5%) |
| Total | 2,739 (100.0%) | 2,473 (100.0%) |
Families and Households in Sparks
Median Family Size in Sparks
The median family size in Sparks is 4.29 persons per family, with married-couple families (704 | 61.9%) accounting for the largest median family size of 4.54 persons per family. On the other hand, single male/father families (87 | 7.6%) represent the smallest median family size with 2.78 persons per family.
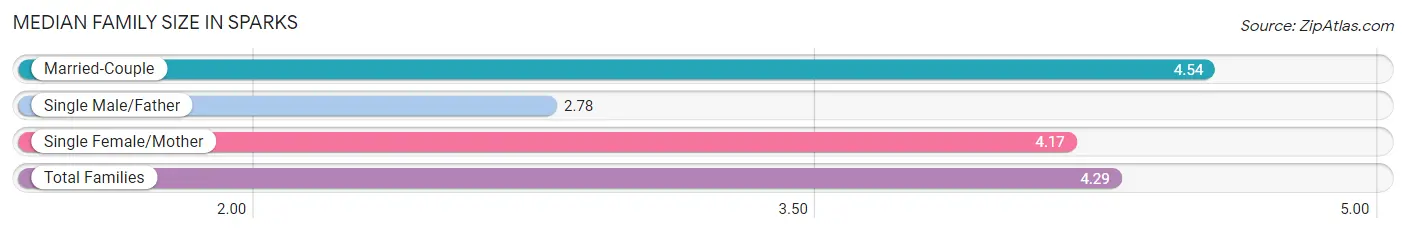
| Family Type | # Families | Family Size |
| Married-Couple | 704 (61.9%) | 4.54 |
| Single Male/Father | 87 (7.6%) | 2.78 |
| Single Female/Mother | 346 (30.4%) | 4.17 |
| Total Families | 1,137 (100.0%) | 4.29 |
Median Household Size in Sparks
The median household size in Sparks is 3.88 persons per household, with married-couple households (704 | 52.3%) accounting for the largest median household size of 4.54 persons per household. non-family households (208 | 15.5%) represent the smallest median household size with 1.30 persons per household.
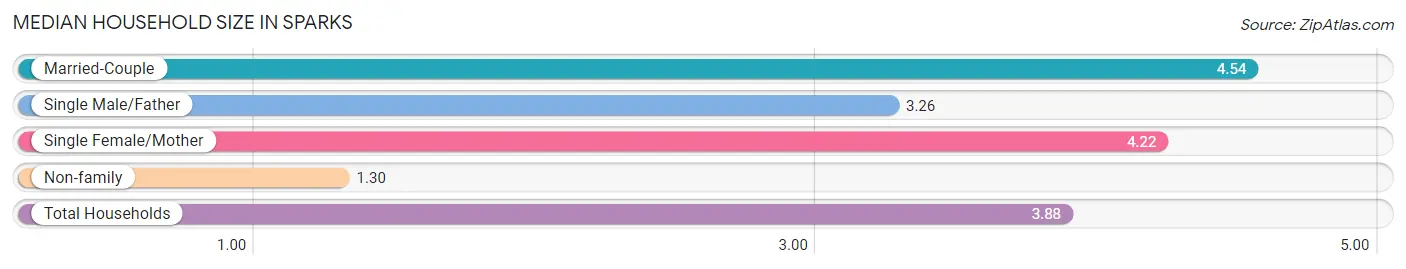
| Household Type | # Households | Household Size |
| Married-Couple | 704 (52.3%) | 4.54 |
| Single Male/Father | 87 (6.5%) | 3.26 |
| Single Female/Mother | 346 (25.7%) | 4.22 |
| Non-family | 208 (15.5%) | 1.30 |
| Total Households | 1,345 (100.0%) | 3.88 |
Household Size by Marriage Status in Sparks
Out of a total of 1,345 households in Sparks, 1,137 (84.5%) are family households, while 208 (15.5%) are nonfamily households. The most numerous type of family households are 3-person households, comprising 298, and the most common type of nonfamily households are 1-person households, comprising 147.
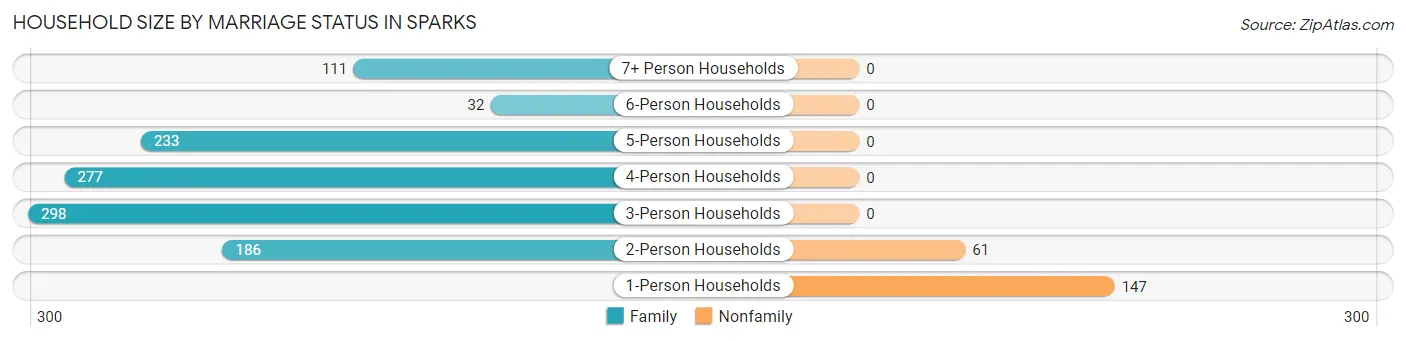
| Household Size | Family Households | Nonfamily Households |
| 1-Person Households | - | 147 (10.9%) |
| 2-Person Households | 186 (13.8%) | 61 (4.5%) |
| 3-Person Households | 298 (22.2%) | 0 (0.0%) |
| 4-Person Households | 277 (20.6%) | 0 (0.0%) |
| 5-Person Households | 233 (17.3%) | 0 (0.0%) |
| 6-Person Households | 32 (2.4%) | 0 (0.0%) |
| 7+ Person Households | 111 (8.3%) | 0 (0.0%) |
| Total | 1,137 (84.5%) | 208 (15.5%) |
Female Fertility in Sparks
Fertility by Age in Sparks
Average fertility rate in Sparks is 42.0 births per 1,000 women. Women in the age bracket of 20 to 34 years have the highest fertility rate with 150.0 births per 1,000 women. Women in the age bracket of 20 to 34 years acount for 100.0% of all women with births.
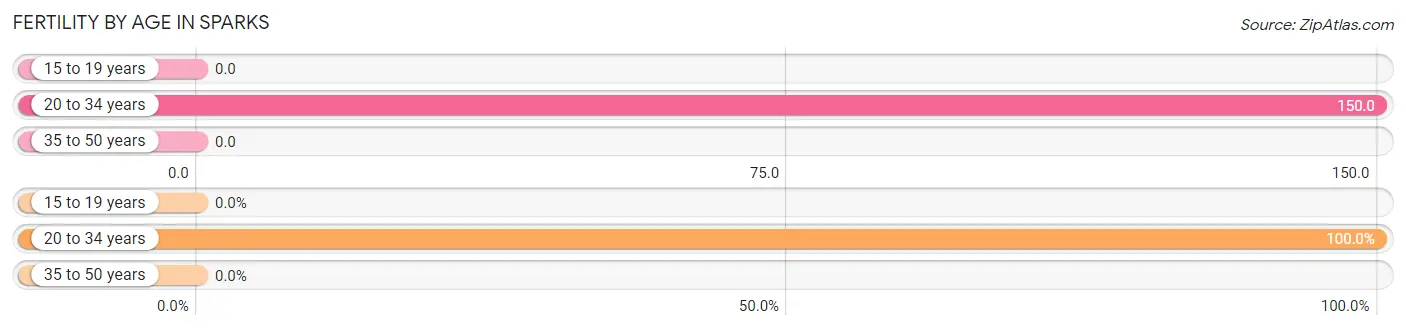
| Age Bracket | Women with Births | Births / 1,000 Women |
| 15 to 19 years | 0 (0.0%) | 0.0 |
| 20 to 34 years | 46 (100.0%) | 150.0 |
| 35 to 50 years | 0 (0.0%) | 0.0 |
| Total | 46 (100.0%) | 42.0 |
Fertility by Age by Marriage Status in Sparks
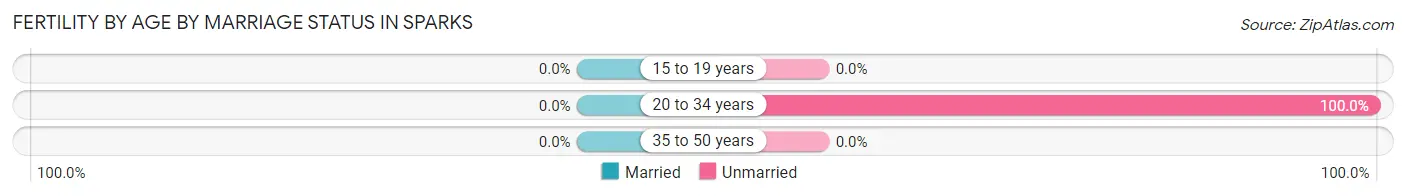
| Age Bracket | Married | Unmarried |
| 15 to 19 years | 0 (0.0%) | 0 (0.0%) |
| 20 to 34 years | 0 (0.0%) | 46 (100.0%) |
| 35 to 50 years | 0 (0.0%) | 0 (0.0%) |
| Total | 0 (0.0%) | 46 (100.0%) |
Fertility by Education in Sparks
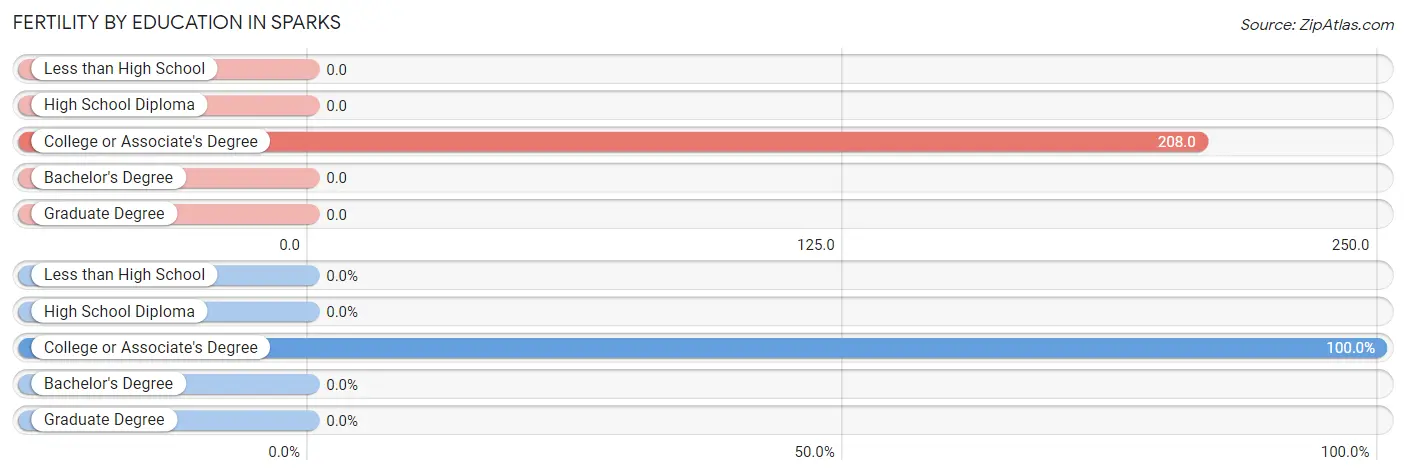
| Educational Attainment | Women with Births | Births / 1,000 Women |
| Less than High School | 0 (0.0%) | 0.0 |
| High School Diploma | 0 (0.0%) | 0.0 |
| College or Associate's Degree | 46 (100.0%) | 208.0 |
| Bachelor's Degree | 0 (0.0%) | 0.0 |
| Graduate Degree | 0 (0.0%) | 0.0 |
| Total | 46 (100.0%) | 42.0 |
Fertility by Education by Marriage Status in Sparks
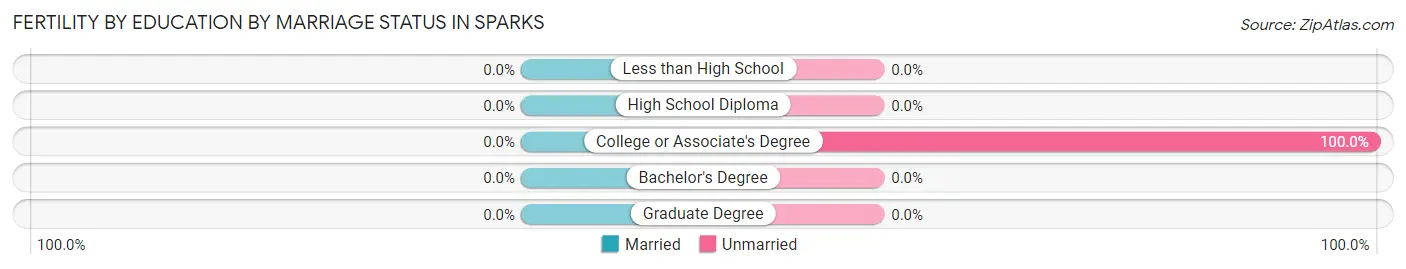
| Educational Attainment | Married | Unmarried |
| Less than High School | 0 (0.0%) | 0 (0.0%) |
| High School Diploma | 0 (0.0%) | 0 (0.0%) |
| College or Associate's Degree | 0 (0.0%) | 46 (100.0%) |
| Bachelor's Degree | 0 (0.0%) | 0 (0.0%) |
| Graduate Degree | 0 (0.0%) | 0 (0.0%) |
| Total | 0 (0.0%) | 46 (100.0%) |
Employment Characteristics in Sparks
Employment by Class of Employer in Sparks
Among the 1,977 employed individuals in Sparks, private company employees (1,331 | 67.3%), local government employees (236 | 11.9%), and state government employees (191 | 9.7%) make up the most common classes of employment.
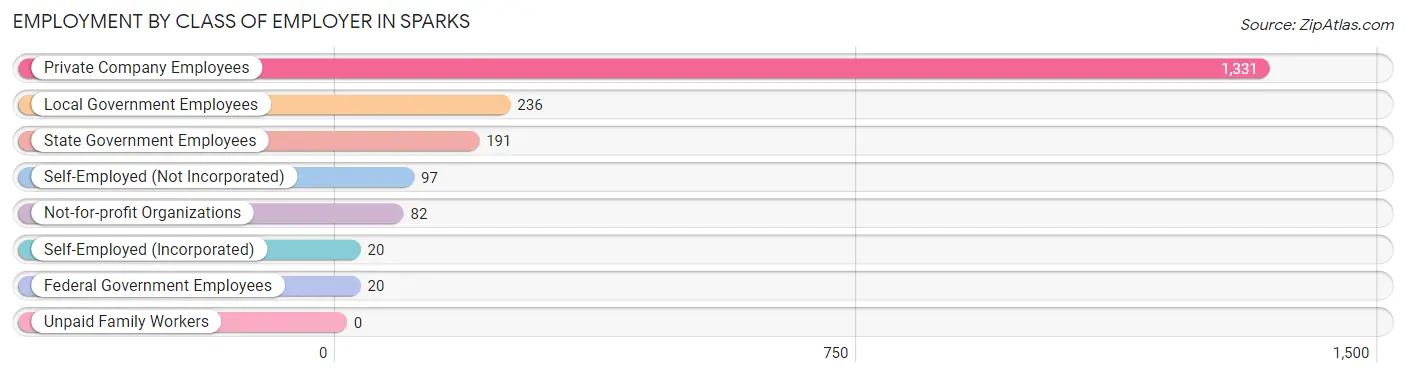
| Employer Class | # Employees | % Employees |
| Private Company Employees | 1,331 | 67.3% |
| Self-Employed (Incorporated) | 20 | 1.0% |
| Self-Employed (Not Incorporated) | 97 | 4.9% |
| Not-for-profit Organizations | 82 | 4.2% |
| Local Government Employees | 236 | 11.9% |
| State Government Employees | 191 | 9.7% |
| Federal Government Employees | 20 | 1.0% |
| Unpaid Family Workers | 0 | 0.0% |
| Total | 1,977 | 100.0% |
Employment Status by Age in Sparks
According to the labor force statistics for Sparks, out of the total population over 16 years of age (3,772), 60.7% or 2,290 individuals are in the labor force, with 10.7% or 245 of them unemployed. The age group with the highest labor force participation rate is 20 to 24 years, with 100.0% or 427 individuals in the labor force. Within the labor force, the 16 to 19 years age range has the highest percentage of unemployed individuals, with 69.3% or 156 of them being unemployed.
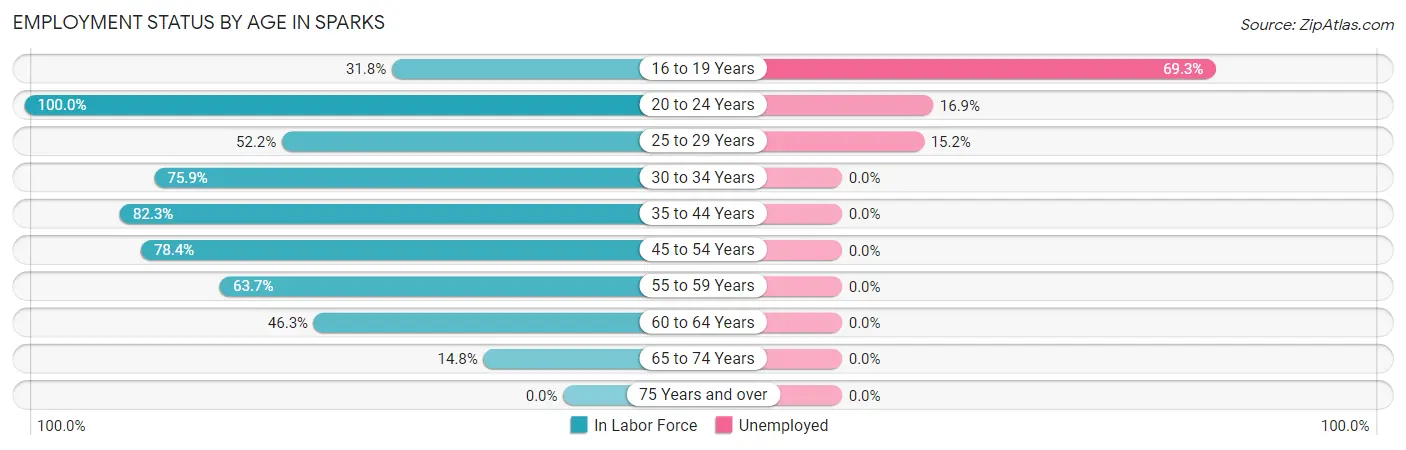
| Age Bracket | In Labor Force | Unemployed |
| 16 to 19 Years | 225 (31.8%) | 156 (69.3%) |
| 20 to 24 Years | 427 (100.0%) | 72 (16.9%) |
| 25 to 29 Years | 105 (52.2%) | 16 (15.2%) |
| 30 to 34 Years | 230 (75.9%) | 0 (0.0%) |
| 35 to 44 Years | 473 (82.3%) | 0 (0.0%) |
| 45 to 54 Years | 548 (78.4%) | 0 (0.0%) |
| 55 to 59 Years | 207 (63.7%) | 0 (0.0%) |
| 60 to 64 Years | 37 (46.3%) | 0 (0.0%) |
| 65 to 74 Years | 37 (14.8%) | 0 (0.0%) |
| 75 Years and over | 0 (0.0%) | 0 (0.0%) |
| Total | 2,290 (60.7%) | 245 (10.7%) |
Employment Status by Educational Attainment in Sparks
According to labor force statistics for Sparks, 73.3% of individuals (1,600) out of the total population between 25 and 64 years of age (2,183) are in the labor force, with 1.0% or 16 of them being unemployed. The group with the highest labor force participation rate are those with the educational attainment of bachelor's degree or higher, with 100.0% or 194 individuals in the labor force. Within the labor force, individuals with high school diploma education have the highest percentage of unemployment, with 3.8% or 16 of them being unemployed.
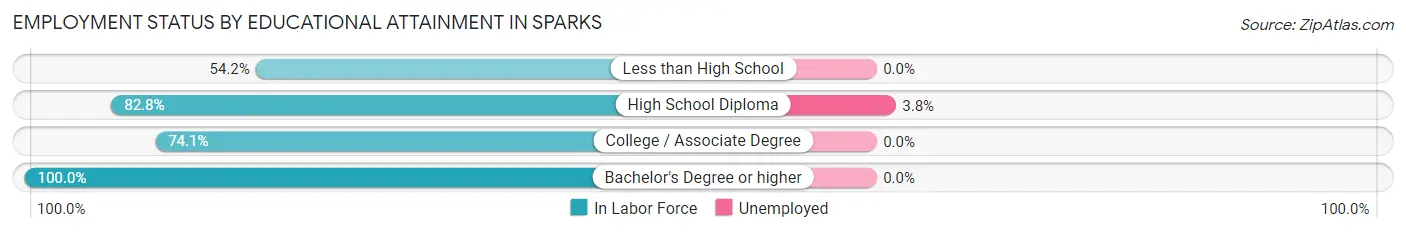
| Educational Attainment | In Labor Force | Unemployed |
| Less than High School | 303 (54.2%) | 0 (0.0%) |
| High School Diploma | 418 (82.8%) | 19 (3.8%) |
| College / Associate Degree | 685 (74.1%) | 0 (0.0%) |
| Bachelor's Degree or higher | 194 (100.0%) | 0 (0.0%) |
| Total | 1,600 (73.3%) | 22 (1.0%) |
Employment Occupations by Sex in Sparks
Management, Business, Science and Arts Occupations
The most common Management, Business, Science and Arts occupations in Sparks are Management (65 | 3.2%), Health Diagnosing & Treating (62 | 3.0%), Computers, Engineering & Science (20 | 1.0%), Architecture & Engineering (20 | 1.0%), and Community & Social Service (15 | 0.7%).
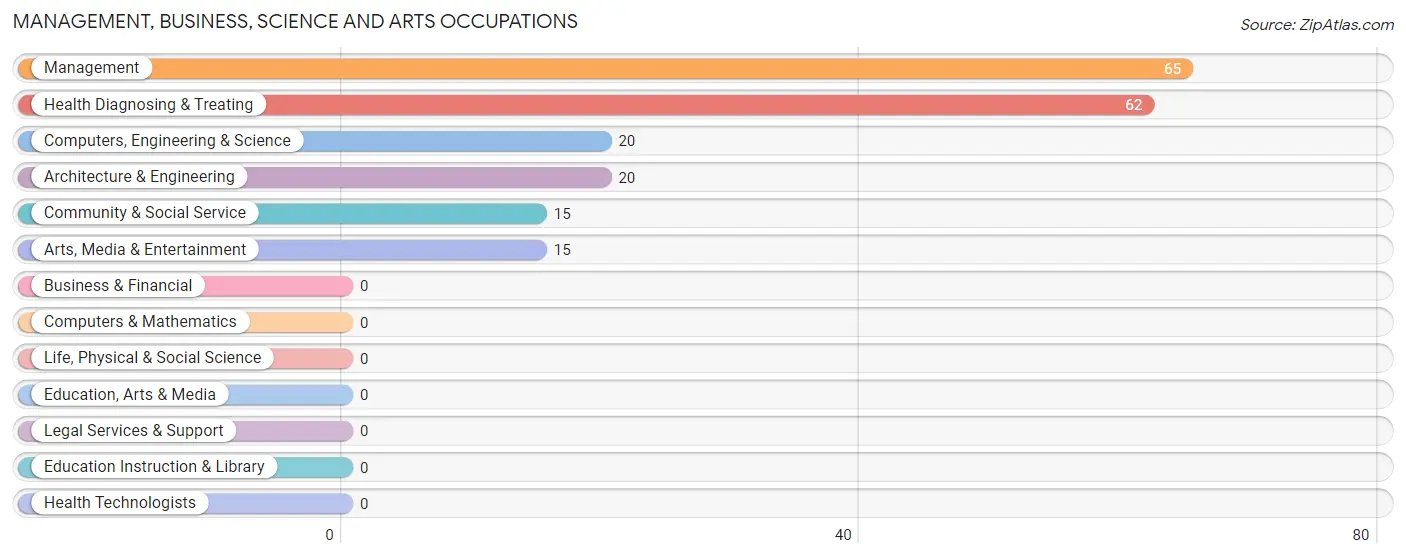
Management, Business, Science and Arts Occupations by Sex
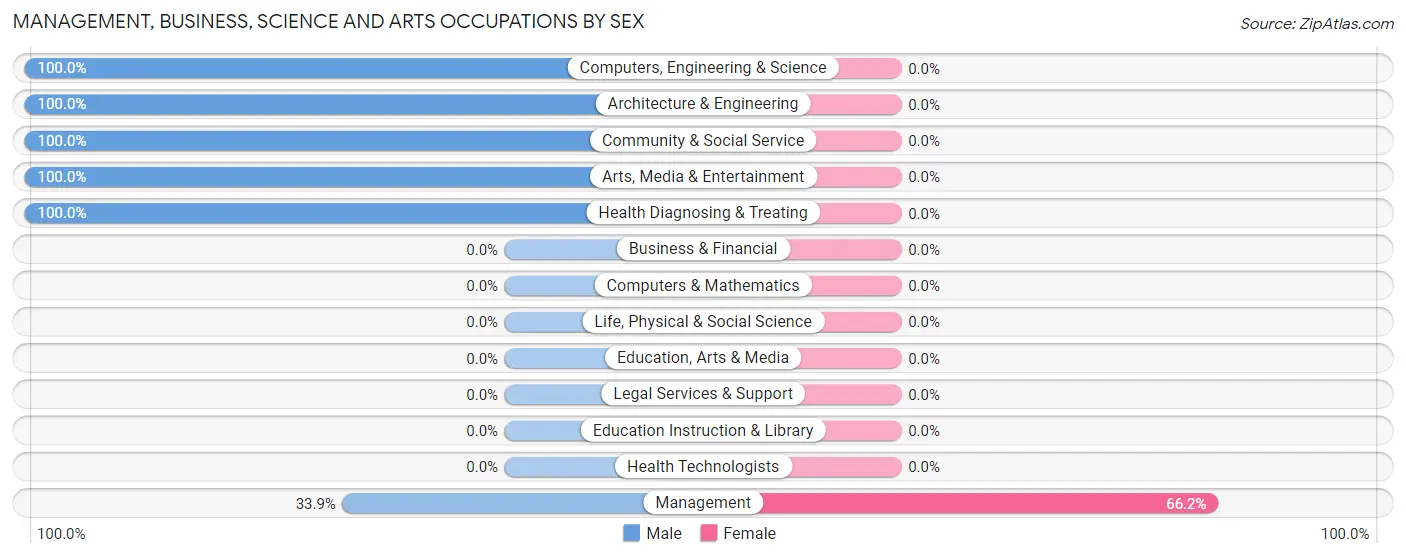
| Occupation | Male | Female |
| Management | 22 (33.9%) | 43 (66.1%) |
| Business & Financial | 0 (0.0%) | 0 (0.0%) |
| Computers, Engineering & Science | 20 (100.0%) | 0 (0.0%) |
| Computers & Mathematics | 0 (0.0%) | 0 (0.0%) |
| Architecture & Engineering | 20 (100.0%) | 0 (0.0%) |
| Life, Physical & Social Science | 0 (0.0%) | 0 (0.0%) |
| Community & Social Service | 15 (100.0%) | 0 (0.0%) |
| Education, Arts & Media | 0 (0.0%) | 0 (0.0%) |
| Legal Services & Support | 0 (0.0%) | 0 (0.0%) |
| Education Instruction & Library | 0 (0.0%) | 0 (0.0%) |
| Arts, Media & Entertainment | 15 (100.0%) | 0 (0.0%) |
| Health Diagnosing & Treating | 62 (100.0%) | 0 (0.0%) |
| Health Technologists | 0 (0.0%) | 0 (0.0%) |
| Total (Category) | 119 (73.5%) | 43 (26.5%) |
| Total (Overall) | 1,308 (64.0%) | 737 (36.0%) |
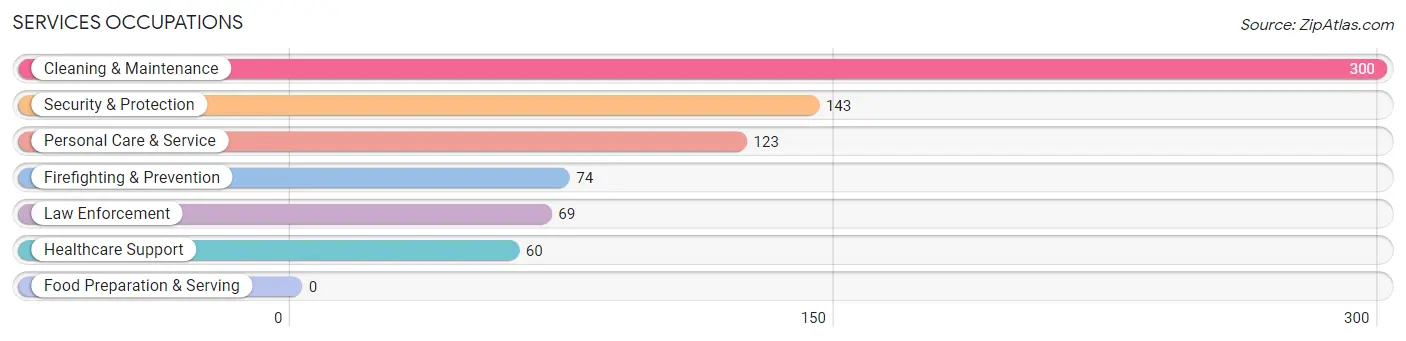
Services Occupations
The most common Services occupations in Sparks are Cleaning & Maintenance (300 | 14.7%), Security & Protection (143 | 7.0%), Personal Care & Service (123 | 6.0%), Firefighting & Prevention (74 | 3.6%), and Law Enforcement (69 | 3.4%).
Services Occupations by Sex
Within the Services occupations in Sparks, the most male-oriented occupations are Security & Protection (100.0%), Firefighting & Prevention (100.0%), and Law Enforcement (100.0%), while the most female-oriented occupations are Healthcare Support (100.0%), Personal Care & Service (45.5%), and Cleaning & Maintenance (43.7%).
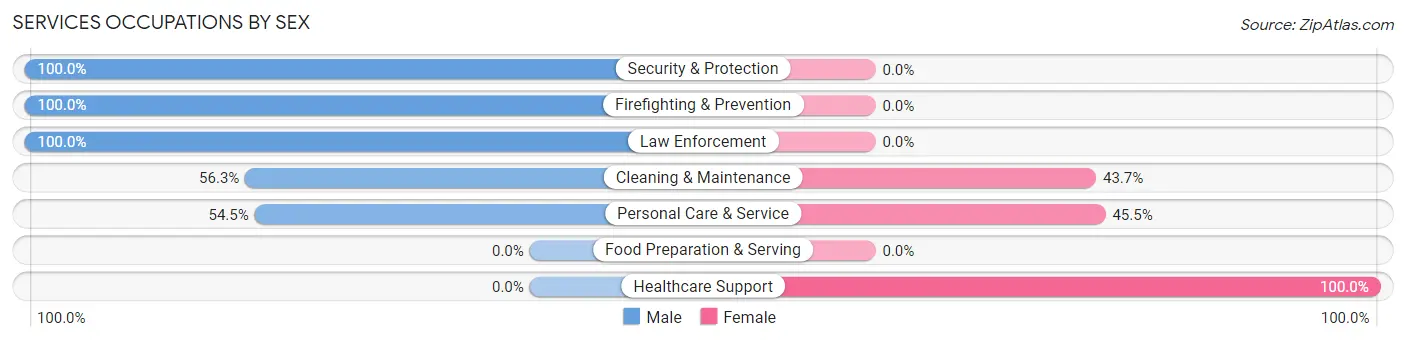
| Occupation | Male | Female |
| Healthcare Support | 0 (0.0%) | 60 (100.0%) |
| Security & Protection | 143 (100.0%) | 0 (0.0%) |
| Firefighting & Prevention | 74 (100.0%) | 0 (0.0%) |
| Law Enforcement | 69 (100.0%) | 0 (0.0%) |
| Food Preparation & Serving | 0 (0.0%) | 0 (0.0%) |
| Cleaning & Maintenance | 169 (56.3%) | 131 (43.7%) |
| Personal Care & Service | 67 (54.5%) | 56 (45.5%) |
| Total (Category) | 379 (60.5%) | 247 (39.5%) |
| Total (Overall) | 1,308 (64.0%) | 737 (36.0%) |
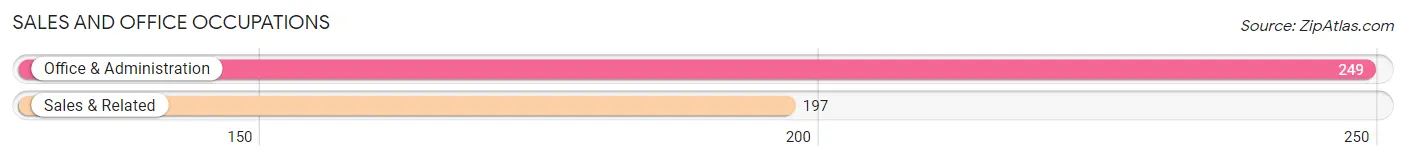
Sales and Office Occupations
The most common Sales and Office occupations in Sparks are Office & Administration (249 | 12.2%), and Sales & Related (197 | 9.6%).
Sales and Office Occupations by Sex
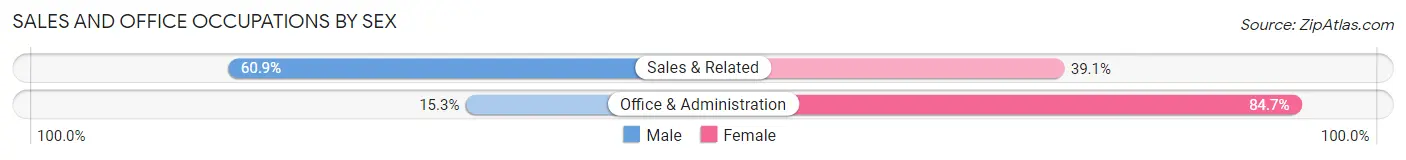
| Occupation | Male | Female |
| Sales & Related | 120 (60.9%) | 77 (39.1%) |
| Office & Administration | 38 (15.3%) | 211 (84.7%) |
| Total (Category) | 158 (35.4%) | 288 (64.6%) |
| Total (Overall) | 1,308 (64.0%) | 737 (36.0%) |
Natural Resources, Construction and Maintenance Occupations
The most common Natural Resources, Construction and Maintenance occupations in Sparks are Construction & Extraction (230 | 11.3%), and Installation, Maintenance & Repair (82 | 4.0%).
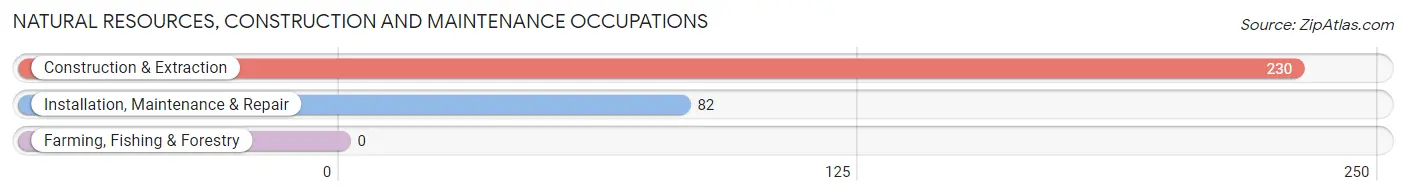
Natural Resources, Construction and Maintenance Occupations by Sex
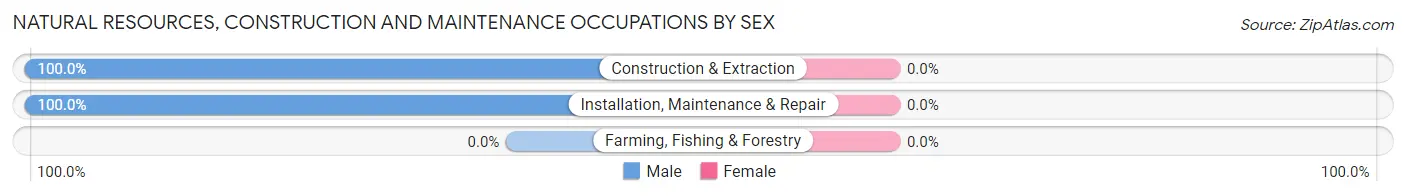
| Occupation | Male | Female |
| Farming, Fishing & Forestry | 0 (0.0%) | 0 (0.0%) |
| Construction & Extraction | 230 (100.0%) | 0 (0.0%) |
| Installation, Maintenance & Repair | 82 (100.0%) | 0 (0.0%) |
| Total (Category) | 312 (100.0%) | 0 (0.0%) |
| Total (Overall) | 1,308 (64.0%) | 737 (36.0%) |
Production, Transportation and Moving Occupations
The most common Production, Transportation and Moving occupations in Sparks are Transportation (204 | 10.0%), Material Moving (199 | 9.7%), and Production (96 | 4.7%).
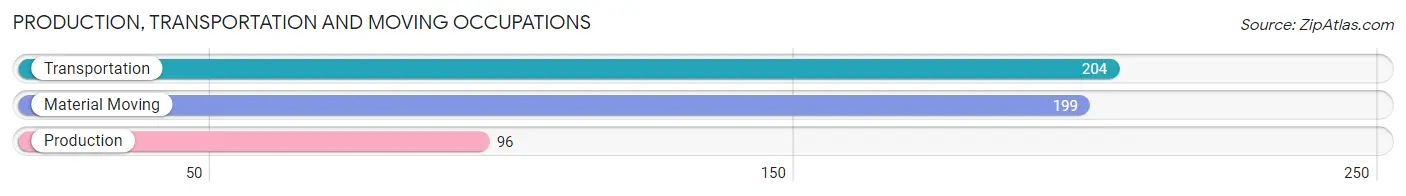
Production, Transportation and Moving Occupations by Sex
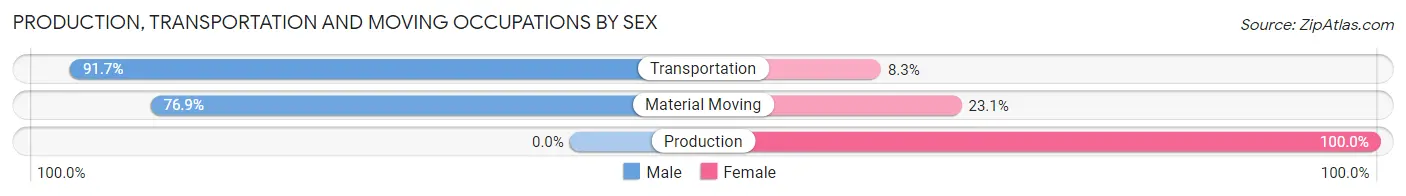
| Occupation | Male | Female |
| Production | 0 (0.0%) | 96 (100.0%) |
| Transportation | 187 (91.7%) | 17 (8.3%) |
| Material Moving | 153 (76.9%) | 46 (23.1%) |
| Total (Category) | 340 (68.1%) | 159 (31.9%) |
| Total (Overall) | 1,308 (64.0%) | 737 (36.0%) |
Employment Industries by Sex in Sparks
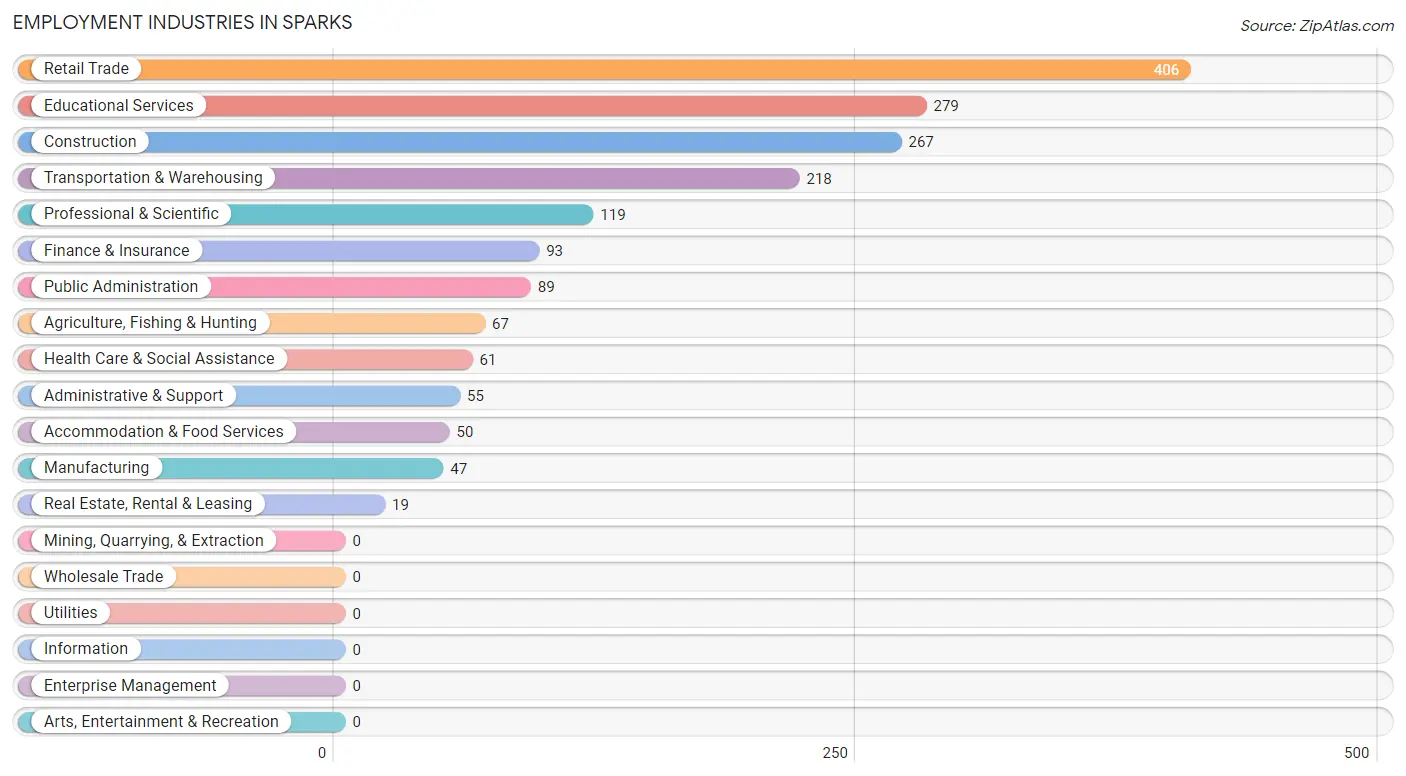
Employment Industries in Sparks
The major employment industries in Sparks include Retail Trade (406 | 19.9%), Educational Services (279 | 13.6%), Construction (267 | 13.1%), Transportation & Warehousing (218 | 10.7%), and Professional & Scientific (119 | 5.8%).
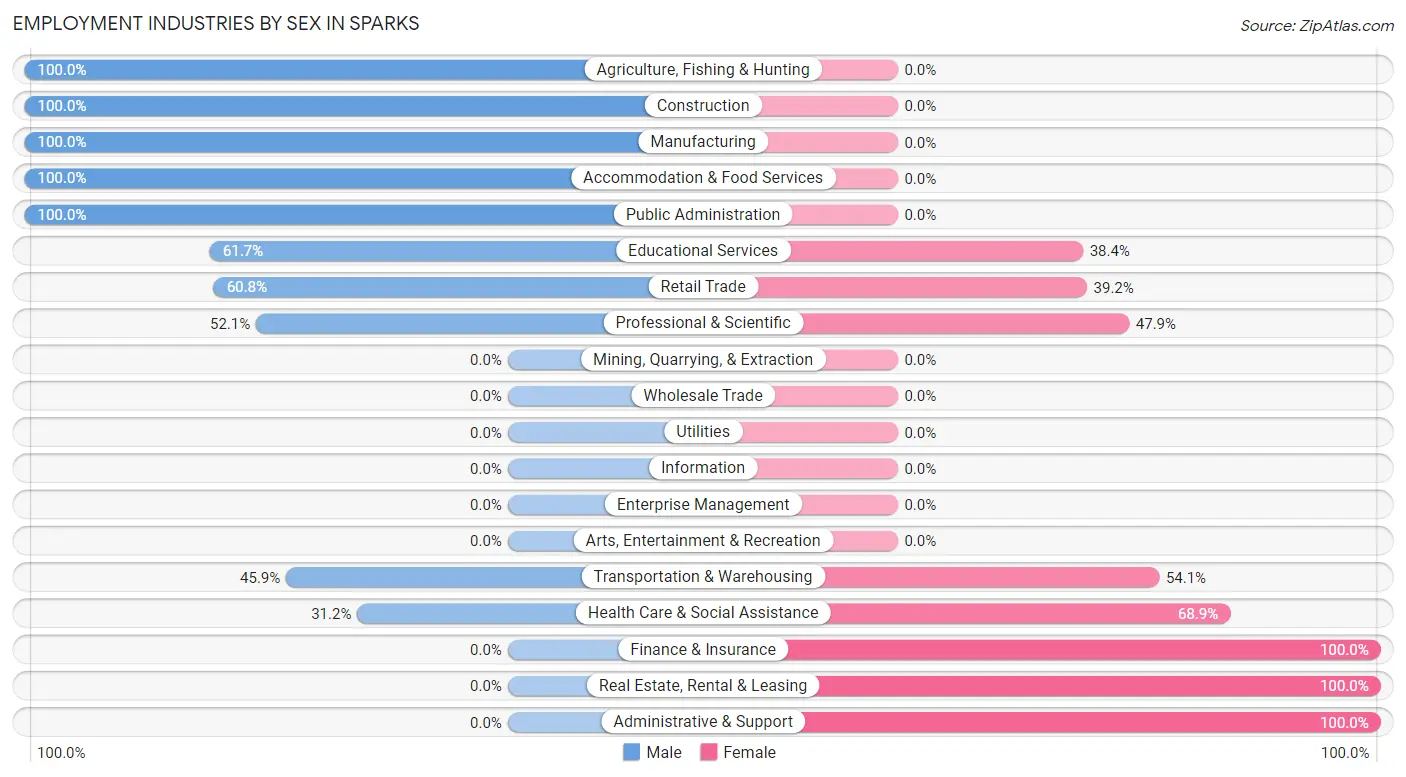
Employment Industries by Sex in Sparks
The Sparks industries that see more men than women are Agriculture, Fishing & Hunting (100.0%), Construction (100.0%), and Manufacturing (100.0%), whereas the industries that tend to have a higher number of women are Finance & Insurance (100.0%), Real Estate, Rental & Leasing (100.0%), and Administrative & Support (100.0%).
| Industry | Male | Female |
| Agriculture, Fishing & Hunting | 67 (100.0%) | 0 (0.0%) |
| Mining, Quarrying, & Extraction | 0 (0.0%) | 0 (0.0%) |
| Construction | 267 (100.0%) | 0 (0.0%) |
| Manufacturing | 47 (100.0%) | 0 (0.0%) |
| Wholesale Trade | 0 (0.0%) | 0 (0.0%) |
| Retail Trade | 247 (60.8%) | 159 (39.2%) |
| Transportation & Warehousing | 100 (45.9%) | 118 (54.1%) |
| Utilities | 0 (0.0%) | 0 (0.0%) |
| Information | 0 (0.0%) | 0 (0.0%) |
| Finance & Insurance | 0 (0.0%) | 93 (100.0%) |
| Real Estate, Rental & Leasing | 0 (0.0%) | 19 (100.0%) |
| Professional & Scientific | 62 (52.1%) | 57 (47.9%) |
| Enterprise Management | 0 (0.0%) | 0 (0.0%) |
| Administrative & Support | 0 (0.0%) | 55 (100.0%) |
| Educational Services | 172 (61.7%) | 107 (38.4%) |
| Health Care & Social Assistance | 19 (31.1%) | 42 (68.9%) |
| Arts, Entertainment & Recreation | 0 (0.0%) | 0 (0.0%) |
| Accommodation & Food Services | 50 (100.0%) | 0 (0.0%) |
| Public Administration | 89 (100.0%) | 0 (0.0%) |
| Total | 1,308 (64.0%) | 737 (36.0%) |
Education in Sparks
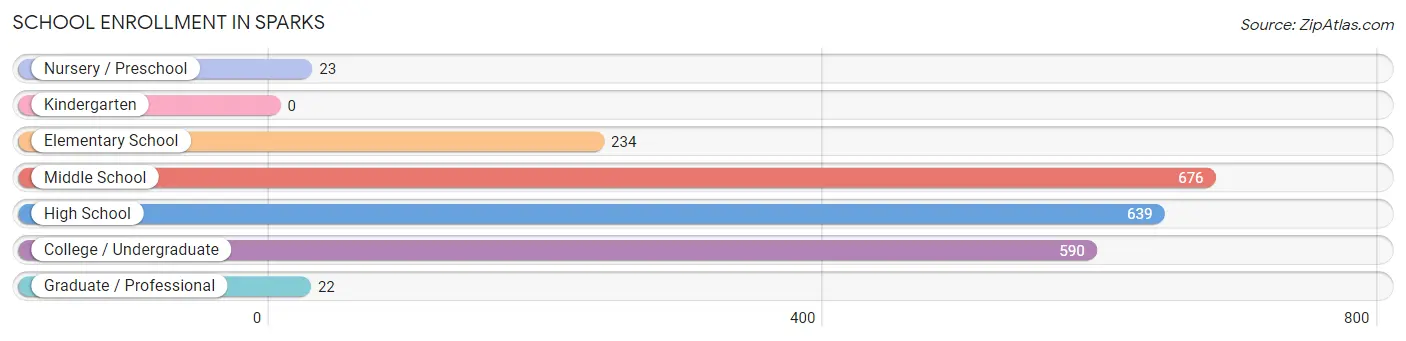
School Enrollment in Sparks
The most common levels of schooling among the 2,184 students in Sparks are middle school (676 | 30.9%), high school (639 | 29.3%), and college / undergraduate (590 | 27.0%).
| School Level | # Students | % Students |
| Nursery / Preschool | 23 | 1.1% |
| Kindergarten | 0 | 0.0% |
| Elementary School | 234 | 10.7% |
| Middle School | 676 | 30.9% |
| High School | 639 | 29.3% |
| College / Undergraduate | 590 | 27.0% |
| Graduate / Professional | 22 | 1.0% |
| Total | 2,184 | 100.0% |
School Enrollment by Age by Funding Source in Sparks
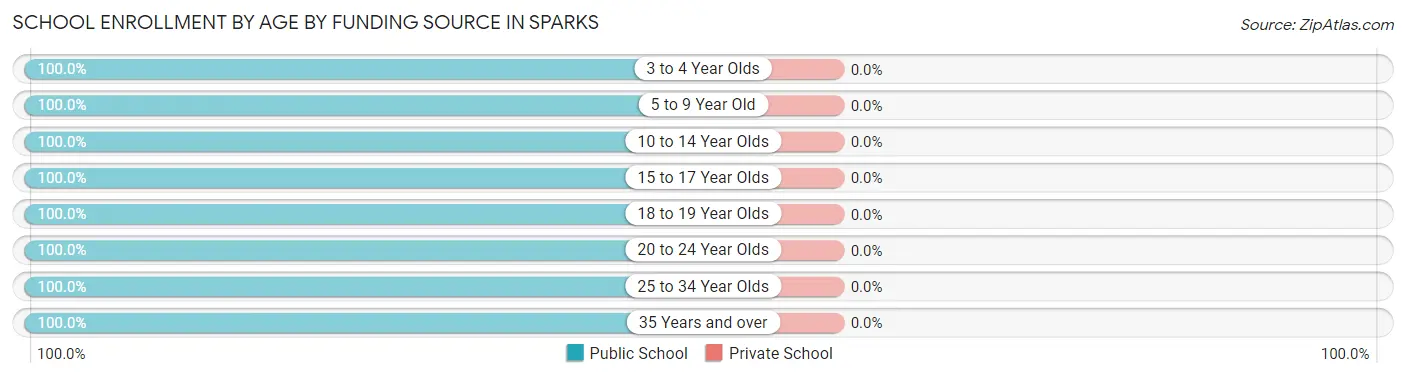
| Age Bracket | Public School | Private School |
| 3 to 4 Year Olds | 23 (100.0%) | 0 (0.0%) |
| 5 to 9 Year Old | 234 (100.0%) | 0 (0.0%) |
| 10 to 14 Year Olds | 808 (100.0%) | 0 (0.0%) |
| 15 to 17 Year Olds | 463 (100.0%) | 0 (0.0%) |
| 18 to 19 Year Olds | 140 (100.0%) | 0 (0.0%) |
| 20 to 24 Year Olds | 365 (100.0%) | 0 (0.0%) |
| 25 to 34 Year Olds | 102 (100.0%) | 0 (0.0%) |
| 35 Years and over | 49 (100.0%) | 0 (0.0%) |
| Total | 2,184 (100.0%) | 0 (0.0%) |
Educational Attainment by Field of Study in Sparks
Business (134 | 58.3%), education (41 | 17.8%), engineering (20 | 8.7%), literature & languages (20 | 8.7%), and visual & performing arts (15 | 6.5%) are the most common fields of study among 230 individuals in Sparks who have obtained a bachelor's degree or higher.
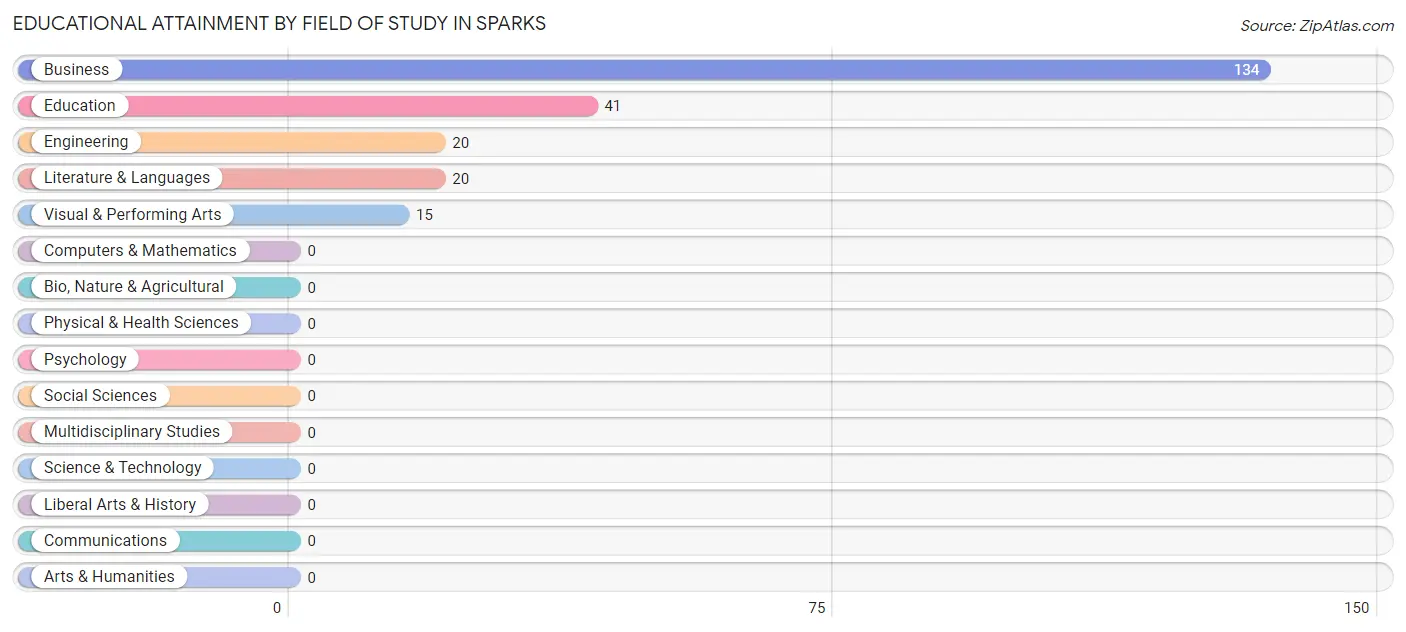
| Field of Study | # Graduates | % Graduates |
| Computers & Mathematics | 0 | 0.0% |
| Bio, Nature & Agricultural | 0 | 0.0% |
| Physical & Health Sciences | 0 | 0.0% |
| Psychology | 0 | 0.0% |
| Social Sciences | 0 | 0.0% |
| Engineering | 20 | 8.7% |
| Multidisciplinary Studies | 0 | 0.0% |
| Science & Technology | 0 | 0.0% |
| Business | 134 | 58.3% |
| Education | 41 | 17.8% |
| Literature & Languages | 20 | 8.7% |
| Liberal Arts & History | 0 | 0.0% |
| Visual & Performing Arts | 15 | 6.5% |
| Communications | 0 | 0.0% |
| Arts & Humanities | 0 | 0.0% |
| Total | 230 | 100.0% |
Transportation & Commute in Sparks
Vehicle Availability by Sex in Sparks
The most prevalent vehicle ownership categories in Sparks are males with 4 vehicles (537, accounting for 41.1%) and females with 4 vehicles (106, making up 80.3%).
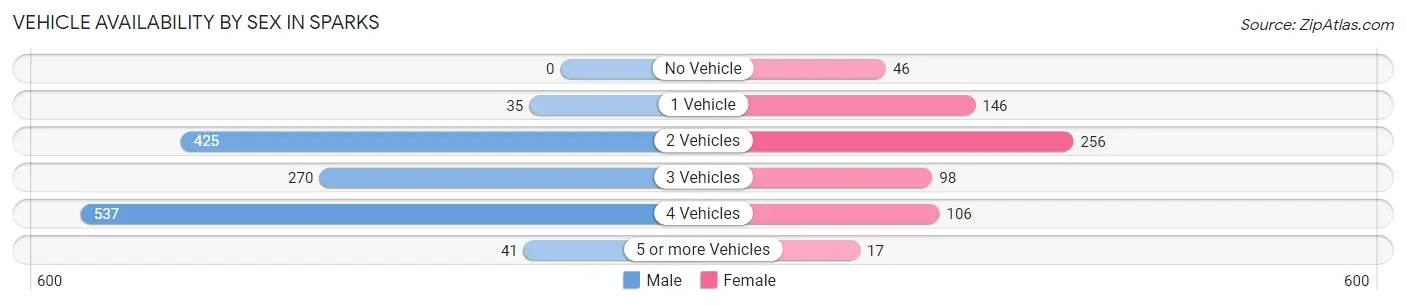
| Vehicles Available | Male | Female |
| No Vehicle | 0 (0.0%) | 46 (6.9%) |
| 1 Vehicle | 35 (2.7%) | 146 (21.8%) |
| 2 Vehicles | 425 (32.5%) | 256 (38.3%) |
| 3 Vehicles | 270 (20.6%) | 98 (14.6%) |
| 4 Vehicles | 537 (41.1%) | 106 (15.8%) |
| 5 or more Vehicles | 41 (3.1%) | 17 (2.5%) |
| Total | 1,308 (100.0%) | 669 (100.0%) |
Commute Time in Sparks
The most frequently occuring commute durations in Sparks are 15 to 19 minutes (504 commuters, 26.0%), 30 to 34 minutes (380 commuters, 19.6%), and 5 to 9 minutes (320 commuters, 16.5%).
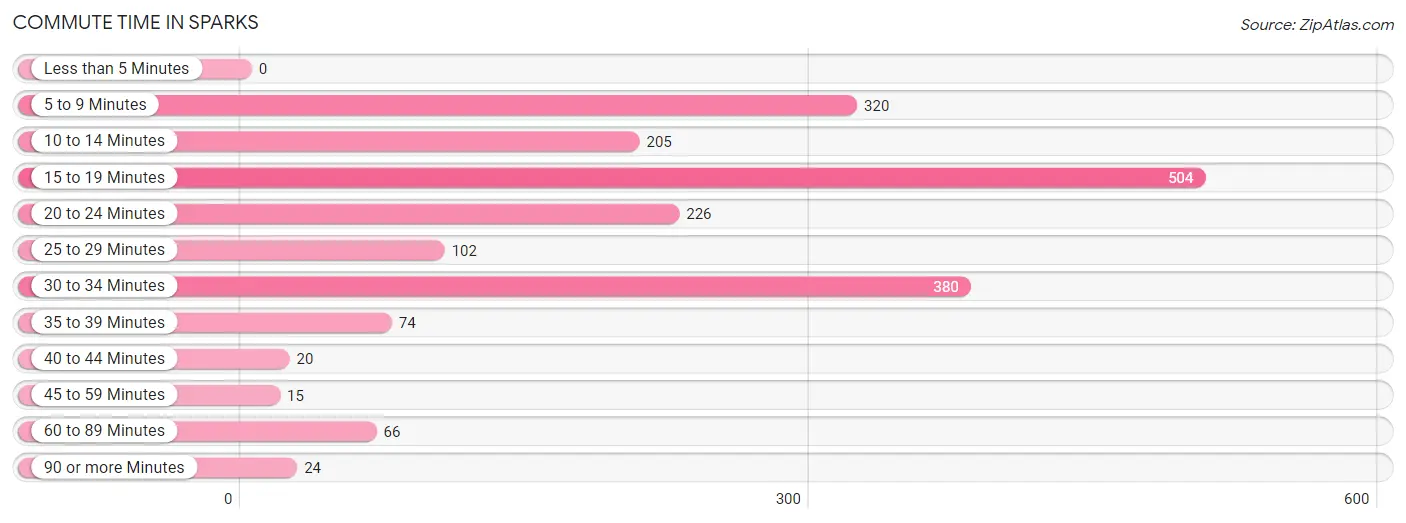
| Commute Time | # Commuters | % Commuters |
| Less than 5 Minutes | 0 | 0.0% |
| 5 to 9 Minutes | 320 | 16.5% |
| 10 to 14 Minutes | 205 | 10.6% |
| 15 to 19 Minutes | 504 | 26.0% |
| 20 to 24 Minutes | 226 | 11.7% |
| 25 to 29 Minutes | 102 | 5.3% |
| 30 to 34 Minutes | 380 | 19.6% |
| 35 to 39 Minutes | 74 | 3.8% |
| 40 to 44 Minutes | 20 | 1.0% |
| 45 to 59 Minutes | 15 | 0.8% |
| 60 to 89 Minutes | 66 | 3.4% |
| 90 or more Minutes | 24 | 1.2% |
Commute Time by Sex in Sparks
The most common commute times in Sparks are 30 to 34 minutes (364 commuters, 27.8%) for males and 15 to 19 minutes (270 commuters, 43.0%) for females.
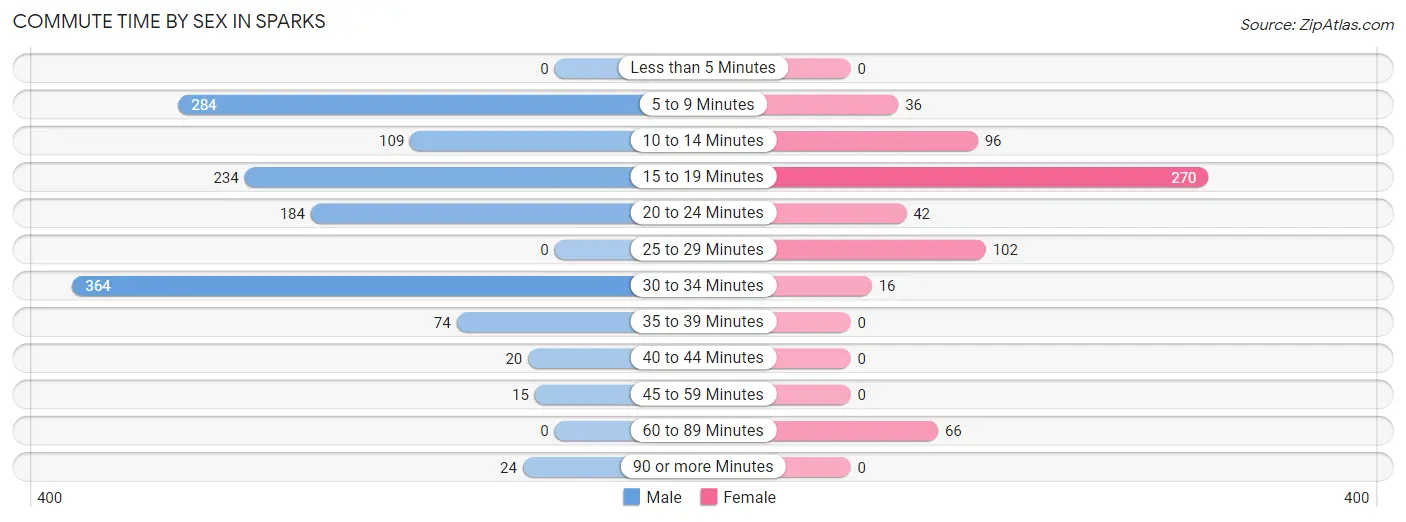
| Commute Time | Male | Female |
| Less than 5 Minutes | 0 (0.0%) | 0 (0.0%) |
| 5 to 9 Minutes | 284 (21.7%) | 36 (5.7%) |
| 10 to 14 Minutes | 109 (8.3%) | 96 (15.3%) |
| 15 to 19 Minutes | 234 (17.9%) | 270 (43.0%) |
| 20 to 24 Minutes | 184 (14.1%) | 42 (6.7%) |
| 25 to 29 Minutes | 0 (0.0%) | 102 (16.2%) |
| 30 to 34 Minutes | 364 (27.8%) | 16 (2.5%) |
| 35 to 39 Minutes | 74 (5.7%) | 0 (0.0%) |
| 40 to 44 Minutes | 20 (1.5%) | 0 (0.0%) |
| 45 to 59 Minutes | 15 (1.1%) | 0 (0.0%) |
| 60 to 89 Minutes | 0 (0.0%) | 66 (10.5%) |
| 90 or more Minutes | 24 (1.8%) | 0 (0.0%) |
Time of Departure to Work by Sex in Sparks
The most frequent times of departure to work in Sparks are 7:00 AM to 7:29 AM (653, 49.9%) for males and 6:30 AM to 6:59 AM (273, 43.5%) for females.
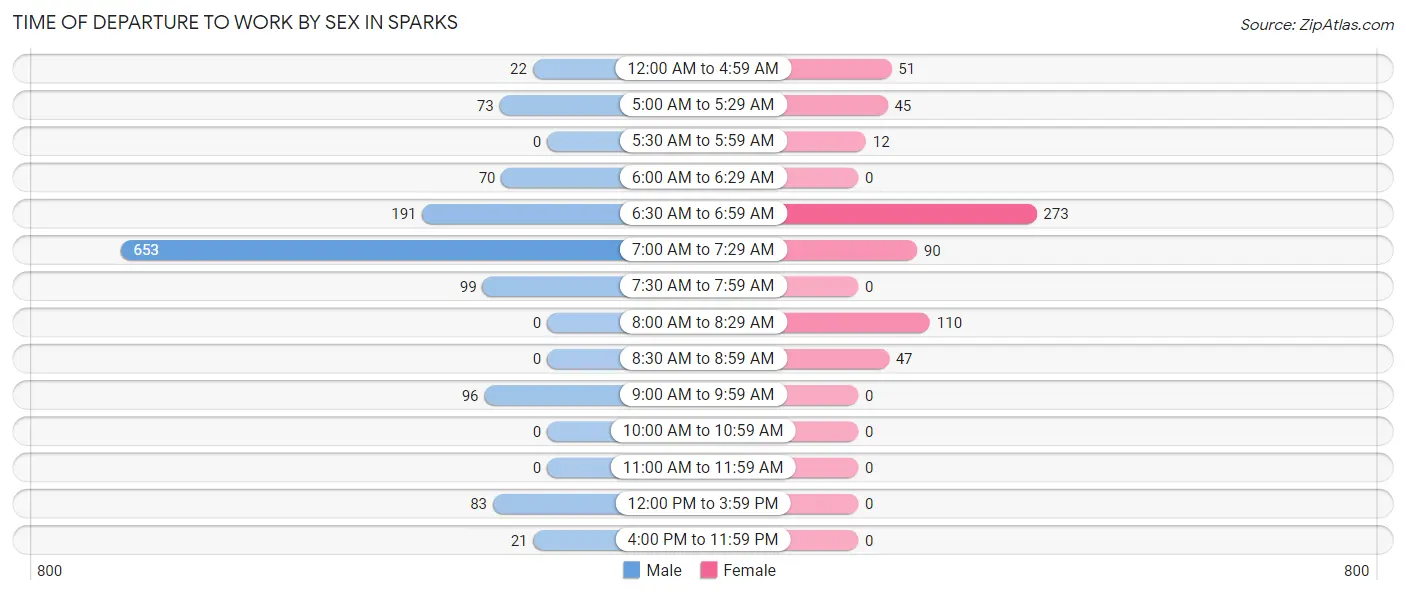
| Time of Departure | Male | Female |
| 12:00 AM to 4:59 AM | 22 (1.7%) | 51 (8.1%) |
| 5:00 AM to 5:29 AM | 73 (5.6%) | 45 (7.2%) |
| 5:30 AM to 5:59 AM | 0 (0.0%) | 12 (1.9%) |
| 6:00 AM to 6:29 AM | 70 (5.3%) | 0 (0.0%) |
| 6:30 AM to 6:59 AM | 191 (14.6%) | 273 (43.5%) |
| 7:00 AM to 7:29 AM | 653 (49.9%) | 90 (14.3%) |
| 7:30 AM to 7:59 AM | 99 (7.6%) | 0 (0.0%) |
| 8:00 AM to 8:29 AM | 0 (0.0%) | 110 (17.5%) |
| 8:30 AM to 8:59 AM | 0 (0.0%) | 47 (7.5%) |
| 9:00 AM to 9:59 AM | 96 (7.3%) | 0 (0.0%) |
| 10:00 AM to 10:59 AM | 0 (0.0%) | 0 (0.0%) |
| 11:00 AM to 11:59 AM | 0 (0.0%) | 0 (0.0%) |
| 12:00 PM to 3:59 PM | 83 (6.4%) | 0 (0.0%) |
| 4:00 PM to 11:59 PM | 21 (1.6%) | 0 (0.0%) |
| Total | 1,308 (100.0%) | 628 (100.0%) |
Housing Occupancy in Sparks
Occupancy by Ownership in Sparks
Of the total 1,345 dwellings in Sparks, owner-occupied units account for 1,020 (75.8%), while renter-occupied units make up 325 (24.2%).
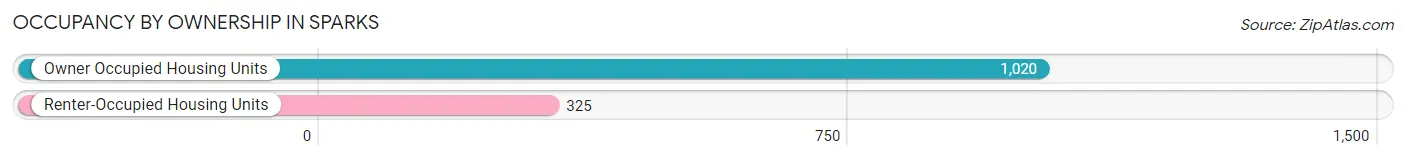
| Occupancy | # Housing Units | % Housing Units |
| Owner Occupied Housing Units | 1,020 | 75.8% |
| Renter-Occupied Housing Units | 325 | 24.2% |
| Total Occupied Housing Units | 1,345 | 100.0% |
Occupancy by Household Size in Sparks
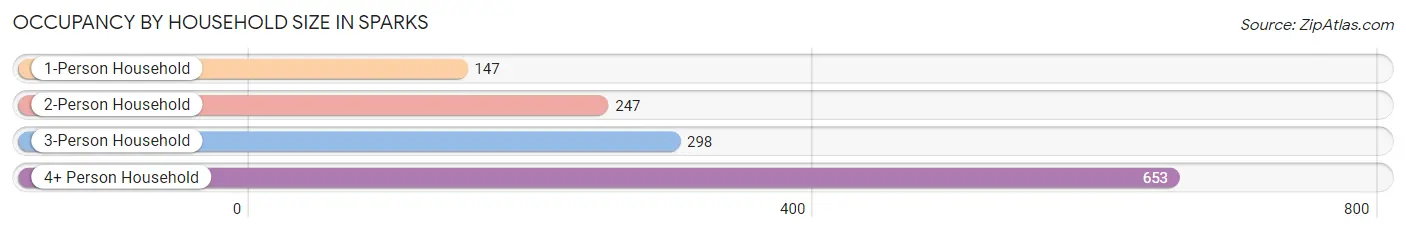
| Household Size | # Housing Units | % Housing Units |
| 1-Person Household | 147 | 10.9% |
| 2-Person Household | 247 | 18.4% |
| 3-Person Household | 298 | 22.2% |
| 4+ Person Household | 653 | 48.5% |
| Total Housing Units | 1,345 | 100.0% |
Occupancy by Ownership by Household Size in Sparks
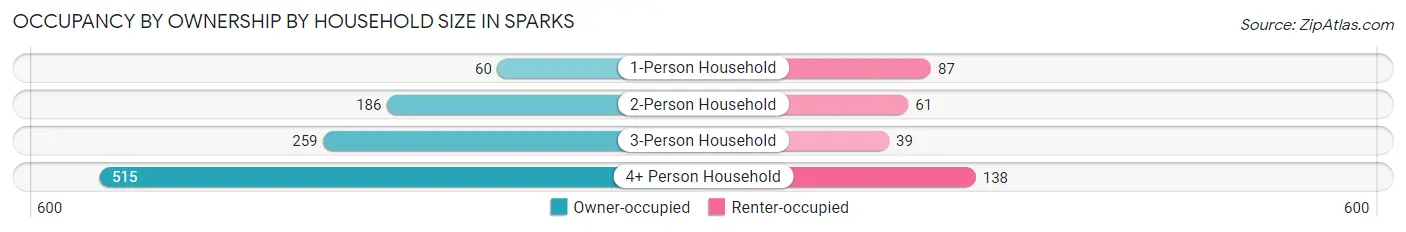
| Household Size | Owner-occupied | Renter-occupied |
| 1-Person Household | 60 (40.8%) | 87 (59.2%) |
| 2-Person Household | 186 (75.3%) | 61 (24.7%) |
| 3-Person Household | 259 (86.9%) | 39 (13.1%) |
| 4+ Person Household | 515 (78.9%) | 138 (21.1%) |
| Total Housing Units | 1,020 (75.8%) | 325 (24.2%) |
Occupancy by Educational Attainment in Sparks
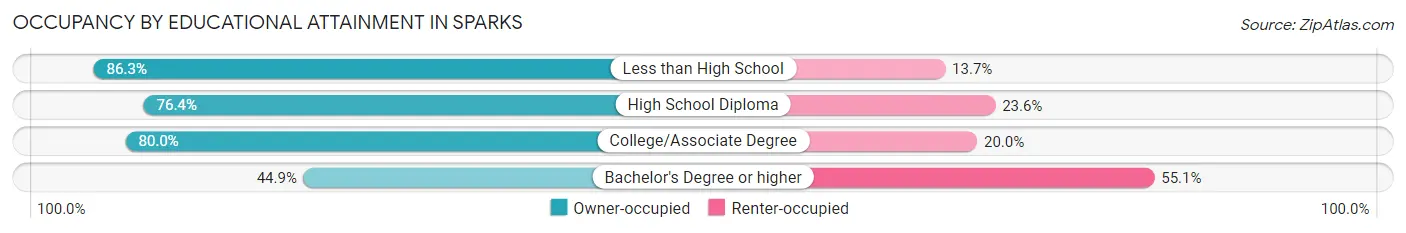
| Household Size | Owner-occupied | Renter-occupied |
| Less than High School | 385 (86.3%) | 61 (13.7%) |
| High School Diploma | 191 (76.4%) | 59 (23.6%) |
| College/Associate Degree | 348 (80.0%) | 87 (20.0%) |
| Bachelor's Degree or higher | 96 (44.9%) | 118 (55.1%) |
Occupancy by Age of Householder in Sparks
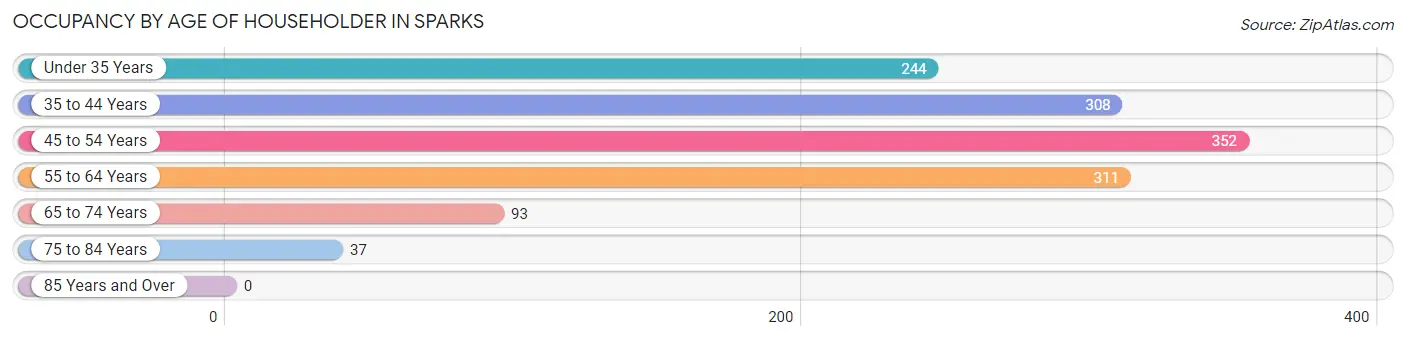
| Age Bracket | # Households | % Households |
| Under 35 Years | 244 | 18.1% |
| 35 to 44 Years | 308 | 22.9% |
| 45 to 54 Years | 352 | 26.2% |
| 55 to 64 Years | 311 | 23.1% |
| 65 to 74 Years | 93 | 6.9% |
| 75 to 84 Years | 37 | 2.8% |
| 85 Years and Over | 0 | 0.0% |
| Total | 1,345 | 100.0% |
Housing Finances in Sparks
Median Income by Occupancy in Sparks
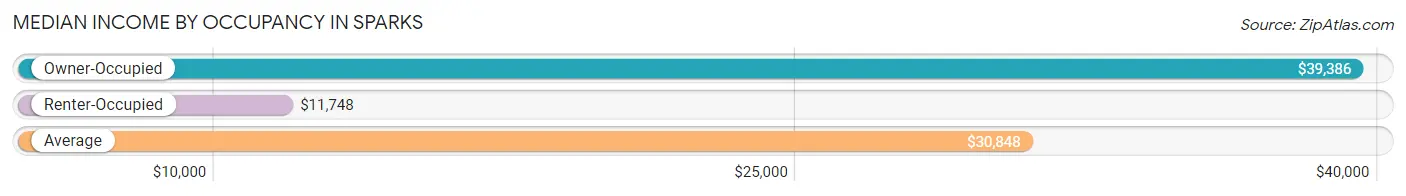
| Occupancy Type | # Households | Median Income |
| Owner-Occupied | 1,020 (75.8%) | $39,386 |
| Renter-Occupied | 325 (24.2%) | $11,748 |
| Average | 1,345 (100.0%) | $30,848 |
Occupancy by Householder Income Bracket in Sparks
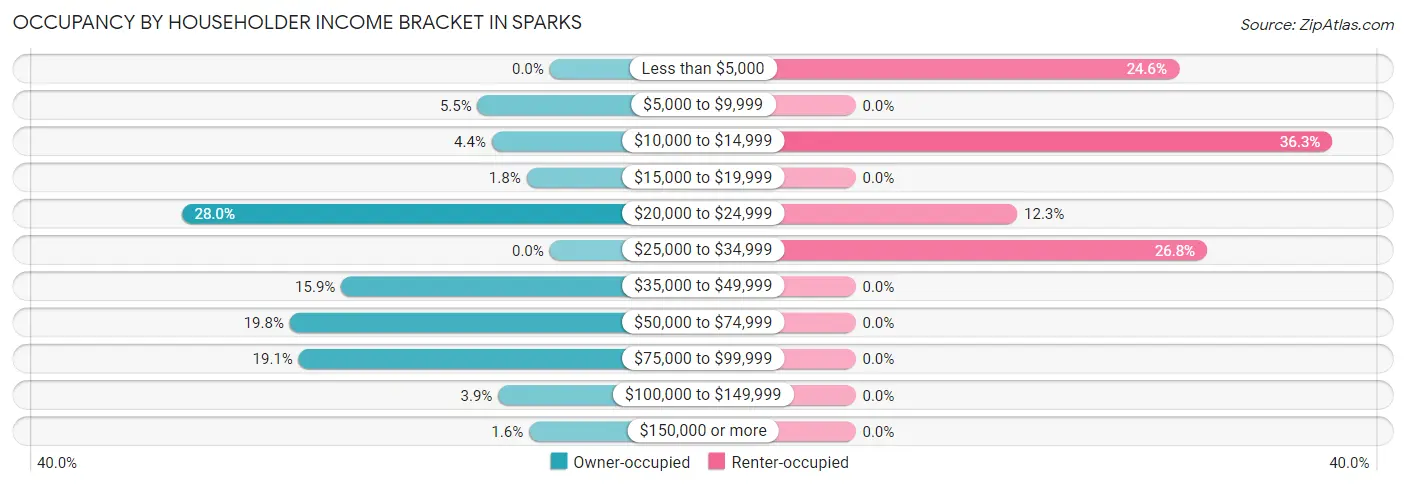
| Income Bracket | Owner-occupied | Renter-occupied |
| Less than $5,000 | 0 (0.0%) | 80 (24.6%) |
| $5,000 to $9,999 | 56 (5.5%) | 0 (0.0%) |
| $10,000 to $14,999 | 45 (4.4%) | 118 (36.3%) |
| $15,000 to $19,999 | 18 (1.8%) | 0 (0.0%) |
| $20,000 to $24,999 | 286 (28.0%) | 40 (12.3%) |
| $25,000 to $34,999 | 0 (0.0%) | 87 (26.8%) |
| $35,000 to $49,999 | 162 (15.9%) | 0 (0.0%) |
| $50,000 to $74,999 | 202 (19.8%) | 0 (0.0%) |
| $75,000 to $99,999 | 195 (19.1%) | 0 (0.0%) |
| $100,000 to $149,999 | 40 (3.9%) | 0 (0.0%) |
| $150,000 or more | 16 (1.6%) | 0 (0.0%) |
| Total | 1,020 (100.0%) | 325 (100.0%) |
Monthly Housing Cost Tiers in Sparks
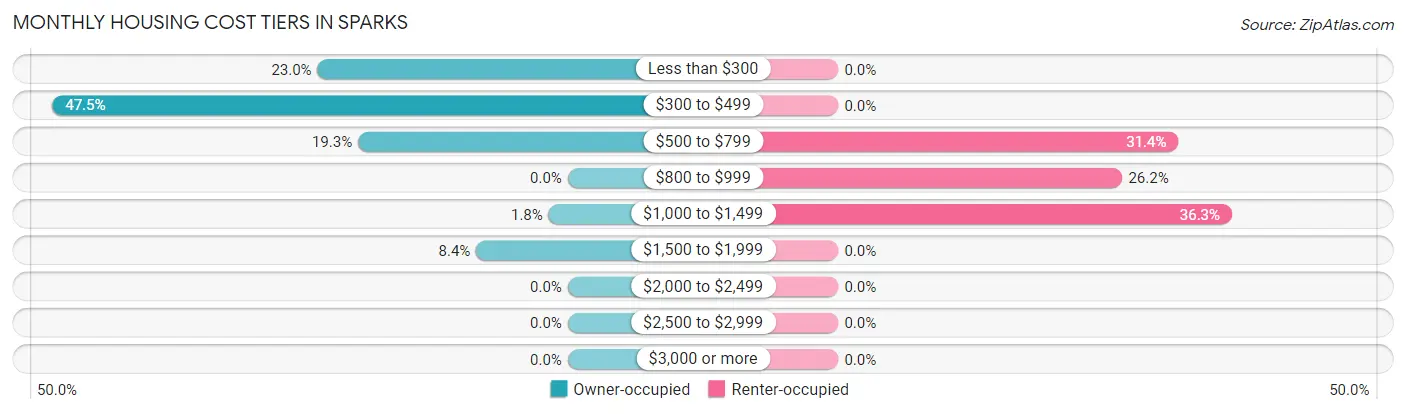
| Monthly Cost | Owner-occupied | Renter-occupied |
| Less than $300 | 235 (23.0%) | 0 (0.0%) |
| $300 to $499 | 484 (47.4%) | 0 (0.0%) |
| $500 to $799 | 197 (19.3%) | 102 (31.4%) |
| $800 to $999 | 0 (0.0%) | 85 (26.2%) |
| $1,000 to $1,499 | 18 (1.8%) | 118 (36.3%) |
| $1,500 to $1,999 | 86 (8.4%) | 0 (0.0%) |
| $2,000 to $2,499 | 0 (0.0%) | 0 (0.0%) |
| $2,500 to $2,999 | 0 (0.0%) | 0 (0.0%) |
| $3,000 or more | 0 (0.0%) | 0 (0.0%) |
| Total | 1,020 (100.0%) | 325 (100.0%) |
Physical Housing Characteristics in Sparks
Housing Structures in Sparks
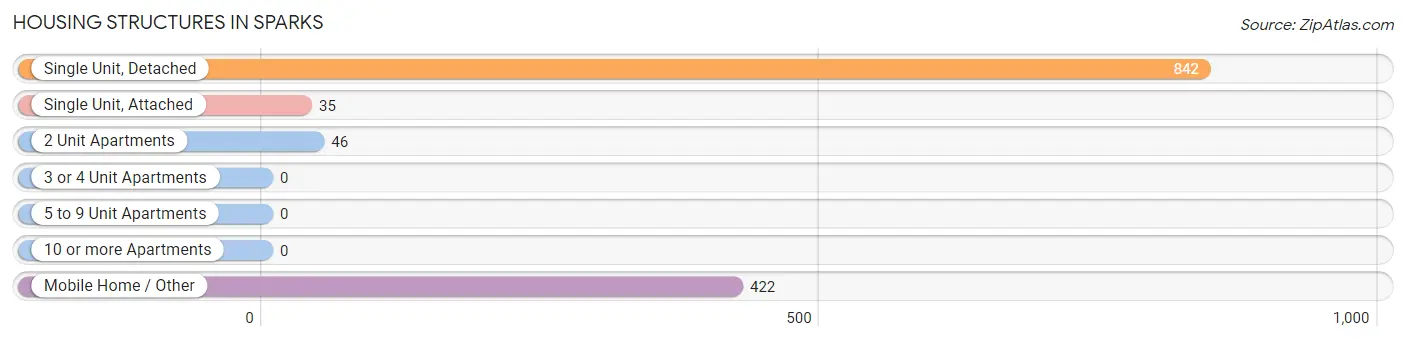
| Structure Type | # Housing Units | % Housing Units |
| Single Unit, Detached | 842 | 62.6% |
| Single Unit, Attached | 35 | 2.6% |
| 2 Unit Apartments | 46 | 3.4% |
| 3 or 4 Unit Apartments | 0 | 0.0% |
| 5 to 9 Unit Apartments | 0 | 0.0% |
| 10 or more Apartments | 0 | 0.0% |
| Mobile Home / Other | 422 | 31.4% |
| Total | 1,345 | 100.0% |
Housing Structures by Occupancy in Sparks
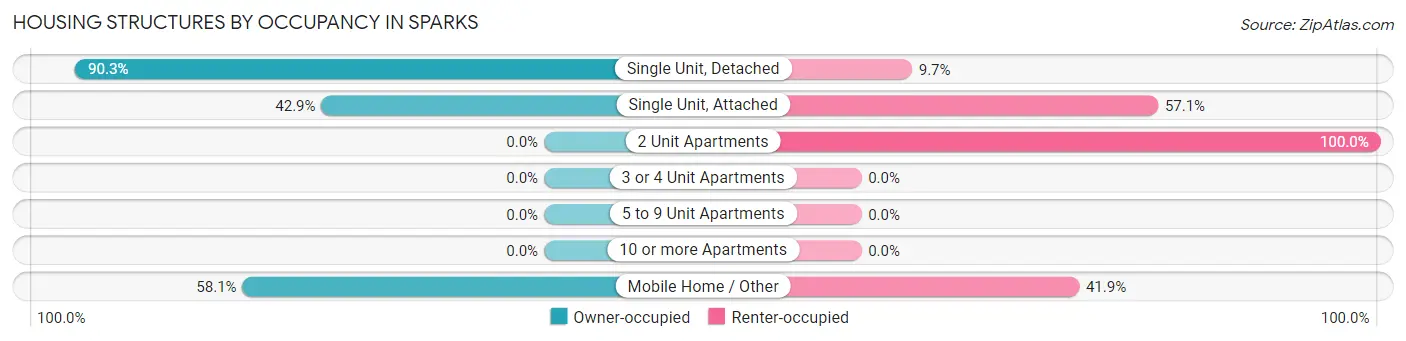
| Structure Type | Owner-occupied | Renter-occupied |
| Single Unit, Detached | 760 (90.3%) | 82 (9.7%) |
| Single Unit, Attached | 15 (42.9%) | 20 (57.1%) |
| 2 Unit Apartments | 0 (0.0%) | 46 (100.0%) |
| 3 or 4 Unit Apartments | 0 (0.0%) | 0 (0.0%) |
| 5 to 9 Unit Apartments | 0 (0.0%) | 0 (0.0%) |
| 10 or more Apartments | 0 (0.0%) | 0 (0.0%) |
| Mobile Home / Other | 245 (58.1%) | 177 (41.9%) |
| Total | 1,020 (75.8%) | 325 (24.2%) |
Housing Structures by Number of Rooms in Sparks
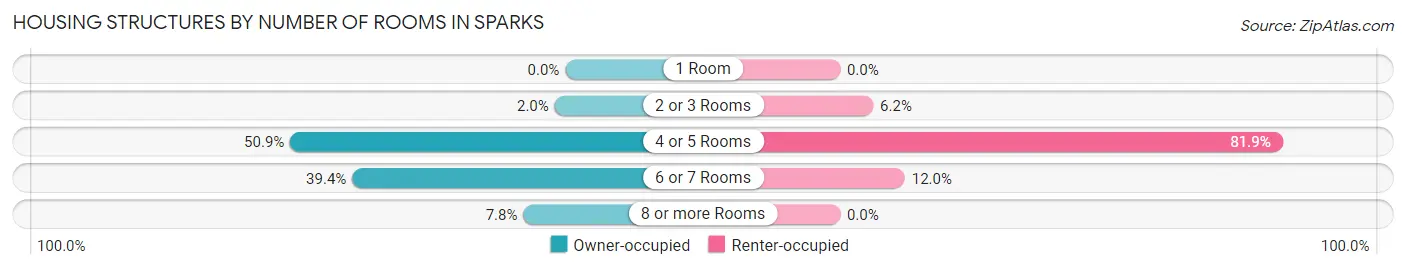
| Number of Rooms | Owner-occupied | Renter-occupied |
| 1 Room | 0 (0.0%) | 0 (0.0%) |
| 2 or 3 Rooms | 20 (2.0%) | 20 (6.1%) |
| 4 or 5 Rooms | 519 (50.9%) | 266 (81.9%) |
| 6 or 7 Rooms | 402 (39.4%) | 39 (12.0%) |
| 8 or more Rooms | 79 (7.7%) | 0 (0.0%) |
| Total | 1,020 (100.0%) | 325 (100.0%) |
Housing Structure by Heating Type in Sparks
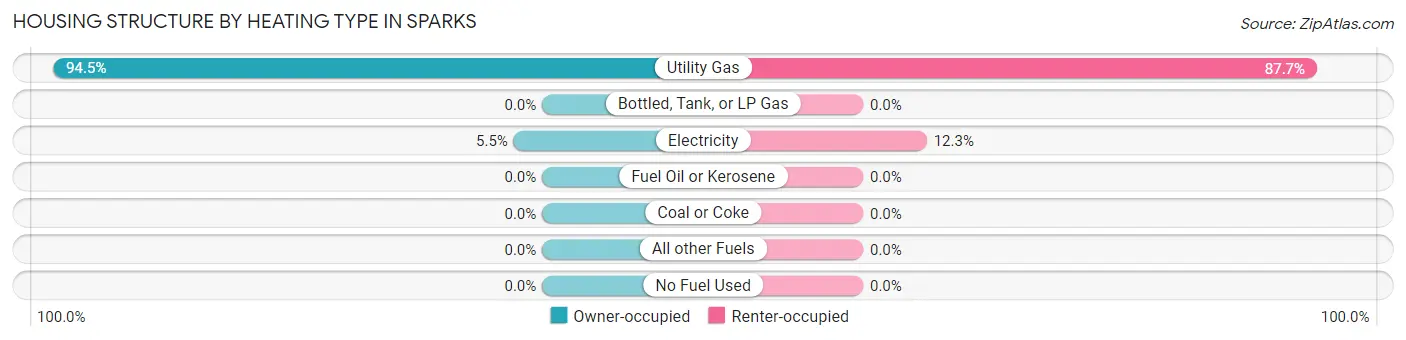
| Heating Type | Owner-occupied | Renter-occupied |
| Utility Gas | 964 (94.5%) | 285 (87.7%) |
| Bottled, Tank, or LP Gas | 0 (0.0%) | 0 (0.0%) |
| Electricity | 56 (5.5%) | 40 (12.3%) |
| Fuel Oil or Kerosene | 0 (0.0%) | 0 (0.0%) |
| Coal or Coke | 0 (0.0%) | 0 (0.0%) |
| All other Fuels | 0 (0.0%) | 0 (0.0%) |
| No Fuel Used | 0 (0.0%) | 0 (0.0%) |
| Total | 1,020 (100.0%) | 325 (100.0%) |
Household Vehicle Usage in Sparks
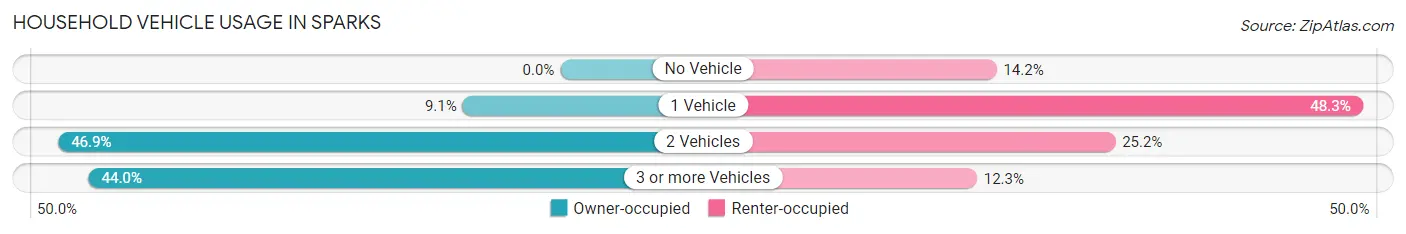
| Vehicles per Household | Owner-occupied | Renter-occupied |
| No Vehicle | 0 (0.0%) | 46 (14.1%) |
| 1 Vehicle | 93 (9.1%) | 157 (48.3%) |
| 2 Vehicles | 478 (46.9%) | 82 (25.2%) |
| 3 or more Vehicles | 449 (44.0%) | 40 (12.3%) |
| Total | 1,020 (100.0%) | 325 (100.0%) |
Real Estate & Mortgages in Sparks
Real Estate and Mortgage Overview in Sparks
| Characteristic | Without Mortgage | With Mortgage |
| Housing Units | 916 | 104 |
| Median Property Value | $81,200 | $234,000 |
| Median Household Income | $37,895 | $16 |
| Monthly Housing Costs | $362 | $0 |
| Real Estate Taxes | $1,290 | $16 |
Property Value by Mortgage Status in Sparks
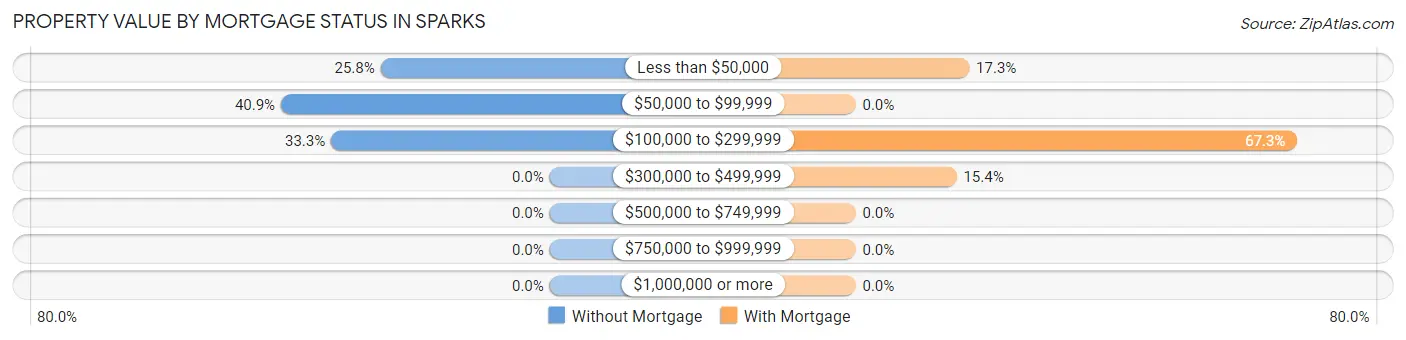
| Property Value | Without Mortgage | With Mortgage |
| Less than $50,000 | 236 (25.8%) | 18 (17.3%) |
| $50,000 to $99,999 | 375 (40.9%) | 0 (0.0%) |
| $100,000 to $299,999 | 305 (33.3%) | 70 (67.3%) |
| $300,000 to $499,999 | 0 (0.0%) | 16 (15.4%) |
| $500,000 to $749,999 | 0 (0.0%) | 0 (0.0%) |
| $750,000 to $999,999 | 0 (0.0%) | 0 (0.0%) |
| $1,000,000 or more | 0 (0.0%) | 0 (0.0%) |
| Total | 916 (100.0%) | 104 (100.0%) |
Household Income by Mortgage Status in Sparks
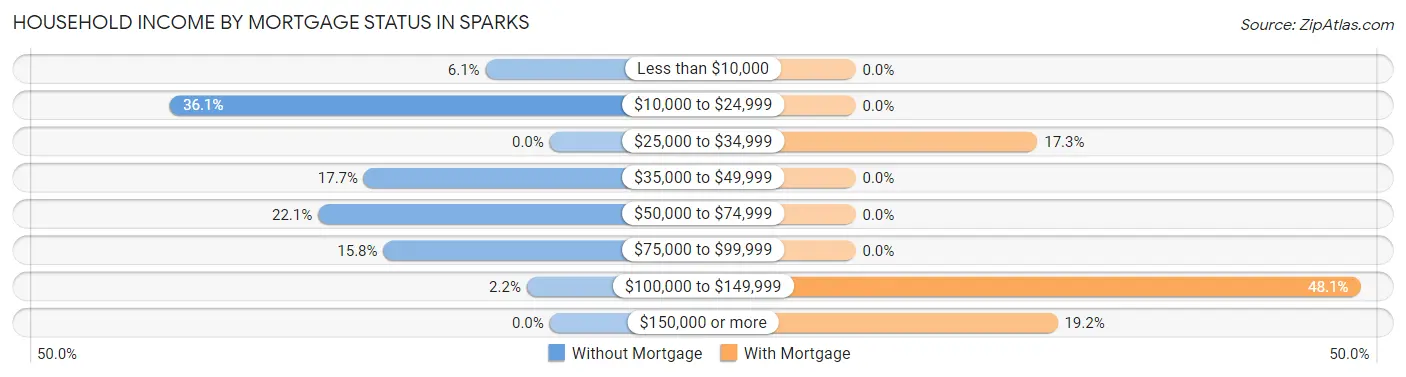
| Household Income | Without Mortgage | With Mortgage |
| Less than $10,000 | 56 (6.1%) | 0 (0.0%) |
| $10,000 to $24,999 | 331 (36.1%) | 0 (0.0%) |
| $25,000 to $34,999 | 0 (0.0%) | 18 (17.3%) |
| $35,000 to $49,999 | 162 (17.7%) | 0 (0.0%) |
| $50,000 to $74,999 | 202 (22.1%) | 0 (0.0%) |
| $75,000 to $99,999 | 145 (15.8%) | 0 (0.0%) |
| $100,000 to $149,999 | 20 (2.2%) | 50 (48.1%) |
| $150,000 or more | 0 (0.0%) | 20 (19.2%) |
| Total | 916 (100.0%) | 104 (100.0%) |
Property Value to Household Income Ratio in Sparks
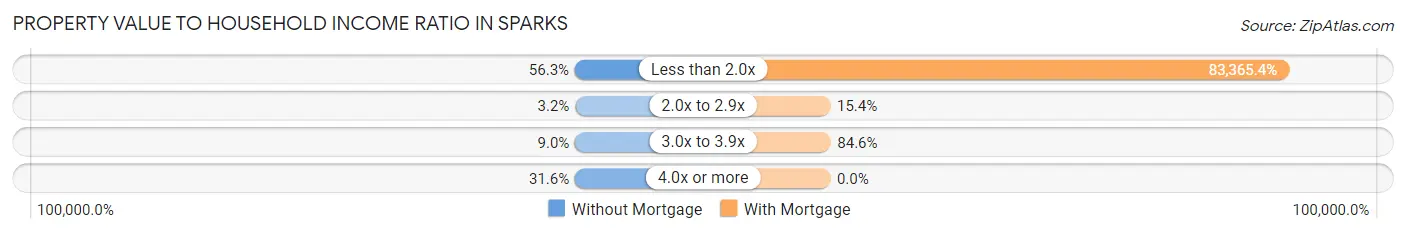
| Value-to-Income Ratio | Without Mortgage | With Mortgage |
| Less than 2.0x | 516 (56.3%) | 86,700 (83,365.4%) |
| 2.0x to 2.9x | 29 (3.2%) | 16 (15.4%) |
| 3.0x to 3.9x | 82 (8.9%) | 88 (84.6%) |
| 4.0x or more | 289 (31.6%) | 0 (0.0%) |
| Total | 916 (100.0%) | 104 (100.0%) |
Real Estate Taxes by Mortgage Status in Sparks
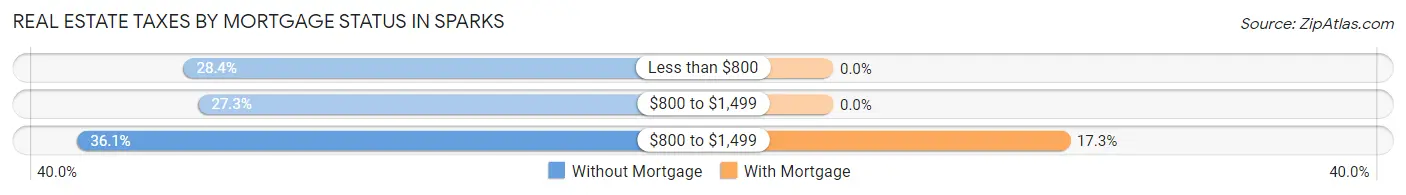
| Property Taxes | Without Mortgage | With Mortgage |
| Less than $800 | 260 (28.4%) | 0 (0.0%) |
| $800 to $1,499 | 250 (27.3%) | 0 (0.0%) |
| $800 to $1,499 | 331 (36.1%) | 18 (17.3%) |
| Total | 916 (100.0%) | 104 (100.0%) |
Health & Disability in Sparks
Health Insurance Coverage by Age in Sparks
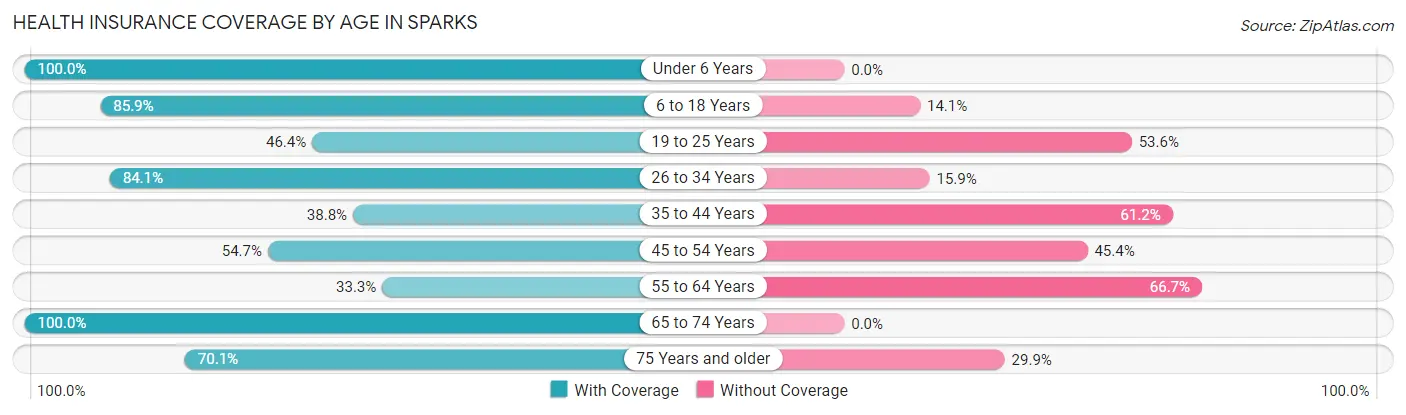
| Age Bracket | With Coverage | Without Coverage |
| Under 6 Years | 490 (100.0%) | 0 (0.0%) |
| 6 to 18 Years | 1,282 (85.9%) | 211 (14.1%) |
| 19 to 25 Years | 316 (46.4%) | 365 (53.6%) |
| 26 to 34 Years | 349 (84.1%) | 66 (15.9%) |
| 35 to 44 Years | 223 (38.8%) | 352 (61.2%) |
| 45 to 54 Years | 382 (54.6%) | 317 (45.4%) |
| 55 to 64 Years | 135 (33.3%) | 270 (66.7%) |
| 65 to 74 Years | 250 (100.0%) | 0 (0.0%) |
| 75 Years and older | 143 (70.1%) | 61 (29.9%) |
| Total | 3,570 (68.5%) | 1,642 (31.5%) |
Health Insurance Coverage by Citizenship Status in Sparks
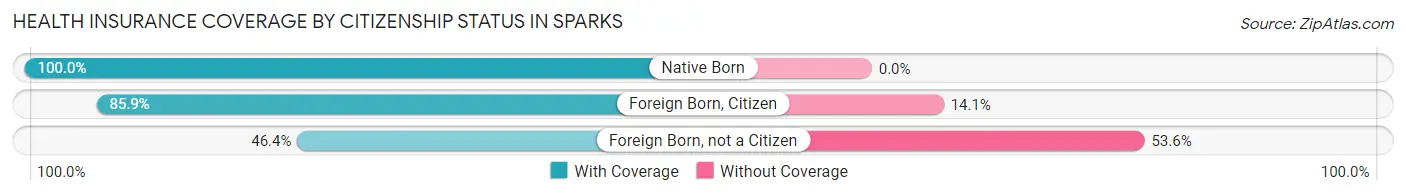
| Citizenship Status | With Coverage | Without Coverage |
| Native Born | 490 (100.0%) | 0 (0.0%) |
| Foreign Born, Citizen | 1,282 (85.9%) | 211 (14.1%) |
| Foreign Born, not a Citizen | 316 (46.4%) | 365 (53.6%) |
Health Insurance Coverage by Household Income in Sparks
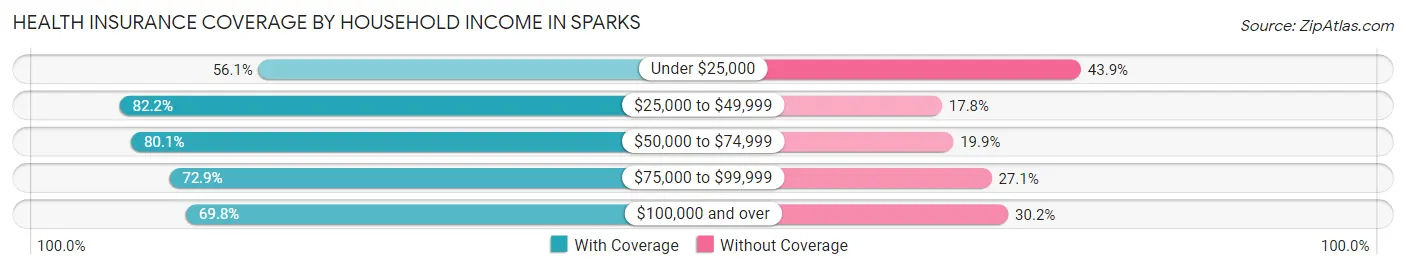
| Household Income | With Coverage | Without Coverage |
| Under $25,000 | 1,230 (56.1%) | 961 (43.9%) |
| $25,000 to $49,999 | 895 (82.2%) | 194 (17.8%) |
| $50,000 to $74,999 | 530 (80.1%) | 132 (19.9%) |
| $75,000 to $99,999 | 675 (72.9%) | 251 (27.1%) |
| $100,000 and over | 240 (69.8%) | 104 (30.2%) |
Public vs Private Health Insurance Coverage by Age in Sparks
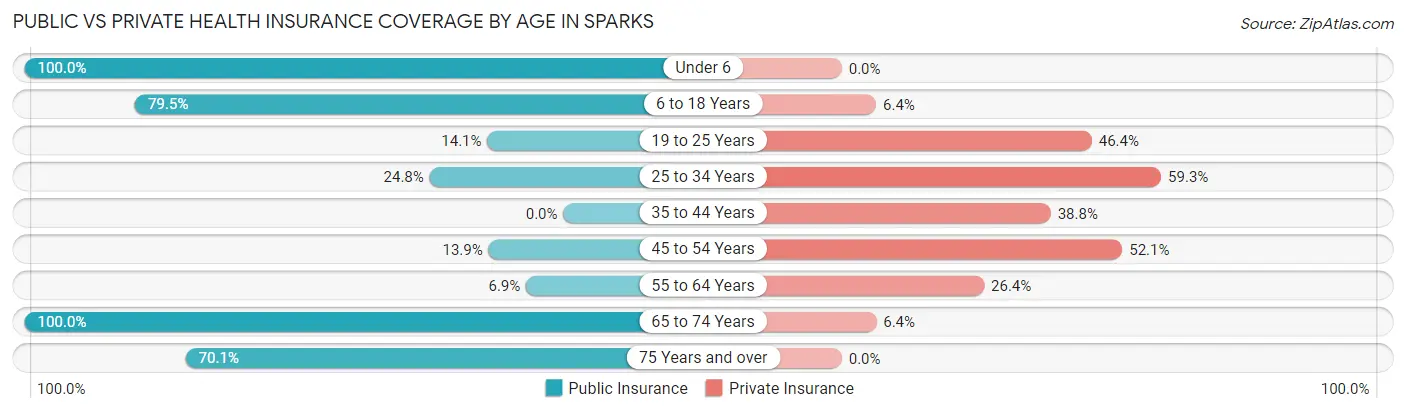
| Age Bracket | Public Insurance | Private Insurance |
| Under 6 | 490 (100.0%) | 0 (0.0%) |
| 6 to 18 Years | 1,187 (79.5%) | 95 (6.4%) |
| 19 to 25 Years | 96 (14.1%) | 316 (46.4%) |
| 25 to 34 Years | 103 (24.8%) | 246 (59.3%) |
| 35 to 44 Years | 0 (0.0%) | 223 (38.8%) |
| 45 to 54 Years | 97 (13.9%) | 364 (52.1%) |
| 55 to 64 Years | 28 (6.9%) | 107 (26.4%) |
| 65 to 74 Years | 250 (100.0%) | 16 (6.4%) |
| 75 Years and over | 143 (70.1%) | 0 (0.0%) |
| Total | 2,394 (45.9%) | 1,367 (26.2%) |
Disability Status by Sex by Age in Sparks
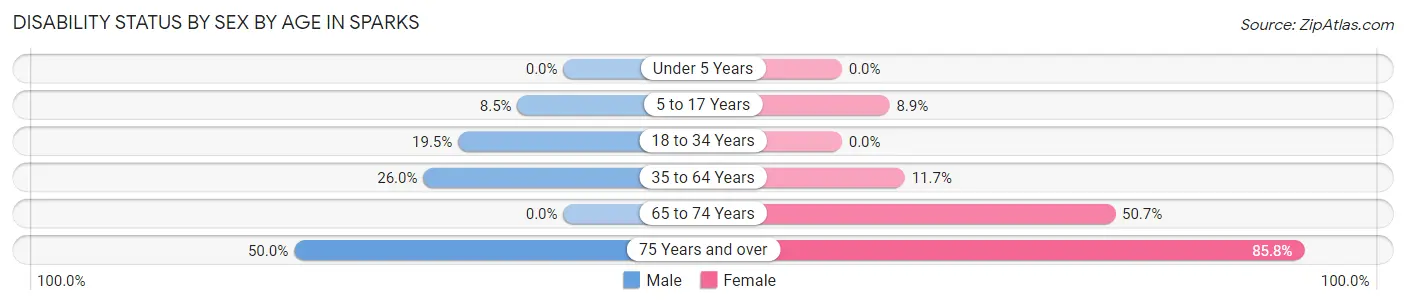
| Age Bracket | Male | Female |
| Under 5 Years | 0 (0.0%) | 0 (0.0%) |
| 5 to 17 Years | 72 (8.5%) | 60 (8.8%) |
| 18 to 34 Years | 163 (19.5%) | 0 (0.0%) |
| 35 to 64 Years | 196 (26.0%) | 108 (11.7%) |
| 65 to 74 Years | 0 (0.0%) | 70 (50.7%) |
| 75 Years and over | 35 (50.0%) | 115 (85.8%) |
Disability Class by Sex by Age in Sparks
Disability Class: Hearing Difficulty
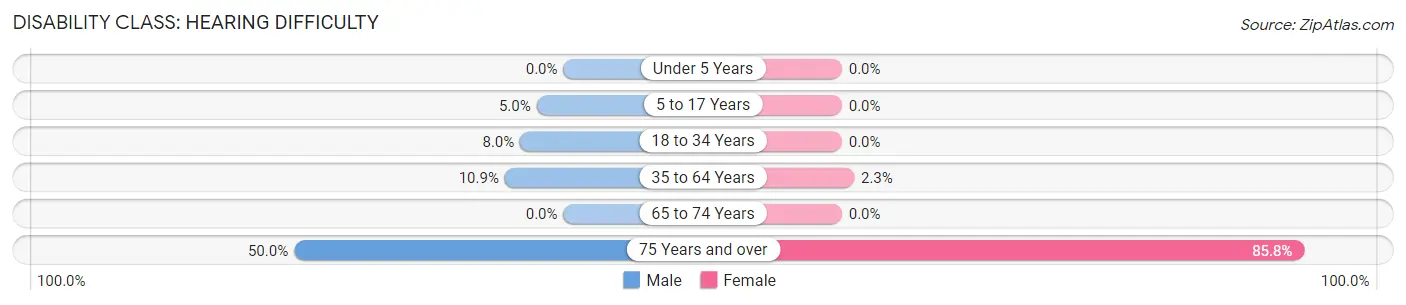
| Age Bracket | Male | Female |
| Under 5 Years | 0 (0.0%) | 0 (0.0%) |
| 5 to 17 Years | 42 (5.0%) | 0 (0.0%) |
| 18 to 34 Years | 67 (8.0%) | 0 (0.0%) |
| 35 to 64 Years | 82 (10.9%) | 21 (2.3%) |
| 65 to 74 Years | 0 (0.0%) | 0 (0.0%) |
| 75 Years and over | 35 (50.0%) | 115 (85.8%) |
Disability Class: Vision Difficulty
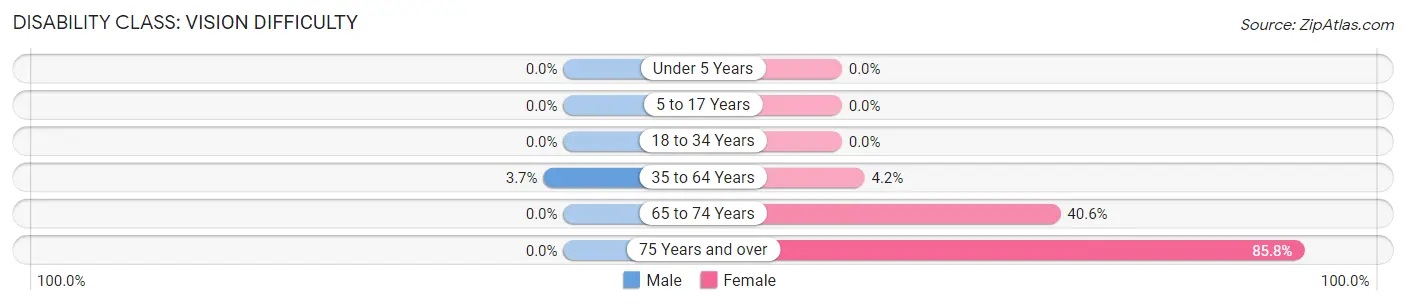
| Age Bracket | Male | Female |
| Under 5 Years | 0 (0.0%) | 0 (0.0%) |
| 5 to 17 Years | 0 (0.0%) | 0 (0.0%) |
| 18 to 34 Years | 0 (0.0%) | 0 (0.0%) |
| 35 to 64 Years | 28 (3.7%) | 39 (4.2%) |
| 65 to 74 Years | 0 (0.0%) | 56 (40.6%) |
| 75 Years and over | 0 (0.0%) | 115 (85.8%) |
Disability Class: Cognitive Difficulty
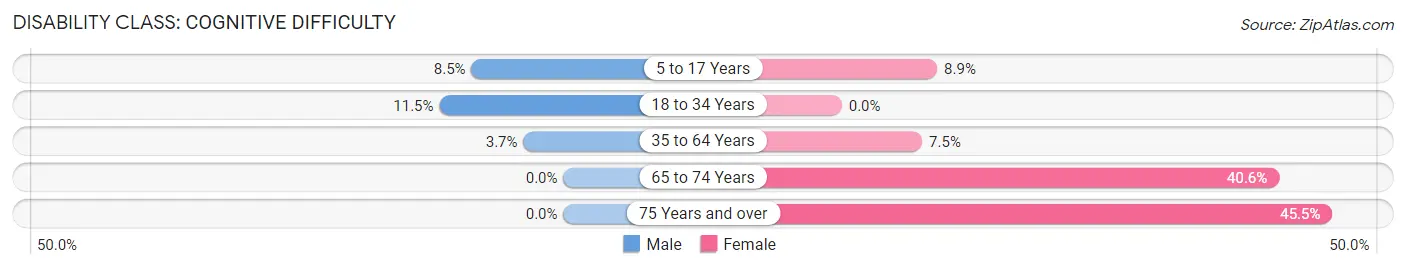
| Age Bracket | Male | Female |
| 5 to 17 Years | 72 (8.5%) | 60 (8.8%) |
| 18 to 34 Years | 96 (11.5%) | 0 (0.0%) |
| 35 to 64 Years | 28 (3.7%) | 69 (7.5%) |
| 65 to 74 Years | 0 (0.0%) | 56 (40.6%) |
| 75 Years and over | 0 (0.0%) | 61 (45.5%) |
Disability Class: Ambulatory Difficulty
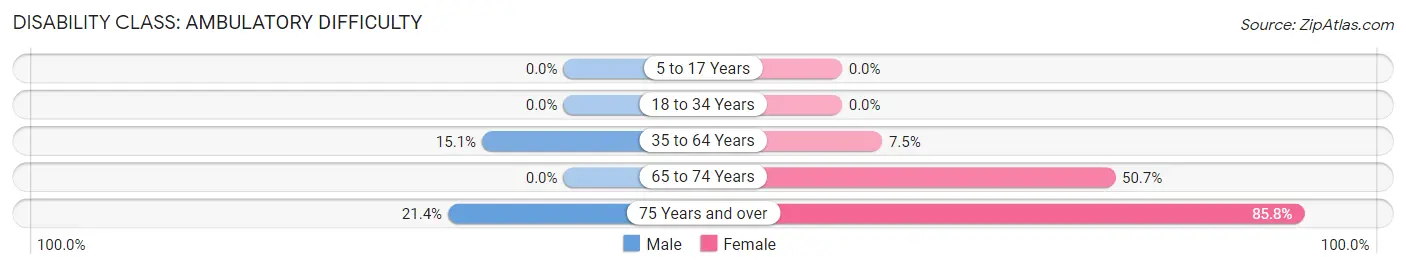
| Age Bracket | Male | Female |
| 5 to 17 Years | 0 (0.0%) | 0 (0.0%) |
| 18 to 34 Years | 0 (0.0%) | 0 (0.0%) |
| 35 to 64 Years | 114 (15.1%) | 69 (7.5%) |
| 65 to 74 Years | 0 (0.0%) | 70 (50.7%) |
| 75 Years and over | 15 (21.4%) | 115 (85.8%) |
Disability Class: Self-Care Difficulty
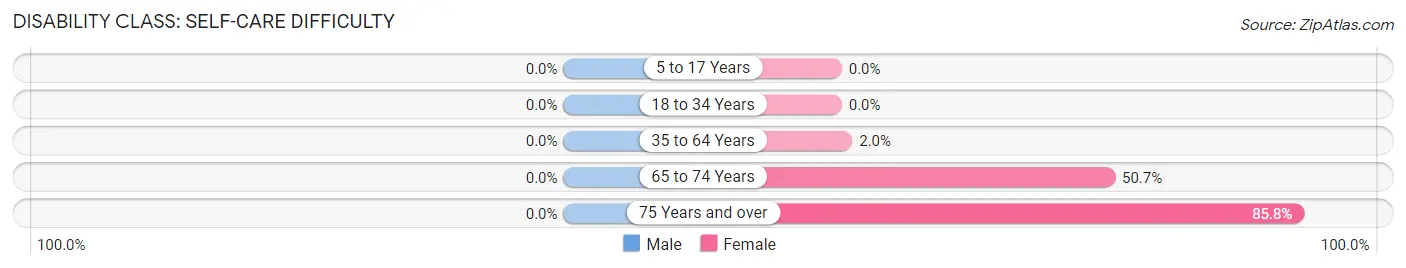
| Age Bracket | Male | Female |
| 5 to 17 Years | 0 (0.0%) | 0 (0.0%) |
| 18 to 34 Years | 0 (0.0%) | 0 (0.0%) |
| 35 to 64 Years | 0 (0.0%) | 18 (1.9%) |
| 65 to 74 Years | 0 (0.0%) | 70 (50.7%) |
| 75 Years and over | 0 (0.0%) | 115 (85.8%) |
Technology Access in Sparks
Computing Device Access in Sparks
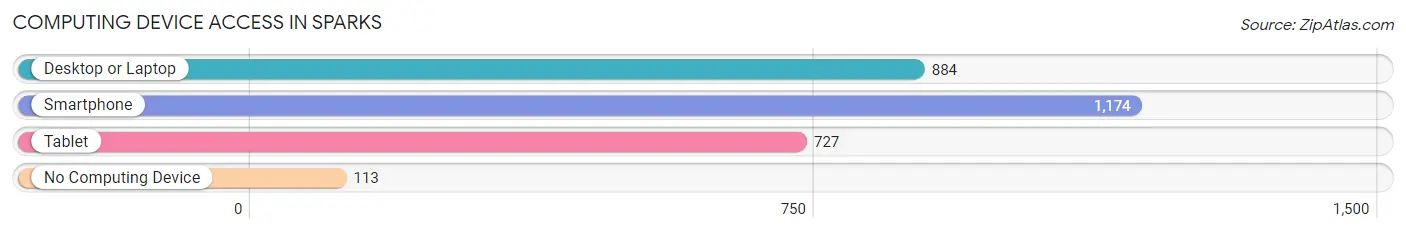
| Device Type | # Households | % Households |
| Desktop or Laptop | 884 | 65.7% |
| Smartphone | 1,174 | 87.3% |
| Tablet | 727 | 54.0% |
| No Computing Device | 113 | 8.4% |
| Total | 1,345 | 100.0% |
Internet Access in Sparks
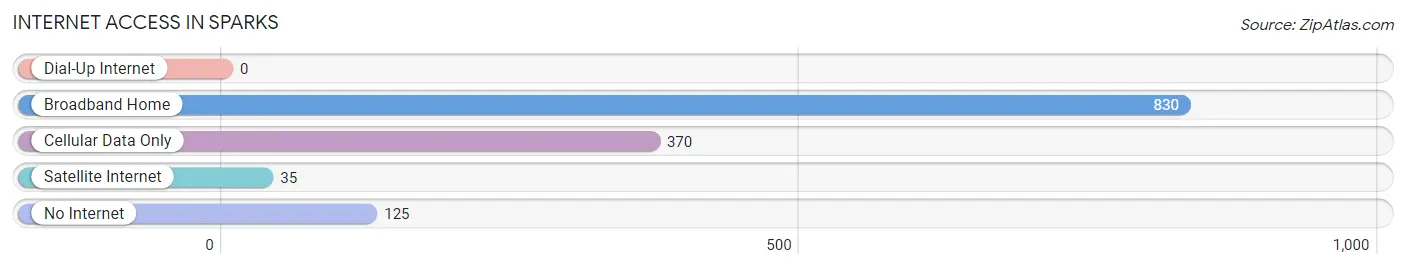
| Internet Type | # Households | % Households |
| Dial-Up Internet | 0 | 0.0% |
| Broadband Home | 830 | 61.7% |
| Cellular Data Only | 370 | 27.5% |
| Satellite Internet | 35 | 2.6% |
| No Internet | 125 | 9.3% |
| Total | 1,345 | 100.0% |
Sparks Summary
Sparks, Texas is a small town located in the northeastern corner of Texas, in the county of Bowie. It is situated on the banks of the Sulphur River, and is part of the Texarkana metropolitan area. The town was founded in 1873, and has a population of approximately 1,000 people.
History
Sparks, Texas was founded in 1873 by a group of settlers from Arkansas. The town was named after the Sparks family, who were among the first settlers. The town was originally a farming community, and the main crops grown were cotton, corn, and wheat. The town also had a sawmill, a gristmill, and a cotton gin.
In the late 19th century, the town began to grow and prosper. The railroad came to town in 1882, and the town became a shipping center for the surrounding area. The town also had a hotel, a bank, and several stores.
In the early 20th century, the town began to decline. The railroad was abandoned in the 1920s, and the town's economy suffered. The population began to decline, and by the 1950s, the town had become a ghost town.
In the late 20th century, the town began to revive. The population began to grow, and the town began to attract new businesses. Today, Sparks is a small, rural town with a population of approximately 1,000 people.
Geography
Sparks, Texas is located in the northeastern corner of Texas, in the county of Bowie. It is situated on the banks of the Sulphur River, and is part of the Texarkana metropolitan area. The town is located approximately 30 miles south of Texarkana, and is surrounded by the towns of Hooks, Maud, and Redwater.
The town has a total area of 1.2 square miles, all of which is land. The terrain is mostly flat, with some rolling hills. The climate is humid subtropical, with hot summers and mild winters.
Economy
The economy of Sparks, Texas is largely based on agriculture. The main crops grown in the area are cotton, corn, and wheat. The town also has a few small businesses, including a grocery store, a hardware store, and a few restaurants.
The town is also home to a few manufacturing companies, including a furniture factory and a plastics factory. The town also has a few small service businesses, such as a barber shop and a beauty salon.
Demographics
As of the 2010 census, the population of Sparks, Texas was 1,000 people. The racial makeup of the town was 97.2% White, 0.7% African American, 0.3% Native American, 0.2% Asian, and 1.6% from other races. The median household income was $31,250, and the median family income was $37,500.
The town has a high rate of poverty, with 28.3% of the population living below the poverty line. The town also has a high rate of unemployment, with 8.3% of the population unemployed. The town has a low rate of educational attainment, with only 11.3% of the population having a college degree.
Common Questions
What is Per Capita Income in Sparks?
Per Capita income in Sparks is $11,517.
What is the Median Family Income in Sparks?
Median Family Income in Sparks is $35,281.
What is the Median Household income in Sparks?
Median Household Income in Sparks is $30,848.
What is Income or Wage Gap in Sparks?
Income or Wage Gap in Sparks is 30.1%.
Women in Sparks earn 69.9 cents for every dollar earned by a man.
What is Family Income Deficit in Sparks?
Family Income Deficit in Sparks is $9,645.
Families that are below poverty line in Sparks earn $9,645 less on average than the poverty threshold level.
What is Inequality or Gini Index in Sparks?
Inequality or Gini Index in Sparks is 0.43.
What is the Total Population of Sparks?
Total Population of Sparks is 5,212.
What is the Total Male Population of Sparks?
Total Male Population of Sparks is 2,739.
What is the Total Female Population of Sparks?
Total Female Population of Sparks is 2,473.
What is the Ratio of Males per 100 Females in Sparks?
There are 110.76 Males per 100 Females in Sparks.
What is the Ratio of Females per 100 Males in Sparks?
There are 90.29 Females per 100 Males in Sparks.
What is the Median Population Age in Sparks?
Median Population Age in Sparks is 25.3 Years.
What is the Average Family Size in Sparks
Average Family Size in Sparks is 4.3 People.
What is the Average Household Size in Sparks
Average Household Size in Sparks is 3.9 People.
How Large is the Labor Force in Sparks?
There are 2,290 People in the Labor Forcein in Sparks.
What is the Percentage of People in the Labor Force in Sparks?
60.7% of People are in the Labor Force in Sparks.
What is the Unemployment Rate in Sparks?
Unemployment Rate in Sparks is 10.7%.