Jeffers Gardens, OR Map & Demographics
Jeffers Gardens Map
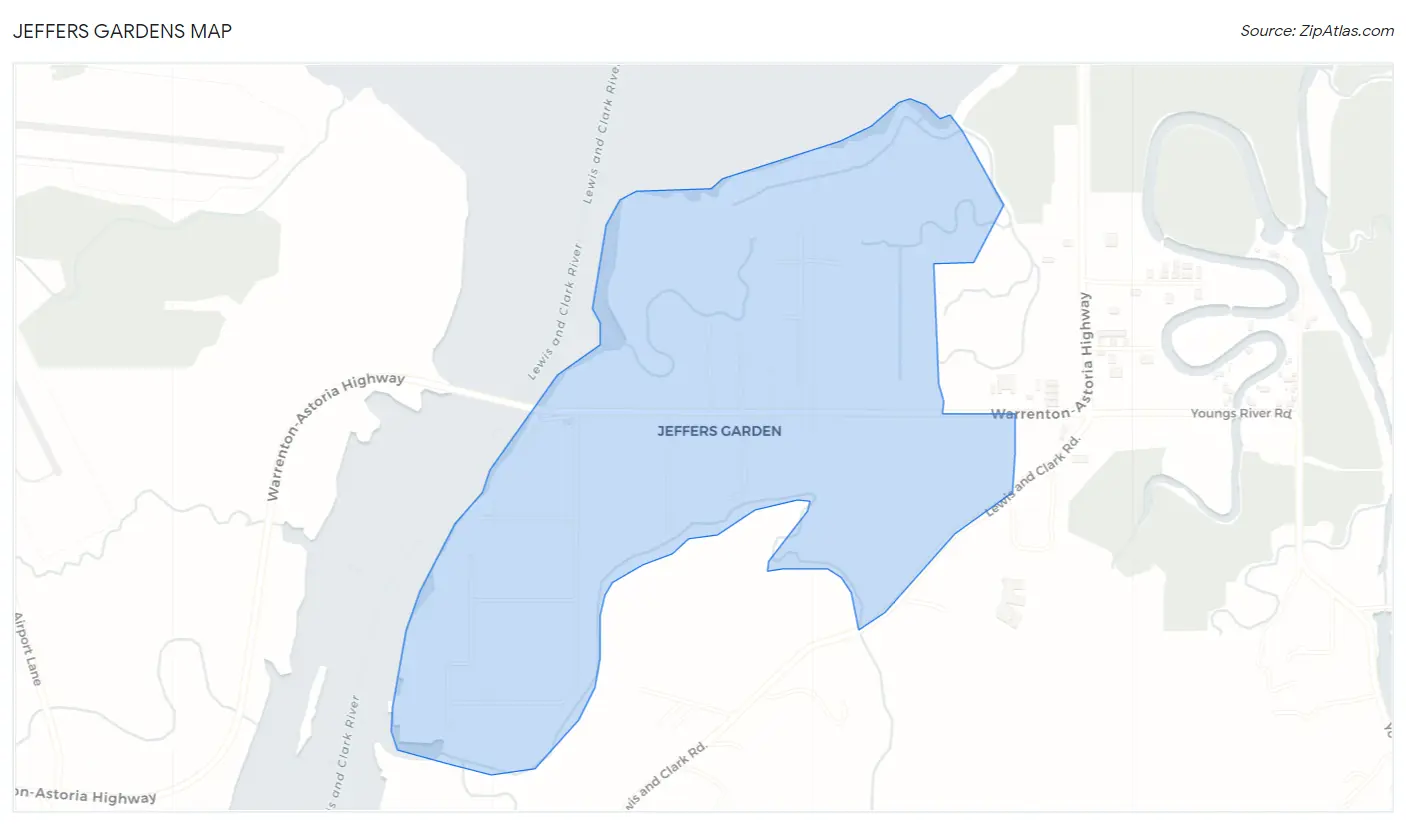
Jeffers Gardens Overview
$28,228
PER CAPITA INCOME
0.51
INEQUALITY / GINI INDEX
117
TOTAL POPULATION
51
MALE POPULATION
66
FEMALE POPULATION
77.27
MALES / 100 FEMALES
129.41
FEMALES / 100 MALES
62.1
MEDIAN AGE
2.4
AVG FAMILY SIZE
1.8
AVG HOUSEHOLD SIZE
53
LABOR FORCE [ PEOPLE ]
48.2%
PERCENT IN LABOR FORCE
52.8%
UNEMPLOYMENT RATE
Income in Jeffers Gardens
Income Overview in Jeffers Gardens
| Characteristic | Number | Measure |
| Per Capita Income | 117 | $28,228 |
| Median Family Income | 37 | $0 |
| Mean Family Income | 37 | $61,141 |
| Median Household Income | 66 | $0 |
| Mean Household Income | 66 | $53,761 |
| Income Deficit | 37 | $0 |
| Wage / Income Gap (%) | 117 | 0.00% |
| Wage / Income Gap ($) | 117 | 100.00¢ per $1 |
| Gini / Inequality Index | 117 | 0.51 |
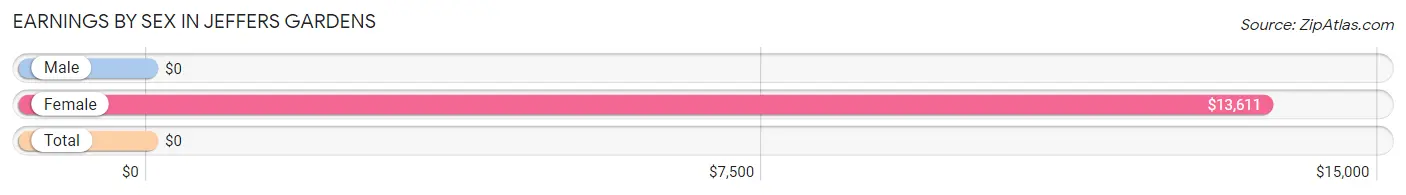
Earnings by Sex in Jeffers Gardens
| Sex | Number | Average Earnings |
| Male | 31 (50.8%) | $0 |
| Female | 30 (49.2%) | $13,611 |
| Total | 61 (100.0%) | $0 |
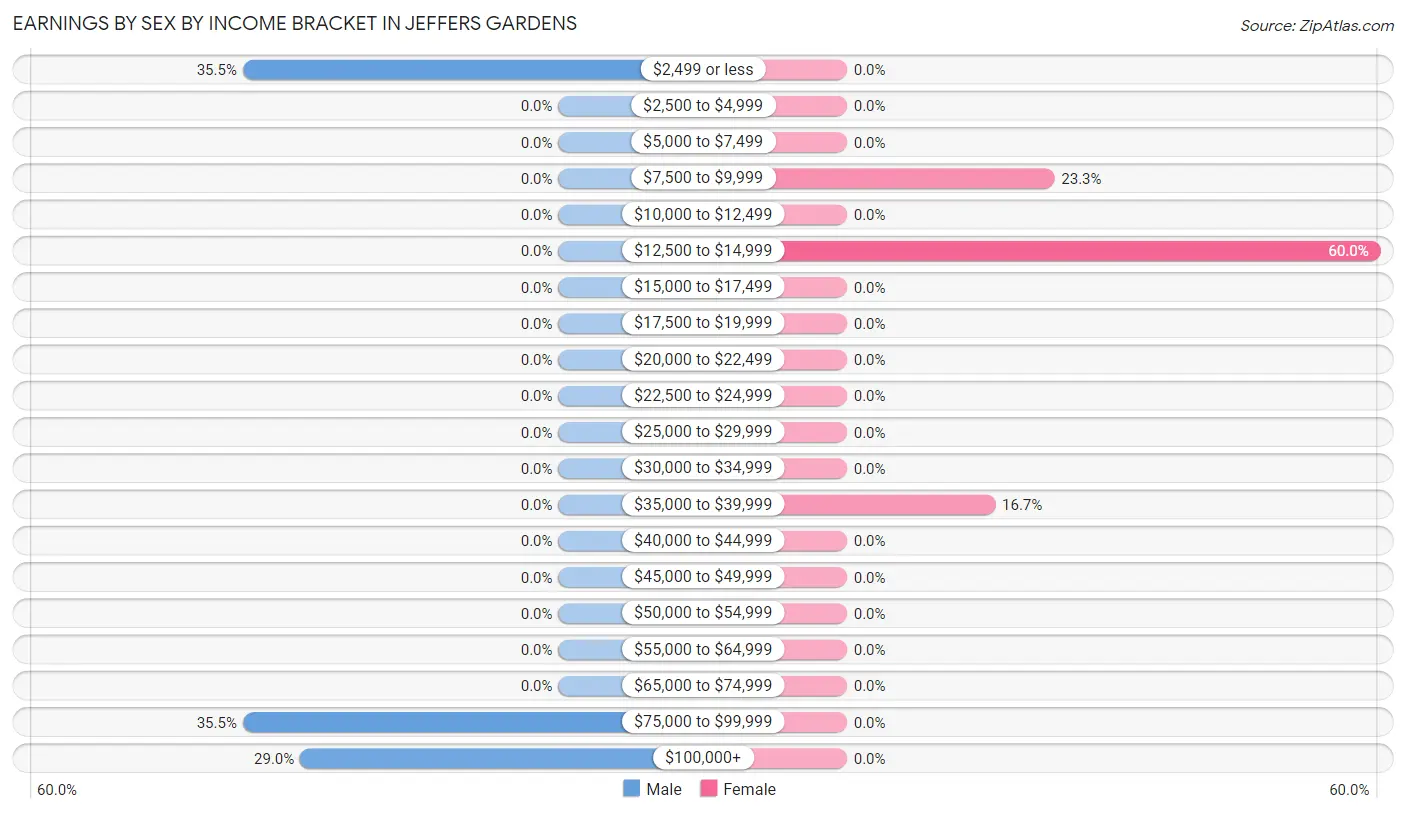
Earnings by Sex by Income Bracket in Jeffers Gardens
The most common earnings brackets in Jeffers Gardens are $2,499 or less for men (11 | 35.5%) and $12,500 to $14,999 for women (18 | 60.0%).
| Income | Male | Female |
| $2,499 or less | 11 (35.5%) | 0 (0.0%) |
| $2,500 to $4,999 | 0 (0.0%) | 0 (0.0%) |
| $5,000 to $7,499 | 0 (0.0%) | 0 (0.0%) |
| $7,500 to $9,999 | 0 (0.0%) | 7 (23.3%) |
| $10,000 to $12,499 | 0 (0.0%) | 0 (0.0%) |
| $12,500 to $14,999 | 0 (0.0%) | 18 (60.0%) |
| $15,000 to $17,499 | 0 (0.0%) | 0 (0.0%) |
| $17,500 to $19,999 | 0 (0.0%) | 0 (0.0%) |
| $20,000 to $22,499 | 0 (0.0%) | 0 (0.0%) |
| $22,500 to $24,999 | 0 (0.0%) | 0 (0.0%) |
| $25,000 to $29,999 | 0 (0.0%) | 0 (0.0%) |
| $30,000 to $34,999 | 0 (0.0%) | 0 (0.0%) |
| $35,000 to $39,999 | 0 (0.0%) | 5 (16.7%) |
| $40,000 to $44,999 | 0 (0.0%) | 0 (0.0%) |
| $45,000 to $49,999 | 0 (0.0%) | 0 (0.0%) |
| $50,000 to $54,999 | 0 (0.0%) | 0 (0.0%) |
| $55,000 to $64,999 | 0 (0.0%) | 0 (0.0%) |
| $65,000 to $74,999 | 0 (0.0%) | 0 (0.0%) |
| $75,000 to $99,999 | 11 (35.5%) | 0 (0.0%) |
| $100,000+ | 9 (29.0%) | 0 (0.0%) |
| Total | 31 (100.0%) | 30 (100.0%) |
Earnings by Sex by Educational Attainment in Jeffers Gardens
| Educational Attainment | Male Income | Female Income |
| Less than High School | - | - |
| High School Diploma | - | - |
| College or Associate's Degree | - | - |
| Bachelor's Degree | - | - |
| Graduate Degree | - | - |
| Total | - | - |
Family Income in Jeffers Gardens
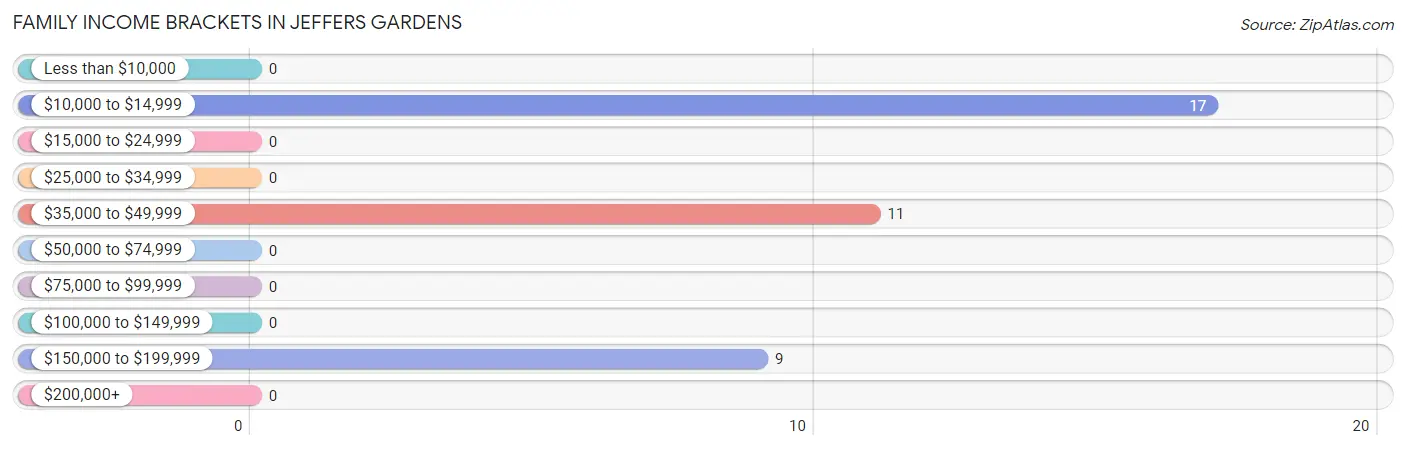
Family Income Brackets in Jeffers Gardens
According to the Jeffers Gardens family income data, there are 17 families falling into the $10,000 to $14,999 income range, which is the most common income bracket and makes up 46.0% of all families.
| Income Bracket | # Families | % Families |
| Less than $10,000 | 0 | 0.0% |
| $10,000 to $14,999 | 17 | 45.9% |
| $15,000 to $24,999 | 0 | 0.0% |
| $25,000 to $34,999 | 0 | 0.0% |
| $35,000 to $49,999 | 11 | 29.7% |
| $50,000 to $74,999 | 0 | 0.0% |
| $75,000 to $99,999 | 0 | 0.0% |
| $100,000 to $149,999 | 0 | 0.0% |
| $150,000 to $199,999 | 9 | 24.3% |
| $200,000+ | 0 | 0.0% |
Family Income by Famaliy Size in Jeffers Gardens
| Income Bracket | # Families | Median Income |
| 2-Person Families | 17 (46.0%) | $0 |
| 3-Person Families | 20 (54.0%) | $0 |
| 4-Person Families | 0 (0.0%) | $0 |
| 5-Person Families | 0 (0.0%) | $0 |
| 6-Person Families | 0 (0.0%) | $0 |
| 7+ Person Families | 0 (0.0%) | $0 |
| Total | 37 (100.0%) | $0 |
Family Income by Number of Earners in Jeffers Gardens
| Number of Earners | # Families | Median Income |
| No Earners | 9 (24.3%) | $0 |
| 1 Earner | 19 (51.3%) | $0 |
| 2 Earners | 9 (24.3%) | $0 |
| 3+ Earners | 0 (0.0%) | $0 |
| Total | 37 (100.0%) | $0 |
Household Income in Jeffers Gardens
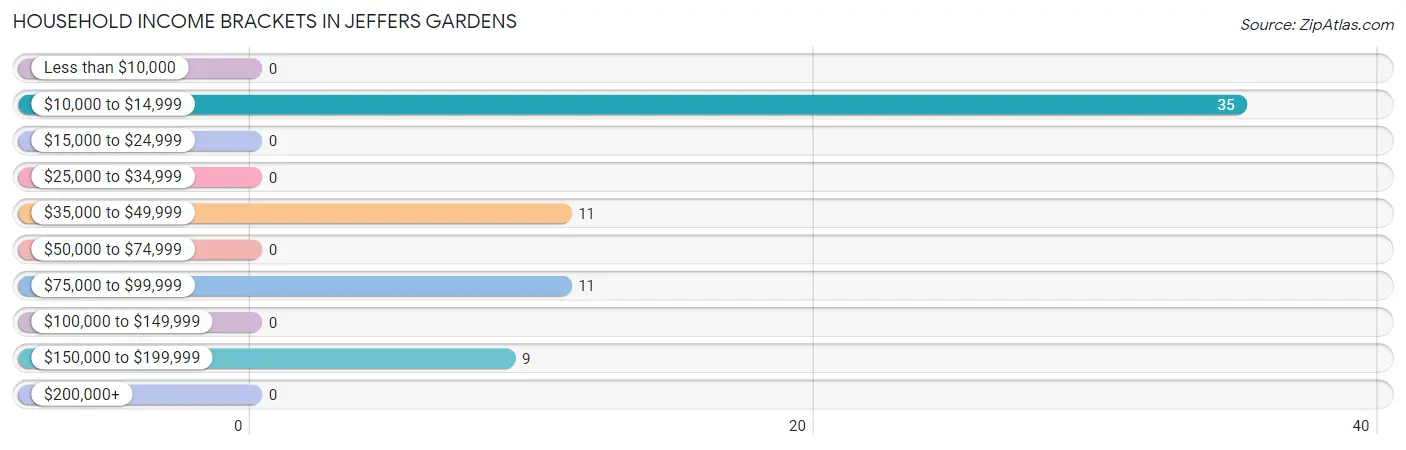
Household Income Brackets in Jeffers Gardens
With 35 households falling in the category, the $10,000 to $14,999 income range is the most frequent in Jeffers Gardens, accounting for 53.0% of all households.
| Income Bracket | # Households | % Households |
| Less than $10,000 | 0 | 0.0% |
| $10,000 to $14,999 | 35 | 53.0% |
| $15,000 to $24,999 | 0 | 0.0% |
| $25,000 to $34,999 | 0 | 0.0% |
| $35,000 to $49,999 | 11 | 16.7% |
| $50,000 to $74,999 | 0 | 0.0% |
| $75,000 to $99,999 | 11 | 16.7% |
| $100,000 to $149,999 | 0 | 0.0% |
| $150,000 to $199,999 | 9 | 13.6% |
| $200,000+ | 0 | 0.0% |
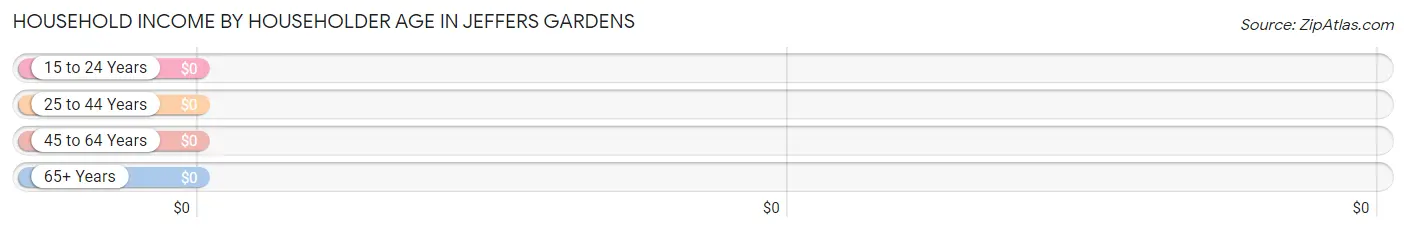
Household Income by Householder Age in Jeffers Gardens
| Income Bracket | # Households | Median Income |
| 15 to 24 Years | 18 (27.3%) | $0 |
| 25 to 44 Years | 11 (16.7%) | $0 |
| 45 to 64 Years | 17 (25.8%) | $0 |
| 65+ Years | 20 (30.3%) | $0 |
| Total | 66 (100.0%) | $0 |
Poverty in Jeffers Gardens
Income Below Poverty by Sex and Age in Jeffers Gardens
With 13.7% poverty level for males and 78.8% for females among the residents of Jeffers Gardens, 12 to 14 year old males and 18 to 24 year old females are the most vulnerable to poverty, with 7 males (100.0%) and 18 females (100.0%) in their respective age groups living below the poverty level.
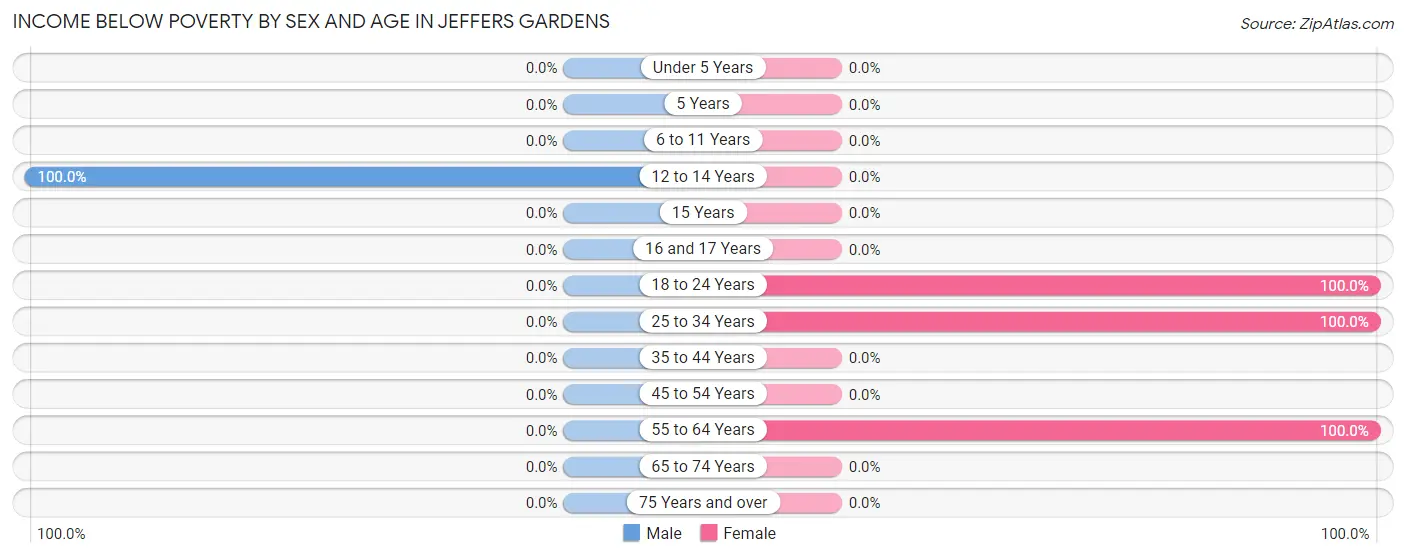
| Age Bracket | Male | Female |
| Under 5 Years | 0 (0.0%) | 0 (0.0%) |
| 5 Years | 0 (0.0%) | 0 (0.0%) |
| 6 to 11 Years | 0 (0.0%) | 0 (0.0%) |
| 12 to 14 Years | 7 (100.0%) | 0 (0.0%) |
| 15 Years | 0 (0.0%) | 0 (0.0%) |
| 16 and 17 Years | 0 (0.0%) | 0 (0.0%) |
| 18 to 24 Years | 0 (0.0%) | 18 (100.0%) |
| 25 to 34 Years | 0 (0.0%) | 10 (100.0%) |
| 35 to 44 Years | 0 (0.0%) | 0 (0.0%) |
| 45 to 54 Years | 0 (0.0%) | 0 (0.0%) |
| 55 to 64 Years | 0 (0.0%) | 24 (100.0%) |
| 65 to 74 Years | 0 (0.0%) | 0 (0.0%) |
| 75 Years and over | 0 (0.0%) | 0 (0.0%) |
| Total | 7 (13.7%) | 52 (78.8%) |
Income Above Poverty by Sex and Age in Jeffers Gardens
According to the poverty statistics in Jeffers Gardens, males aged 35 to 44 years and females aged 45 to 54 years are the age groups that are most secure financially, with 100.0% of males and 100.0% of females in these age groups living above the poverty line.
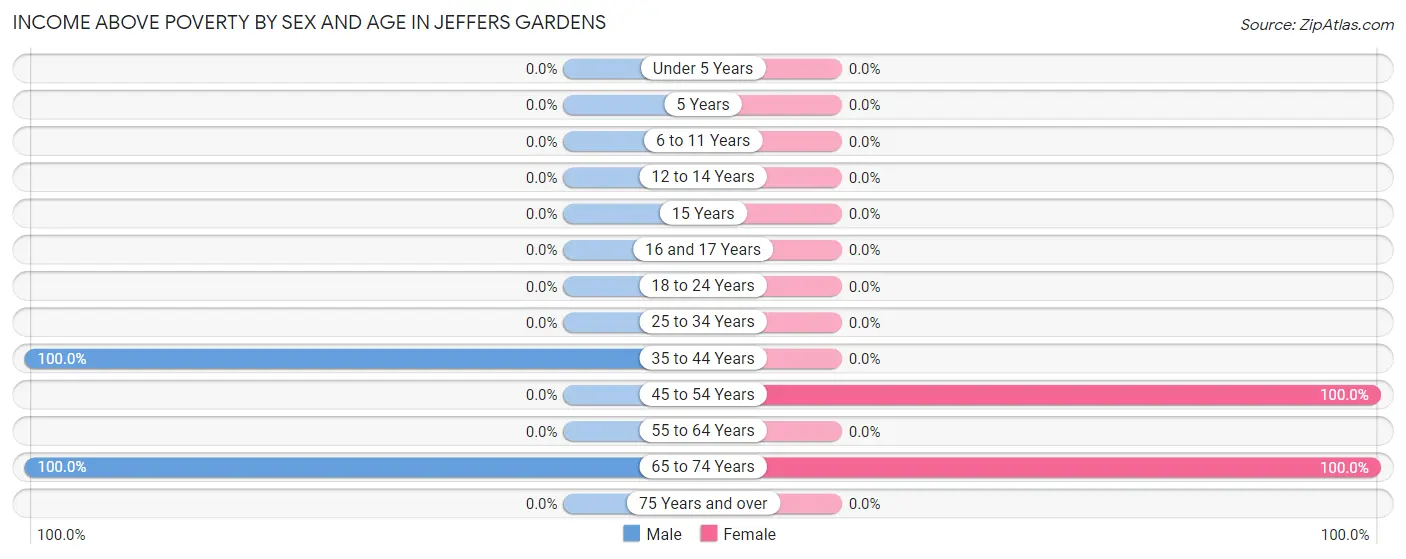
| Age Bracket | Male | Female |
| Under 5 Years | 0 (0.0%) | 0 (0.0%) |
| 5 Years | 0 (0.0%) | 0 (0.0%) |
| 6 to 11 Years | 0 (0.0%) | 0 (0.0%) |
| 12 to 14 Years | 0 (0.0%) | 0 (0.0%) |
| 15 Years | 0 (0.0%) | 0 (0.0%) |
| 16 and 17 Years | 0 (0.0%) | 0 (0.0%) |
| 18 to 24 Years | 0 (0.0%) | 0 (0.0%) |
| 25 to 34 Years | 0 (0.0%) | 0 (0.0%) |
| 35 to 44 Years | 11 (100.0%) | 0 (0.0%) |
| 45 to 54 Years | 0 (0.0%) | 5 (100.0%) |
| 55 to 64 Years | 0 (0.0%) | 0 (0.0%) |
| 65 to 74 Years | 33 (100.0%) | 9 (100.0%) |
| 75 Years and over | 0 (0.0%) | 0 (0.0%) |
| Total | 44 (86.3%) | 14 (21.2%) |
Income Below Poverty Among Married-Couple Families in Jeffers Gardens
The poverty statistics for married-couple families in Jeffers Gardens show that 28.6% or 8 of the total 28 families live below the poverty line. Families with no children have the highest poverty rate of 28.6%, comprising of 8 families. On the other hand, families with no children have the lowest poverty rate of 28.6%, which includes 8 families.
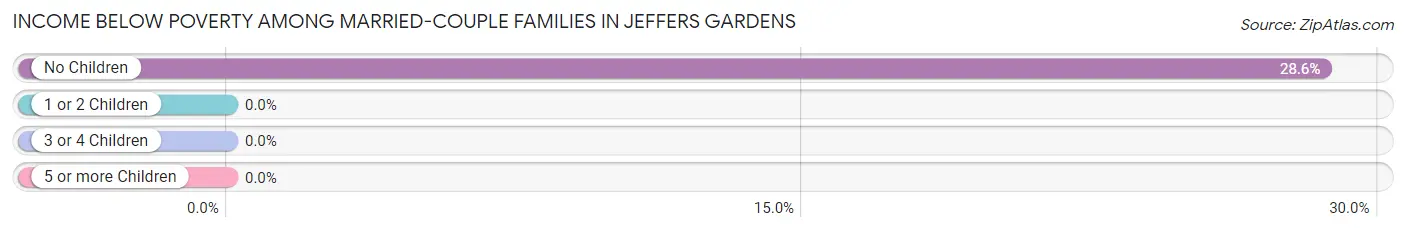
| Children | Above Poverty | Below Poverty |
| No Children | 20 (71.4%) | 8 (28.6%) |
| 1 or 2 Children | 0 (0.0%) | 0 (0.0%) |
| 3 or 4 Children | 0 (0.0%) | 0 (0.0%) |
| 5 or more Children | 0 (0.0%) | 0 (0.0%) |
| Total | 20 (71.4%) | 8 (28.6%) |
Income Below Poverty Among Single-Parent Households in Jeffers Gardens
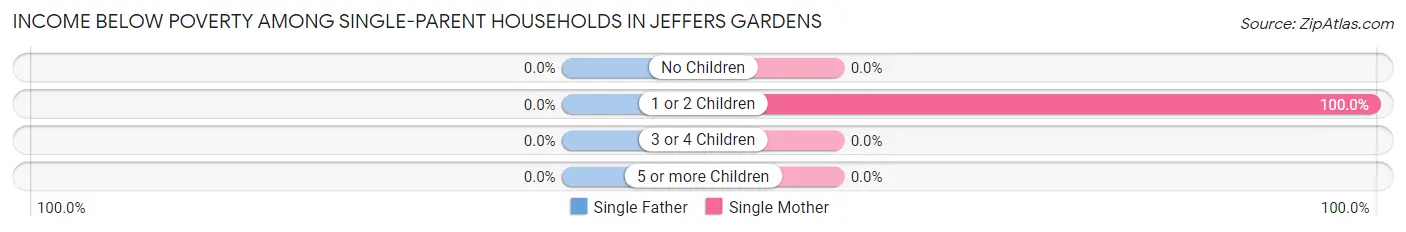
| Children | Single Father | Single Mother |
| No Children | 0 (0.0%) | 0 (0.0%) |
| 1 or 2 Children | 0 (0.0%) | 9 (100.0%) |
| 3 or 4 Children | 0 (0.0%) | 0 (0.0%) |
| 5 or more Children | 0 (0.0%) | 0 (0.0%) |
| Total | 0 (0.0%) | 9 (100.0%) |
Income Below Poverty Among Married-Couple vs Single-Parent Households in Jeffers Gardens
The poverty data for Jeffers Gardens shows that 8 of the married-couple family households (28.6%) and 9 of the single-parent households (100.0%) are living below the poverty level. Within the married-couple family households, those with no children have the highest poverty rate, with 8 households (28.6%) falling below the poverty line. Among the single-parent households, those with 1 or 2 children have the highest poverty rate, with 9 household (100.0%) living below poverty.
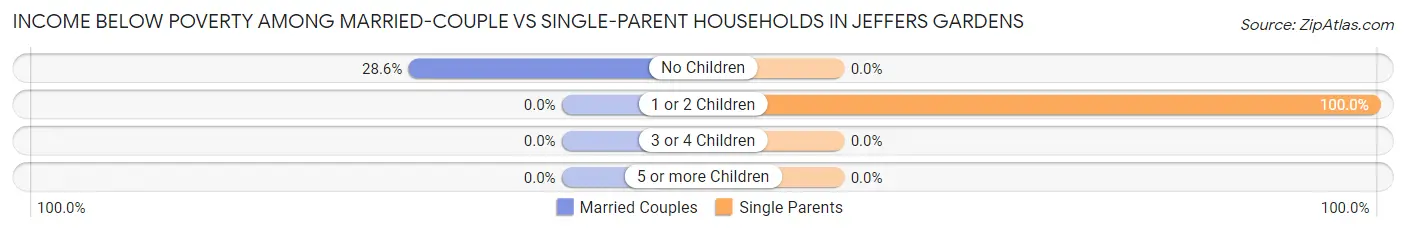
| Children | Married-Couple Families | Single-Parent Households |
| No Children | 8 (28.6%) | 0 (0.0%) |
| 1 or 2 Children | 0 (0.0%) | 9 (100.0%) |
| 3 or 4 Children | 0 (0.0%) | 0 (0.0%) |
| 5 or more Children | 0 (0.0%) | 0 (0.0%) |
| Total | 8 (28.6%) | 9 (100.0%) |
Race in Jeffers Gardens
The most populous races in Jeffers Gardens are White / Caucasian (112 | 95.7%), and Asian (5 | 4.3%).
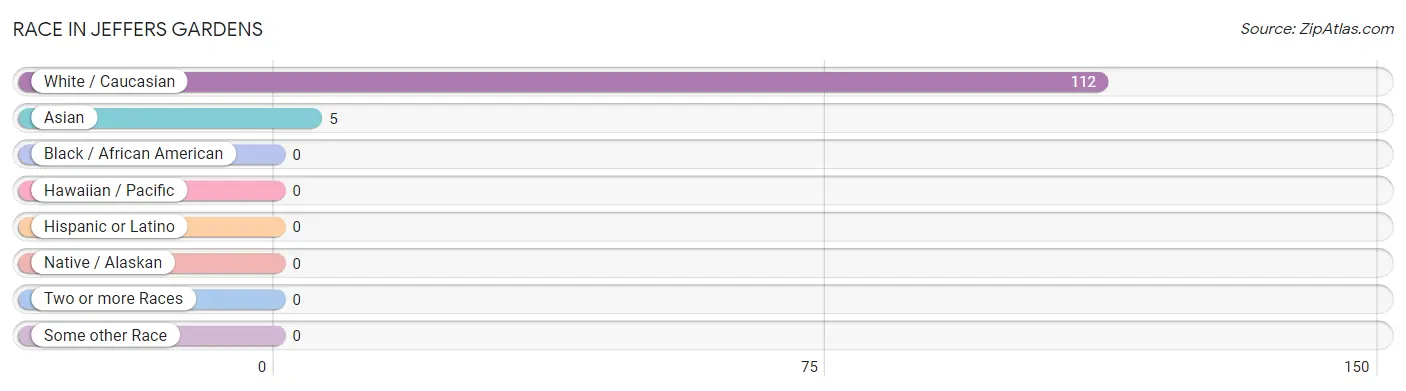
| Race | # Population | % Population |
| Asian | 5 | 4.3% |
| Black / African American | 0 | 0.0% |
| Hawaiian / Pacific | 0 | 0.0% |
| Hispanic or Latino | 0 | 0.0% |
| Native / Alaskan | 0 | 0.0% |
| White / Caucasian | 112 | 95.7% |
| Two or more Races | 0 | 0.0% |
| Some other Race | 0 | 0.0% |
| Total | 117 | 100.0% |
Ancestry in Jeffers Gardens
The most populous ancestries reported in Jeffers Gardens are Polish (26 | 22.2%), Irish (19 | 16.2%), American (18 | 15.4%), German (16 | 13.7%), and Italian (11 | 9.4%), together accounting for 76.9% of all Jeffers Gardens residents.
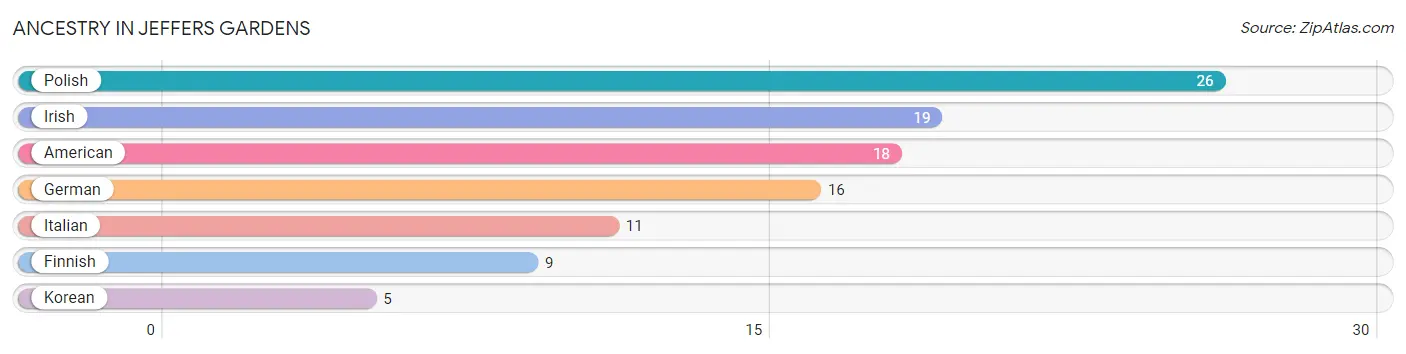
| Ancestry | # Population | % Population |
| American | 18 | 15.4% |
| Finnish | 9 | 7.7% |
| German | 16 | 13.7% |
| Irish | 19 | 16.2% |
| Italian | 11 | 9.4% |
| Korean | 5 | 4.3% |
| Polish | 26 | 22.2% | View All 7 Rows |
Immigrants in Jeffers Gardens
The most numerous immigrant groups reported in Jeffers Gardens came from Asia (5 | 4.3%), Philippines (5 | 4.3%), and South Eastern Asia (5 | 4.3%), together accounting for 12.8% of all Jeffers Gardens residents.
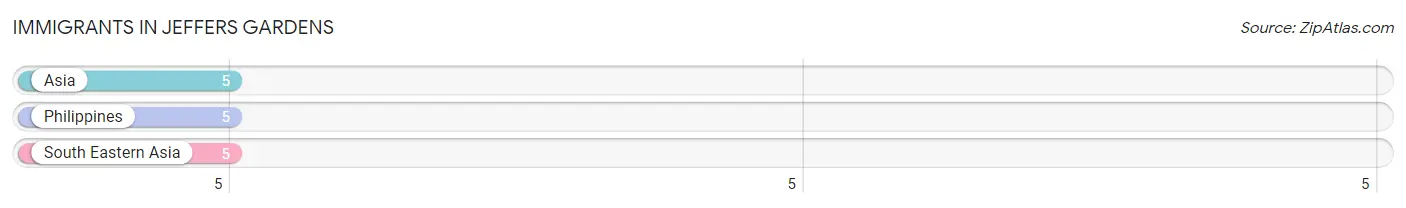
| Immigration Origin | # Population | % Population |
| Asia | 5 | 4.3% |
| Philippines | 5 | 4.3% |
| South Eastern Asia | 5 | 4.3% | View All 3 Rows |
Sex and Age in Jeffers Gardens
Sex and Age in Jeffers Gardens
The most populous age groups in Jeffers Gardens are 65 to 69 Years (20 | 39.2%) for men and 60 to 64 Years (24 | 36.4%) for women.
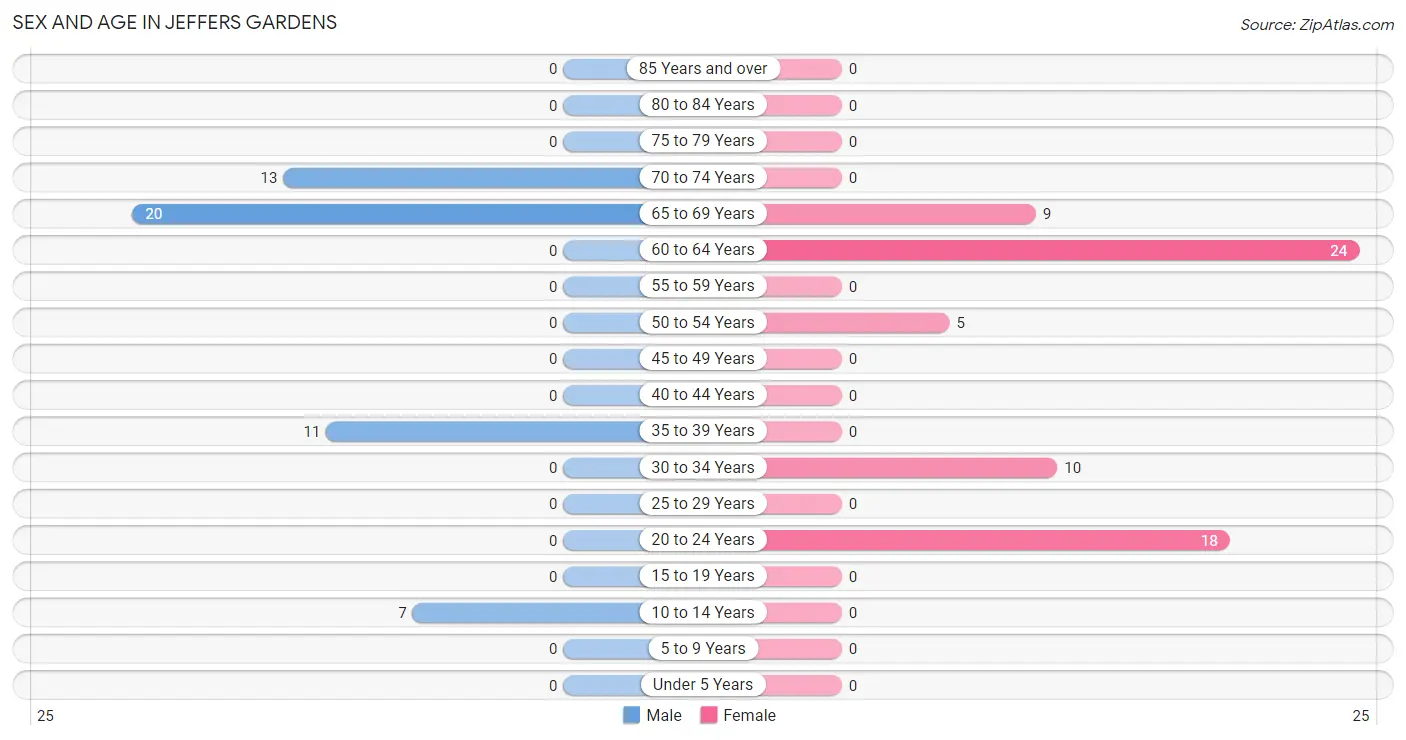
| Age Bracket | Male | Female |
| Under 5 Years | 0 (0.0%) | 0 (0.0%) |
| 5 to 9 Years | 0 (0.0%) | 0 (0.0%) |
| 10 to 14 Years | 7 (13.7%) | 0 (0.0%) |
| 15 to 19 Years | 0 (0.0%) | 0 (0.0%) |
| 20 to 24 Years | 0 (0.0%) | 18 (27.3%) |
| 25 to 29 Years | 0 (0.0%) | 0 (0.0%) |
| 30 to 34 Years | 0 (0.0%) | 10 (15.1%) |
| 35 to 39 Years | 11 (21.6%) | 0 (0.0%) |
| 40 to 44 Years | 0 (0.0%) | 0 (0.0%) |
| 45 to 49 Years | 0 (0.0%) | 0 (0.0%) |
| 50 to 54 Years | 0 (0.0%) | 5 (7.6%) |
| 55 to 59 Years | 0 (0.0%) | 0 (0.0%) |
| 60 to 64 Years | 0 (0.0%) | 24 (36.4%) |
| 65 to 69 Years | 20 (39.2%) | 9 (13.6%) |
| 70 to 74 Years | 13 (25.5%) | 0 (0.0%) |
| 75 to 79 Years | 0 (0.0%) | 0 (0.0%) |
| 80 to 84 Years | 0 (0.0%) | 0 (0.0%) |
| 85 Years and over | 0 (0.0%) | 0 (0.0%) |
| Total | 51 (100.0%) | 66 (100.0%) |
Families and Households in Jeffers Gardens
Median Family Size in Jeffers Gardens
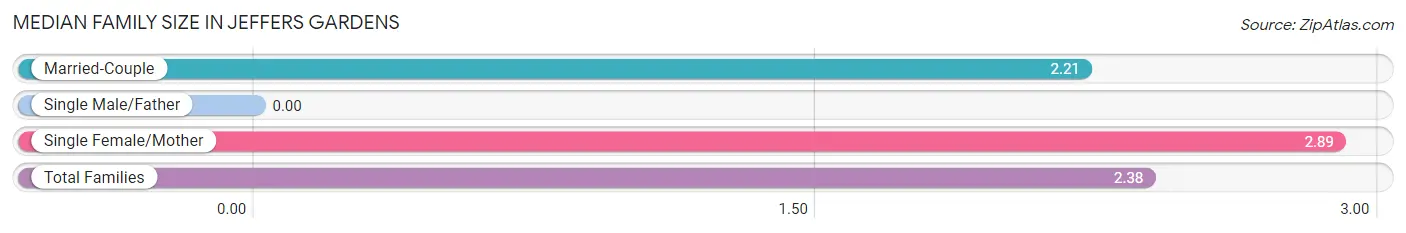
| Family Type | # Families | Family Size |
| Married-Couple | 28 (75.7%) | 2.21 |
| Single Male/Father | 0 (0.0%) | - |
| Single Female/Mother | 9 (24.3%) | 2.89 |
| Total Families | 37 (100.0%) | 2.38 |
Median Household Size in Jeffers Gardens
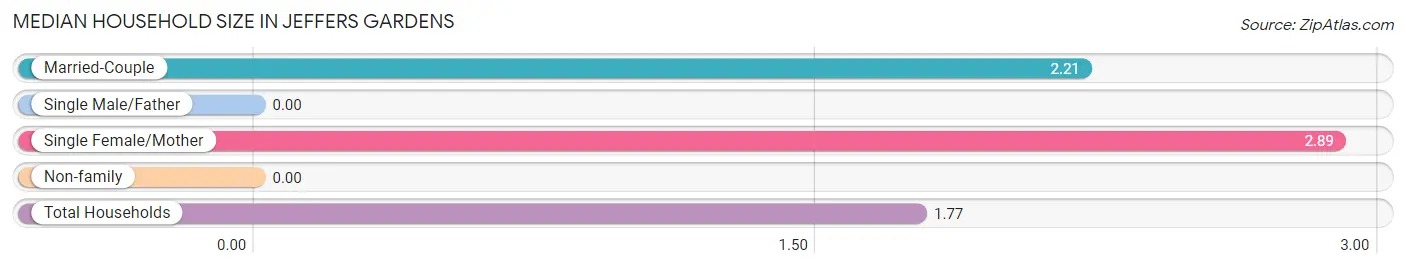
| Household Type | # Households | Household Size |
| Married-Couple | 28 (42.4%) | 2.21 |
| Single Male/Father | 0 (0.0%) | - |
| Single Female/Mother | 9 (13.6%) | 2.89 |
| Non-family | 29 (43.9%) | - |
| Total Households | 66 (100.0%) | 1.77 |
Household Size by Marriage Status in Jeffers Gardens
Out of a total of 66 households in Jeffers Gardens, 37 (56.1%) are family households, while 29 (43.9%) are nonfamily households. The most numerous type of family households are 3-person households, comprising 20, and the most common type of nonfamily households are 1-person households, comprising 29.
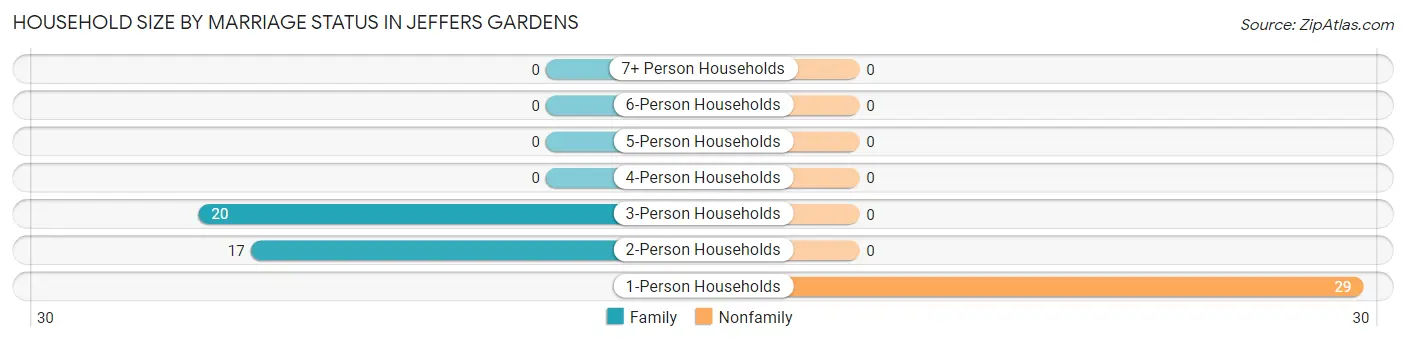
| Household Size | Family Households | Nonfamily Households |
| 1-Person Households | - | 29 (43.9%) |
| 2-Person Households | 17 (25.8%) | 0 (0.0%) |
| 3-Person Households | 20 (30.3%) | 0 (0.0%) |
| 4-Person Households | 0 (0.0%) | 0 (0.0%) |
| 5-Person Households | 0 (0.0%) | 0 (0.0%) |
| 6-Person Households | 0 (0.0%) | 0 (0.0%) |
| 7+ Person Households | 0 (0.0%) | 0 (0.0%) |
| Total | 37 (56.1%) | 29 (43.9%) |
Female Fertility in Jeffers Gardens
Fertility by Age in Jeffers Gardens
| Age Bracket | Women with Births | Births / 1,000 Women |
| 15 to 19 years | 0 (0.0%) | 0.0 |
| 20 to 34 years | 0 (0.0%) | 0.0 |
| 35 to 50 years | 0 (0.0%) | 0.0 |
| Total | 0 (0.0%) | 0.0 |
Fertility by Age by Marriage Status in Jeffers Gardens
| Age Bracket | Married | Unmarried |
| 15 to 19 years | 0 (0.0%) | 0 (0.0%) |
| 20 to 34 years | 0 (0.0%) | 0 (0.0%) |
| 35 to 50 years | 0 (0.0%) | 0 (0.0%) |
| Total | 0 (0.0%) | 0 (0.0%) |
Fertility by Education in Jeffers Gardens
| Educational Attainment | Women with Births | Births / 1,000 Women |
| Less than High School | 0 (0.0%) | 0.0 |
| High School Diploma | 0 (0.0%) | 0.0 |
| College or Associate's Degree | 0 (0.0%) | 0.0 |
| Bachelor's Degree | 0 (0.0%) | 0.0 |
| Graduate Degree | 0 (0.0%) | 0.0 |
| Total | 0 (0.0%) | 0.0 |
Fertility by Education by Marriage Status in Jeffers Gardens
| Educational Attainment | Married | Unmarried |
| Less than High School | 0 (0.0%) | 0 (0.0%) |
| High School Diploma | 0 (0.0%) | 0 (0.0%) |
| College or Associate's Degree | 0 (0.0%) | 0 (0.0%) |
| Bachelor's Degree | 0 (0.0%) | 0 (0.0%) |
| Graduate Degree | 0 (0.0%) | 0 (0.0%) |
| Total | 0 (0.0%) | 0 (0.0%) |
Employment Characteristics in Jeffers Gardens
Employment by Class of Employer in Jeffers Gardens
Among the 25 employed individuals in Jeffers Gardens, federal government employees (11 | 44.0%), private company employees (9 | 36.0%), and not-for-profit organizations (5 | 20.0%) make up the most common classes of employment.
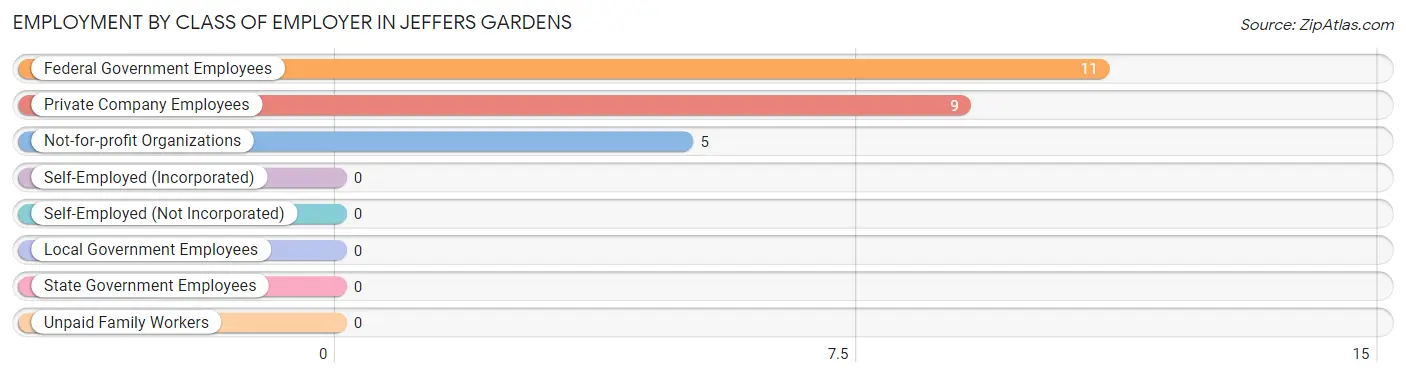
| Employer Class | # Employees | % Employees |
| Private Company Employees | 9 | 36.0% |
| Self-Employed (Incorporated) | 0 | 0.0% |
| Self-Employed (Not Incorporated) | 0 | 0.0% |
| Not-for-profit Organizations | 5 | 20.0% |
| Local Government Employees | 0 | 0.0% |
| State Government Employees | 0 | 0.0% |
| Federal Government Employees | 11 | 44.0% |
| Unpaid Family Workers | 0 | 0.0% |
| Total | 25 | 100.0% |
Employment Status by Age in Jeffers Gardens
According to the labor force statistics for Jeffers Gardens, out of the total population over 16 years of age (110), 48.2% or 53 individuals are in the labor force, with 52.8% or 28 of them unemployed. The age group with the highest labor force participation rate is 20 to 24 years, with 100.0% or 18 individuals in the labor force. Within the labor force, the 20 to 24 years age range has the highest percentage of unemployed individuals, with 100.0% or 18 of them being unemployed.
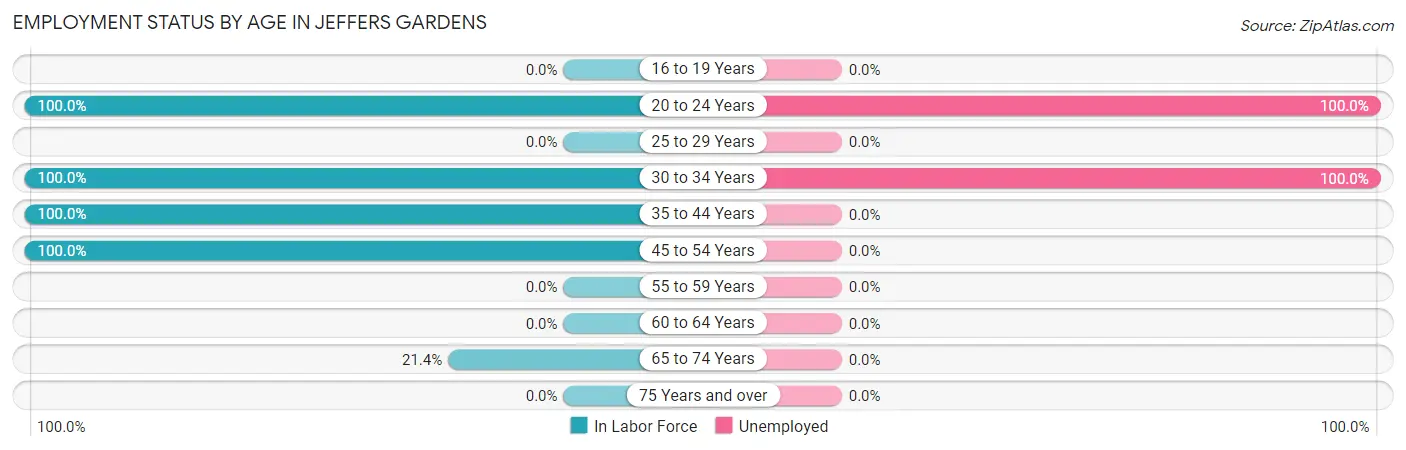
| Age Bracket | In Labor Force | Unemployed |
| 16 to 19 Years | 0 (0.0%) | 0 (0.0%) |
| 20 to 24 Years | 18 (100.0%) | 18 (100.0%) |
| 25 to 29 Years | 0 (0.0%) | 0 (0.0%) |
| 30 to 34 Years | 10 (100.0%) | 10 (100.0%) |
| 35 to 44 Years | 11 (100.0%) | 0 (0.0%) |
| 45 to 54 Years | 5 (100.0%) | 0 (0.0%) |
| 55 to 59 Years | 0 (0.0%) | 0 (0.0%) |
| 60 to 64 Years | 0 (0.0%) | 0 (0.0%) |
| 65 to 74 Years | 9 (21.4%) | 0 (0.0%) |
| 75 Years and over | 0 (0.0%) | 0 (0.0%) |
| Total | 53 (48.2%) | 28 (52.8%) |
Employment Status by Educational Attainment in Jeffers Gardens
According to labor force statistics for Jeffers Gardens, 52.0% of individuals (26) out of the total population between 25 and 64 years of age (50) are in the labor force, with 38.5% or 10 of them being unemployed. The group with the highest labor force participation rate are those with the educational attainment of high school diploma, with 100.0% or 21 individuals in the labor force. Within the labor force, individuals with high school diploma education have the highest percentage of unemployment, with 47.6% or 10 of them being unemployed.
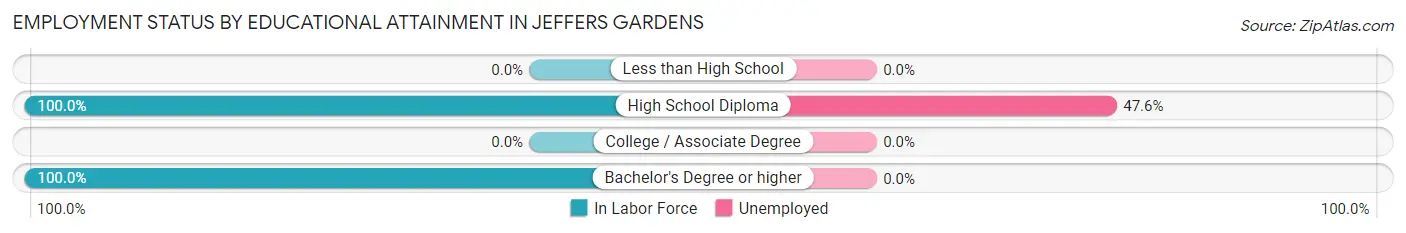
| Educational Attainment | In Labor Force | Unemployed |
| Less than High School | 0 (0.0%) | 0 (0.0%) |
| High School Diploma | 21 (100.0%) | 10 (47.6%) |
| College / Associate Degree | 0 (0.0%) | 0 (0.0%) |
| Bachelor's Degree or higher | 5 (100.0%) | 0 (0.0%) |
| Total | 26 (52.0%) | 19 (38.5%) |
Employment Occupations by Sex in Jeffers Gardens
Management, Business, Science and Arts Occupations
Management, Business, Science and Arts Occupations by Sex
| Occupation | Male | Female |
| Management | 0 (0.0%) | 0 (0.0%) |
| Business & Financial | 0 (0.0%) | 0 (0.0%) |
| Computers, Engineering & Science | 0 (0.0%) | 0 (0.0%) |
| Computers & Mathematics | 0 (0.0%) | 0 (0.0%) |
| Architecture & Engineering | 0 (0.0%) | 0 (0.0%) |
| Life, Physical & Social Science | 0 (0.0%) | 0 (0.0%) |
| Community & Social Service | 0 (0.0%) | 0 (0.0%) |
| Education, Arts & Media | 0 (0.0%) | 0 (0.0%) |
| Legal Services & Support | 0 (0.0%) | 0 (0.0%) |
| Education Instruction & Library | 0 (0.0%) | 0 (0.0%) |
| Arts, Media & Entertainment | 0 (0.0%) | 0 (0.0%) |
| Health Diagnosing & Treating | 0 (0.0%) | 0 (0.0%) |
| Health Technologists | 0 (0.0%) | 0 (0.0%) |
| Total (Category) | 0 (0.0%) | 0 (0.0%) |
| Total (Overall) | 20 (80.0%) | 5 (20.0%) |
Services Occupations
Services Occupations by Sex
| Occupation | Male | Female |
| Healthcare Support | 0 (0.0%) | 0 (0.0%) |
| Security & Protection | 0 (0.0%) | 0 (0.0%) |
| Firefighting & Prevention | 0 (0.0%) | 0 (0.0%) |
| Law Enforcement | 0 (0.0%) | 0 (0.0%) |
| Food Preparation & Serving | 0 (0.0%) | 0 (0.0%) |
| Cleaning & Maintenance | 0 (0.0%) | 0 (0.0%) |
| Personal Care & Service | 0 (0.0%) | 0 (0.0%) |
| Total (Category) | 0 (0.0%) | 0 (0.0%) |
| Total (Overall) | 20 (80.0%) | 5 (20.0%) |
Sales and Office Occupations
Sales and Office Occupations by Sex
| Occupation | Male | Female |
| Sales & Related | 0 (0.0%) | 0 (0.0%) |
| Office & Administration | 0 (0.0%) | 0 (0.0%) |
| Total (Category) | 0 (0.0%) | 0 (0.0%) |
| Total (Overall) | 20 (80.0%) | 5 (20.0%) |
Natural Resources, Construction and Maintenance Occupations
The most common Natural Resources, Construction and Maintenance occupations in Jeffers Gardens are , and Installation, Maintenance & Repair (11 | 44.0%).
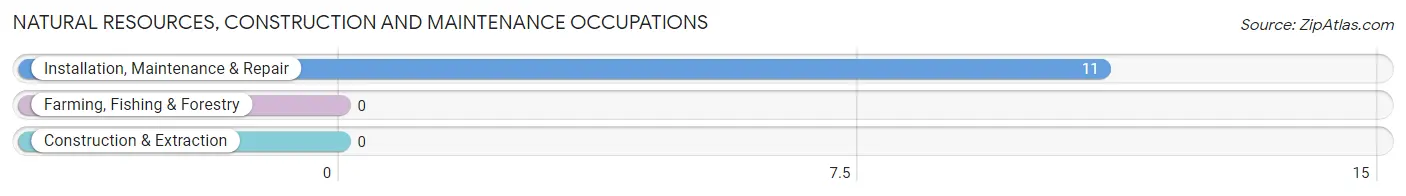
Natural Resources, Construction and Maintenance Occupations by Sex
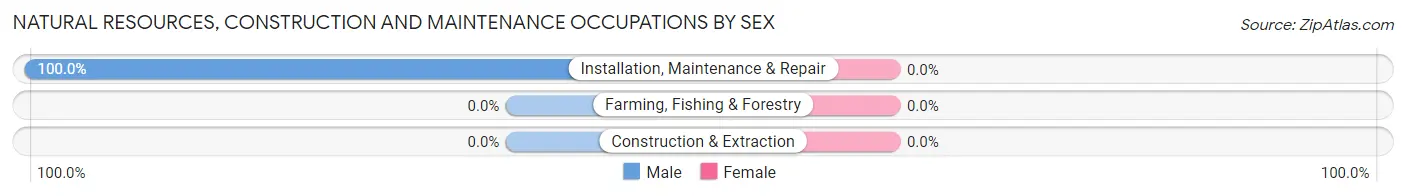
| Occupation | Male | Female |
| Farming, Fishing & Forestry | 0 (0.0%) | 0 (0.0%) |
| Construction & Extraction | 0 (0.0%) | 0 (0.0%) |
| Installation, Maintenance & Repair | 11 (100.0%) | 0 (0.0%) |
| Total (Category) | 11 (100.0%) | 0 (0.0%) |
| Total (Overall) | 20 (80.0%) | 5 (20.0%) |
Production, Transportation and Moving Occupations
The most common Production, Transportation and Moving occupations in Jeffers Gardens are Material Moving (9 | 36.0%), and Production (5 | 20.0%).
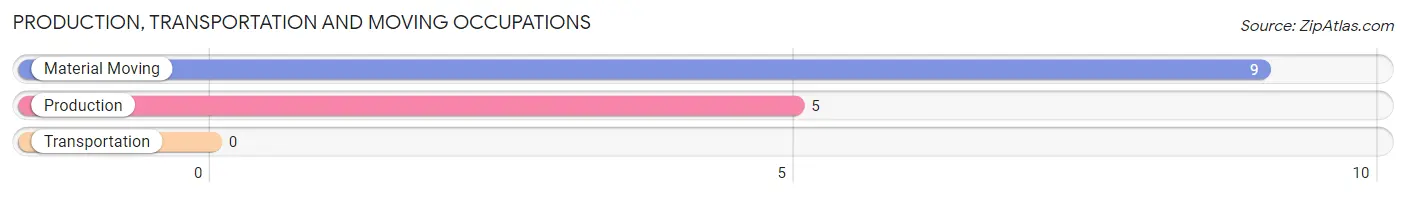
Production, Transportation and Moving Occupations by Sex
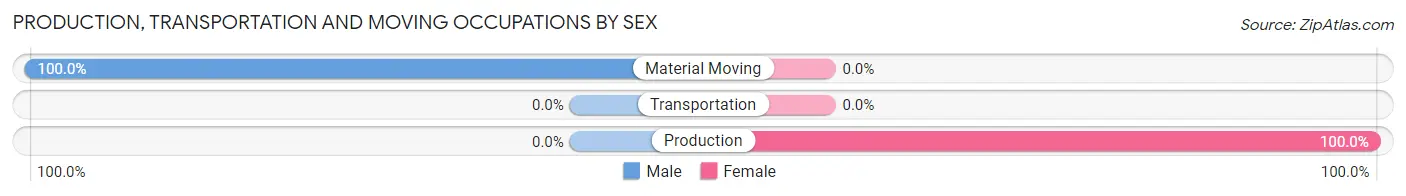
| Occupation | Male | Female |
| Production | 0 (0.0%) | 5 (100.0%) |
| Transportation | 0 (0.0%) | 0 (0.0%) |
| Material Moving | 9 (100.0%) | 0 (0.0%) |
| Total (Category) | 9 (64.3%) | 5 (35.7%) |
| Total (Overall) | 20 (80.0%) | 5 (20.0%) |
Employment Industries by Sex in Jeffers Gardens
Employment Industries in Jeffers Gardens
The major employment industries in Jeffers Gardens include Public Administration (11 | 44.0%), Transportation & Warehousing (9 | 36.0%), and Health Care & Social Assistance (5 | 20.0%).
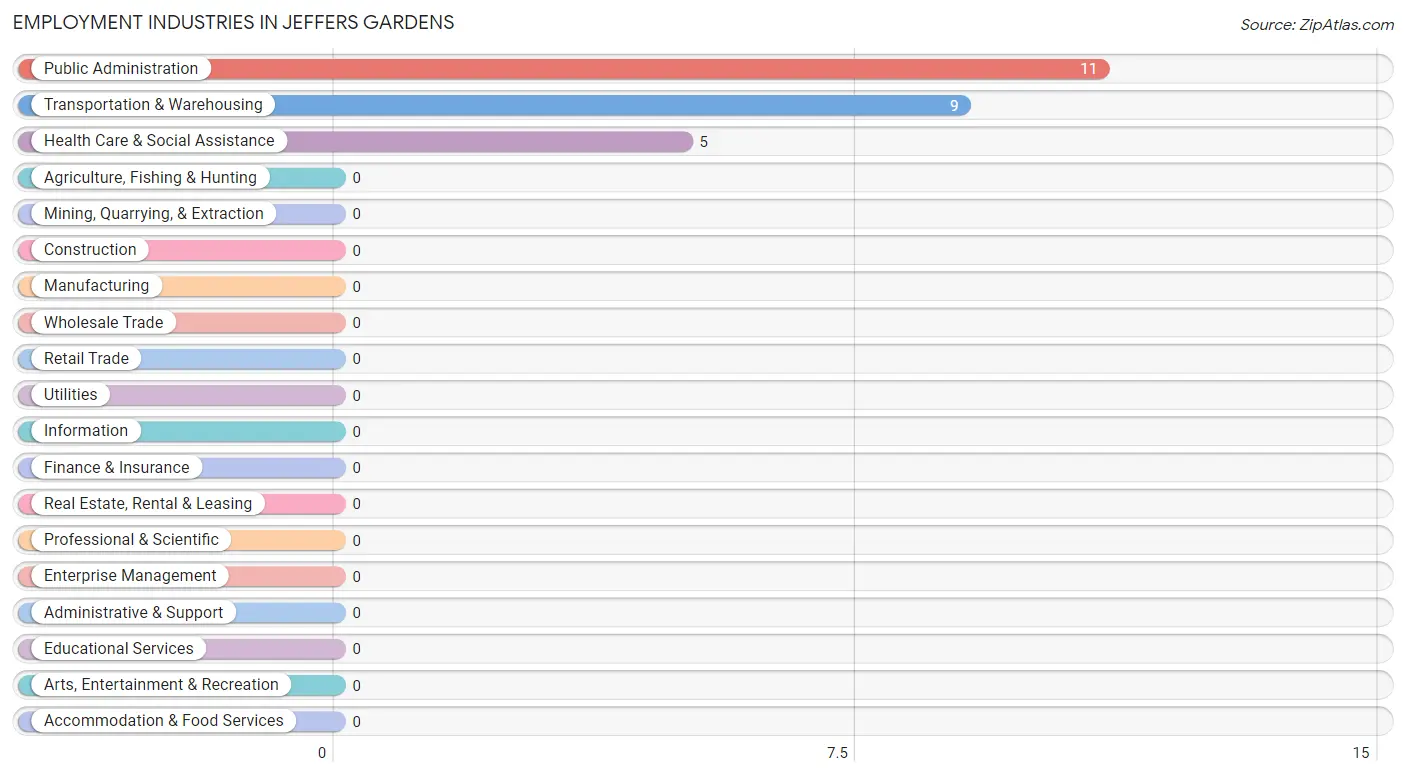
Employment Industries by Sex in Jeffers Gardens
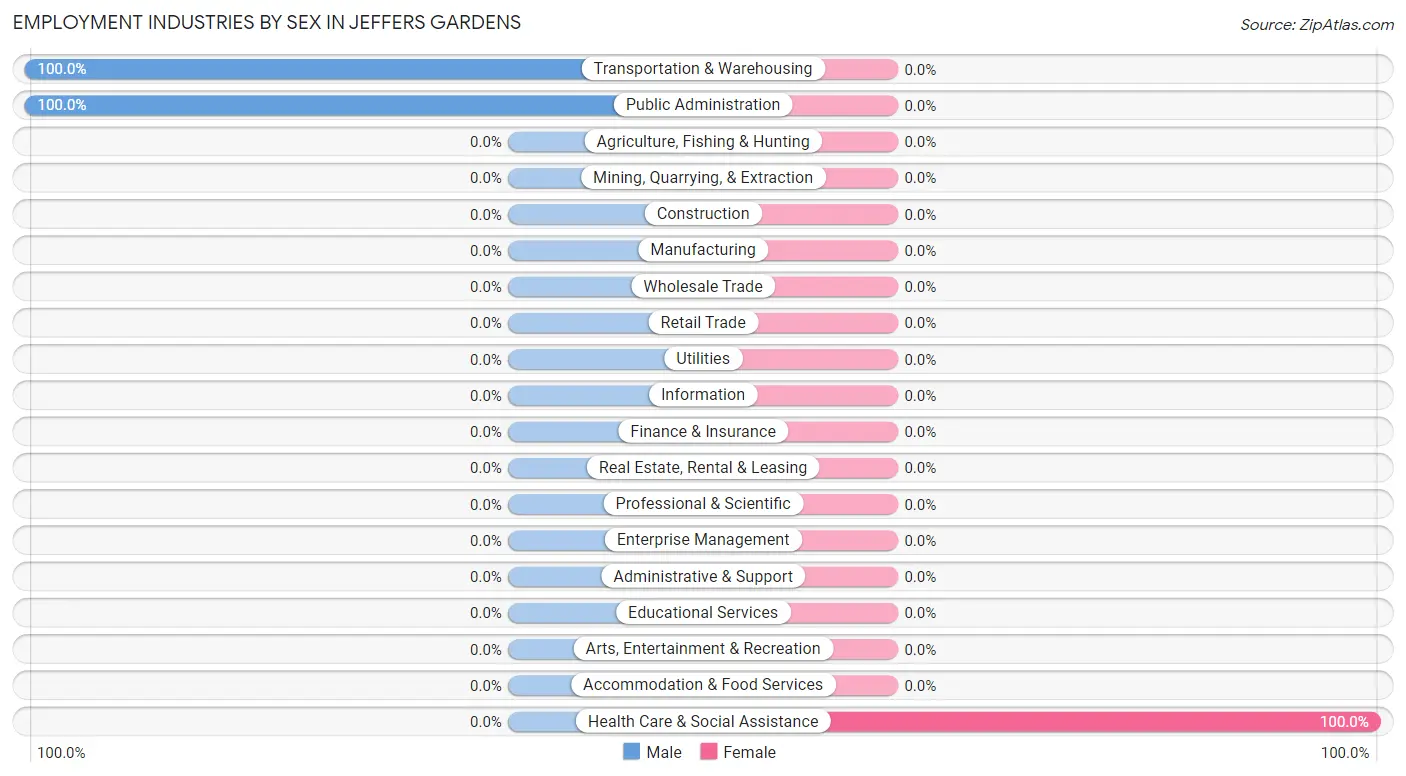
| Industry | Male | Female |
| Agriculture, Fishing & Hunting | 0 (0.0%) | 0 (0.0%) |
| Mining, Quarrying, & Extraction | 0 (0.0%) | 0 (0.0%) |
| Construction | 0 (0.0%) | 0 (0.0%) |
| Manufacturing | 0 (0.0%) | 0 (0.0%) |
| Wholesale Trade | 0 (0.0%) | 0 (0.0%) |
| Retail Trade | 0 (0.0%) | 0 (0.0%) |
| Transportation & Warehousing | 9 (100.0%) | 0 (0.0%) |
| Utilities | 0 (0.0%) | 0 (0.0%) |
| Information | 0 (0.0%) | 0 (0.0%) |
| Finance & Insurance | 0 (0.0%) | 0 (0.0%) |
| Real Estate, Rental & Leasing | 0 (0.0%) | 0 (0.0%) |
| Professional & Scientific | 0 (0.0%) | 0 (0.0%) |
| Enterprise Management | 0 (0.0%) | 0 (0.0%) |
| Administrative & Support | 0 (0.0%) | 0 (0.0%) |
| Educational Services | 0 (0.0%) | 0 (0.0%) |
| Health Care & Social Assistance | 0 (0.0%) | 5 (100.0%) |
| Arts, Entertainment & Recreation | 0 (0.0%) | 0 (0.0%) |
| Accommodation & Food Services | 0 (0.0%) | 0 (0.0%) |
| Public Administration | 11 (100.0%) | 0 (0.0%) |
| Total | 20 (80.0%) | 5 (20.0%) |
Education in Jeffers Gardens
School Enrollment in Jeffers Gardens
The most common levels of schooling among the 16 students in Jeffers Gardens are college / undergraduate (9 | 56.2%), and middle school (7 | 43.8%).
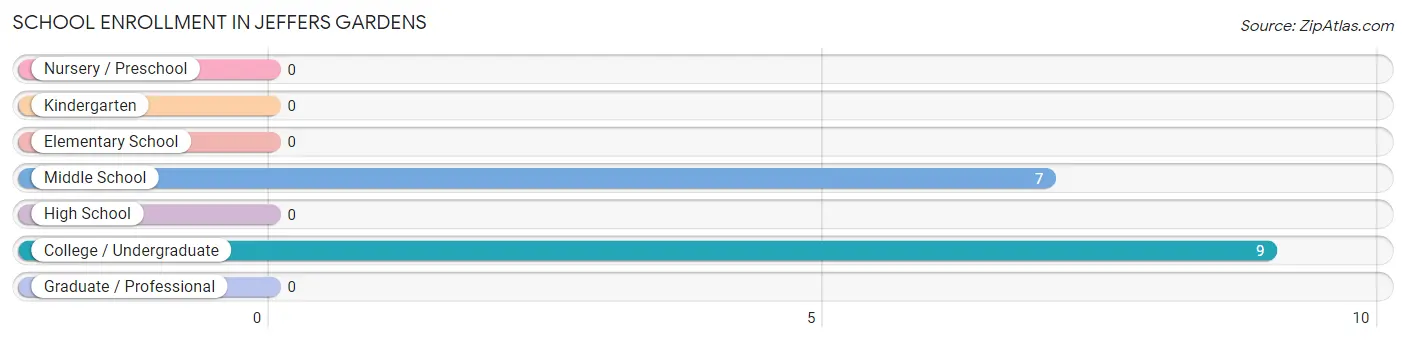
| School Level | # Students | % Students |
| Nursery / Preschool | 0 | 0.0% |
| Kindergarten | 0 | 0.0% |
| Elementary School | 0 | 0.0% |
| Middle School | 7 | 43.8% |
| High School | 0 | 0.0% |
| College / Undergraduate | 9 | 56.2% |
| Graduate / Professional | 0 | 0.0% |
| Total | 16 | 100.0% |
School Enrollment by Age by Funding Source in Jeffers Gardens
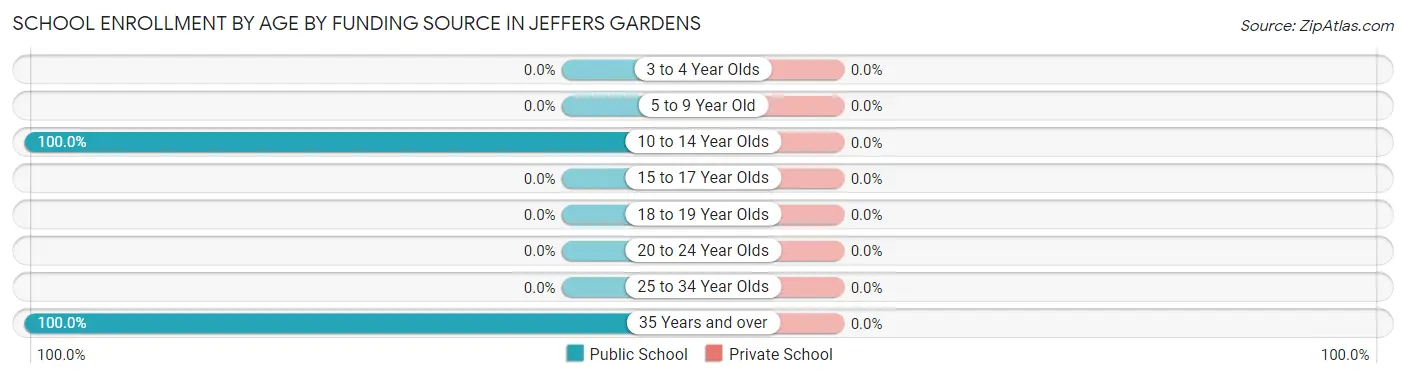
| Age Bracket | Public School | Private School |
| 3 to 4 Year Olds | 0 (0.0%) | 0 (0.0%) |
| 5 to 9 Year Old | 0 (0.0%) | 0 (0.0%) |
| 10 to 14 Year Olds | 7 (100.0%) | 0 (0.0%) |
| 15 to 17 Year Olds | 0 (0.0%) | 0 (0.0%) |
| 18 to 19 Year Olds | 0 (0.0%) | 0 (0.0%) |
| 20 to 24 Year Olds | 0 (0.0%) | 0 (0.0%) |
| 25 to 34 Year Olds | 0 (0.0%) | 0 (0.0%) |
| 35 Years and over | 9 (100.0%) | 0 (0.0%) |
| Total | 16 (100.0%) | 0 (0.0%) |
Educational Attainment by Field of Study in Jeffers Gardens
Social sciences (13 | 72.2%), and education (5 | 27.8%) are the most common fields of study among 18 individuals in Jeffers Gardens who have obtained a bachelor's degree or higher.
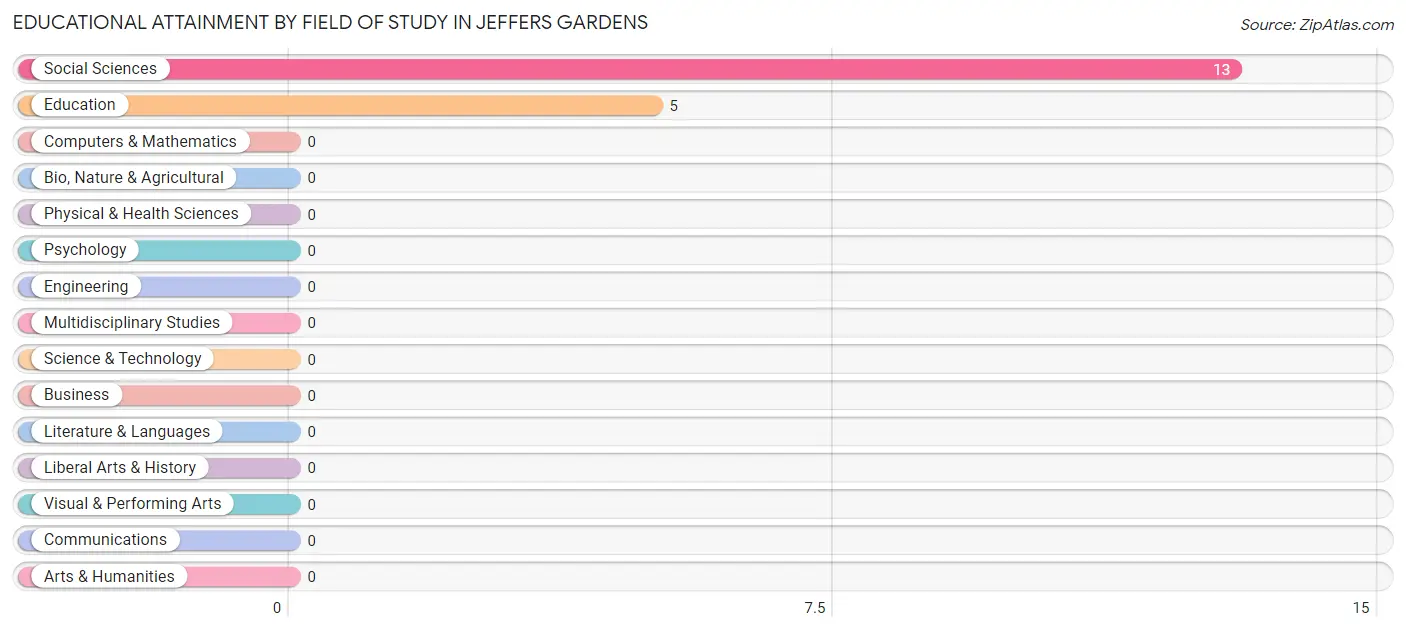
| Field of Study | # Graduates | % Graduates |
| Computers & Mathematics | 0 | 0.0% |
| Bio, Nature & Agricultural | 0 | 0.0% |
| Physical & Health Sciences | 0 | 0.0% |
| Psychology | 0 | 0.0% |
| Social Sciences | 13 | 72.2% |
| Engineering | 0 | 0.0% |
| Multidisciplinary Studies | 0 | 0.0% |
| Science & Technology | 0 | 0.0% |
| Business | 0 | 0.0% |
| Education | 5 | 27.8% |
| Literature & Languages | 0 | 0.0% |
| Liberal Arts & History | 0 | 0.0% |
| Visual & Performing Arts | 0 | 0.0% |
| Communications | 0 | 0.0% |
| Arts & Humanities | 0 | 0.0% |
| Total | 18 | 100.0% |
Transportation & Commute in Jeffers Gardens
Vehicle Availability by Sex in Jeffers Gardens
The most prevalent vehicle ownership categories in Jeffers Gardens are males with 5 or more vehicles (11, accounting for 55.0%) and females with 5 or more vehicles (0, making up 220.0%).
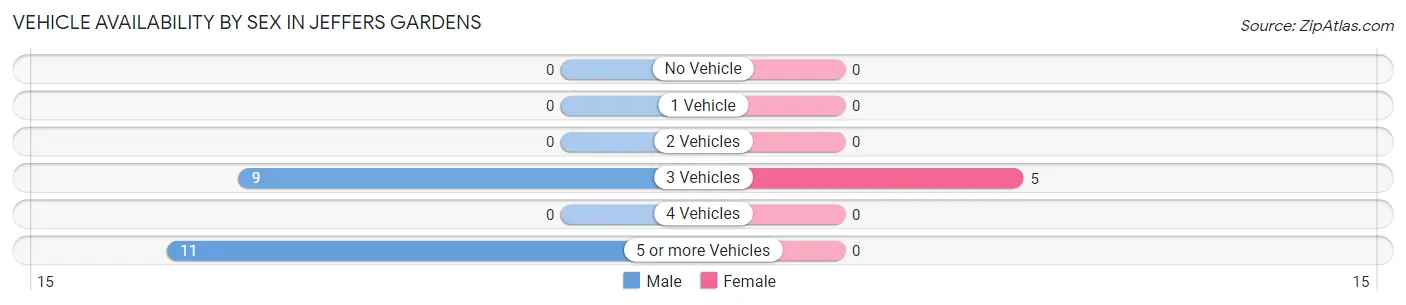
| Vehicles Available | Male | Female |
| No Vehicle | 0 (0.0%) | 0 (0.0%) |
| 1 Vehicle | 0 (0.0%) | 0 (0.0%) |
| 2 Vehicles | 0 (0.0%) | 0 (0.0%) |
| 3 Vehicles | 9 (45.0%) | 5 (100.0%) |
| 4 Vehicles | 0 (0.0%) | 0 (0.0%) |
| 5 or more Vehicles | 11 (55.0%) | 0 (0.0%) |
| Total | 20 (100.0%) | 5 (100.0%) |
Commute Time in Jeffers Gardens
The most frequently occuring commute durations in Jeffers Gardens are 10 to 14 minutes (16 commuters, 64.0%), 5 to 9 minutes (9 commuters, 36.0%), and less than 5 minutes (0 commuters, 0.0%).
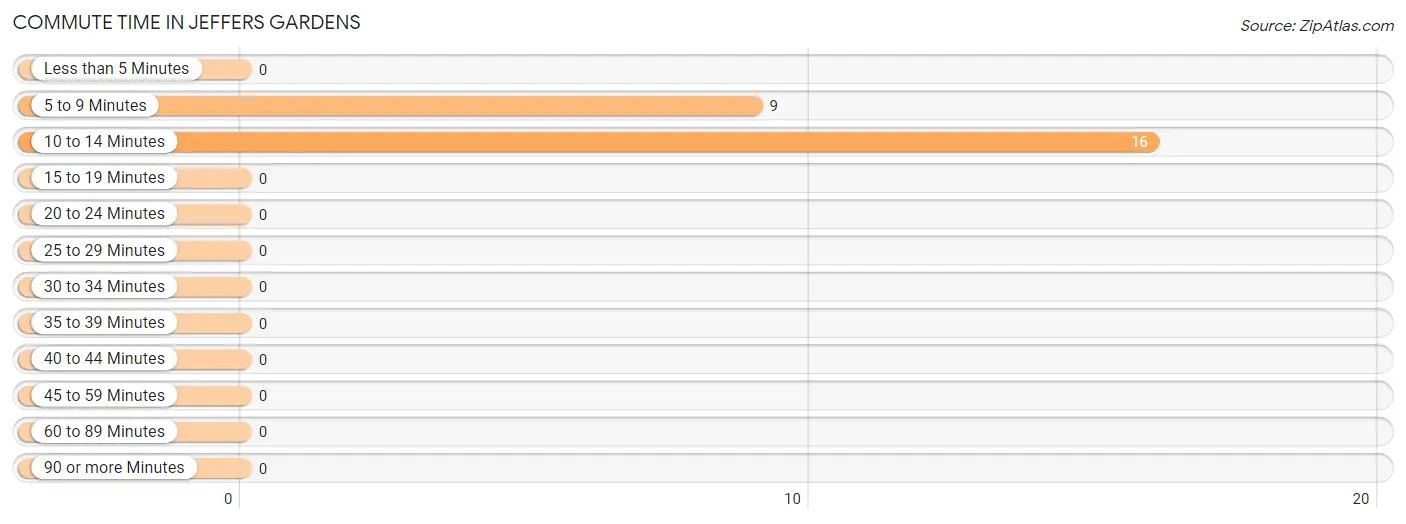
| Commute Time | # Commuters | % Commuters |
| Less than 5 Minutes | 0 | 0.0% |
| 5 to 9 Minutes | 9 | 36.0% |
| 10 to 14 Minutes | 16 | 64.0% |
| 15 to 19 Minutes | 0 | 0.0% |
| 20 to 24 Minutes | 0 | 0.0% |
| 25 to 29 Minutes | 0 | 0.0% |
| 30 to 34 Minutes | 0 | 0.0% |
| 35 to 39 Minutes | 0 | 0.0% |
| 40 to 44 Minutes | 0 | 0.0% |
| 45 to 59 Minutes | 0 | 0.0% |
| 60 to 89 Minutes | 0 | 0.0% |
| 90 or more Minutes | 0 | 0.0% |
Commute Time by Sex in Jeffers Gardens
The most common commute times in Jeffers Gardens are 10 to 14 minutes (11 commuters, 55.0%) for males and 10 to 14 minutes (5 commuters, 100.0%) for females.
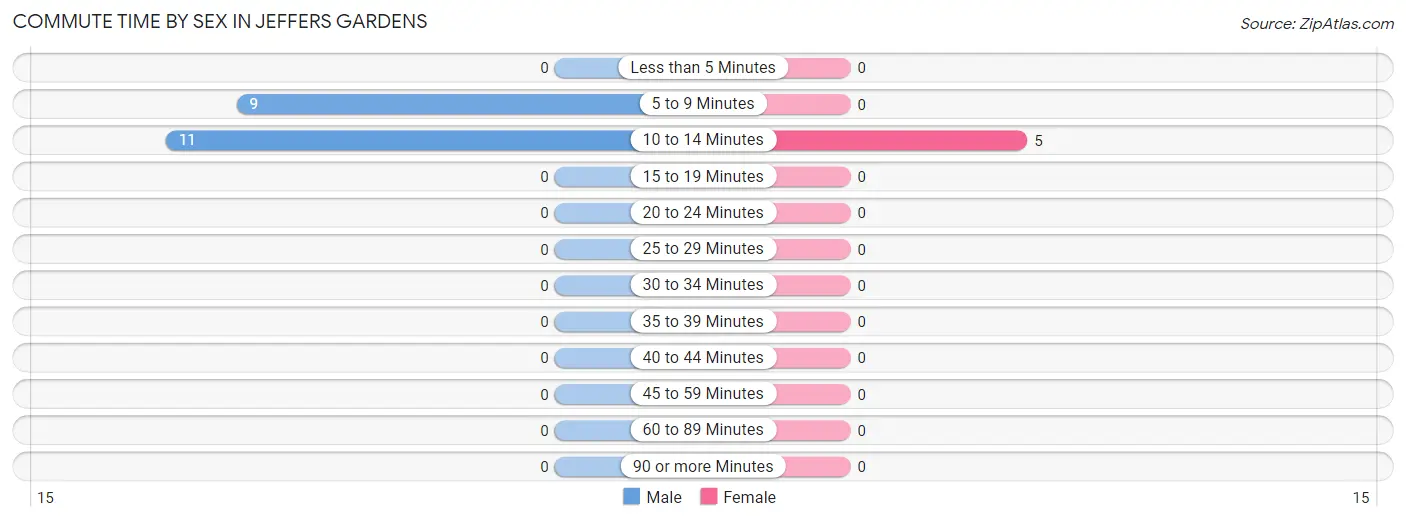
| Commute Time | Male | Female |
| Less than 5 Minutes | 0 (0.0%) | 0 (0.0%) |
| 5 to 9 Minutes | 9 (45.0%) | 0 (0.0%) |
| 10 to 14 Minutes | 11 (55.0%) | 5 (100.0%) |
| 15 to 19 Minutes | 0 (0.0%) | 0 (0.0%) |
| 20 to 24 Minutes | 0 (0.0%) | 0 (0.0%) |
| 25 to 29 Minutes | 0 (0.0%) | 0 (0.0%) |
| 30 to 34 Minutes | 0 (0.0%) | 0 (0.0%) |
| 35 to 39 Minutes | 0 (0.0%) | 0 (0.0%) |
| 40 to 44 Minutes | 0 (0.0%) | 0 (0.0%) |
| 45 to 59 Minutes | 0 (0.0%) | 0 (0.0%) |
| 60 to 89 Minutes | 0 (0.0%) | 0 (0.0%) |
| 90 or more Minutes | 0 (0.0%) | 0 (0.0%) |
Time of Departure to Work by Sex in Jeffers Gardens
The most frequent times of departure to work in Jeffers Gardens are 6:30 AM to 6:59 AM (20, 100.0%) for males and 6:30 AM to 6:59 AM (5, 100.0%) for females.
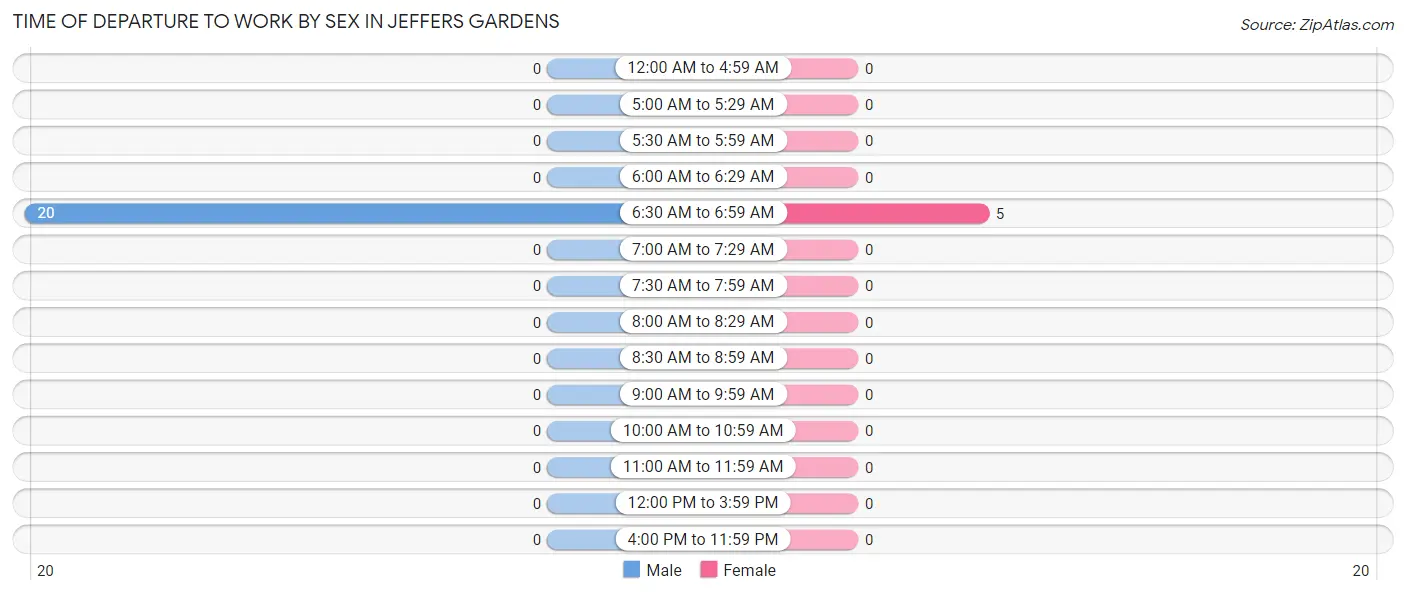
| Time of Departure | Male | Female |
| 12:00 AM to 4:59 AM | 0 (0.0%) | 0 (0.0%) |
| 5:00 AM to 5:29 AM | 0 (0.0%) | 0 (0.0%) |
| 5:30 AM to 5:59 AM | 0 (0.0%) | 0 (0.0%) |
| 6:00 AM to 6:29 AM | 0 (0.0%) | 0 (0.0%) |
| 6:30 AM to 6:59 AM | 20 (100.0%) | 5 (100.0%) |
| 7:00 AM to 7:29 AM | 0 (0.0%) | 0 (0.0%) |
| 7:30 AM to 7:59 AM | 0 (0.0%) | 0 (0.0%) |
| 8:00 AM to 8:29 AM | 0 (0.0%) | 0 (0.0%) |
| 8:30 AM to 8:59 AM | 0 (0.0%) | 0 (0.0%) |
| 9:00 AM to 9:59 AM | 0 (0.0%) | 0 (0.0%) |
| 10:00 AM to 10:59 AM | 0 (0.0%) | 0 (0.0%) |
| 11:00 AM to 11:59 AM | 0 (0.0%) | 0 (0.0%) |
| 12:00 PM to 3:59 PM | 0 (0.0%) | 0 (0.0%) |
| 4:00 PM to 11:59 PM | 0 (0.0%) | 0 (0.0%) |
| Total | 20 (100.0%) | 5 (100.0%) |
Housing Occupancy in Jeffers Gardens
Occupancy by Ownership in Jeffers Gardens
Of the total 66 dwellings in Jeffers Gardens, owner-occupied units account for 39 (59.1%), while renter-occupied units make up 27 (40.9%).
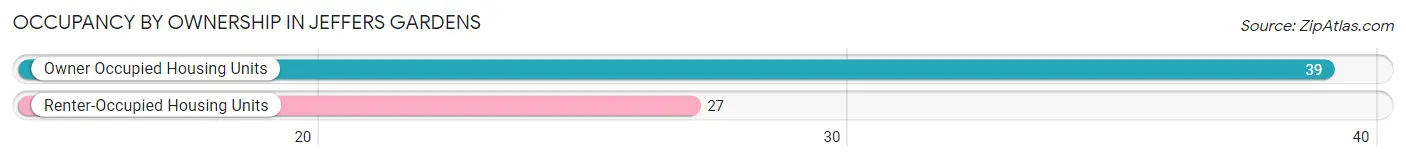
| Occupancy | # Housing Units | % Housing Units |
| Owner Occupied Housing Units | 39 | 59.1% |
| Renter-Occupied Housing Units | 27 | 40.9% |
| Total Occupied Housing Units | 66 | 100.0% |
Occupancy by Household Size in Jeffers Gardens
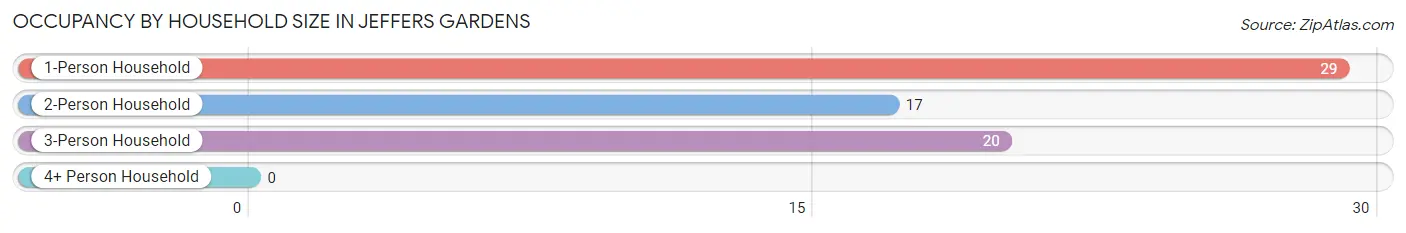
| Household Size | # Housing Units | % Housing Units |
| 1-Person Household | 29 | 43.9% |
| 2-Person Household | 17 | 25.8% |
| 3-Person Household | 20 | 30.3% |
| 4+ Person Household | 0 | 0.0% |
| Total Housing Units | 66 | 100.0% |
Occupancy by Ownership by Household Size in Jeffers Gardens
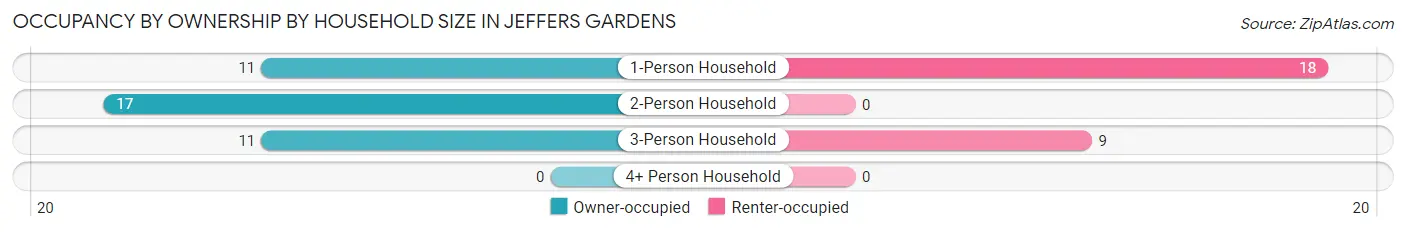
| Household Size | Owner-occupied | Renter-occupied |
| 1-Person Household | 11 (37.9%) | 18 (62.1%) |
| 2-Person Household | 17 (100.0%) | 0 (0.0%) |
| 3-Person Household | 11 (55.0%) | 9 (45.0%) |
| 4+ Person Household | 0 (0.0%) | 0 (0.0%) |
| Total Housing Units | 39 (59.1%) | 27 (40.9%) |
Occupancy by Educational Attainment in Jeffers Gardens
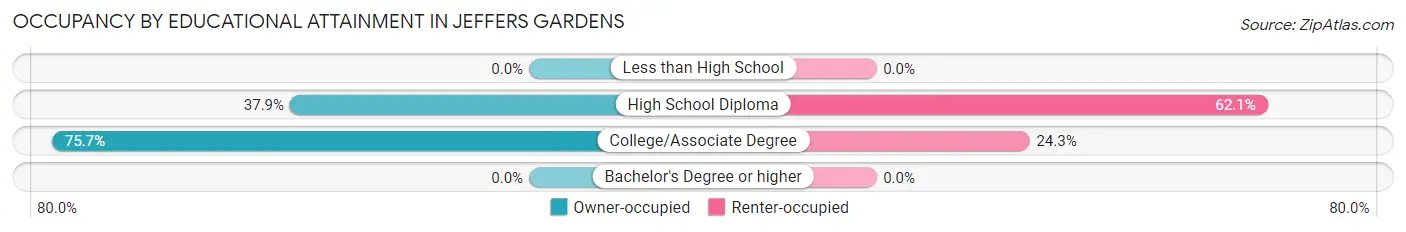
| Household Size | Owner-occupied | Renter-occupied |
| Less than High School | 0 (0.0%) | 0 (0.0%) |
| High School Diploma | 11 (37.9%) | 18 (62.1%) |
| College/Associate Degree | 28 (75.7%) | 9 (24.3%) |
| Bachelor's Degree or higher | 0 (0.0%) | 0 (0.0%) |
Occupancy by Age of Householder in Jeffers Gardens
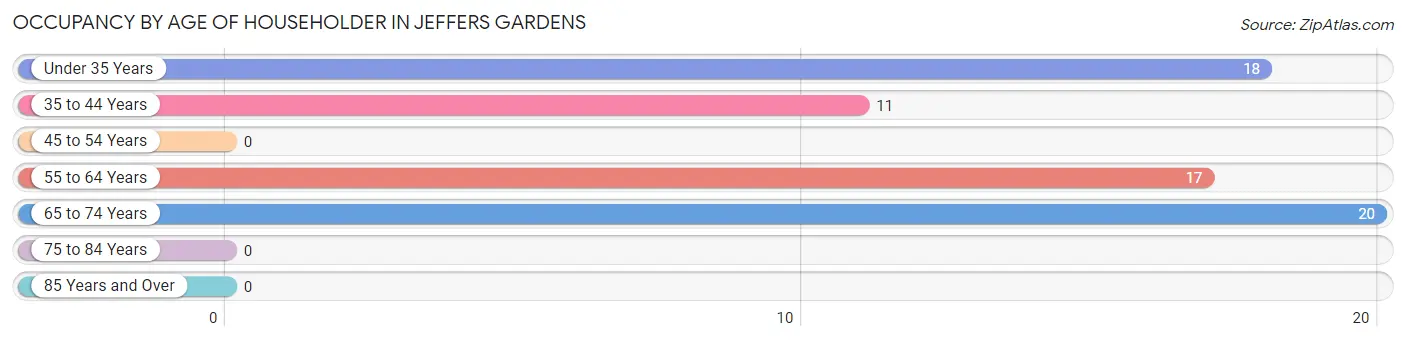
| Age Bracket | # Households | % Households |
| Under 35 Years | 18 | 27.3% |
| 35 to 44 Years | 11 | 16.7% |
| 45 to 54 Years | 0 | 0.0% |
| 55 to 64 Years | 17 | 25.8% |
| 65 to 74 Years | 20 | 30.3% |
| 75 to 84 Years | 0 | 0.0% |
| 85 Years and Over | 0 | 0.0% |
| Total | 66 | 100.0% |
Housing Finances in Jeffers Gardens
Median Income by Occupancy in Jeffers Gardens
| Occupancy Type | # Households | Median Income |
| Owner-Occupied | 39 (59.1%) | $0 |
| Renter-Occupied | 27 (40.9%) | $0 |
| Average | 66 (100.0%) | $0 |
Occupancy by Householder Income Bracket in Jeffers Gardens
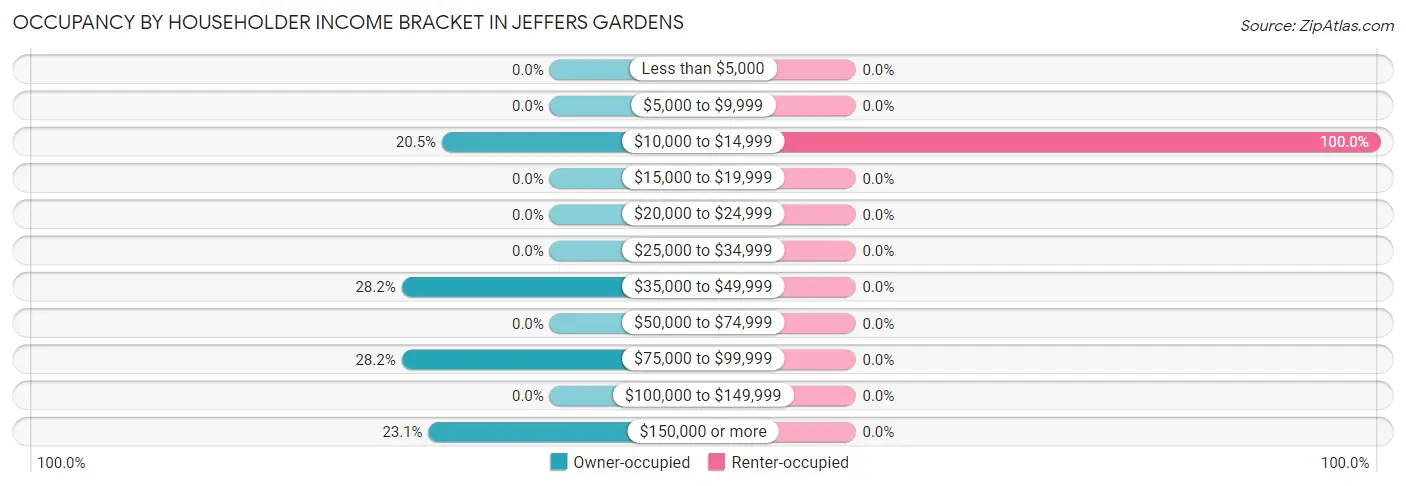
| Income Bracket | Owner-occupied | Renter-occupied |
| Less than $5,000 | 0 (0.0%) | 0 (0.0%) |
| $5,000 to $9,999 | 0 (0.0%) | 0 (0.0%) |
| $10,000 to $14,999 | 8 (20.5%) | 27 (100.0%) |
| $15,000 to $19,999 | 0 (0.0%) | 0 (0.0%) |
| $20,000 to $24,999 | 0 (0.0%) | 0 (0.0%) |
| $25,000 to $34,999 | 0 (0.0%) | 0 (0.0%) |
| $35,000 to $49,999 | 11 (28.2%) | 0 (0.0%) |
| $50,000 to $74,999 | 0 (0.0%) | 0 (0.0%) |
| $75,000 to $99,999 | 11 (28.2%) | 0 (0.0%) |
| $100,000 to $149,999 | 0 (0.0%) | 0 (0.0%) |
| $150,000 or more | 9 (23.1%) | 0 (0.0%) |
| Total | 39 (100.0%) | 27 (100.0%) |
Monthly Housing Cost Tiers in Jeffers Gardens
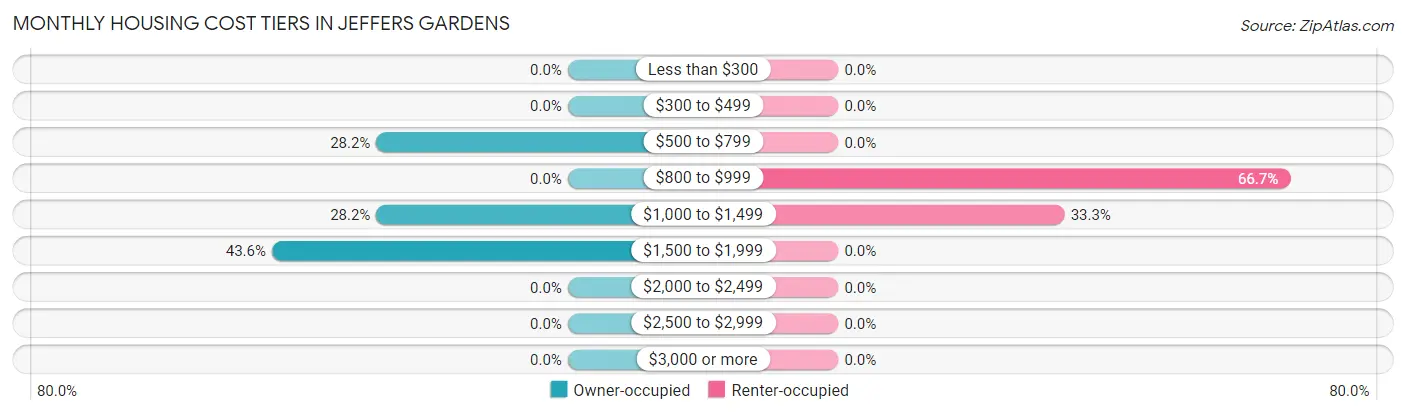
| Monthly Cost | Owner-occupied | Renter-occupied |
| Less than $300 | 0 (0.0%) | 0 (0.0%) |
| $300 to $499 | 0 (0.0%) | 0 (0.0%) |
| $500 to $799 | 11 (28.2%) | 0 (0.0%) |
| $800 to $999 | 0 (0.0%) | 18 (66.7%) |
| $1,000 to $1,499 | 11 (28.2%) | 9 (33.3%) |
| $1,500 to $1,999 | 17 (43.6%) | 0 (0.0%) |
| $2,000 to $2,499 | 0 (0.0%) | 0 (0.0%) |
| $2,500 to $2,999 | 0 (0.0%) | 0 (0.0%) |
| $3,000 or more | 0 (0.0%) | 0 (0.0%) |
| Total | 39 (100.0%) | 27 (100.0%) |
Physical Housing Characteristics in Jeffers Gardens
Housing Structures in Jeffers Gardens
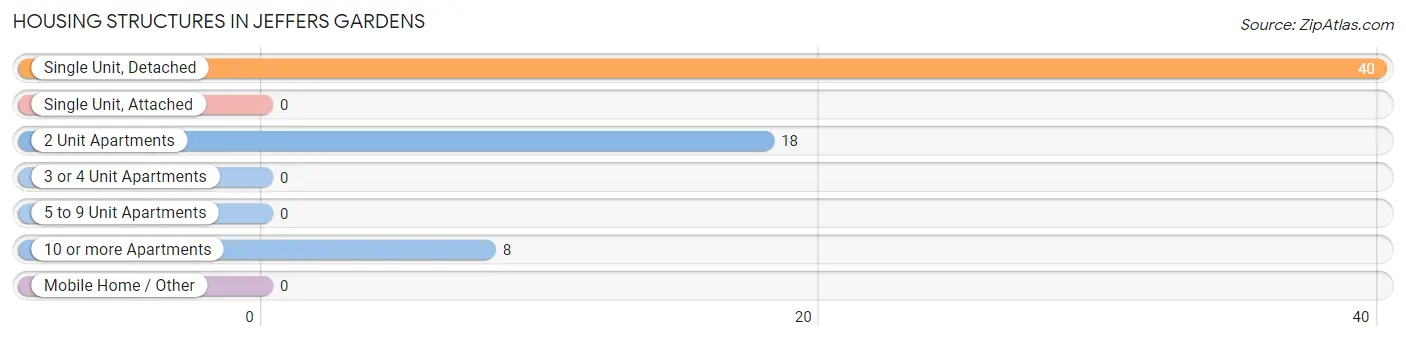
| Structure Type | # Housing Units | % Housing Units |
| Single Unit, Detached | 40 | 60.6% |
| Single Unit, Attached | 0 | 0.0% |
| 2 Unit Apartments | 18 | 27.3% |
| 3 or 4 Unit Apartments | 0 | 0.0% |
| 5 to 9 Unit Apartments | 0 | 0.0% |
| 10 or more Apartments | 8 | 12.1% |
| Mobile Home / Other | 0 | 0.0% |
| Total | 66 | 100.0% |
Housing Structures by Occupancy in Jeffers Gardens
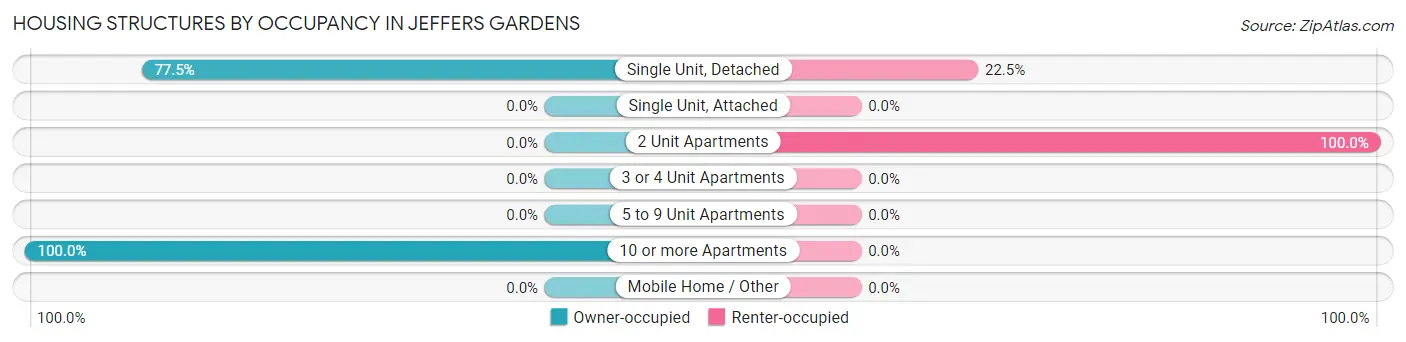
| Structure Type | Owner-occupied | Renter-occupied |
| Single Unit, Detached | 31 (77.5%) | 9 (22.5%) |
| Single Unit, Attached | 0 (0.0%) | 0 (0.0%) |
| 2 Unit Apartments | 0 (0.0%) | 18 (100.0%) |
| 3 or 4 Unit Apartments | 0 (0.0%) | 0 (0.0%) |
| 5 to 9 Unit Apartments | 0 (0.0%) | 0 (0.0%) |
| 10 or more Apartments | 8 (100.0%) | 0 (0.0%) |
| Mobile Home / Other | 0 (0.0%) | 0 (0.0%) |
| Total | 39 (59.1%) | 27 (40.9%) |
Housing Structures by Number of Rooms in Jeffers Gardens
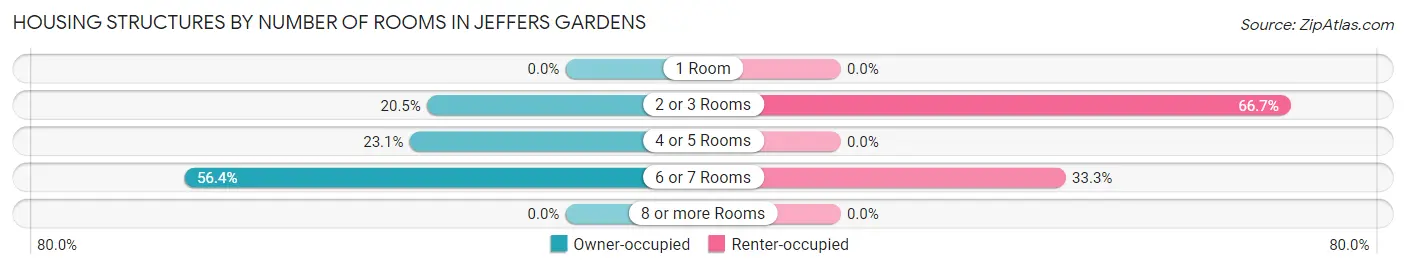
| Number of Rooms | Owner-occupied | Renter-occupied |
| 1 Room | 0 (0.0%) | 0 (0.0%) |
| 2 or 3 Rooms | 8 (20.5%) | 18 (66.7%) |
| 4 or 5 Rooms | 9 (23.1%) | 0 (0.0%) |
| 6 or 7 Rooms | 22 (56.4%) | 9 (33.3%) |
| 8 or more Rooms | 0 (0.0%) | 0 (0.0%) |
| Total | 39 (100.0%) | 27 (100.0%) |
Housing Structure by Heating Type in Jeffers Gardens
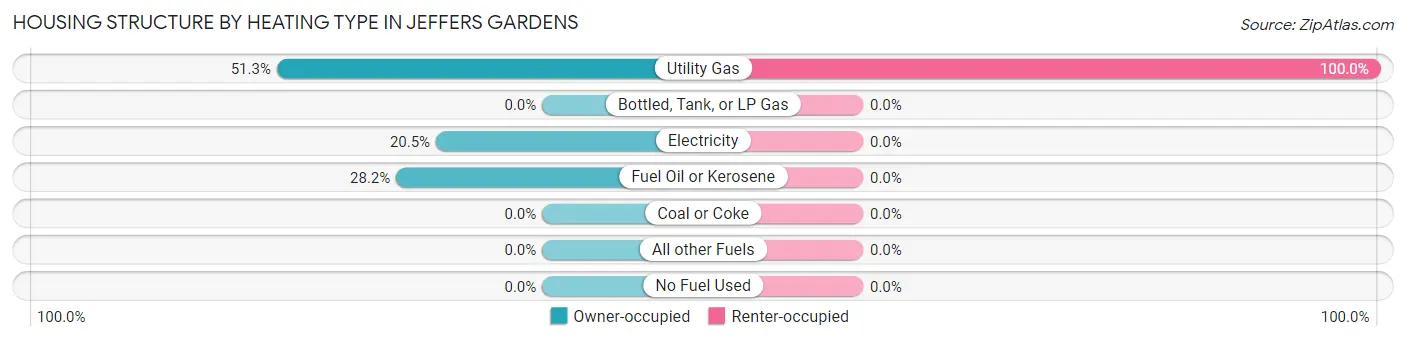
| Heating Type | Owner-occupied | Renter-occupied |
| Utility Gas | 20 (51.3%) | 27 (100.0%) |
| Bottled, Tank, or LP Gas | 0 (0.0%) | 0 (0.0%) |
| Electricity | 8 (20.5%) | 0 (0.0%) |
| Fuel Oil or Kerosene | 11 (28.2%) | 0 (0.0%) |
| Coal or Coke | 0 (0.0%) | 0 (0.0%) |
| All other Fuels | 0 (0.0%) | 0 (0.0%) |
| No Fuel Used | 0 (0.0%) | 0 (0.0%) |
| Total | 39 (100.0%) | 27 (100.0%) |
Household Vehicle Usage in Jeffers Gardens
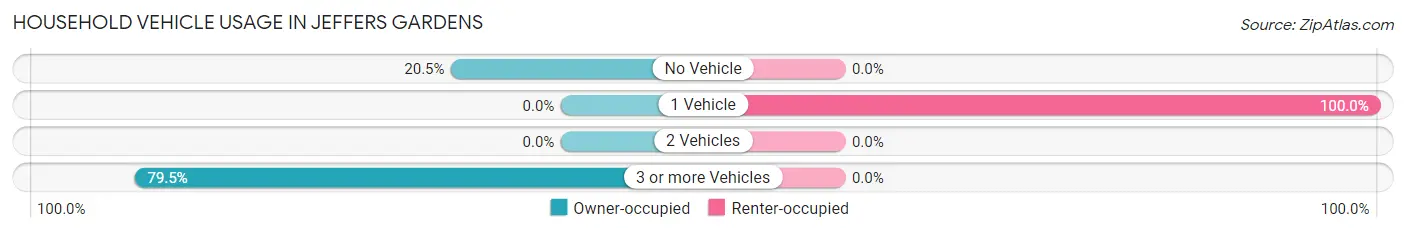
| Vehicles per Household | Owner-occupied | Renter-occupied |
| No Vehicle | 8 (20.5%) | 0 (0.0%) |
| 1 Vehicle | 0 (0.0%) | 27 (100.0%) |
| 2 Vehicles | 0 (0.0%) | 0 (0.0%) |
| 3 or more Vehicles | 31 (79.5%) | 0 (0.0%) |
| Total | 39 (100.0%) | 27 (100.0%) |
Real Estate & Mortgages in Jeffers Gardens
Real Estate and Mortgage Overview in Jeffers Gardens
| Characteristic | Without Mortgage | With Mortgage |
| Housing Units | 11 | 28 |
| Median Property Value | - | - |
| Median Household Income | - | - |
| Monthly Housing Costs | - | - |
| Real Estate Taxes | - | - |
Property Value by Mortgage Status in Jeffers Gardens
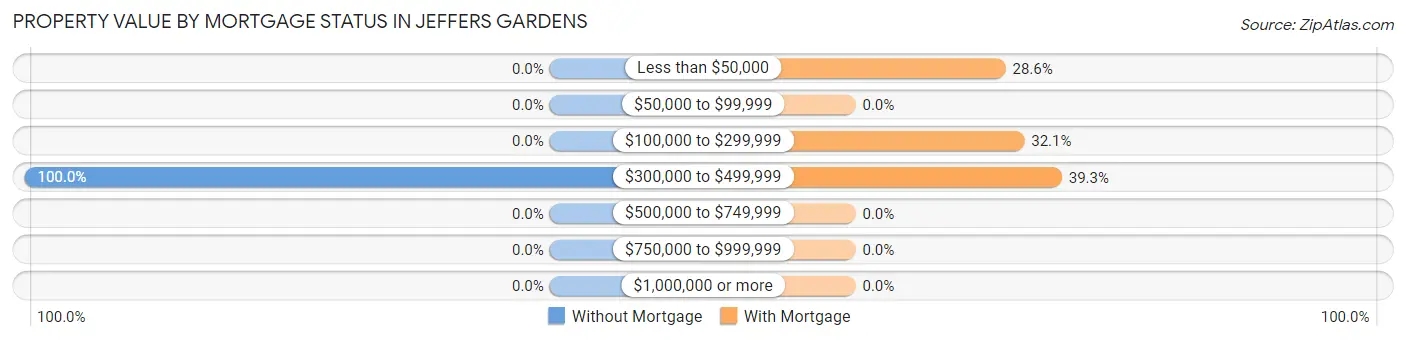
| Property Value | Without Mortgage | With Mortgage |
| Less than $50,000 | 0 (0.0%) | 8 (28.6%) |
| $50,000 to $99,999 | 0 (0.0%) | 0 (0.0%) |
| $100,000 to $299,999 | 0 (0.0%) | 9 (32.1%) |
| $300,000 to $499,999 | 11 (100.0%) | 11 (39.3%) |
| $500,000 to $749,999 | 0 (0.0%) | 0 (0.0%) |
| $750,000 to $999,999 | 0 (0.0%) | 0 (0.0%) |
| $1,000,000 or more | 0 (0.0%) | 0 (0.0%) |
| Total | 11 (100.0%) | 28 (100.0%) |
Household Income by Mortgage Status in Jeffers Gardens
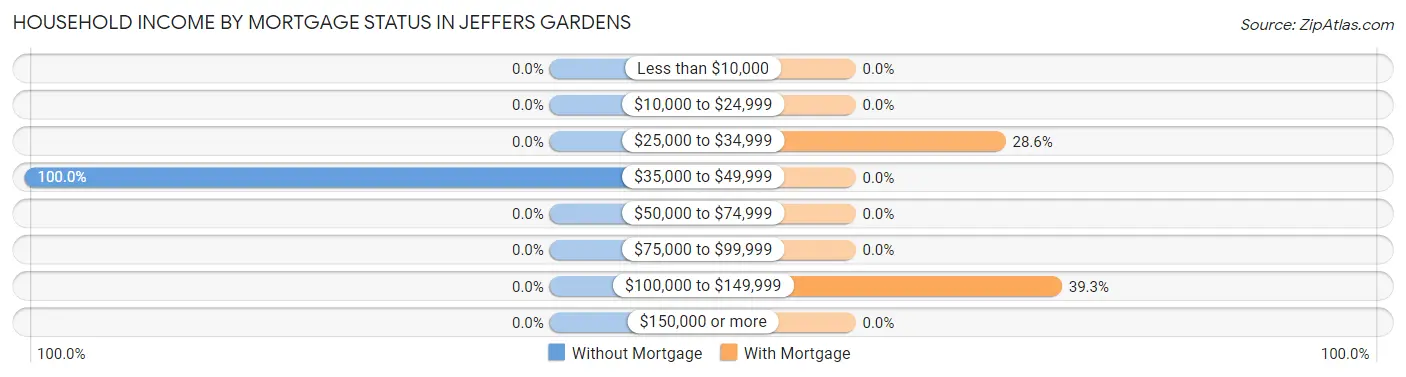
| Household Income | Without Mortgage | With Mortgage |
| Less than $10,000 | 0 (0.0%) | 0 (0.0%) |
| $10,000 to $24,999 | 0 (0.0%) | 0 (0.0%) |
| $25,000 to $34,999 | 0 (0.0%) | 8 (28.6%) |
| $35,000 to $49,999 | 11 (100.0%) | 0 (0.0%) |
| $50,000 to $74,999 | 0 (0.0%) | 0 (0.0%) |
| $75,000 to $99,999 | 0 (0.0%) | 0 (0.0%) |
| $100,000 to $149,999 | 0 (0.0%) | 11 (39.3%) |
| $150,000 or more | 0 (0.0%) | 0 (0.0%) |
| Total | 11 (100.0%) | 28 (100.0%) |
Property Value to Household Income Ratio in Jeffers Gardens
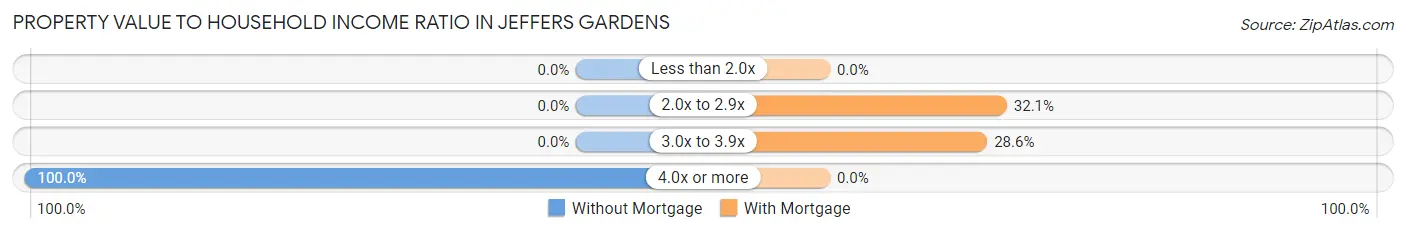
| Value-to-Income Ratio | Without Mortgage | With Mortgage |
| Less than 2.0x | 0 (0.0%) | 0 (0.0%) |
| 2.0x to 2.9x | 0 (0.0%) | 9 (32.1%) |
| 3.0x to 3.9x | 0 (0.0%) | 8 (28.6%) |
| 4.0x or more | 11 (100.0%) | 0 (0.0%) |
| Total | 11 (100.0%) | 28 (100.0%) |
Real Estate Taxes by Mortgage Status in Jeffers Gardens
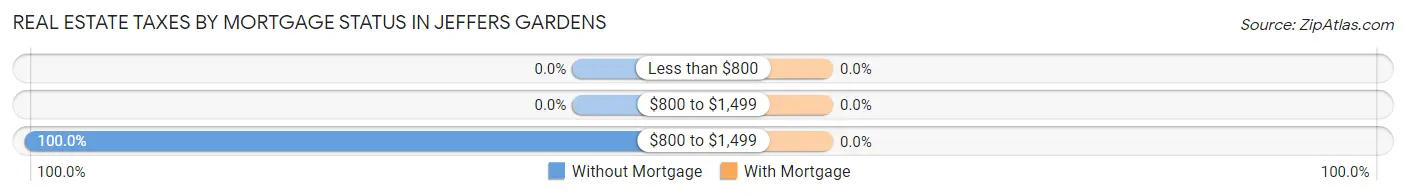
| Property Taxes | Without Mortgage | With Mortgage |
| Less than $800 | 0 (0.0%) | 0 (0.0%) |
| $800 to $1,499 | 0 (0.0%) | 0 (0.0%) |
| $800 to $1,499 | 11 (100.0%) | 0 (0.0%) |
| Total | 11 (100.0%) | 28 (100.0%) |
Health & Disability in Jeffers Gardens
Health Insurance Coverage by Age in Jeffers Gardens
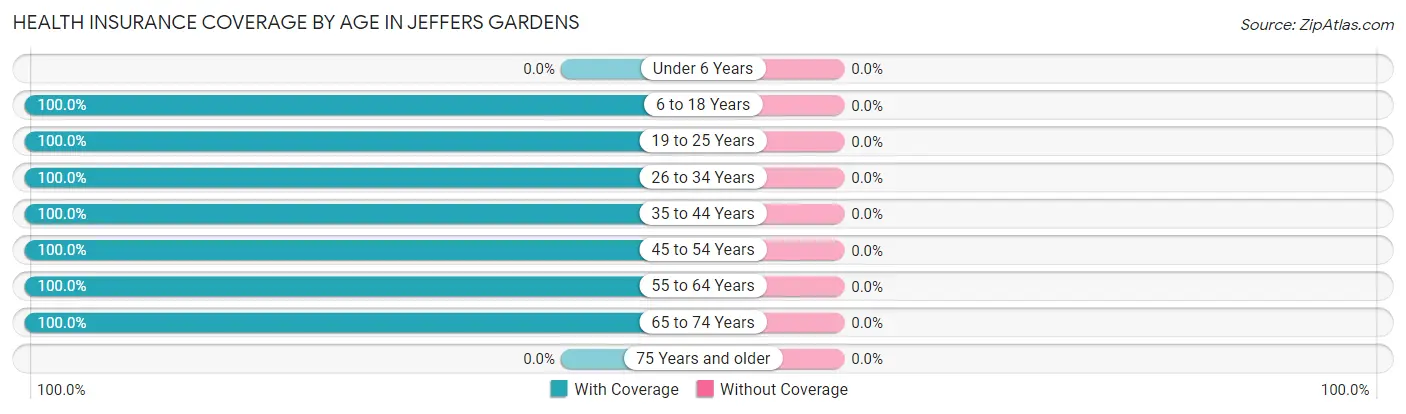
| Age Bracket | With Coverage | Without Coverage |
| Under 6 Years | 0 (0.0%) | 0 (0.0%) |
| 6 to 18 Years | 7 (100.0%) | 0 (0.0%) |
| 19 to 25 Years | 18 (100.0%) | 0 (0.0%) |
| 26 to 34 Years | 10 (100.0%) | 0 (0.0%) |
| 35 to 44 Years | 11 (100.0%) | 0 (0.0%) |
| 45 to 54 Years | 5 (100.0%) | 0 (0.0%) |
| 55 to 64 Years | 24 (100.0%) | 0 (0.0%) |
| 65 to 74 Years | 42 (100.0%) | 0 (0.0%) |
| 75 Years and older | 0 (0.0%) | 0 (0.0%) |
| Total | 117 (100.0%) | 0 (0.0%) |
Health Insurance Coverage by Citizenship Status in Jeffers Gardens
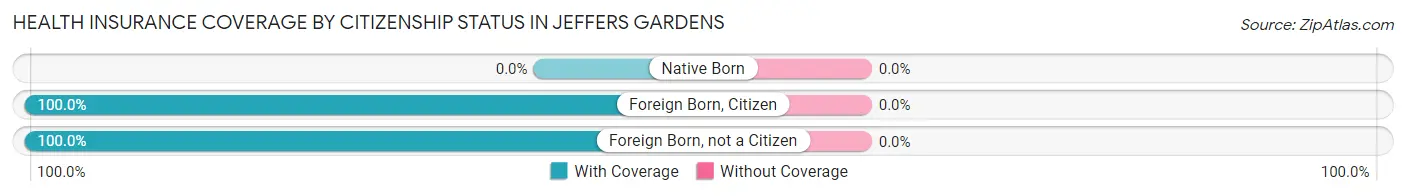
| Citizenship Status | With Coverage | Without Coverage |
| Native Born | 0 (0.0%) | 0 (0.0%) |
| Foreign Born, Citizen | 7 (100.0%) | 0 (0.0%) |
| Foreign Born, not a Citizen | 18 (100.0%) | 0 (0.0%) |
Health Insurance Coverage by Household Income in Jeffers Gardens
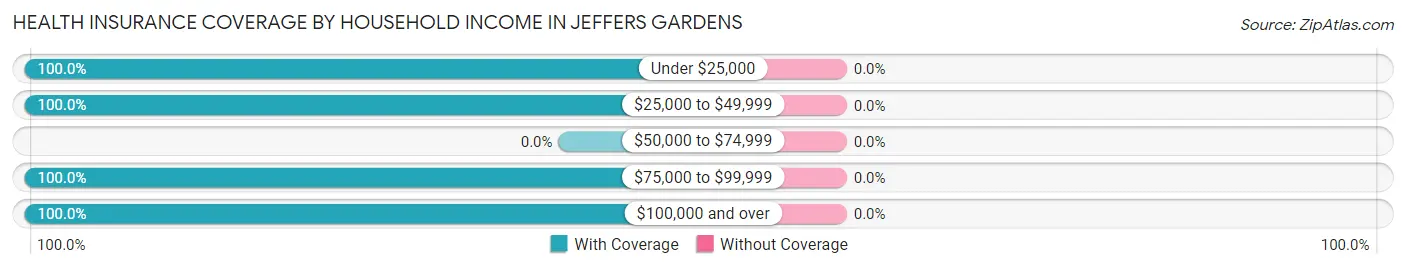
| Household Income | With Coverage | Without Coverage |
| Under $25,000 | 59 (100.0%) | 0 (0.0%) |
| $25,000 to $49,999 | 33 (100.0%) | 0 (0.0%) |
| $50,000 to $74,999 | 0 (0.0%) | 0 (0.0%) |
| $75,000 to $99,999 | 11 (100.0%) | 0 (0.0%) |
| $100,000 and over | 14 (100.0%) | 0 (0.0%) |
Public vs Private Health Insurance Coverage by Age in Jeffers Gardens
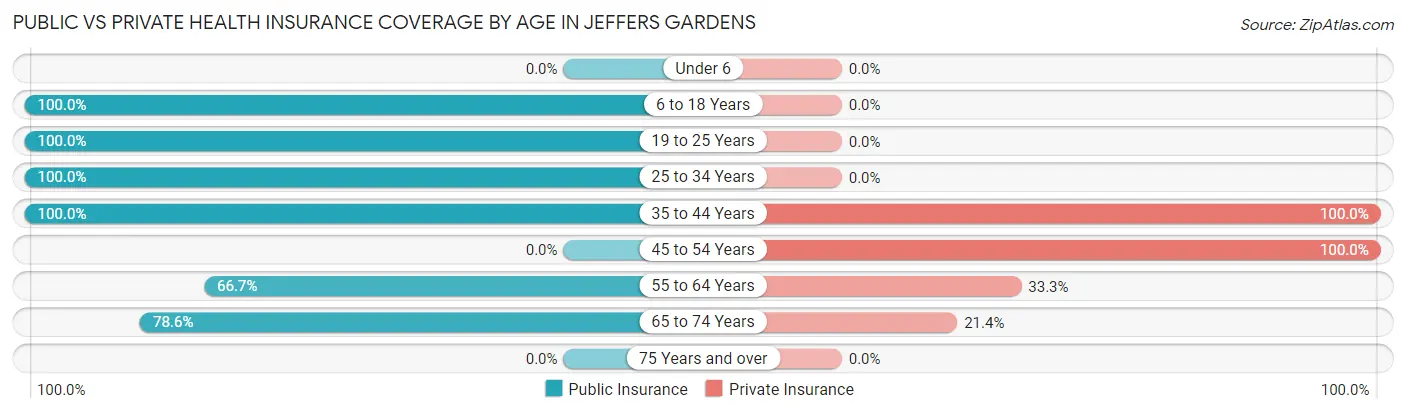
| Age Bracket | Public Insurance | Private Insurance |
| Under 6 | 0 (0.0%) | 0 (0.0%) |
| 6 to 18 Years | 7 (100.0%) | 0 (0.0%) |
| 19 to 25 Years | 18 (100.0%) | 0 (0.0%) |
| 25 to 34 Years | 10 (100.0%) | 0 (0.0%) |
| 35 to 44 Years | 11 (100.0%) | 11 (100.0%) |
| 45 to 54 Years | 0 (0.0%) | 5 (100.0%) |
| 55 to 64 Years | 16 (66.7%) | 8 (33.3%) |
| 65 to 74 Years | 33 (78.6%) | 9 (21.4%) |
| 75 Years and over | 0 (0.0%) | 0 (0.0%) |
| Total | 95 (81.2%) | 33 (28.2%) |
Disability Status by Sex by Age in Jeffers Gardens
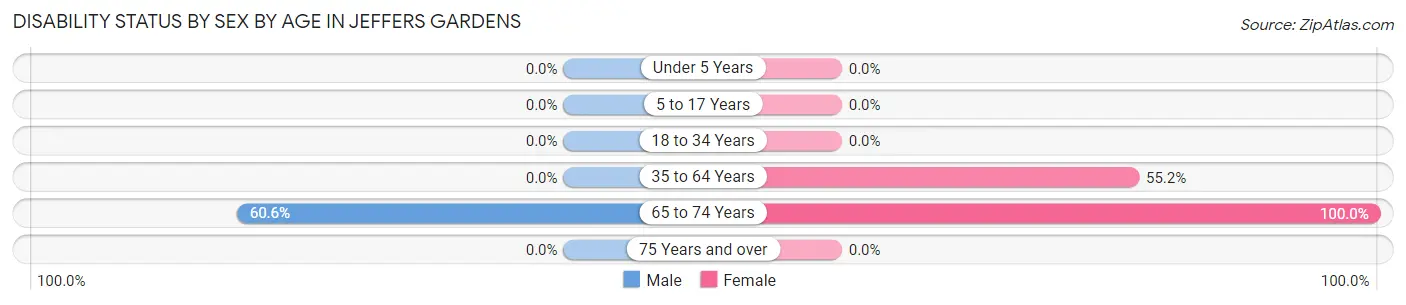
| Age Bracket | Male | Female |
| Under 5 Years | 0 (0.0%) | 0 (0.0%) |
| 5 to 17 Years | 0 (0.0%) | 0 (0.0%) |
| 18 to 34 Years | 0 (0.0%) | 0 (0.0%) |
| 35 to 64 Years | 0 (0.0%) | 16 (55.2%) |
| 65 to 74 Years | 20 (60.6%) | 9 (100.0%) |
| 75 Years and over | 0 (0.0%) | 0 (0.0%) |
Disability Class by Sex by Age in Jeffers Gardens
Disability Class: Hearing Difficulty
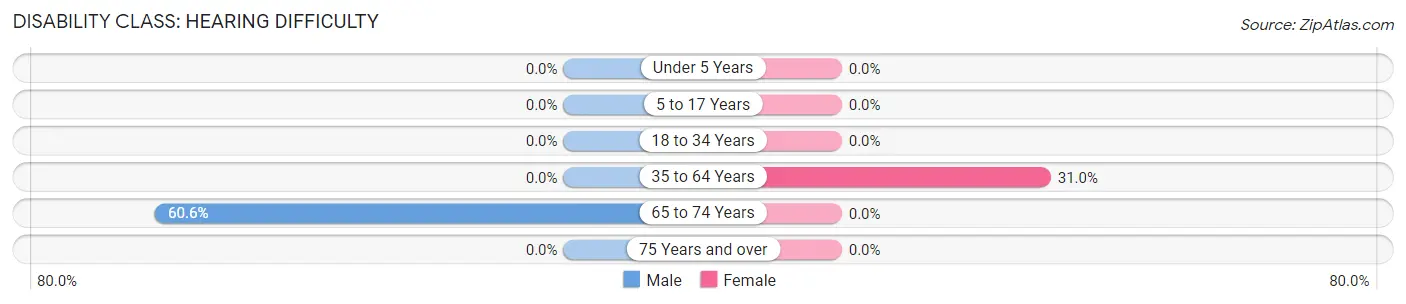
| Age Bracket | Male | Female |
| Under 5 Years | 0 (0.0%) | 0 (0.0%) |
| 5 to 17 Years | 0 (0.0%) | 0 (0.0%) |
| 18 to 34 Years | 0 (0.0%) | 0 (0.0%) |
| 35 to 64 Years | 0 (0.0%) | 9 (31.0%) |
| 65 to 74 Years | 20 (60.6%) | 0 (0.0%) |
| 75 Years and over | 0 (0.0%) | 0 (0.0%) |
Disability Class: Vision Difficulty
| Age Bracket | Male | Female |
| Under 5 Years | 0 (0.0%) | 0 (0.0%) |
| 5 to 17 Years | 0 (0.0%) | 0 (0.0%) |
| 18 to 34 Years | 0 (0.0%) | 0 (0.0%) |
| 35 to 64 Years | 0 (0.0%) | 0 (0.0%) |
| 65 to 74 Years | 0 (0.0%) | 0 (0.0%) |
| 75 Years and over | 0 (0.0%) | 0 (0.0%) |
Disability Class: Cognitive Difficulty
| Age Bracket | Male | Female |
| 5 to 17 Years | 0 (0.0%) | 0 (0.0%) |
| 18 to 34 Years | 0 (0.0%) | 0 (0.0%) |
| 35 to 64 Years | 0 (0.0%) | 0 (0.0%) |
| 65 to 74 Years | 0 (0.0%) | 0 (0.0%) |
| 75 Years and over | 0 (0.0%) | 0 (0.0%) |
Disability Class: Ambulatory Difficulty
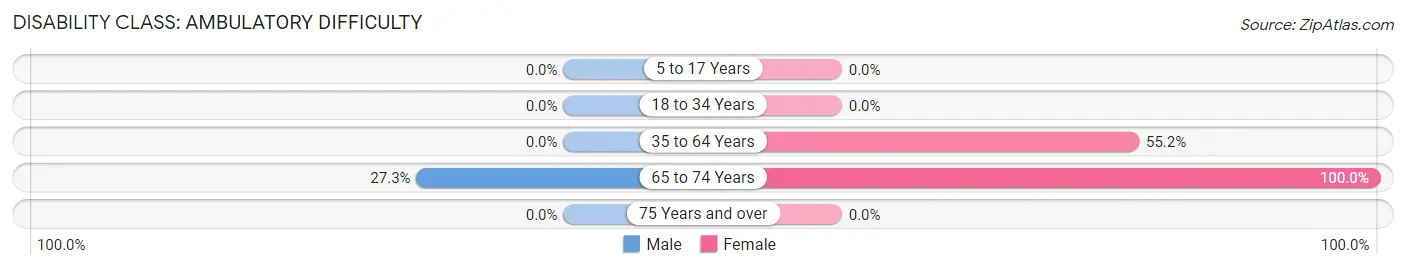
| Age Bracket | Male | Female |
| 5 to 17 Years | 0 (0.0%) | 0 (0.0%) |
| 18 to 34 Years | 0 (0.0%) | 0 (0.0%) |
| 35 to 64 Years | 0 (0.0%) | 16 (55.2%) |
| 65 to 74 Years | 9 (27.3%) | 9 (100.0%) |
| 75 Years and over | 0 (0.0%) | 0 (0.0%) |
Disability Class: Self-Care Difficulty
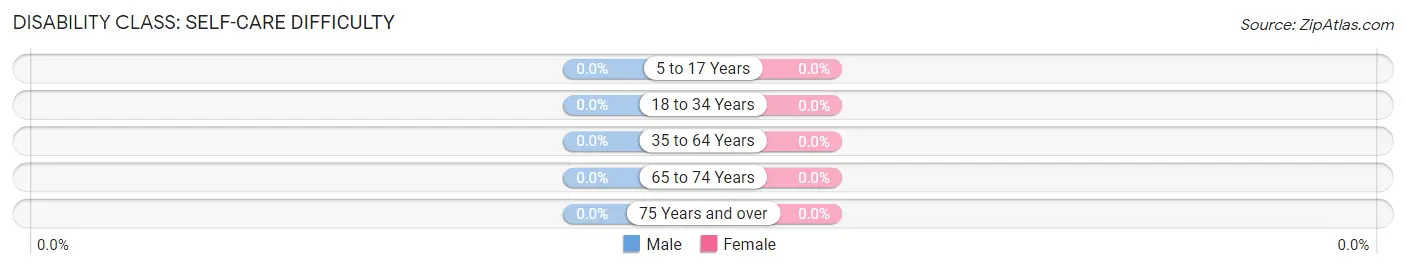
| Age Bracket | Male | Female |
| 5 to 17 Years | 0 (0.0%) | 0 (0.0%) |
| 18 to 34 Years | 0 (0.0%) | 0 (0.0%) |
| 35 to 64 Years | 0 (0.0%) | 0 (0.0%) |
| 65 to 74 Years | 0 (0.0%) | 0 (0.0%) |
| 75 Years and over | 0 (0.0%) | 0 (0.0%) |
Technology Access in Jeffers Gardens
Computing Device Access in Jeffers Gardens
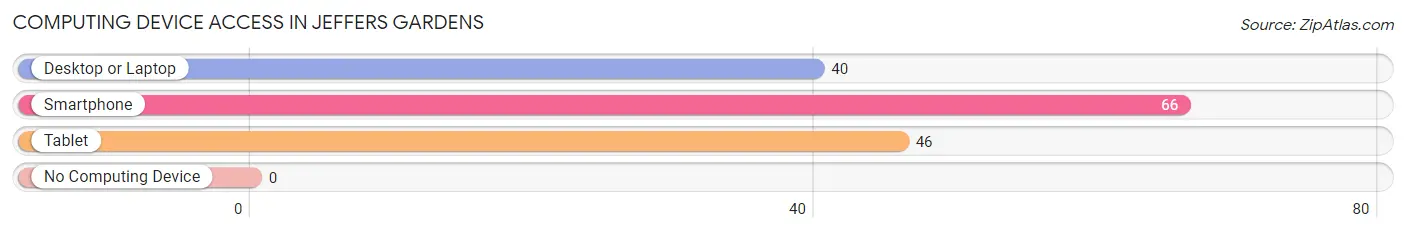
| Device Type | # Households | % Households |
| Desktop or Laptop | 40 | 60.6% |
| Smartphone | 66 | 100.0% |
| Tablet | 46 | 69.7% |
| No Computing Device | 0 | 0.0% |
| Total | 66 | 100.0% |
Internet Access in Jeffers Gardens
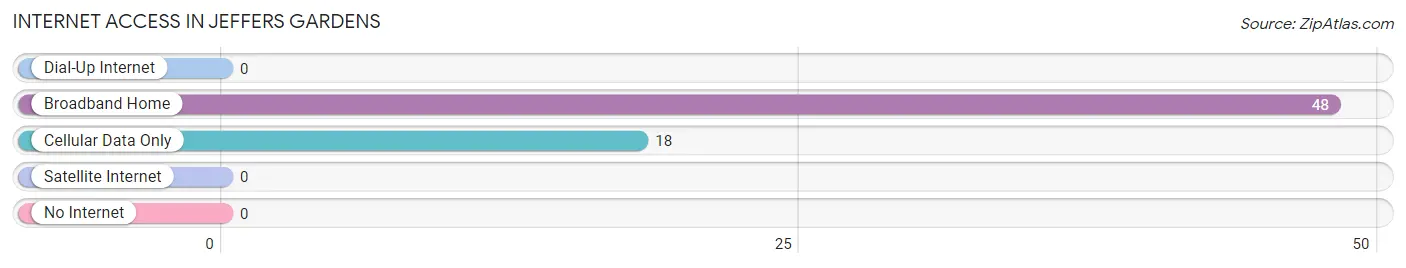
| Internet Type | # Households | % Households |
| Dial-Up Internet | 0 | 0.0% |
| Broadband Home | 48 | 72.7% |
| Cellular Data Only | 18 | 27.3% |
| Satellite Internet | 0 | 0.0% |
| No Internet | 0 | 0.0% |
| Total | 66 | 100.0% |
Jeffers Gardens Summary
Jeffers Gardens is a small unincorporated community located in the state of Oregon, United States. It is situated in the foothills of the Cascade Mountains, approximately 25 miles east of Portland. The community is home to a population of approximately 500 people, and is known for its rural charm and scenic beauty.
History
Jeffers Gardens was founded in the late 1800s by a group of settlers from the Midwest. The settlers were drawn to the area by its abundance of natural resources, including timber, water, and fertile soil. The settlers quickly established a thriving agricultural community, and the area soon became known for its production of apples, pears, and other fruits and vegetables.
In the early 1900s, the community began to grow and develop. A post office was established in 1906, and a school was built in 1908. The community also saw the construction of a general store, a blacksmith shop, and a church.
Geography
Jeffers Gardens is located in the foothills of the Cascade Mountains, approximately 25 miles east of Portland. The community is situated in a valley surrounded by rolling hills and lush forests. The climate is mild and temperate, with warm summers and cool winters.
The area is known for its scenic beauty, and is home to a variety of wildlife, including deer, elk, and black bears. The nearby rivers and streams provide excellent fishing opportunities, and the nearby mountains offer a variety of outdoor activities, including hiking, camping, and skiing.
Economy
The economy of Jeffers Gardens is largely based on agriculture. The area is known for its production of apples, pears, and other fruits and vegetables. The community also has a thriving timber industry, and is home to several sawmills and lumber yards.
In addition to agriculture and timber, the community is home to a variety of small businesses, including restaurants, shops, and services. The community also has a small airport, which serves as a hub for private and commercial flights.
Demographics
As of the 2010 census, the population of Jeffers Gardens was approximately 500 people. The racial makeup of the community was 94.2% White, 0.8% African American, 0.4% Native American, 0.4% Asian, and 4.2% from other races.
The median household income in Jeffers Gardens was $45,000, and the median family income was $50,000. The per capita income was $20,000. The unemployment rate was 4.2%.
Conclusion
Jeffers Gardens is a small unincorporated community located in the state of Oregon, United States. It is situated in the foothills of the Cascade Mountains, approximately 25 miles east of Portland. The community is home to a population of approximately 500 people, and is known for its rural charm and scenic beauty. The economy of Jeffers Gardens is largely based on agriculture, timber, and small businesses. The racial makeup of the community is 94.2% White, 0.8% African American, 0.4% Native American, 0.4% Asian, and 4.2% from other races. The median household income in Jeffers Gardens was $45,000, and the median family income was $50,000. The per capita income was $20,000. The unemployment rate was 4.2%.
Common Questions
What is Per Capita Income in Jeffers Gardens?
Per Capita income in Jeffers Gardens is $28,228.
What is Inequality or Gini Index in Jeffers Gardens?
Inequality or Gini Index in Jeffers Gardens is 0.51.
What is the Total Population of Jeffers Gardens?
Total Population of Jeffers Gardens is 117.
What is the Total Male Population of Jeffers Gardens?
Total Male Population of Jeffers Gardens is 51.
What is the Total Female Population of Jeffers Gardens?
Total Female Population of Jeffers Gardens is 66.
What is the Ratio of Males per 100 Females in Jeffers Gardens?
There are 77.27 Males per 100 Females in Jeffers Gardens.
What is the Ratio of Females per 100 Males in Jeffers Gardens?
There are 129.41 Females per 100 Males in Jeffers Gardens.
What is the Median Population Age in Jeffers Gardens?
Median Population Age in Jeffers Gardens is 62.1 Years.
What is the Average Family Size in Jeffers Gardens
Average Family Size in Jeffers Gardens is 2.4 People.
What is the Average Household Size in Jeffers Gardens
Average Household Size in Jeffers Gardens is 1.8 People.
How Large is the Labor Force in Jeffers Gardens?
There are 53 People in the Labor Forcein in Jeffers Gardens.
What is the Percentage of People in the Labor Force in Jeffers Gardens?
48.2% of People are in the Labor Force in Jeffers Gardens.
What is the Unemployment Rate in Jeffers Gardens?
Unemployment Rate in Jeffers Gardens is 52.8%.