Athena, OR Map & Demographics
Athena Map
Athena Overview
$31,116
PER CAPITA INCOME
$73,333
AVG FAMILY INCOME
$66,333
AVG HOUSEHOLD INCOME
7.4%
WAGE / INCOME GAP [ % ]
92.6¢/ $1
WAGE / INCOME GAP [ $ ]
0.34
INEQUALITY / GINI INDEX
1,333
TOTAL POPULATION
738
MALE POPULATION
595
FEMALE POPULATION
124.03
MALES / 100 FEMALES
80.62
FEMALES / 100 MALES
37.1
MEDIAN AGE
3.1
AVG FAMILY SIZE
2.4
AVG HOUSEHOLD SIZE
677
LABOR FORCE [ PEOPLE ]
61.0%
PERCENT IN LABOR FORCE
10.5%
UNEMPLOYMENT RATE
Athena Zip Codes
Athena Area Codes
Income in Athena
Income Overview in Athena
Per Capita Income in Athena is $31,116, while median incomes of families and households are $73,333 and $66,333 respectively.
| Characteristic | Number | Measure |
| Per Capita Income | 1,333 | $31,116 |
| Median Family Income | 324 | $73,333 |
| Mean Family Income | 324 | $86,708 |
| Median Household Income | 542 | $66,333 |
| Mean Household Income | 542 | $73,506 |
| Income Deficit | 324 | $0 |
| Wage / Income Gap (%) | 1,333 | 7.42% |
| Wage / Income Gap ($) | 1,333 | 92.58¢ per $1 |
| Gini / Inequality Index | 1,333 | 0.34 |
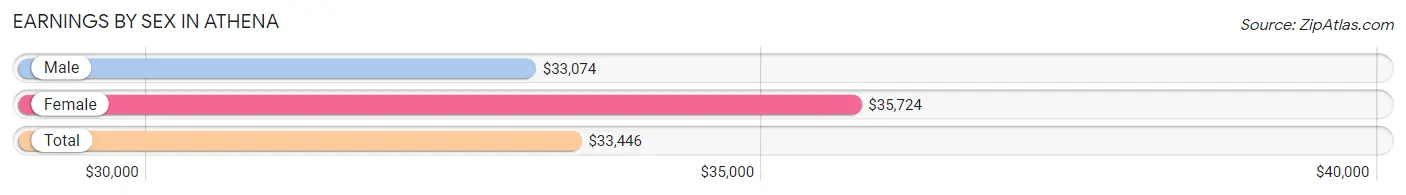
Earnings by Sex in Athena
Average Earnings in Athena are $33,446, $33,074 for men and $35,724 for women, a difference of 7.4%.
| Sex | Number | Average Earnings |
| Male | 423 (62.8%) | $33,074 |
| Female | 251 (37.2%) | $35,724 |
| Total | 674 (100.0%) | $33,446 |
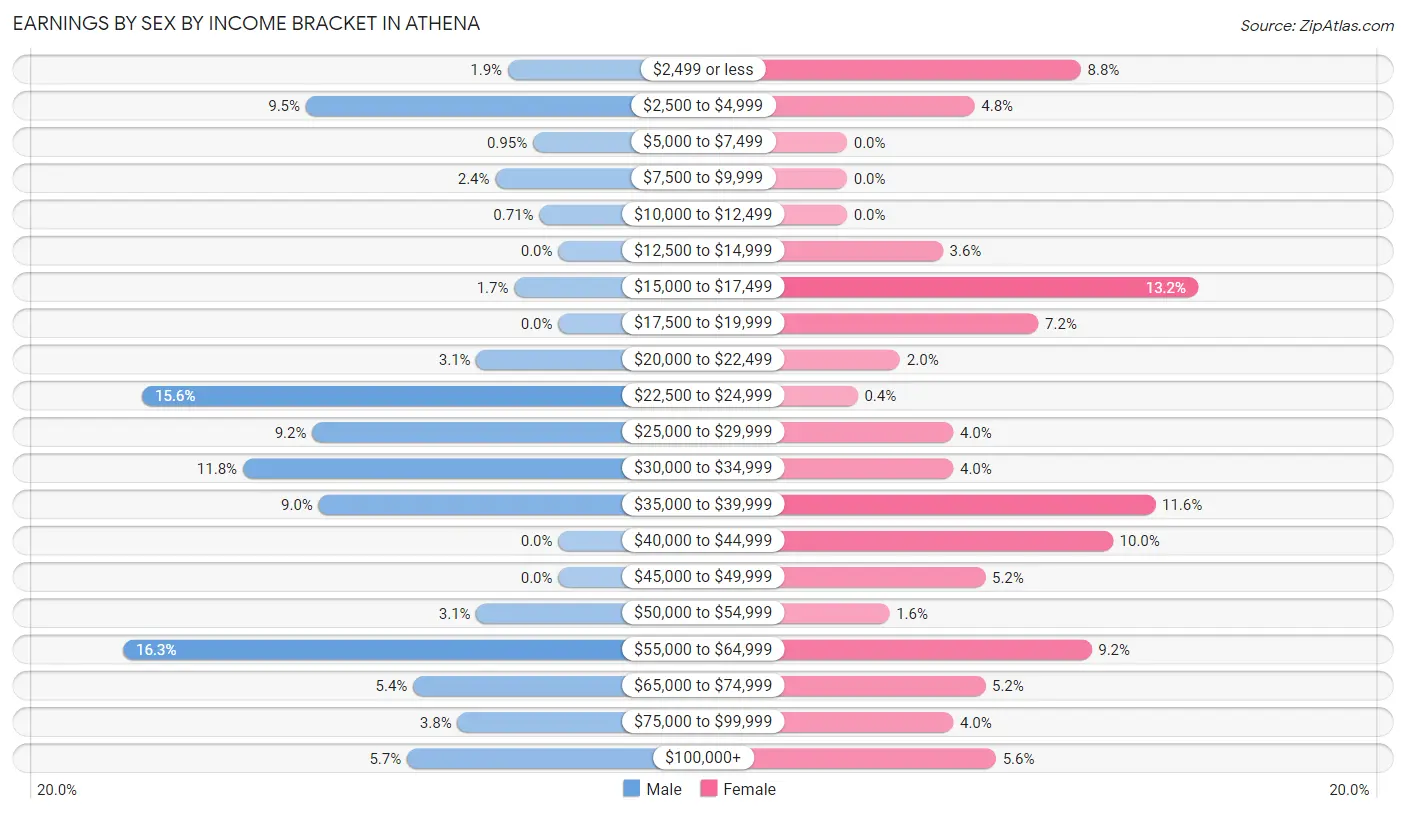
Earnings by Sex by Income Bracket in Athena
The most common earnings brackets in Athena are $55,000 to $64,999 for men (69 | 16.3%) and $15,000 to $17,499 for women (33 | 13.2%).
| Income | Male | Female |
| $2,499 or less | 8 (1.9%) | 22 (8.8%) |
| $2,500 to $4,999 | 40 (9.5%) | 12 (4.8%) |
| $5,000 to $7,499 | 4 (0.9%) | 0 (0.0%) |
| $7,500 to $9,999 | 10 (2.4%) | 0 (0.0%) |
| $10,000 to $12,499 | 3 (0.7%) | 0 (0.0%) |
| $12,500 to $14,999 | 0 (0.0%) | 9 (3.6%) |
| $15,000 to $17,499 | 7 (1.7%) | 33 (13.2%) |
| $17,500 to $19,999 | 0 (0.0%) | 18 (7.2%) |
| $20,000 to $22,499 | 13 (3.1%) | 5 (2.0%) |
| $22,500 to $24,999 | 66 (15.6%) | 1 (0.4%) |
| $25,000 to $29,999 | 39 (9.2%) | 10 (4.0%) |
| $30,000 to $34,999 | 50 (11.8%) | 10 (4.0%) |
| $35,000 to $39,999 | 38 (9.0%) | 29 (11.6%) |
| $40,000 to $44,999 | 0 (0.0%) | 25 (10.0%) |
| $45,000 to $49,999 | 0 (0.0%) | 13 (5.2%) |
| $50,000 to $54,999 | 13 (3.1%) | 4 (1.6%) |
| $55,000 to $64,999 | 69 (16.3%) | 23 (9.2%) |
| $65,000 to $74,999 | 23 (5.4%) | 13 (5.2%) |
| $75,000 to $99,999 | 16 (3.8%) | 10 (4.0%) |
| $100,000+ | 24 (5.7%) | 14 (5.6%) |
| Total | 423 (100.0%) | 251 (100.0%) |
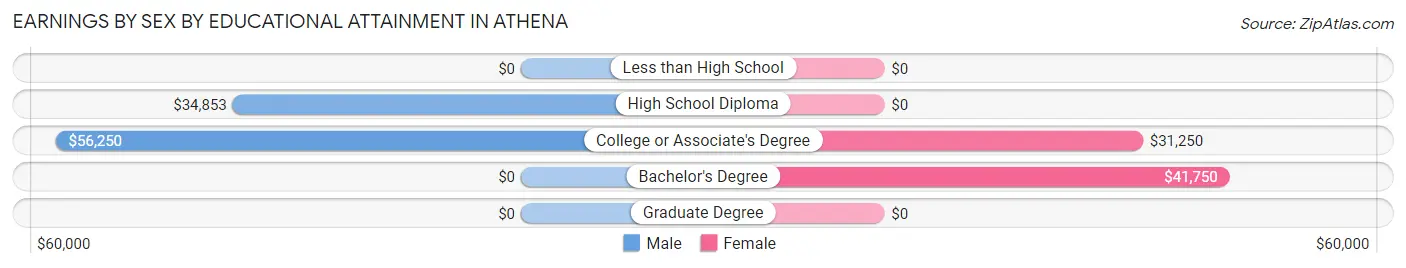
Earnings by Sex by Educational Attainment in Athena
Average earnings in Athena are $39,000 for men and $35,789 for women, a difference of 8.2%. Men with an educational attainment of college or associate's degree enjoy the highest average annual earnings of $56,250, while those with high school diploma education earn the least with $34,853. Women with an educational attainment of bachelor's degree earn the most with the average annual earnings of $41,750, while those with college or associate's degree education have the smallest earnings of $31,250.
| Educational Attainment | Male Income | Female Income |
| Less than High School | - | - |
| High School Diploma | $34,853 | $0 |
| College or Associate's Degree | $56,250 | $31,250 |
| Bachelor's Degree | - | - |
| Graduate Degree | - | - |
| Total | $39,000 | $35,789 |
Family Income in Athena
Family Income Brackets in Athena
According to the Athena family income data, there are 144 families falling into the $50,000 to $74,999 income range, which is the most common income bracket and makes up 44.4% of all families.
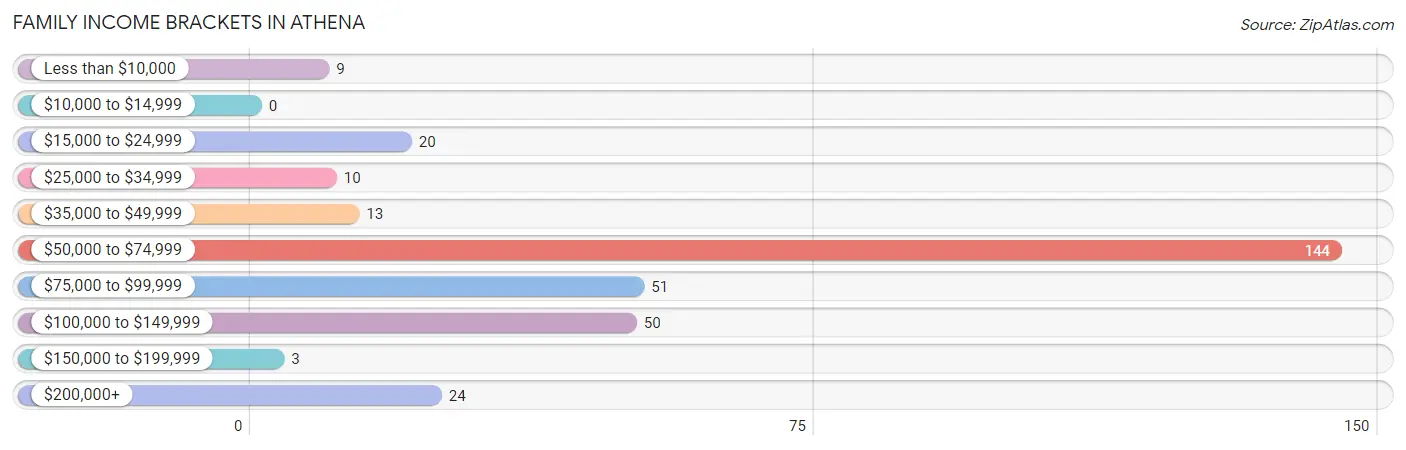
| Income Bracket | # Families | % Families |
| Less than $10,000 | 9 | 2.8% |
| $10,000 to $14,999 | 0 | 0.0% |
| $15,000 to $24,999 | 20 | 6.2% |
| $25,000 to $34,999 | 10 | 3.1% |
| $35,000 to $49,999 | 13 | 4.0% |
| $50,000 to $74,999 | 144 | 44.4% |
| $75,000 to $99,999 | 51 | 15.7% |
| $100,000 to $149,999 | 50 | 15.4% |
| $150,000 to $199,999 | 3 | 0.9% |
| $200,000+ | 24 | 7.4% |
Family Income by Famaliy Size in Athena
3-person families (118 | 36.4%) account for the highest median family income in Athena with $74,531 per family, while 2-person families (130 | 40.1%) have the highest median income of $35,156 per family member.
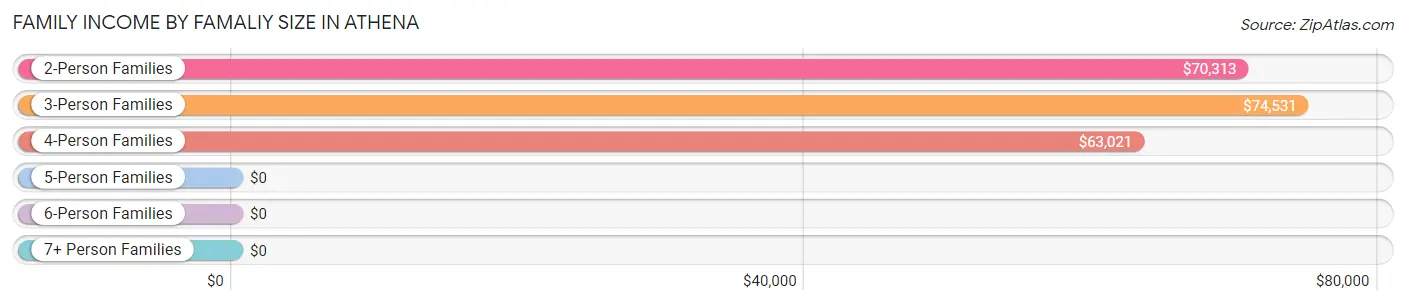
| Income Bracket | # Families | Median Income |
| 2-Person Families | 130 (40.1%) | $70,313 |
| 3-Person Families | 118 (36.4%) | $74,531 |
| 4-Person Families | 49 (15.1%) | $63,021 |
| 5-Person Families | 18 (5.6%) | $0 |
| 6-Person Families | 5 (1.5%) | $0 |
| 7+ Person Families | 4 (1.2%) | $0 |
| Total | 324 (100.0%) | $73,333 |
Family Income by Number of Earners in Athena
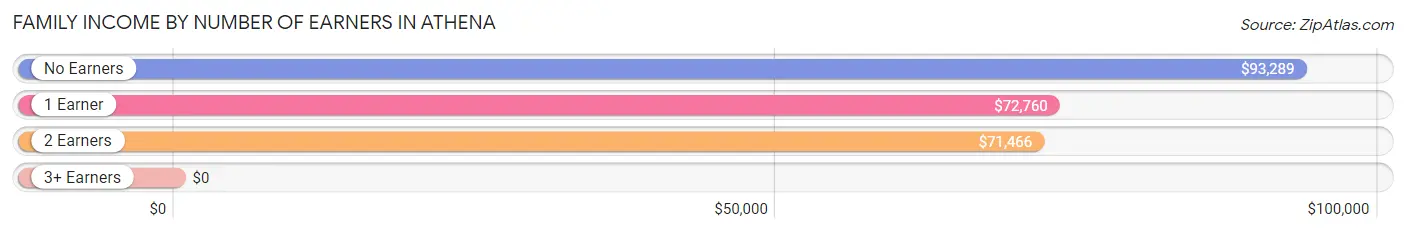
| Number of Earners | # Families | Median Income |
| No Earners | 36 (11.1%) | $93,289 |
| 1 Earner | 136 (42.0%) | $72,760 |
| 2 Earners | 122 (37.7%) | $71,466 |
| 3+ Earners | 30 (9.3%) | $0 |
| Total | 324 (100.0%) | $73,333 |
Household Income in Athena
Household Income Brackets in Athena
With 245 households falling in the category, the $50,000 to $74,999 income range is the most frequent in Athena, accounting for 45.2% of all households. In contrast, only 3 households (0.5%) fall into the $150,000 to $199,999 income bracket, making it the least populous group.
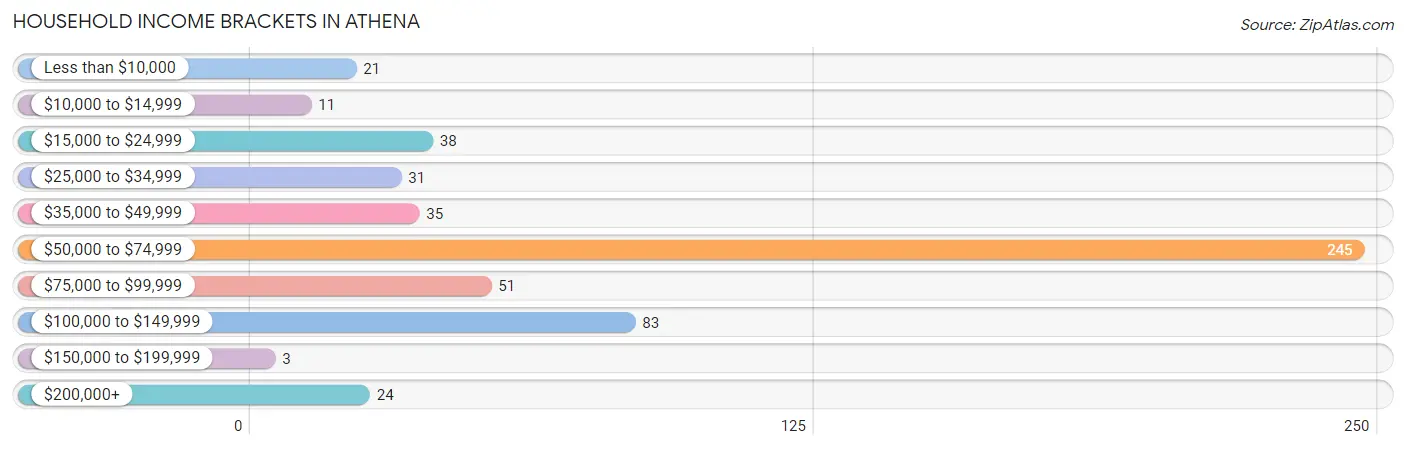
| Income Bracket | # Households | % Households |
| Less than $10,000 | 21 | 3.9% |
| $10,000 to $14,999 | 11 | 2.0% |
| $15,000 to $24,999 | 38 | 7.0% |
| $25,000 to $34,999 | 31 | 5.7% |
| $35,000 to $49,999 | 35 | 6.5% |
| $50,000 to $74,999 | 245 | 45.2% |
| $75,000 to $99,999 | 51 | 9.4% |
| $100,000 to $149,999 | 83 | 15.3% |
| $150,000 to $199,999 | 3 | 0.6% |
| $200,000+ | 24 | 4.4% |
Household Income by Householder Age in Athena
The median household income in Athena is $66,333, with the highest median household income of $73,880 found in the 45 to 64 years age bracket for the primary householder. A total of 203 households (37.4%) fall into this category.
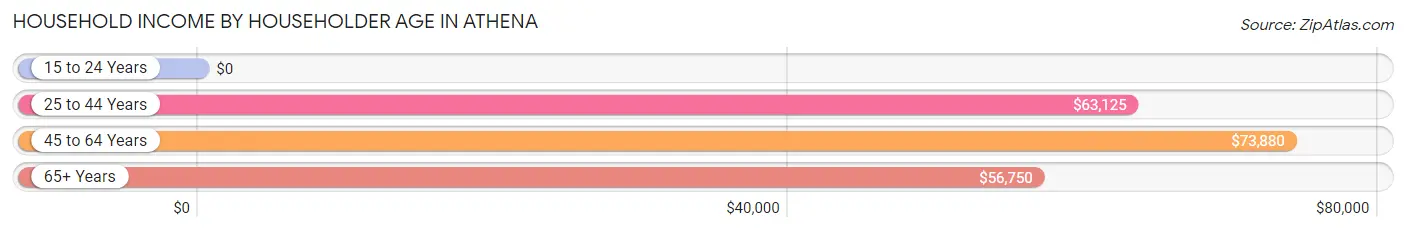
| Income Bracket | # Households | Median Income |
| 15 to 24 Years | 0 (0.0%) | $0 |
| 25 to 44 Years | 194 (35.8%) | $63,125 |
| 45 to 64 Years | 203 (37.4%) | $73,880 |
| 65+ Years | 145 (26.8%) | $56,750 |
| Total | 542 (100.0%) | $66,333 |
Poverty in Athena
Income Below Poverty by Sex and Age in Athena
With 8.6% poverty level for males and 7.2% for females among the residents of Athena, 35 to 44 year old males and 18 to 24 year old females are the most vulnerable to poverty, with 25 males (21.7%) and 15 females (68.2%) in their respective age groups living below the poverty level.
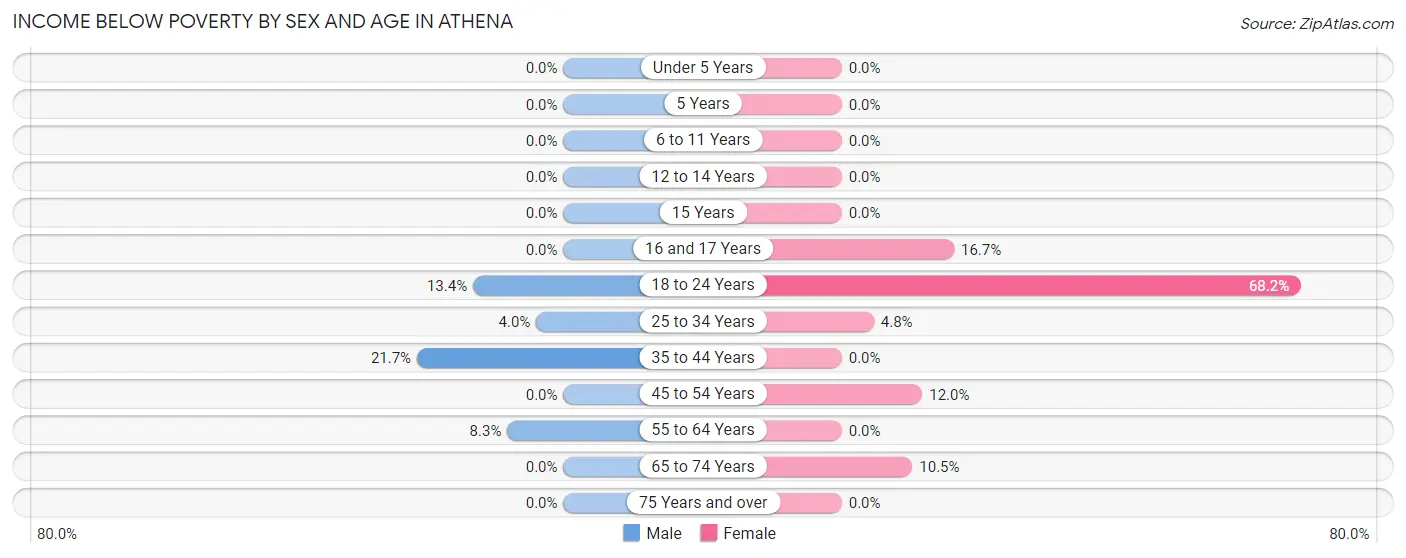
| Age Bracket | Male | Female |
| Under 5 Years | 0 (0.0%) | 0 (0.0%) |
| 5 Years | 0 (0.0%) | 0 (0.0%) |
| 6 to 11 Years | 0 (0.0%) | 0 (0.0%) |
| 12 to 14 Years | 0 (0.0%) | 0 (0.0%) |
| 15 Years | 0 (0.0%) | 0 (0.0%) |
| 16 and 17 Years | 0 (0.0%) | 2 (16.7%) |
| 18 to 24 Years | 20 (13.4%) | 15 (68.2%) |
| 25 to 34 Years | 5 (4.0%) | 4 (4.8%) |
| 35 to 44 Years | 25 (21.7%) | 0 (0.0%) |
| 45 to 54 Years | 0 (0.0%) | 11 (12.0%) |
| 55 to 64 Years | 9 (8.3%) | 0 (0.0%) |
| 65 to 74 Years | 0 (0.0%) | 11 (10.5%) |
| 75 Years and over | 0 (0.0%) | 0 (0.0%) |
| Total | 59 (8.6%) | 43 (7.2%) |
Income Above Poverty by Sex and Age in Athena
According to the poverty statistics in Athena, males aged under 5 years and females aged under 5 years are the age groups that are most secure financially, with 100.0% of males and 100.0% of females in these age groups living above the poverty line.
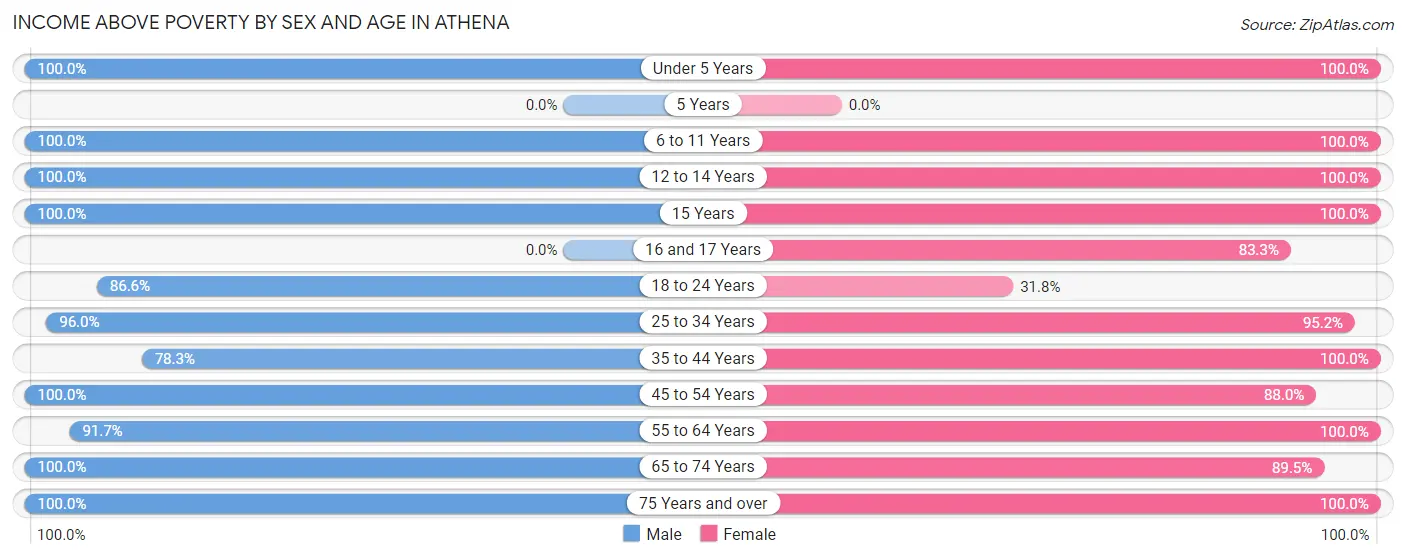
| Age Bracket | Male | Female |
| Under 5 Years | 14 (100.0%) | 12 (100.0%) |
| 5 Years | 0 (0.0%) | 0 (0.0%) |
| 6 to 11 Years | 29 (100.0%) | 42 (100.0%) |
| 12 to 14 Years | 36 (100.0%) | 22 (100.0%) |
| 15 Years | 14 (100.0%) | 7 (100.0%) |
| 16 and 17 Years | 0 (0.0%) | 10 (83.3%) |
| 18 to 24 Years | 129 (86.6%) | 7 (31.8%) |
| 25 to 34 Years | 119 (96.0%) | 80 (95.2%) |
| 35 to 44 Years | 90 (78.3%) | 57 (100.0%) |
| 45 to 54 Years | 35 (100.0%) | 81 (88.0%) |
| 55 to 64 Years | 99 (91.7%) | 112 (100.0%) |
| 65 to 74 Years | 49 (100.0%) | 94 (89.5%) |
| 75 Years and over | 14 (100.0%) | 28 (100.0%) |
| Total | 628 (91.4%) | 552 (92.8%) |
Income Below Poverty Among Married-Couple Families in Athena
The poverty statistics for married-couple families in Athena show that 4.8% or 13 of the total 272 families live below the poverty line. Families with no children have the highest poverty rate of 7.3%, comprising of 13 families. On the other hand, families with 1 or 2 children have the lowest poverty rate of 0.0%, which includes 0 families.
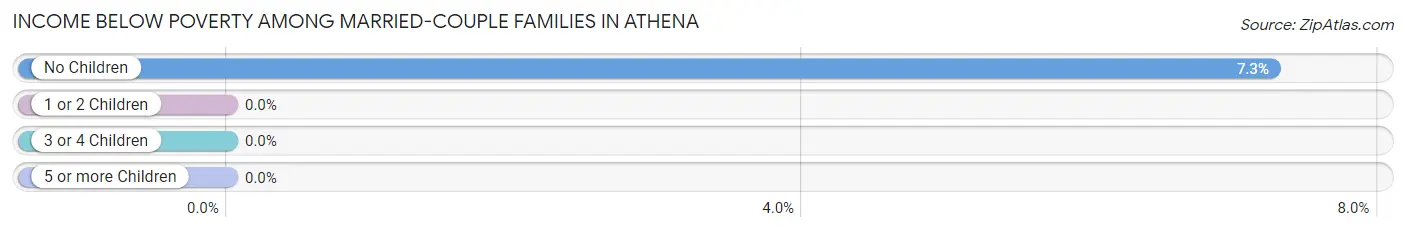
| Children | Above Poverty | Below Poverty |
| No Children | 166 (92.7%) | 13 (7.3%) |
| 1 or 2 Children | 81 (100.0%) | 0 (0.0%) |
| 3 or 4 Children | 8 (100.0%) | 0 (0.0%) |
| 5 or more Children | 4 (100.0%) | 0 (0.0%) |
| Total | 259 (95.2%) | 13 (4.8%) |
Income Below Poverty Among Single-Parent Households in Athena
| Children | Single Father | Single Mother |
| No Children | 0 (0.0%) | 0 (0.0%) |
| 1 or 2 Children | 0 (0.0%) | 0 (0.0%) |
| 3 or 4 Children | 0 (0.0%) | 0 (0.0%) |
| 5 or more Children | 0 (0.0%) | 0 (0.0%) |
| Total | 0 (0.0%) | 0 (0.0%) |
Income Below Poverty Among Married-Couple vs Single-Parent Households in Athena
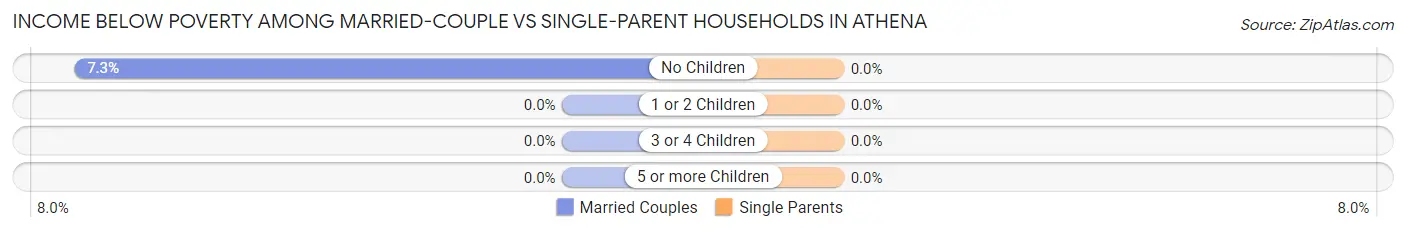
| Children | Married-Couple Families | Single-Parent Households |
| No Children | 13 (7.3%) | 0 (0.0%) |
| 1 or 2 Children | 0 (0.0%) | 0 (0.0%) |
| 3 or 4 Children | 0 (0.0%) | 0 (0.0%) |
| 5 or more Children | 0 (0.0%) | 0 (0.0%) |
| Total | 13 (4.8%) | 0 (0.0%) |
Race in Athena
The most populous races in Athena are White / Caucasian (1,244 | 93.3%), Hispanic or Latino (58 | 4.3%), and Some other Race (42 | 3.2%).
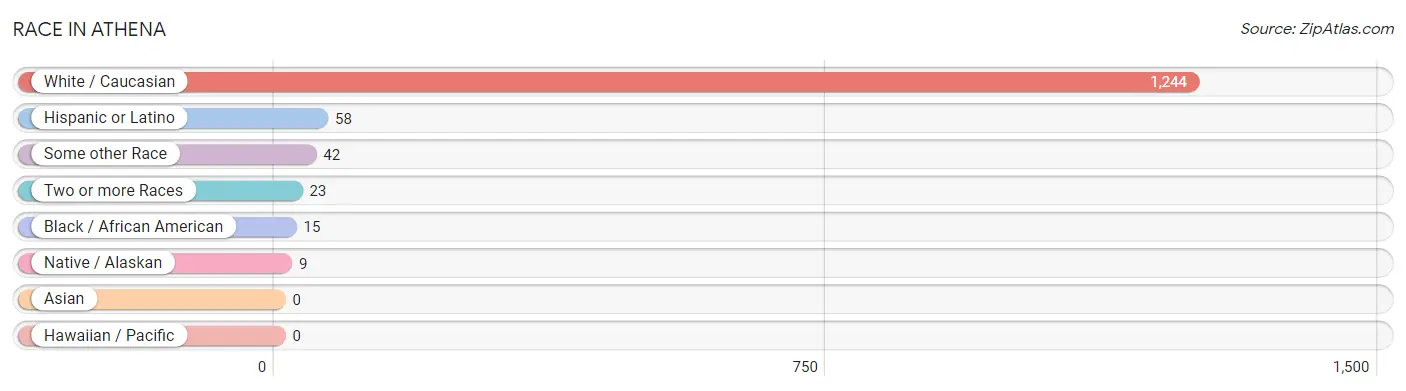
| Race | # Population | % Population |
| Asian | 0 | 0.0% |
| Black / African American | 15 | 1.1% |
| Hawaiian / Pacific | 0 | 0.0% |
| Hispanic or Latino | 58 | 4.3% |
| Native / Alaskan | 9 | 0.7% |
| White / Caucasian | 1,244 | 93.3% |
| Two or more Races | 23 | 1.7% |
| Some other Race | 42 | 3.2% |
| Total | 1,333 | 100.0% |
Ancestry in Athena
The most populous ancestries reported in Athena are German (255 | 19.1%), Irish (157 | 11.8%), American (150 | 11.3%), Scottish (103 | 7.7%), and English (96 | 7.2%), together accounting for 57.1% of all Athena residents.
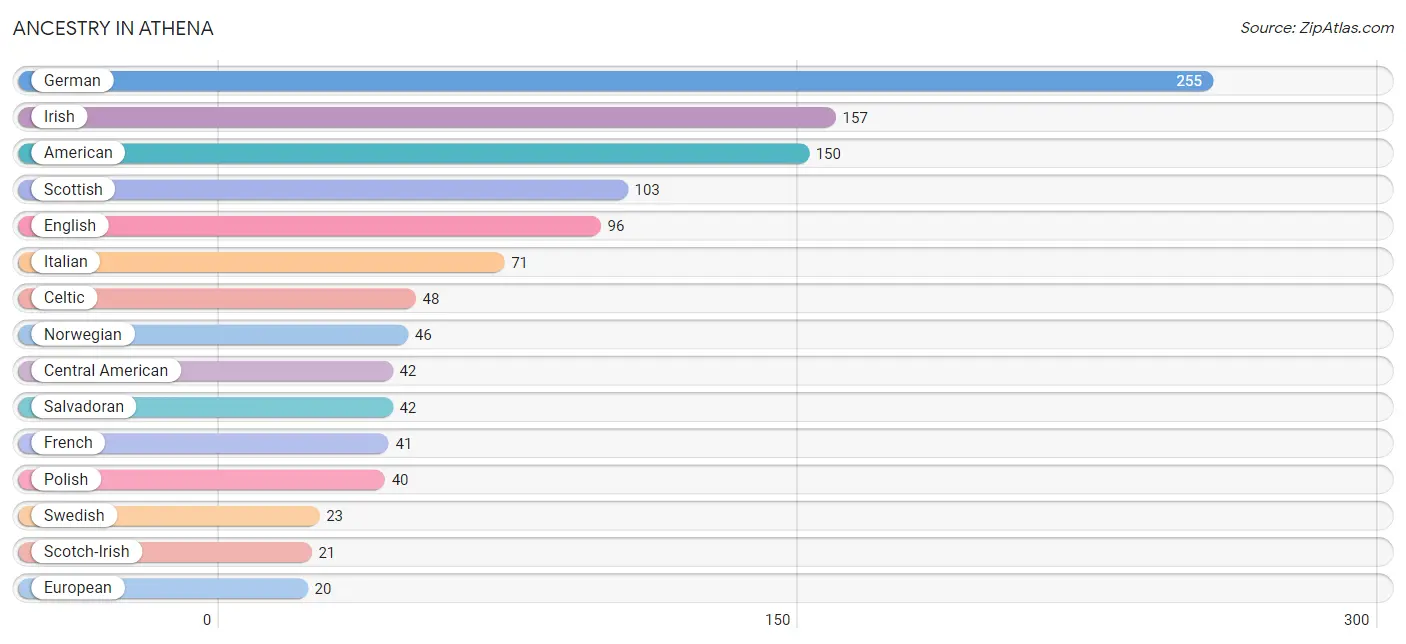
| Ancestry | # Population | % Population |
| American | 150 | 11.3% |
| Brazilian | 5 | 0.4% |
| British | 10 | 0.7% |
| Celtic | 48 | 3.6% |
| Central American | 42 | 3.2% |
| Chippewa | 12 | 0.9% |
| Cuban | 4 | 0.3% |
| Eastern European | 11 | 0.8% |
| English | 96 | 7.2% |
| European | 20 | 1.5% |
| French | 41 | 3.1% |
| German | 255 | 19.1% |
| Irish | 157 | 11.8% |
| Italian | 71 | 5.3% |
| Mexican | 1 | 0.1% |
| Norwegian | 46 | 3.5% |
| Paiute | 9 | 0.7% |
| Polish | 40 | 3.0% |
| Romanian | 10 | 0.7% |
| Salvadoran | 42 | 3.2% |
| Scandinavian | 4 | 0.3% |
| Scotch-Irish | 21 | 1.6% |
| Scottish | 103 | 7.7% |
| Shoshone | 9 | 0.7% |
| Spaniard | 10 | 0.7% |
| Spanish | 1 | 0.1% |
| Swedish | 23 | 1.7% |
| Swiss | 13 | 1.0% | View All 28 Rows |
Immigrants in Athena
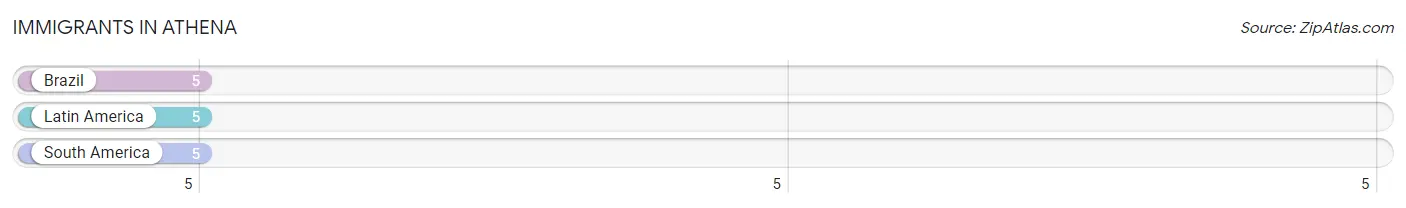
The most numerous immigrant groups reported in Athena came from Brazil (5 | 0.4%), Latin America (5 | 0.4%), and South America (5 | 0.4%), together accounting for 1.1% of all Athena residents.
| Immigration Origin | # Population | % Population |
| Brazil | 5 | 0.4% |
| Latin America | 5 | 0.4% |
| South America | 5 | 0.4% | View All 3 Rows |
Sex and Age in Athena
Sex and Age in Athena
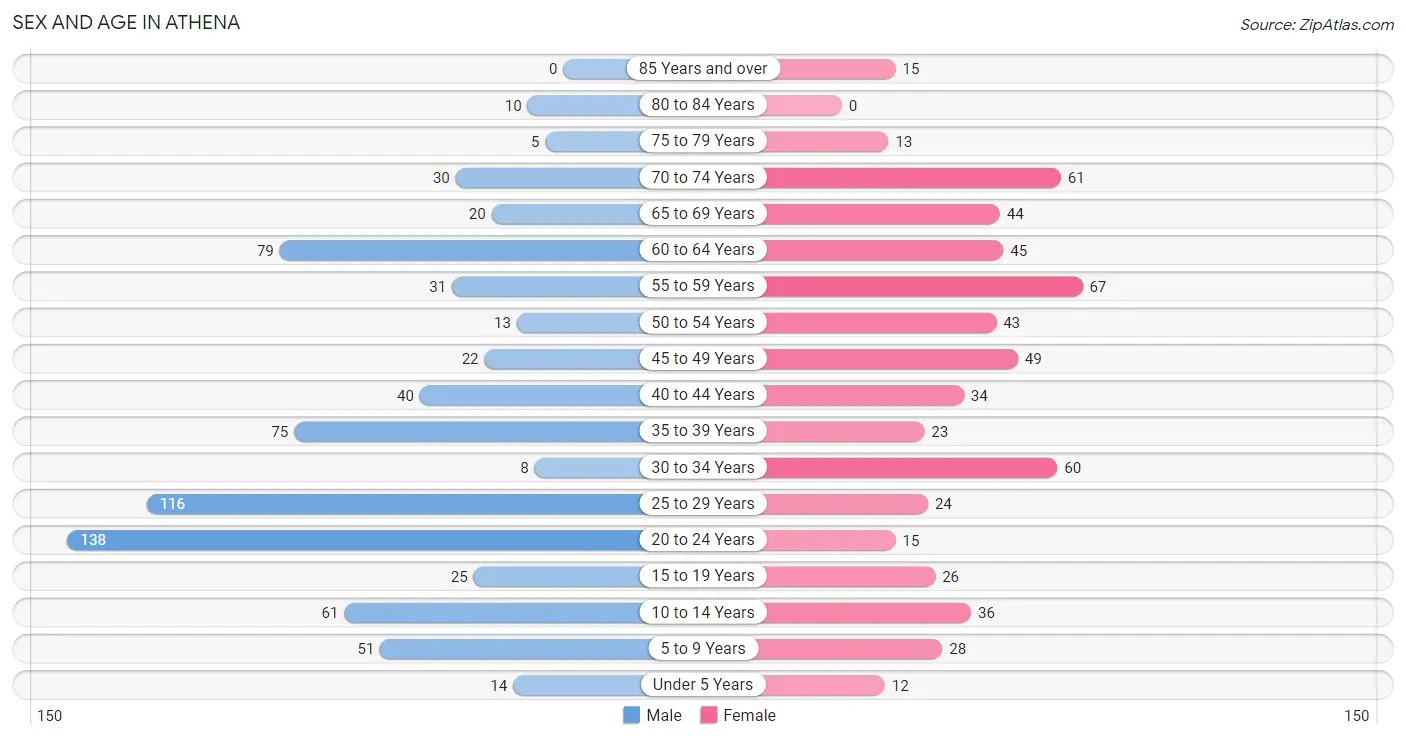
The most populous age groups in Athena are 20 to 24 Years (138 | 18.7%) for men and 55 to 59 Years (67 | 11.3%) for women.
| Age Bracket | Male | Female |
| Under 5 Years | 14 (1.9%) | 12 (2.0%) |
| 5 to 9 Years | 51 (6.9%) | 28 (4.7%) |
| 10 to 14 Years | 61 (8.3%) | 36 (6.0%) |
| 15 to 19 Years | 25 (3.4%) | 26 (4.4%) |
| 20 to 24 Years | 138 (18.7%) | 15 (2.5%) |
| 25 to 29 Years | 116 (15.7%) | 24 (4.0%) |
| 30 to 34 Years | 8 (1.1%) | 60 (10.1%) |
| 35 to 39 Years | 75 (10.2%) | 23 (3.9%) |
| 40 to 44 Years | 40 (5.4%) | 34 (5.7%) |
| 45 to 49 Years | 22 (3.0%) | 49 (8.2%) |
| 50 to 54 Years | 13 (1.8%) | 43 (7.2%) |
| 55 to 59 Years | 31 (4.2%) | 67 (11.3%) |
| 60 to 64 Years | 79 (10.7%) | 45 (7.6%) |
| 65 to 69 Years | 20 (2.7%) | 44 (7.4%) |
| 70 to 74 Years | 30 (4.1%) | 61 (10.2%) |
| 75 to 79 Years | 5 (0.7%) | 13 (2.2%) |
| 80 to 84 Years | 10 (1.4%) | 0 (0.0%) |
| 85 Years and over | 0 (0.0%) | 15 (2.5%) |
| Total | 738 (100.0%) | 595 (100.0%) |
Families and Households in Athena
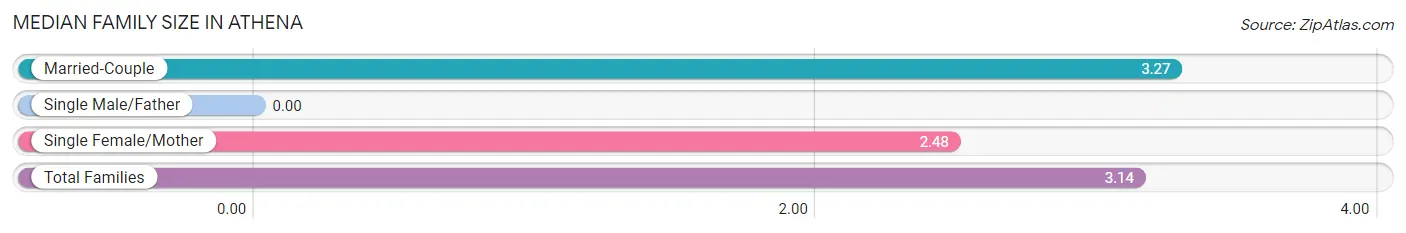
Median Family Size in Athena
| Family Type | # Families | Family Size |
| Married-Couple | 272 (84.0%) | 3.27 |
| Single Male/Father | 0 (0.0%) | - |
| Single Female/Mother | 52 (16.1%) | 2.48 |
| Total Families | 324 (100.0%) | 3.14 |
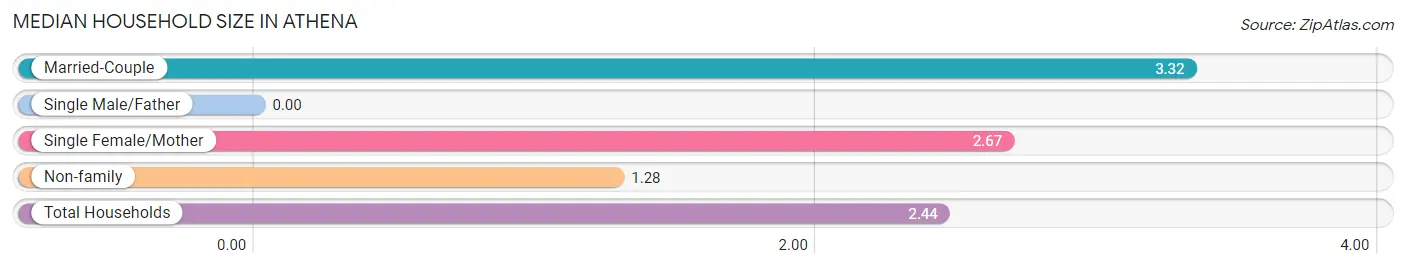
Median Household Size in Athena
| Household Type | # Households | Household Size |
| Married-Couple | 272 (50.2%) | 3.32 |
| Single Male/Father | 0 (0.0%) | - |
| Single Female/Mother | 52 (9.6%) | 2.67 |
| Non-family | 218 (40.2%) | 1.28 |
| Total Households | 542 (100.0%) | 2.44 |
Household Size by Marriage Status in Athena
Out of a total of 542 households in Athena, 324 (59.8%) are family households, while 218 (40.2%) are nonfamily households. The most numerous type of family households are 3-person households, comprising 127, and the most common type of nonfamily households are 1-person households, comprising 190.
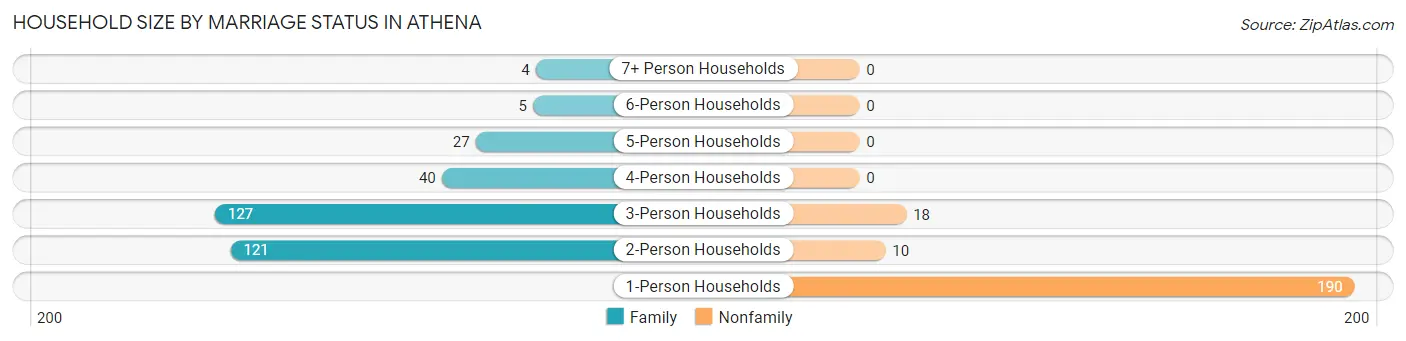
| Household Size | Family Households | Nonfamily Households |
| 1-Person Households | - | 190 (35.1%) |
| 2-Person Households | 121 (22.3%) | 10 (1.8%) |
| 3-Person Households | 127 (23.4%) | 18 (3.3%) |
| 4-Person Households | 40 (7.4%) | 0 (0.0%) |
| 5-Person Households | 27 (5.0%) | 0 (0.0%) |
| 6-Person Households | 5 (0.9%) | 0 (0.0%) |
| 7+ Person Households | 4 (0.7%) | 0 (0.0%) |
| Total | 324 (59.8%) | 218 (40.2%) |
Female Fertility in Athena
Fertility by Age in Athena
| Age Bracket | Women with Births | Births / 1,000 Women |
| 15 to 19 years | 0 (0.0%) | 0.0 |
| 20 to 34 years | 0 (0.0%) | 0.0 |
| 35 to 50 years | 0 (0.0%) | 0.0 |
| Total | 0 (0.0%) | 0.0 |
Fertility by Age by Marriage Status in Athena
| Age Bracket | Married | Unmarried |
| 15 to 19 years | 0 (0.0%) | 0 (0.0%) |
| 20 to 34 years | 0 (0.0%) | 0 (0.0%) |
| 35 to 50 years | 0 (0.0%) | 0 (0.0%) |
| Total | 0 (0.0%) | 0 (0.0%) |
Fertility by Education in Athena
| Educational Attainment | Women with Births | Births / 1,000 Women |
| Less than High School | 0 (0.0%) | 0.0 |
| High School Diploma | 0 (0.0%) | 0.0 |
| College or Associate's Degree | 0 (0.0%) | 0.0 |
| Bachelor's Degree | 0 (0.0%) | 0.0 |
| Graduate Degree | 0 (0.0%) | 0.0 |
| Total | 0 (0.0%) | 0.0 |
Fertility by Education by Marriage Status in Athena
| Educational Attainment | Married | Unmarried |
| Less than High School | 0 (0.0%) | 0 (0.0%) |
| High School Diploma | 0 (0.0%) | 0 (0.0%) |
| College or Associate's Degree | 0 (0.0%) | 0 (0.0%) |
| Bachelor's Degree | 0 (0.0%) | 0 (0.0%) |
| Graduate Degree | 0 (0.0%) | 0 (0.0%) |
| Total | 0 (0.0%) | 0 (0.0%) |
Employment Characteristics in Athena
Employment by Class of Employer in Athena
Among the 604 employed individuals in Athena, private company employees (427 | 70.7%), not-for-profit organizations (47 | 7.8%), and federal government employees (42 | 7.0%) make up the most common classes of employment.
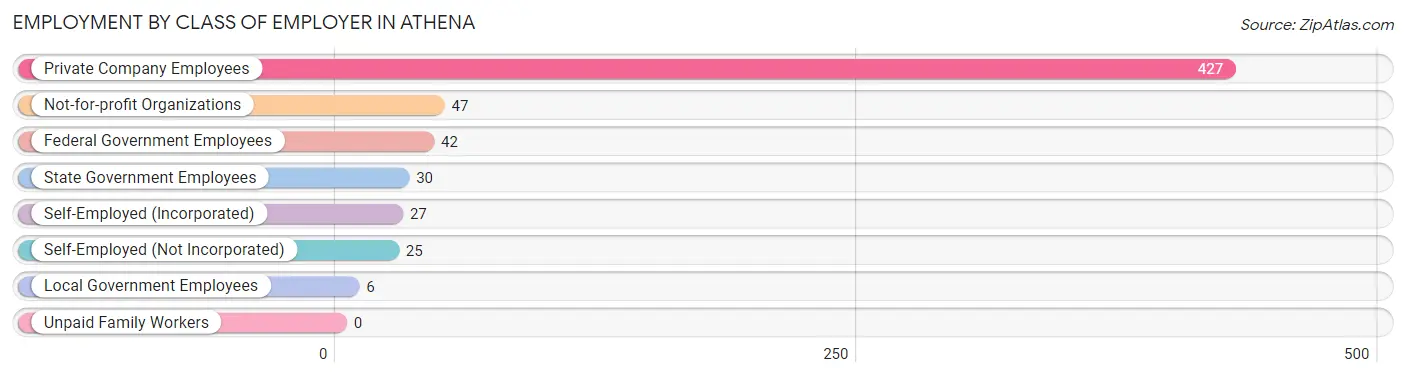
| Employer Class | # Employees | % Employees |
| Private Company Employees | 427 | 70.7% |
| Self-Employed (Incorporated) | 27 | 4.5% |
| Self-Employed (Not Incorporated) | 25 | 4.1% |
| Not-for-profit Organizations | 47 | 7.8% |
| Local Government Employees | 6 | 1.0% |
| State Government Employees | 30 | 5.0% |
| Federal Government Employees | 42 | 7.0% |
| Unpaid Family Workers | 0 | 0.0% |
| Total | 604 | 100.0% |
Employment Status by Age in Athena
According to the labor force statistics for Athena, out of the total population over 16 years of age (1,110), 61.0% or 677 individuals are in the labor force, with 10.5% or 71 of them unemployed. The age group with the highest labor force participation rate is 25 to 29 years, with 96.4% or 135 individuals in the labor force. Within the labor force, the 60 to 64 years age range has the highest percentage of unemployed individuals, with 52.7% or 48 of them being unemployed.
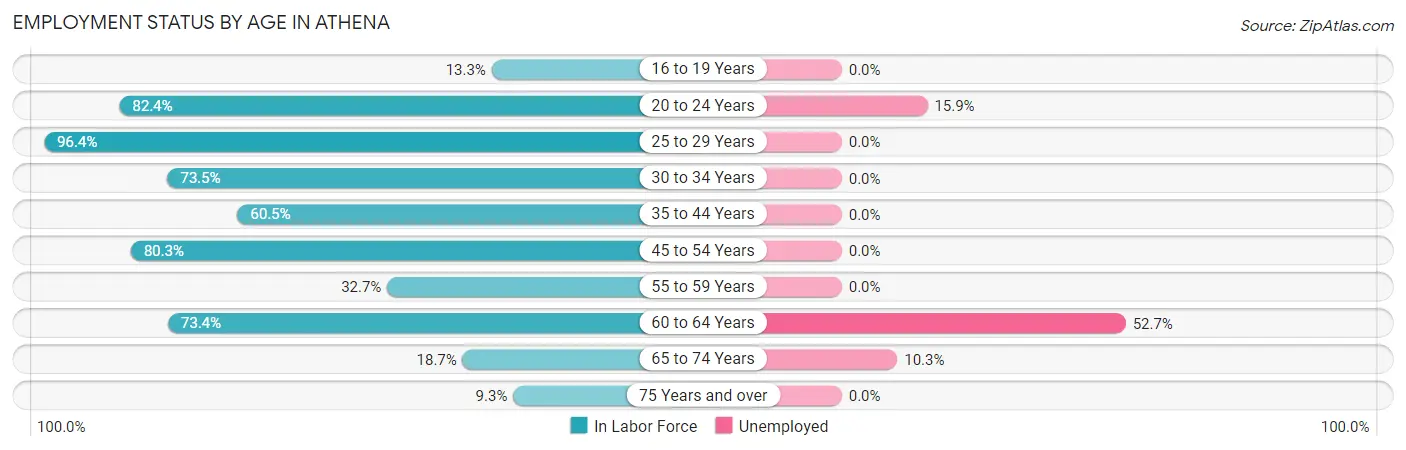
| Age Bracket | In Labor Force | Unemployed |
| 16 to 19 Years | 4 (13.3%) | 0 (0.0%) |
| 20 to 24 Years | 126 (82.4%) | 20 (15.9%) |
| 25 to 29 Years | 135 (96.4%) | 0 (0.0%) |
| 30 to 34 Years | 50 (73.5%) | 0 (0.0%) |
| 35 to 44 Years | 104 (60.5%) | 0 (0.0%) |
| 45 to 54 Years | 102 (80.3%) | 0 (0.0%) |
| 55 to 59 Years | 32 (32.7%) | 0 (0.0%) |
| 60 to 64 Years | 91 (73.4%) | 48 (52.7%) |
| 65 to 74 Years | 29 (18.7%) | 3 (10.3%) |
| 75 Years and over | 4 (9.3%) | 0 (0.0%) |
| Total | 677 (61.0%) | 71 (10.5%) |
Employment Status by Educational Attainment in Athena
According to labor force statistics for Athena, 70.5% of individuals (514) out of the total population between 25 and 64 years of age (729) are in the labor force, with 9.3% or 48 of them being unemployed. The group with the highest labor force participation rate are those with the educational attainment of college / associate degree, with 88.2% or 201 individuals in the labor force. Within the labor force, individuals with college / associate degree education have the highest percentage of unemployment, with 23.9% or 48 of them being unemployed.
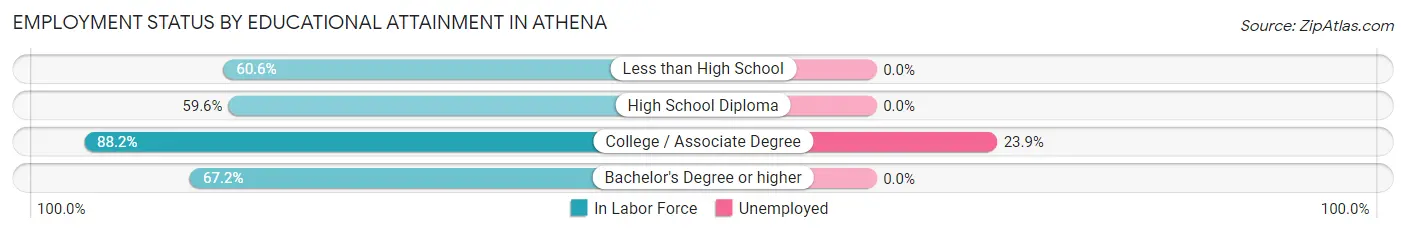
| Educational Attainment | In Labor Force | Unemployed |
| Less than High School | 43 (60.6%) | 0 (0.0%) |
| High School Diploma | 149 (59.6%) | 0 (0.0%) |
| College / Associate Degree | 201 (88.2%) | 54 (23.9%) |
| Bachelor's Degree or higher | 121 (67.2%) | 0 (0.0%) |
| Total | 514 (70.5%) | 68 (9.3%) |
Employment Occupations by Sex in Athena
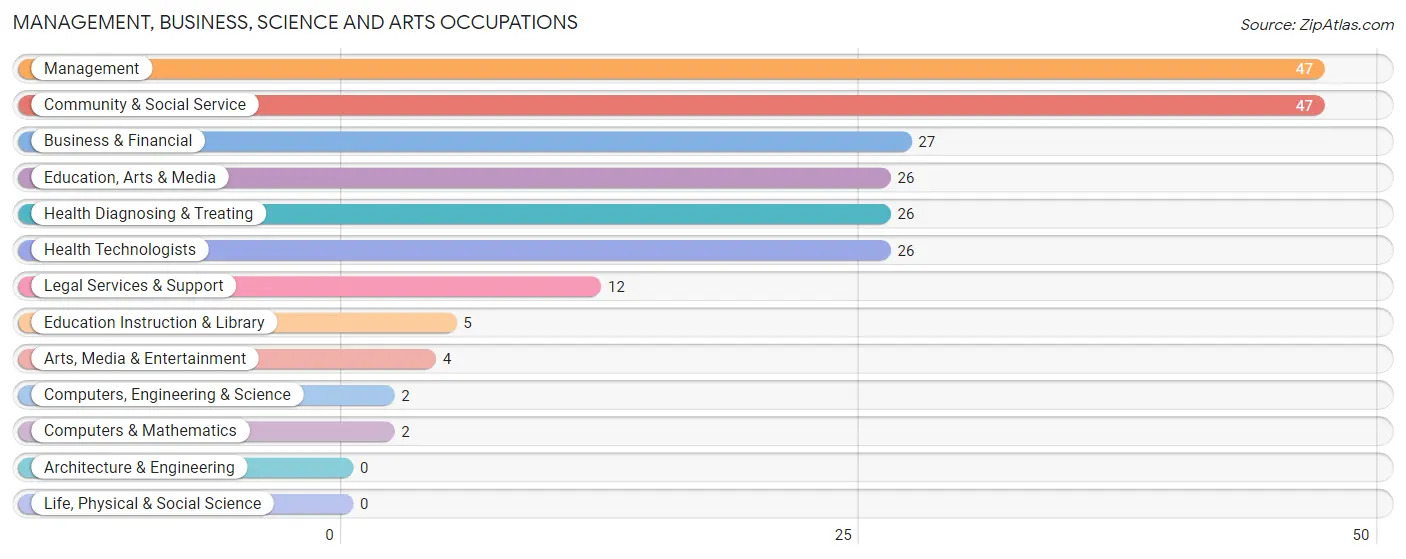
Management, Business, Science and Arts Occupations
The most common Management, Business, Science and Arts occupations in Athena are Management (47 | 7.8%), Community & Social Service (47 | 7.8%), Business & Financial (27 | 4.5%), Education, Arts & Media (26 | 4.3%), and Health Diagnosing & Treating (26 | 4.3%).
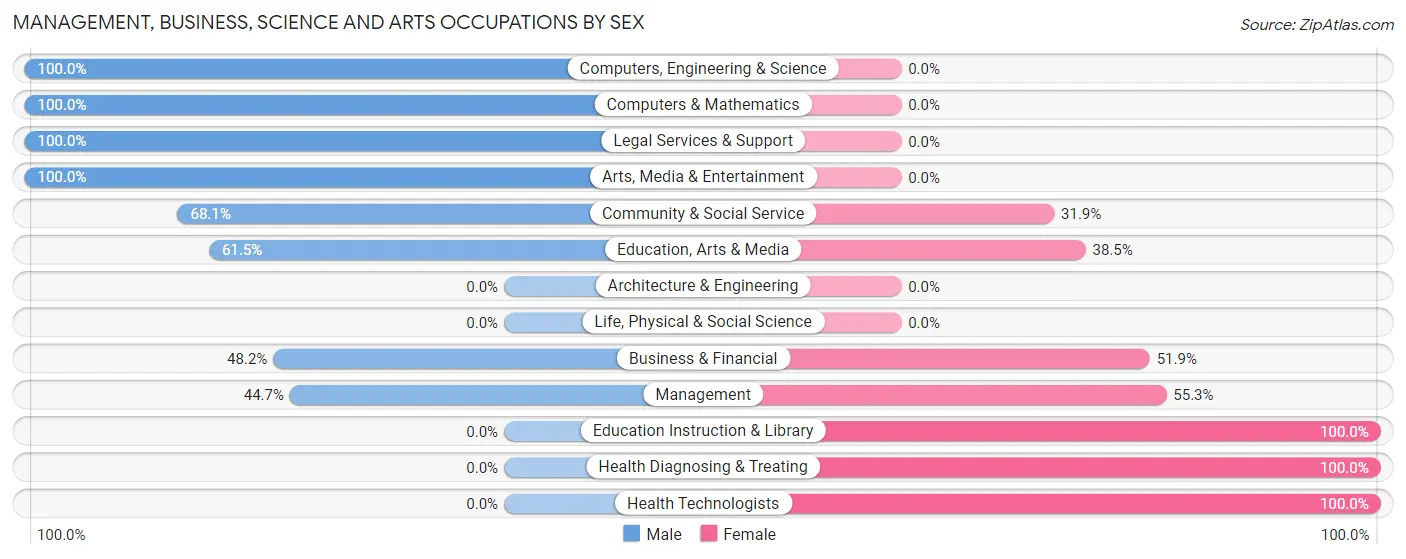
Management, Business, Science and Arts Occupations by Sex
Within the Management, Business, Science and Arts occupations in Athena, the most male-oriented occupations are Computers, Engineering & Science (100.0%), Computers & Mathematics (100.0%), and Legal Services & Support (100.0%), while the most female-oriented occupations are Education Instruction & Library (100.0%), Health Diagnosing & Treating (100.0%), and Health Technologists (100.0%).
| Occupation | Male | Female |
| Management | 21 (44.7%) | 26 (55.3%) |
| Business & Financial | 13 (48.1%) | 14 (51.8%) |
| Computers, Engineering & Science | 2 (100.0%) | 0 (0.0%) |
| Computers & Mathematics | 2 (100.0%) | 0 (0.0%) |
| Architecture & Engineering | 0 (0.0%) | 0 (0.0%) |
| Life, Physical & Social Science | 0 (0.0%) | 0 (0.0%) |
| Community & Social Service | 32 (68.1%) | 15 (31.9%) |
| Education, Arts & Media | 16 (61.5%) | 10 (38.5%) |
| Legal Services & Support | 12 (100.0%) | 0 (0.0%) |
| Education Instruction & Library | 0 (0.0%) | 5 (100.0%) |
| Arts, Media & Entertainment | 4 (100.0%) | 0 (0.0%) |
| Health Diagnosing & Treating | 0 (0.0%) | 26 (100.0%) |
| Health Technologists | 0 (0.0%) | 26 (100.0%) |
| Total (Category) | 68 (45.6%) | 81 (54.4%) |
| Total (Overall) | 387 (63.9%) | 219 (36.1%) |
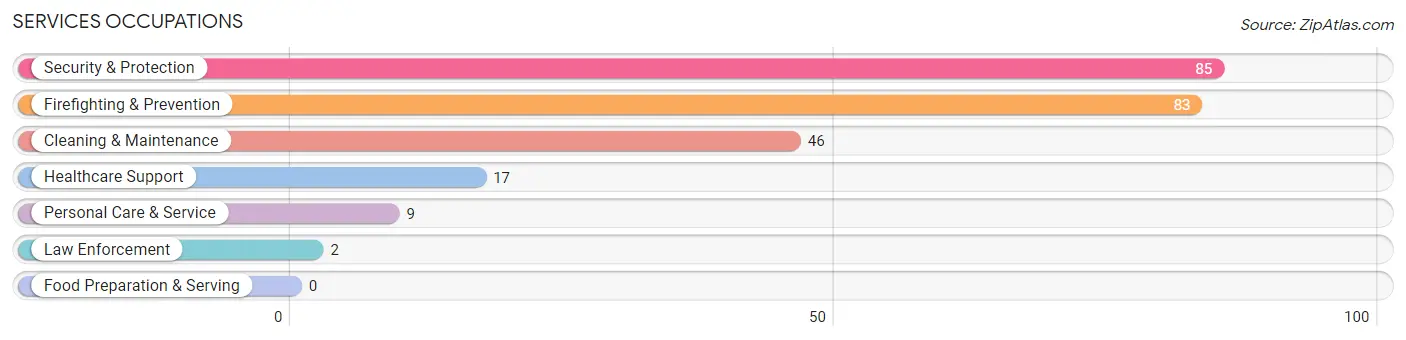
Services Occupations
The most common Services occupations in Athena are Security & Protection (85 | 14.0%), Firefighting & Prevention (83 | 13.7%), Cleaning & Maintenance (46 | 7.6%), Healthcare Support (17 | 2.8%), and Personal Care & Service (9 | 1.5%).
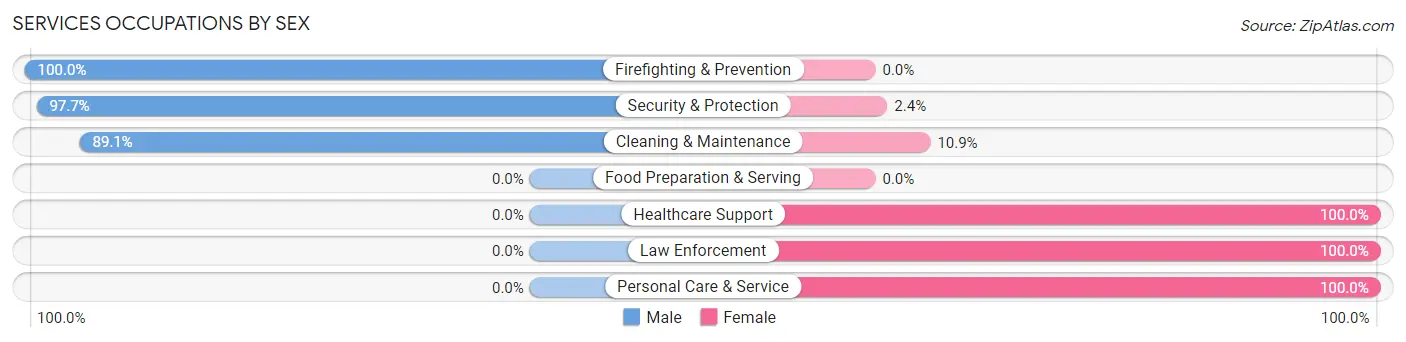
Services Occupations by Sex
Within the Services occupations in Athena, the most male-oriented occupations are Firefighting & Prevention (100.0%), Security & Protection (97.7%), and Cleaning & Maintenance (89.1%), while the most female-oriented occupations are Healthcare Support (100.0%), Law Enforcement (100.0%), and Personal Care & Service (100.0%).
| Occupation | Male | Female |
| Healthcare Support | 0 (0.0%) | 17 (100.0%) |
| Security & Protection | 83 (97.7%) | 2 (2.4%) |
| Firefighting & Prevention | 83 (100.0%) | 0 (0.0%) |
| Law Enforcement | 0 (0.0%) | 2 (100.0%) |
| Food Preparation & Serving | 0 (0.0%) | 0 (0.0%) |
| Cleaning & Maintenance | 41 (89.1%) | 5 (10.9%) |
| Personal Care & Service | 0 (0.0%) | 9 (100.0%) |
| Total (Category) | 124 (79.0%) | 33 (21.0%) |
| Total (Overall) | 387 (63.9%) | 219 (36.1%) |
Sales and Office Occupations
The most common Sales and Office occupations in Athena are Office & Administration (61 | 10.1%), and Sales & Related (55 | 9.1%).
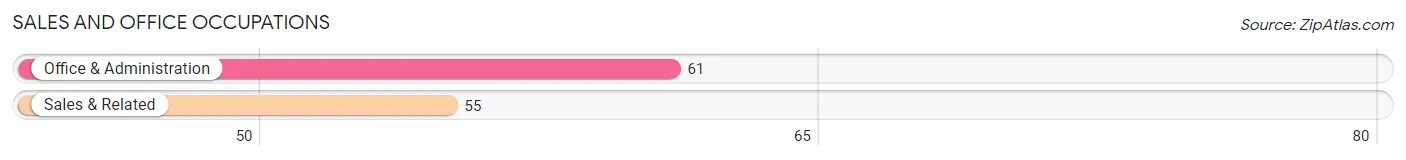
Sales and Office Occupations by Sex
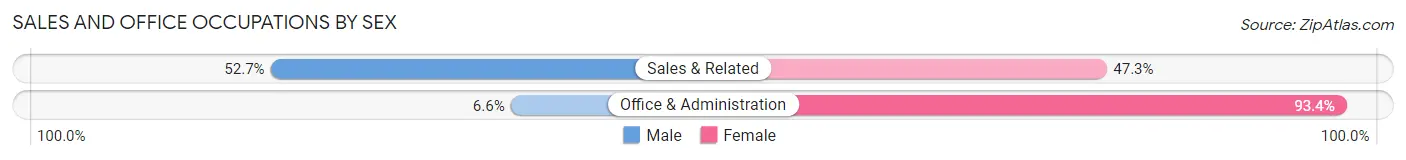
| Occupation | Male | Female |
| Sales & Related | 29 (52.7%) | 26 (47.3%) |
| Office & Administration | 4 (6.6%) | 57 (93.4%) |
| Total (Category) | 33 (28.4%) | 83 (71.6%) |
| Total (Overall) | 387 (63.9%) | 219 (36.1%) |
Natural Resources, Construction and Maintenance Occupations
The most common Natural Resources, Construction and Maintenance occupations in Athena are Installation, Maintenance & Repair (98 | 16.2%), Construction & Extraction (51 | 8.4%), and Farming, Fishing & Forestry (11 | 1.8%).
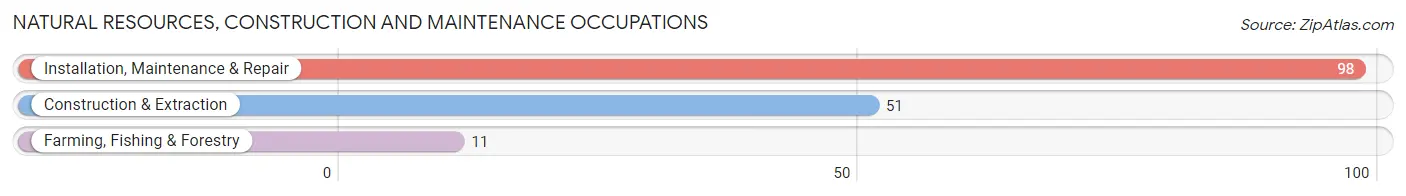
Natural Resources, Construction and Maintenance Occupations by Sex
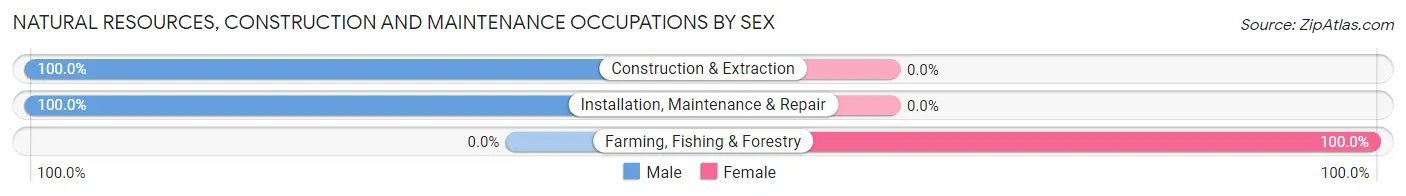
| Occupation | Male | Female |
| Farming, Fishing & Forestry | 0 (0.0%) | 11 (100.0%) |
| Construction & Extraction | 51 (100.0%) | 0 (0.0%) |
| Installation, Maintenance & Repair | 98 (100.0%) | 0 (0.0%) |
| Total (Category) | 149 (93.1%) | 11 (6.9%) |
| Total (Overall) | 387 (63.9%) | 219 (36.1%) |
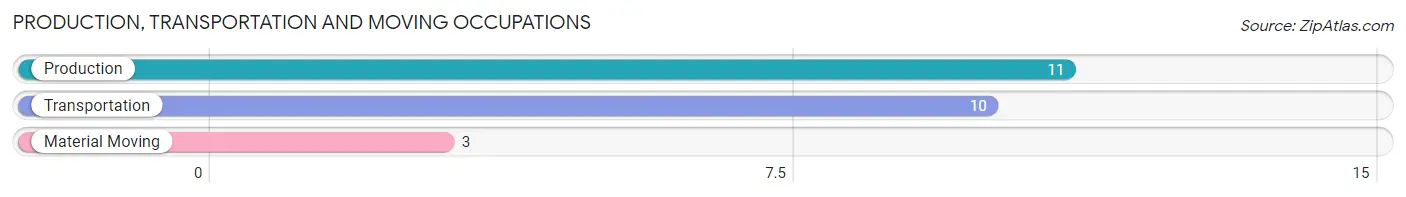
Production, Transportation and Moving Occupations
The most common Production, Transportation and Moving occupations in Athena are Production (11 | 1.8%), Transportation (10 | 1.7%), and Material Moving (3 | 0.5%).
Production, Transportation and Moving Occupations by Sex
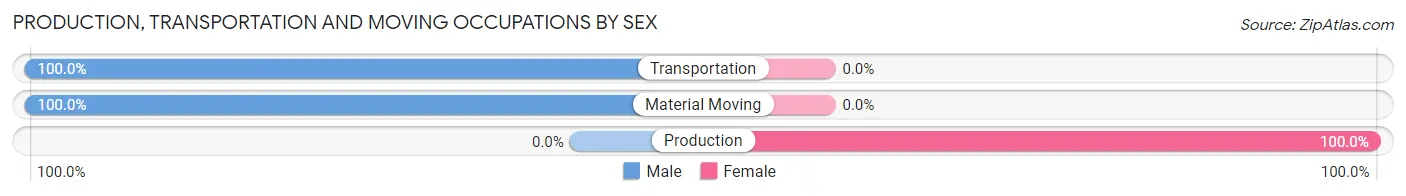
| Occupation | Male | Female |
| Production | 0 (0.0%) | 11 (100.0%) |
| Transportation | 10 (100.0%) | 0 (0.0%) |
| Material Moving | 3 (100.0%) | 0 (0.0%) |
| Total (Category) | 13 (54.2%) | 11 (45.8%) |
| Total (Overall) | 387 (63.9%) | 219 (36.1%) |
Employment Industries by Sex in Athena
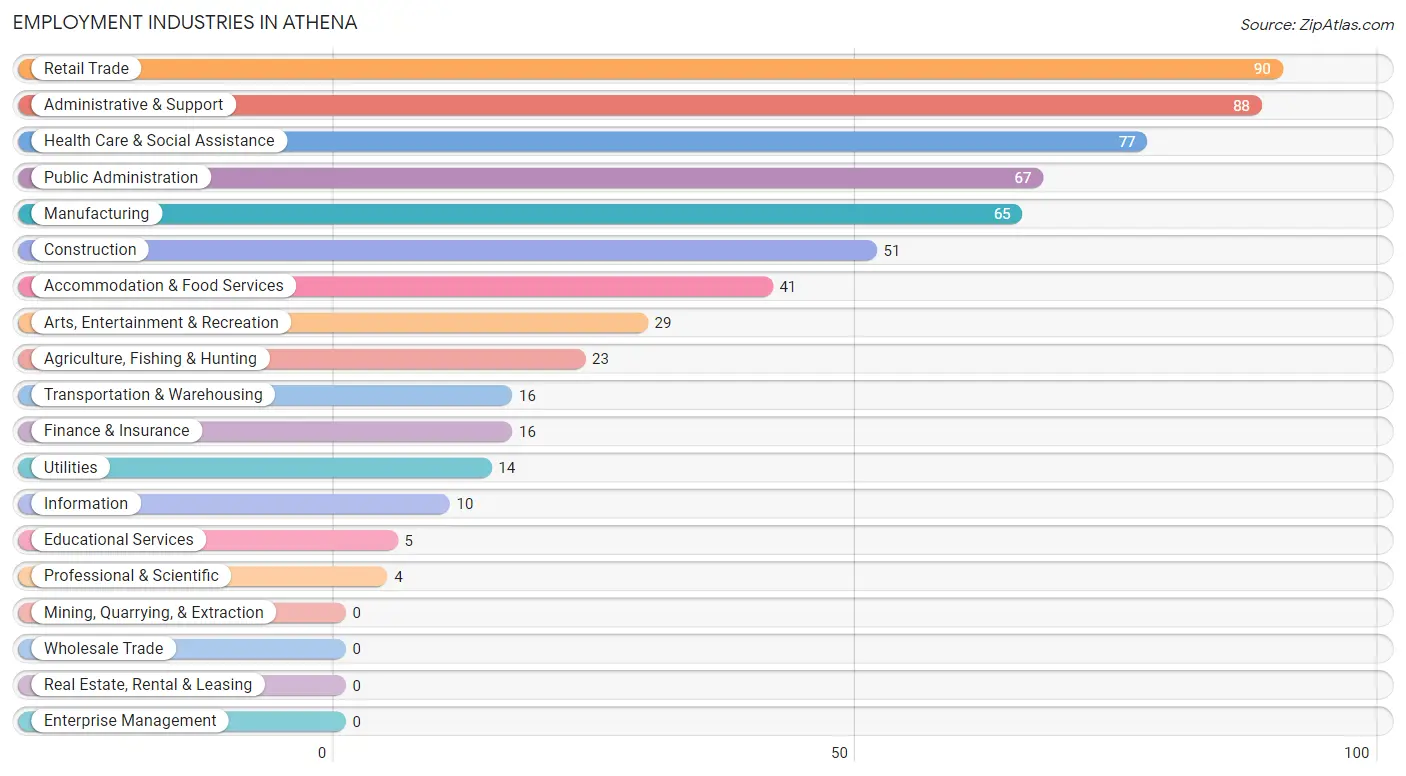
Employment Industries in Athena
The major employment industries in Athena include Retail Trade (90 | 14.8%), Administrative & Support (88 | 14.5%), Health Care & Social Assistance (77 | 12.7%), Public Administration (67 | 11.1%), and Manufacturing (65 | 10.7%).
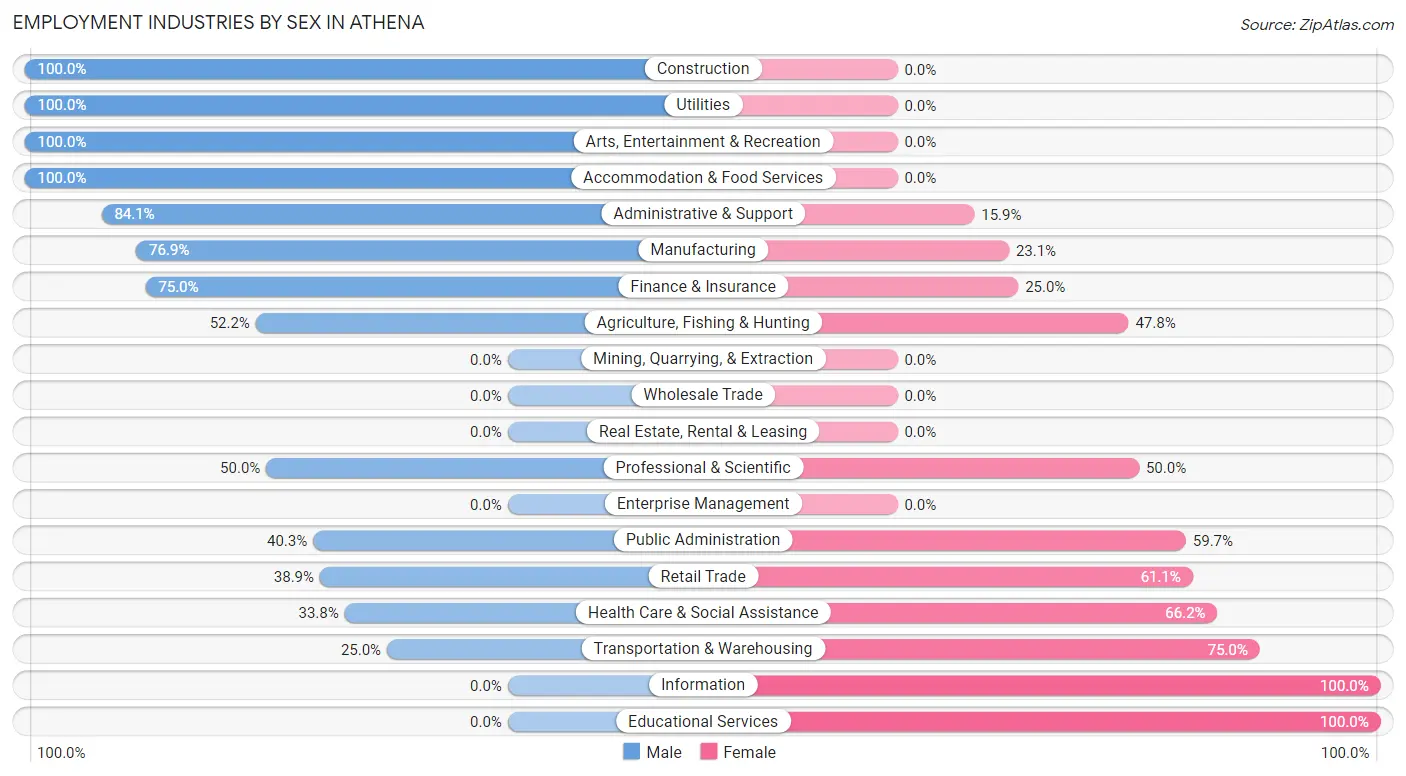
Employment Industries by Sex in Athena
The Athena industries that see more men than women are Construction (100.0%), Utilities (100.0%), and Arts, Entertainment & Recreation (100.0%), whereas the industries that tend to have a higher number of women are Information (100.0%), Educational Services (100.0%), and Transportation & Warehousing (75.0%).
| Industry | Male | Female |
| Agriculture, Fishing & Hunting | 12 (52.2%) | 11 (47.8%) |
| Mining, Quarrying, & Extraction | 0 (0.0%) | 0 (0.0%) |
| Construction | 51 (100.0%) | 0 (0.0%) |
| Manufacturing | 50 (76.9%) | 15 (23.1%) |
| Wholesale Trade | 0 (0.0%) | 0 (0.0%) |
| Retail Trade | 35 (38.9%) | 55 (61.1%) |
| Transportation & Warehousing | 4 (25.0%) | 12 (75.0%) |
| Utilities | 14 (100.0%) | 0 (0.0%) |
| Information | 0 (0.0%) | 10 (100.0%) |
| Finance & Insurance | 12 (75.0%) | 4 (25.0%) |
| Real Estate, Rental & Leasing | 0 (0.0%) | 0 (0.0%) |
| Professional & Scientific | 2 (50.0%) | 2 (50.0%) |
| Enterprise Management | 0 (0.0%) | 0 (0.0%) |
| Administrative & Support | 74 (84.1%) | 14 (15.9%) |
| Educational Services | 0 (0.0%) | 5 (100.0%) |
| Health Care & Social Assistance | 26 (33.8%) | 51 (66.2%) |
| Arts, Entertainment & Recreation | 29 (100.0%) | 0 (0.0%) |
| Accommodation & Food Services | 41 (100.0%) | 0 (0.0%) |
| Public Administration | 27 (40.3%) | 40 (59.7%) |
| Total | 387 (63.9%) | 219 (36.1%) |
Education in Athena
School Enrollment in Athena
The most common levels of schooling among the 232 students in Athena are middle school (95 | 40.9%), elementary school (80 | 34.5%), and high school (37 | 16.0%).
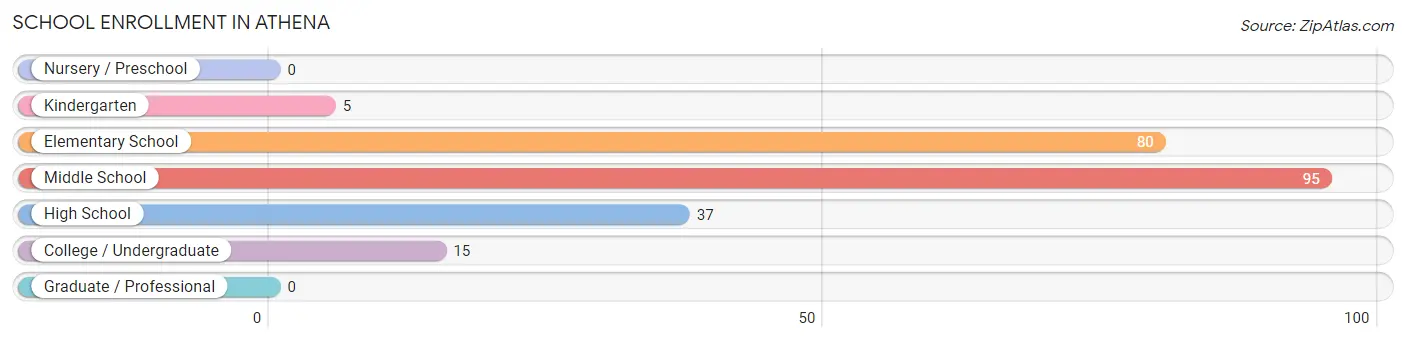
| School Level | # Students | % Students |
| Nursery / Preschool | 0 | 0.0% |
| Kindergarten | 5 | 2.2% |
| Elementary School | 80 | 34.5% |
| Middle School | 95 | 40.9% |
| High School | 37 | 16.0% |
| College / Undergraduate | 15 | 6.5% |
| Graduate / Professional | 0 | 0.0% |
| Total | 232 | 100.0% |
School Enrollment by Age by Funding Source in Athena
Out of a total of 232 students who are enrolled in schools in Athena, 33 (14.2%) attend a private institution, while the remaining 199 (85.8%) are enrolled in public schools. The age group of 15 to 17 year olds has the highest likelihood of being enrolled in private schools, with 13 (39.4% in the age bracket) enrolled. Conversely, the age group of 18 to 19 year olds has the lowest likelihood of being enrolled in a private school, with 11 (100.0% in the age bracket) attending a public institution.
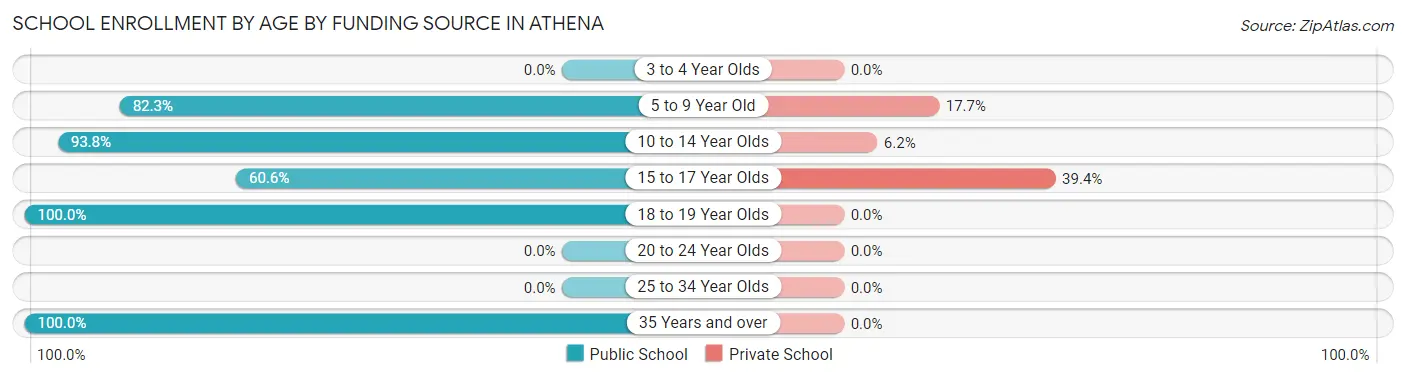
| Age Bracket | Public School | Private School |
| 3 to 4 Year Olds | 0 (0.0%) | 0 (0.0%) |
| 5 to 9 Year Old | 65 (82.3%) | 14 (17.7%) |
| 10 to 14 Year Olds | 91 (93.8%) | 6 (6.2%) |
| 15 to 17 Year Olds | 20 (60.6%) | 13 (39.4%) |
| 18 to 19 Year Olds | 11 (100.0%) | 0 (0.0%) |
| 20 to 24 Year Olds | 0 (0.0%) | 0 (0.0%) |
| 25 to 34 Year Olds | 0 (0.0%) | 0 (0.0%) |
| 35 Years and over | 12 (100.0%) | 0 (0.0%) |
| Total | 199 (85.8%) | 33 (14.2%) |
Educational Attainment by Field of Study in Athena
Education (73 | 31.5%), arts & humanities (35 | 15.1%), bio, nature & agricultural (26 | 11.2%), business (26 | 11.2%), and visual & performing arts (19 | 8.2%) are the most common fields of study among 232 individuals in Athena who have obtained a bachelor's degree or higher.
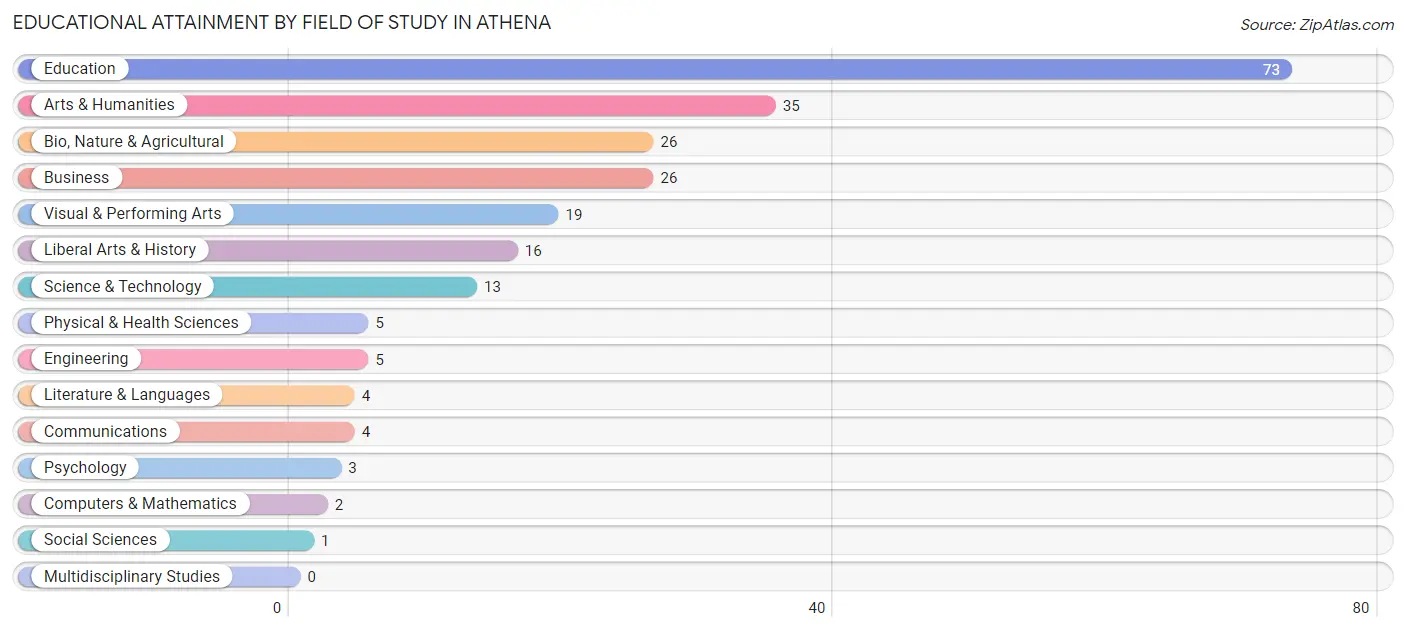
| Field of Study | # Graduates | % Graduates |
| Computers & Mathematics | 2 | 0.9% |
| Bio, Nature & Agricultural | 26 | 11.2% |
| Physical & Health Sciences | 5 | 2.2% |
| Psychology | 3 | 1.3% |
| Social Sciences | 1 | 0.4% |
| Engineering | 5 | 2.2% |
| Multidisciplinary Studies | 0 | 0.0% |
| Science & Technology | 13 | 5.6% |
| Business | 26 | 11.2% |
| Education | 73 | 31.5% |
| Literature & Languages | 4 | 1.7% |
| Liberal Arts & History | 16 | 6.9% |
| Visual & Performing Arts | 19 | 8.2% |
| Communications | 4 | 1.7% |
| Arts & Humanities | 35 | 15.1% |
| Total | 232 | 100.0% |
Transportation & Commute in Athena
Vehicle Availability by Sex in Athena
The most prevalent vehicle ownership categories in Athena are males with 3 vehicles (168, accounting for 43.6%) and females with 3 vehicles (85, making up 78.9%).
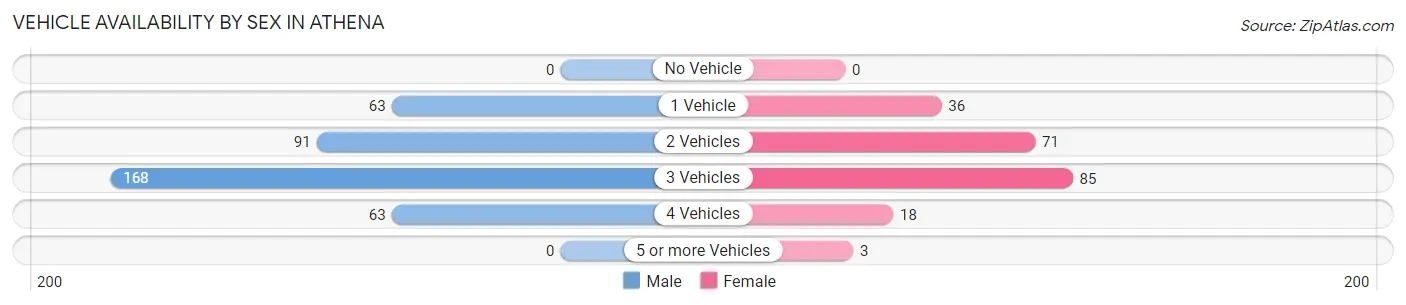
| Vehicles Available | Male | Female |
| No Vehicle | 0 (0.0%) | 0 (0.0%) |
| 1 Vehicle | 63 (16.4%) | 36 (16.9%) |
| 2 Vehicles | 91 (23.6%) | 71 (33.3%) |
| 3 Vehicles | 168 (43.6%) | 85 (39.9%) |
| 4 Vehicles | 63 (16.4%) | 18 (8.5%) |
| 5 or more Vehicles | 0 (0.0%) | 3 (1.4%) |
| Total | 385 (100.0%) | 213 (100.0%) |
Commute Time in Athena
The most frequently occuring commute durations in Athena are 20 to 24 minutes (164 commuters, 32.5%), 25 to 29 minutes (71 commuters, 14.1%), and 30 to 34 minutes (69 commuters, 13.7%).
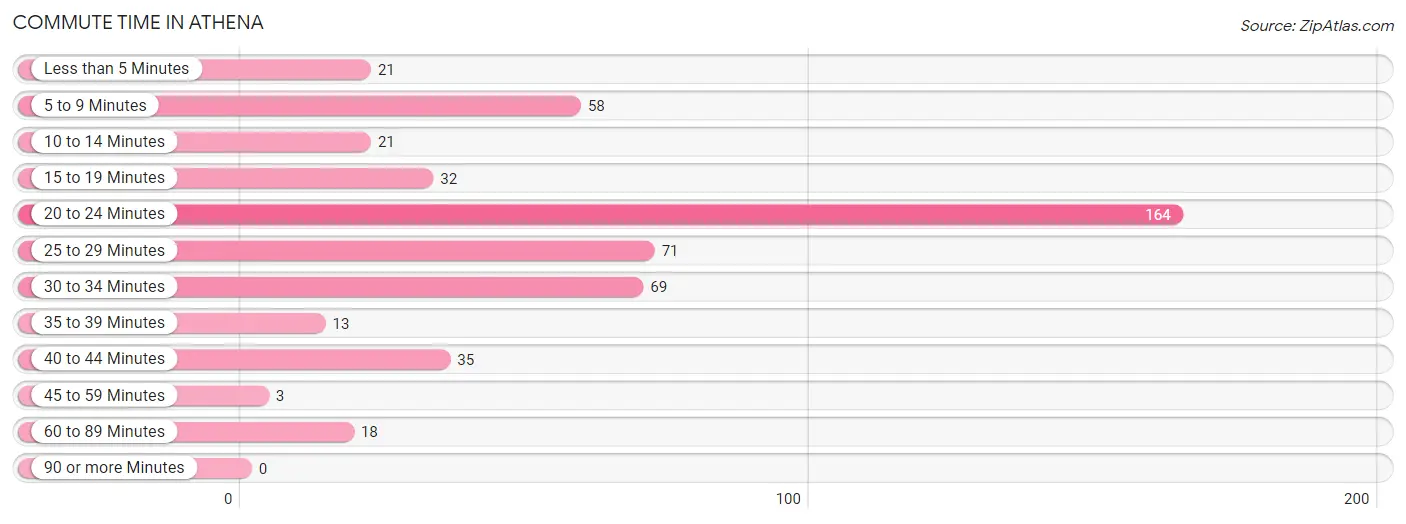
| Commute Time | # Commuters | % Commuters |
| Less than 5 Minutes | 21 | 4.2% |
| 5 to 9 Minutes | 58 | 11.5% |
| 10 to 14 Minutes | 21 | 4.2% |
| 15 to 19 Minutes | 32 | 6.3% |
| 20 to 24 Minutes | 164 | 32.5% |
| 25 to 29 Minutes | 71 | 14.1% |
| 30 to 34 Minutes | 69 | 13.7% |
| 35 to 39 Minutes | 13 | 2.6% |
| 40 to 44 Minutes | 35 | 6.9% |
| 45 to 59 Minutes | 3 | 0.6% |
| 60 to 89 Minutes | 18 | 3.6% |
| 90 or more Minutes | 0 | 0.0% |
Commute Time by Sex in Athena
The most common commute times in Athena are 20 to 24 minutes (106 commuters, 29.0%) for males and 20 to 24 minutes (58 commuters, 41.4%) for females.
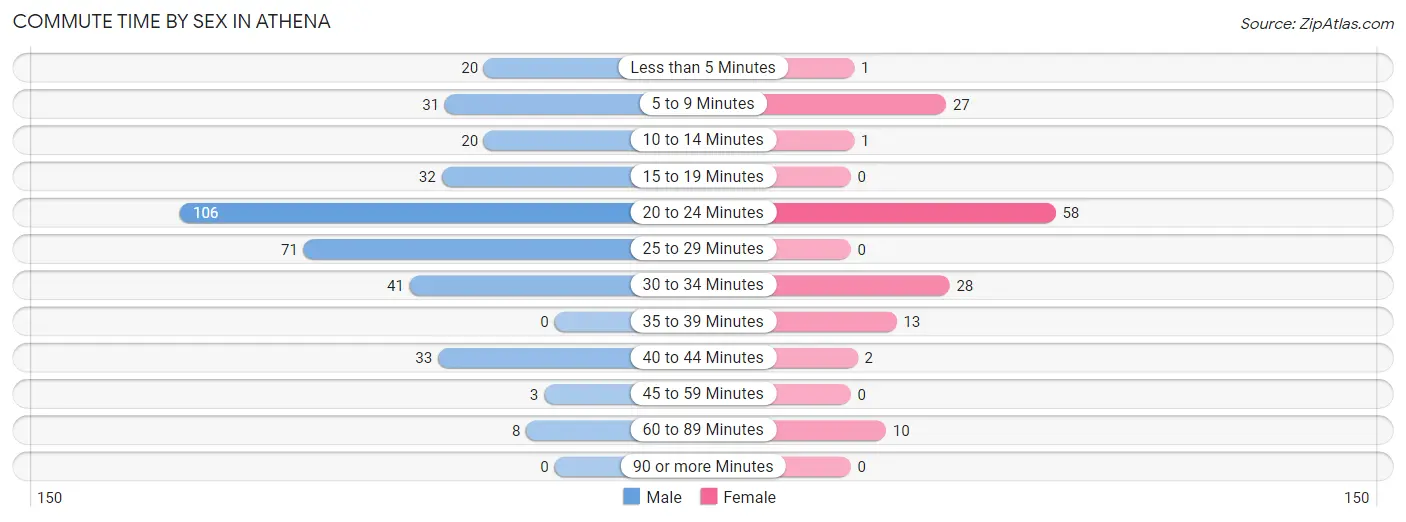
| Commute Time | Male | Female |
| Less than 5 Minutes | 20 (5.5%) | 1 (0.7%) |
| 5 to 9 Minutes | 31 (8.5%) | 27 (19.3%) |
| 10 to 14 Minutes | 20 (5.5%) | 1 (0.7%) |
| 15 to 19 Minutes | 32 (8.8%) | 0 (0.0%) |
| 20 to 24 Minutes | 106 (29.0%) | 58 (41.4%) |
| 25 to 29 Minutes | 71 (19.5%) | 0 (0.0%) |
| 30 to 34 Minutes | 41 (11.2%) | 28 (20.0%) |
| 35 to 39 Minutes | 0 (0.0%) | 13 (9.3%) |
| 40 to 44 Minutes | 33 (9.0%) | 2 (1.4%) |
| 45 to 59 Minutes | 3 (0.8%) | 0 (0.0%) |
| 60 to 89 Minutes | 8 (2.2%) | 10 (7.1%) |
| 90 or more Minutes | 0 (0.0%) | 0 (0.0%) |
Time of Departure to Work by Sex in Athena
The most frequent times of departure to work in Athena are 7:00 AM to 7:29 AM (110, 30.1%) for males and 7:00 AM to 7:29 AM (44, 31.4%) for females.
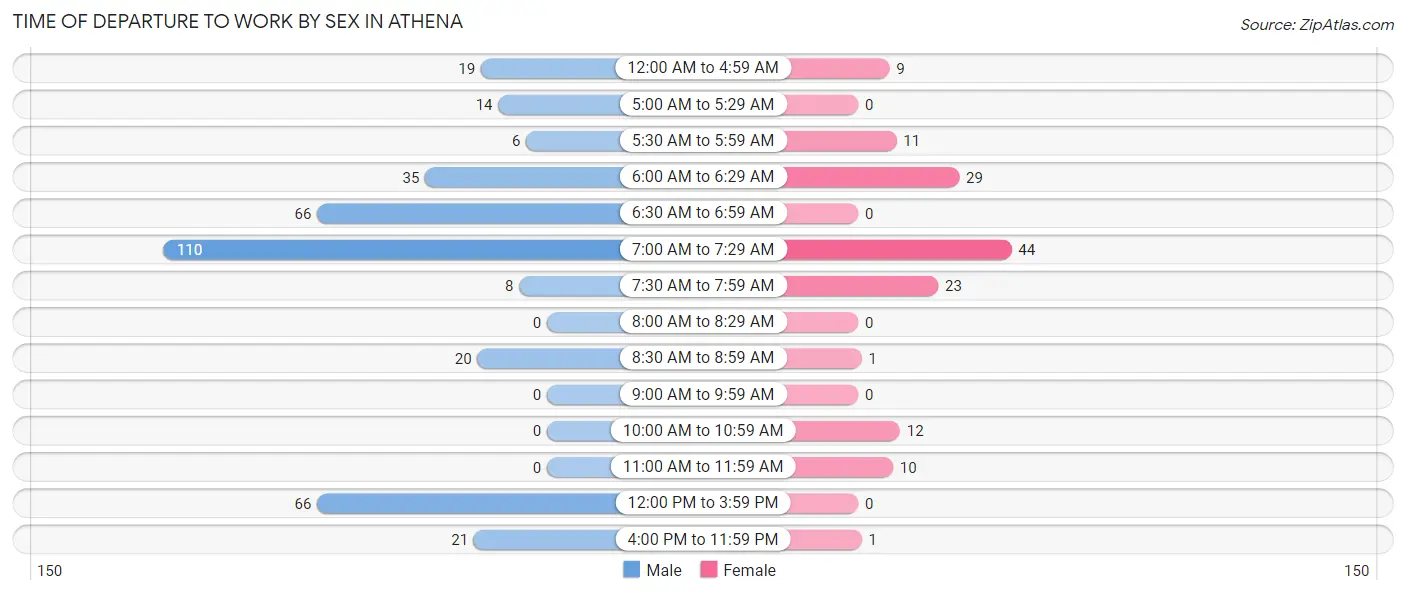
| Time of Departure | Male | Female |
| 12:00 AM to 4:59 AM | 19 (5.2%) | 9 (6.4%) |
| 5:00 AM to 5:29 AM | 14 (3.8%) | 0 (0.0%) |
| 5:30 AM to 5:59 AM | 6 (1.6%) | 11 (7.9%) |
| 6:00 AM to 6:29 AM | 35 (9.6%) | 29 (20.7%) |
| 6:30 AM to 6:59 AM | 66 (18.1%) | 0 (0.0%) |
| 7:00 AM to 7:29 AM | 110 (30.1%) | 44 (31.4%) |
| 7:30 AM to 7:59 AM | 8 (2.2%) | 23 (16.4%) |
| 8:00 AM to 8:29 AM | 0 (0.0%) | 0 (0.0%) |
| 8:30 AM to 8:59 AM | 20 (5.5%) | 1 (0.7%) |
| 9:00 AM to 9:59 AM | 0 (0.0%) | 0 (0.0%) |
| 10:00 AM to 10:59 AM | 0 (0.0%) | 12 (8.6%) |
| 11:00 AM to 11:59 AM | 0 (0.0%) | 10 (7.1%) |
| 12:00 PM to 3:59 PM | 66 (18.1%) | 0 (0.0%) |
| 4:00 PM to 11:59 PM | 21 (5.8%) | 1 (0.7%) |
| Total | 365 (100.0%) | 140 (100.0%) |
Housing Occupancy in Athena
Occupancy by Ownership in Athena
Of the total 542 dwellings in Athena, owner-occupied units account for 395 (72.9%), while renter-occupied units make up 147 (27.1%).
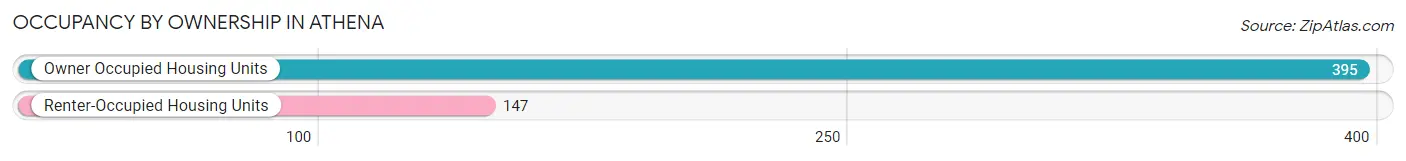
| Occupancy | # Housing Units | % Housing Units |
| Owner Occupied Housing Units | 395 | 72.9% |
| Renter-Occupied Housing Units | 147 | 27.1% |
| Total Occupied Housing Units | 542 | 100.0% |
Occupancy by Household Size in Athena
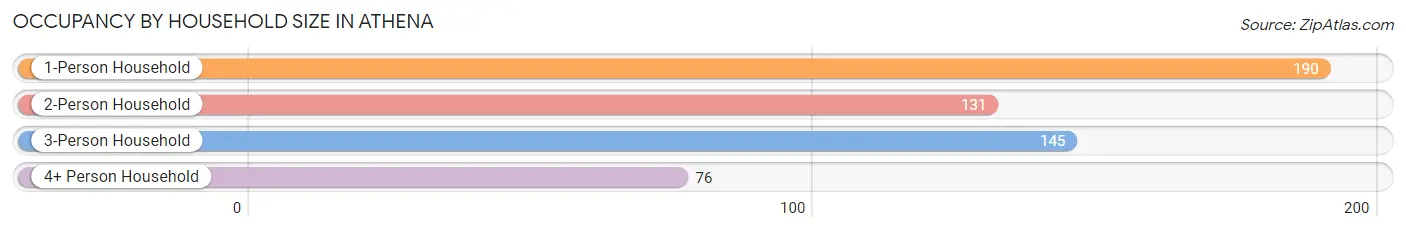
| Household Size | # Housing Units | % Housing Units |
| 1-Person Household | 190 | 35.1% |
| 2-Person Household | 131 | 24.2% |
| 3-Person Household | 145 | 26.8% |
| 4+ Person Household | 76 | 14.0% |
| Total Housing Units | 542 | 100.0% |
Occupancy by Ownership by Household Size in Athena
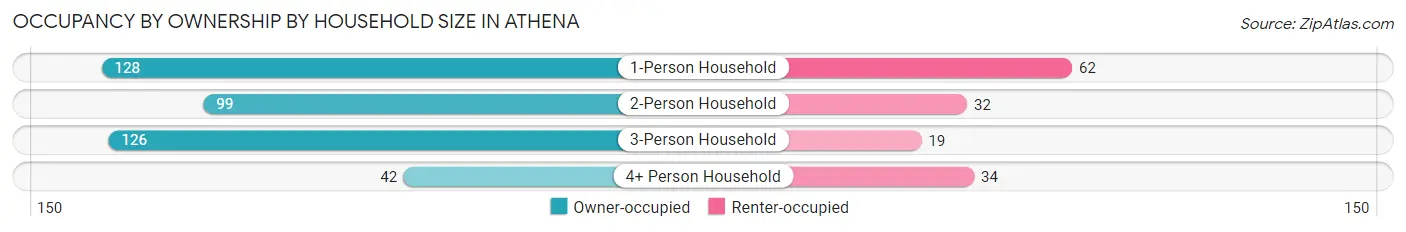
| Household Size | Owner-occupied | Renter-occupied |
| 1-Person Household | 128 (67.4%) | 62 (32.6%) |
| 2-Person Household | 99 (75.6%) | 32 (24.4%) |
| 3-Person Household | 126 (86.9%) | 19 (13.1%) |
| 4+ Person Household | 42 (55.3%) | 34 (44.7%) |
| Total Housing Units | 395 (72.9%) | 147 (27.1%) |
Occupancy by Educational Attainment in Athena
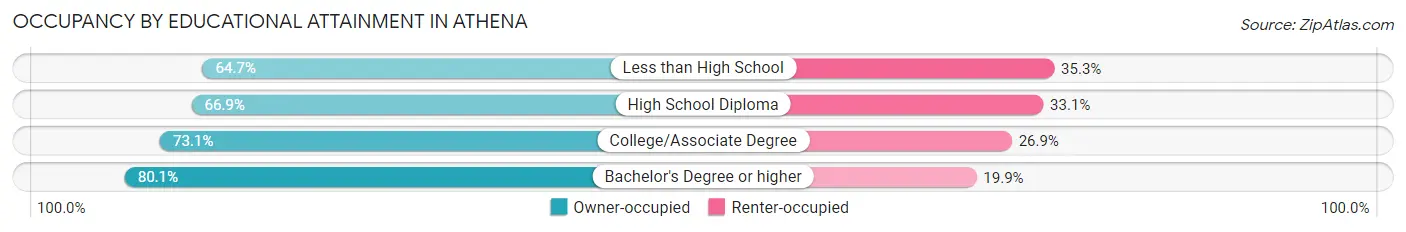
| Household Size | Owner-occupied | Renter-occupied |
| Less than High School | 22 (64.7%) | 12 (35.3%) |
| High School Diploma | 101 (66.9%) | 50 (33.1%) |
| College/Associate Degree | 147 (73.1%) | 54 (26.9%) |
| Bachelor's Degree or higher | 125 (80.1%) | 31 (19.9%) |
Occupancy by Age of Householder in Athena
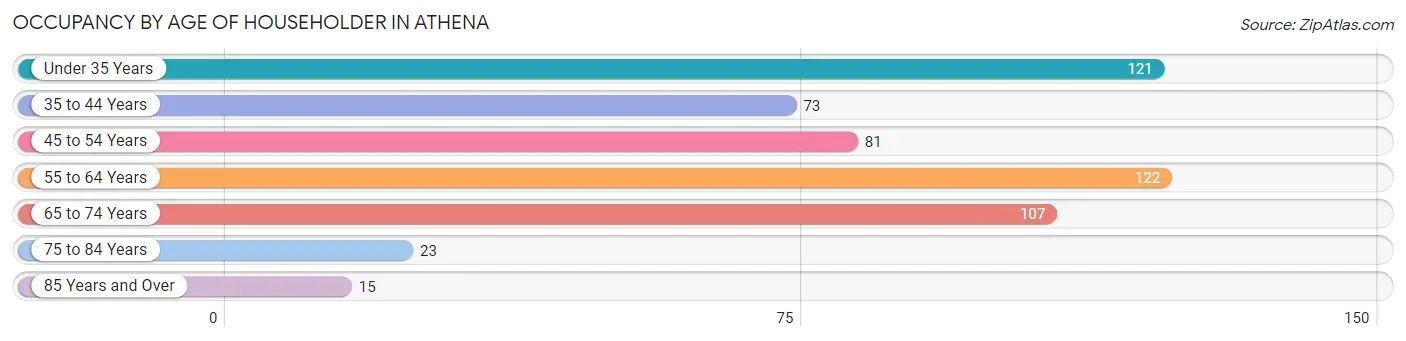
| Age Bracket | # Households | % Households |
| Under 35 Years | 121 | 22.3% |
| 35 to 44 Years | 73 | 13.5% |
| 45 to 54 Years | 81 | 14.9% |
| 55 to 64 Years | 122 | 22.5% |
| 65 to 74 Years | 107 | 19.7% |
| 75 to 84 Years | 23 | 4.2% |
| 85 Years and Over | 15 | 2.8% |
| Total | 542 | 100.0% |
Housing Finances in Athena
Median Income by Occupancy in Athena
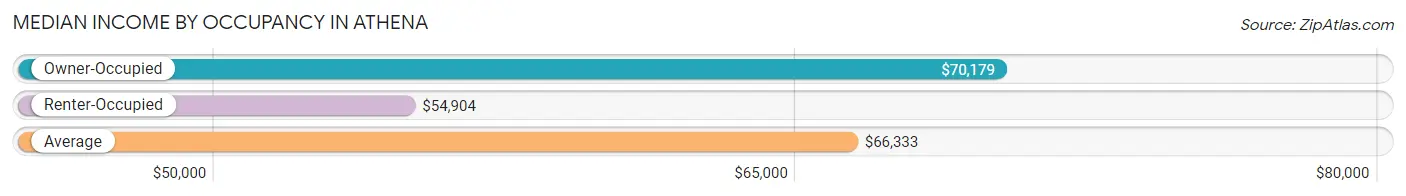
| Occupancy Type | # Households | Median Income |
| Owner-Occupied | 395 (72.9%) | $70,179 |
| Renter-Occupied | 147 (27.1%) | $54,904 |
| Average | 542 (100.0%) | $66,333 |
Occupancy by Householder Income Bracket in Athena
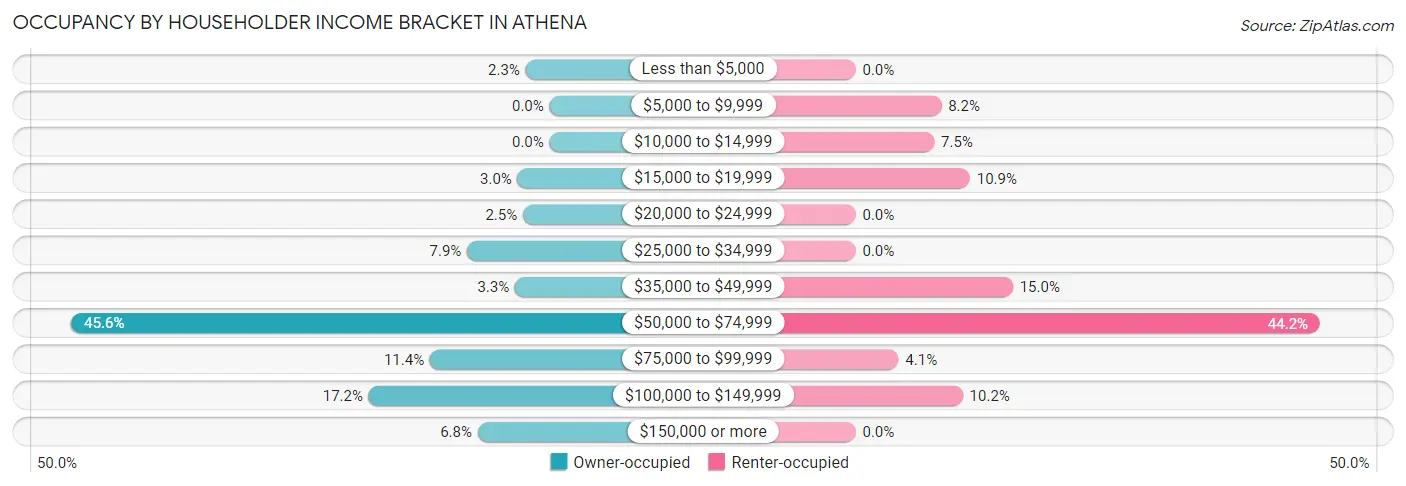
| Income Bracket | Owner-occupied | Renter-occupied |
| Less than $5,000 | 9 (2.3%) | 0 (0.0%) |
| $5,000 to $9,999 | 0 (0.0%) | 12 (8.2%) |
| $10,000 to $14,999 | 0 (0.0%) | 11 (7.5%) |
| $15,000 to $19,999 | 12 (3.0%) | 16 (10.9%) |
| $20,000 to $24,999 | 10 (2.5%) | 0 (0.0%) |
| $25,000 to $34,999 | 31 (7.9%) | 0 (0.0%) |
| $35,000 to $49,999 | 13 (3.3%) | 22 (15.0%) |
| $50,000 to $74,999 | 180 (45.6%) | 65 (44.2%) |
| $75,000 to $99,999 | 45 (11.4%) | 6 (4.1%) |
| $100,000 to $149,999 | 68 (17.2%) | 15 (10.2%) |
| $150,000 or more | 27 (6.8%) | 0 (0.0%) |
| Total | 395 (100.0%) | 147 (100.0%) |
Monthly Housing Cost Tiers in Athena
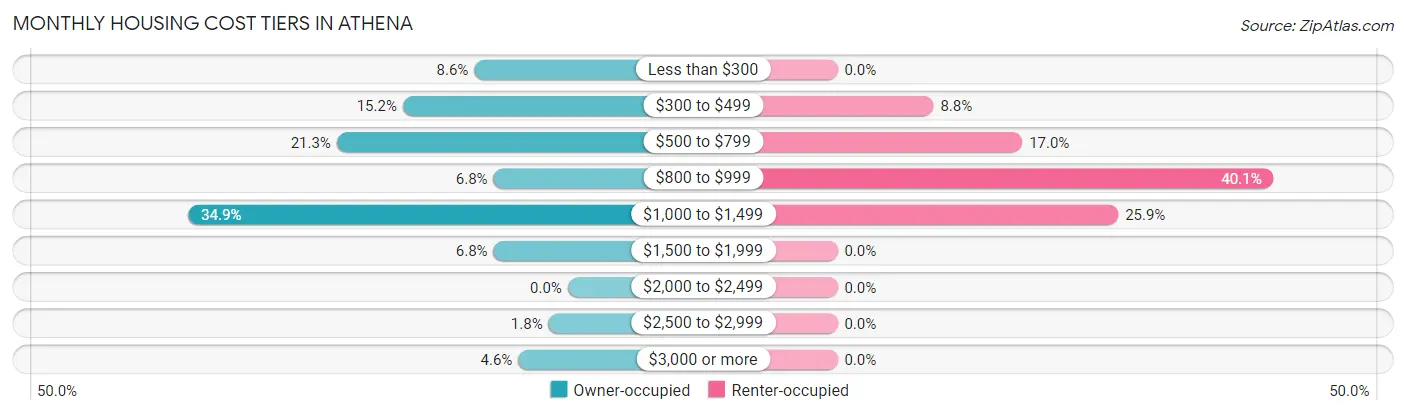
| Monthly Cost | Owner-occupied | Renter-occupied |
| Less than $300 | 34 (8.6%) | 0 (0.0%) |
| $300 to $499 | 60 (15.2%) | 13 (8.8%) |
| $500 to $799 | 84 (21.3%) | 25 (17.0%) |
| $800 to $999 | 27 (6.8%) | 59 (40.1%) |
| $1,000 to $1,499 | 138 (34.9%) | 38 (25.9%) |
| $1,500 to $1,999 | 27 (6.8%) | 0 (0.0%) |
| $2,000 to $2,499 | 0 (0.0%) | 0 (0.0%) |
| $2,500 to $2,999 | 7 (1.8%) | 0 (0.0%) |
| $3,000 or more | 18 (4.6%) | 0 (0.0%) |
| Total | 395 (100.0%) | 147 (100.0%) |
Physical Housing Characteristics in Athena
Housing Structures in Athena
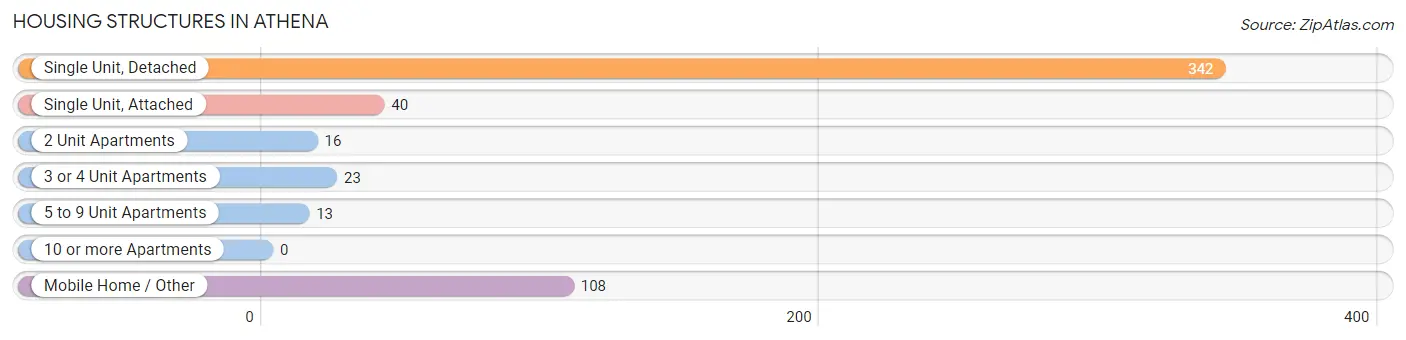
| Structure Type | # Housing Units | % Housing Units |
| Single Unit, Detached | 342 | 63.1% |
| Single Unit, Attached | 40 | 7.4% |
| 2 Unit Apartments | 16 | 2.9% |
| 3 or 4 Unit Apartments | 23 | 4.2% |
| 5 to 9 Unit Apartments | 13 | 2.4% |
| 10 or more Apartments | 0 | 0.0% |
| Mobile Home / Other | 108 | 19.9% |
| Total | 542 | 100.0% |
Housing Structures by Occupancy in Athena
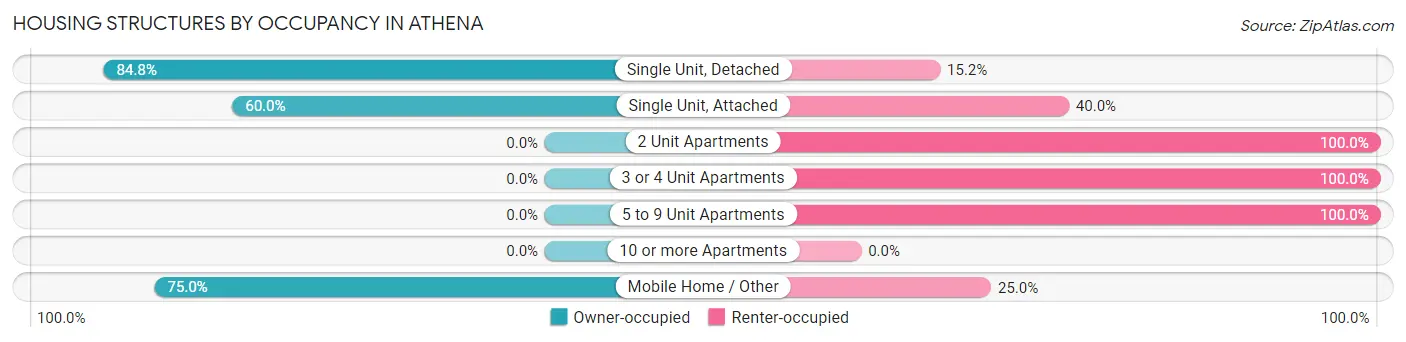
| Structure Type | Owner-occupied | Renter-occupied |
| Single Unit, Detached | 290 (84.8%) | 52 (15.2%) |
| Single Unit, Attached | 24 (60.0%) | 16 (40.0%) |
| 2 Unit Apartments | 0 (0.0%) | 16 (100.0%) |
| 3 or 4 Unit Apartments | 0 (0.0%) | 23 (100.0%) |
| 5 to 9 Unit Apartments | 0 (0.0%) | 13 (100.0%) |
| 10 or more Apartments | 0 (0.0%) | 0 (0.0%) |
| Mobile Home / Other | 81 (75.0%) | 27 (25.0%) |
| Total | 395 (72.9%) | 147 (27.1%) |
Housing Structures by Number of Rooms in Athena
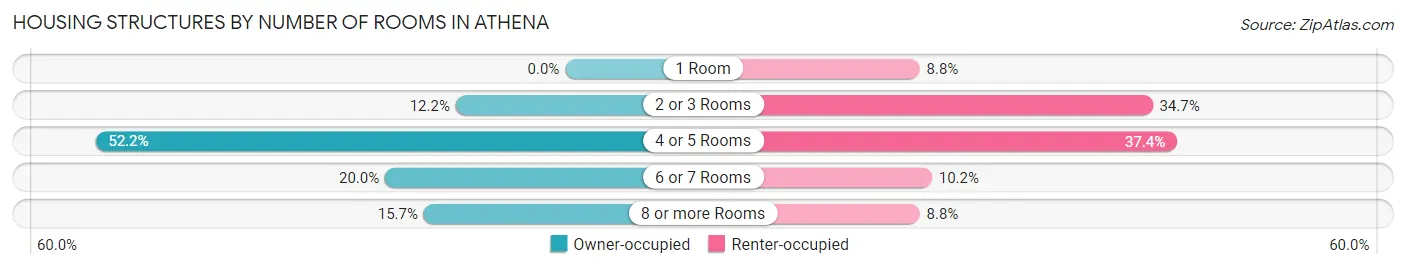
| Number of Rooms | Owner-occupied | Renter-occupied |
| 1 Room | 0 (0.0%) | 13 (8.8%) |
| 2 or 3 Rooms | 48 (12.1%) | 51 (34.7%) |
| 4 or 5 Rooms | 206 (52.1%) | 55 (37.4%) |
| 6 or 7 Rooms | 79 (20.0%) | 15 (10.2%) |
| 8 or more Rooms | 62 (15.7%) | 13 (8.8%) |
| Total | 395 (100.0%) | 147 (100.0%) |
Housing Structure by Heating Type in Athena
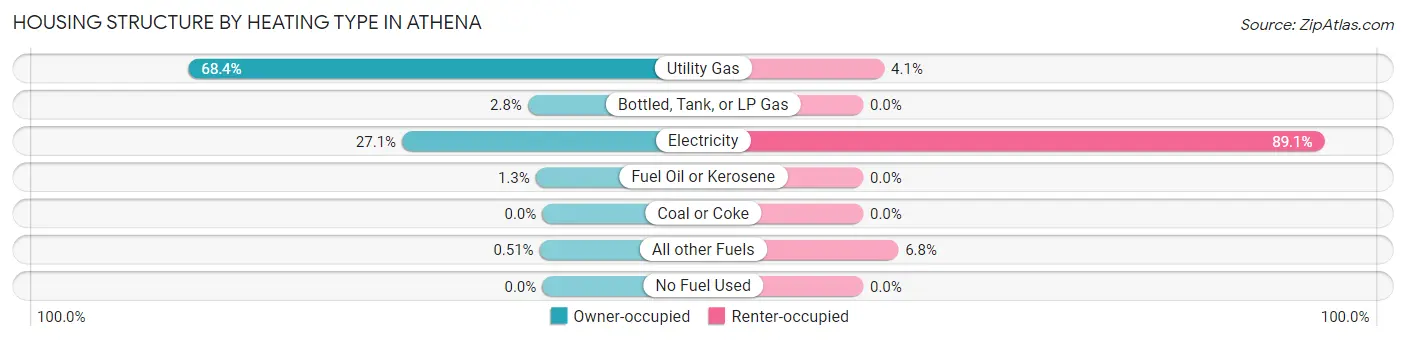
| Heating Type | Owner-occupied | Renter-occupied |
| Utility Gas | 270 (68.3%) | 6 (4.1%) |
| Bottled, Tank, or LP Gas | 11 (2.8%) | 0 (0.0%) |
| Electricity | 107 (27.1%) | 131 (89.1%) |
| Fuel Oil or Kerosene | 5 (1.3%) | 0 (0.0%) |
| Coal or Coke | 0 (0.0%) | 0 (0.0%) |
| All other Fuels | 2 (0.5%) | 10 (6.8%) |
| No Fuel Used | 0 (0.0%) | 0 (0.0%) |
| Total | 395 (100.0%) | 147 (100.0%) |
Household Vehicle Usage in Athena
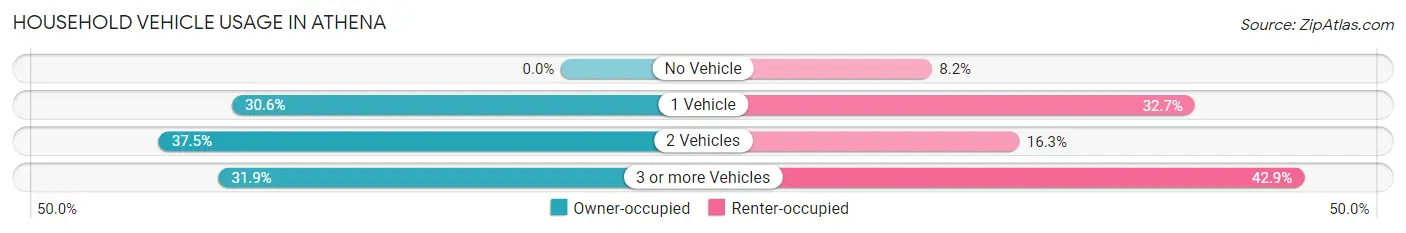
| Vehicles per Household | Owner-occupied | Renter-occupied |
| No Vehicle | 0 (0.0%) | 12 (8.2%) |
| 1 Vehicle | 121 (30.6%) | 48 (32.7%) |
| 2 Vehicles | 148 (37.5%) | 24 (16.3%) |
| 3 or more Vehicles | 126 (31.9%) | 63 (42.9%) |
| Total | 395 (100.0%) | 147 (100.0%) |
Real Estate & Mortgages in Athena
Real Estate and Mortgage Overview in Athena
| Characteristic | Without Mortgage | With Mortgage |
| Housing Units | 178 | 217 |
| Median Property Value | $184,800 | $161,500 |
| Median Household Income | $75,682 | $12 |
| Monthly Housing Costs | $492 | $18 |
| Real Estate Taxes | $1,979 | $0 |
Property Value by Mortgage Status in Athena
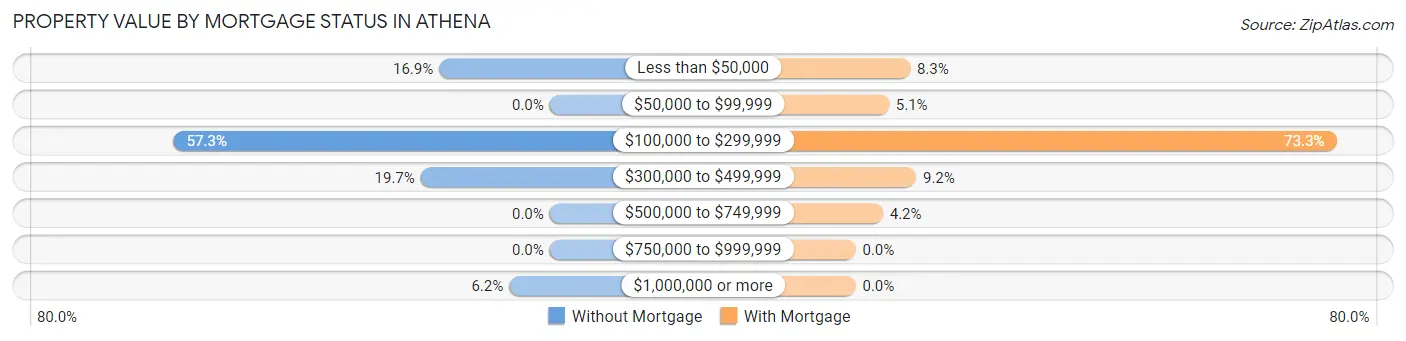
| Property Value | Without Mortgage | With Mortgage |
| Less than $50,000 | 30 (16.9%) | 18 (8.3%) |
| $50,000 to $99,999 | 0 (0.0%) | 11 (5.1%) |
| $100,000 to $299,999 | 102 (57.3%) | 159 (73.3%) |
| $300,000 to $499,999 | 35 (19.7%) | 20 (9.2%) |
| $500,000 to $749,999 | 0 (0.0%) | 9 (4.2%) |
| $750,000 to $999,999 | 0 (0.0%) | 0 (0.0%) |
| $1,000,000 or more | 11 (6.2%) | 0 (0.0%) |
| Total | 178 (100.0%) | 217 (100.0%) |
Household Income by Mortgage Status in Athena
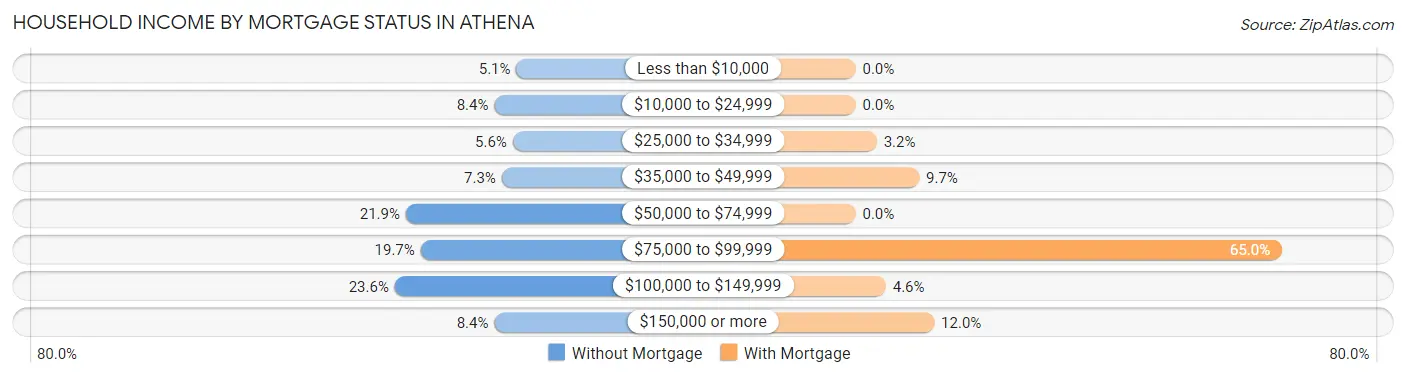
| Household Income | Without Mortgage | With Mortgage |
| Less than $10,000 | 9 (5.1%) | 0 (0.0%) |
| $10,000 to $24,999 | 15 (8.4%) | 0 (0.0%) |
| $25,000 to $34,999 | 10 (5.6%) | 7 (3.2%) |
| $35,000 to $49,999 | 13 (7.3%) | 21 (9.7%) |
| $50,000 to $74,999 | 39 (21.9%) | 0 (0.0%) |
| $75,000 to $99,999 | 35 (19.7%) | 141 (65.0%) |
| $100,000 to $149,999 | 42 (23.6%) | 10 (4.6%) |
| $150,000 or more | 15 (8.4%) | 26 (12.0%) |
| Total | 178 (100.0%) | 217 (100.0%) |
Property Value to Household Income Ratio in Athena
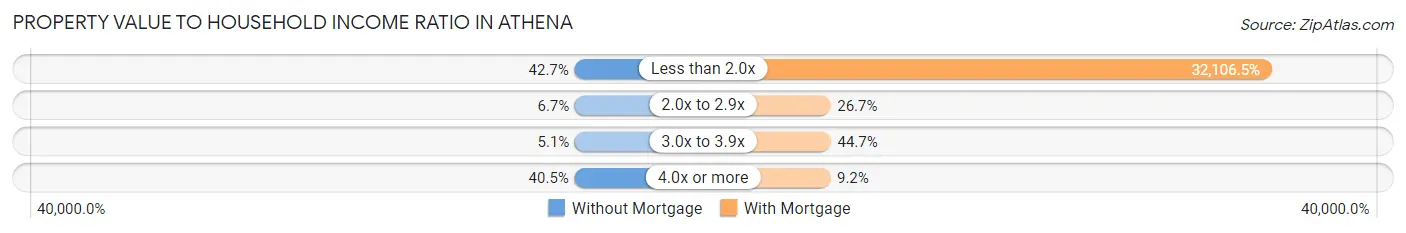
| Value-to-Income Ratio | Without Mortgage | With Mortgage |
| Less than 2.0x | 76 (42.7%) | 69,671 (32,106.5%) |
| 2.0x to 2.9x | 12 (6.7%) | 58 (26.7%) |
| 3.0x to 3.9x | 9 (5.1%) | 97 (44.7%) |
| 4.0x or more | 72 (40.5%) | 20 (9.2%) |
| Total | 178 (100.0%) | 217 (100.0%) |
Real Estate Taxes by Mortgage Status in Athena
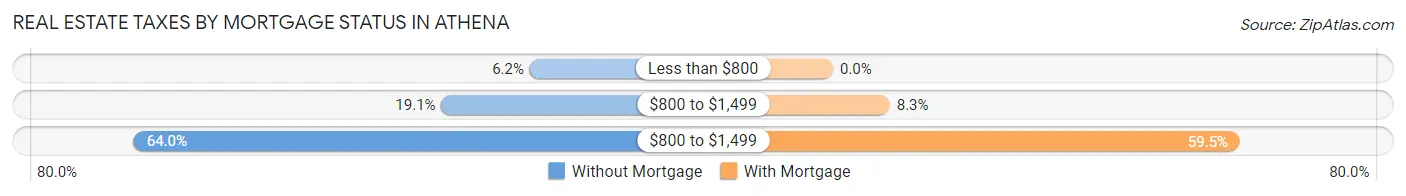
| Property Taxes | Without Mortgage | With Mortgage |
| Less than $800 | 11 (6.2%) | 0 (0.0%) |
| $800 to $1,499 | 34 (19.1%) | 18 (8.3%) |
| $800 to $1,499 | 114 (64.0%) | 129 (59.5%) |
| Total | 178 (100.0%) | 217 (100.0%) |
Health & Disability in Athena
Health Insurance Coverage by Age in Athena
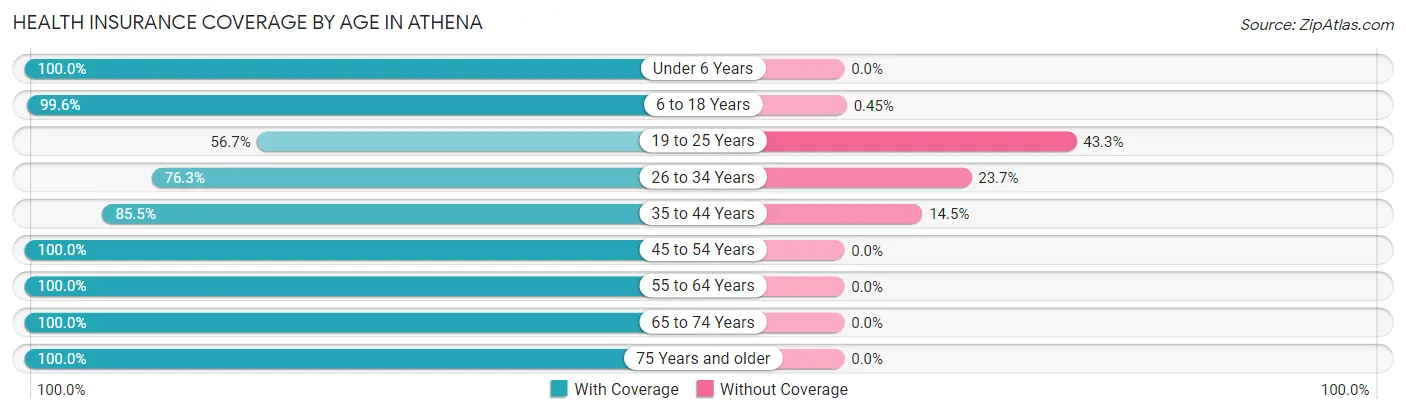
| Age Bracket | With Coverage | Without Coverage |
| Under 6 Years | 26 (100.0%) | 0 (0.0%) |
| 6 to 18 Years | 220 (99.6%) | 1 (0.4%) |
| 19 to 25 Years | 122 (56.7%) | 93 (43.3%) |
| 26 to 34 Years | 116 (76.3%) | 36 (23.7%) |
| 35 to 44 Years | 147 (85.5%) | 25 (14.5%) |
| 45 to 54 Years | 127 (100.0%) | 0 (0.0%) |
| 55 to 64 Years | 220 (100.0%) | 0 (0.0%) |
| 65 to 74 Years | 154 (100.0%) | 0 (0.0%) |
| 75 Years and older | 42 (100.0%) | 0 (0.0%) |
| Total | 1,174 (88.3%) | 155 (11.7%) |
Health Insurance Coverage by Citizenship Status in Athena
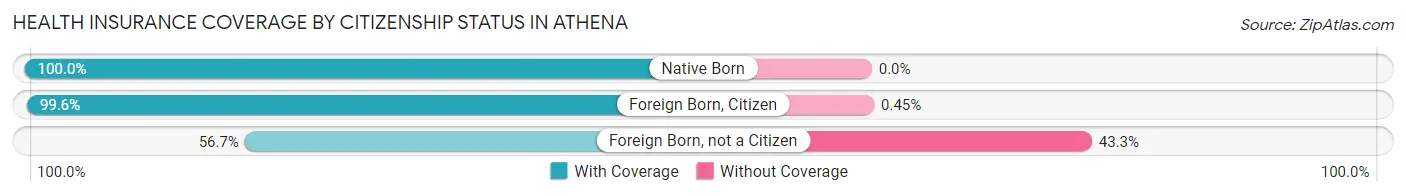
| Citizenship Status | With Coverage | Without Coverage |
| Native Born | 26 (100.0%) | 0 (0.0%) |
| Foreign Born, Citizen | 220 (99.6%) | 1 (0.4%) |
| Foreign Born, not a Citizen | 122 (56.7%) | 93 (43.3%) |
Health Insurance Coverage by Household Income in Athena
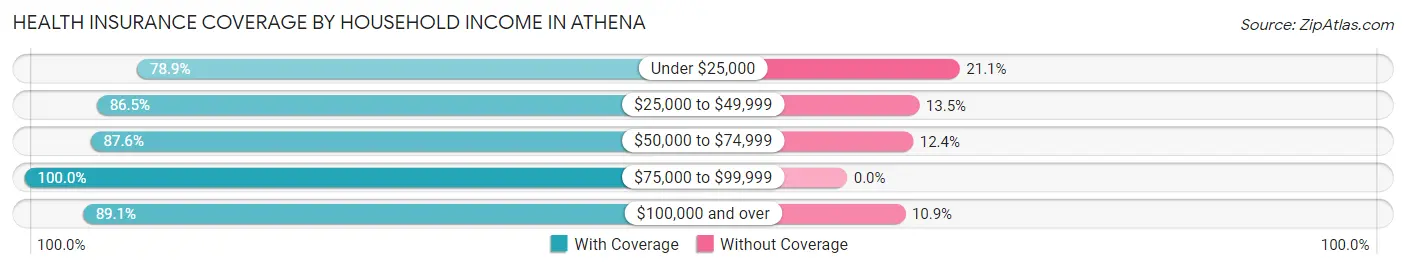
| Household Income | With Coverage | Without Coverage |
| Under $25,000 | 101 (78.9%) | 27 (21.1%) |
| $25,000 to $49,999 | 128 (86.5%) | 20 (13.5%) |
| $50,000 to $74,999 | 524 (87.6%) | 74 (12.4%) |
| $75,000 to $99,999 | 144 (100.0%) | 0 (0.0%) |
| $100,000 and over | 270 (89.1%) | 33 (10.9%) |
Public vs Private Health Insurance Coverage by Age in Athena
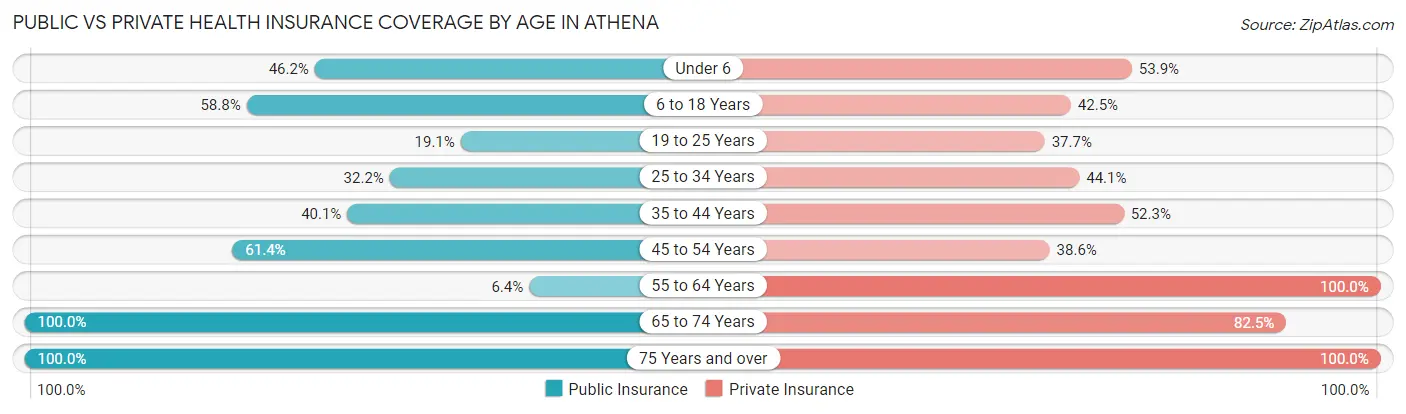
| Age Bracket | Public Insurance | Private Insurance |
| Under 6 | 12 (46.2%) | 14 (53.8%) |
| 6 to 18 Years | 130 (58.8%) | 94 (42.5%) |
| 19 to 25 Years | 41 (19.1%) | 81 (37.7%) |
| 25 to 34 Years | 49 (32.2%) | 67 (44.1%) |
| 35 to 44 Years | 69 (40.1%) | 90 (52.3%) |
| 45 to 54 Years | 78 (61.4%) | 49 (38.6%) |
| 55 to 64 Years | 14 (6.4%) | 220 (100.0%) |
| 65 to 74 Years | 154 (100.0%) | 127 (82.5%) |
| 75 Years and over | 42 (100.0%) | 42 (100.0%) |
| Total | 589 (44.3%) | 784 (59.0%) |
Disability Status by Sex by Age in Athena
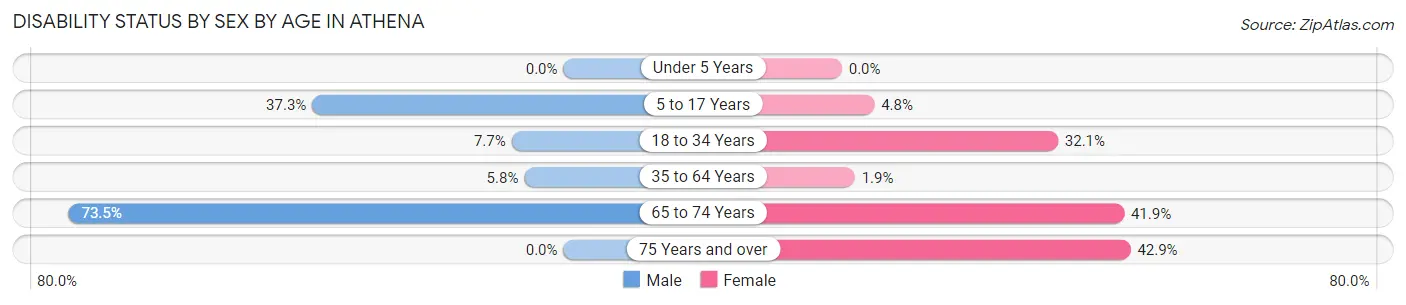
| Age Bracket | Male | Female |
| Under 5 Years | 0 (0.0%) | 0 (0.0%) |
| 5 to 17 Years | 47 (37.3%) | 4 (4.8%) |
| 18 to 34 Years | 21 (7.7%) | 34 (32.1%) |
| 35 to 64 Years | 15 (5.8%) | 5 (1.9%) |
| 65 to 74 Years | 36 (73.5%) | 44 (41.9%) |
| 75 Years and over | 0 (0.0%) | 12 (42.9%) |
Disability Class by Sex by Age in Athena
Disability Class: Hearing Difficulty
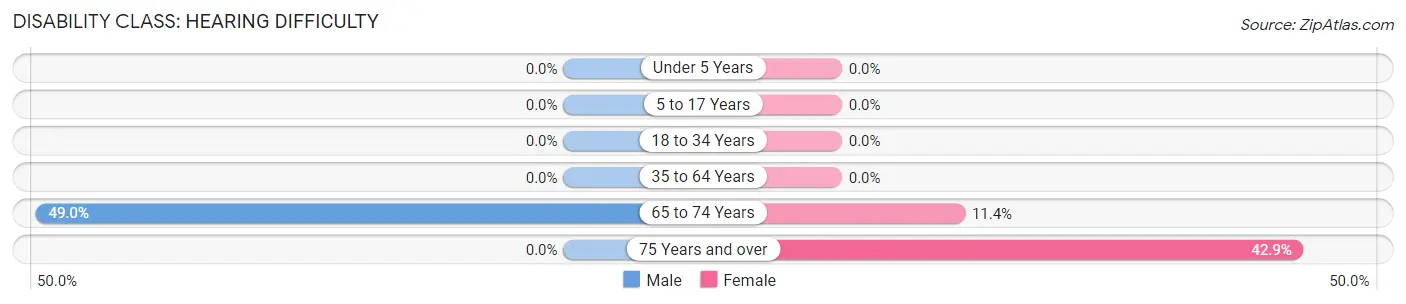
| Age Bracket | Male | Female |
| Under 5 Years | 0 (0.0%) | 0 (0.0%) |
| 5 to 17 Years | 0 (0.0%) | 0 (0.0%) |
| 18 to 34 Years | 0 (0.0%) | 0 (0.0%) |
| 35 to 64 Years | 0 (0.0%) | 0 (0.0%) |
| 65 to 74 Years | 24 (49.0%) | 12 (11.4%) |
| 75 Years and over | 0 (0.0%) | 12 (42.9%) |
Disability Class: Vision Difficulty
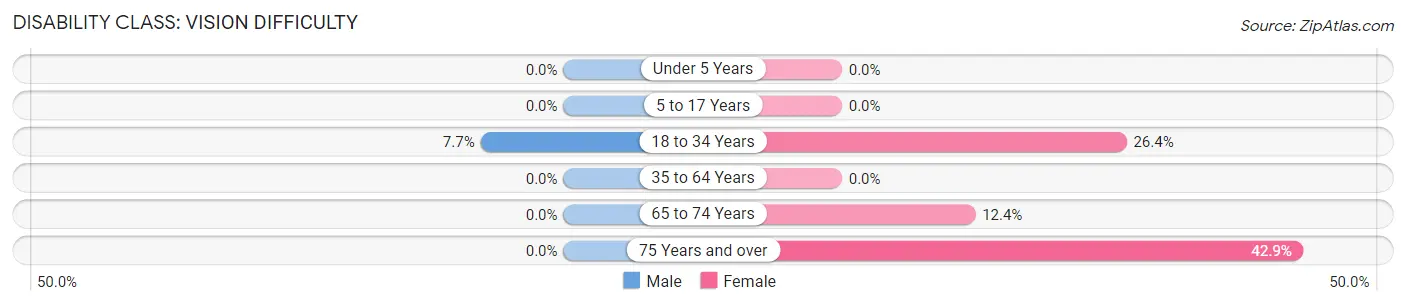
| Age Bracket | Male | Female |
| Under 5 Years | 0 (0.0%) | 0 (0.0%) |
| 5 to 17 Years | 0 (0.0%) | 0 (0.0%) |
| 18 to 34 Years | 21 (7.7%) | 28 (26.4%) |
| 35 to 64 Years | 0 (0.0%) | 0 (0.0%) |
| 65 to 74 Years | 0 (0.0%) | 13 (12.4%) |
| 75 Years and over | 0 (0.0%) | 12 (42.9%) |
Disability Class: Cognitive Difficulty
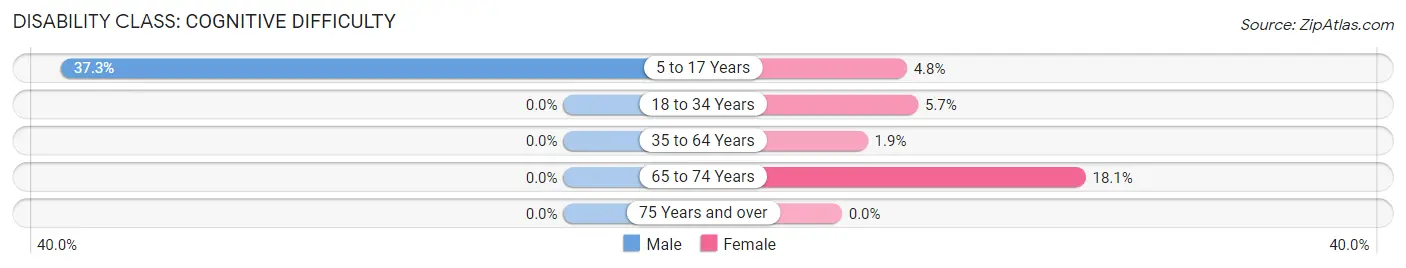
| Age Bracket | Male | Female |
| 5 to 17 Years | 47 (37.3%) | 4 (4.8%) |
| 18 to 34 Years | 0 (0.0%) | 6 (5.7%) |
| 35 to 64 Years | 0 (0.0%) | 5 (1.9%) |
| 65 to 74 Years | 0 (0.0%) | 19 (18.1%) |
| 75 Years and over | 0 (0.0%) | 0 (0.0%) |
Disability Class: Ambulatory Difficulty
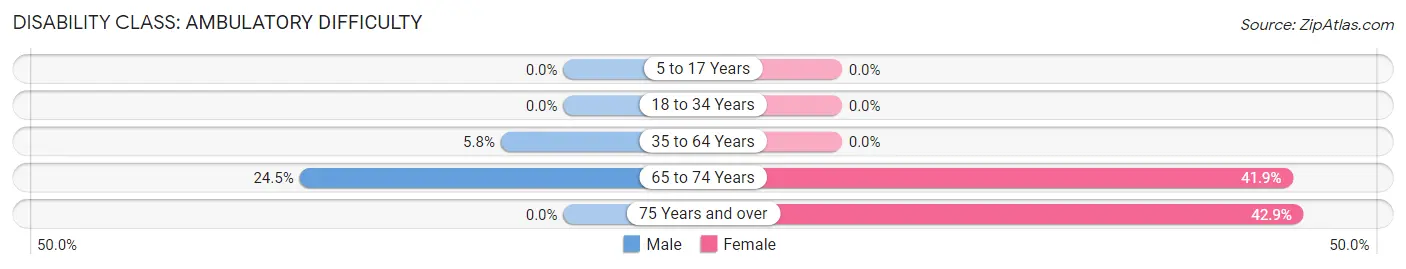
| Age Bracket | Male | Female |
| 5 to 17 Years | 0 (0.0%) | 0 (0.0%) |
| 18 to 34 Years | 0 (0.0%) | 0 (0.0%) |
| 35 to 64 Years | 15 (5.8%) | 0 (0.0%) |
| 65 to 74 Years | 12 (24.5%) | 44 (41.9%) |
| 75 Years and over | 0 (0.0%) | 12 (42.9%) |
Disability Class: Self-Care Difficulty
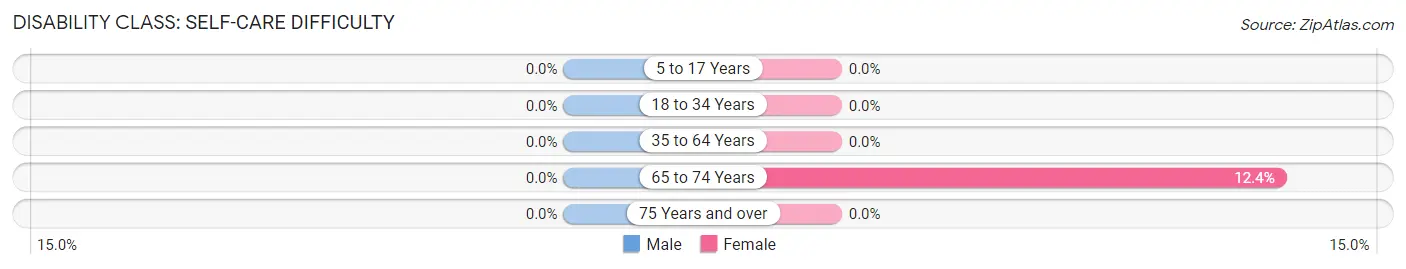
| Age Bracket | Male | Female |
| 5 to 17 Years | 0 (0.0%) | 0 (0.0%) |
| 18 to 34 Years | 0 (0.0%) | 0 (0.0%) |
| 35 to 64 Years | 0 (0.0%) | 0 (0.0%) |
| 65 to 74 Years | 0 (0.0%) | 13 (12.4%) |
| 75 Years and over | 0 (0.0%) | 0 (0.0%) |
Technology Access in Athena
Computing Device Access in Athena
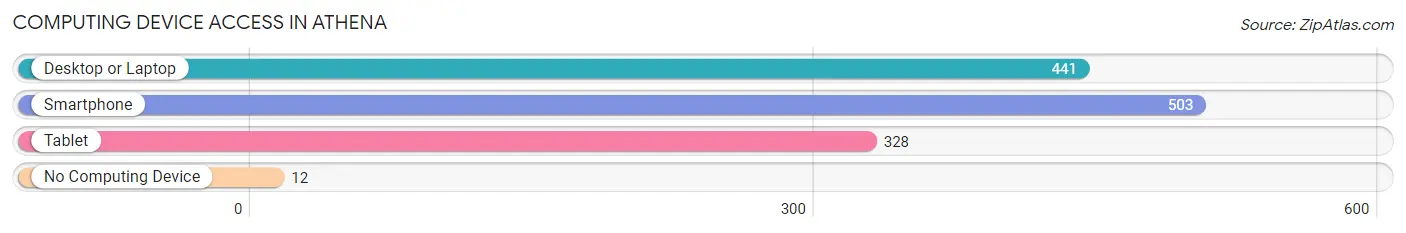
| Device Type | # Households | % Households |
| Desktop or Laptop | 441 | 81.4% |
| Smartphone | 503 | 92.8% |
| Tablet | 328 | 60.5% |
| No Computing Device | 12 | 2.2% |
| Total | 542 | 100.0% |
Internet Access in Athena
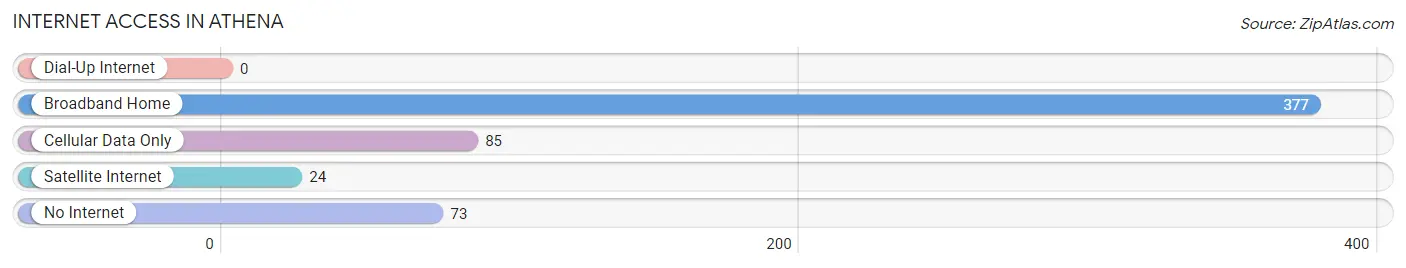
| Internet Type | # Households | % Households |
| Dial-Up Internet | 0 | 0.0% |
| Broadband Home | 377 | 69.6% |
| Cellular Data Only | 85 | 15.7% |
| Satellite Internet | 24 | 4.4% |
| No Internet | 73 | 13.5% |
| Total | 542 | 100.0% |
Athena Summary
Athena is a small city located in Umatilla County, Oregon, United States. It is situated in the foothills of the Blue Mountains, approximately 10 miles south of the Columbia River. The city is part of the Pendleton-Hermiston Micropolitan Statistical Area. As of the 2010 census, the population of Athena was 1,737.
History
Athena was founded in 1883 by a group of settlers from the nearby town of Weston. The settlers named the town after the Greek goddess Athena, in honor of the area’s rich agricultural heritage. The town was incorporated in 1891 and quickly became a thriving agricultural center.
Athena was a major stop on the Oregon Trail, and the town’s economy was largely based on the production of wheat, barley, and other grains. The town also had a thriving lumber industry, and the local sawmill was one of the largest in the region.
In the early 20th century, Athena experienced a period of rapid growth. The town was connected to the outside world by the Oregon-Washington Railroad and Navigation Company, and the population grew to over 1,000 by 1910.
Geography
Athena is located in the foothills of the Blue Mountains, approximately 10 miles south of the Columbia River. The city is situated at an elevation of 1,845 feet above sea level.
The city covers an area of 1.3 square miles, all of which is land. Athena is bordered by the cities of Weston and Pendleton to the north, and by the towns of Helix and Echo to the south.
Climate
Athena has a semi-arid climate, with hot summers and cold winters. The average annual temperature is 52.2°F, and the average annual precipitation is 11.3 inches.
Economy
Athena’s economy is largely based on agriculture. The city is home to several large farms, and the surrounding area is known for its production of wheat, barley, and other grains.
The city is also home to several manufacturing companies, including a wood products plant and a metal fabrication plant. Athena is also home to a number of small businesses, including restaurants, retail stores, and service providers.
Demographics
As of the 2010 census, the population of Athena was 1,737. The racial makeup of the city was 94.2% White, 0.7% African American, 0.7% Native American, 0.3% Asian, 0.1% Pacific Islander, 1.2% from other races, and 2.9% from two or more races. Hispanic or Latino of any race were 4.2% of the population.
The median household income in Athena was $37,917, and the median family income was $45,938. The per capita income was $18,945. About 11.2% of families and 14.2% of the population were below the poverty line, including 19.2% of those under age 18 and 8.2% of those age 65 or over.
Common Questions
What is Per Capita Income in Athena?
Per Capita income in Athena is $31,116.
What is the Median Family Income in Athena?
Median Family Income in Athena is $73,333.
What is the Median Household income in Athena?
Median Household Income in Athena is $66,333.
What is Income or Wage Gap in Athena?
Income or Wage Gap in Athena is 7.4%.
Women in Athena earn 92.6 cents for every dollar earned by a man.
What is Inequality or Gini Index in Athena?
Inequality or Gini Index in Athena is 0.34.
What is the Total Population of Athena?
Total Population of Athena is 1,333.
What is the Total Male Population of Athena?
Total Male Population of Athena is 738.
What is the Total Female Population of Athena?
Total Female Population of Athena is 595.
What is the Ratio of Males per 100 Females in Athena?
There are 124.03 Males per 100 Females in Athena.
What is the Ratio of Females per 100 Males in Athena?
There are 80.62 Females per 100 Males in Athena.
What is the Median Population Age in Athena?
Median Population Age in Athena is 37.1 Years.
What is the Average Family Size in Athena
Average Family Size in Athena is 3.1 People.
What is the Average Household Size in Athena
Average Household Size in Athena is 2.4 People.
How Large is the Labor Force in Athena?
There are 677 People in the Labor Forcein in Athena.
What is the Percentage of People in the Labor Force in Athena?
61.0% of People are in the Labor Force in Athena.
What is the Unemployment Rate in Athena?
Unemployment Rate in Athena is 10.5%.