Altamont, OR Map & Demographics
Altamont Map
Altamont Overview
$26,772
PER CAPITA INCOME
$63,979
AVG FAMILY INCOME
$54,609
AVG HOUSEHOLD INCOME
41.7%
WAGE / INCOME GAP [ % ]
58.3¢/ $1
WAGE / INCOME GAP [ $ ]
$13,436
FAMILY INCOME DEFICIT
0.42
INEQUALITY / GINI INDEX
20,345
TOTAL POPULATION
9,653
MALE POPULATION
10,692
FEMALE POPULATION
90.28
MALES / 100 FEMALES
110.76
FEMALES / 100 MALES
36.8
MEDIAN AGE
3.1
AVG FAMILY SIZE
2.6
AVG HOUSEHOLD SIZE
8,135
LABOR FORCE [ PEOPLE ]
52.6%
PERCENT IN LABOR FORCE
9.2%
UNEMPLOYMENT RATE
Income in Altamont
Income Overview in Altamont
Per Capita Income in Altamont is $26,772, while median incomes of families and households are $63,979 and $54,609 respectively.
| Characteristic | Number | Measure |
| Per Capita Income | 20,345 | $26,772 |
| Median Family Income | 5,022 | $63,979 |
| Mean Family Income | 5,022 | $77,438 |
| Median Household Income | 7,899 | $54,609 |
| Mean Household Income | 7,899 | $67,418 |
| Income Deficit | 5,022 | $13,436 |
| Wage / Income Gap (%) | 20,345 | 41.67% |
| Wage / Income Gap ($) | 20,345 | 58.33¢ per $1 |
| Gini / Inequality Index | 20,345 | 0.42 |
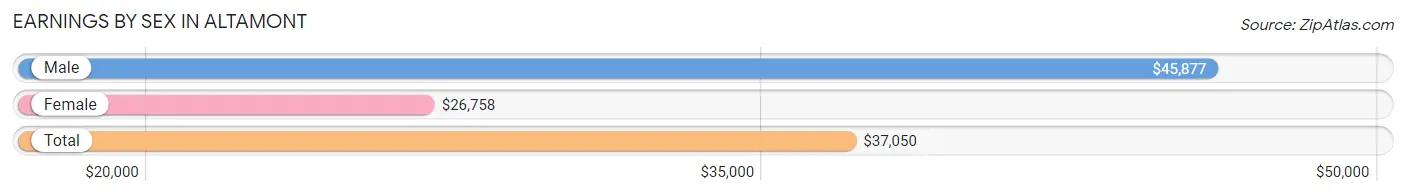
Earnings by Sex in Altamont
Average Earnings in Altamont are $37,050, $45,877 for men and $26,758 for women, a difference of 41.7%.
| Sex | Number | Average Earnings |
| Male | 4,545 (52.1%) | $45,877 |
| Female | 4,181 (47.9%) | $26,758 |
| Total | 8,726 (100.0%) | $37,050 |
Earnings by Sex by Income Bracket in Altamont
The most common earnings brackets in Altamont are $75,000 to $99,999 for men (608 | 13.4%) and $35,000 to $39,999 for women (301 | 7.2%).
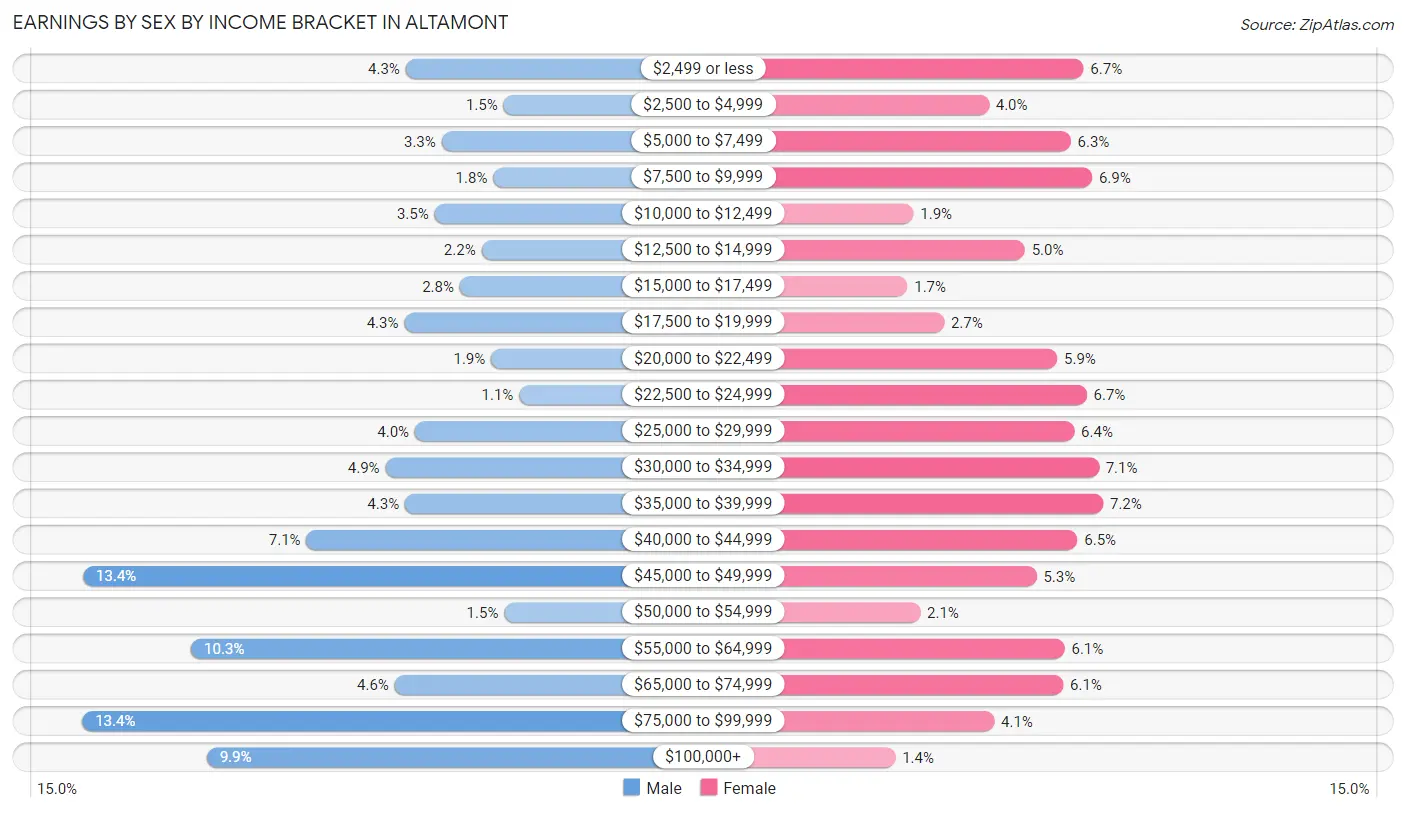
| Income | Male | Female |
| $2,499 or less | 195 (4.3%) | 278 (6.7%) |
| $2,500 to $4,999 | 70 (1.5%) | 167 (4.0%) |
| $5,000 to $7,499 | 149 (3.3%) | 263 (6.3%) |
| $7,500 to $9,999 | 83 (1.8%) | 288 (6.9%) |
| $10,000 to $12,499 | 158 (3.5%) | 78 (1.9%) |
| $12,500 to $14,999 | 98 (2.2%) | 209 (5.0%) |
| $15,000 to $17,499 | 126 (2.8%) | 71 (1.7%) |
| $17,500 to $19,999 | 197 (4.3%) | 114 (2.7%) |
| $20,000 to $22,499 | 86 (1.9%) | 247 (5.9%) |
| $22,500 to $24,999 | 50 (1.1%) | 282 (6.7%) |
| $25,000 to $29,999 | 183 (4.0%) | 267 (6.4%) |
| $30,000 to $34,999 | 221 (4.9%) | 296 (7.1%) |
| $35,000 to $39,999 | 196 (4.3%) | 301 (7.2%) |
| $40,000 to $44,999 | 322 (7.1%) | 271 (6.5%) |
| $45,000 to $49,999 | 607 (13.4%) | 223 (5.3%) |
| $50,000 to $54,999 | 69 (1.5%) | 86 (2.1%) |
| $55,000 to $64,999 | 469 (10.3%) | 256 (6.1%) |
| $65,000 to $74,999 | 209 (4.6%) | 254 (6.1%) |
| $75,000 to $99,999 | 608 (13.4%) | 173 (4.1%) |
| $100,000+ | 449 (9.9%) | 57 (1.4%) |
| Total | 4,545 (100.0%) | 4,181 (100.0%) |
Earnings by Sex by Educational Attainment in Altamont
Average earnings in Altamont are $47,392 for men and $29,664 for women, a difference of 37.4%. Men with an educational attainment of less than high school enjoy the highest average annual earnings of $60,337, while those with high school diploma education earn the least with $45,047. Women with an educational attainment of graduate degree earn the most with the average annual earnings of $51,875, while those with less than high school education have the smallest earnings of $17,426.
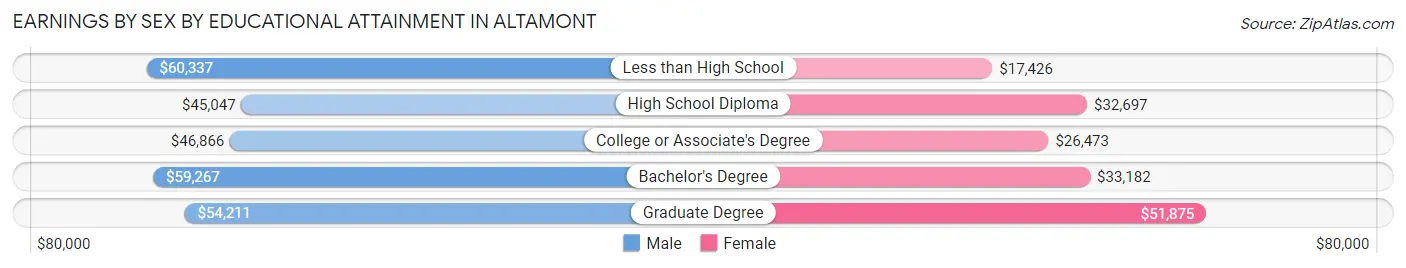
| Educational Attainment | Male Income | Female Income |
| Less than High School | $60,337 | $17,426 |
| High School Diploma | $45,047 | $32,697 |
| College or Associate's Degree | $46,866 | $26,473 |
| Bachelor's Degree | $59,267 | $33,182 |
| Graduate Degree | $54,211 | $51,875 |
| Total | $47,392 | $29,664 |
Family Income in Altamont
Family Income Brackets in Altamont
According to the Altamont family income data, there are 944 families falling into the $75,000 to $99,999 income range, which is the most common income bracket and makes up 18.8% of all families. Conversely, the $10,000 to $14,999 income bracket is the least frequent group with only 141 families (2.8%) belonging to this category.
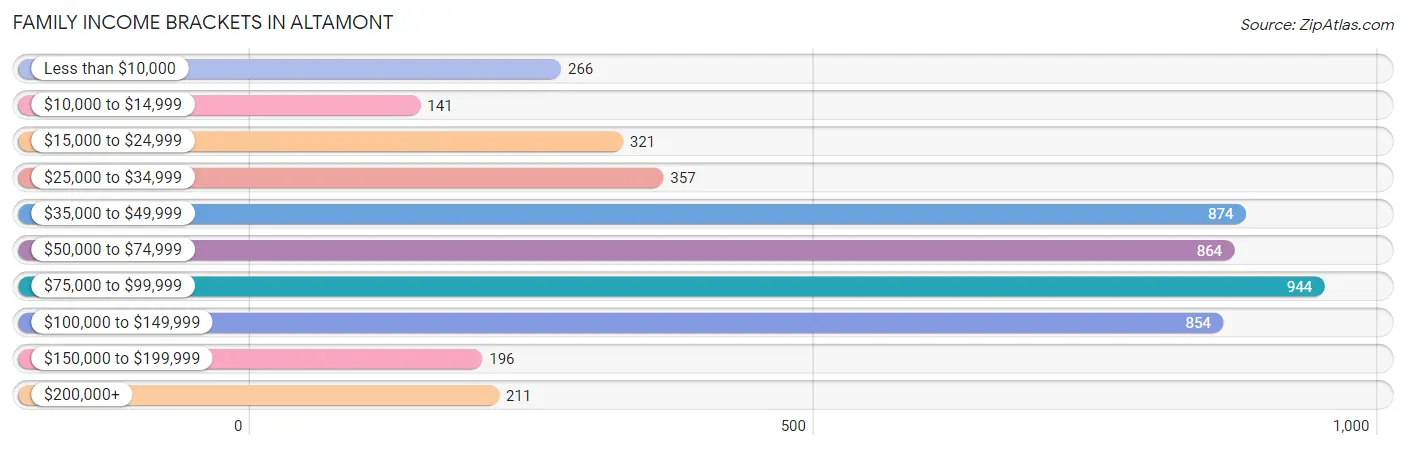
| Income Bracket | # Families | % Families |
| Less than $10,000 | 266 | 5.3% |
| $10,000 to $14,999 | 141 | 2.8% |
| $15,000 to $24,999 | 321 | 6.4% |
| $25,000 to $34,999 | 357 | 7.1% |
| $35,000 to $49,999 | 874 | 17.4% |
| $50,000 to $74,999 | 864 | 17.2% |
| $75,000 to $99,999 | 944 | 18.8% |
| $100,000 to $149,999 | 854 | 17.0% |
| $150,000 to $199,999 | 196 | 3.9% |
| $200,000+ | 211 | 4.2% |
Family Income by Famaliy Size in Altamont
4-person families (696 | 13.9%) account for the highest median family income in Altamont with $85,577 per family, while 2-person families (2,545 | 50.7%) have the highest median income of $29,714 per family member.
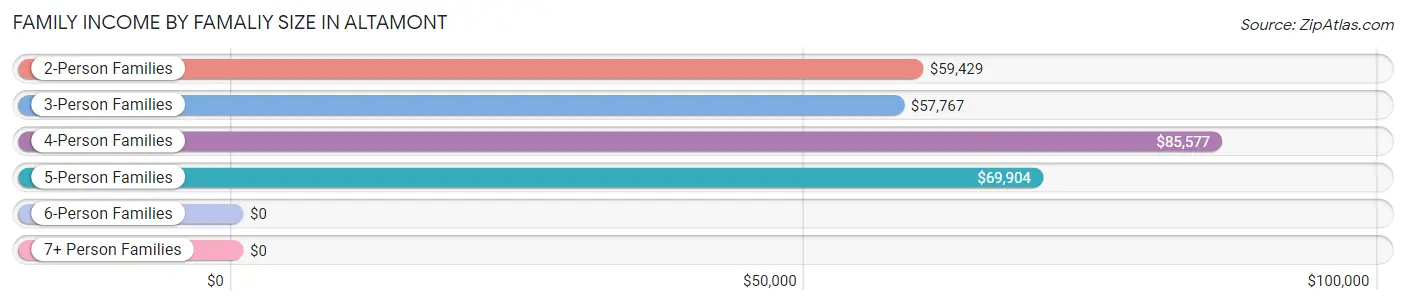
| Income Bracket | # Families | Median Income |
| 2-Person Families | 2,545 (50.7%) | $59,429 |
| 3-Person Families | 1,062 (21.1%) | $57,767 |
| 4-Person Families | 696 (13.9%) | $85,577 |
| 5-Person Families | 439 (8.7%) | $69,904 |
| 6-Person Families | 148 (2.9%) | $0 |
| 7+ Person Families | 132 (2.6%) | $0 |
| Total | 5,022 (100.0%) | $63,979 |
Family Income by Number of Earners in Altamont
The median family income in Altamont is $63,979, with families comprising 3+ earners (189) having the highest median family income of $89,453, while families with 1 earner (1,993) have the lowest median family income of $47,870, accounting for 3.8% and 39.7% of families, respectively.
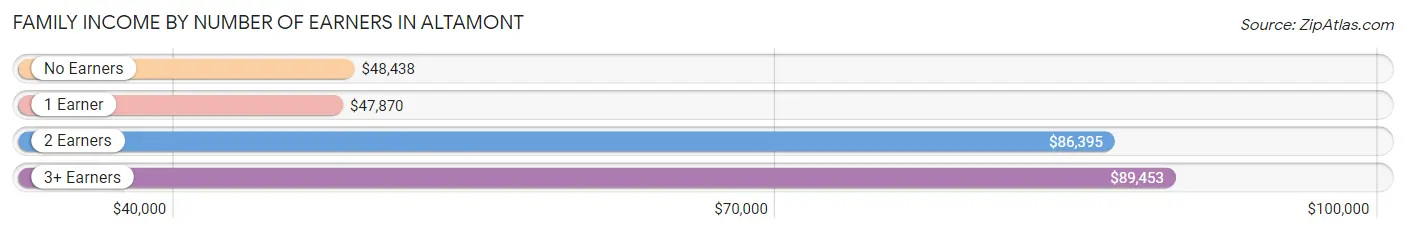
| Number of Earners | # Families | Median Income |
| No Earners | 938 (18.7%) | $48,438 |
| 1 Earner | 1,993 (39.7%) | $47,870 |
| 2 Earners | 1,902 (37.9%) | $86,395 |
| 3+ Earners | 189 (3.8%) | $89,453 |
| Total | 5,022 (100.0%) | $63,979 |
Household Income in Altamont
Household Income Brackets in Altamont
With 1,438 households falling in the category, the $75,000 to $99,999 income range is the most frequent in Altamont, accounting for 18.2% of all households. In contrast, only 213 households (2.7%) fall into the $200,000+ income bracket, making it the least populous group.
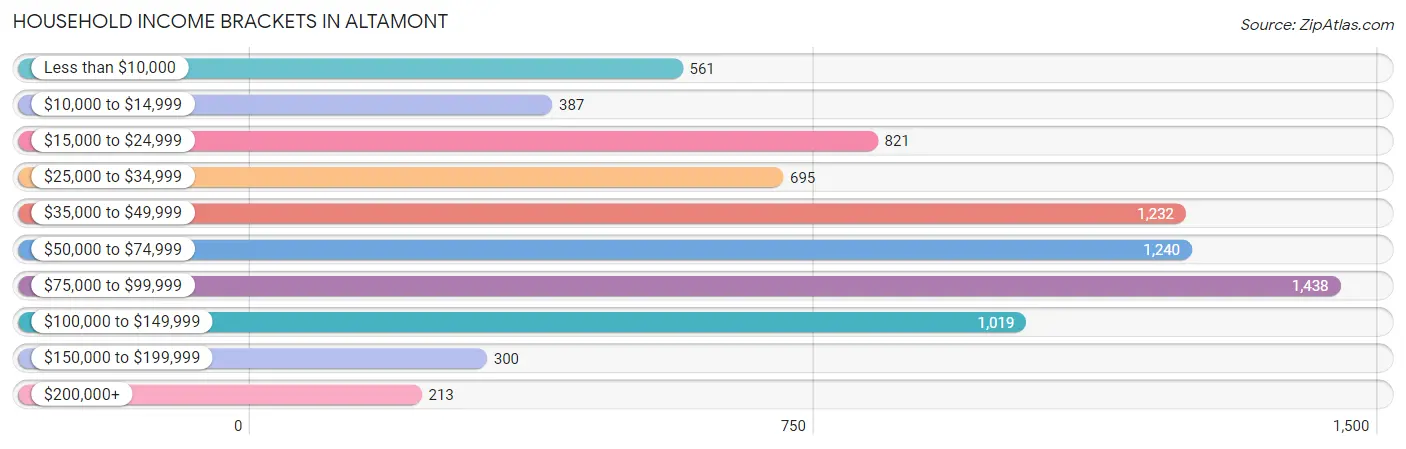
| Income Bracket | # Households | % Households |
| Less than $10,000 | 561 | 7.1% |
| $10,000 to $14,999 | 387 | 4.9% |
| $15,000 to $24,999 | 821 | 10.4% |
| $25,000 to $34,999 | 695 | 8.8% |
| $35,000 to $49,999 | 1,232 | 15.6% |
| $50,000 to $74,999 | 1,240 | 15.7% |
| $75,000 to $99,999 | 1,438 | 18.2% |
| $100,000 to $149,999 | 1,019 | 12.9% |
| $150,000 to $199,999 | 300 | 3.8% |
| $200,000+ | 213 | 2.7% |
Household Income by Householder Age in Altamont
The median household income in Altamont is $54,609, with the highest median household income of $79,815 found in the 45 to 64 years age bracket for the primary householder. A total of 2,461 households (31.2%) fall into this category. Meanwhile, the 15 to 24 years age bracket for the primary householder has the lowest median household income of $33,250, with 216 households (2.7%) in this group.
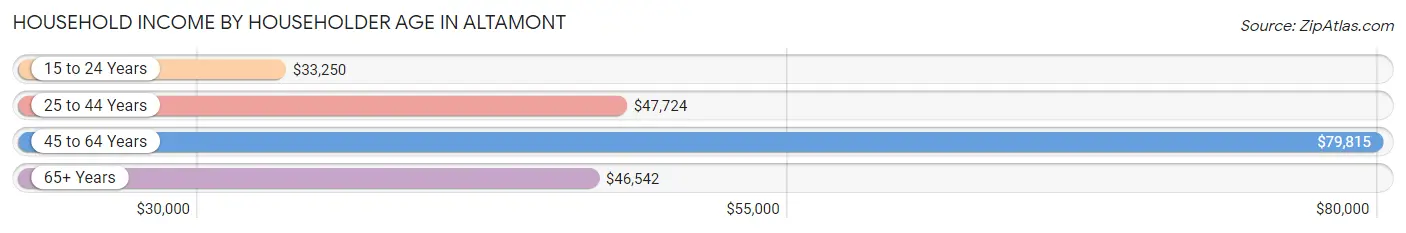
| Income Bracket | # Households | Median Income |
| 15 to 24 Years | 216 (2.7%) | $33,250 |
| 25 to 44 Years | 2,439 (30.9%) | $47,724 |
| 45 to 64 Years | 2,461 (31.2%) | $79,815 |
| 65+ Years | 2,783 (35.2%) | $46,542 |
| Total | 7,899 (100.0%) | $54,609 |
Poverty in Altamont
Income Below Poverty by Sex and Age in Altamont
With 18.4% poverty level for males and 20.8% for females among the residents of Altamont, 6 to 11 year old males and 15 year old females are the most vulnerable to poverty, with 389 males (47.6%) and 103 females (60.6%) in their respective age groups living below the poverty level.
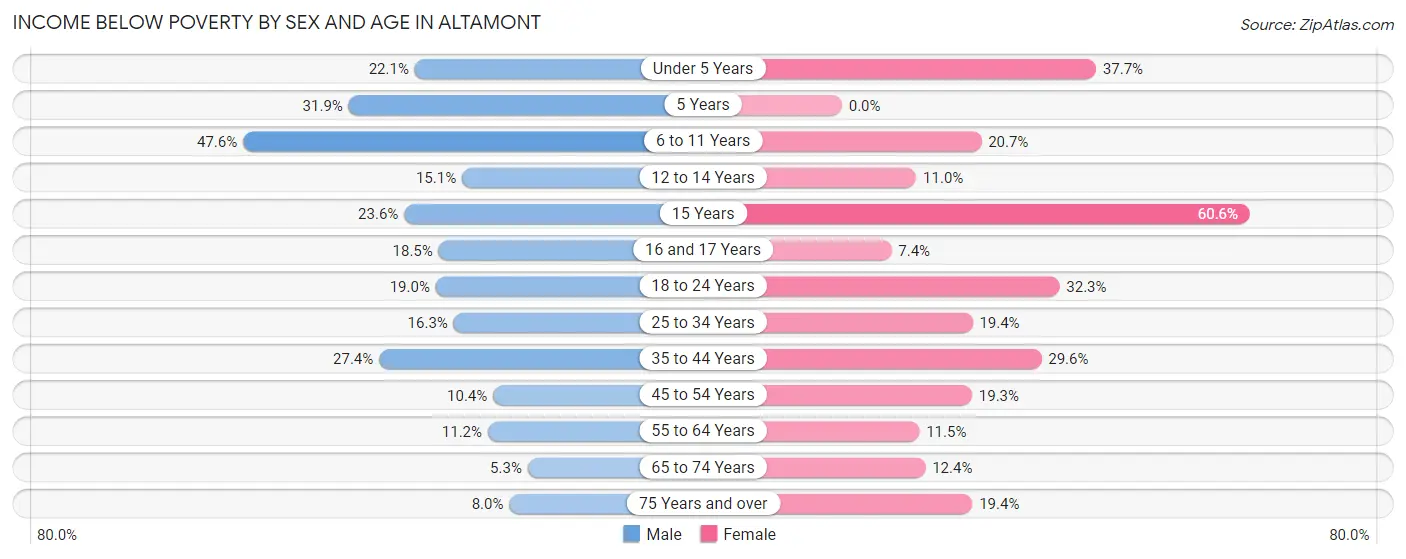
| Age Bracket | Male | Female |
| Under 5 Years | 141 (22.1%) | 309 (37.7%) |
| 5 Years | 124 (31.9%) | 0 (0.0%) |
| 6 to 11 Years | 389 (47.6%) | 183 (20.7%) |
| 12 to 14 Years | 62 (15.0%) | 18 (11.0%) |
| 15 Years | 26 (23.6%) | 103 (60.6%) |
| 16 and 17 Years | 20 (18.5%) | 19 (7.4%) |
| 18 to 24 Years | 145 (19.0%) | 253 (32.3%) |
| 25 to 34 Years | 201 (16.3%) | 316 (19.4%) |
| 35 to 44 Years | 319 (27.4%) | 295 (29.6%) |
| 45 to 54 Years | 95 (10.4%) | 162 (19.3%) |
| 55 to 64 Years | 127 (11.2%) | 171 (11.5%) |
| 65 to 74 Years | 67 (5.3%) | 152 (12.4%) |
| 75 Years and over | 53 (8.0%) | 192 (19.4%) |
| Total | 1,769 (18.4%) | 2,173 (20.8%) |
Income Above Poverty by Sex and Age in Altamont
According to the poverty statistics in Altamont, males aged 65 to 74 years and females aged 5 years are the age groups that are most secure financially, with 94.7% of males and 100.0% of females in these age groups living above the poverty line.
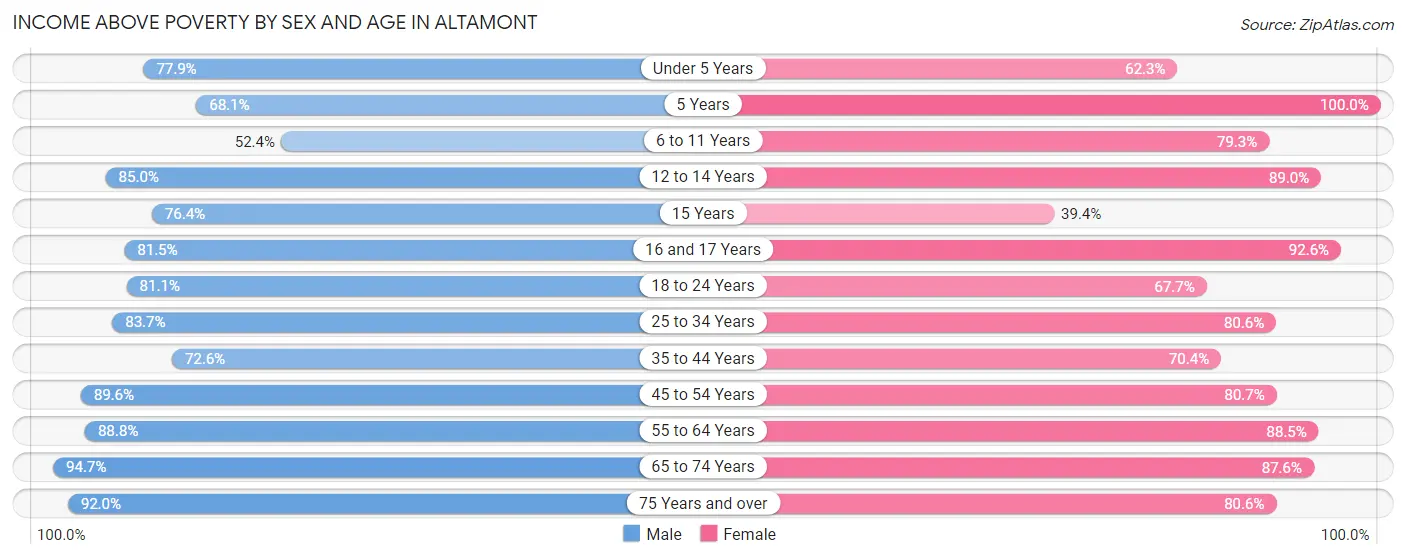
| Age Bracket | Male | Female |
| Under 5 Years | 498 (77.9%) | 510 (62.3%) |
| 5 Years | 265 (68.1%) | 177 (100.0%) |
| 6 to 11 Years | 429 (52.4%) | 701 (79.3%) |
| 12 to 14 Years | 350 (85.0%) | 145 (89.0%) |
| 15 Years | 84 (76.4%) | 67 (39.4%) |
| 16 and 17 Years | 88 (81.5%) | 239 (92.6%) |
| 18 to 24 Years | 620 (81.0%) | 530 (67.7%) |
| 25 to 34 Years | 1,033 (83.7%) | 1,313 (80.6%) |
| 35 to 44 Years | 847 (72.6%) | 701 (70.4%) |
| 45 to 54 Years | 816 (89.6%) | 677 (80.7%) |
| 55 to 64 Years | 1,006 (88.8%) | 1,316 (88.5%) |
| 65 to 74 Years | 1,199 (94.7%) | 1,075 (87.6%) |
| 75 Years and over | 607 (92.0%) | 799 (80.6%) |
| Total | 7,842 (81.6%) | 8,250 (79.1%) |
Income Below Poverty Among Married-Couple Families in Altamont
The poverty statistics for married-couple families in Altamont show that 8.0% or 284 of the total 3,545 families live below the poverty line. Families with 5 or more children have the highest poverty rate of 80.2%, comprising of 73 families. On the other hand, families with no children have the lowest poverty rate of 3.8%, which includes 78 families.
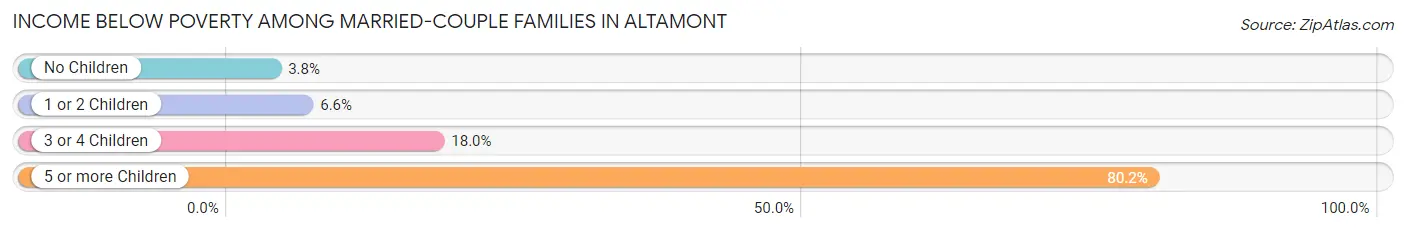
| Children | Above Poverty | Below Poverty |
| No Children | 1,995 (96.2%) | 78 (3.8%) |
| 1 or 2 Children | 942 (93.4%) | 66 (6.6%) |
| 3 or 4 Children | 306 (82.0%) | 67 (18.0%) |
| 5 or more Children | 18 (19.8%) | 73 (80.2%) |
| Total | 3,261 (92.0%) | 284 (8.0%) |
Income Below Poverty Among Single-Parent Households in Altamont
According to the poverty data in Altamont, 15.5% or 63 single-father households and 28.6% or 306 single-mother households are living below the poverty line. Among single-father households, those with 3 or 4 children have the highest poverty rate, with 7 households (100.0%) experiencing poverty. Likewise, among single-mother households, those with 3 or 4 children have the highest poverty rate, with 114 households (79.2%) falling below the poverty line.
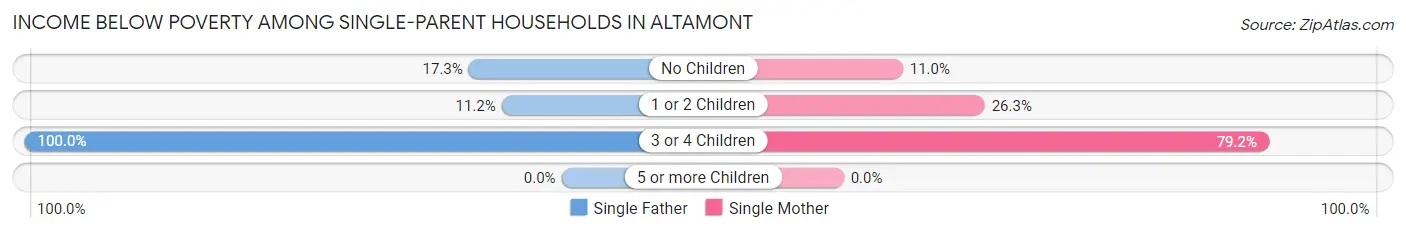
| Children | Single Father | Single Mother |
| No Children | 32 (17.3%) | 37 (11.0%) |
| 1 or 2 Children | 24 (11.2%) | 155 (26.3%) |
| 3 or 4 Children | 7 (100.0%) | 114 (79.2%) |
| 5 or more Children | 0 (0.0%) | 0 (0.0%) |
| Total | 63 (15.5%) | 306 (28.6%) |
Income Below Poverty Among Married-Couple vs Single-Parent Households in Altamont
The poverty data for Altamont shows that 284 of the married-couple family households (8.0%) and 369 of the single-parent households (25.0%) are living below the poverty level. Within the married-couple family households, those with 5 or more children have the highest poverty rate, with 73 households (80.2%) falling below the poverty line. Among the single-parent households, those with 3 or 4 children have the highest poverty rate, with 121 household (80.1%) living below poverty.
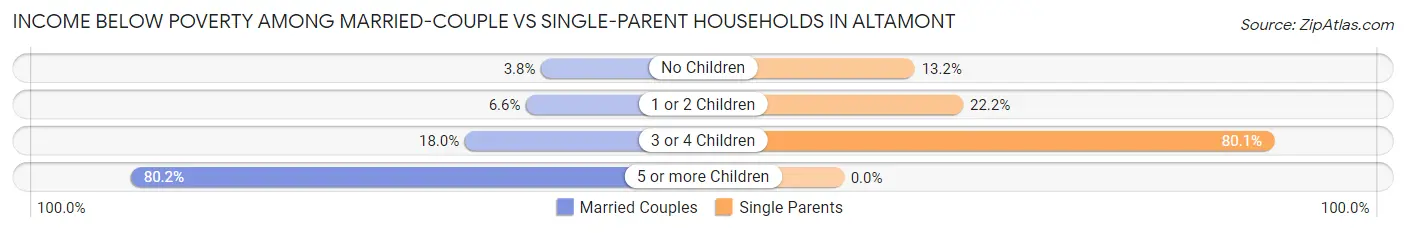
| Children | Married-Couple Families | Single-Parent Households |
| No Children | 78 (3.8%) | 69 (13.2%) |
| 1 or 2 Children | 66 (6.6%) | 179 (22.2%) |
| 3 or 4 Children | 67 (18.0%) | 121 (80.1%) |
| 5 or more Children | 73 (80.2%) | 0 (0.0%) |
| Total | 284 (8.0%) | 369 (25.0%) |
Race in Altamont
The most populous races in Altamont are White / Caucasian (15,459 | 76.0%), Hispanic or Latino (3,648 | 17.9%), and Two or more Races (2,270 | 11.2%).
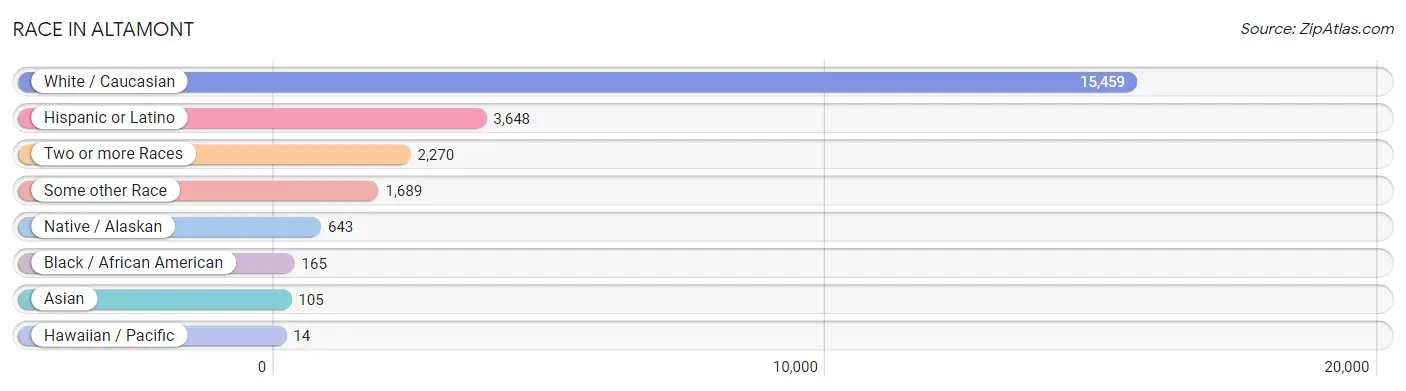
| Race | # Population | % Population |
| Asian | 105 | 0.5% |
| Black / African American | 165 | 0.8% |
| Hawaiian / Pacific | 14 | 0.1% |
| Hispanic or Latino | 3,648 | 17.9% |
| Native / Alaskan | 643 | 3.2% |
| White / Caucasian | 15,459 | 76.0% |
| Two or more Races | 2,270 | 11.2% |
| Some other Race | 1,689 | 8.3% |
| Total | 20,345 | 100.0% |
Ancestry in Altamont
The most populous ancestries reported in Altamont are Mexican (3,442 | 16.9%), German (3,014 | 14.8%), English (2,591 | 12.7%), Irish (1,567 | 7.7%), and American (981 | 4.8%), together accounting for 57.0% of all Altamont residents.
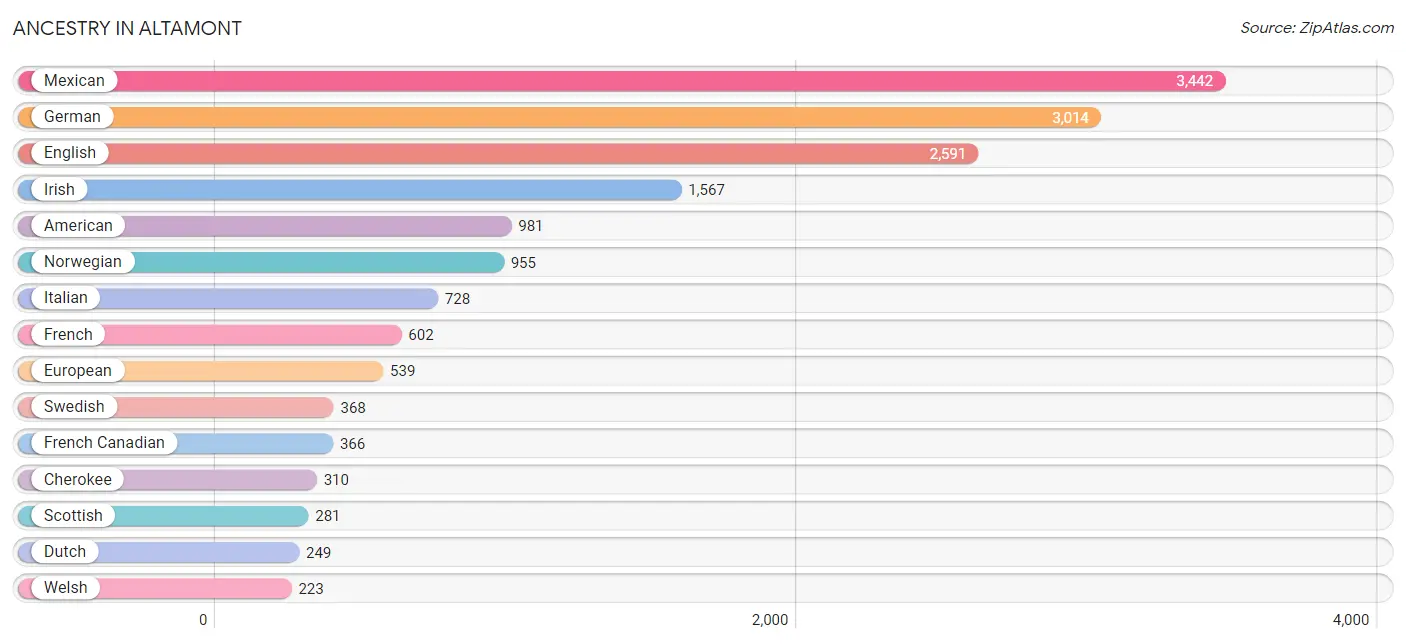
| Ancestry | # Population | % Population |
| African | 1 | 0.0% |
| Alaska Native | 31 | 0.2% |
| American | 981 | 4.8% |
| Austrian | 40 | 0.2% |
| Basque | 171 | 0.8% |
| Bhutanese | 68 | 0.3% |
| British | 221 | 1.1% |
| Canadian | 56 | 0.3% |
| Celtic | 11 | 0.1% |
| Central American | 1 | 0.0% |
| Cherokee | 310 | 1.5% |
| Chippewa | 1 | 0.0% |
| Comanche | 7 | 0.0% |
| Creek | 76 | 0.4% |
| Croatian | 13 | 0.1% |
| Czech | 72 | 0.4% |
| Danish | 81 | 0.4% |
| Dutch | 249 | 1.2% |
| Eastern European | 68 | 0.3% |
| English | 2,591 | 12.7% |
| European | 539 | 2.6% |
| Filipino | 28 | 0.1% |
| French | 602 | 3.0% |
| French Canadian | 366 | 1.8% |
| German | 3,014 | 14.8% |
| Greek | 40 | 0.2% |
| Hungarian | 31 | 0.2% |
| Indian (Asian) | 33 | 0.2% |
| Irish | 1,567 | 7.7% |
| Iroquois | 39 | 0.2% |
| Israeli | 115 | 0.6% |
| Italian | 728 | 3.6% |
| Korean | 30 | 0.2% |
| Latvian | 12 | 0.1% |
| Mexican | 3,442 | 16.9% |
| Native Hawaiian | 4 | 0.0% |
| Northern European | 121 | 0.6% |
| Norwegian | 955 | 4.7% |
| Panamanian | 1 | 0.0% |
| Polish | 200 | 1.0% |
| Portuguese | 145 | 0.7% |
| Pueblo | 2 | 0.0% |
| Russian | 207 | 1.0% |
| Scandinavian | 166 | 0.8% |
| Scotch-Irish | 82 | 0.4% |
| Scottish | 281 | 1.4% |
| Shoshone | 62 | 0.3% |
| Sioux | 42 | 0.2% |
| Spaniard | 49 | 0.2% |
| Spanish | 145 | 0.7% |
| Subsaharan African | 1 | 0.0% |
| Swedish | 368 | 1.8% |
| Thai | 56 | 0.3% |
| Welsh | 223 | 1.1% |
| Yaqui | 26 | 0.1% | View All 55 Rows |
Immigrants in Altamont
The most numerous immigrant groups reported in Altamont came from Central America (823 | 4.1%), Latin America (823 | 4.1%), Mexico (822 | 4.0%), Europe (121 | 0.6%), and Eastern Europe (64 | 0.3%), together accounting for 13.0% of all Altamont residents.
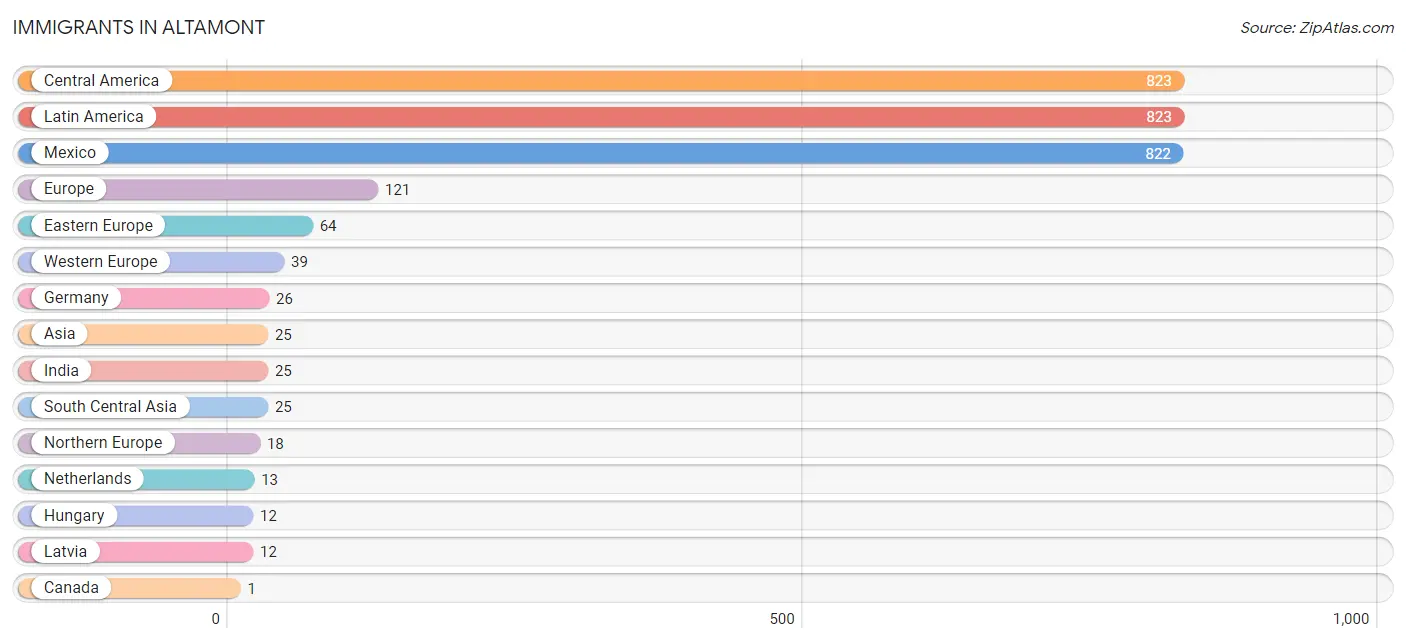
| Immigration Origin | # Population | % Population |
| Asia | 25 | 0.1% |
| Canada | 1 | 0.0% |
| Central America | 823 | 4.1% |
| Eastern Europe | 64 | 0.3% |
| Europe | 121 | 0.6% |
| Germany | 26 | 0.1% |
| Hungary | 12 | 0.1% |
| India | 25 | 0.1% |
| Latin America | 823 | 4.1% |
| Latvia | 12 | 0.1% |
| Mexico | 822 | 4.0% |
| Netherlands | 13 | 0.1% |
| Northern Europe | 18 | 0.1% |
| Panama | 1 | 0.0% |
| South Central Asia | 25 | 0.1% |
| Western Europe | 39 | 0.2% | View All 16 Rows |
Sex and Age in Altamont
Sex and Age in Altamont
The most populous age groups in Altamont are 5 to 9 Years (1,093 | 11.3%) for men and 60 to 64 Years (949 | 8.9%) for women.
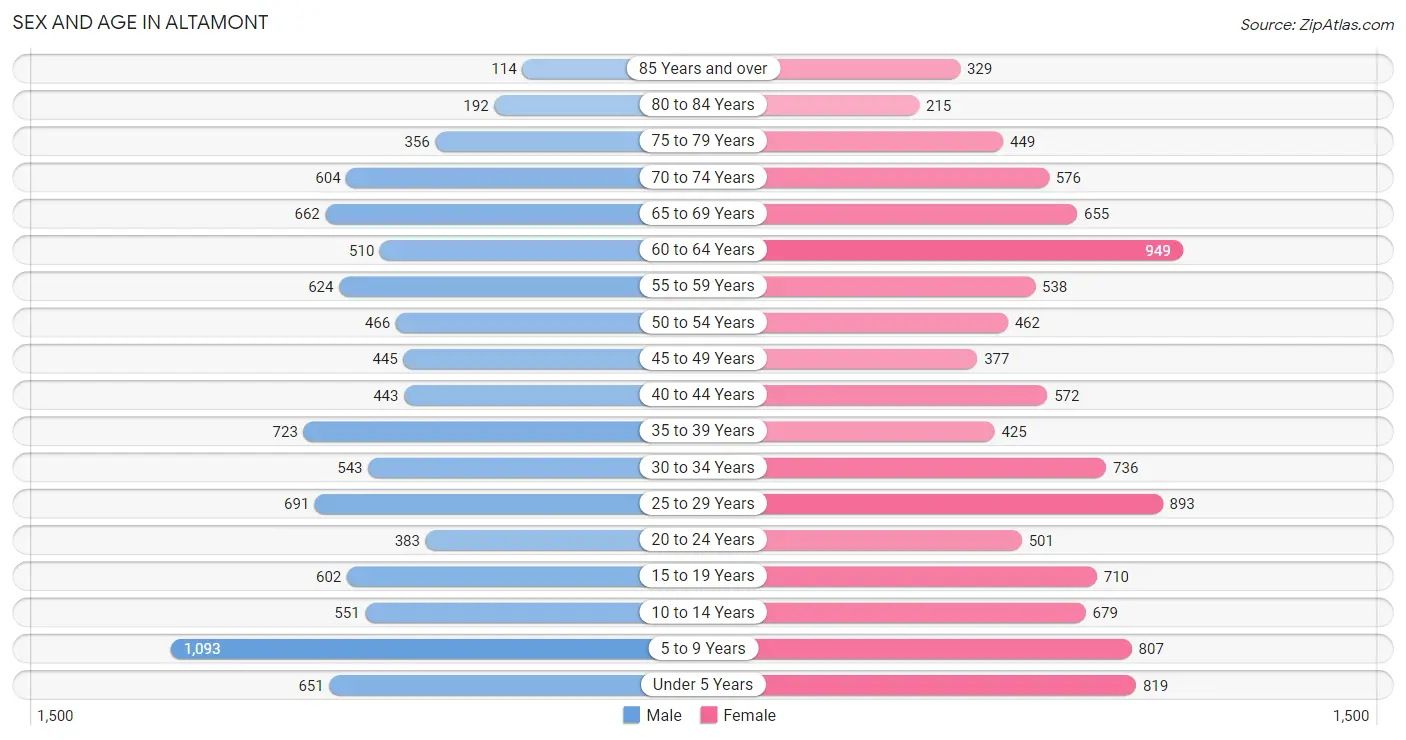
| Age Bracket | Male | Female |
| Under 5 Years | 651 (6.7%) | 819 (7.7%) |
| 5 to 9 Years | 1,093 (11.3%) | 807 (7.5%) |
| 10 to 14 Years | 551 (5.7%) | 679 (6.4%) |
| 15 to 19 Years | 602 (6.2%) | 710 (6.6%) |
| 20 to 24 Years | 383 (4.0%) | 501 (4.7%) |
| 25 to 29 Years | 691 (7.2%) | 893 (8.4%) |
| 30 to 34 Years | 543 (5.6%) | 736 (6.9%) |
| 35 to 39 Years | 723 (7.5%) | 425 (4.0%) |
| 40 to 44 Years | 443 (4.6%) | 572 (5.3%) |
| 45 to 49 Years | 445 (4.6%) | 377 (3.5%) |
| 50 to 54 Years | 466 (4.8%) | 462 (4.3%) |
| 55 to 59 Years | 624 (6.5%) | 538 (5.0%) |
| 60 to 64 Years | 510 (5.3%) | 949 (8.9%) |
| 65 to 69 Years | 662 (6.9%) | 655 (6.1%) |
| 70 to 74 Years | 604 (6.3%) | 576 (5.4%) |
| 75 to 79 Years | 356 (3.7%) | 449 (4.2%) |
| 80 to 84 Years | 192 (2.0%) | 215 (2.0%) |
| 85 Years and over | 114 (1.2%) | 329 (3.1%) |
| Total | 9,653 (100.0%) | 10,692 (100.0%) |
Families and Households in Altamont
Median Family Size in Altamont
The median family size in Altamont is 3.10 persons per family, with married-couple families (3,545 | 70.6%) accounting for the largest median family size of 3.17 persons per family. On the other hand, single male/father families (407 | 8.1%) represent the smallest median family size with 2.80 persons per family.
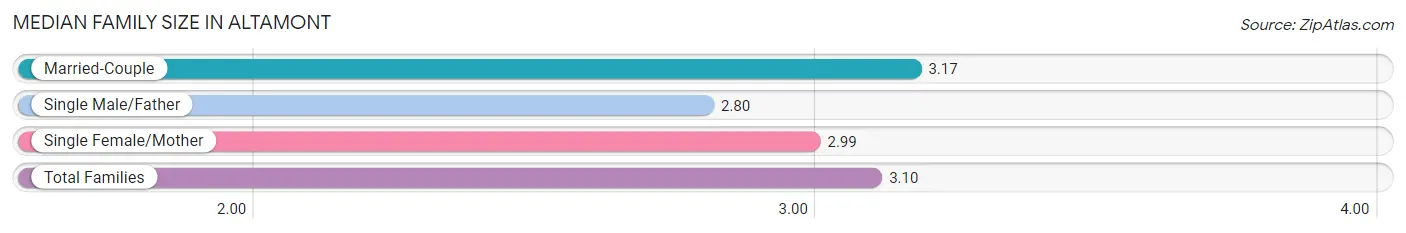
| Family Type | # Families | Family Size |
| Married-Couple | 3,545 (70.6%) | 3.17 |
| Single Male/Father | 407 (8.1%) | 2.80 |
| Single Female/Mother | 1,070 (21.3%) | 2.99 |
| Total Families | 5,022 (100.0%) | 3.10 |
Median Household Size in Altamont
The median household size in Altamont is 2.56 persons per household, with single female/mother households (1,070 | 13.6%) accounting for the largest median household size of 3.31 persons per household. non-family households (2,877 | 36.4%) represent the smallest median household size with 1.37 persons per household.
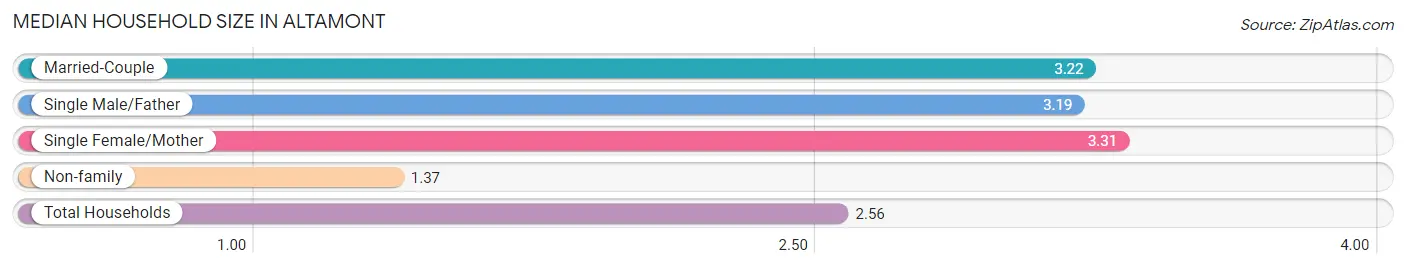
| Household Type | # Households | Household Size |
| Married-Couple | 3,545 (44.9%) | 3.22 |
| Single Male/Father | 407 (5.1%) | 3.19 |
| Single Female/Mother | 1,070 (13.6%) | 3.31 |
| Non-family | 2,877 (36.4%) | 1.37 |
| Total Households | 7,899 (100.0%) | 2.56 |
Household Size by Marriage Status in Altamont
Out of a total of 7,899 households in Altamont, 5,022 (63.6%) are family households, while 2,877 (36.4%) are nonfamily households. The most numerous type of family households are 2-person households, comprising 2,403, and the most common type of nonfamily households are 1-person households, comprising 2,219.
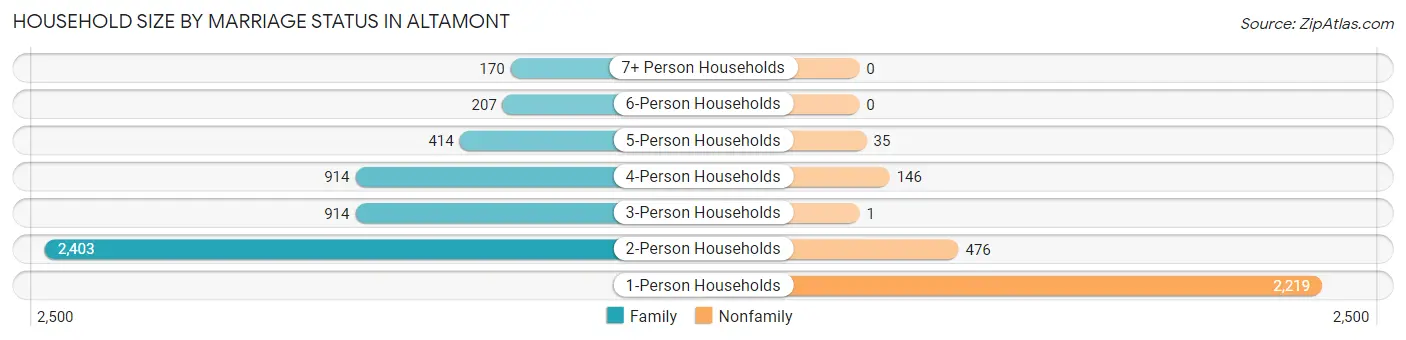
| Household Size | Family Households | Nonfamily Households |
| 1-Person Households | - | 2,219 (28.1%) |
| 2-Person Households | 2,403 (30.4%) | 476 (6.0%) |
| 3-Person Households | 914 (11.6%) | 1 (0.0%) |
| 4-Person Households | 914 (11.6%) | 146 (1.8%) |
| 5-Person Households | 414 (5.2%) | 35 (0.4%) |
| 6-Person Households | 207 (2.6%) | 0 (0.0%) |
| 7+ Person Households | 170 (2.1%) | 0 (0.0%) |
| Total | 5,022 (63.6%) | 2,877 (36.4%) |
Female Fertility in Altamont
Fertility by Age in Altamont
Average fertility rate in Altamont is 35.0 births per 1,000 women. Women in the age bracket of 20 to 34 years have the highest fertility rate with 69.0 births per 1,000 women. Women in the age bracket of 20 to 34 years acount for 94.8% of all women with births.
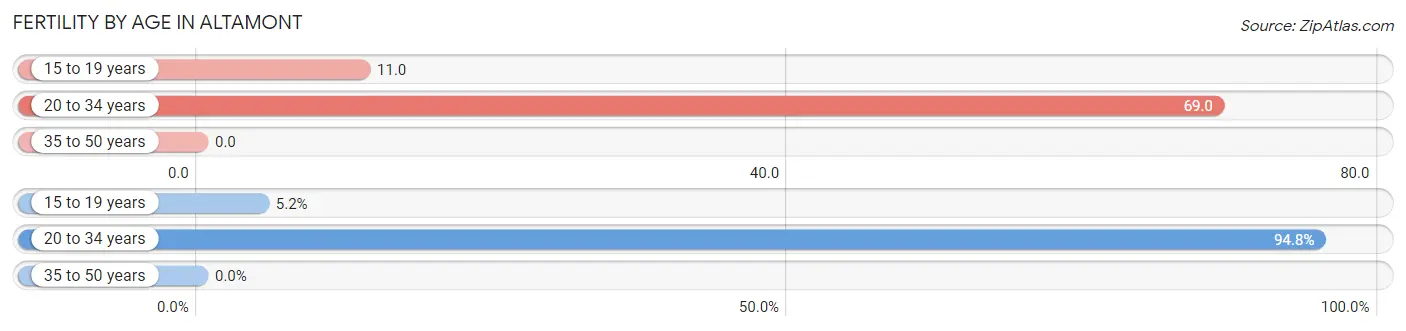
| Age Bracket | Women with Births | Births / 1,000 Women |
| 15 to 19 years | 8 (5.2%) | 11.0 |
| 20 to 34 years | 147 (94.8%) | 69.0 |
| 35 to 50 years | 0 (0.0%) | 0.0 |
| Total | 155 (100.0%) | 35.0 |
Fertility by Age by Marriage Status in Altamont
86.5% of women with births (155) in Altamont are married. The highest percentage of unmarried women with births falls into 15 to 19 years age bracket with 100.0% of them unmarried at the time of birth, while the lowest percentage of unmarried women with births belong to 20 to 34 years age bracket with 8.8% of them unmarried.
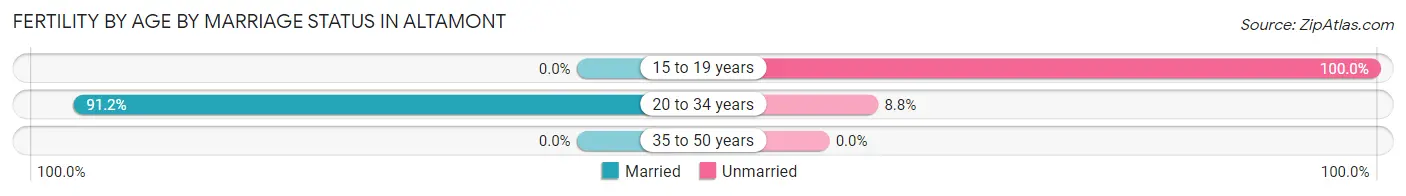
| Age Bracket | Married | Unmarried |
| 15 to 19 years | 0 (0.0%) | 8 (100.0%) |
| 20 to 34 years | 134 (91.2%) | 13 (8.8%) |
| 35 to 50 years | 0 (0.0%) | 0 (0.0%) |
| Total | 134 (86.5%) | 21 (13.6%) |
Fertility by Education in Altamont
Average fertility rate in Altamont is 35.0 births per 1,000 women. Women with the education attainment of graduate degree have the highest fertility rate of 55.0 births per 1,000 women, while women with the education attainment of less than high school have the lowest fertility at 15.0 births per 1,000 women. Women with the education attainment of college or associate's degree represent 30.3% of all women with births.
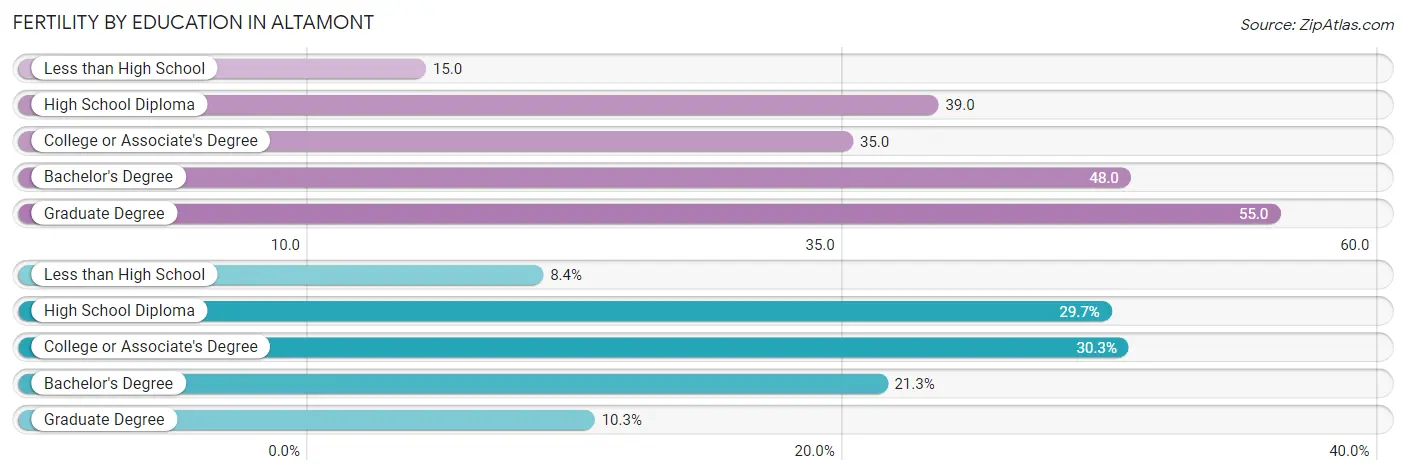
| Educational Attainment | Women with Births | Births / 1,000 Women |
| Less than High School | 13 (8.4%) | 15.0 |
| High School Diploma | 46 (29.7%) | 39.0 |
| College or Associate's Degree | 47 (30.3%) | 35.0 |
| Bachelor's Degree | 33 (21.3%) | 48.0 |
| Graduate Degree | 16 (10.3%) | 55.0 |
| Total | 155 (100.0%) | 35.0 |
Fertility by Education by Marriage Status in Altamont
13.6% of women with births in Altamont are unmarried. Women with the educational attainment of college or associate's degree are most likely to be married with 100.0% of them married at childbirth, while women with the educational attainment of less than high school are least likely to be married with 100.0% of them unmarried at childbirth.
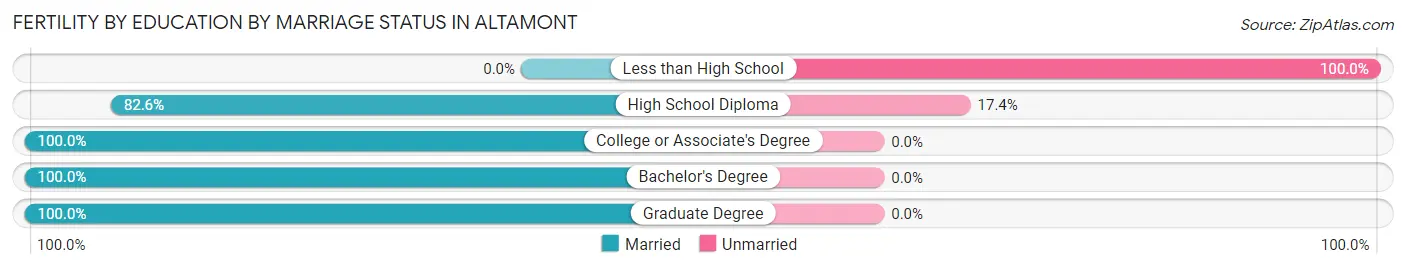
| Educational Attainment | Married | Unmarried |
| Less than High School | 0 (0.0%) | 13 (100.0%) |
| High School Diploma | 38 (82.6%) | 8 (17.4%) |
| College or Associate's Degree | 47 (100.0%) | 0 (0.0%) |
| Bachelor's Degree | 33 (100.0%) | 0 (0.0%) |
| Graduate Degree | 16 (100.0%) | 0 (0.0%) |
| Total | 134 (86.5%) | 21 (13.6%) |
Employment Characteristics in Altamont
Employment by Class of Employer in Altamont
Among the 7,344 employed individuals in Altamont, private company employees (4,528 | 61.7%), local government employees (798 | 10.9%), and not-for-profit organizations (587 | 8.0%) make up the most common classes of employment.
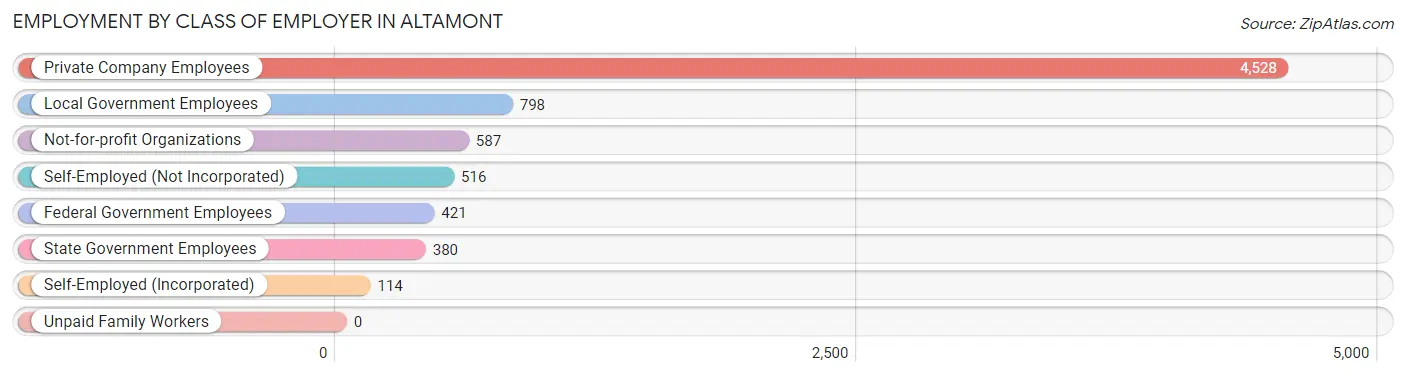
| Employer Class | # Employees | % Employees |
| Private Company Employees | 4,528 | 61.7% |
| Self-Employed (Incorporated) | 114 | 1.5% |
| Self-Employed (Not Incorporated) | 516 | 7.0% |
| Not-for-profit Organizations | 587 | 8.0% |
| Local Government Employees | 798 | 10.9% |
| State Government Employees | 380 | 5.2% |
| Federal Government Employees | 421 | 5.7% |
| Unpaid Family Workers | 0 | 0.0% |
| Total | 7,344 | 100.0% |
Employment Status by Age in Altamont
According to the labor force statistics for Altamont, out of the total population over 16 years of age (15,465), 52.6% or 8,135 individuals are in the labor force, with 9.2% or 748 of them unemployed. The age group with the highest labor force participation rate is 25 to 29 years, with 85.5% or 1,354 individuals in the labor force. Within the labor force, the 20 to 24 years age range has the highest percentage of unemployed individuals, with 46.3% or 262 of them being unemployed.
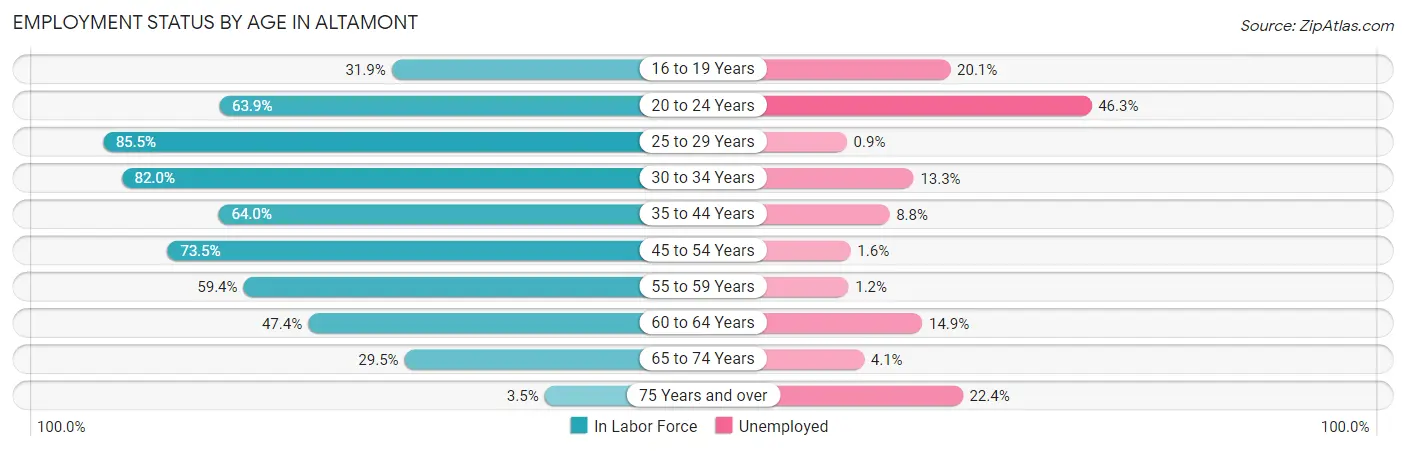
| Age Bracket | In Labor Force | Unemployed |
| 16 to 19 Years | 329 (31.9%) | 66 (20.1%) |
| 20 to 24 Years | 565 (63.9%) | 262 (46.3%) |
| 25 to 29 Years | 1,354 (85.5%) | 12 (0.9%) |
| 30 to 34 Years | 1,049 (82.0%) | 140 (13.3%) |
| 35 to 44 Years | 1,384 (64.0%) | 122 (8.8%) |
| 45 to 54 Years | 1,286 (73.5%) | 21 (1.6%) |
| 55 to 59 Years | 690 (59.4%) | 8 (1.2%) |
| 60 to 64 Years | 692 (47.4%) | 103 (14.9%) |
| 65 to 74 Years | 737 (29.5%) | 30 (4.1%) |
| 75 Years and over | 58 (3.5%) | 13 (22.4%) |
| Total | 8,135 (52.6%) | 748 (9.2%) |
Employment Status by Educational Attainment in Altamont
According to labor force statistics for Altamont, 68.7% of individuals (6,456) out of the total population between 25 and 64 years of age (9,397) are in the labor force, with 6.3% or 407 of them being unemployed. The group with the highest labor force participation rate are those with the educational attainment of bachelor's degree or higher, with 77.7% or 1,476 individuals in the labor force. Within the labor force, individuals with less than high school education have the highest percentage of unemployment, with 13.3% or 65 of them being unemployed.
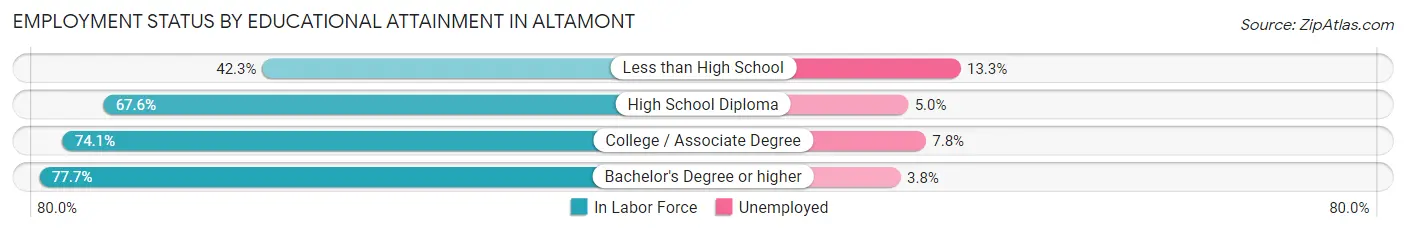
| Educational Attainment | In Labor Force | Unemployed |
| Less than High School | 487 (42.3%) | 153 (13.3%) |
| High School Diploma | 2,201 (67.6%) | 163 (5.0%) |
| College / Associate Degree | 2,290 (74.1%) | 241 (7.8%) |
| Bachelor's Degree or higher | 1,476 (77.7%) | 72 (3.8%) |
| Total | 6,456 (68.7%) | 592 (6.3%) |
Employment Occupations by Sex in Altamont
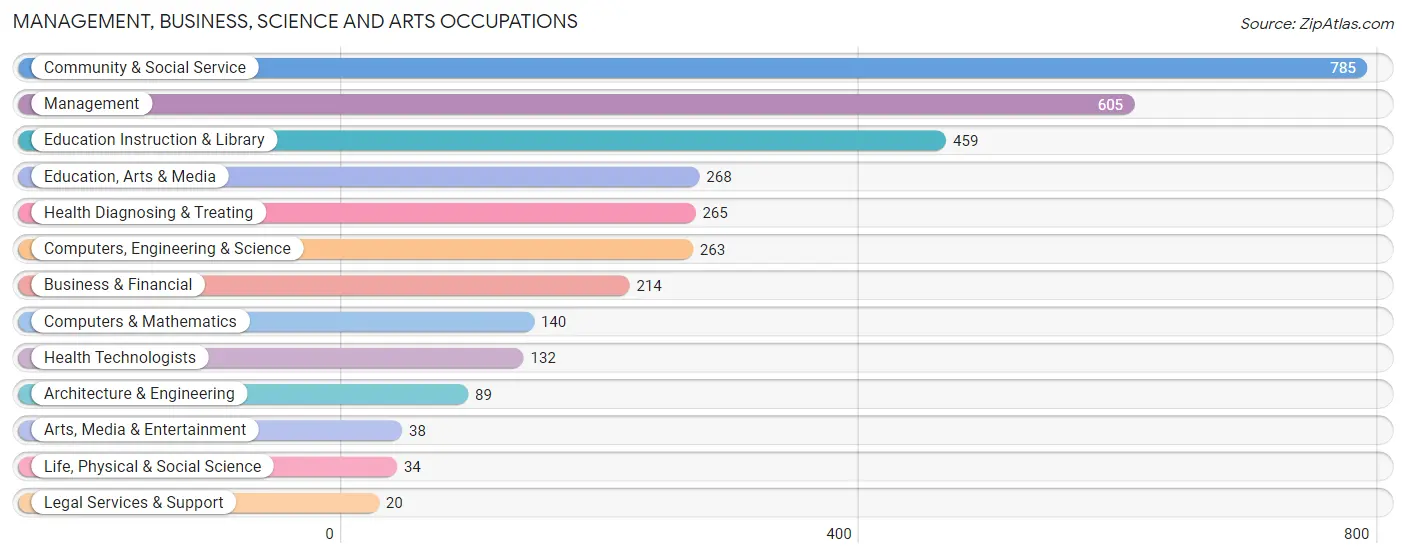
Management, Business, Science and Arts Occupations
The most common Management, Business, Science and Arts occupations in Altamont are Community & Social Service (785 | 11.0%), Management (605 | 8.4%), Education Instruction & Library (459 | 6.4%), Education, Arts & Media (268 | 3.7%), and Health Diagnosing & Treating (265 | 3.7%).
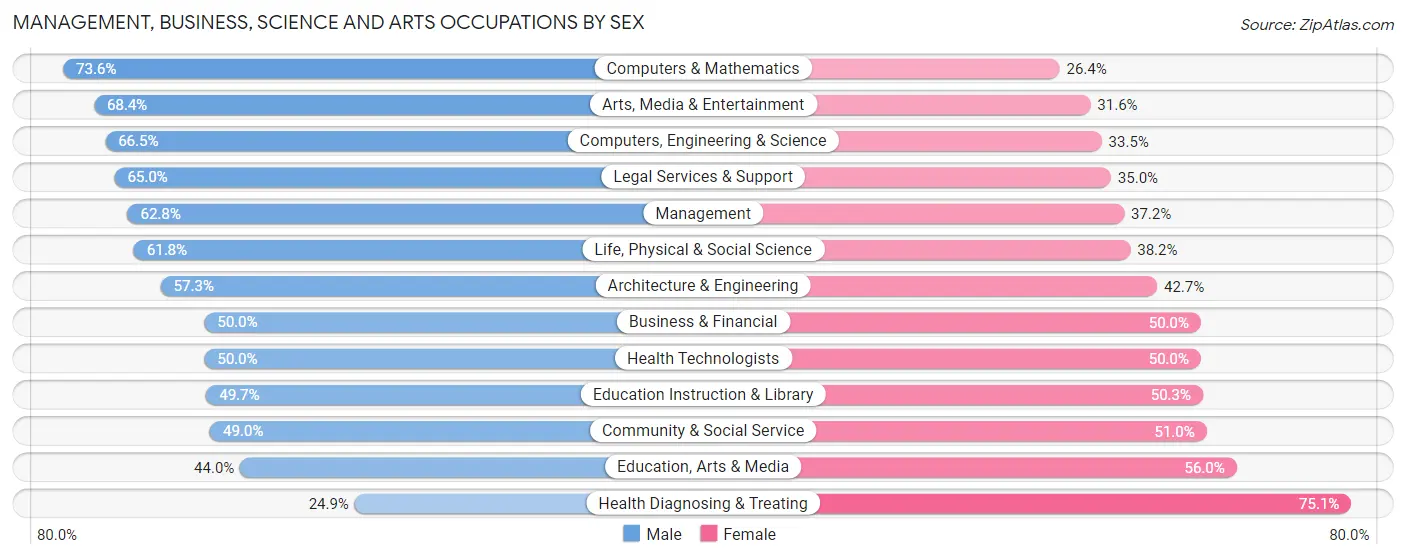
Management, Business, Science and Arts Occupations by Sex
Within the Management, Business, Science and Arts occupations in Altamont, the most male-oriented occupations are Computers & Mathematics (73.6%), Arts, Media & Entertainment (68.4%), and Computers, Engineering & Science (66.5%), while the most female-oriented occupations are Health Diagnosing & Treating (75.1%), Education, Arts & Media (56.0%), and Community & Social Service (51.0%).
| Occupation | Male | Female |
| Management | 380 (62.8%) | 225 (37.2%) |
| Business & Financial | 107 (50.0%) | 107 (50.0%) |
| Computers, Engineering & Science | 175 (66.5%) | 88 (33.5%) |
| Computers & Mathematics | 103 (73.6%) | 37 (26.4%) |
| Architecture & Engineering | 51 (57.3%) | 38 (42.7%) |
| Life, Physical & Social Science | 21 (61.8%) | 13 (38.2%) |
| Community & Social Service | 385 (49.0%) | 400 (51.0%) |
| Education, Arts & Media | 118 (44.0%) | 150 (56.0%) |
| Legal Services & Support | 13 (65.0%) | 7 (35.0%) |
| Education Instruction & Library | 228 (49.7%) | 231 (50.3%) |
| Arts, Media & Entertainment | 26 (68.4%) | 12 (31.6%) |
| Health Diagnosing & Treating | 66 (24.9%) | 199 (75.1%) |
| Health Technologists | 66 (50.0%) | 66 (50.0%) |
| Total (Category) | 1,113 (52.2%) | 1,019 (47.8%) |
| Total (Overall) | 3,804 (53.0%) | 3,368 (47.0%) |
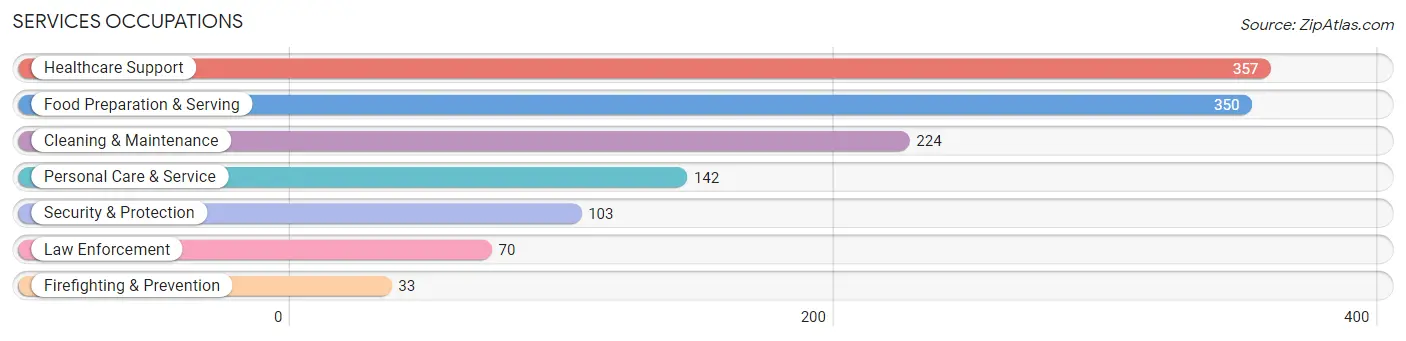
Services Occupations
The most common Services occupations in Altamont are Healthcare Support (357 | 5.0%), Food Preparation & Serving (350 | 4.9%), Cleaning & Maintenance (224 | 3.1%), Personal Care & Service (142 | 2.0%), and Security & Protection (103 | 1.4%).
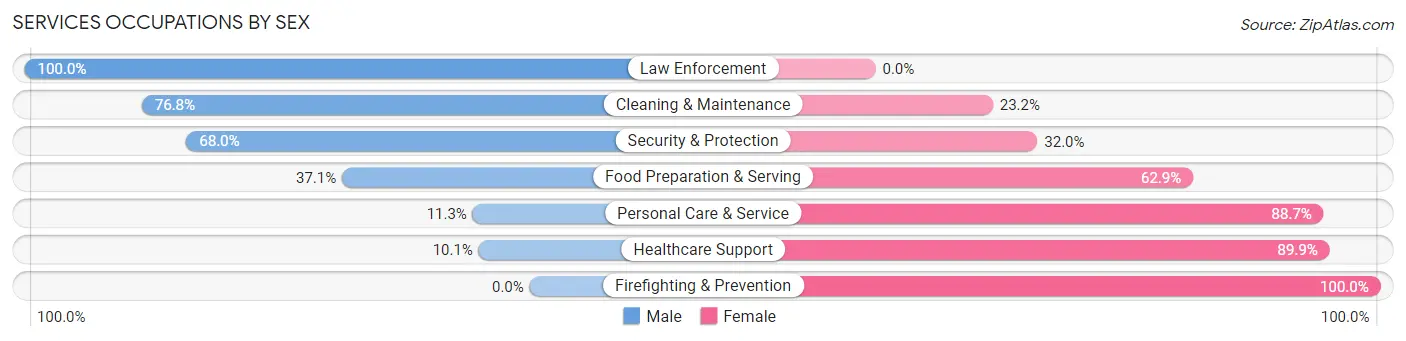
Services Occupations by Sex
Within the Services occupations in Altamont, the most male-oriented occupations are Law Enforcement (100.0%), Cleaning & Maintenance (76.8%), and Security & Protection (68.0%), while the most female-oriented occupations are Firefighting & Prevention (100.0%), Healthcare Support (89.9%), and Personal Care & Service (88.7%).
| Occupation | Male | Female |
| Healthcare Support | 36 (10.1%) | 321 (89.9%) |
| Security & Protection | 70 (68.0%) | 33 (32.0%) |
| Firefighting & Prevention | 0 (0.0%) | 33 (100.0%) |
| Law Enforcement | 70 (100.0%) | 0 (0.0%) |
| Food Preparation & Serving | 130 (37.1%) | 220 (62.9%) |
| Cleaning & Maintenance | 172 (76.8%) | 52 (23.2%) |
| Personal Care & Service | 16 (11.3%) | 126 (88.7%) |
| Total (Category) | 424 (36.0%) | 752 (63.9%) |
| Total (Overall) | 3,804 (53.0%) | 3,368 (47.0%) |
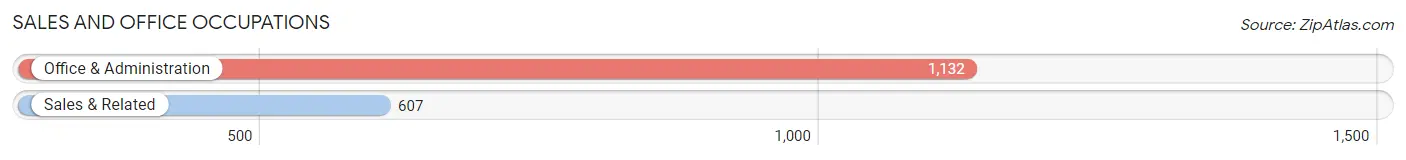
Sales and Office Occupations
The most common Sales and Office occupations in Altamont are Office & Administration (1,132 | 15.8%), and Sales & Related (607 | 8.5%).
Sales and Office Occupations by Sex
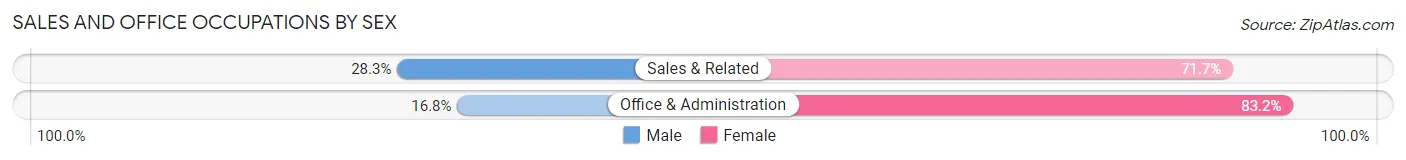
| Occupation | Male | Female |
| Sales & Related | 172 (28.3%) | 435 (71.7%) |
| Office & Administration | 190 (16.8%) | 942 (83.2%) |
| Total (Category) | 362 (20.8%) | 1,377 (79.2%) |
| Total (Overall) | 3,804 (53.0%) | 3,368 (47.0%) |
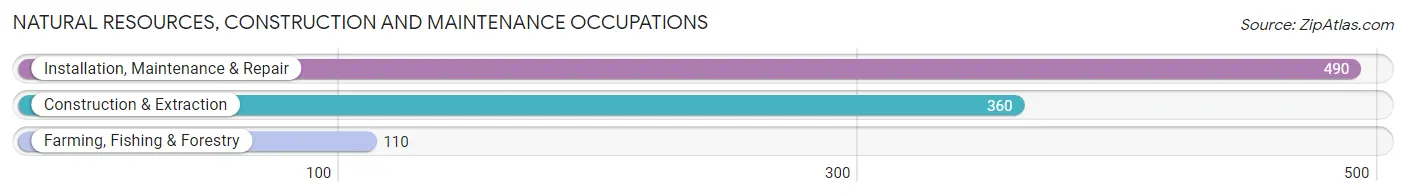
Natural Resources, Construction and Maintenance Occupations
The most common Natural Resources, Construction and Maintenance occupations in Altamont are Installation, Maintenance & Repair (490 | 6.8%), Construction & Extraction (360 | 5.0%), and Farming, Fishing & Forestry (110 | 1.5%).
Natural Resources, Construction and Maintenance Occupations by Sex
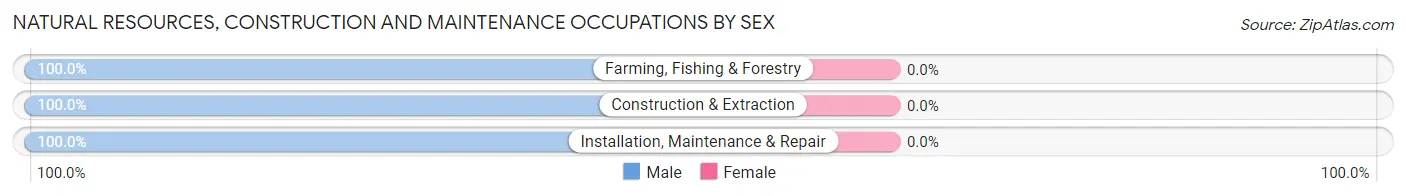
| Occupation | Male | Female |
| Farming, Fishing & Forestry | 110 (100.0%) | 0 (0.0%) |
| Construction & Extraction | 360 (100.0%) | 0 (0.0%) |
| Installation, Maintenance & Repair | 490 (100.0%) | 0 (0.0%) |
| Total (Category) | 960 (100.0%) | 0 (0.0%) |
| Total (Overall) | 3,804 (53.0%) | 3,368 (47.0%) |
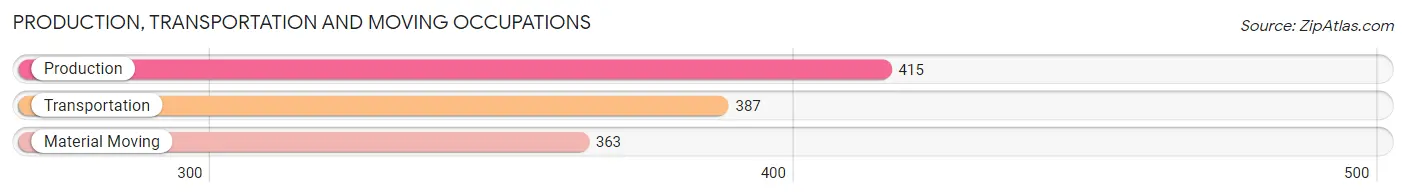
Production, Transportation and Moving Occupations
The most common Production, Transportation and Moving occupations in Altamont are Production (415 | 5.8%), Transportation (387 | 5.4%), and Material Moving (363 | 5.1%).
Production, Transportation and Moving Occupations by Sex
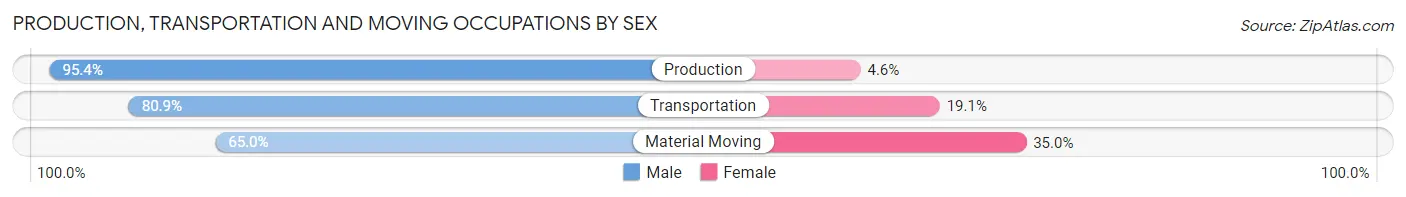
| Occupation | Male | Female |
| Production | 396 (95.4%) | 19 (4.6%) |
| Transportation | 313 (80.9%) | 74 (19.1%) |
| Material Moving | 236 (65.0%) | 127 (35.0%) |
| Total (Category) | 945 (81.1%) | 220 (18.9%) |
| Total (Overall) | 3,804 (53.0%) | 3,368 (47.0%) |
Employment Industries by Sex in Altamont
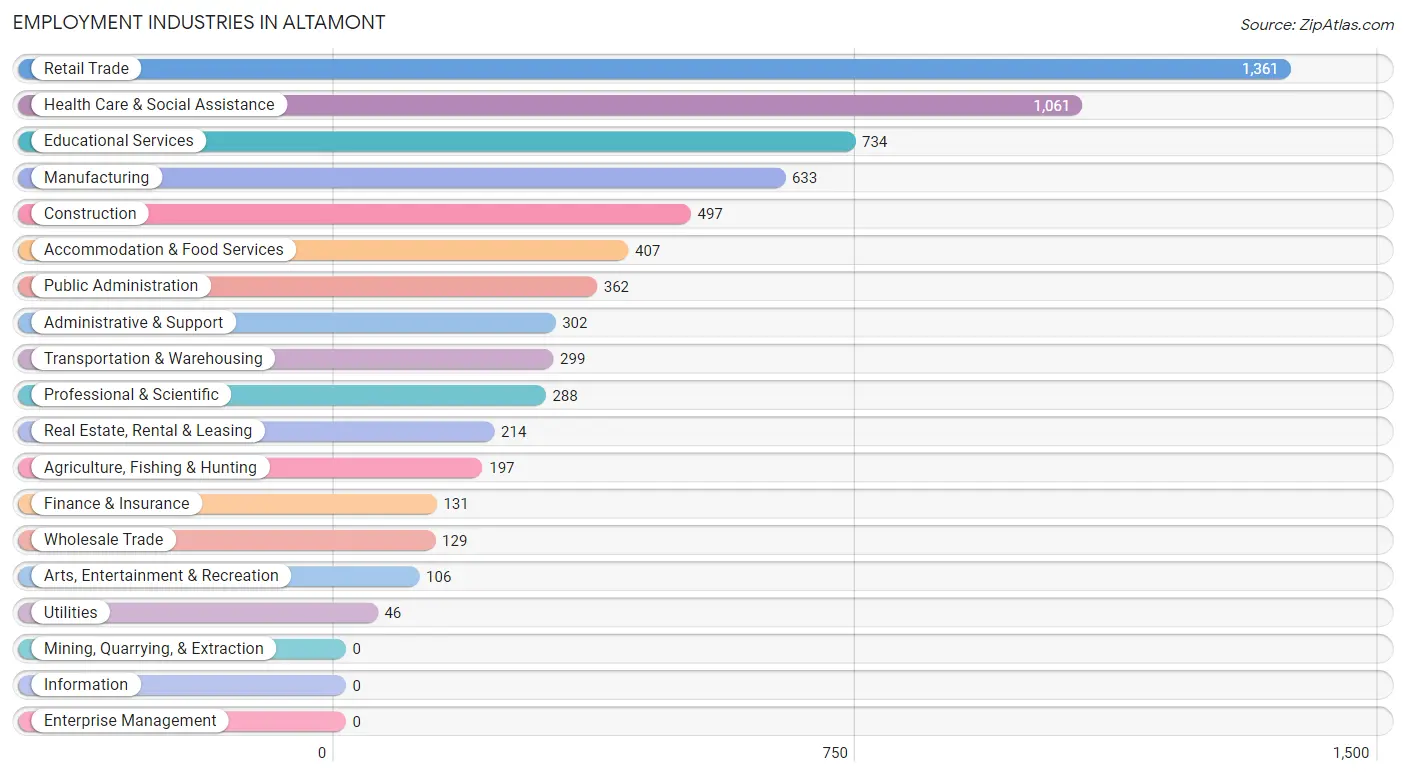
Employment Industries in Altamont
The major employment industries in Altamont include Retail Trade (1,361 | 19.0%), Health Care & Social Assistance (1,061 | 14.8%), Educational Services (734 | 10.2%), Manufacturing (633 | 8.8%), and Construction (497 | 6.9%).
Employment Industries by Sex in Altamont
The Altamont industries that see more men than women are Agriculture, Fishing & Hunting (100.0%), Wholesale Trade (100.0%), and Construction (83.7%), whereas the industries that tend to have a higher number of women are Health Care & Social Assistance (81.3%), Finance & Insurance (67.9%), and Professional & Scientific (57.3%).
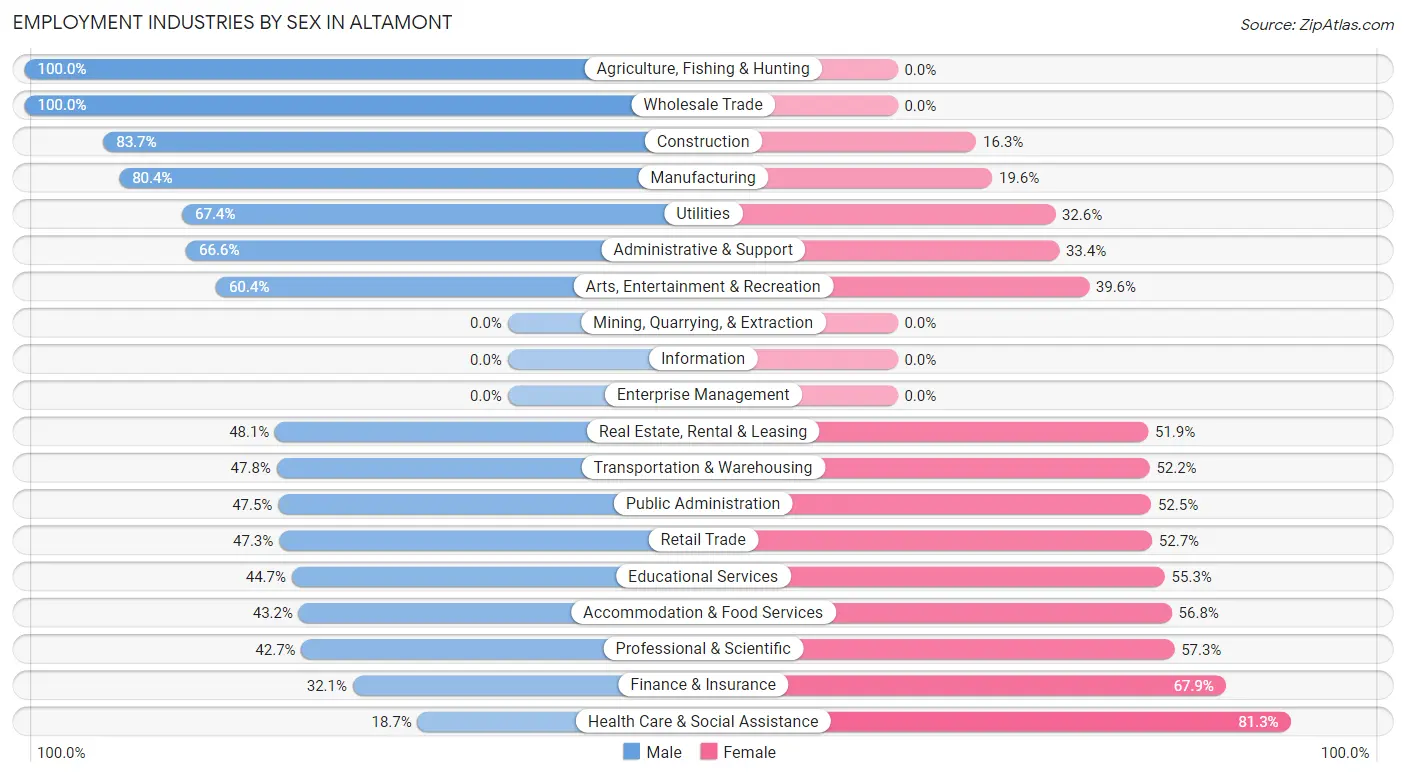
| Industry | Male | Female |
| Agriculture, Fishing & Hunting | 197 (100.0%) | 0 (0.0%) |
| Mining, Quarrying, & Extraction | 0 (0.0%) | 0 (0.0%) |
| Construction | 416 (83.7%) | 81 (16.3%) |
| Manufacturing | 509 (80.4%) | 124 (19.6%) |
| Wholesale Trade | 129 (100.0%) | 0 (0.0%) |
| Retail Trade | 644 (47.3%) | 717 (52.7%) |
| Transportation & Warehousing | 143 (47.8%) | 156 (52.2%) |
| Utilities | 31 (67.4%) | 15 (32.6%) |
| Information | 0 (0.0%) | 0 (0.0%) |
| Finance & Insurance | 42 (32.1%) | 89 (67.9%) |
| Real Estate, Rental & Leasing | 103 (48.1%) | 111 (51.9%) |
| Professional & Scientific | 123 (42.7%) | 165 (57.3%) |
| Enterprise Management | 0 (0.0%) | 0 (0.0%) |
| Administrative & Support | 201 (66.6%) | 101 (33.4%) |
| Educational Services | 328 (44.7%) | 406 (55.3%) |
| Health Care & Social Assistance | 198 (18.7%) | 863 (81.3%) |
| Arts, Entertainment & Recreation | 64 (60.4%) | 42 (39.6%) |
| Accommodation & Food Services | 176 (43.2%) | 231 (56.8%) |
| Public Administration | 172 (47.5%) | 190 (52.5%) |
| Total | 3,804 (53.0%) | 3,368 (47.0%) |
Education in Altamont
School Enrollment in Altamont
The most common levels of schooling among the 4,883 students in Altamont are elementary school (1,459 | 29.9%), middle school (831 | 17.0%), and college / undergraduate (817 | 16.7%).
| School Level | # Students | % Students |
| Nursery / Preschool | 400 | 8.2% |
| Kindergarten | 476 | 9.8% |
| Elementary School | 1,459 | 29.9% |
| Middle School | 831 | 17.0% |
| High School | 796 | 16.3% |
| College / Undergraduate | 817 | 16.7% |
| Graduate / Professional | 104 | 2.1% |
| Total | 4,883 | 100.0% |
School Enrollment by Age by Funding Source in Altamont
Out of a total of 4,883 students who are enrolled in schools in Altamont, 742 (15.2%) attend a private institution, while the remaining 4,141 (84.8%) are enrolled in public schools. The age group of 3 to 4 year olds has the highest likelihood of being enrolled in private schools, with 184 (52.0% in the age bracket) enrolled. Conversely, the age group of 18 to 19 year olds has the lowest likelihood of being enrolled in a private school, with 396 (100.0% in the age bracket) attending a public institution.
| Age Bracket | Public School | Private School |
| 3 to 4 Year Olds | 170 (48.0%) | 184 (52.0%) |
| 5 to 9 Year Old | 1,372 (81.7%) | 308 (18.3%) |
| 10 to 14 Year Olds | 1,092 (90.0%) | 121 (10.0%) |
| 15 to 17 Year Olds | 560 (92.6%) | 45 (7.4%) |
| 18 to 19 Year Olds | 396 (100.0%) | 0 (0.0%) |
| 20 to 24 Year Olds | 201 (89.3%) | 24 (10.7%) |
| 25 to 34 Year Olds | 286 (92.3%) | 24 (7.7%) |
| 35 Years and over | 62 (62.0%) | 38 (38.0%) |
| Total | 4,141 (84.8%) | 742 (15.2%) |
Educational Attainment by Field of Study in Altamont
Education (511 | 19.2%), bio, nature & agricultural (429 | 16.1%), science & technology (377 | 14.1%), business (351 | 13.2%), and social sciences (211 | 7.9%) are the most common fields of study among 2,664 individuals in Altamont who have obtained a bachelor's degree or higher.
| Field of Study | # Graduates | % Graduates |
| Computers & Mathematics | 107 | 4.0% |
| Bio, Nature & Agricultural | 429 | 16.1% |
| Physical & Health Sciences | 33 | 1.2% |
| Psychology | 176 | 6.6% |
| Social Sciences | 211 | 7.9% |
| Engineering | 91 | 3.4% |
| Multidisciplinary Studies | 36 | 1.3% |
| Science & Technology | 377 | 14.1% |
| Business | 351 | 13.2% |
| Education | 511 | 19.2% |
| Literature & Languages | 92 | 3.5% |
| Liberal Arts & History | 46 | 1.7% |
| Visual & Performing Arts | 45 | 1.7% |
| Communications | 37 | 1.4% |
| Arts & Humanities | 122 | 4.6% |
| Total | 2,664 | 100.0% |
Transportation & Commute in Altamont
Vehicle Availability by Sex in Altamont
The most prevalent vehicle ownership categories in Altamont are males with 2 vehicles (1,809, accounting for 46.2%) and females with 2 vehicles (1,444, making up 53.2%).
| Vehicles Available | Male | Female |
| No Vehicle | 25 (0.6%) | 38 (1.1%) |
| 1 Vehicle | 531 (13.6%) | 728 (21.4%) |
| 2 Vehicles | 1,809 (46.2%) | 1,444 (42.5%) |
| 3 Vehicles | 761 (19.4%) | 693 (20.4%) |
| 4 Vehicles | 661 (16.9%) | 399 (11.7%) |
| 5 or more Vehicles | 127 (3.2%) | 96 (2.8%) |
| Total | 3,914 (100.0%) | 3,398 (100.0%) |
Commute Time in Altamont
The most frequently occuring commute durations in Altamont are 15 to 19 minutes (1,841 commuters, 26.6%), 10 to 14 minutes (1,790 commuters, 25.9%), and 5 to 9 minutes (1,777 commuters, 25.7%).
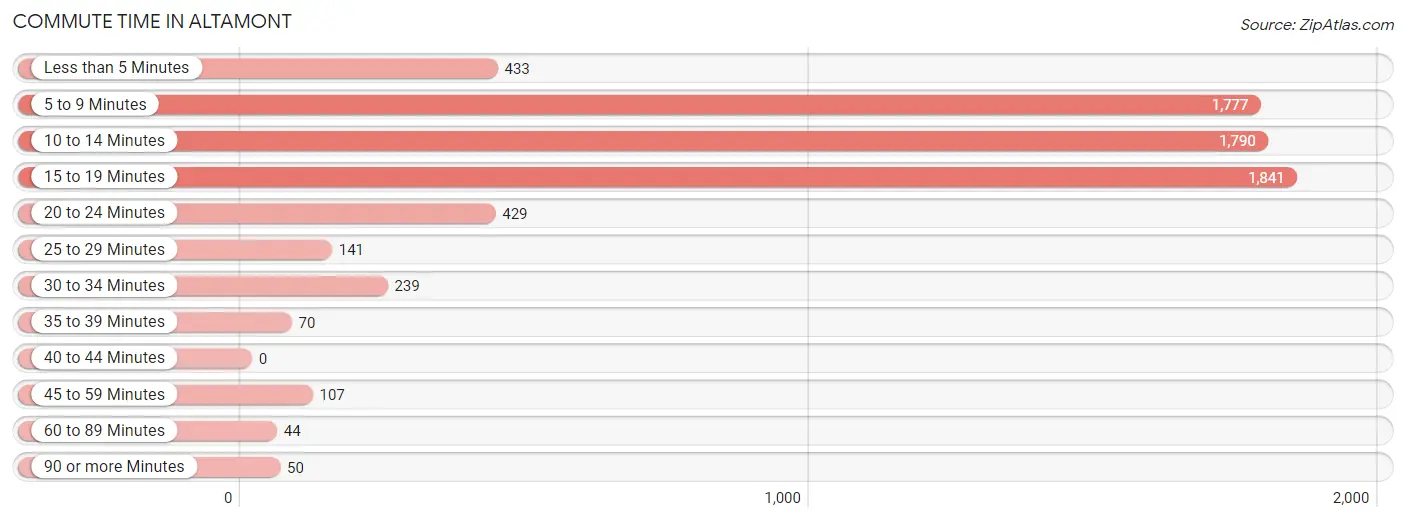
| Commute Time | # Commuters | % Commuters |
| Less than 5 Minutes | 433 | 6.3% |
| 5 to 9 Minutes | 1,777 | 25.7% |
| 10 to 14 Minutes | 1,790 | 25.9% |
| 15 to 19 Minutes | 1,841 | 26.6% |
| 20 to 24 Minutes | 429 | 6.2% |
| 25 to 29 Minutes | 141 | 2.0% |
| 30 to 34 Minutes | 239 | 3.5% |
| 35 to 39 Minutes | 70 | 1.0% |
| 40 to 44 Minutes | 0 | 0.0% |
| 45 to 59 Minutes | 107 | 1.5% |
| 60 to 89 Minutes | 44 | 0.6% |
| 90 or more Minutes | 50 | 0.7% |
Commute Time by Sex in Altamont
The most common commute times in Altamont are 5 to 9 minutes (1,000 commuters, 26.2%) for males and 10 to 14 minutes (909 commuters, 29.3%) for females.
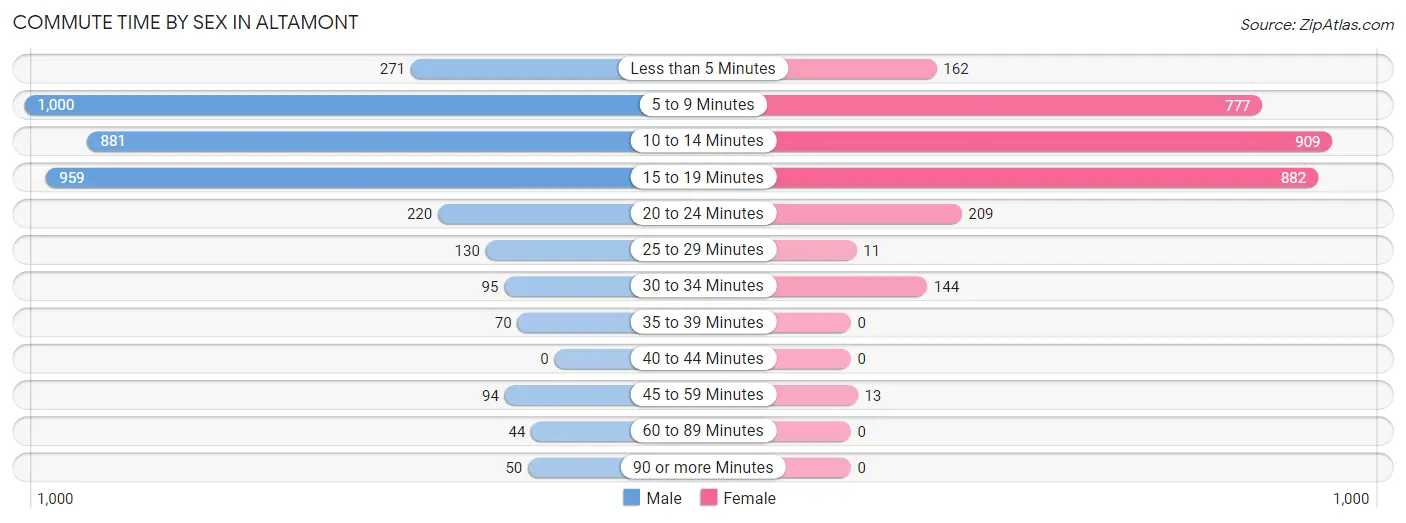
| Commute Time | Male | Female |
| Less than 5 Minutes | 271 (7.1%) | 162 (5.2%) |
| 5 to 9 Minutes | 1,000 (26.2%) | 777 (25.0%) |
| 10 to 14 Minutes | 881 (23.1%) | 909 (29.3%) |
| 15 to 19 Minutes | 959 (25.1%) | 882 (28.4%) |
| 20 to 24 Minutes | 220 (5.8%) | 209 (6.7%) |
| 25 to 29 Minutes | 130 (3.4%) | 11 (0.4%) |
| 30 to 34 Minutes | 95 (2.5%) | 144 (4.6%) |
| 35 to 39 Minutes | 70 (1.8%) | 0 (0.0%) |
| 40 to 44 Minutes | 0 (0.0%) | 0 (0.0%) |
| 45 to 59 Minutes | 94 (2.5%) | 13 (0.4%) |
| 60 to 89 Minutes | 44 (1.1%) | 0 (0.0%) |
| 90 or more Minutes | 50 (1.3%) | 0 (0.0%) |
Time of Departure to Work by Sex in Altamont
The most frequent times of departure to work in Altamont are 7:00 AM to 7:29 AM (578, 15.1%) for males and 7:00 AM to 7:29 AM (486, 15.6%) for females.
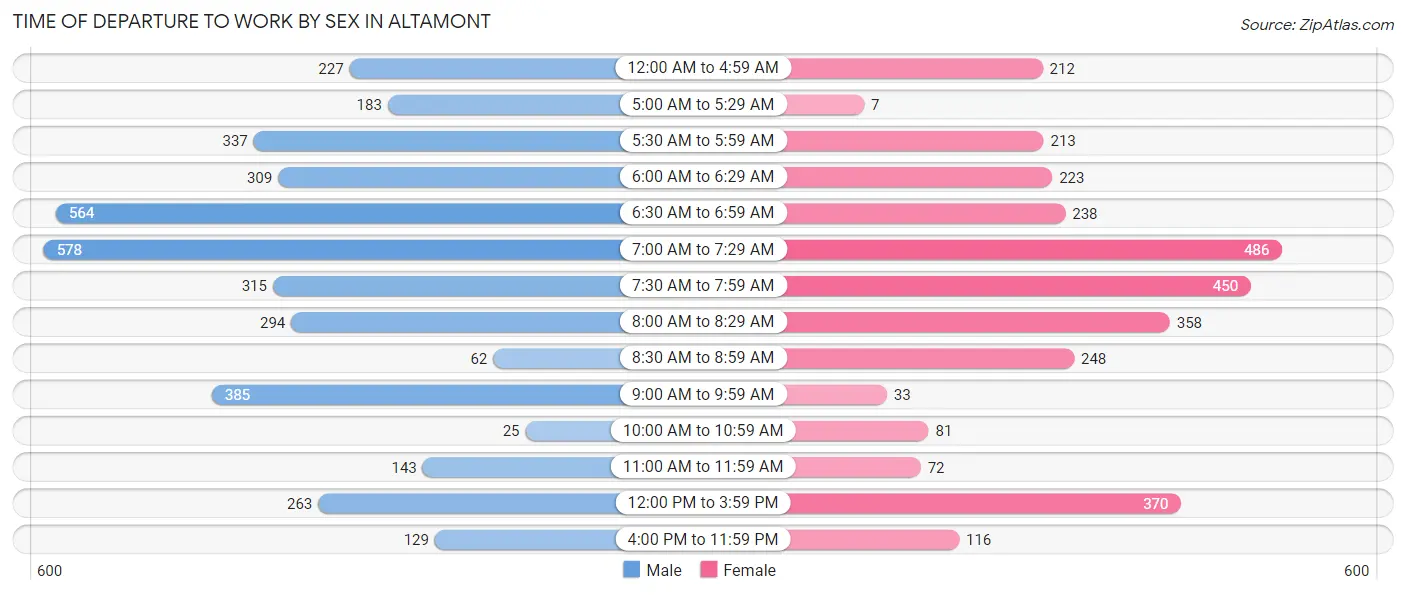
| Time of Departure | Male | Female |
| 12:00 AM to 4:59 AM | 227 (5.9%) | 212 (6.8%) |
| 5:00 AM to 5:29 AM | 183 (4.8%) | 7 (0.2%) |
| 5:30 AM to 5:59 AM | 337 (8.8%) | 213 (6.9%) |
| 6:00 AM to 6:29 AM | 309 (8.1%) | 223 (7.2%) |
| 6:30 AM to 6:59 AM | 564 (14.8%) | 238 (7.7%) |
| 7:00 AM to 7:29 AM | 578 (15.1%) | 486 (15.6%) |
| 7:30 AM to 7:59 AM | 315 (8.3%) | 450 (14.5%) |
| 8:00 AM to 8:29 AM | 294 (7.7%) | 358 (11.5%) |
| 8:30 AM to 8:59 AM | 62 (1.6%) | 248 (8.0%) |
| 9:00 AM to 9:59 AM | 385 (10.1%) | 33 (1.1%) |
| 10:00 AM to 10:59 AM | 25 (0.7%) | 81 (2.6%) |
| 11:00 AM to 11:59 AM | 143 (3.7%) | 72 (2.3%) |
| 12:00 PM to 3:59 PM | 263 (6.9%) | 370 (11.9%) |
| 4:00 PM to 11:59 PM | 129 (3.4%) | 116 (3.7%) |
| Total | 3,814 (100.0%) | 3,107 (100.0%) |
Housing Occupancy in Altamont
Occupancy by Ownership in Altamont
Of the total 7,899 dwellings in Altamont, owner-occupied units account for 5,283 (66.9%), while renter-occupied units make up 2,616 (33.1%).
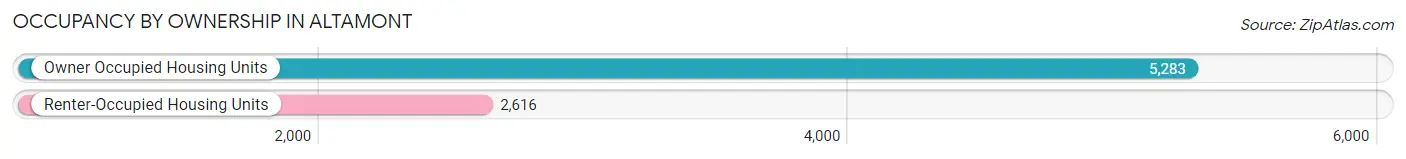
| Occupancy | # Housing Units | % Housing Units |
| Owner Occupied Housing Units | 5,283 | 66.9% |
| Renter-Occupied Housing Units | 2,616 | 33.1% |
| Total Occupied Housing Units | 7,899 | 100.0% |
Occupancy by Household Size in Altamont
| Household Size | # Housing Units | % Housing Units |
| 1-Person Household | 2,219 | 28.1% |
| 2-Person Household | 2,879 | 36.4% |
| 3-Person Household | 915 | 11.6% |
| 4+ Person Household | 1,886 | 23.9% |
| Total Housing Units | 7,899 | 100.0% |
Occupancy by Ownership by Household Size in Altamont
| Household Size | Owner-occupied | Renter-occupied |
| 1-Person Household | 1,403 (63.2%) | 816 (36.8%) |
| 2-Person Household | 1,993 (69.2%) | 886 (30.8%) |
| 3-Person Household | 564 (61.6%) | 351 (38.4%) |
| 4+ Person Household | 1,323 (70.2%) | 563 (29.8%) |
| Total Housing Units | 5,283 (66.9%) | 2,616 (33.1%) |
Occupancy by Educational Attainment in Altamont
| Household Size | Owner-occupied | Renter-occupied |
| Less than High School | 435 (66.7%) | 217 (33.3%) |
| High School Diploma | 1,752 (64.5%) | 965 (35.5%) |
| College/Associate Degree | 1,893 (63.7%) | 1,080 (36.3%) |
| Bachelor's Degree or higher | 1,203 (77.3%) | 354 (22.7%) |
Occupancy by Age of Householder in Altamont
| Age Bracket | # Households | % Households |
| Under 35 Years | 1,413 | 17.9% |
| 35 to 44 Years | 1,242 | 15.7% |
| 45 to 54 Years | 962 | 12.2% |
| 55 to 64 Years | 1,499 | 19.0% |
| 65 to 74 Years | 1,664 | 21.1% |
| 75 to 84 Years | 809 | 10.2% |
| 85 Years and Over | 310 | 3.9% |
| Total | 7,899 | 100.0% |
Housing Finances in Altamont
Median Income by Occupancy in Altamont
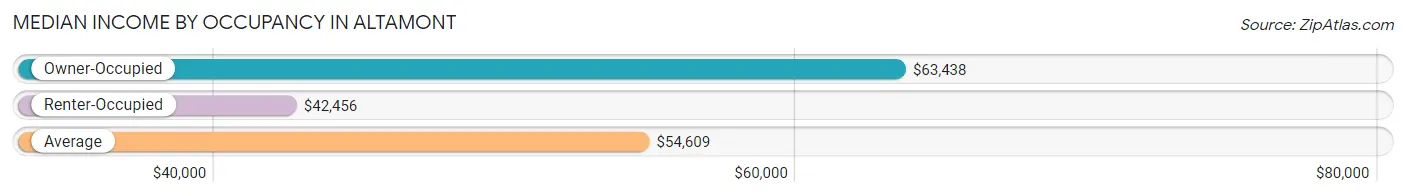
| Occupancy Type | # Households | Median Income |
| Owner-Occupied | 5,283 (66.9%) | $63,438 |
| Renter-Occupied | 2,616 (33.1%) | $42,456 |
| Average | 7,899 (100.0%) | $54,609 |
Occupancy by Householder Income Bracket in Altamont
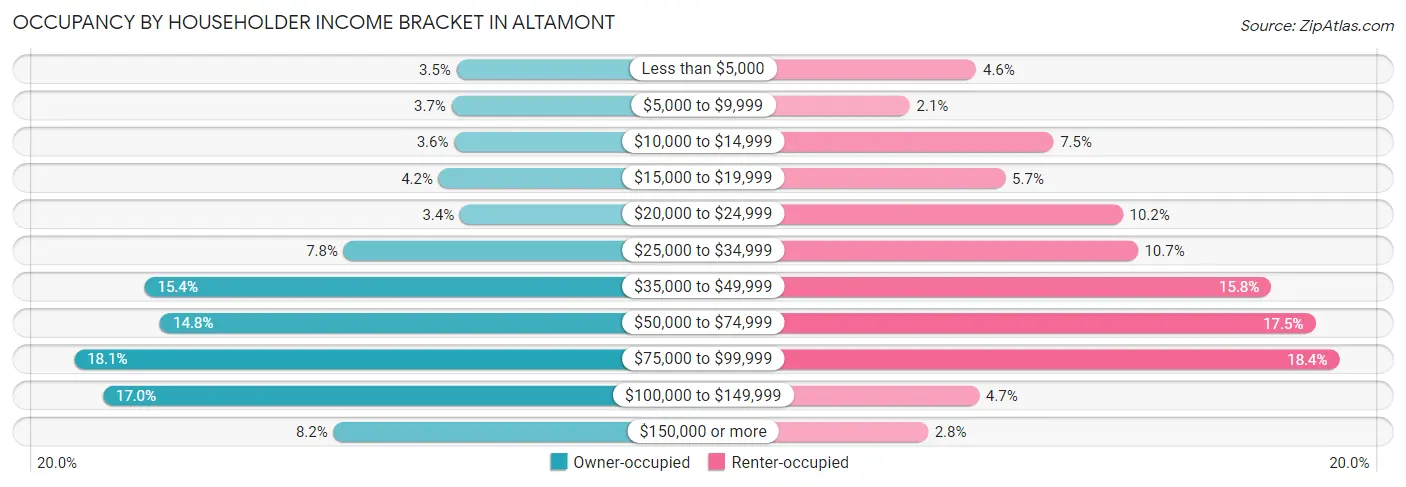
| Income Bracket | Owner-occupied | Renter-occupied |
| Less than $5,000 | 187 (3.5%) | 120 (4.6%) |
| $5,000 to $9,999 | 197 (3.7%) | 54 (2.1%) |
| $10,000 to $14,999 | 192 (3.6%) | 197 (7.5%) |
| $15,000 to $19,999 | 223 (4.2%) | 149 (5.7%) |
| $20,000 to $24,999 | 180 (3.4%) | 266 (10.2%) |
| $25,000 to $34,999 | 414 (7.8%) | 281 (10.7%) |
| $35,000 to $49,999 | 815 (15.4%) | 414 (15.8%) |
| $50,000 to $74,999 | 784 (14.8%) | 458 (17.5%) |
| $75,000 to $99,999 | 957 (18.1%) | 482 (18.4%) |
| $100,000 to $149,999 | 899 (17.0%) | 123 (4.7%) |
| $150,000 or more | 435 (8.2%) | 72 (2.8%) |
| Total | 5,283 (100.0%) | 2,616 (100.0%) |
Monthly Housing Cost Tiers in Altamont
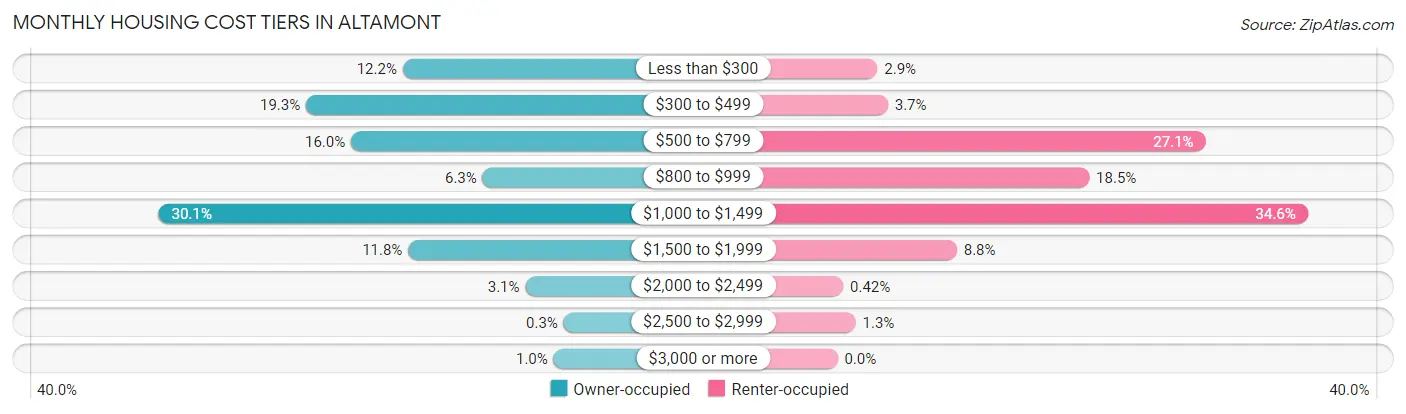
| Monthly Cost | Owner-occupied | Renter-occupied |
| Less than $300 | 642 (12.1%) | 77 (2.9%) |
| $300 to $499 | 1,018 (19.3%) | 97 (3.7%) |
| $500 to $799 | 843 (16.0%) | 709 (27.1%) |
| $800 to $999 | 331 (6.3%) | 485 (18.5%) |
| $1,000 to $1,499 | 1,592 (30.1%) | 906 (34.6%) |
| $1,500 to $1,999 | 621 (11.7%) | 230 (8.8%) |
| $2,000 to $2,499 | 165 (3.1%) | 11 (0.4%) |
| $2,500 to $2,999 | 16 (0.3%) | 35 (1.3%) |
| $3,000 or more | 55 (1.0%) | 0 (0.0%) |
| Total | 5,283 (100.0%) | 2,616 (100.0%) |
Physical Housing Characteristics in Altamont
Housing Structures in Altamont
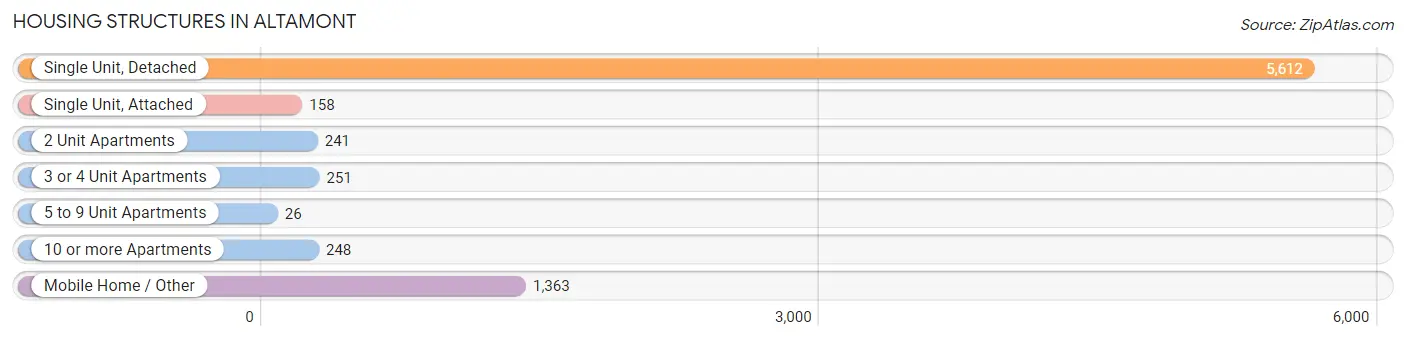
| Structure Type | # Housing Units | % Housing Units |
| Single Unit, Detached | 5,612 | 71.1% |
| Single Unit, Attached | 158 | 2.0% |
| 2 Unit Apartments | 241 | 3.0% |
| 3 or 4 Unit Apartments | 251 | 3.2% |
| 5 to 9 Unit Apartments | 26 | 0.3% |
| 10 or more Apartments | 248 | 3.1% |
| Mobile Home / Other | 1,363 | 17.3% |
| Total | 7,899 | 100.0% |
Housing Structures by Occupancy in Altamont
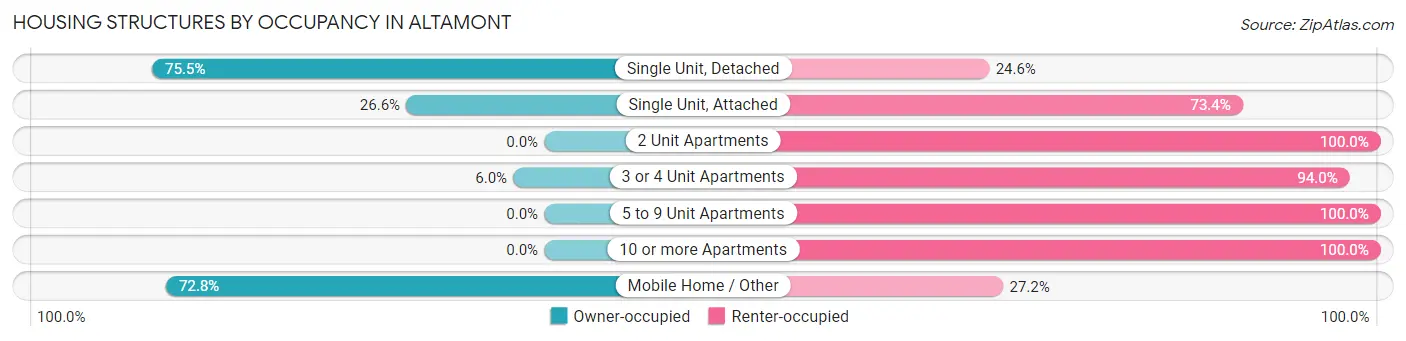
| Structure Type | Owner-occupied | Renter-occupied |
| Single Unit, Detached | 4,234 (75.4%) | 1,378 (24.5%) |
| Single Unit, Attached | 42 (26.6%) | 116 (73.4%) |
| 2 Unit Apartments | 0 (0.0%) | 241 (100.0%) |
| 3 or 4 Unit Apartments | 15 (6.0%) | 236 (94.0%) |
| 5 to 9 Unit Apartments | 0 (0.0%) | 26 (100.0%) |
| 10 or more Apartments | 0 (0.0%) | 248 (100.0%) |
| Mobile Home / Other | 992 (72.8%) | 371 (27.2%) |
| Total | 5,283 (66.9%) | 2,616 (33.1%) |
Housing Structures by Number of Rooms in Altamont
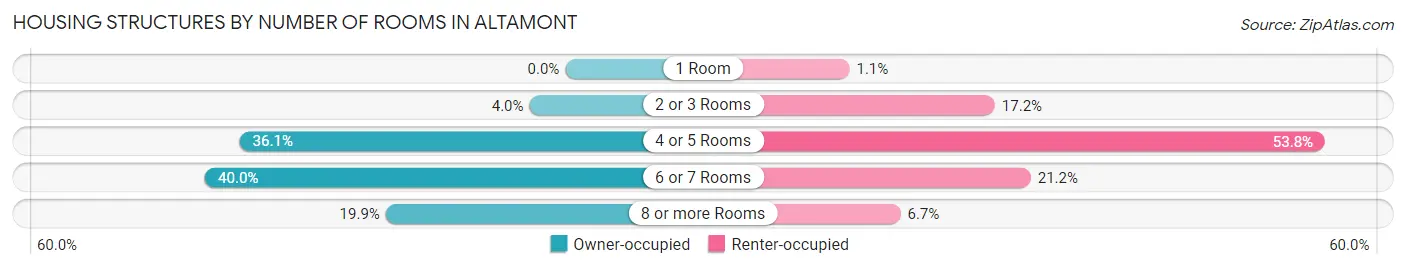
| Number of Rooms | Owner-occupied | Renter-occupied |
| 1 Room | 0 (0.0%) | 28 (1.1%) |
| 2 or 3 Rooms | 210 (4.0%) | 450 (17.2%) |
| 4 or 5 Rooms | 1,909 (36.1%) | 1,408 (53.8%) |
| 6 or 7 Rooms | 2,111 (40.0%) | 554 (21.2%) |
| 8 or more Rooms | 1,053 (19.9%) | 176 (6.7%) |
| Total | 5,283 (100.0%) | 2,616 (100.0%) |
Housing Structure by Heating Type in Altamont
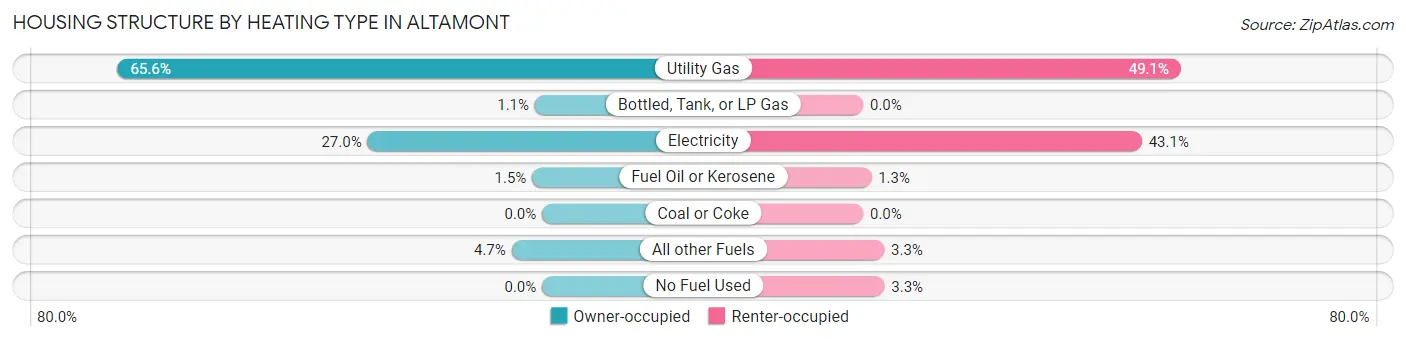
| Heating Type | Owner-occupied | Renter-occupied |
| Utility Gas | 3,468 (65.6%) | 1,285 (49.1%) |
| Bottled, Tank, or LP Gas | 59 (1.1%) | 0 (0.0%) |
| Electricity | 1,426 (27.0%) | 1,127 (43.1%) |
| Fuel Oil or Kerosene | 81 (1.5%) | 33 (1.3%) |
| Coal or Coke | 0 (0.0%) | 0 (0.0%) |
| All other Fuels | 249 (4.7%) | 85 (3.3%) |
| No Fuel Used | 0 (0.0%) | 86 (3.3%) |
| Total | 5,283 (100.0%) | 2,616 (100.0%) |
Household Vehicle Usage in Altamont
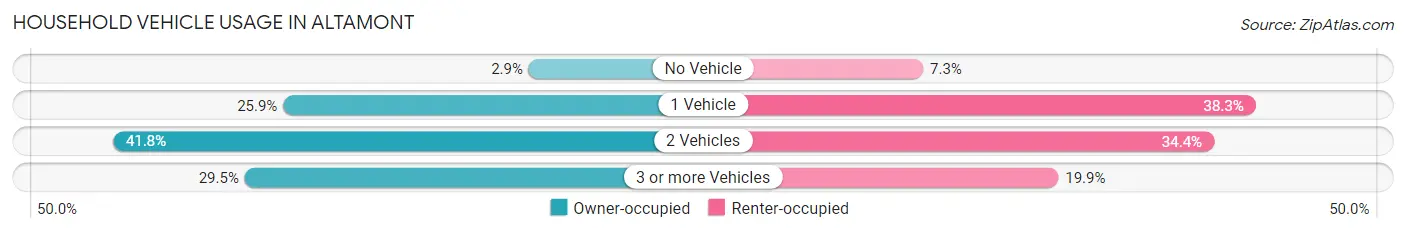
| Vehicles per Household | Owner-occupied | Renter-occupied |
| No Vehicle | 155 (2.9%) | 191 (7.3%) |
| 1 Vehicle | 1,366 (25.9%) | 1,003 (38.3%) |
| 2 Vehicles | 2,206 (41.8%) | 901 (34.4%) |
| 3 or more Vehicles | 1,556 (29.4%) | 521 (19.9%) |
| Total | 5,283 (100.0%) | 2,616 (100.0%) |
Real Estate & Mortgages in Altamont
Real Estate and Mortgage Overview in Altamont
| Characteristic | Without Mortgage | With Mortgage |
| Housing Units | 2,330 | 2,953 |
| Median Property Value | $178,900 | $221,400 |
| Median Household Income | $47,910 | $328 |
| Monthly Housing Costs | $391 | $55 |
| Real Estate Taxes | $1,243 | $0 |
Property Value by Mortgage Status in Altamont
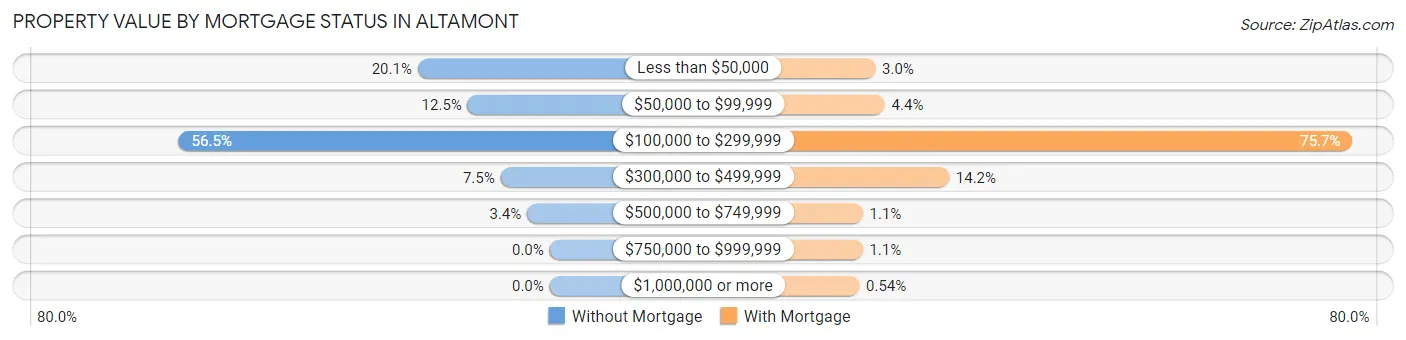
| Property Value | Without Mortgage | With Mortgage |
| Less than $50,000 | 468 (20.1%) | 88 (3.0%) |
| $50,000 to $99,999 | 291 (12.5%) | 131 (4.4%) |
| $100,000 to $299,999 | 1,317 (56.5%) | 2,235 (75.7%) |
| $300,000 to $499,999 | 174 (7.5%) | 420 (14.2%) |
| $500,000 to $749,999 | 80 (3.4%) | 32 (1.1%) |
| $750,000 to $999,999 | 0 (0.0%) | 31 (1.1%) |
| $1,000,000 or more | 0 (0.0%) | 16 (0.5%) |
| Total | 2,330 (100.0%) | 2,953 (100.0%) |
Household Income by Mortgage Status in Altamont
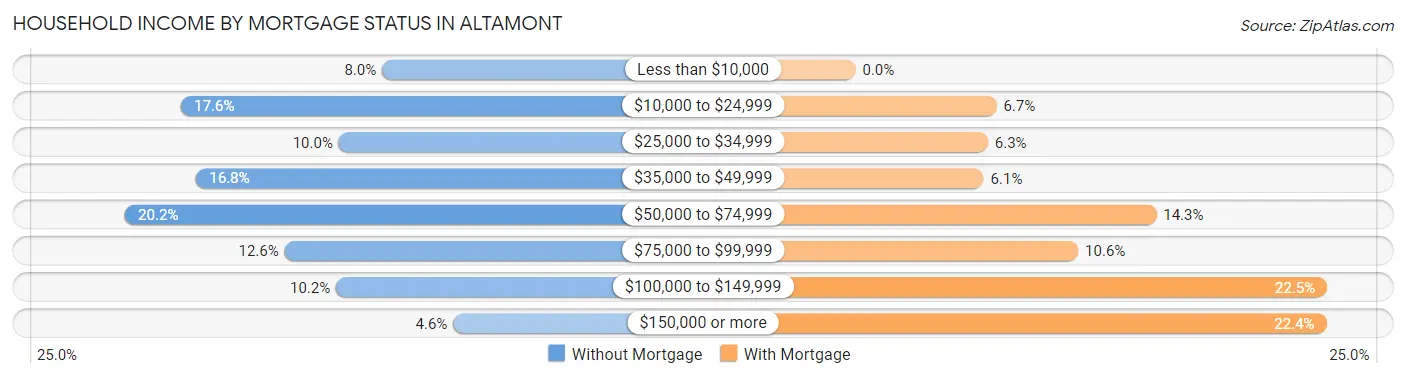
| Household Income | Without Mortgage | With Mortgage |
| Less than $10,000 | 186 (8.0%) | 0 (0.0%) |
| $10,000 to $24,999 | 409 (17.5%) | 198 (6.7%) |
| $25,000 to $34,999 | 234 (10.0%) | 186 (6.3%) |
| $35,000 to $49,999 | 392 (16.8%) | 180 (6.1%) |
| $50,000 to $74,999 | 471 (20.2%) | 423 (14.3%) |
| $75,000 to $99,999 | 294 (12.6%) | 313 (10.6%) |
| $100,000 to $149,999 | 237 (10.2%) | 663 (22.5%) |
| $150,000 or more | 107 (4.6%) | 662 (22.4%) |
| Total | 2,330 (100.0%) | 2,953 (100.0%) |
Property Value to Household Income Ratio in Altamont
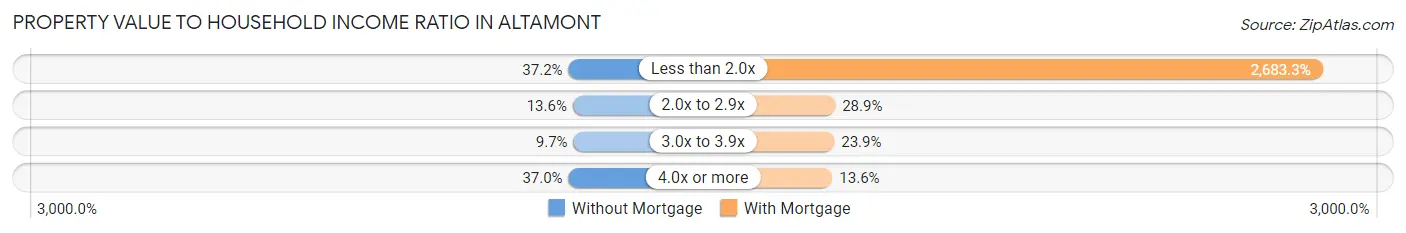
| Value-to-Income Ratio | Without Mortgage | With Mortgage |
| Less than 2.0x | 867 (37.2%) | 79,239 (2,683.3%) |
| 2.0x to 2.9x | 316 (13.6%) | 854 (28.9%) |
| 3.0x to 3.9x | 226 (9.7%) | 705 (23.9%) |
| 4.0x or more | 861 (36.9%) | 400 (13.6%) |
| Total | 2,330 (100.0%) | 2,953 (100.0%) |
Real Estate Taxes by Mortgage Status in Altamont
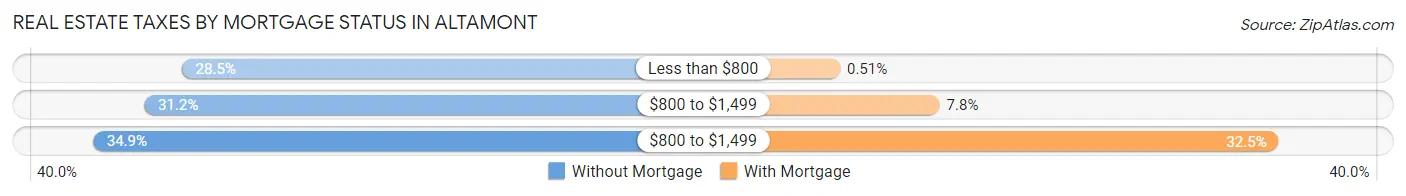
| Property Taxes | Without Mortgage | With Mortgage |
| Less than $800 | 663 (28.4%) | 15 (0.5%) |
| $800 to $1,499 | 727 (31.2%) | 230 (7.8%) |
| $800 to $1,499 | 814 (34.9%) | 961 (32.5%) |
| Total | 2,330 (100.0%) | 2,953 (100.0%) |
Health & Disability in Altamont
Health Insurance Coverage by Age in Altamont
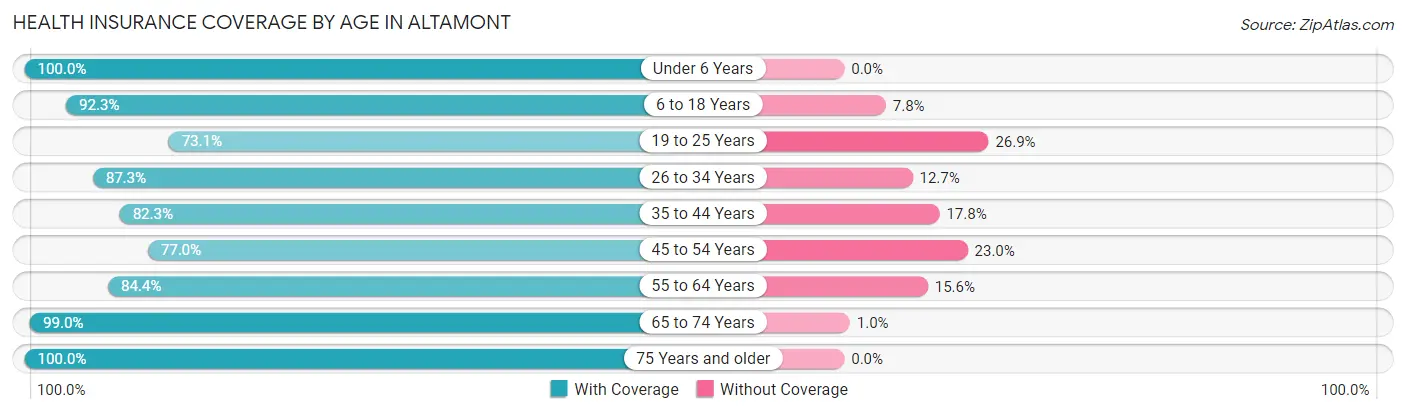
| Age Bracket | With Coverage | Without Coverage |
| Under 6 Years | 2,036 (100.0%) | 0 (0.0%) |
| 6 to 18 Years | 3,192 (92.2%) | 268 (7.7%) |
| 19 to 25 Years | 944 (73.1%) | 347 (26.9%) |
| 26 to 34 Years | 2,353 (87.3%) | 343 (12.7%) |
| 35 to 44 Years | 1,761 (82.3%) | 380 (17.7%) |
| 45 to 54 Years | 1,310 (77.0%) | 391 (23.0%) |
| 55 to 64 Years | 2,212 (84.4%) | 408 (15.6%) |
| 65 to 74 Years | 2,467 (99.0%) | 26 (1.0%) |
| 75 Years and older | 1,651 (100.0%) | 0 (0.0%) |
| Total | 17,926 (89.2%) | 2,163 (10.8%) |
Health Insurance Coverage by Citizenship Status in Altamont
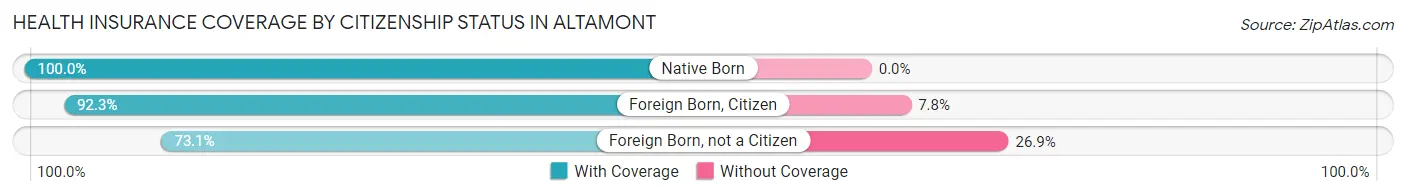
| Citizenship Status | With Coverage | Without Coverage |
| Native Born | 2,036 (100.0%) | 0 (0.0%) |
| Foreign Born, Citizen | 3,192 (92.2%) | 268 (7.7%) |
| Foreign Born, not a Citizen | 944 (73.1%) | 347 (26.9%) |
Health Insurance Coverage by Household Income in Altamont
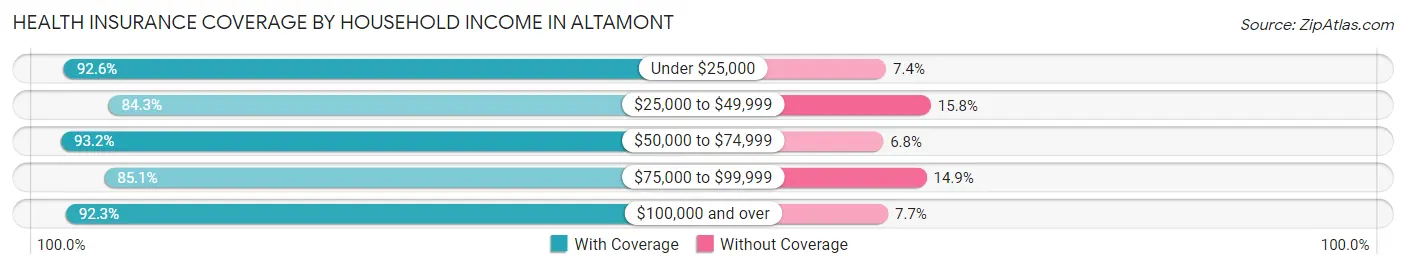
| Household Income | With Coverage | Without Coverage |
| Under $25,000 | 2,967 (92.6%) | 236 (7.4%) |
| $25,000 to $49,999 | 3,979 (84.3%) | 744 (15.8%) |
| $50,000 to $74,999 | 2,947 (93.2%) | 216 (6.8%) |
| $75,000 to $99,999 | 3,325 (85.1%) | 584 (14.9%) |
| $100,000 and over | 4,567 (92.3%) | 383 (7.7%) |
Public vs Private Health Insurance Coverage by Age in Altamont
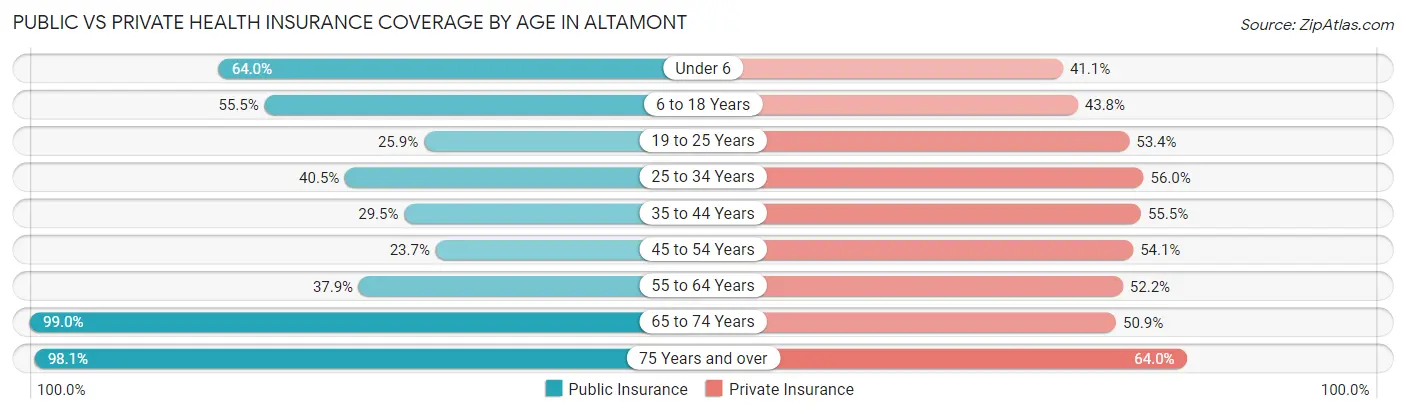
| Age Bracket | Public Insurance | Private Insurance |
| Under 6 | 1,302 (63.9%) | 836 (41.1%) |
| 6 to 18 Years | 1,919 (55.5%) | 1,516 (43.8%) |
| 19 to 25 Years | 334 (25.9%) | 689 (53.4%) |
| 25 to 34 Years | 1,092 (40.5%) | 1,510 (56.0%) |
| 35 to 44 Years | 632 (29.5%) | 1,189 (55.5%) |
| 45 to 54 Years | 403 (23.7%) | 920 (54.1%) |
| 55 to 64 Years | 994 (37.9%) | 1,367 (52.2%) |
| 65 to 74 Years | 2,467 (99.0%) | 1,269 (50.9%) |
| 75 Years and over | 1,620 (98.1%) | 1,056 (64.0%) |
| Total | 10,763 (53.6%) | 10,352 (51.5%) |
Disability Status by Sex by Age in Altamont
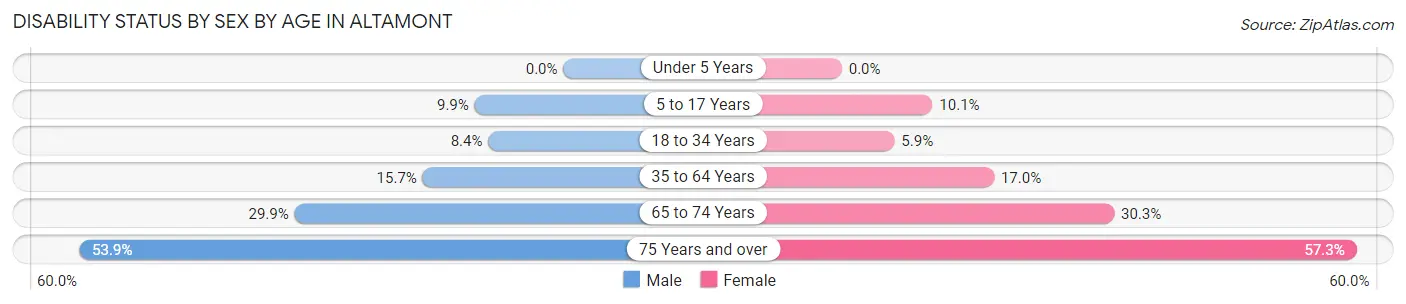
| Age Bracket | Male | Female |
| Under 5 Years | 0 (0.0%) | 0 (0.0%) |
| 5 to 17 Years | 184 (9.9%) | 193 (10.1%) |
| 18 to 34 Years | 159 (8.4%) | 137 (5.9%) |
| 35 to 64 Years | 492 (15.7%) | 563 (17.0%) |
| 65 to 74 Years | 379 (29.9%) | 372 (30.3%) |
| 75 Years and over | 356 (53.9%) | 568 (57.3%) |
Disability Class by Sex by Age in Altamont
Disability Class: Hearing Difficulty
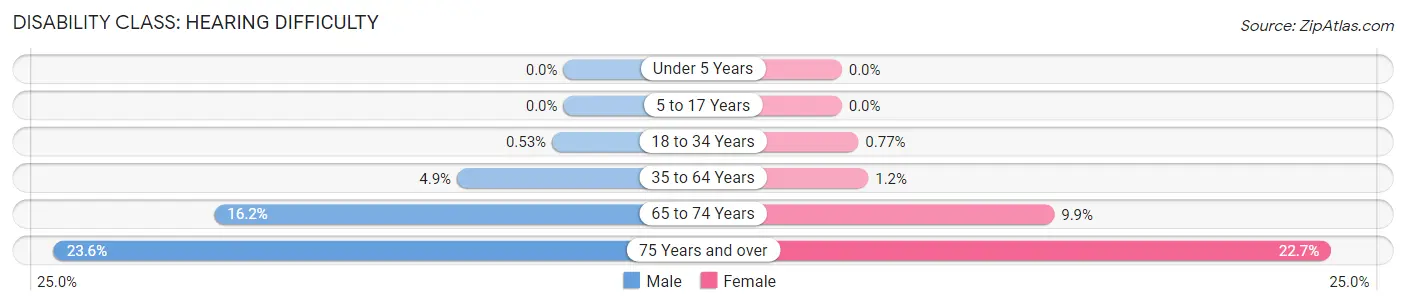
| Age Bracket | Male | Female |
| Under 5 Years | 0 (0.0%) | 0 (0.0%) |
| 5 to 17 Years | 0 (0.0%) | 0 (0.0%) |
| 18 to 34 Years | 10 (0.5%) | 18 (0.8%) |
| 35 to 64 Years | 155 (4.9%) | 41 (1.2%) |
| 65 to 74 Years | 205 (16.2%) | 121 (9.9%) |
| 75 Years and over | 156 (23.6%) | 225 (22.7%) |
Disability Class: Vision Difficulty
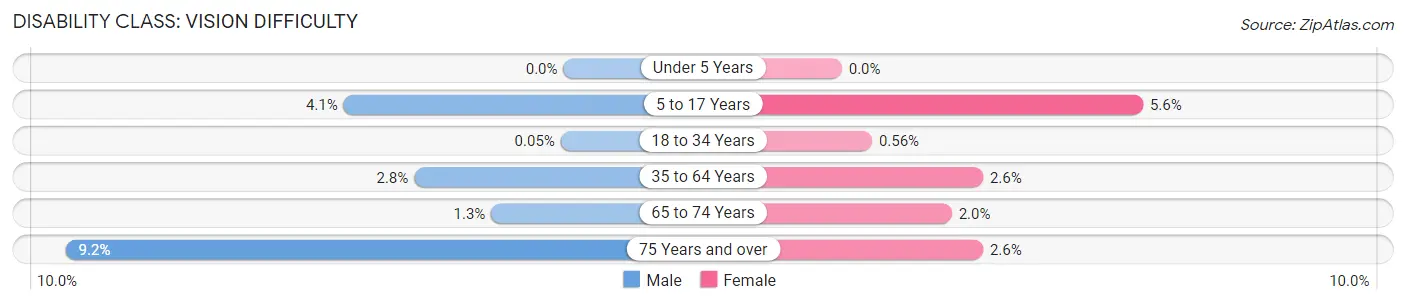
| Age Bracket | Male | Female |
| Under 5 Years | 0 (0.0%) | 0 (0.0%) |
| 5 to 17 Years | 76 (4.1%) | 107 (5.6%) |
| 18 to 34 Years | 1 (0.1%) | 13 (0.6%) |
| 35 to 64 Years | 87 (2.8%) | 87 (2.6%) |
| 65 to 74 Years | 17 (1.3%) | 25 (2.0%) |
| 75 Years and over | 61 (9.2%) | 26 (2.6%) |
Disability Class: Cognitive Difficulty
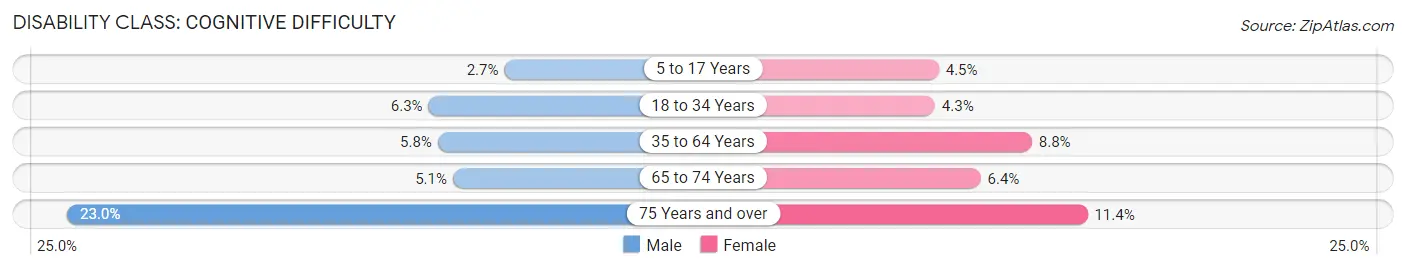
| Age Bracket | Male | Female |
| 5 to 17 Years | 51 (2.7%) | 86 (4.5%) |
| 18 to 34 Years | 119 (6.3%) | 101 (4.3%) |
| 35 to 64 Years | 183 (5.8%) | 293 (8.8%) |
| 65 to 74 Years | 65 (5.1%) | 79 (6.4%) |
| 75 Years and over | 152 (23.0%) | 113 (11.4%) |
Disability Class: Ambulatory Difficulty
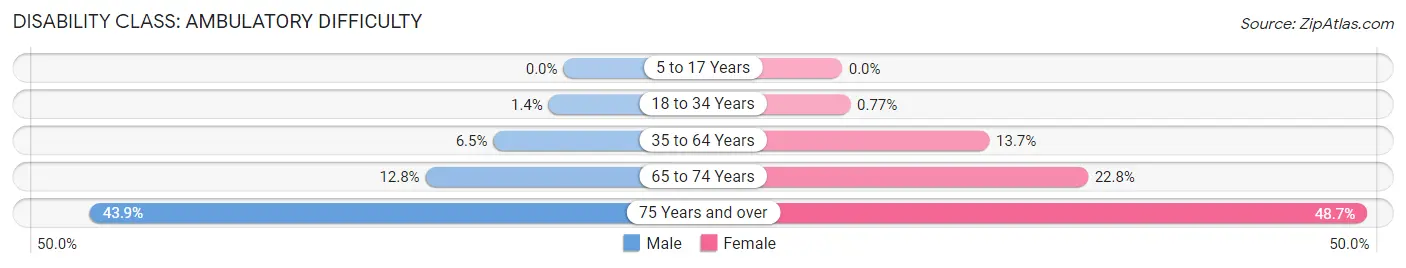
| Age Bracket | Male | Female |
| 5 to 17 Years | 0 (0.0%) | 0 (0.0%) |
| 18 to 34 Years | 26 (1.4%) | 18 (0.8%) |
| 35 to 64 Years | 204 (6.5%) | 454 (13.7%) |
| 65 to 74 Years | 162 (12.8%) | 280 (22.8%) |
| 75 Years and over | 290 (43.9%) | 483 (48.7%) |
Disability Class: Self-Care Difficulty
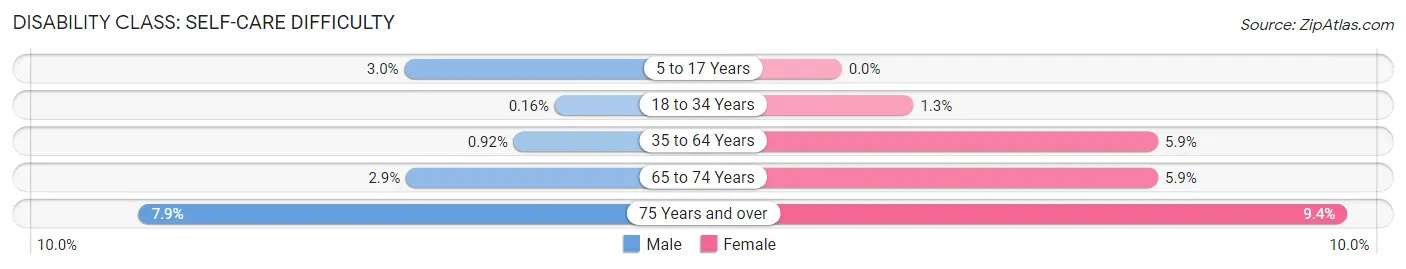
| Age Bracket | Male | Female |
| 5 to 17 Years | 55 (2.9%) | 0 (0.0%) |
| 18 to 34 Years | 3 (0.2%) | 31 (1.3%) |
| 35 to 64 Years | 29 (0.9%) | 195 (5.9%) |
| 65 to 74 Years | 37 (2.9%) | 72 (5.9%) |
| 75 Years and over | 52 (7.9%) | 93 (9.4%) |
Technology Access in Altamont
Computing Device Access in Altamont
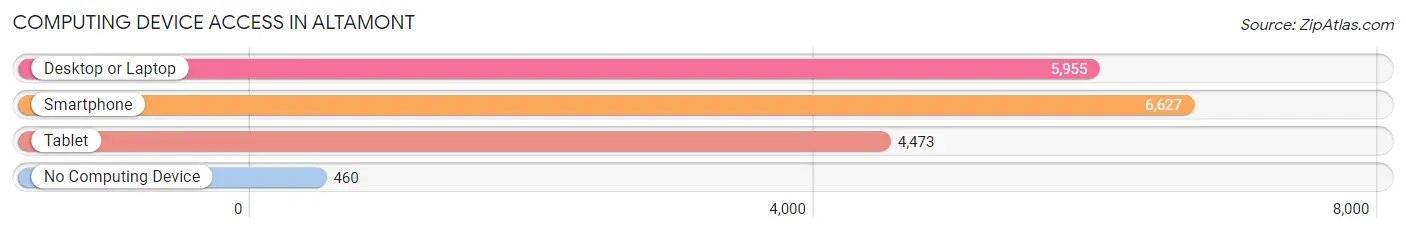
| Device Type | # Households | % Households |
| Desktop or Laptop | 5,955 | 75.4% |
| Smartphone | 6,627 | 83.9% |
| Tablet | 4,473 | 56.6% |
| No Computing Device | 460 | 5.8% |
| Total | 7,899 | 100.0% |
Internet Access in Altamont
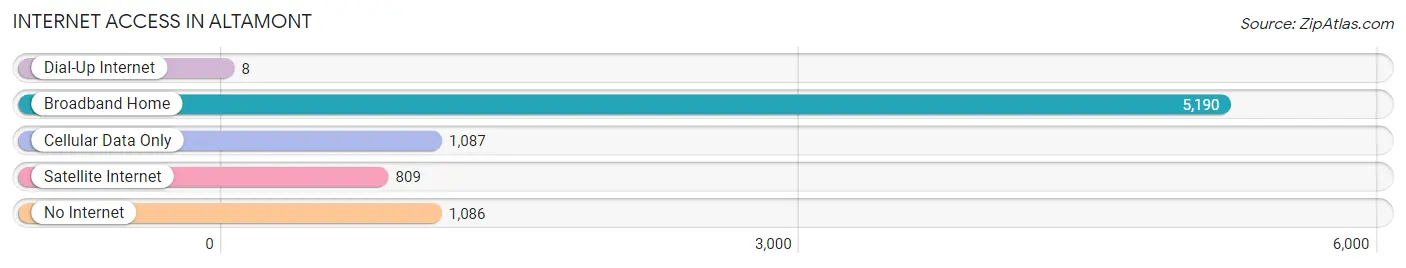
| Internet Type | # Households | % Households |
| Dial-Up Internet | 8 | 0.1% |
| Broadband Home | 5,190 | 65.7% |
| Cellular Data Only | 1,087 | 13.8% |
| Satellite Internet | 809 | 10.2% |
| No Internet | 1,086 | 13.8% |
| Total | 7,899 | 100.0% |
Altamont Summary
Altamont, Oregon is a small city located in the eastern part of the state, in Umatilla County. It is situated on the banks of the Umatilla River, and is surrounded by rolling hills and farmland. The city has a population of approximately 1,500 people, and is a popular destination for outdoor recreation and relaxation.
History
The area that is now Altamont was first settled in the late 1800s by homesteaders. The town was originally known as “Umatilla City”, and was later renamed “Altamont” in honor of the nearby mountain range. The city was officially incorporated in 1909, and has remained a small, rural community ever since.
Geography
Altamont is located in the eastern part of Oregon, in Umatilla County. It is situated on the banks of the Umatilla River, and is surrounded by rolling hills and farmland. The city is located at an elevation of 1,890 feet, and has a total area of 1.2 square miles.
Economy
The economy of Altamont is largely based on agriculture and tourism. The city is home to several farms and ranches, and is a popular destination for outdoor recreation and relaxation. The city also has a small manufacturing sector, and is home to several small businesses.
Demographics
As of the 2010 census, the population of Altamont was 1,500 people. The racial makeup of the city was 94.2% White, 0.7% African American, 0.7% Native American, 0.7% Asian, 0.7% from other races, and 2.7% from two or more races. The median household income was $37,500, and the median family income was $41,250. The per capita income was $17,500.
Conclusion
Altamont, Oregon is a small city located in the eastern part of the state, in Umatilla County. It is situated on the banks of the Umatilla River, and is surrounded by rolling hills and farmland. The city has a population of approximately 1,500 people, and is a popular destination for outdoor recreation and relaxation. The economy of Altamont is largely based on agriculture and tourism, and the city is home to several small businesses. The racial makeup of the city is predominantly White, with a small percentage of African American, Native American, and Asian residents. The median household income is $37,500, and the median family income is $41,250.
Common Questions
What is Per Capita Income in Altamont?
Per Capita income in Altamont is $26,772.
What is the Median Family Income in Altamont?
Median Family Income in Altamont is $63,979.
What is the Median Household income in Altamont?
Median Household Income in Altamont is $54,609.
What is Income or Wage Gap in Altamont?
Income or Wage Gap in Altamont is 41.7%.
Women in Altamont earn 58.3 cents for every dollar earned by a man.
What is Family Income Deficit in Altamont?
Family Income Deficit in Altamont is $13,436.
Families that are below poverty line in Altamont earn $13,436 less on average than the poverty threshold level.
What is Inequality or Gini Index in Altamont?
Inequality or Gini Index in Altamont is 0.42.
What is the Total Population of Altamont?
Total Population of Altamont is 20,345.
What is the Total Male Population of Altamont?
Total Male Population of Altamont is 9,653.
What is the Total Female Population of Altamont?
Total Female Population of Altamont is 10,692.
What is the Ratio of Males per 100 Females in Altamont?
There are 90.28 Males per 100 Females in Altamont.
What is the Ratio of Females per 100 Males in Altamont?
There are 110.76 Females per 100 Males in Altamont.
What is the Median Population Age in Altamont?
Median Population Age in Altamont is 36.8 Years.
What is the Average Family Size in Altamont
Average Family Size in Altamont is 3.1 People.
What is the Average Household Size in Altamont
Average Household Size in Altamont is 2.6 People.
How Large is the Labor Force in Altamont?
There are 8,135 People in the Labor Forcein in Altamont.
What is the Percentage of People in the Labor Force in Altamont?
52.6% of People are in the Labor Force in Altamont.
What is the Unemployment Rate in Altamont?
Unemployment Rate in Altamont is 9.2%.