Lexington, OR Map & Demographics
Lexington Map
Lexington Overview
$25,301
PER CAPITA INCOME
$39,063
AVG FAMILY INCOME
$38,906
AVG HOUSEHOLD INCOME
16.7%
WAGE / INCOME GAP [ % ]
83.3¢/ $1
WAGE / INCOME GAP [ $ ]
0.36
INEQUALITY / GINI INDEX
140
TOTAL POPULATION
80
MALE POPULATION
60
FEMALE POPULATION
133.33
MALES / 100 FEMALES
75.00
FEMALES / 100 MALES
53.9
MEDIAN AGE
2.8
AVG FAMILY SIZE
2.0
AVG HOUSEHOLD SIZE
53
LABOR FORCE [ PEOPLE ]
46.1%
PERCENT IN LABOR FORCE
3.8%
UNEMPLOYMENT RATE
Lexington Zip Codes
Lexington Area Codes
Income in Lexington
Income Overview in Lexington
Per Capita Income in Lexington is $25,301, while median incomes of families and households are $39,063 and $38,906 respectively.
| Characteristic | Number | Measure |
| Per Capita Income | 140 | $25,301 |
| Median Family Income | 37 | $39,063 |
| Mean Family Income | 37 | $59,824 |
| Median Household Income | 69 | $38,906 |
| Mean Household Income | 69 | $52,330 |
| Income Deficit | 37 | $0 |
| Wage / Income Gap (%) | 140 | 16.67% |
| Wage / Income Gap ($) | 140 | 83.33¢ per $1 |
| Gini / Inequality Index | 140 | 0.36 |
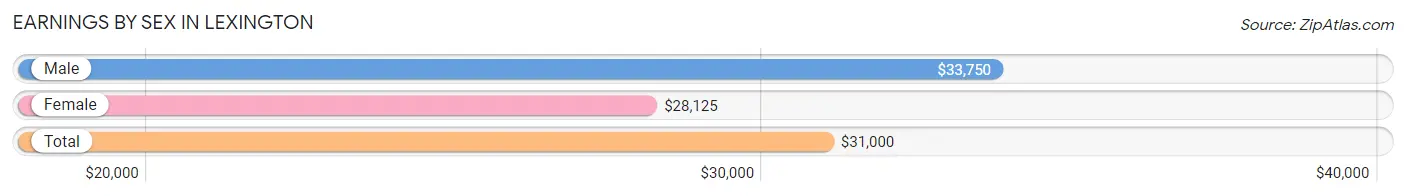
Earnings by Sex in Lexington
Average Earnings in Lexington are $31,000, $33,750 for men and $28,125 for women, a difference of 16.7%.
| Sex | Number | Average Earnings |
| Male | 34 (65.4%) | $33,750 |
| Female | 18 (34.6%) | $28,125 |
| Total | 52 (100.0%) | $31,000 |
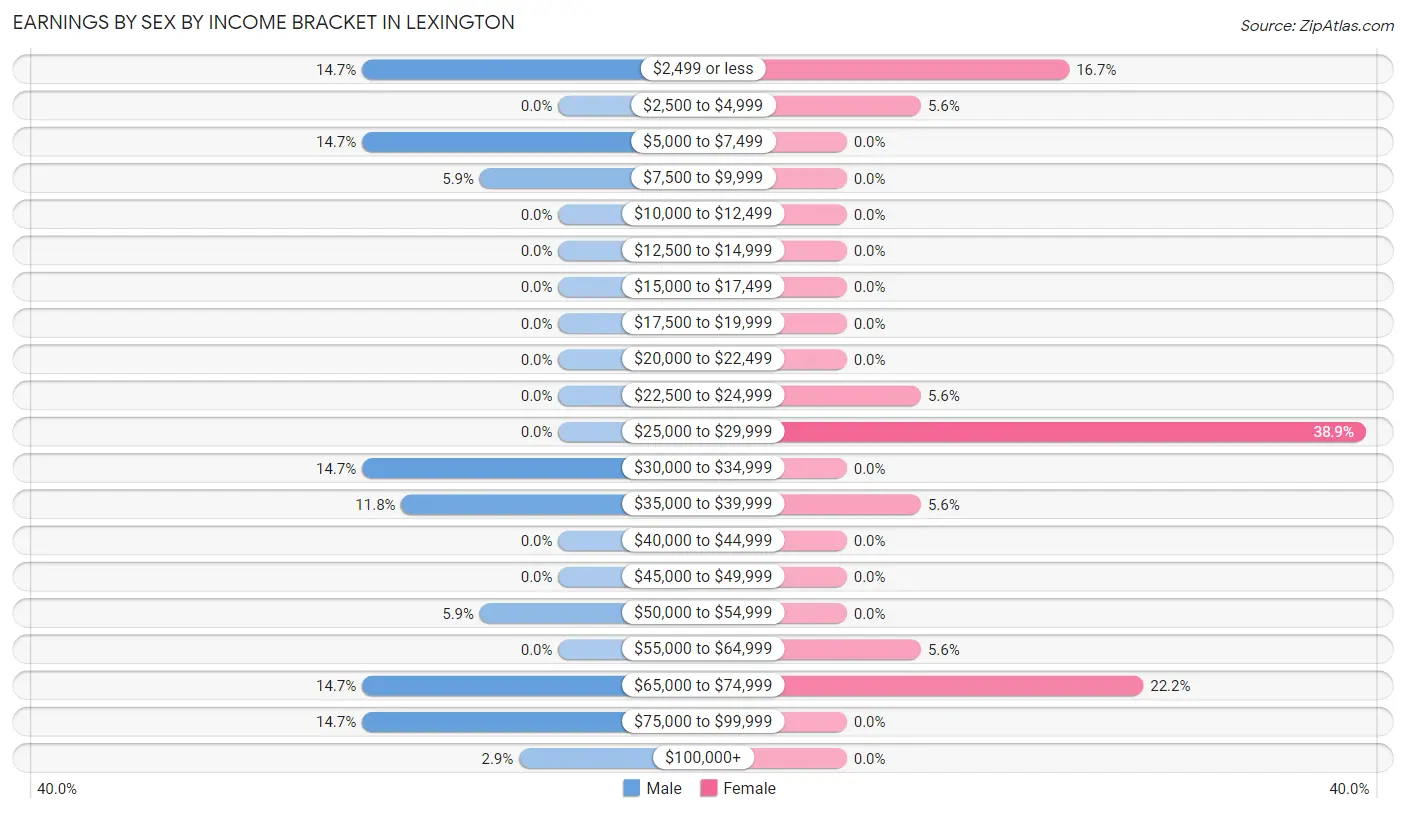
Earnings by Sex by Income Bracket in Lexington
The most common earnings brackets in Lexington are $2,499 or less for men (5 | 14.7%) and $25,000 to $29,999 for women (7 | 38.9%).
| Income | Male | Female |
| $2,499 or less | 5 (14.7%) | 3 (16.7%) |
| $2,500 to $4,999 | 0 (0.0%) | 1 (5.6%) |
| $5,000 to $7,499 | 5 (14.7%) | 0 (0.0%) |
| $7,500 to $9,999 | 2 (5.9%) | 0 (0.0%) |
| $10,000 to $12,499 | 0 (0.0%) | 0 (0.0%) |
| $12,500 to $14,999 | 0 (0.0%) | 0 (0.0%) |
| $15,000 to $17,499 | 0 (0.0%) | 0 (0.0%) |
| $17,500 to $19,999 | 0 (0.0%) | 0 (0.0%) |
| $20,000 to $22,499 | 0 (0.0%) | 0 (0.0%) |
| $22,500 to $24,999 | 0 (0.0%) | 1 (5.6%) |
| $25,000 to $29,999 | 0 (0.0%) | 7 (38.9%) |
| $30,000 to $34,999 | 5 (14.7%) | 0 (0.0%) |
| $35,000 to $39,999 | 4 (11.8%) | 1 (5.6%) |
| $40,000 to $44,999 | 0 (0.0%) | 0 (0.0%) |
| $45,000 to $49,999 | 0 (0.0%) | 0 (0.0%) |
| $50,000 to $54,999 | 2 (5.9%) | 0 (0.0%) |
| $55,000 to $64,999 | 0 (0.0%) | 1 (5.6%) |
| $65,000 to $74,999 | 5 (14.7%) | 4 (22.2%) |
| $75,000 to $99,999 | 5 (14.7%) | 0 (0.0%) |
| $100,000+ | 1 (2.9%) | 0 (0.0%) |
| Total | 34 (100.0%) | 18 (100.0%) |
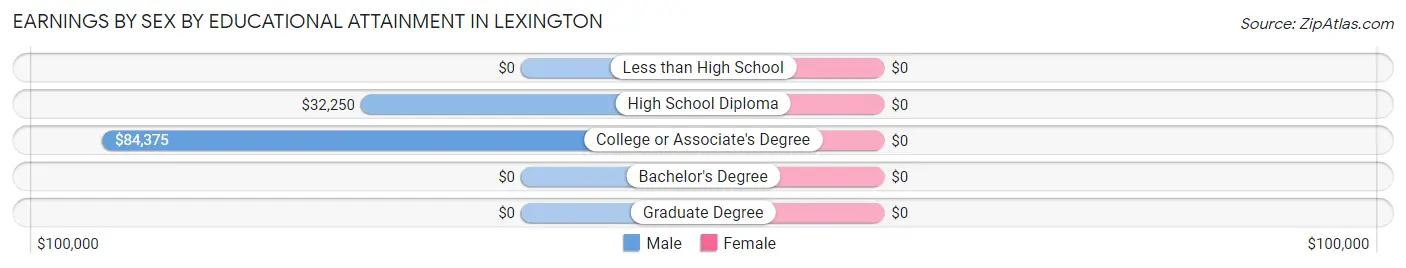
Earnings by Sex by Educational Attainment in Lexington
| Educational Attainment | Male Income | Female Income |
| Less than High School | - | - |
| High School Diploma | $32,250 | $0 |
| College or Associate's Degree | $84,375 | $0 |
| Bachelor's Degree | - | - |
| Graduate Degree | - | - |
| Total | - | - |
Family Income in Lexington
Family Income Brackets in Lexington
According to the Lexington family income data, there are 13 families falling into the $35,000 to $49,999 income range, which is the most common income bracket and makes up 35.1% of all families.
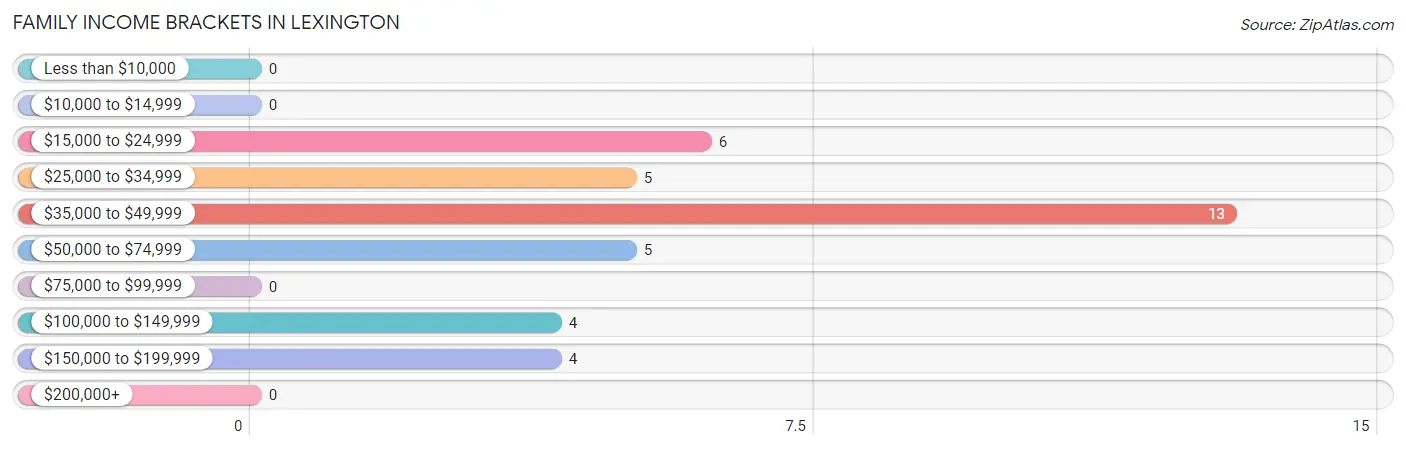
| Income Bracket | # Families | % Families |
| Less than $10,000 | 0 | 0.0% |
| $10,000 to $14,999 | 0 | 0.0% |
| $15,000 to $24,999 | 6 | 16.2% |
| $25,000 to $34,999 | 5 | 13.5% |
| $35,000 to $49,999 | 13 | 35.1% |
| $50,000 to $74,999 | 5 | 13.5% |
| $75,000 to $99,999 | 0 | 0.0% |
| $100,000 to $149,999 | 4 | 10.8% |
| $150,000 to $199,999 | 4 | 10.8% |
| $200,000+ | 0 | 0.0% |
Family Income by Famaliy Size in Lexington
2-person families (29 | 78.4%) account for the highest median family income in Lexington with $36,750 per family, while 2-person families (29 | 78.4%) have the highest median income of $18,375 per family member.
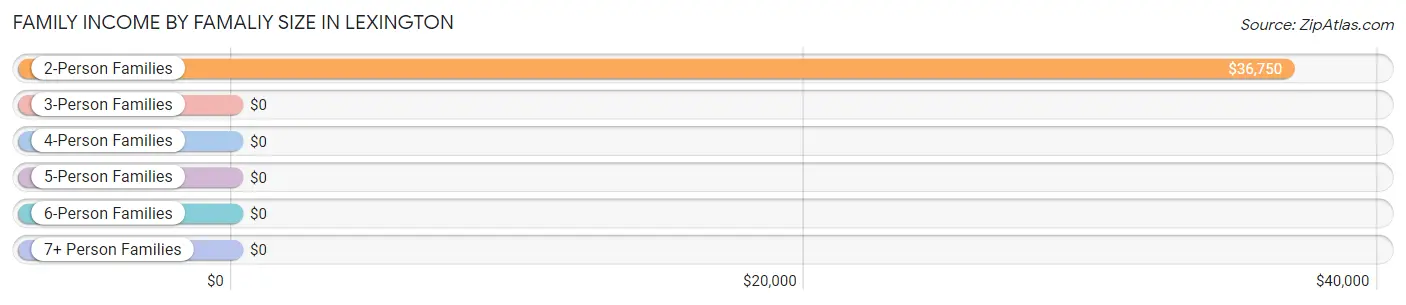
| Income Bracket | # Families | Median Income |
| 2-Person Families | 29 (78.4%) | $36,750 |
| 3-Person Families | 2 (5.4%) | $0 |
| 4-Person Families | 0 (0.0%) | $0 |
| 5-Person Families | 6 (16.2%) | $0 |
| 6-Person Families | 0 (0.0%) | $0 |
| 7+ Person Families | 0 (0.0%) | $0 |
| Total | 37 (100.0%) | $39,063 |
Family Income by Number of Earners in Lexington
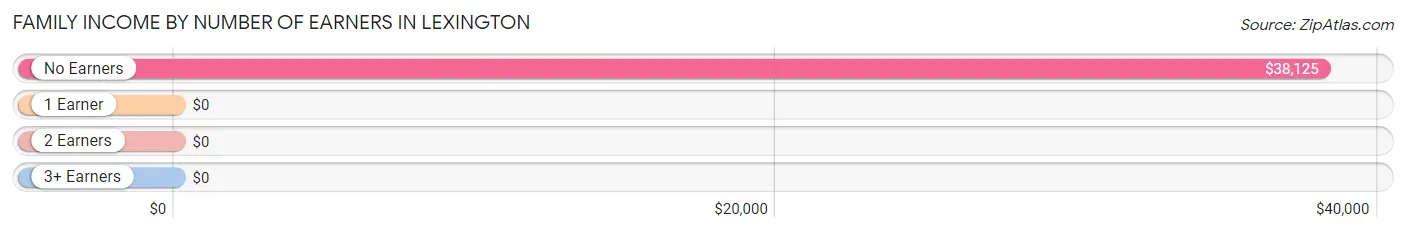
| Number of Earners | # Families | Median Income |
| No Earners | 14 (37.8%) | $38,125 |
| 1 Earner | 8 (21.6%) | $0 |
| 2 Earners | 14 (37.8%) | $0 |
| 3+ Earners | 1 (2.7%) | $0 |
| Total | 37 (100.0%) | $39,063 |
Household Income in Lexington
Household Income Brackets in Lexington
With 17 households falling in the category, the $15,000 to $24,999 income range is the most frequent in Lexington, accounting for 24.6% of all households.
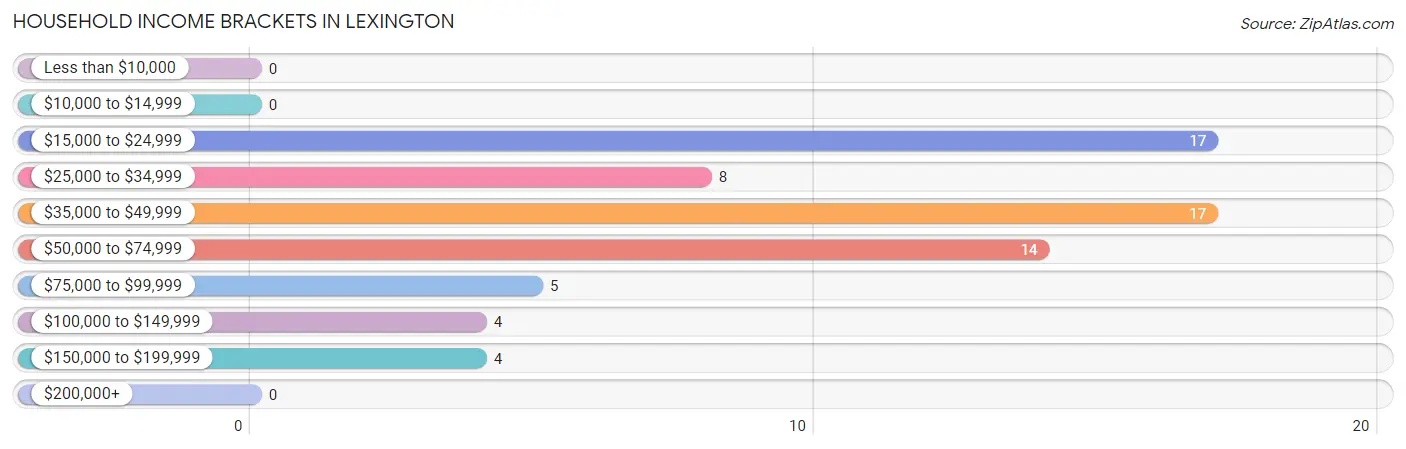
| Income Bracket | # Households | % Households |
| Less than $10,000 | 0 | 0.0% |
| $10,000 to $14,999 | 0 | 0.0% |
| $15,000 to $24,999 | 17 | 24.6% |
| $25,000 to $34,999 | 8 | 11.6% |
| $35,000 to $49,999 | 17 | 24.6% |
| $50,000 to $74,999 | 14 | 20.3% |
| $75,000 to $99,999 | 5 | 7.2% |
| $100,000 to $149,999 | 4 | 5.8% |
| $150,000 to $199,999 | 4 | 5.8% |
| $200,000+ | 0 | 0.0% |
Household Income by Householder Age in Lexington
The median household income in Lexington is $38,906, with the highest median household income of $63,125 found in the 25 to 44 years age bracket for the primary householder. A total of 12 households (17.4%) fall into this category.
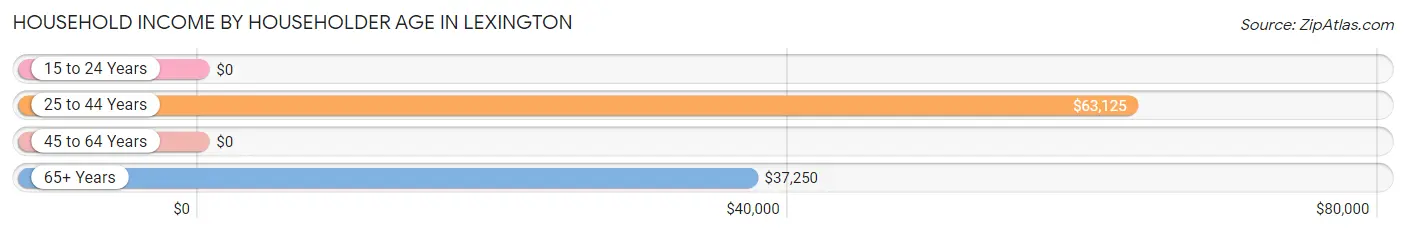
| Income Bracket | # Households | Median Income |
| 15 to 24 Years | 0 (0.0%) | $0 |
| 25 to 44 Years | 12 (17.4%) | $63,125 |
| 45 to 64 Years | 22 (31.9%) | $0 |
| 65+ Years | 35 (50.7%) | $37,250 |
| Total | 69 (100.0%) | $38,906 |
Poverty in Lexington
Income Below Poverty by Sex and Age in Lexington
With 1.3% poverty level for males and 6.7% for females among the residents of Lexington, 55 to 64 year old males and 25 to 34 year old females are the most vulnerable to poverty, with 1 males (5.6%) and 3 females (42.9%) in their respective age groups living below the poverty level.
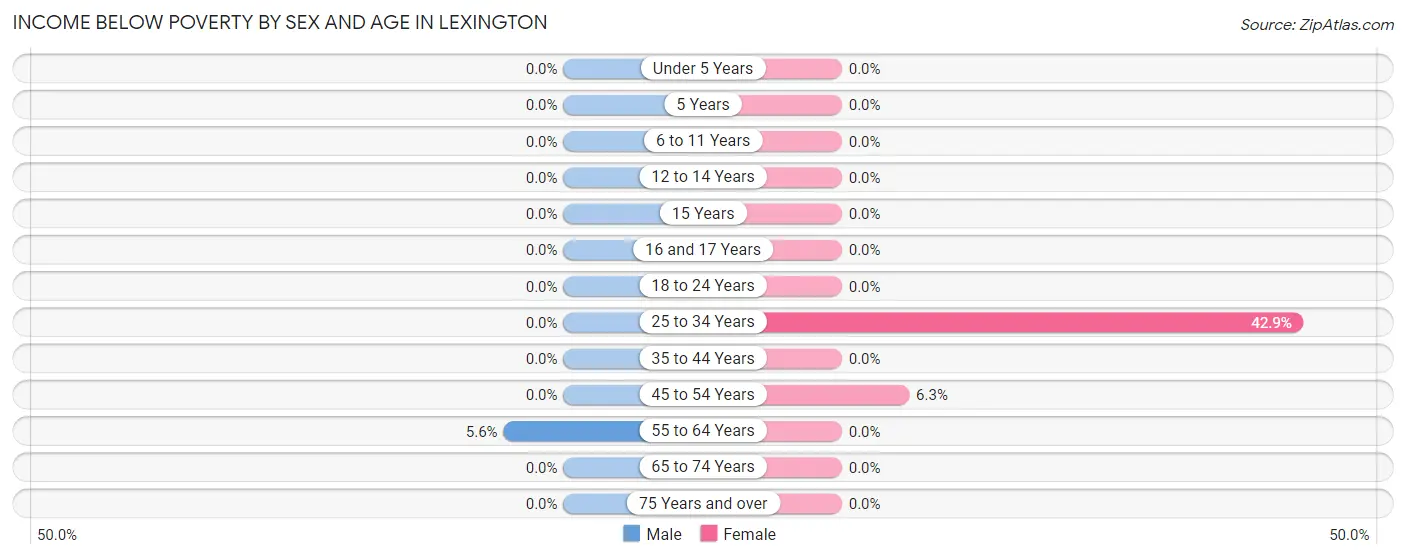
| Age Bracket | Male | Female |
| Under 5 Years | 0 (0.0%) | 0 (0.0%) |
| 5 Years | 0 (0.0%) | 0 (0.0%) |
| 6 to 11 Years | 0 (0.0%) | 0 (0.0%) |
| 12 to 14 Years | 0 (0.0%) | 0 (0.0%) |
| 15 Years | 0 (0.0%) | 0 (0.0%) |
| 16 and 17 Years | 0 (0.0%) | 0 (0.0%) |
| 18 to 24 Years | 0 (0.0%) | 0 (0.0%) |
| 25 to 34 Years | 0 (0.0%) | 3 (42.9%) |
| 35 to 44 Years | 0 (0.0%) | 0 (0.0%) |
| 45 to 54 Years | 0 (0.0%) | 1 (6.2%) |
| 55 to 64 Years | 1 (5.6%) | 0 (0.0%) |
| 65 to 74 Years | 0 (0.0%) | 0 (0.0%) |
| 75 Years and over | 0 (0.0%) | 0 (0.0%) |
| Total | 1 (1.3%) | 4 (6.7%) |
Income Above Poverty by Sex and Age in Lexington
According to the poverty statistics in Lexington, males aged under 5 years and females aged under 5 years are the age groups that are most secure financially, with 100.0% of males and 100.0% of females in these age groups living above the poverty line.
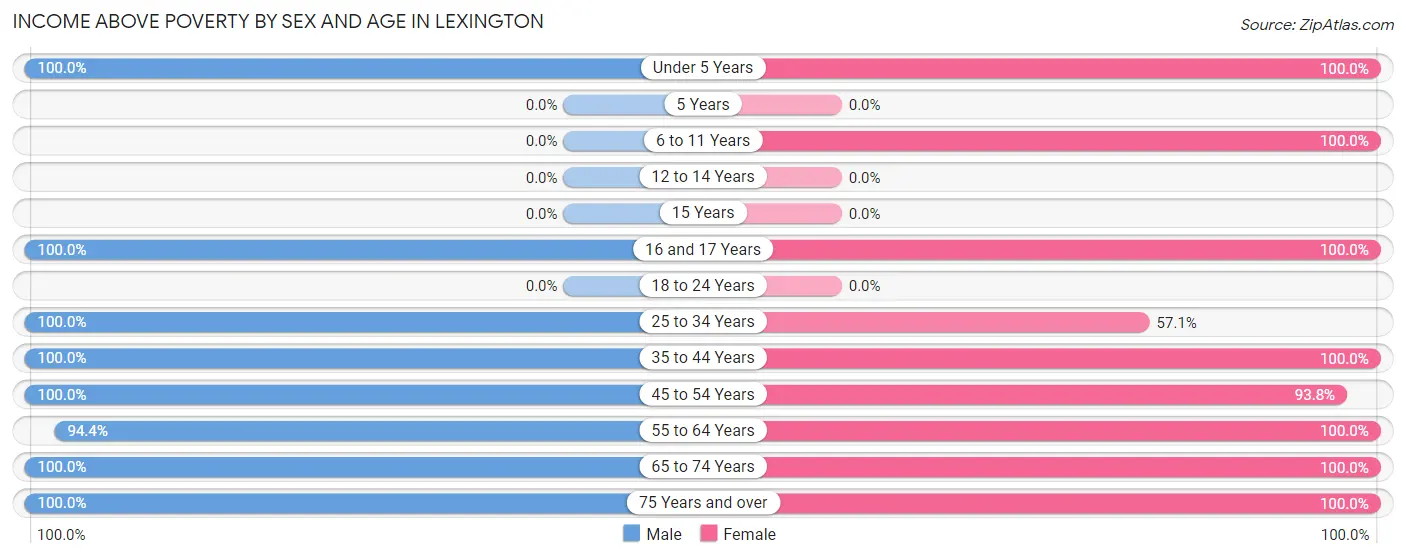
| Age Bracket | Male | Female |
| Under 5 Years | 11 (100.0%) | 6 (100.0%) |
| 5 Years | 0 (0.0%) | 0 (0.0%) |
| 6 to 11 Years | 0 (0.0%) | 8 (100.0%) |
| 12 to 14 Years | 0 (0.0%) | 0 (0.0%) |
| 15 Years | 0 (0.0%) | 0 (0.0%) |
| 16 and 17 Years | 5 (100.0%) | 1 (100.0%) |
| 18 to 24 Years | 0 (0.0%) | 0 (0.0%) |
| 25 to 34 Years | 2 (100.0%) | 4 (57.1%) |
| 35 to 44 Years | 10 (100.0%) | 6 (100.0%) |
| 45 to 54 Years | 4 (100.0%) | 15 (93.8%) |
| 55 to 64 Years | 17 (94.4%) | 5 (100.0%) |
| 65 to 74 Years | 13 (100.0%) | 7 (100.0%) |
| 75 Years and over | 17 (100.0%) | 4 (100.0%) |
| Total | 79 (98.8%) | 56 (93.3%) |
Income Below Poverty Among Married-Couple Families in Lexington
The poverty statistics for married-couple families in Lexington show that 3.1% or 1 of the total 32 families live below the poverty line. Families with no children have the highest poverty rate of 4.2%, comprising of 1 families. On the other hand, families with 1 or 2 children have the lowest poverty rate of 0.0%, which includes 0 families.
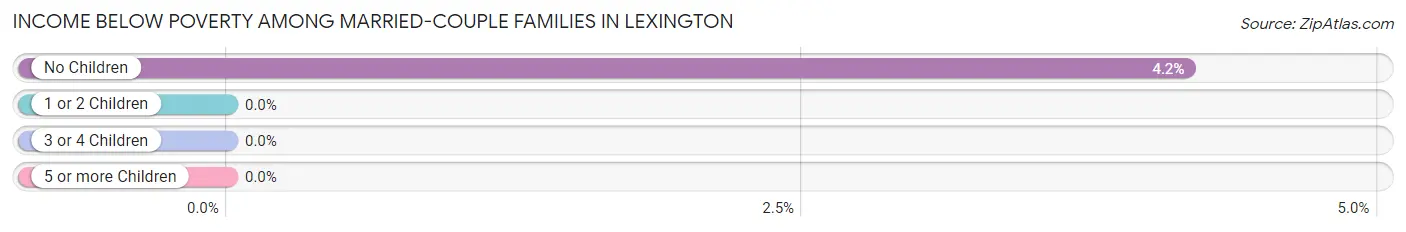
| Children | Above Poverty | Below Poverty |
| No Children | 23 (95.8%) | 1 (4.2%) |
| 1 or 2 Children | 2 (100.0%) | 0 (0.0%) |
| 3 or 4 Children | 6 (100.0%) | 0 (0.0%) |
| 5 or more Children | 0 (0.0%) | 0 (0.0%) |
| Total | 31 (96.9%) | 1 (3.1%) |
Income Below Poverty Among Single-Parent Households in Lexington
| Children | Single Father | Single Mother |
| No Children | 0 (0.0%) | 0 (0.0%) |
| 1 or 2 Children | 0 (0.0%) | 0 (0.0%) |
| 3 or 4 Children | 0 (0.0%) | 0 (0.0%) |
| 5 or more Children | 0 (0.0%) | 0 (0.0%) |
| Total | 0 (0.0%) | 0 (0.0%) |
Income Below Poverty Among Married-Couple vs Single-Parent Households in Lexington
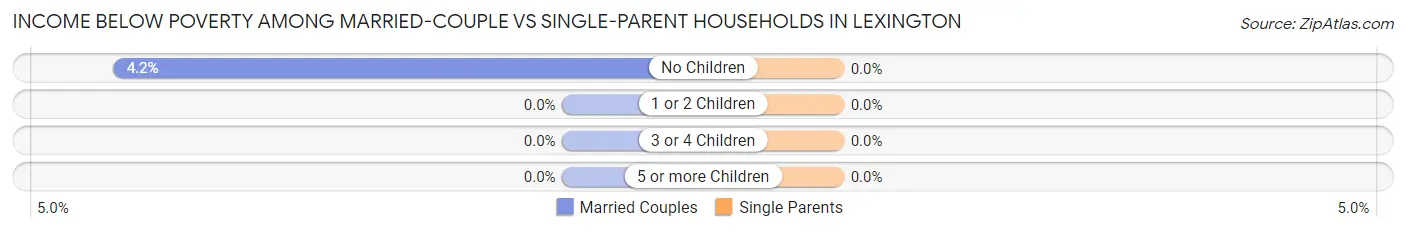
| Children | Married-Couple Families | Single-Parent Households |
| No Children | 1 (4.2%) | 0 (0.0%) |
| 1 or 2 Children | 0 (0.0%) | 0 (0.0%) |
| 3 or 4 Children | 0 (0.0%) | 0 (0.0%) |
| 5 or more Children | 0 (0.0%) | 0 (0.0%) |
| Total | 1 (3.1%) | 0 (0.0%) |
Race in Lexington
The most populous races in Lexington are White / Caucasian (127 | 90.7%), and Two or more Races (13 | 9.3%).
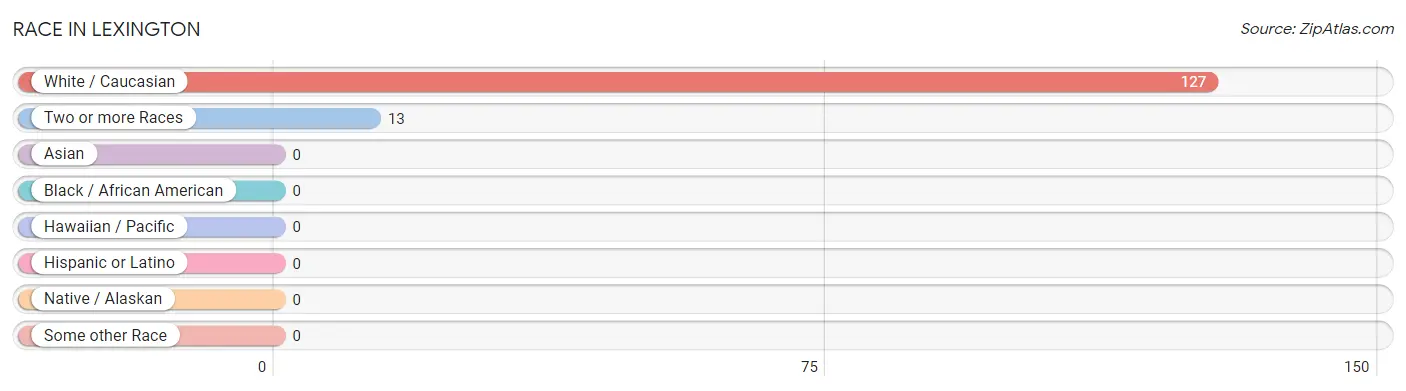
| Race | # Population | % Population |
| Asian | 0 | 0.0% |
| Black / African American | 0 | 0.0% |
| Hawaiian / Pacific | 0 | 0.0% |
| Hispanic or Latino | 0 | 0.0% |
| Native / Alaskan | 0 | 0.0% |
| White / Caucasian | 127 | 90.7% |
| Two or more Races | 13 | 9.3% |
| Some other Race | 0 | 0.0% |
| Total | 140 | 100.0% |
Ancestry in Lexington
The most populous ancestries reported in Lexington are Irish (47 | 33.6%), German (36 | 25.7%), English (30 | 21.4%), British (6 | 4.3%), and Scottish (5 | 3.6%), together accounting for 88.6% of all Lexington residents.
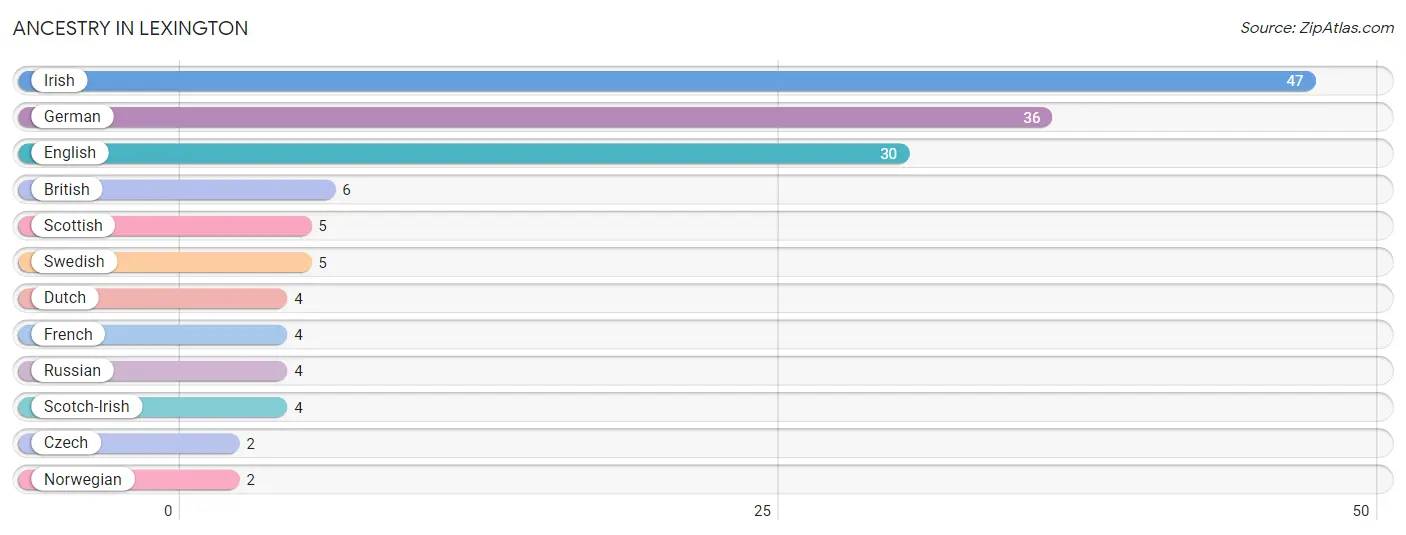
| Ancestry | # Population | % Population |
| British | 6 | 4.3% |
| Czech | 2 | 1.4% |
| Dutch | 4 | 2.9% |
| English | 30 | 21.4% |
| French | 4 | 2.9% |
| German | 36 | 25.7% |
| Irish | 47 | 33.6% |
| Norwegian | 2 | 1.4% |
| Russian | 4 | 2.9% |
| Scotch-Irish | 4 | 2.9% |
| Scottish | 5 | 3.6% |
| Swedish | 5 | 3.6% | View All 12 Rows |
Immigrants in Lexington

| Immigration Origin | # Population | % Population | View All 0 Rows |
Sex and Age in Lexington
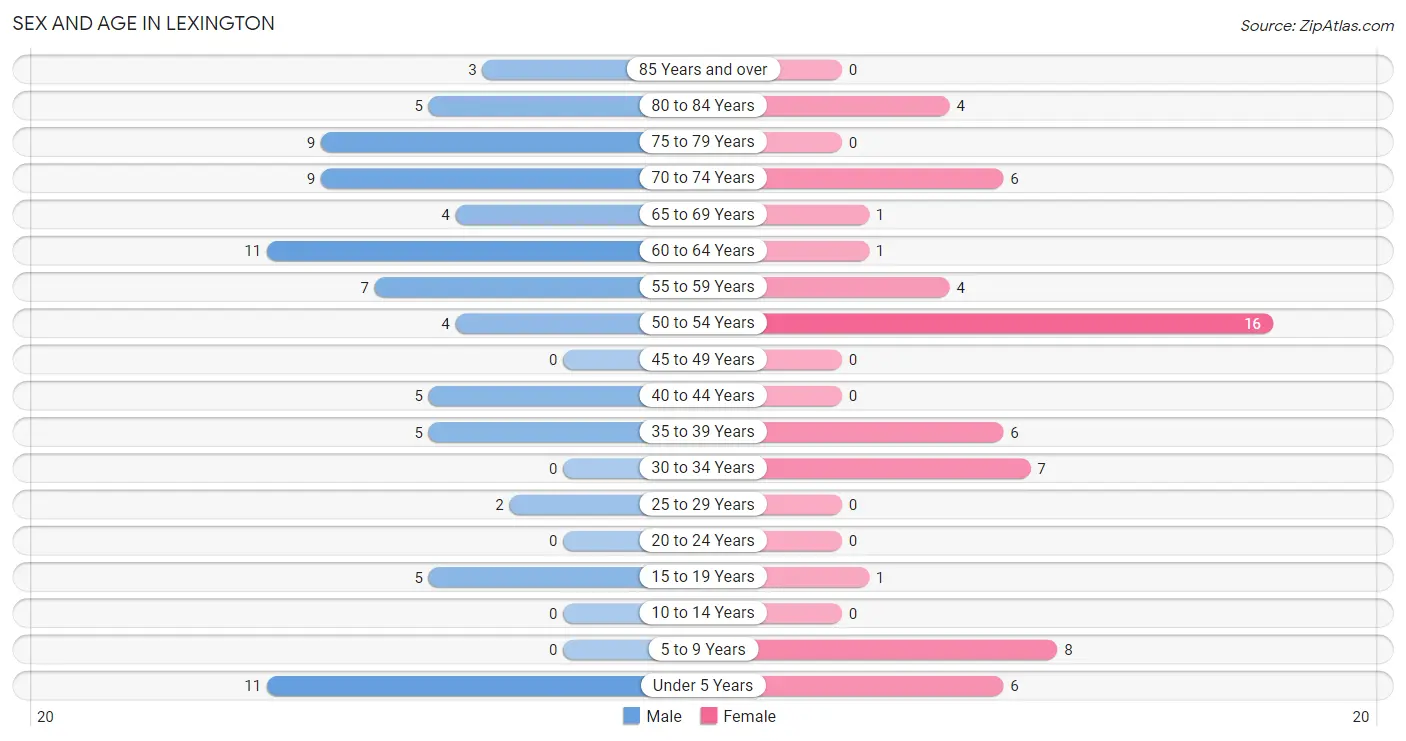
Sex and Age in Lexington
The most populous age groups in Lexington are Under 5 Years (11 | 13.8%) for men and 50 to 54 Years (16 | 26.7%) for women.
| Age Bracket | Male | Female |
| Under 5 Years | 11 (13.8%) | 6 (10.0%) |
| 5 to 9 Years | 0 (0.0%) | 8 (13.3%) |
| 10 to 14 Years | 0 (0.0%) | 0 (0.0%) |
| 15 to 19 Years | 5 (6.2%) | 1 (1.7%) |
| 20 to 24 Years | 0 (0.0%) | 0 (0.0%) |
| 25 to 29 Years | 2 (2.5%) | 0 (0.0%) |
| 30 to 34 Years | 0 (0.0%) | 7 (11.7%) |
| 35 to 39 Years | 5 (6.2%) | 6 (10.0%) |
| 40 to 44 Years | 5 (6.2%) | 0 (0.0%) |
| 45 to 49 Years | 0 (0.0%) | 0 (0.0%) |
| 50 to 54 Years | 4 (5.0%) | 16 (26.7%) |
| 55 to 59 Years | 7 (8.7%) | 4 (6.7%) |
| 60 to 64 Years | 11 (13.8%) | 1 (1.7%) |
| 65 to 69 Years | 4 (5.0%) | 1 (1.7%) |
| 70 to 74 Years | 9 (11.3%) | 6 (10.0%) |
| 75 to 79 Years | 9 (11.3%) | 0 (0.0%) |
| 80 to 84 Years | 5 (6.2%) | 4 (6.7%) |
| 85 Years and over | 3 (3.7%) | 0 (0.0%) |
| Total | 80 (100.0%) | 60 (100.0%) |
Families and Households in Lexington
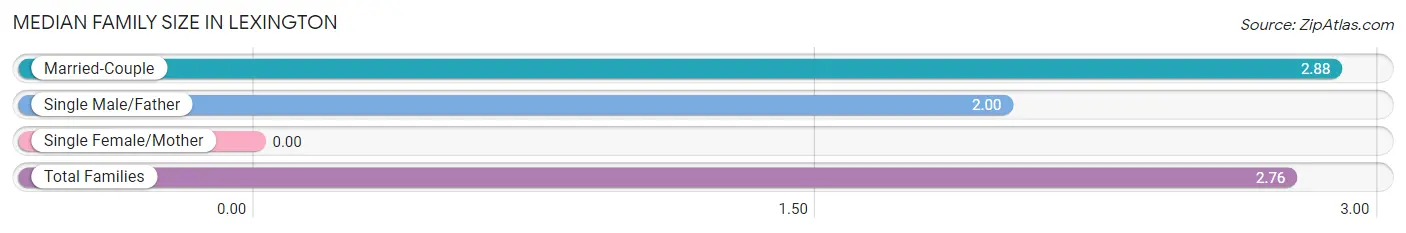
Median Family Size in Lexington
| Family Type | # Families | Family Size |
| Married-Couple | 32 (86.5%) | 2.88 |
| Single Male/Father | 5 (13.5%) | 2.00 |
| Single Female/Mother | 0 (0.0%) | - |
| Total Families | 37 (100.0%) | 2.76 |
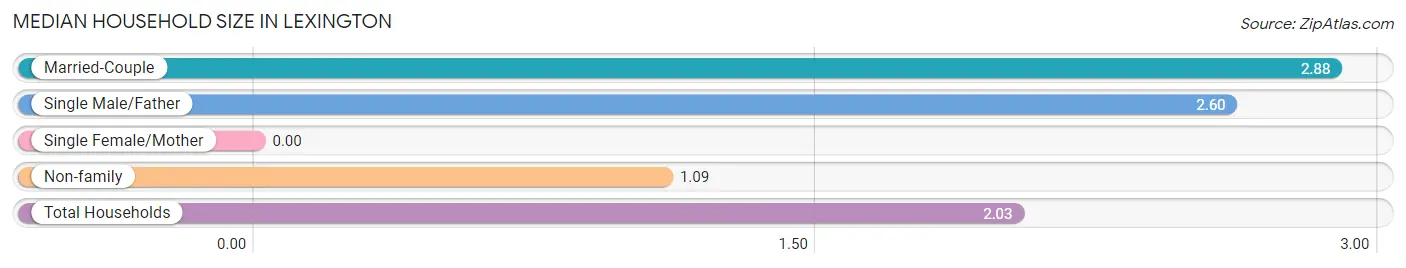
Median Household Size in Lexington
| Household Type | # Households | Household Size |
| Married-Couple | 32 (46.4%) | 2.88 |
| Single Male/Father | 5 (7.2%) | 2.60 |
| Single Female/Mother | 0 (0.0%) | - |
| Non-family | 32 (46.4%) | 1.09 |
| Total Households | 69 (100.0%) | 2.03 |
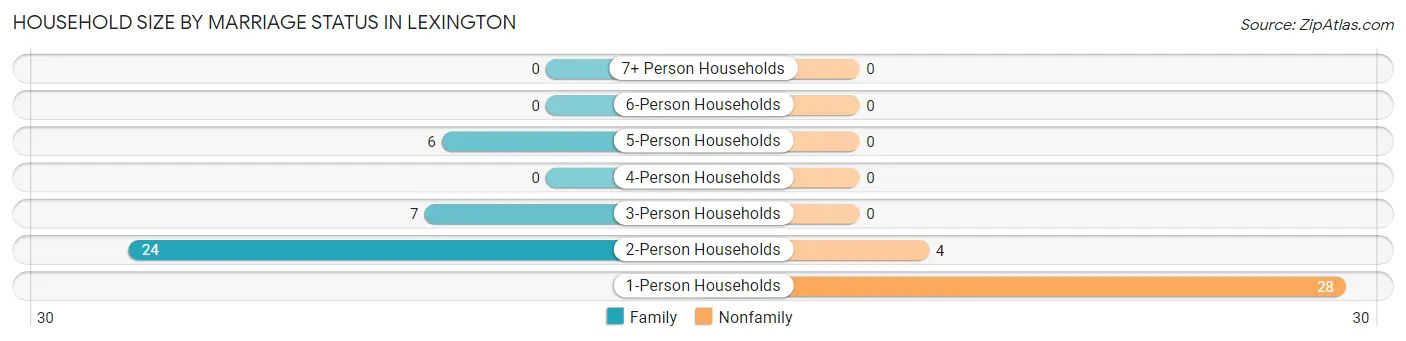
Household Size by Marriage Status in Lexington
Out of a total of 69 households in Lexington, 37 (53.6%) are family households, while 32 (46.4%) are nonfamily households. The most numerous type of family households are 2-person households, comprising 24, and the most common type of nonfamily households are 1-person households, comprising 28.
| Household Size | Family Households | Nonfamily Households |
| 1-Person Households | - | 28 (40.6%) |
| 2-Person Households | 24 (34.8%) | 4 (5.8%) |
| 3-Person Households | 7 (10.1%) | 0 (0.0%) |
| 4-Person Households | 0 (0.0%) | 0 (0.0%) |
| 5-Person Households | 6 (8.7%) | 0 (0.0%) |
| 6-Person Households | 0 (0.0%) | 0 (0.0%) |
| 7+ Person Households | 0 (0.0%) | 0 (0.0%) |
| Total | 37 (53.6%) | 32 (46.4%) |
Female Fertility in Lexington
Fertility by Age in Lexington
| Age Bracket | Women with Births | Births / 1,000 Women |
| 15 to 19 years | 0 (0.0%) | 0.0 |
| 20 to 34 years | 0 (0.0%) | 0.0 |
| 35 to 50 years | 0 (0.0%) | 0.0 |
| Total | 0 (0.0%) | 0.0 |
Fertility by Age by Marriage Status in Lexington
| Age Bracket | Married | Unmarried |
| 15 to 19 years | 0 (0.0%) | 0 (0.0%) |
| 20 to 34 years | 0 (0.0%) | 0 (0.0%) |
| 35 to 50 years | 0 (0.0%) | 0 (0.0%) |
| Total | 0 (0.0%) | 0 (0.0%) |
Fertility by Education in Lexington
| Educational Attainment | Women with Births | Births / 1,000 Women |
| Less than High School | 0 (0.0%) | 0.0 |
| High School Diploma | 0 (0.0%) | 0.0 |
| College or Associate's Degree | 0 (0.0%) | 0.0 |
| Bachelor's Degree | 0 (0.0%) | 0.0 |
| Graduate Degree | 0 (0.0%) | 0.0 |
| Total | 0 (0.0%) | 0.0 |
Fertility by Education by Marriage Status in Lexington
| Educational Attainment | Married | Unmarried |
| Less than High School | 0 (0.0%) | 0 (0.0%) |
| High School Diploma | 0 (0.0%) | 0 (0.0%) |
| College or Associate's Degree | 0 (0.0%) | 0 (0.0%) |
| Bachelor's Degree | 0 (0.0%) | 0 (0.0%) |
| Graduate Degree | 0 (0.0%) | 0 (0.0%) |
| Total | 0 (0.0%) | 0 (0.0%) |
Employment Characteristics in Lexington
Employment by Class of Employer in Lexington
Among the 51 employed individuals in Lexington, private company employees (22 | 43.1%), self-employed (not incorporated) (11 | 21.6%), and not-for-profit organizations (9 | 17.6%) make up the most common classes of employment.
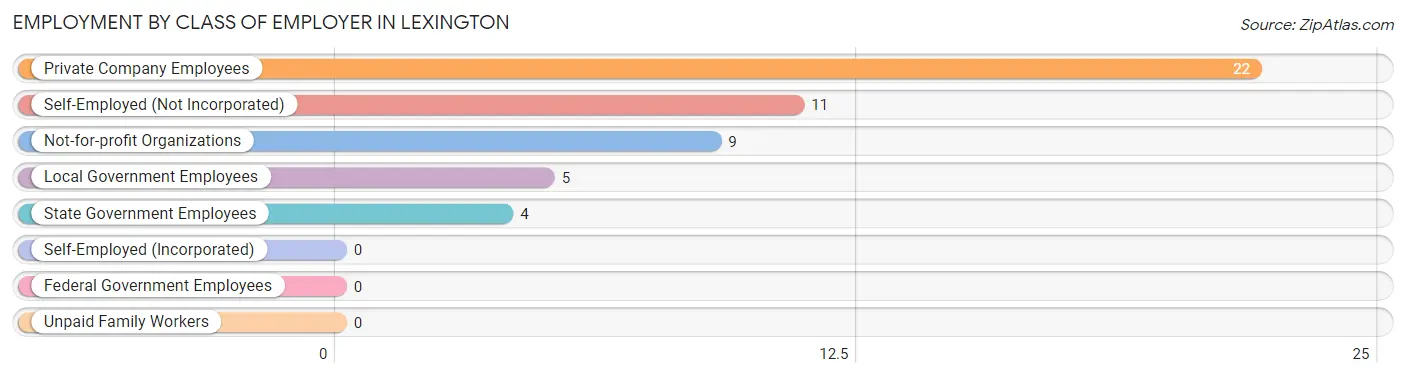
| Employer Class | # Employees | % Employees |
| Private Company Employees | 22 | 43.1% |
| Self-Employed (Incorporated) | 0 | 0.0% |
| Self-Employed (Not Incorporated) | 11 | 21.6% |
| Not-for-profit Organizations | 9 | 17.6% |
| Local Government Employees | 5 | 9.8% |
| State Government Employees | 4 | 7.8% |
| Federal Government Employees | 0 | 0.0% |
| Unpaid Family Workers | 0 | 0.0% |
| Total | 51 | 100.0% |
Employment Status by Age in Lexington
According to the labor force statistics for Lexington, out of the total population over 16 years of age (115), 46.1% or 53 individuals are in the labor force, with 3.8% or 2 of them unemployed. The age group with the highest labor force participation rate is 16 to 19 years, with 100.0% or 6 individuals in the labor force. Within the labor force, the 16 to 19 years age range has the highest percentage of unemployed individuals, with 16.7% or 1 of them being unemployed.
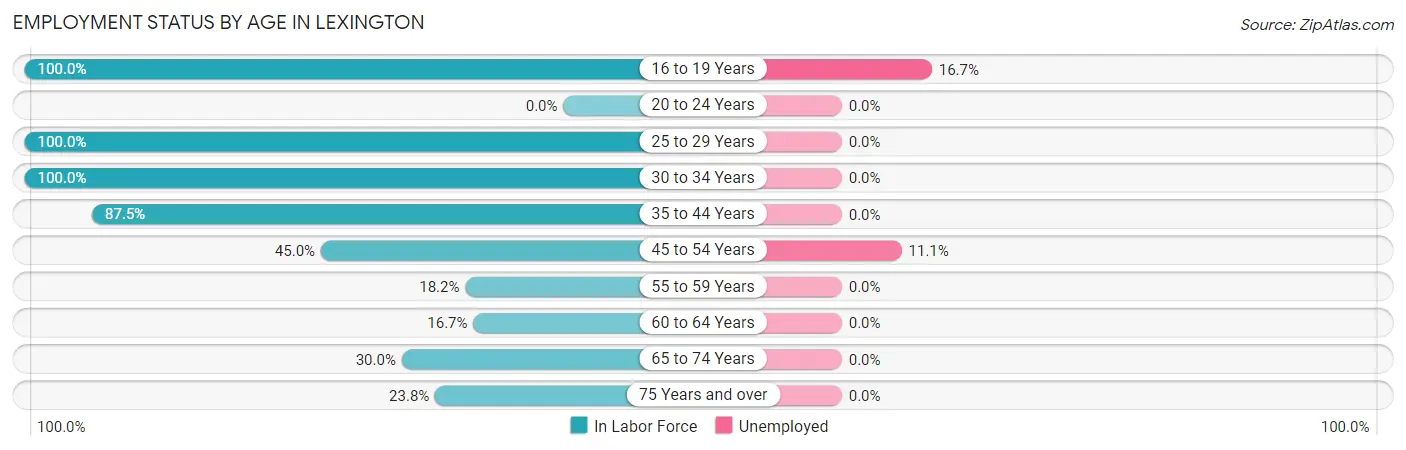
| Age Bracket | In Labor Force | Unemployed |
| 16 to 19 Years | 6 (100.0%) | 1 (16.7%) |
| 20 to 24 Years | 0 (0.0%) | 0 (0.0%) |
| 25 to 29 Years | 2 (100.0%) | 0 (0.0%) |
| 30 to 34 Years | 7 (100.0%) | 0 (0.0%) |
| 35 to 44 Years | 14 (87.5%) | 0 (0.0%) |
| 45 to 54 Years | 9 (45.0%) | 1 (11.1%) |
| 55 to 59 Years | 2 (18.2%) | 0 (0.0%) |
| 60 to 64 Years | 2 (16.7%) | 0 (0.0%) |
| 65 to 74 Years | 6 (30.0%) | 0 (0.0%) |
| 75 Years and over | 5 (23.8%) | 0 (0.0%) |
| Total | 53 (46.1%) | 2 (3.8%) |
Employment Status by Educational Attainment in Lexington
According to labor force statistics for Lexington, 52.9% of individuals (36) out of the total population between 25 and 64 years of age (68) are in the labor force, with 2.8% or 1 of them being unemployed. The group with the highest labor force participation rate are those with the educational attainment of high school diploma, with 73.9% or 17 individuals in the labor force. Within the labor force, individuals with college / associate degree education have the highest percentage of unemployment, with 7.1% or 1 of them being unemployed.
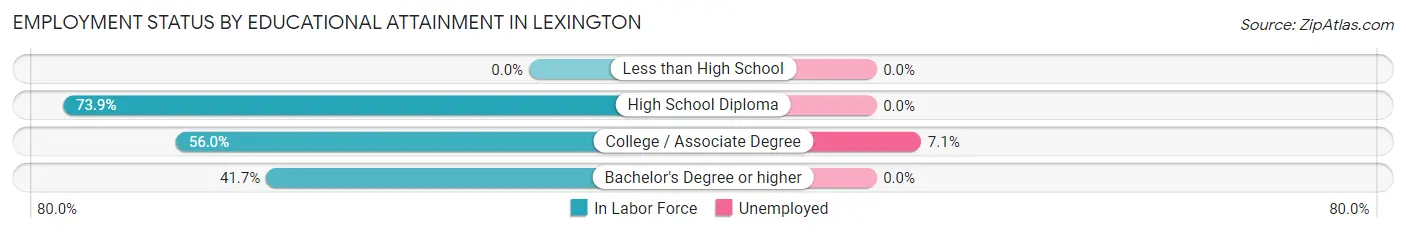
| Educational Attainment | In Labor Force | Unemployed |
| Less than High School | 0 (0.0%) | 0 (0.0%) |
| High School Diploma | 17 (73.9%) | 0 (0.0%) |
| College / Associate Degree | 14 (56.0%) | 2 (7.1%) |
| Bachelor's Degree or higher | 5 (41.7%) | 0 (0.0%) |
| Total | 36 (52.9%) | 2 (2.8%) |
Employment Occupations by Sex in Lexington
Management, Business, Science and Arts Occupations
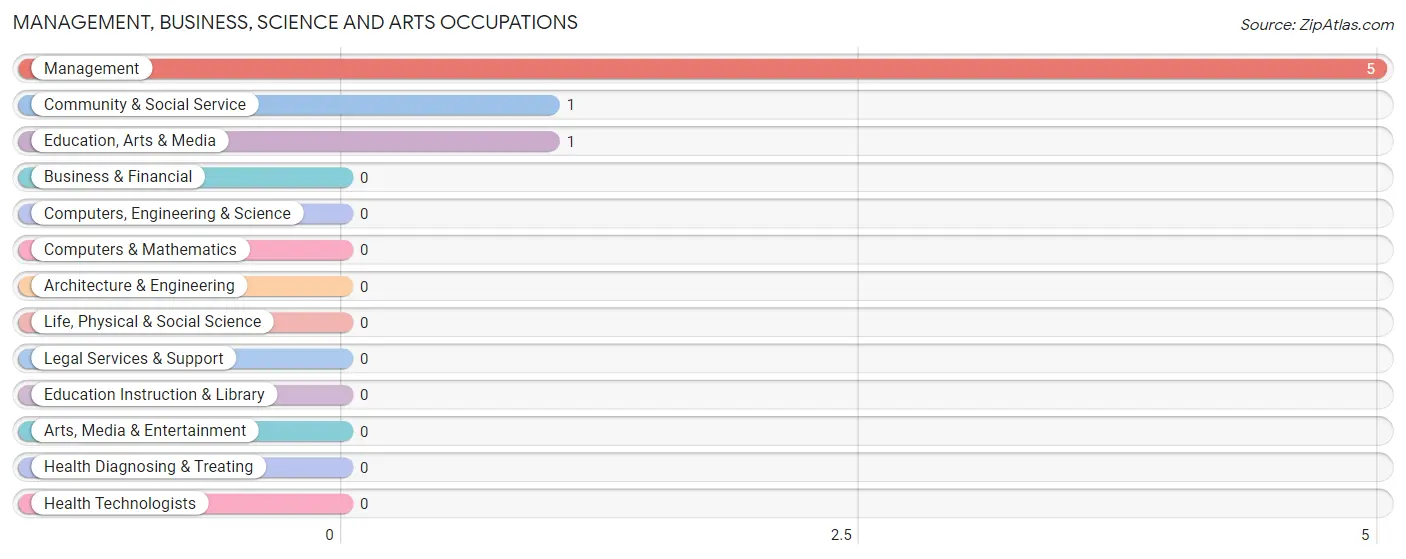
The most common Management, Business, Science and Arts occupations in Lexington are Management (5 | 9.8%), Community & Social Service (1 | 2.0%), and Education, Arts & Media (1 | 2.0%).
Management, Business, Science and Arts Occupations by Sex
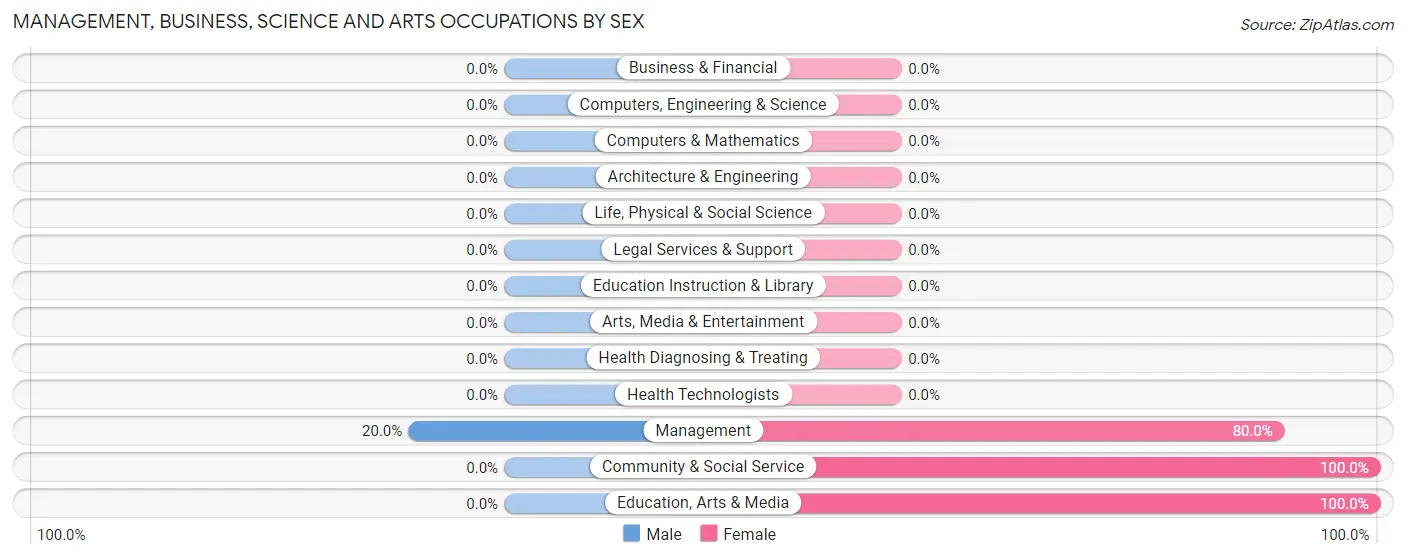
| Occupation | Male | Female |
| Management | 1 (20.0%) | 4 (80.0%) |
| Business & Financial | 0 (0.0%) | 0 (0.0%) |
| Computers, Engineering & Science | 0 (0.0%) | 0 (0.0%) |
| Computers & Mathematics | 0 (0.0%) | 0 (0.0%) |
| Architecture & Engineering | 0 (0.0%) | 0 (0.0%) |
| Life, Physical & Social Science | 0 (0.0%) | 0 (0.0%) |
| Community & Social Service | 0 (0.0%) | 1 (100.0%) |
| Education, Arts & Media | 0 (0.0%) | 1 (100.0%) |
| Legal Services & Support | 0 (0.0%) | 0 (0.0%) |
| Education Instruction & Library | 0 (0.0%) | 0 (0.0%) |
| Arts, Media & Entertainment | 0 (0.0%) | 0 (0.0%) |
| Health Diagnosing & Treating | 0 (0.0%) | 0 (0.0%) |
| Health Technologists | 0 (0.0%) | 0 (0.0%) |
| Total (Category) | 1 (16.7%) | 5 (83.3%) |
| Total (Overall) | 34 (66.7%) | 17 (33.3%) |
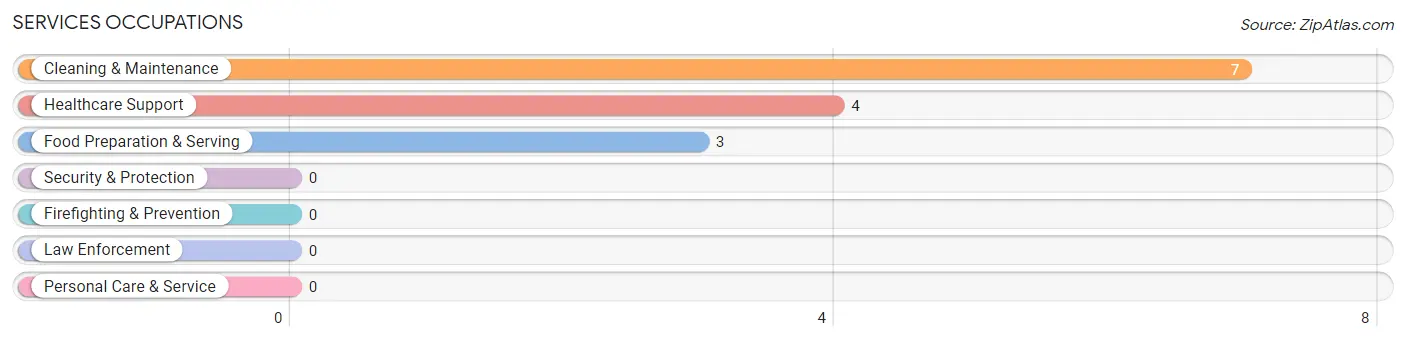
Services Occupations
The most common Services occupations in Lexington are Cleaning & Maintenance (7 | 13.7%), Healthcare Support (4 | 7.8%), and Food Preparation & Serving (3 | 5.9%).
Services Occupations by Sex
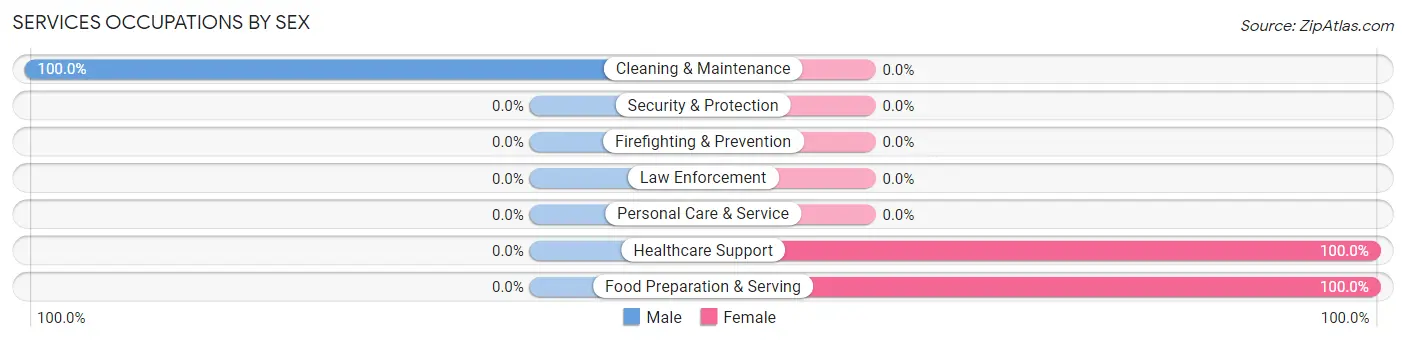
| Occupation | Male | Female |
| Healthcare Support | 0 (0.0%) | 4 (100.0%) |
| Security & Protection | 0 (0.0%) | 0 (0.0%) |
| Firefighting & Prevention | 0 (0.0%) | 0 (0.0%) |
| Law Enforcement | 0 (0.0%) | 0 (0.0%) |
| Food Preparation & Serving | 0 (0.0%) | 3 (100.0%) |
| Cleaning & Maintenance | 7 (100.0%) | 0 (0.0%) |
| Personal Care & Service | 0 (0.0%) | 0 (0.0%) |
| Total (Category) | 7 (50.0%) | 7 (50.0%) |
| Total (Overall) | 34 (66.7%) | 17 (33.3%) |
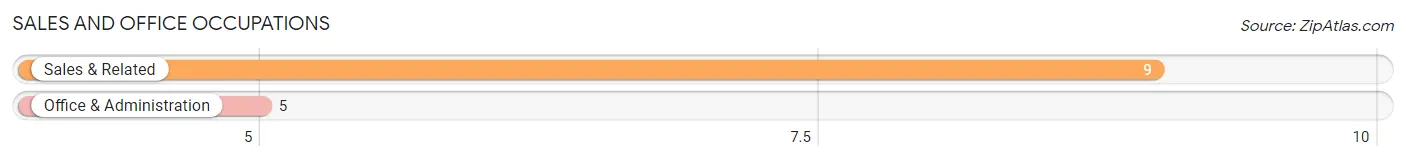
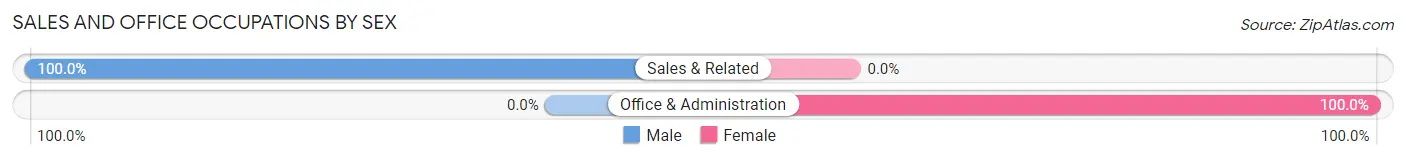
Sales and Office Occupations
The most common Sales and Office occupations in Lexington are Sales & Related (9 | 17.6%), and Office & Administration (5 | 9.8%).
Sales and Office Occupations by Sex
| Occupation | Male | Female |
| Sales & Related | 9 (100.0%) | 0 (0.0%) |
| Office & Administration | 0 (0.0%) | 5 (100.0%) |
| Total (Category) | 9 (64.3%) | 5 (35.7%) |
| Total (Overall) | 34 (66.7%) | 17 (33.3%) |
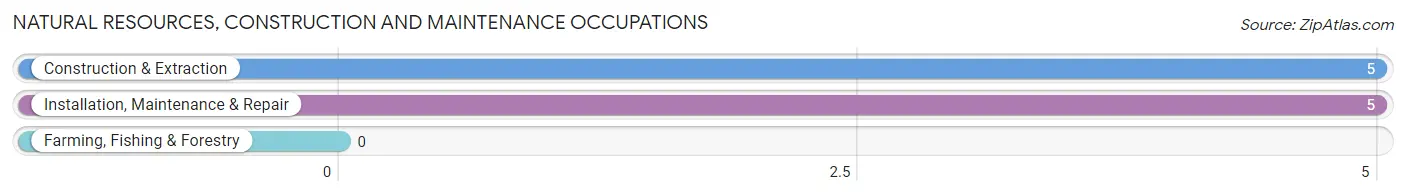
Natural Resources, Construction and Maintenance Occupations
The most common Natural Resources, Construction and Maintenance occupations in Lexington are Construction & Extraction (5 | 9.8%), and Installation, Maintenance & Repair (5 | 9.8%).
Natural Resources, Construction and Maintenance Occupations by Sex
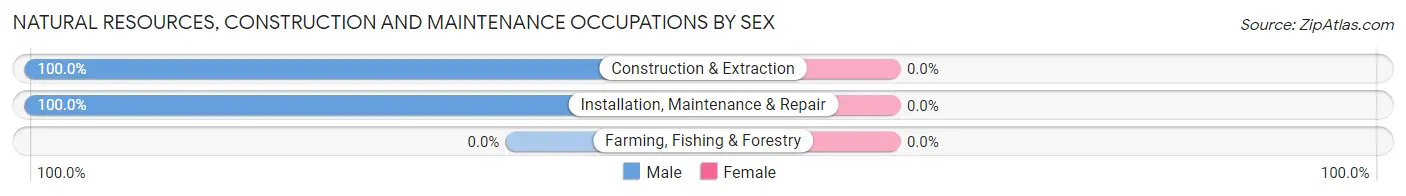
| Occupation | Male | Female |
| Farming, Fishing & Forestry | 0 (0.0%) | 0 (0.0%) |
| Construction & Extraction | 5 (100.0%) | 0 (0.0%) |
| Installation, Maintenance & Repair | 5 (100.0%) | 0 (0.0%) |
| Total (Category) | 10 (100.0%) | 0 (0.0%) |
| Total (Overall) | 34 (66.7%) | 17 (33.3%) |
Production, Transportation and Moving Occupations
The most common Production, Transportation and Moving occupations in Lexington are , and Transportation (7 | 13.7%).
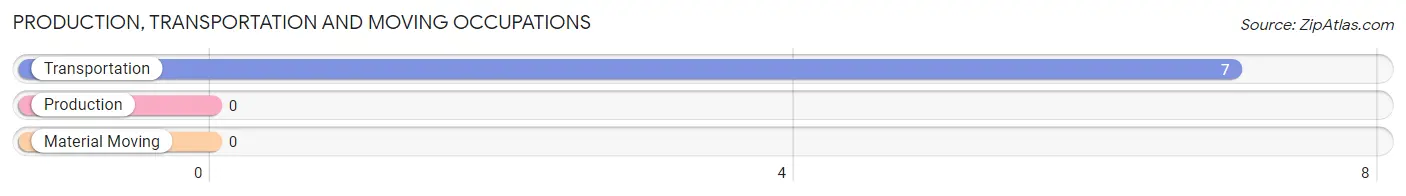
Production, Transportation and Moving Occupations by Sex
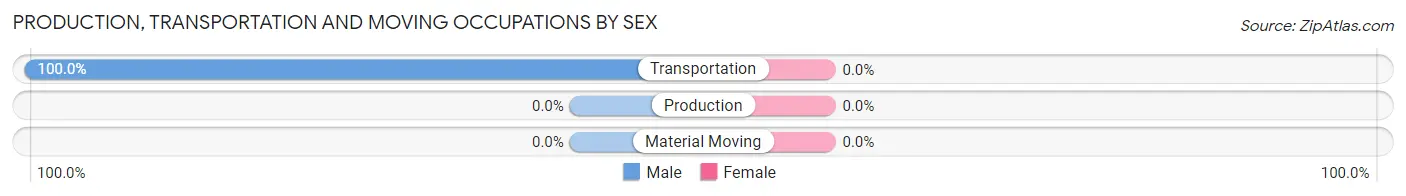
| Occupation | Male | Female |
| Production | 0 (0.0%) | 0 (0.0%) |
| Transportation | 7 (100.0%) | 0 (0.0%) |
| Material Moving | 0 (0.0%) | 0 (0.0%) |
| Total (Category) | 7 (100.0%) | 0 (0.0%) |
| Total (Overall) | 34 (66.7%) | 17 (33.3%) |
Employment Industries by Sex in Lexington
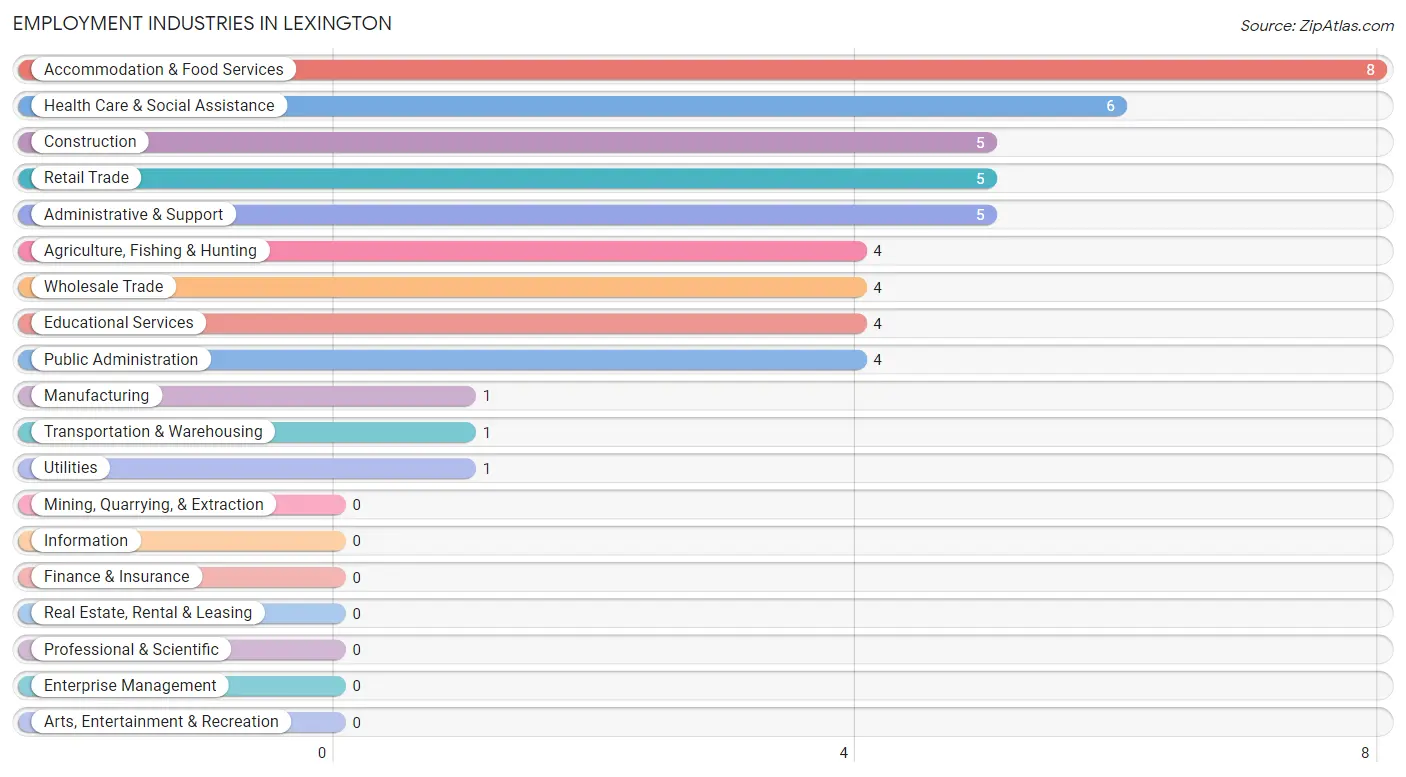
Employment Industries in Lexington
The major employment industries in Lexington include Accommodation & Food Services (8 | 15.7%), Health Care & Social Assistance (6 | 11.8%), Construction (5 | 9.8%), Retail Trade (5 | 9.8%), and Administrative & Support (5 | 9.8%).
Employment Industries by Sex in Lexington
The Lexington industries that see more men than women are Agriculture, Fishing & Hunting (100.0%), Construction (100.0%), and Manufacturing (100.0%), whereas the industries that tend to have a higher number of women are Transportation & Warehousing (100.0%), Educational Services (100.0%), and Public Administration (100.0%).
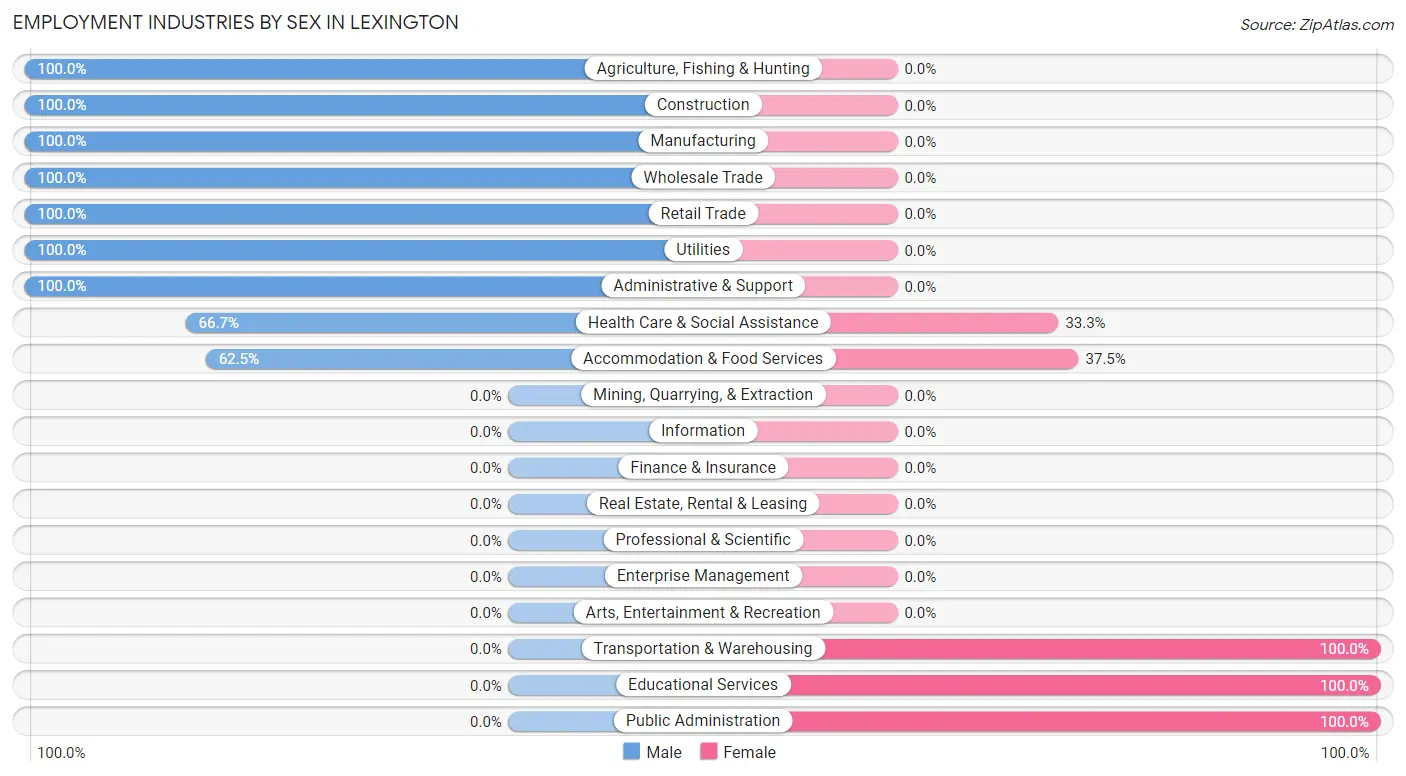
| Industry | Male | Female |
| Agriculture, Fishing & Hunting | 4 (100.0%) | 0 (0.0%) |
| Mining, Quarrying, & Extraction | 0 (0.0%) | 0 (0.0%) |
| Construction | 5 (100.0%) | 0 (0.0%) |
| Manufacturing | 1 (100.0%) | 0 (0.0%) |
| Wholesale Trade | 4 (100.0%) | 0 (0.0%) |
| Retail Trade | 5 (100.0%) | 0 (0.0%) |
| Transportation & Warehousing | 0 (0.0%) | 1 (100.0%) |
| Utilities | 1 (100.0%) | 0 (0.0%) |
| Information | 0 (0.0%) | 0 (0.0%) |
| Finance & Insurance | 0 (0.0%) | 0 (0.0%) |
| Real Estate, Rental & Leasing | 0 (0.0%) | 0 (0.0%) |
| Professional & Scientific | 0 (0.0%) | 0 (0.0%) |
| Enterprise Management | 0 (0.0%) | 0 (0.0%) |
| Administrative & Support | 5 (100.0%) | 0 (0.0%) |
| Educational Services | 0 (0.0%) | 4 (100.0%) |
| Health Care & Social Assistance | 4 (66.7%) | 2 (33.3%) |
| Arts, Entertainment & Recreation | 0 (0.0%) | 0 (0.0%) |
| Accommodation & Food Services | 5 (62.5%) | 3 (37.5%) |
| Public Administration | 0 (0.0%) | 4 (100.0%) |
| Total | 34 (66.7%) | 17 (33.3%) |
Education in Lexington
School Enrollment in Lexington
The most common levels of schooling among the 26 students in Lexington are nursery / preschool (9 | 34.6%), elementary school (8 | 30.8%), and high school (6 | 23.1%).
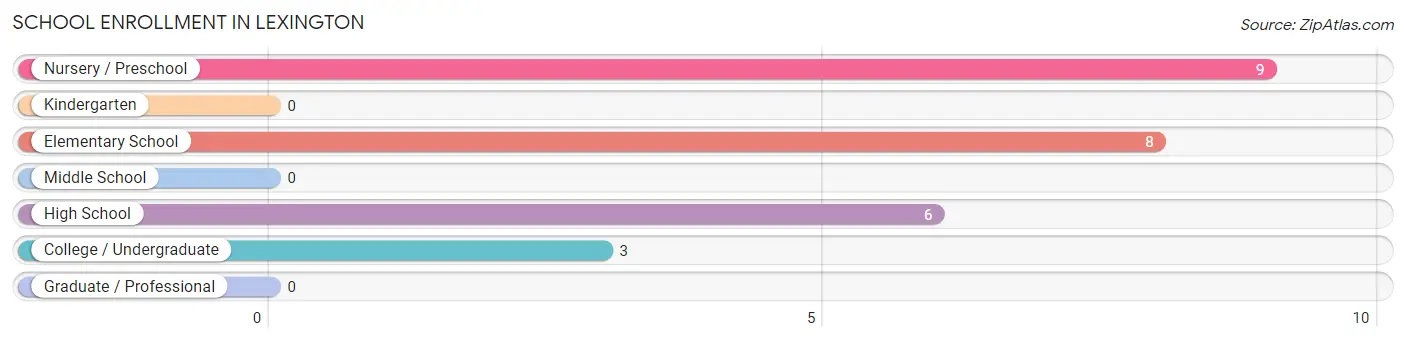
| School Level | # Students | % Students |
| Nursery / Preschool | 9 | 34.6% |
| Kindergarten | 0 | 0.0% |
| Elementary School | 8 | 30.8% |
| Middle School | 0 | 0.0% |
| High School | 6 | 23.1% |
| College / Undergraduate | 3 | 11.5% |
| Graduate / Professional | 0 | 0.0% |
| Total | 26 | 100.0% |
School Enrollment by Age by Funding Source in Lexington
Out of a total of 26 students who are enrolled in schools in Lexington, 11 (42.3%) attend a private institution, while the remaining 15 (57.7%) are enrolled in public schools. The age group of 3 to 4 year olds has the highest likelihood of being enrolled in private schools, with 9 (100.0% in the age bracket) enrolled. Conversely, the age group of 15 to 17 year olds has the lowest likelihood of being enrolled in a private school, with 6 (100.0% in the age bracket) attending a public institution.
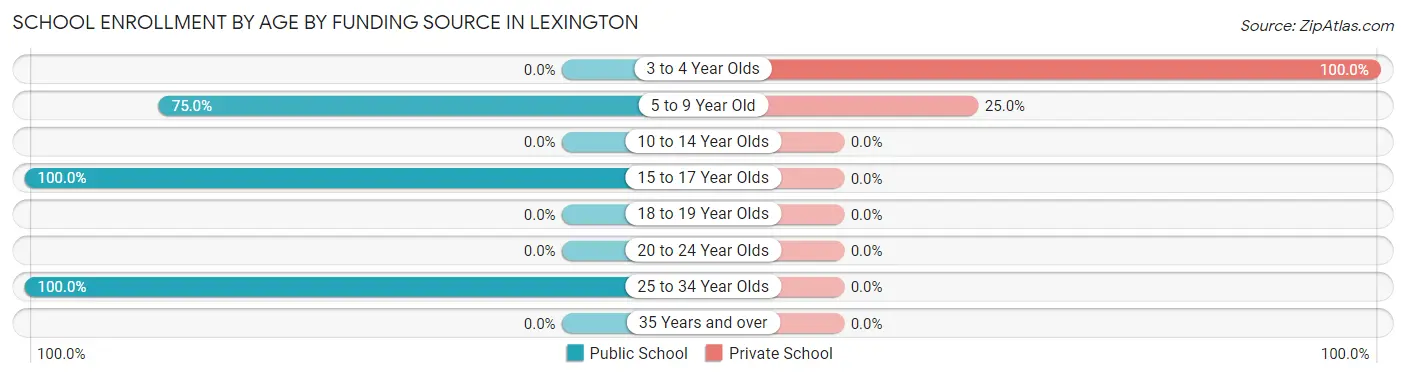
| Age Bracket | Public School | Private School |
| 3 to 4 Year Olds | 0 (0.0%) | 9 (100.0%) |
| 5 to 9 Year Old | 6 (75.0%) | 2 (25.0%) |
| 10 to 14 Year Olds | 0 (0.0%) | 0 (0.0%) |
| 15 to 17 Year Olds | 6 (100.0%) | 0 (0.0%) |
| 18 to 19 Year Olds | 0 (0.0%) | 0 (0.0%) |
| 20 to 24 Year Olds | 0 (0.0%) | 0 (0.0%) |
| 25 to 34 Year Olds | 3 (100.0%) | 0 (0.0%) |
| 35 Years and over | 0 (0.0%) | 0 (0.0%) |
| Total | 15 (57.7%) | 11 (42.3%) |
Educational Attainment by Field of Study in Lexington
Arts & humanities (9 | 75.0%), education (2 | 16.7%), and social sciences (1 | 8.3%) are the most common fields of study among 12 individuals in Lexington who have obtained a bachelor's degree or higher.
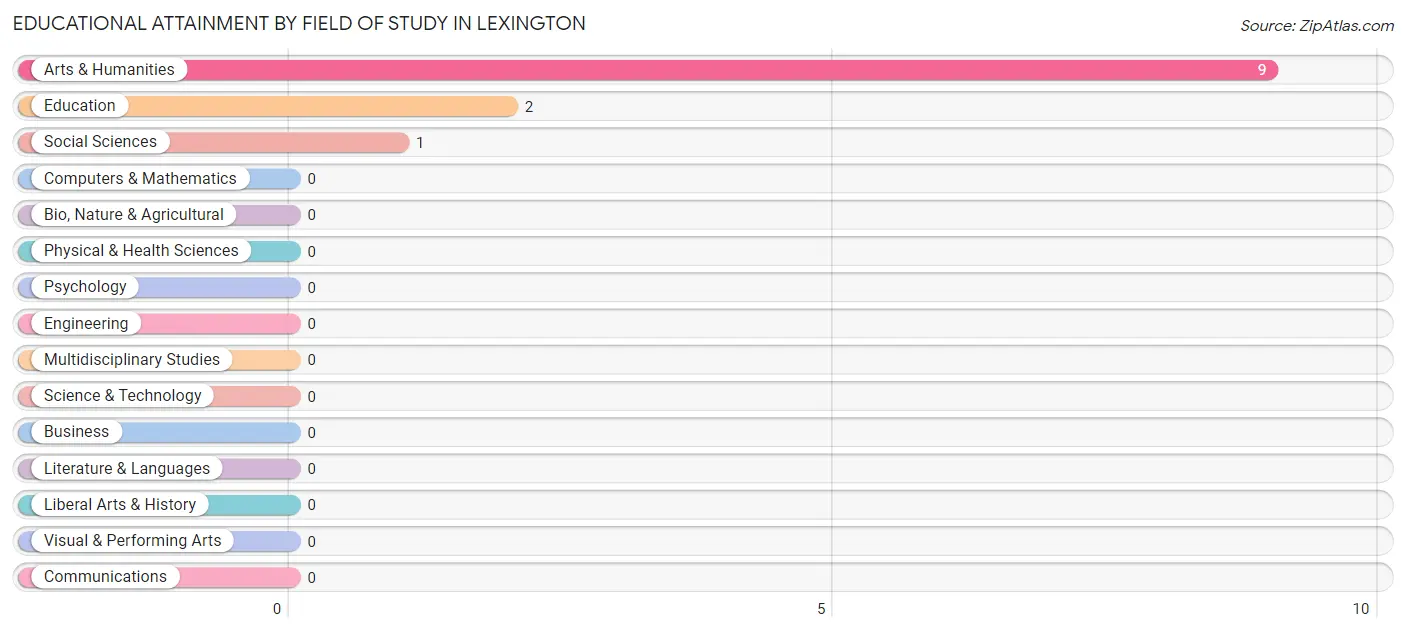
| Field of Study | # Graduates | % Graduates |
| Computers & Mathematics | 0 | 0.0% |
| Bio, Nature & Agricultural | 0 | 0.0% |
| Physical & Health Sciences | 0 | 0.0% |
| Psychology | 0 | 0.0% |
| Social Sciences | 1 | 8.3% |
| Engineering | 0 | 0.0% |
| Multidisciplinary Studies | 0 | 0.0% |
| Science & Technology | 0 | 0.0% |
| Business | 0 | 0.0% |
| Education | 2 | 16.7% |
| Literature & Languages | 0 | 0.0% |
| Liberal Arts & History | 0 | 0.0% |
| Visual & Performing Arts | 0 | 0.0% |
| Communications | 0 | 0.0% |
| Arts & Humanities | 9 | 75.0% |
| Total | 12 | 100.0% |
Transportation & Commute in Lexington
Vehicle Availability by Sex in Lexington
The most prevalent vehicle ownership categories in Lexington are males with 3 vehicles (26, accounting for 76.5%) and females with 3 vehicles (8, making up 152.9%).
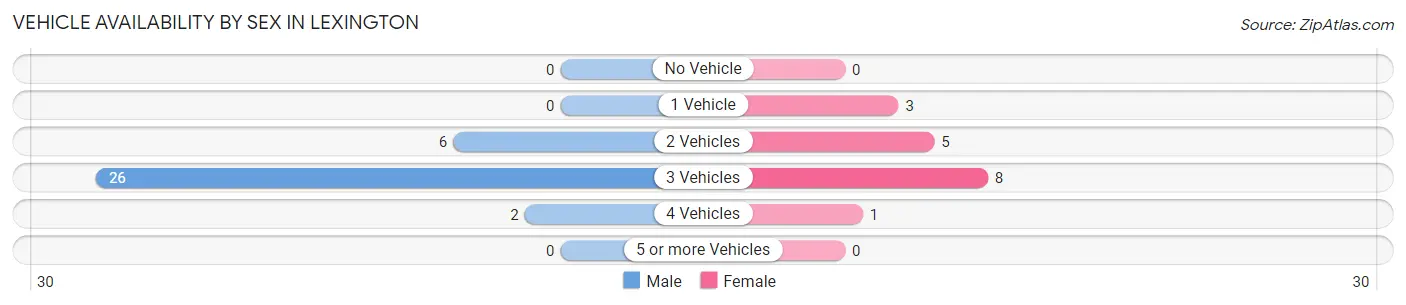
| Vehicles Available | Male | Female |
| No Vehicle | 0 (0.0%) | 0 (0.0%) |
| 1 Vehicle | 0 (0.0%) | 3 (17.6%) |
| 2 Vehicles | 6 (17.6%) | 5 (29.4%) |
| 3 Vehicles | 26 (76.5%) | 8 (47.1%) |
| 4 Vehicles | 2 (5.9%) | 1 (5.9%) |
| 5 or more Vehicles | 0 (0.0%) | 0 (0.0%) |
| Total | 34 (100.0%) | 17 (100.0%) |
Commute Time in Lexington
The most frequently occuring commute durations in Lexington are 10 to 14 minutes (28 commuters, 54.9%), less than 5 minutes (8 commuters, 15.7%), and 20 to 24 minutes (8 commuters, 15.7%).
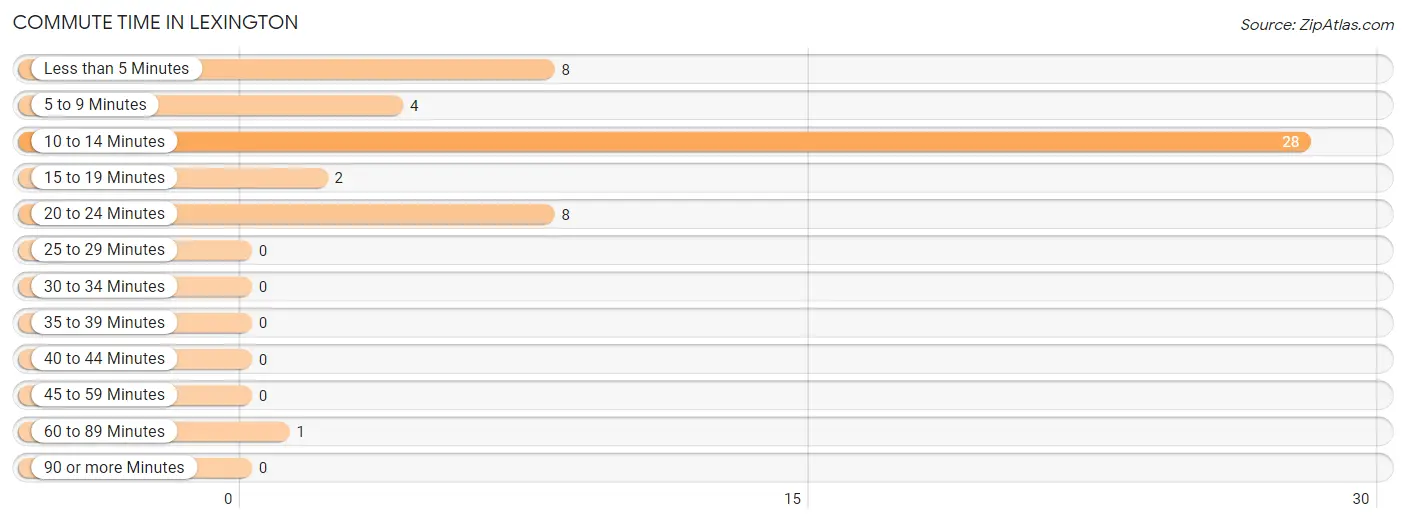
| Commute Time | # Commuters | % Commuters |
| Less than 5 Minutes | 8 | 15.7% |
| 5 to 9 Minutes | 4 | 7.8% |
| 10 to 14 Minutes | 28 | 54.9% |
| 15 to 19 Minutes | 2 | 3.9% |
| 20 to 24 Minutes | 8 | 15.7% |
| 25 to 29 Minutes | 0 | 0.0% |
| 30 to 34 Minutes | 0 | 0.0% |
| 35 to 39 Minutes | 0 | 0.0% |
| 40 to 44 Minutes | 0 | 0.0% |
| 45 to 59 Minutes | 0 | 0.0% |
| 60 to 89 Minutes | 1 | 2.0% |
| 90 or more Minutes | 0 | 0.0% |
Commute Time by Sex in Lexington
The most common commute times in Lexington are 10 to 14 minutes (19 commuters, 55.9%) for males and 10 to 14 minutes (9 commuters, 52.9%) for females.
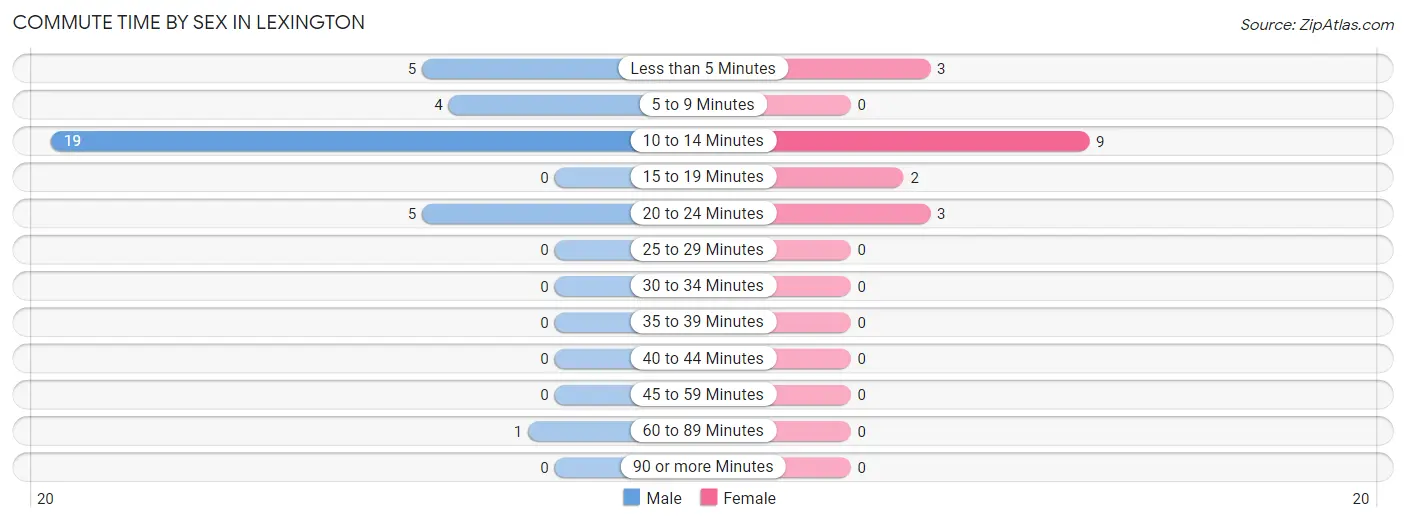
| Commute Time | Male | Female |
| Less than 5 Minutes | 5 (14.7%) | 3 (17.6%) |
| 5 to 9 Minutes | 4 (11.8%) | 0 (0.0%) |
| 10 to 14 Minutes | 19 (55.9%) | 9 (52.9%) |
| 15 to 19 Minutes | 0 (0.0%) | 2 (11.8%) |
| 20 to 24 Minutes | 5 (14.7%) | 3 (17.6%) |
| 25 to 29 Minutes | 0 (0.0%) | 0 (0.0%) |
| 30 to 34 Minutes | 0 (0.0%) | 0 (0.0%) |
| 35 to 39 Minutes | 0 (0.0%) | 0 (0.0%) |
| 40 to 44 Minutes | 0 (0.0%) | 0 (0.0%) |
| 45 to 59 Minutes | 0 (0.0%) | 0 (0.0%) |
| 60 to 89 Minutes | 1 (2.9%) | 0 (0.0%) |
| 90 or more Minutes | 0 (0.0%) | 0 (0.0%) |
Time of Departure to Work by Sex in Lexington
The most frequent times of departure to work in Lexington are 6:00 AM to 6:29 AM (6, 17.6%) for males and 6:30 AM to 6:59 AM (4, 23.5%) for females.
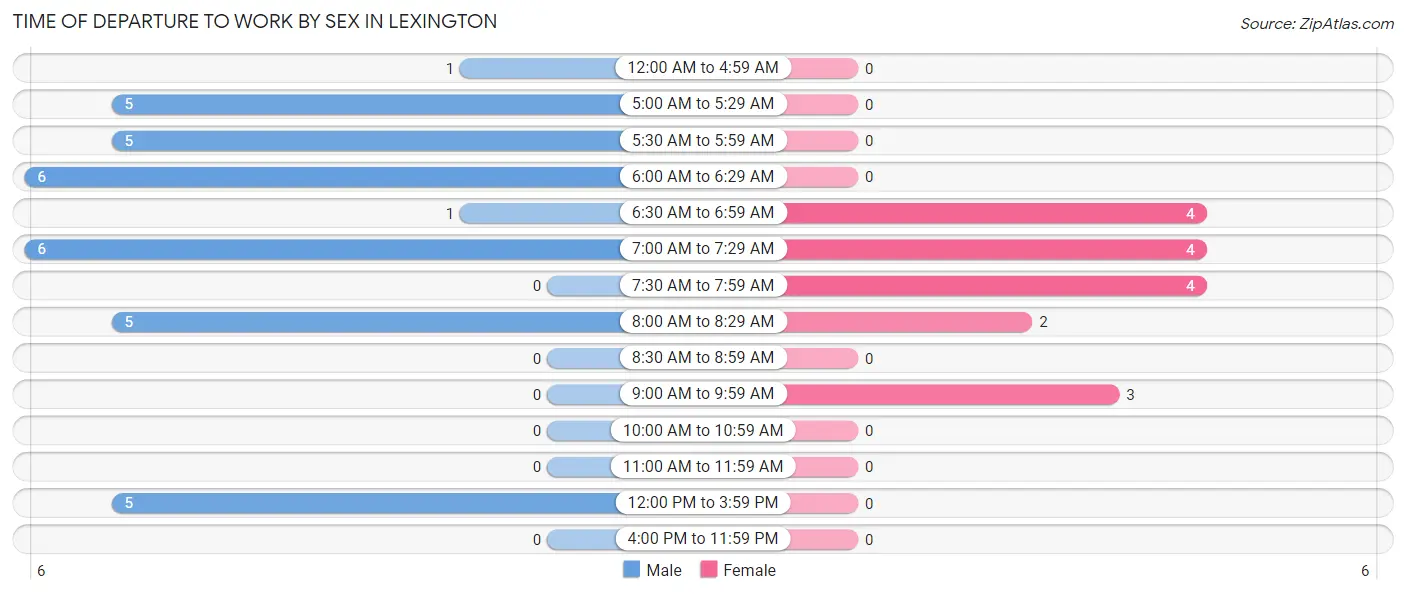
| Time of Departure | Male | Female |
| 12:00 AM to 4:59 AM | 1 (2.9%) | 0 (0.0%) |
| 5:00 AM to 5:29 AM | 5 (14.7%) | 0 (0.0%) |
| 5:30 AM to 5:59 AM | 5 (14.7%) | 0 (0.0%) |
| 6:00 AM to 6:29 AM | 6 (17.6%) | 0 (0.0%) |
| 6:30 AM to 6:59 AM | 1 (2.9%) | 4 (23.5%) |
| 7:00 AM to 7:29 AM | 6 (17.6%) | 4 (23.5%) |
| 7:30 AM to 7:59 AM | 0 (0.0%) | 4 (23.5%) |
| 8:00 AM to 8:29 AM | 5 (14.7%) | 2 (11.8%) |
| 8:30 AM to 8:59 AM | 0 (0.0%) | 0 (0.0%) |
| 9:00 AM to 9:59 AM | 0 (0.0%) | 3 (17.6%) |
| 10:00 AM to 10:59 AM | 0 (0.0%) | 0 (0.0%) |
| 11:00 AM to 11:59 AM | 0 (0.0%) | 0 (0.0%) |
| 12:00 PM to 3:59 PM | 5 (14.7%) | 0 (0.0%) |
| 4:00 PM to 11:59 PM | 0 (0.0%) | 0 (0.0%) |
| Total | 34 (100.0%) | 17 (100.0%) |
Housing Occupancy in Lexington
Occupancy by Ownership in Lexington
Of the total 69 dwellings in Lexington, owner-occupied units account for 60 (87.0%), while renter-occupied units make up 9 (13.0%).
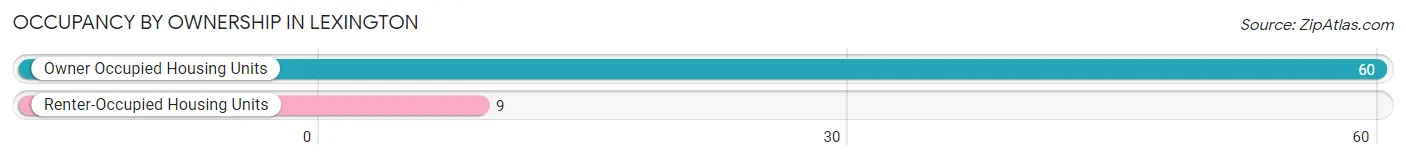
| Occupancy | # Housing Units | % Housing Units |
| Owner Occupied Housing Units | 60 | 87.0% |
| Renter-Occupied Housing Units | 9 | 13.0% |
| Total Occupied Housing Units | 69 | 100.0% |
Occupancy by Household Size in Lexington
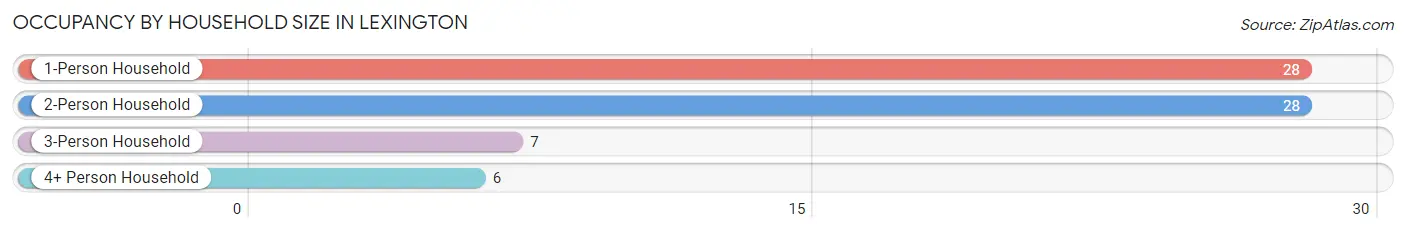
| Household Size | # Housing Units | % Housing Units |
| 1-Person Household | 28 | 40.6% |
| 2-Person Household | 28 | 40.6% |
| 3-Person Household | 7 | 10.1% |
| 4+ Person Household | 6 | 8.7% |
| Total Housing Units | 69 | 100.0% |
Occupancy by Ownership by Household Size in Lexington
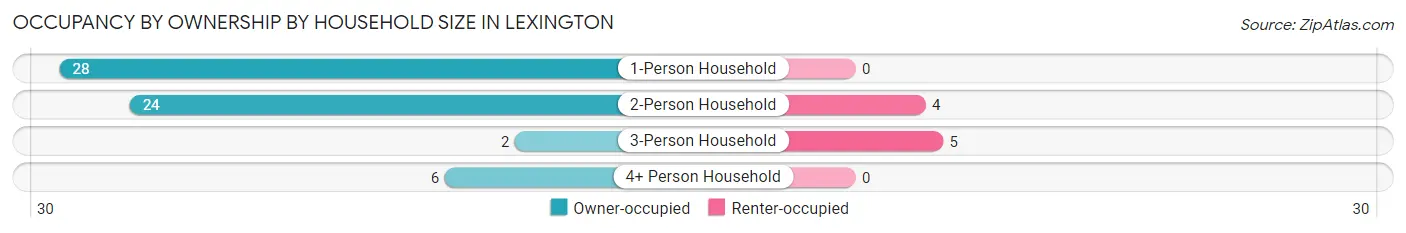
| Household Size | Owner-occupied | Renter-occupied |
| 1-Person Household | 28 (100.0%) | 0 (0.0%) |
| 2-Person Household | 24 (85.7%) | 4 (14.3%) |
| 3-Person Household | 2 (28.6%) | 5 (71.4%) |
| 4+ Person Household | 6 (100.0%) | 0 (0.0%) |
| Total Housing Units | 60 (87.0%) | 9 (13.0%) |
Occupancy by Educational Attainment in Lexington
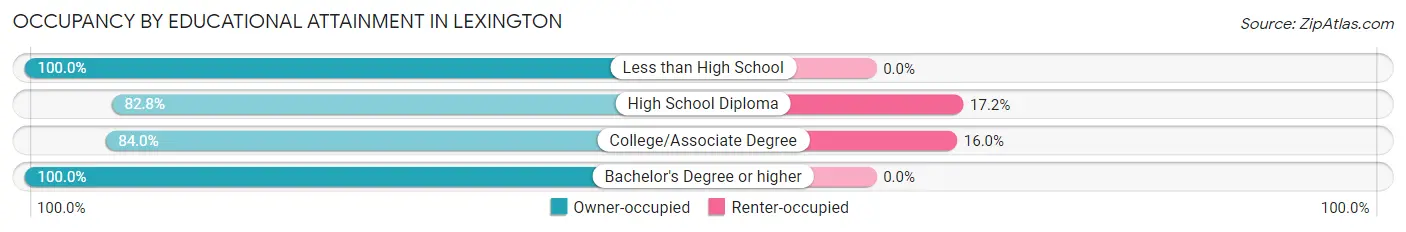
| Household Size | Owner-occupied | Renter-occupied |
| Less than High School | 8 (100.0%) | 0 (0.0%) |
| High School Diploma | 24 (82.8%) | 5 (17.2%) |
| College/Associate Degree | 21 (84.0%) | 4 (16.0%) |
| Bachelor's Degree or higher | 7 (100.0%) | 0 (0.0%) |
Occupancy by Age of Householder in Lexington
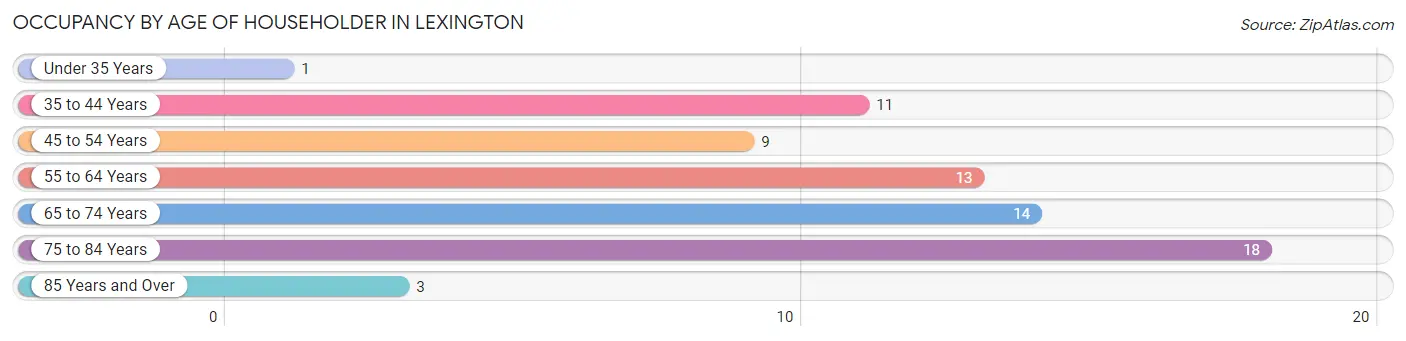
| Age Bracket | # Households | % Households |
| Under 35 Years | 1 | 1.5% |
| 35 to 44 Years | 11 | 15.9% |
| 45 to 54 Years | 9 | 13.0% |
| 55 to 64 Years | 13 | 18.8% |
| 65 to 74 Years | 14 | 20.3% |
| 75 to 84 Years | 18 | 26.1% |
| 85 Years and Over | 3 | 4.3% |
| Total | 69 | 100.0% |
Housing Finances in Lexington
Median Income by Occupancy in Lexington
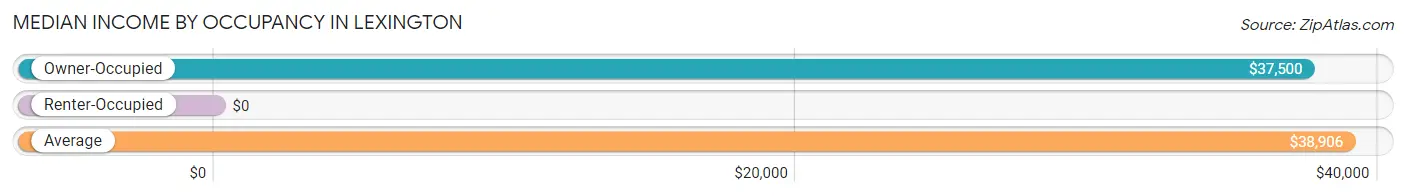
| Occupancy Type | # Households | Median Income |
| Owner-Occupied | 60 (87.0%) | $37,500 |
| Renter-Occupied | 9 (13.0%) | $0 |
| Average | 69 (100.0%) | $38,906 |
Occupancy by Householder Income Bracket in Lexington
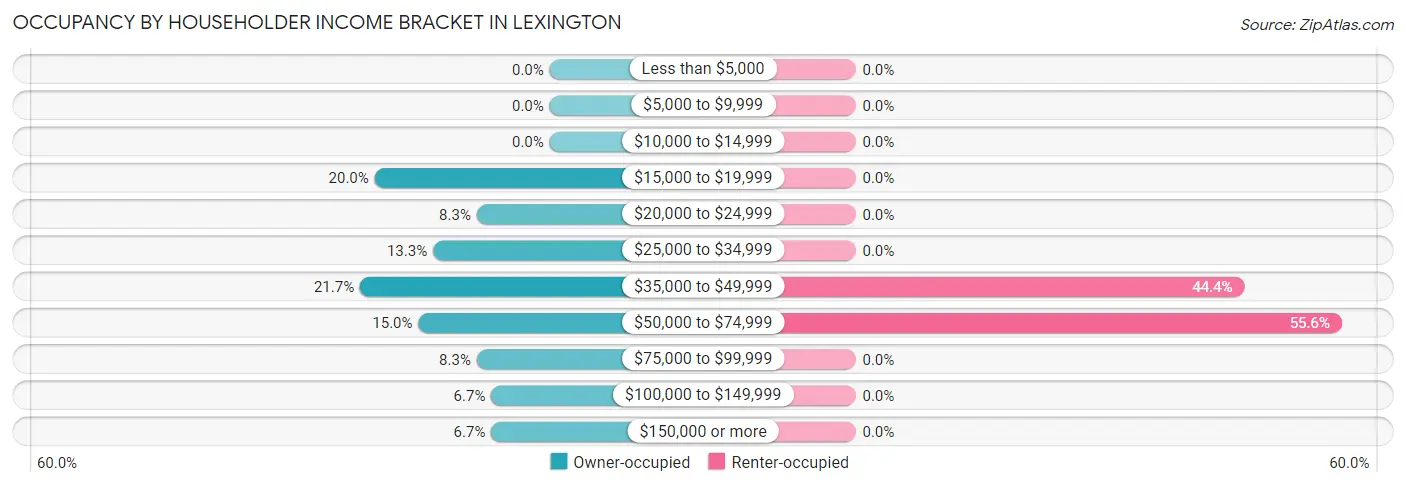
| Income Bracket | Owner-occupied | Renter-occupied |
| Less than $5,000 | 0 (0.0%) | 0 (0.0%) |
| $5,000 to $9,999 | 0 (0.0%) | 0 (0.0%) |
| $10,000 to $14,999 | 0 (0.0%) | 0 (0.0%) |
| $15,000 to $19,999 | 12 (20.0%) | 0 (0.0%) |
| $20,000 to $24,999 | 5 (8.3%) | 0 (0.0%) |
| $25,000 to $34,999 | 8 (13.3%) | 0 (0.0%) |
| $35,000 to $49,999 | 13 (21.7%) | 4 (44.4%) |
| $50,000 to $74,999 | 9 (15.0%) | 5 (55.6%) |
| $75,000 to $99,999 | 5 (8.3%) | 0 (0.0%) |
| $100,000 to $149,999 | 4 (6.7%) | 0 (0.0%) |
| $150,000 or more | 4 (6.7%) | 0 (0.0%) |
| Total | 60 (100.0%) | 9 (100.0%) |
Monthly Housing Cost Tiers in Lexington
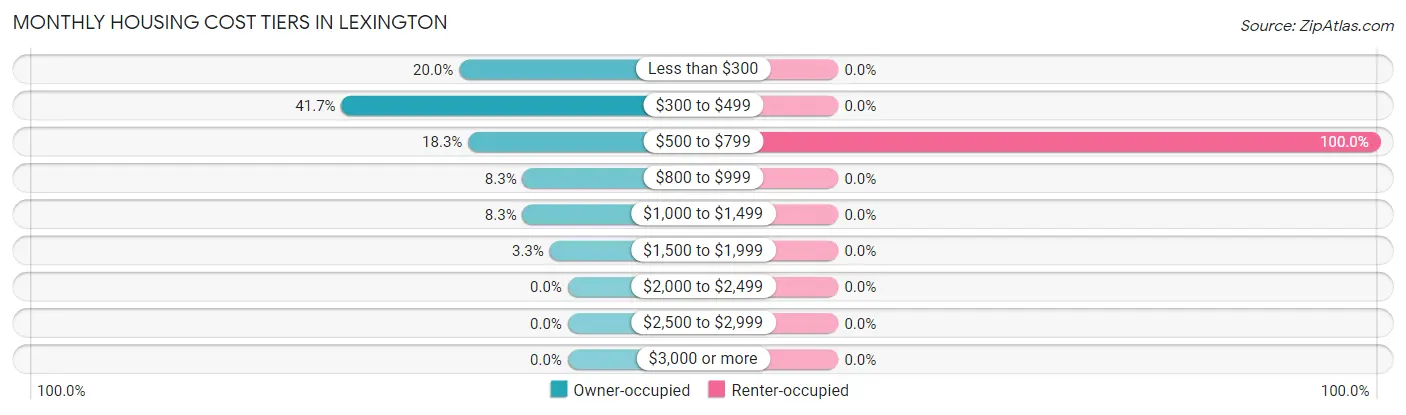
| Monthly Cost | Owner-occupied | Renter-occupied |
| Less than $300 | 12 (20.0%) | 0 (0.0%) |
| $300 to $499 | 25 (41.7%) | 0 (0.0%) |
| $500 to $799 | 11 (18.3%) | 9 (100.0%) |
| $800 to $999 | 5 (8.3%) | 0 (0.0%) |
| $1,000 to $1,499 | 5 (8.3%) | 0 (0.0%) |
| $1,500 to $1,999 | 2 (3.3%) | 0 (0.0%) |
| $2,000 to $2,499 | 0 (0.0%) | 0 (0.0%) |
| $2,500 to $2,999 | 0 (0.0%) | 0 (0.0%) |
| $3,000 or more | 0 (0.0%) | 0 (0.0%) |
| Total | 60 (100.0%) | 9 (100.0%) |
Physical Housing Characteristics in Lexington
Housing Structures in Lexington
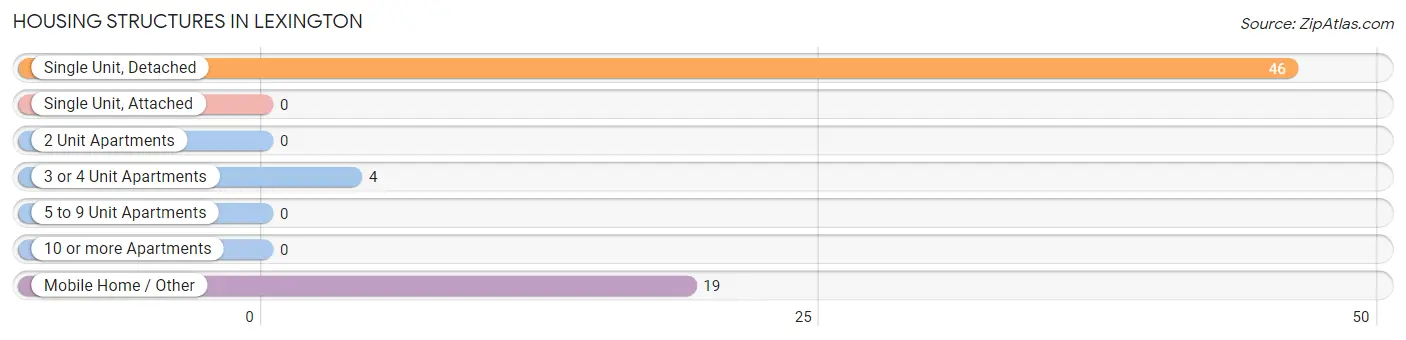
| Structure Type | # Housing Units | % Housing Units |
| Single Unit, Detached | 46 | 66.7% |
| Single Unit, Attached | 0 | 0.0% |
| 2 Unit Apartments | 0 | 0.0% |
| 3 or 4 Unit Apartments | 4 | 5.8% |
| 5 to 9 Unit Apartments | 0 | 0.0% |
| 10 or more Apartments | 0 | 0.0% |
| Mobile Home / Other | 19 | 27.5% |
| Total | 69 | 100.0% |
Housing Structures by Occupancy in Lexington
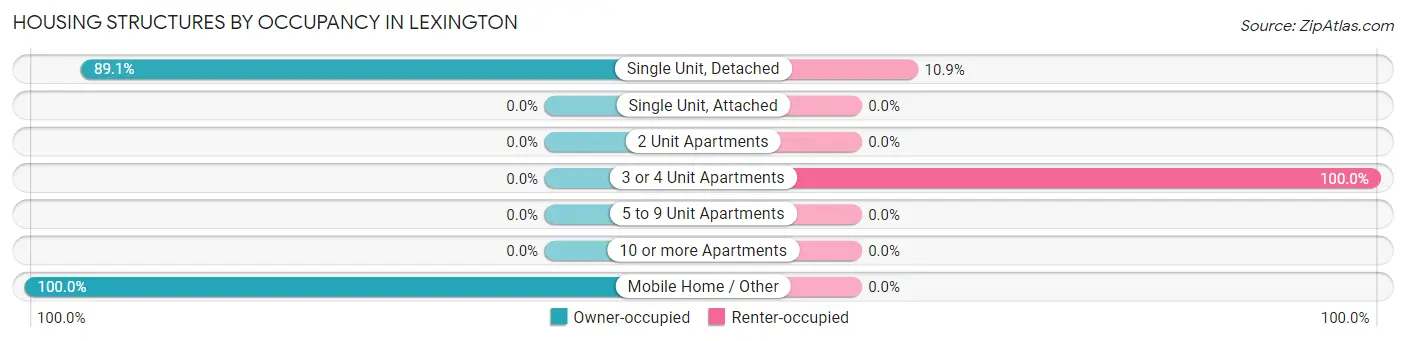
| Structure Type | Owner-occupied | Renter-occupied |
| Single Unit, Detached | 41 (89.1%) | 5 (10.9%) |
| Single Unit, Attached | 0 (0.0%) | 0 (0.0%) |
| 2 Unit Apartments | 0 (0.0%) | 0 (0.0%) |
| 3 or 4 Unit Apartments | 0 (0.0%) | 4 (100.0%) |
| 5 to 9 Unit Apartments | 0 (0.0%) | 0 (0.0%) |
| 10 or more Apartments | 0 (0.0%) | 0 (0.0%) |
| Mobile Home / Other | 19 (100.0%) | 0 (0.0%) |
| Total | 60 (87.0%) | 9 (13.0%) |
Housing Structures by Number of Rooms in Lexington
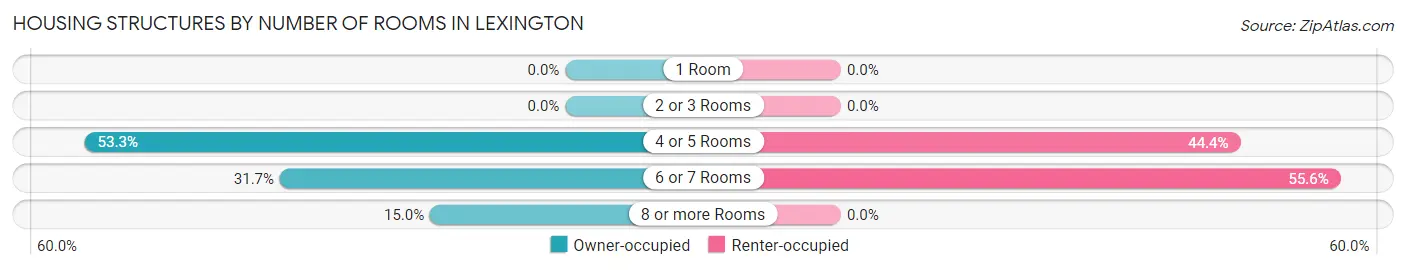
| Number of Rooms | Owner-occupied | Renter-occupied |
| 1 Room | 0 (0.0%) | 0 (0.0%) |
| 2 or 3 Rooms | 0 (0.0%) | 0 (0.0%) |
| 4 or 5 Rooms | 32 (53.3%) | 4 (44.4%) |
| 6 or 7 Rooms | 19 (31.7%) | 5 (55.6%) |
| 8 or more Rooms | 9 (15.0%) | 0 (0.0%) |
| Total | 60 (100.0%) | 9 (100.0%) |
Housing Structure by Heating Type in Lexington
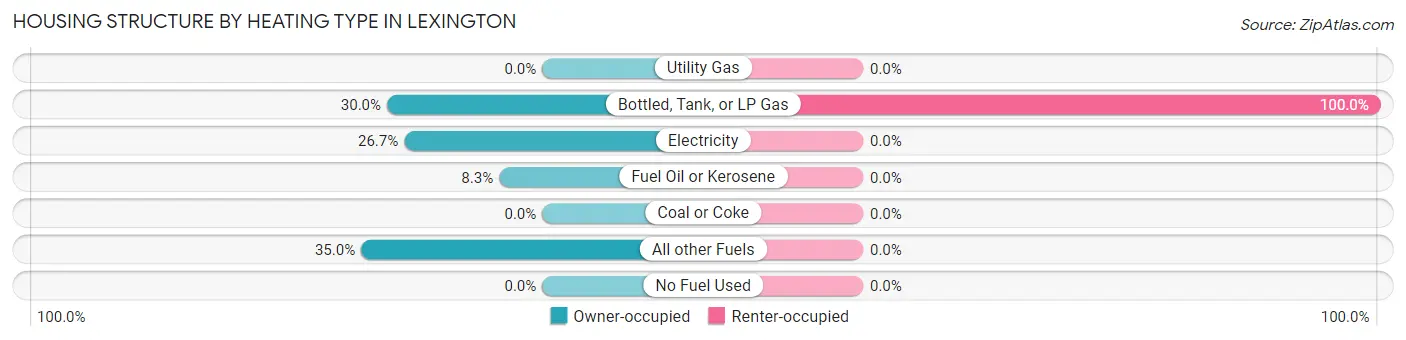
| Heating Type | Owner-occupied | Renter-occupied |
| Utility Gas | 0 (0.0%) | 0 (0.0%) |
| Bottled, Tank, or LP Gas | 18 (30.0%) | 9 (100.0%) |
| Electricity | 16 (26.7%) | 0 (0.0%) |
| Fuel Oil or Kerosene | 5 (8.3%) | 0 (0.0%) |
| Coal or Coke | 0 (0.0%) | 0 (0.0%) |
| All other Fuels | 21 (35.0%) | 0 (0.0%) |
| No Fuel Used | 0 (0.0%) | 0 (0.0%) |
| Total | 60 (100.0%) | 9 (100.0%) |
Household Vehicle Usage in Lexington
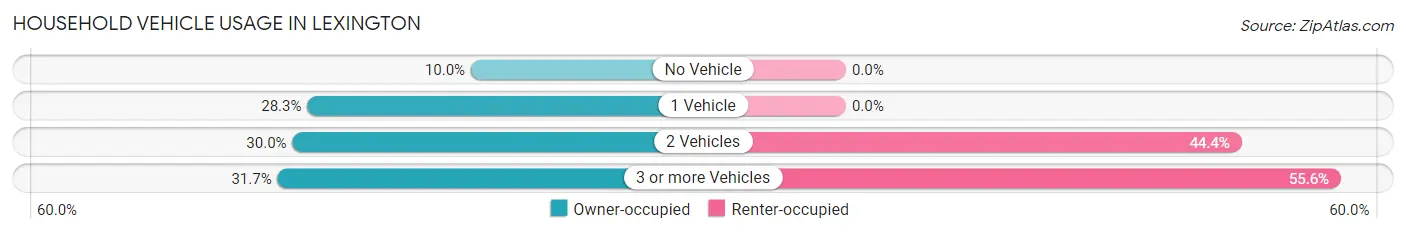
| Vehicles per Household | Owner-occupied | Renter-occupied |
| No Vehicle | 6 (10.0%) | 0 (0.0%) |
| 1 Vehicle | 17 (28.3%) | 0 (0.0%) |
| 2 Vehicles | 18 (30.0%) | 4 (44.4%) |
| 3 or more Vehicles | 19 (31.7%) | 5 (55.6%) |
| Total | 60 (100.0%) | 9 (100.0%) |
Real Estate & Mortgages in Lexington
Real Estate and Mortgage Overview in Lexington
| Characteristic | Without Mortgage | With Mortgage |
| Housing Units | 44 | 16 |
| Median Property Value | $187,500 | $162,500 |
| Median Household Income | $35,500 | $0 |
| Monthly Housing Costs | $421 | $0 |
| Real Estate Taxes | $982 | $0 |
Property Value by Mortgage Status in Lexington
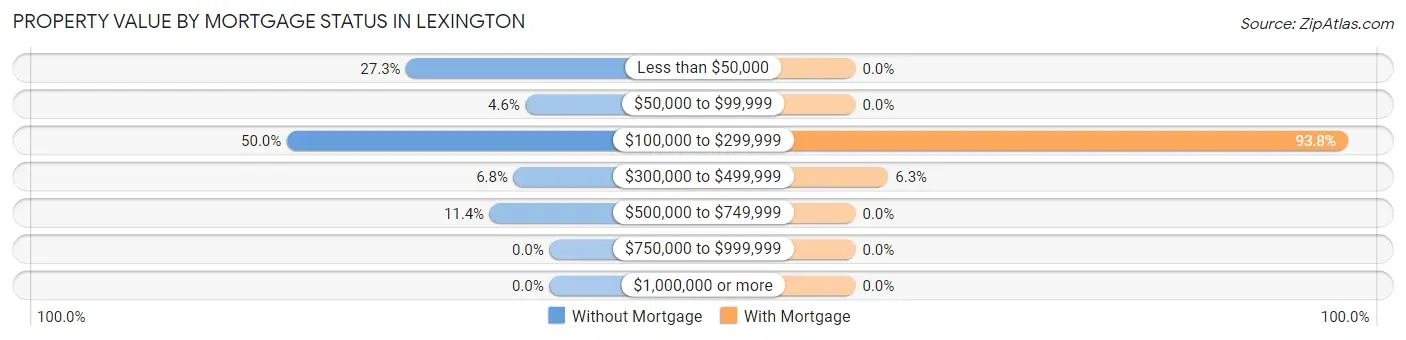
| Property Value | Without Mortgage | With Mortgage |
| Less than $50,000 | 12 (27.3%) | 0 (0.0%) |
| $50,000 to $99,999 | 2 (4.5%) | 0 (0.0%) |
| $100,000 to $299,999 | 22 (50.0%) | 15 (93.8%) |
| $300,000 to $499,999 | 3 (6.8%) | 1 (6.2%) |
| $500,000 to $749,999 | 5 (11.4%) | 0 (0.0%) |
| $750,000 to $999,999 | 0 (0.0%) | 0 (0.0%) |
| $1,000,000 or more | 0 (0.0%) | 0 (0.0%) |
| Total | 44 (100.0%) | 16 (100.0%) |
Household Income by Mortgage Status in Lexington
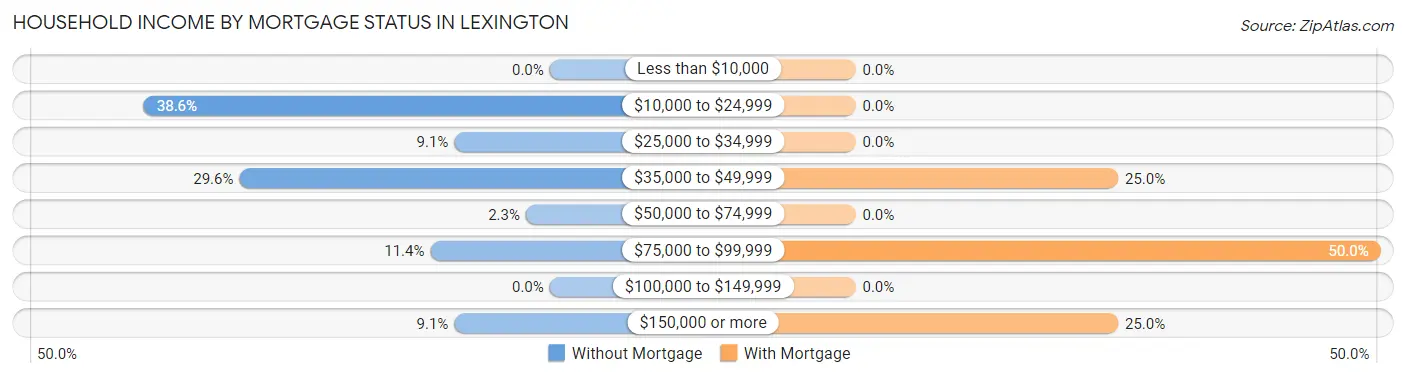
| Household Income | Without Mortgage | With Mortgage |
| Less than $10,000 | 0 (0.0%) | 0 (0.0%) |
| $10,000 to $24,999 | 17 (38.6%) | 0 (0.0%) |
| $25,000 to $34,999 | 4 (9.1%) | 0 (0.0%) |
| $35,000 to $49,999 | 13 (29.5%) | 4 (25.0%) |
| $50,000 to $74,999 | 1 (2.3%) | 0 (0.0%) |
| $75,000 to $99,999 | 5 (11.4%) | 8 (50.0%) |
| $100,000 to $149,999 | 0 (0.0%) | 0 (0.0%) |
| $150,000 or more | 4 (9.1%) | 4 (25.0%) |
| Total | 44 (100.0%) | 16 (100.0%) |
Property Value to Household Income Ratio in Lexington
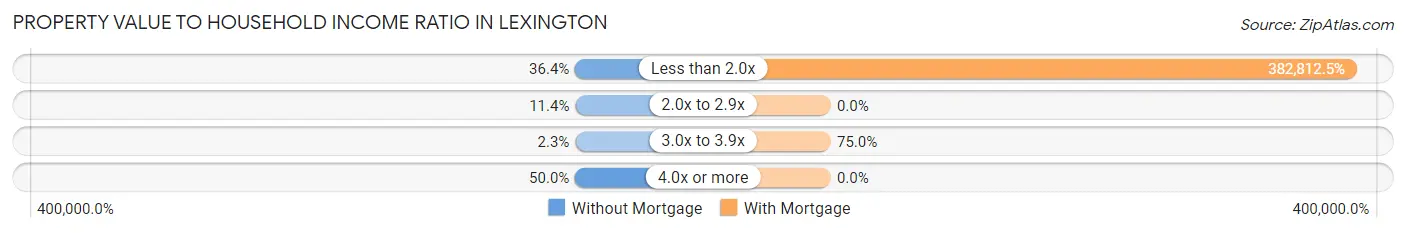
| Value-to-Income Ratio | Without Mortgage | With Mortgage |
| Less than 2.0x | 16 (36.4%) | 61,250 (382,812.5%) |
| 2.0x to 2.9x | 5 (11.4%) | 0 (0.0%) |
| 3.0x to 3.9x | 1 (2.3%) | 12 (75.0%) |
| 4.0x or more | 22 (50.0%) | 0 (0.0%) |
| Total | 44 (100.0%) | 16 (100.0%) |
Real Estate Taxes by Mortgage Status in Lexington
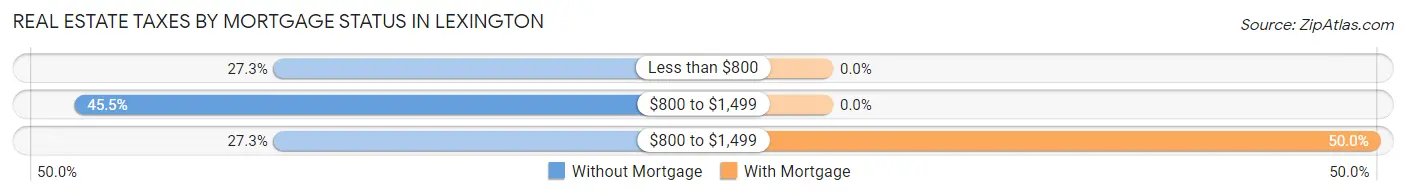
| Property Taxes | Without Mortgage | With Mortgage |
| Less than $800 | 12 (27.3%) | 0 (0.0%) |
| $800 to $1,499 | 20 (45.5%) | 0 (0.0%) |
| $800 to $1,499 | 12 (27.3%) | 8 (50.0%) |
| Total | 44 (100.0%) | 16 (100.0%) |
Health & Disability in Lexington
Health Insurance Coverage by Age in Lexington
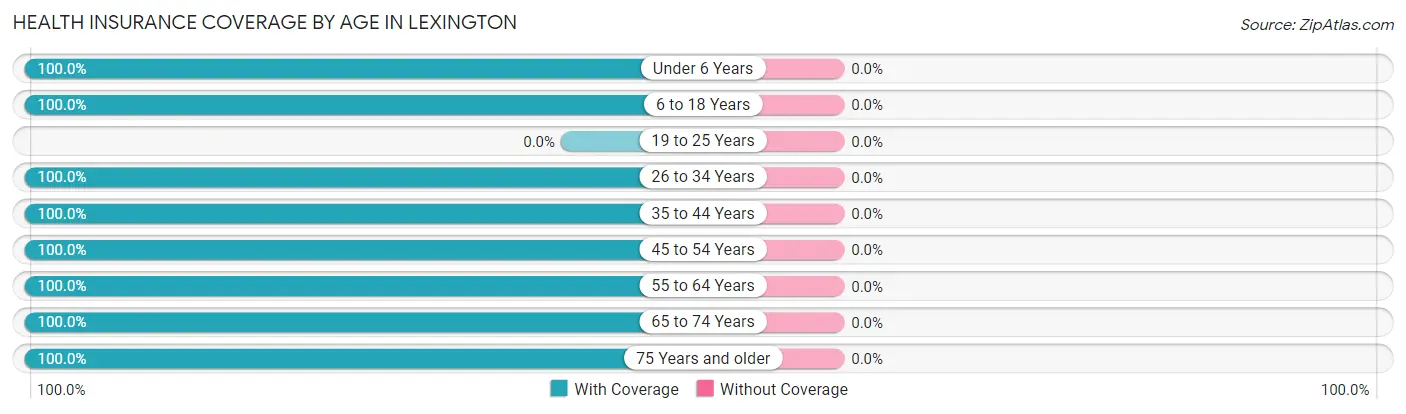
| Age Bracket | With Coverage | Without Coverage |
| Under 6 Years | 17 (100.0%) | 0 (0.0%) |
| 6 to 18 Years | 14 (100.0%) | 0 (0.0%) |
| 19 to 25 Years | 0 (0.0%) | 0 (0.0%) |
| 26 to 34 Years | 9 (100.0%) | 0 (0.0%) |
| 35 to 44 Years | 16 (100.0%) | 0 (0.0%) |
| 45 to 54 Years | 20 (100.0%) | 0 (0.0%) |
| 55 to 64 Years | 23 (100.0%) | 0 (0.0%) |
| 65 to 74 Years | 20 (100.0%) | 0 (0.0%) |
| 75 Years and older | 21 (100.0%) | 0 (0.0%) |
| Total | 140 (100.0%) | 0 (0.0%) |
Health Insurance Coverage by Citizenship Status in Lexington
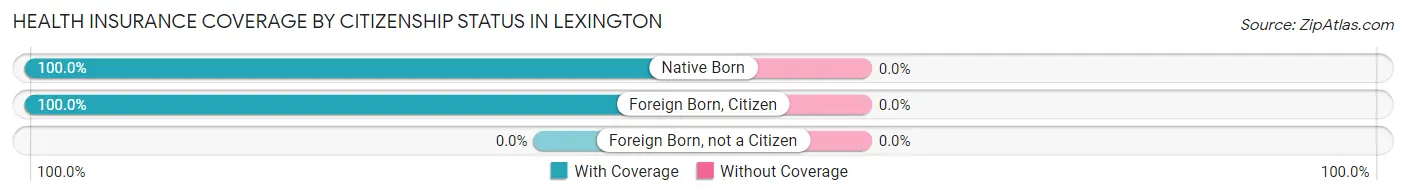
| Citizenship Status | With Coverage | Without Coverage |
| Native Born | 17 (100.0%) | 0 (0.0%) |
| Foreign Born, Citizen | 14 (100.0%) | 0 (0.0%) |
| Foreign Born, not a Citizen | 0 (0.0%) | 0 (0.0%) |
Health Insurance Coverage by Household Income in Lexington
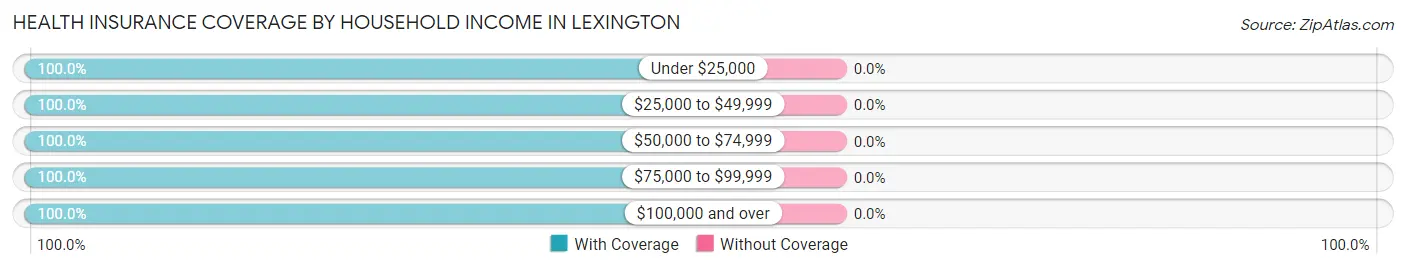
| Household Income | With Coverage | Without Coverage |
| Under $25,000 | 22 (100.0%) | 0 (0.0%) |
| $25,000 to $49,999 | 43 (100.0%) | 0 (0.0%) |
| $50,000 to $74,999 | 45 (100.0%) | 0 (0.0%) |
| $75,000 to $99,999 | 5 (100.0%) | 0 (0.0%) |
| $100,000 and over | 25 (100.0%) | 0 (0.0%) |
Public vs Private Health Insurance Coverage by Age in Lexington
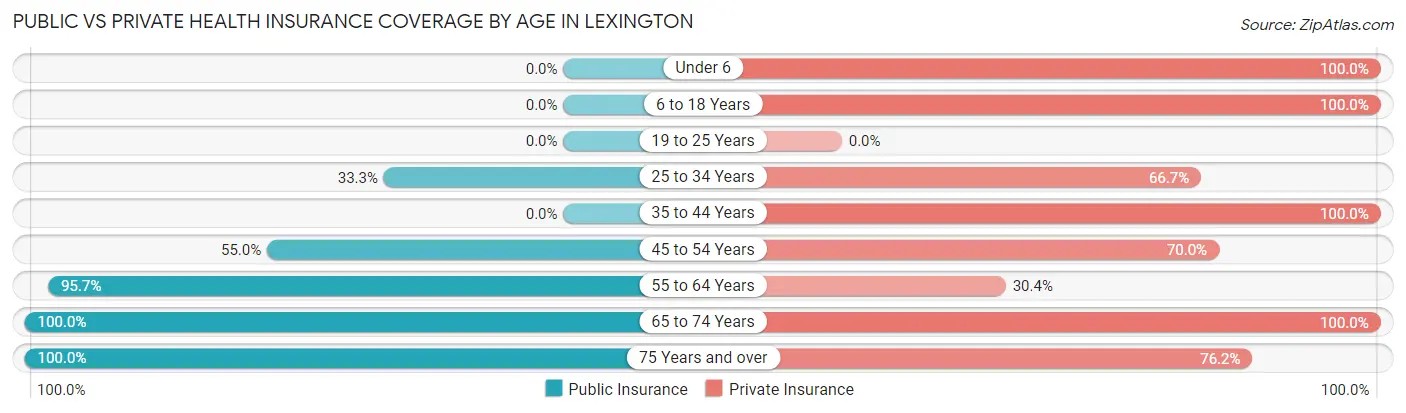
| Age Bracket | Public Insurance | Private Insurance |
| Under 6 | 0 (0.0%) | 17 (100.0%) |
| 6 to 18 Years | 0 (0.0%) | 14 (100.0%) |
| 19 to 25 Years | 0 (0.0%) | 0 (0.0%) |
| 25 to 34 Years | 3 (33.3%) | 6 (66.7%) |
| 35 to 44 Years | 0 (0.0%) | 16 (100.0%) |
| 45 to 54 Years | 11 (55.0%) | 14 (70.0%) |
| 55 to 64 Years | 22 (95.7%) | 7 (30.4%) |
| 65 to 74 Years | 20 (100.0%) | 20 (100.0%) |
| 75 Years and over | 21 (100.0%) | 16 (76.2%) |
| Total | 77 (55.0%) | 110 (78.6%) |
Disability Status by Sex by Age in Lexington
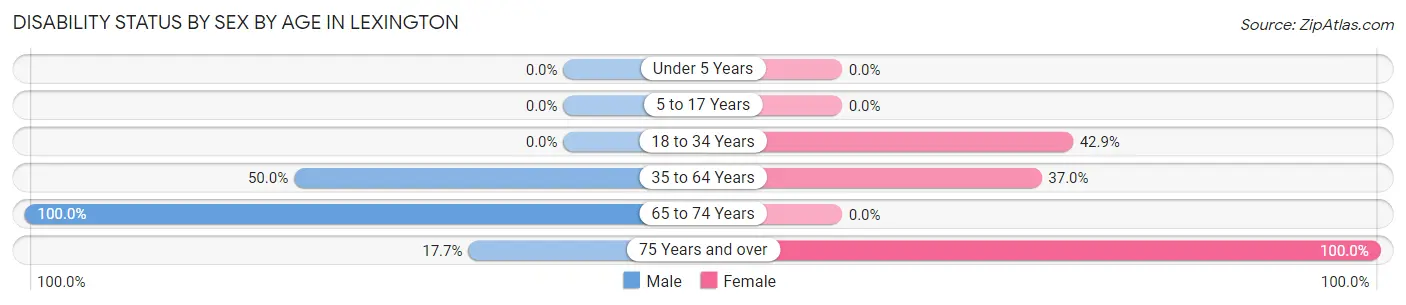
| Age Bracket | Male | Female |
| Under 5 Years | 0 (0.0%) | 0 (0.0%) |
| 5 to 17 Years | 0 (0.0%) | 0 (0.0%) |
| 18 to 34 Years | 0 (0.0%) | 3 (42.9%) |
| 35 to 64 Years | 16 (50.0%) | 10 (37.0%) |
| 65 to 74 Years | 13 (100.0%) | 0 (0.0%) |
| 75 Years and over | 3 (17.6%) | 4 (100.0%) |
Disability Class by Sex by Age in Lexington
Disability Class: Hearing Difficulty
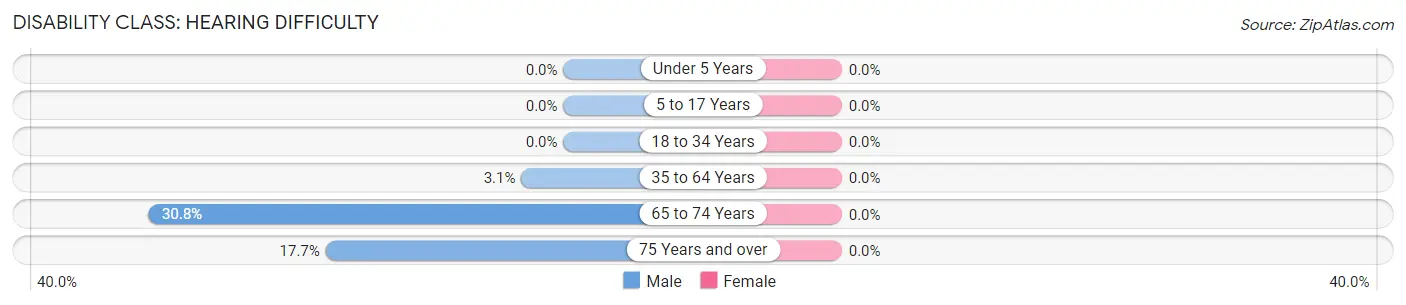
| Age Bracket | Male | Female |
| Under 5 Years | 0 (0.0%) | 0 (0.0%) |
| 5 to 17 Years | 0 (0.0%) | 0 (0.0%) |
| 18 to 34 Years | 0 (0.0%) | 0 (0.0%) |
| 35 to 64 Years | 1 (3.1%) | 0 (0.0%) |
| 65 to 74 Years | 4 (30.8%) | 0 (0.0%) |
| 75 Years and over | 3 (17.6%) | 0 (0.0%) |
Disability Class: Vision Difficulty
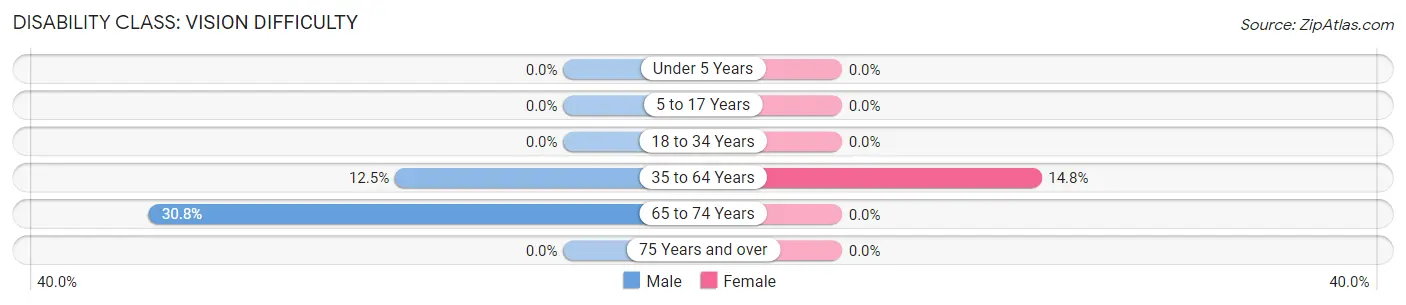
| Age Bracket | Male | Female |
| Under 5 Years | 0 (0.0%) | 0 (0.0%) |
| 5 to 17 Years | 0 (0.0%) | 0 (0.0%) |
| 18 to 34 Years | 0 (0.0%) | 0 (0.0%) |
| 35 to 64 Years | 4 (12.5%) | 4 (14.8%) |
| 65 to 74 Years | 4 (30.8%) | 0 (0.0%) |
| 75 Years and over | 0 (0.0%) | 0 (0.0%) |
Disability Class: Cognitive Difficulty
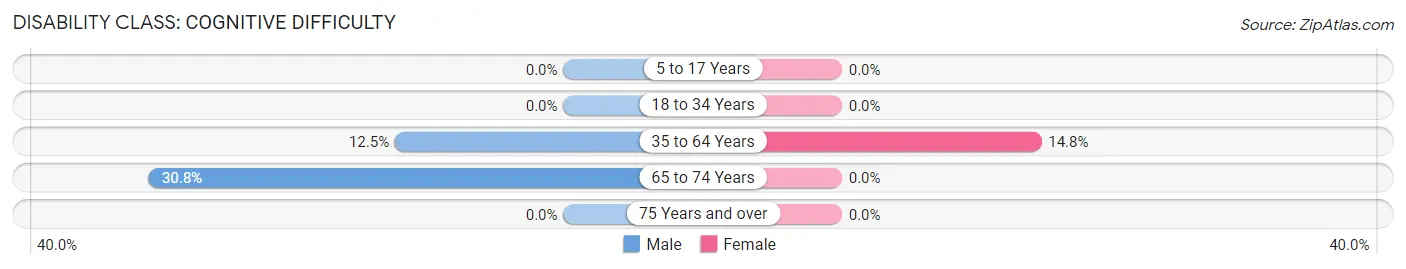
| Age Bracket | Male | Female |
| 5 to 17 Years | 0 (0.0%) | 0 (0.0%) |
| 18 to 34 Years | 0 (0.0%) | 0 (0.0%) |
| 35 to 64 Years | 4 (12.5%) | 4 (14.8%) |
| 65 to 74 Years | 4 (30.8%) | 0 (0.0%) |
| 75 Years and over | 0 (0.0%) | 0 (0.0%) |
Disability Class: Ambulatory Difficulty
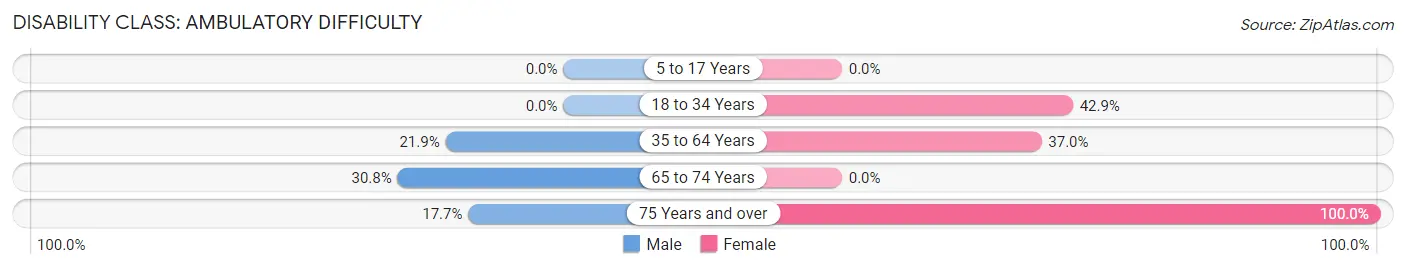
| Age Bracket | Male | Female |
| 5 to 17 Years | 0 (0.0%) | 0 (0.0%) |
| 18 to 34 Years | 0 (0.0%) | 3 (42.9%) |
| 35 to 64 Years | 7 (21.9%) | 10 (37.0%) |
| 65 to 74 Years | 4 (30.8%) | 0 (0.0%) |
| 75 Years and over | 3 (17.6%) | 4 (100.0%) |
Disability Class: Self-Care Difficulty
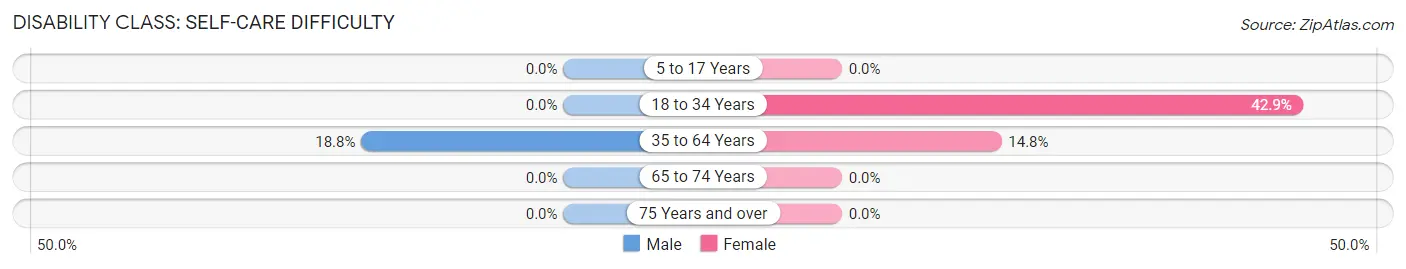
| Age Bracket | Male | Female |
| 5 to 17 Years | 0 (0.0%) | 0 (0.0%) |
| 18 to 34 Years | 0 (0.0%) | 3 (42.9%) |
| 35 to 64 Years | 6 (18.8%) | 4 (14.8%) |
| 65 to 74 Years | 0 (0.0%) | 0 (0.0%) |
| 75 Years and over | 0 (0.0%) | 0 (0.0%) |
Technology Access in Lexington
Computing Device Access in Lexington
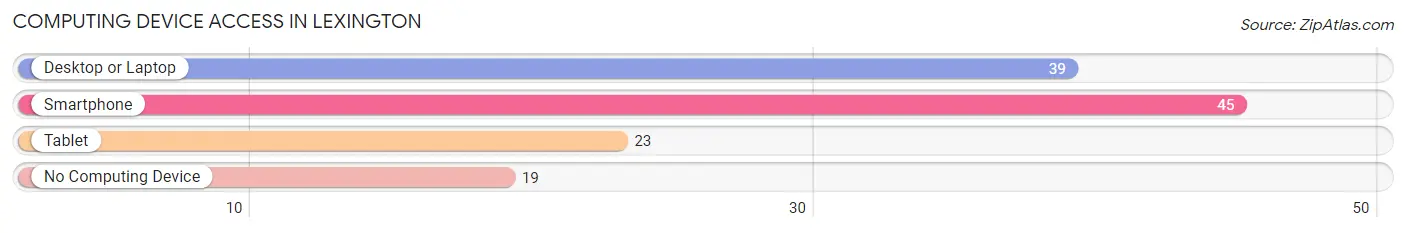
| Device Type | # Households | % Households |
| Desktop or Laptop | 39 | 56.5% |
| Smartphone | 45 | 65.2% |
| Tablet | 23 | 33.3% |
| No Computing Device | 19 | 27.5% |
| Total | 69 | 100.0% |
Internet Access in Lexington
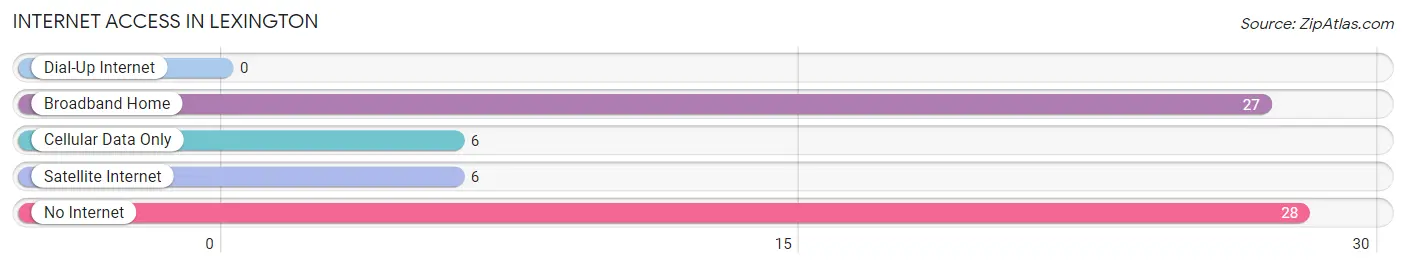
| Internet Type | # Households | % Households |
| Dial-Up Internet | 0 | 0.0% |
| Broadband Home | 27 | 39.1% |
| Cellular Data Only | 6 | 8.7% |
| Satellite Internet | 6 | 8.7% |
| No Internet | 28 | 40.6% |
| Total | 69 | 100.0% |
Lexington Summary
Lexington, Oregon is a small city located in the Willamette Valley of Oregon, about 20 miles south of Salem. It is part of the Salem Metropolitan Statistical Area and is the county seat of Polk County. The city has a population of about 1,500 people and is known for its small-town charm and rural atmosphere.
Geography
Lexington is located in the Willamette Valley of Oregon, about 20 miles south of Salem. The city is situated on the banks of the Luckiamute River, which flows through the city and is a popular spot for fishing and other recreational activities. The city is surrounded by rolling hills and farmland, and is located in the foothills of the Cascade Mountains. The climate in Lexington is mild and temperate, with warm summers and cool winters.
Economy
The economy of Lexington is largely based on agriculture and forestry. The city is home to several farms and ranches, and the surrounding area is known for its production of hazelnuts, grass seed, and other crops. The city is also home to several timber companies, which provide jobs for many of the city’s residents. In addition, Lexington is home to several small businesses, including restaurants, retail stores, and other services.
Demographics
As of the 2010 census, the population of Lexington was 1,521. The racial makeup of the city was 94.3% White, 0.7% African American, 0.3% Native American, 0.7% Asian, 0.1% Pacific Islander, 1.2% from other races, and 2.1% from two or more races. Hispanic or Latino of any race were 3.2% of the population.
The median income for a household in the city was $41,250, and the median income for a family was $50,000. The per capita income for the city was $20,845. About 11.2% of families and 14.2% of the population were below the poverty line, including 18.2% of those under age 18 and 8.3% of those age 65 or over.
History
Lexington was founded in 1851 by a group of settlers from the Oregon Trail. The city was named after Lexington, Kentucky, and was originally intended to be a farming community. The city was incorporated in 1872, and the first post office was established in 1873.
In the late 19th century, Lexington was a major center for the timber industry, and the city was home to several sawmills and lumber companies. The city was also home to several brickyards, which produced bricks for the construction of buildings in the city and throughout the region.
In the early 20th century, Lexington was a major center for the dairy industry, and the city was home to several dairy farms and creameries. The city was also home to several canneries, which produced canned fruits and vegetables for the local market.
In the late 20th century, Lexington began to transition away from its agricultural and industrial roots and towards a more service-oriented economy. The city is now home to several small businesses, including restaurants, retail stores, and other services. The city is also home to several wineries, which produce wines for the local market.
Common Questions
What is Per Capita Income in Lexington?
Per Capita income in Lexington is $25,301.
What is the Median Family Income in Lexington?
Median Family Income in Lexington is $39,063.
What is the Median Household income in Lexington?
Median Household Income in Lexington is $38,906.
What is Income or Wage Gap in Lexington?
Income or Wage Gap in Lexington is 16.7%.
Women in Lexington earn 83.3 cents for every dollar earned by a man.
What is Inequality or Gini Index in Lexington?
Inequality or Gini Index in Lexington is 0.36.
What is the Total Population of Lexington?
Total Population of Lexington is 140.
What is the Total Male Population of Lexington?
Total Male Population of Lexington is 80.
What is the Total Female Population of Lexington?
Total Female Population of Lexington is 60.
What is the Ratio of Males per 100 Females in Lexington?
There are 133.33 Males per 100 Females in Lexington.
What is the Ratio of Females per 100 Males in Lexington?
There are 75.00 Females per 100 Males in Lexington.
What is the Median Population Age in Lexington?
Median Population Age in Lexington is 53.9 Years.
What is the Average Family Size in Lexington
Average Family Size in Lexington is 2.8 People.
What is the Average Household Size in Lexington
Average Household Size in Lexington is 2.0 People.
How Large is the Labor Force in Lexington?
There are 53 People in the Labor Forcein in Lexington.
What is the Percentage of People in the Labor Force in Lexington?
46.1% of People are in the Labor Force in Lexington.
What is the Unemployment Rate in Lexington?
Unemployment Rate in Lexington is 3.8%.