Zip Codes with the Highest Percentage of Population Employed in Installation, Maintenance & Repair in Ponca City, OK
RELATED REPORTS & OPTIONS
Installation, Maintenance & Repair
Ponca City
Compare Zip Codes
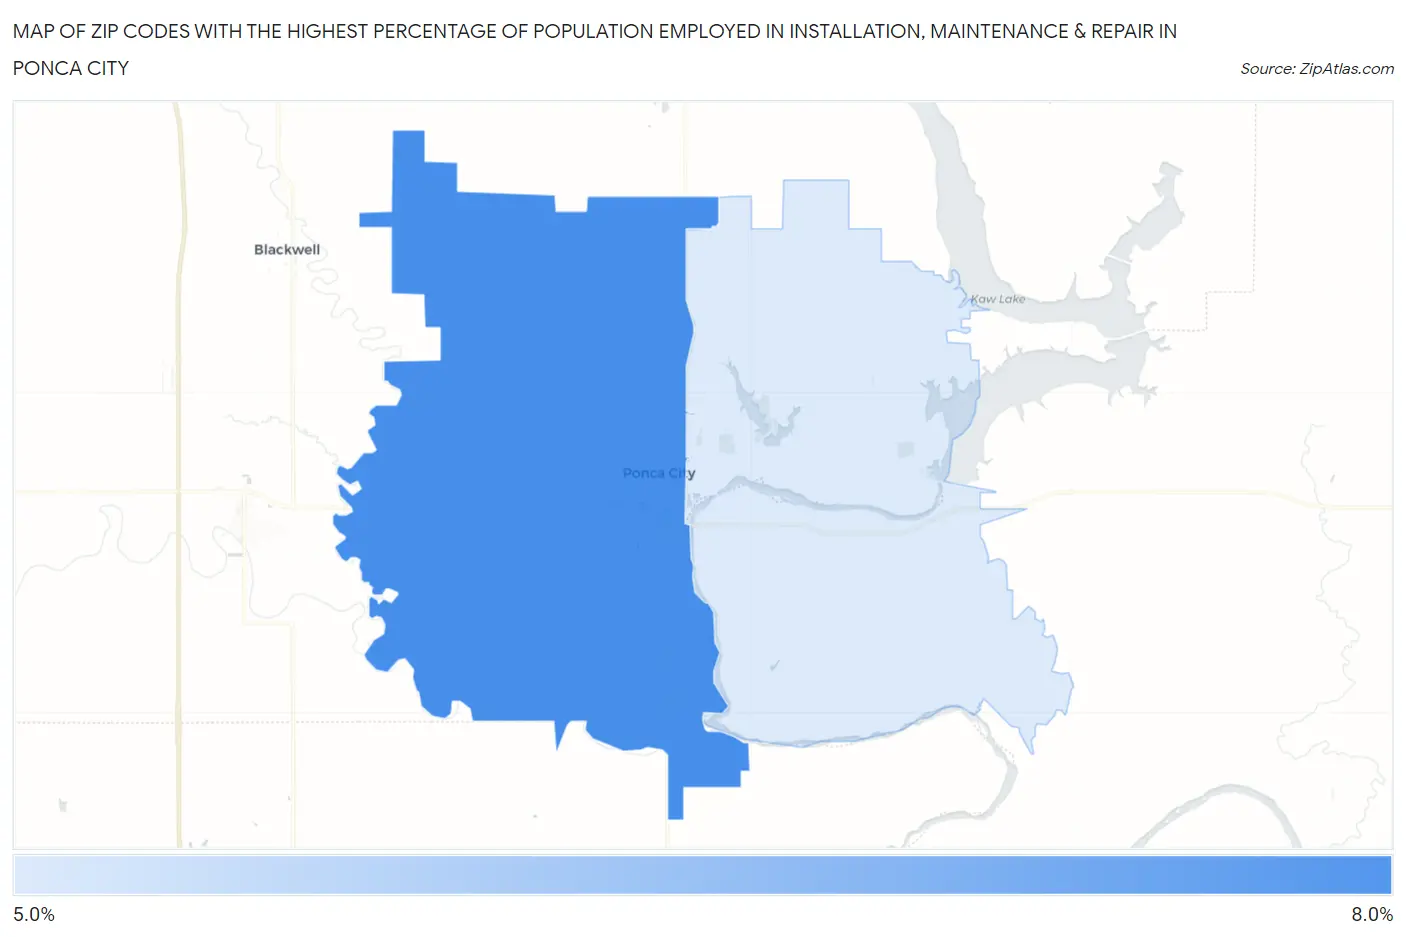
Map of Zip Codes with the Highest Percentage of Population Employed in Installation, Maintenance & Repair in Ponca City
5.7%
7.5%
Zip Codes with the Highest Percentage of Population Employed in Installation, Maintenance & Repair in Ponca City, OK
| Zip Code | % Employed | vs State | vs National | |
| 1. | 74601 | 7.5% | 4.2%(+3.34)#110 | 3.1%(+4.44)#3,815 |
| 2. | 74604 | 5.7% | 4.2%(+1.57)#196 | 3.1%(+2.67)#6,712 |
1
Common Questions
What are the Top Zip Codes with the Highest Percentage of Population Employed in Installation, Maintenance & Repair in Ponca City, OK?
Top Zip Codes with the Highest Percentage of Population Employed in Installation, Maintenance & Repair in Ponca City, OK are:
What zip code has the Highest Percentage of Population Employed in Installation, Maintenance & Repair in Ponca City, OK?
74601 has the Highest Percentage of Population Employed in Installation, Maintenance & Repair in Ponca City, OK with 7.5%.
What is the Percentage of Population Employed in Installation, Maintenance & Repair in Ponca City, OK?
Percentage of Population Employed in Installation, Maintenance & Repair in Ponca City is 7.1%.
What is the Percentage of Population Employed in Installation, Maintenance & Repair in Oklahoma?
Percentage of Population Employed in Installation, Maintenance & Repair in Oklahoma is 4.2%.
What is the Percentage of Population Employed in Installation, Maintenance & Repair in the United States?
Percentage of Population Employed in Installation, Maintenance & Repair in the United States is 3.1%.