Cliff, NM Map & Demographics
Cliff Map
Cliff Overview
$28,957
PER CAPITA INCOME
$44,500
AVG FAMILY INCOME
$36,000
AVG HOUSEHOLD INCOME
0.27
INEQUALITY / GINI INDEX
165
TOTAL POPULATION
92
MALE POPULATION
73
FEMALE POPULATION
126.03
MALES / 100 FEMALES
79.35
FEMALES / 100 MALES
68.3
MEDIAN AGE
2.7
AVG FAMILY SIZE
1.7
AVG HOUSEHOLD SIZE
52
LABOR FORCE [ PEOPLE ]
31.5%
PERCENT IN LABOR FORCE
Cliff Zip Codes
Cliff Area Codes
Income in Cliff
Income Overview in Cliff
Per Capita Income in Cliff is $28,957, while median incomes of families and households are $44,500 and $36,000 respectively.
| Characteristic | Number | Measure |
| Per Capita Income | 165 | $28,957 |
| Median Family Income | 40 | $44,500 |
| Mean Family Income | 40 | $48,430 |
| Median Household Income | 98 | $36,000 |
| Mean Household Income | 98 | $41,801 |
| Income Deficit | 40 | $0 |
| Wage / Income Gap (%) | 165 | 0.00% |
| Wage / Income Gap ($) | 165 | 100.00¢ per $1 |
| Gini / Inequality Index | 165 | 0.27 |
Earnings by Sex in Cliff
| Sex | Number | Average Earnings |
| Male | 63 (91.3%) | $0 |
| Female | 6 (8.7%) | $0 |
| Total | 69 (100.0%) | $0 |
Earnings by Sex by Income Bracket in Cliff
The most common earnings brackets in Cliff are $35,000 to $39,999 for men (20 | 31.8%) and $75,000 to $99,999 for women (6 | 100.0%).
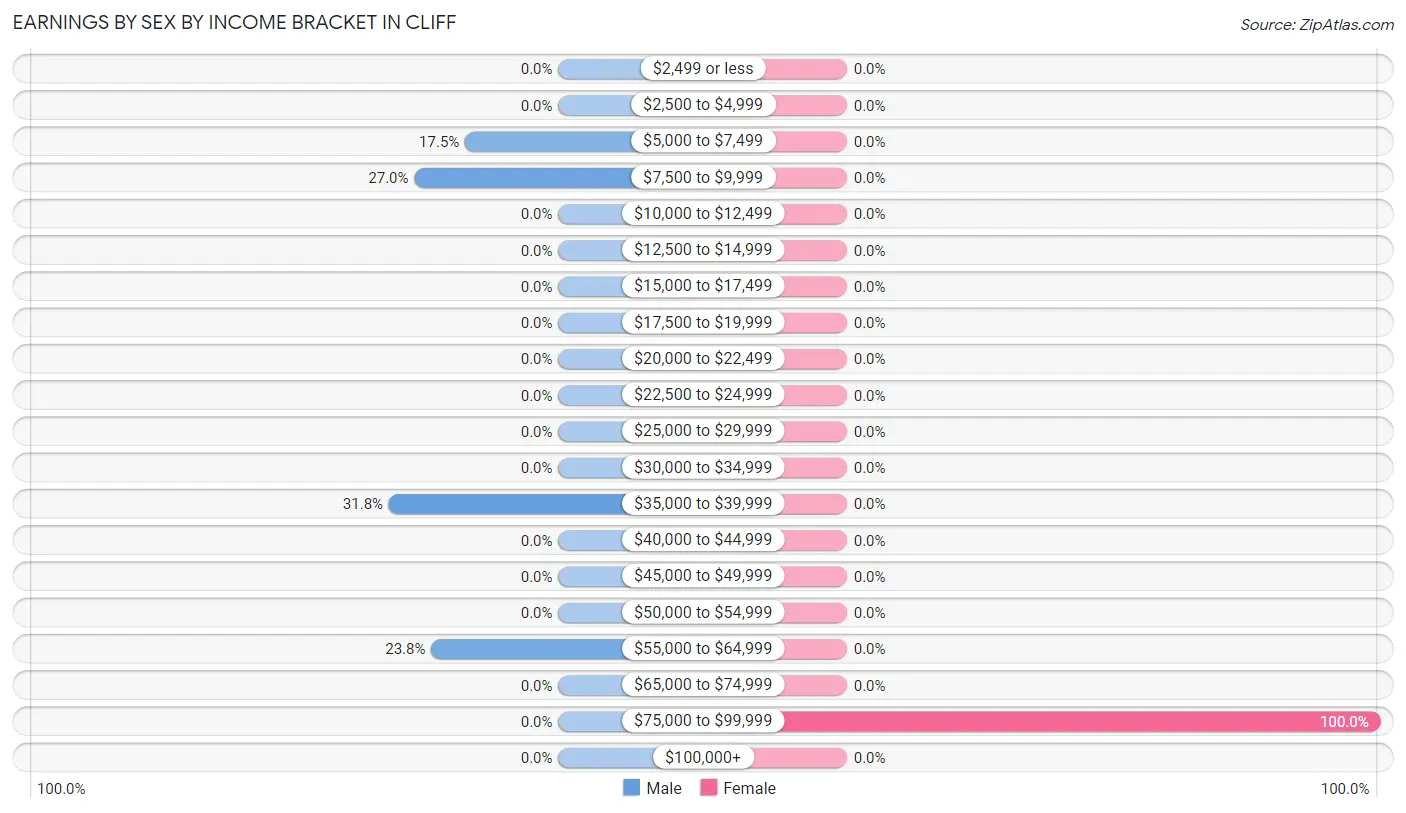
| Income | Male | Female |
| $2,499 or less | 0 (0.0%) | 0 (0.0%) |
| $2,500 to $4,999 | 0 (0.0%) | 0 (0.0%) |
| $5,000 to $7,499 | 11 (17.5%) | 0 (0.0%) |
| $7,500 to $9,999 | 17 (27.0%) | 0 (0.0%) |
| $10,000 to $12,499 | 0 (0.0%) | 0 (0.0%) |
| $12,500 to $14,999 | 0 (0.0%) | 0 (0.0%) |
| $15,000 to $17,499 | 0 (0.0%) | 0 (0.0%) |
| $17,500 to $19,999 | 0 (0.0%) | 0 (0.0%) |
| $20,000 to $22,499 | 0 (0.0%) | 0 (0.0%) |
| $22,500 to $24,999 | 0 (0.0%) | 0 (0.0%) |
| $25,000 to $29,999 | 0 (0.0%) | 0 (0.0%) |
| $30,000 to $34,999 | 0 (0.0%) | 0 (0.0%) |
| $35,000 to $39,999 | 20 (31.8%) | 0 (0.0%) |
| $40,000 to $44,999 | 0 (0.0%) | 0 (0.0%) |
| $45,000 to $49,999 | 0 (0.0%) | 0 (0.0%) |
| $50,000 to $54,999 | 0 (0.0%) | 0 (0.0%) |
| $55,000 to $64,999 | 15 (23.8%) | 0 (0.0%) |
| $65,000 to $74,999 | 0 (0.0%) | 0 (0.0%) |
| $75,000 to $99,999 | 0 (0.0%) | 6 (100.0%) |
| $100,000+ | 0 (0.0%) | 0 (0.0%) |
| Total | 63 (100.0%) | 6 (100.0%) |
Earnings by Sex by Educational Attainment in Cliff
| Educational Attainment | Male Income | Female Income |
| Less than High School | - | - |
| High School Diploma | - | - |
| College or Associate's Degree | - | - |
| Bachelor's Degree | - | - |
| Graduate Degree | - | - |
| Total | - | - |
Family Income in Cliff
Family Income Brackets in Cliff
According to the Cliff family income data, there are 16 families falling into the $25,000 to $34,999 income range, which is the most common income bracket and makes up 40.0% of all families.
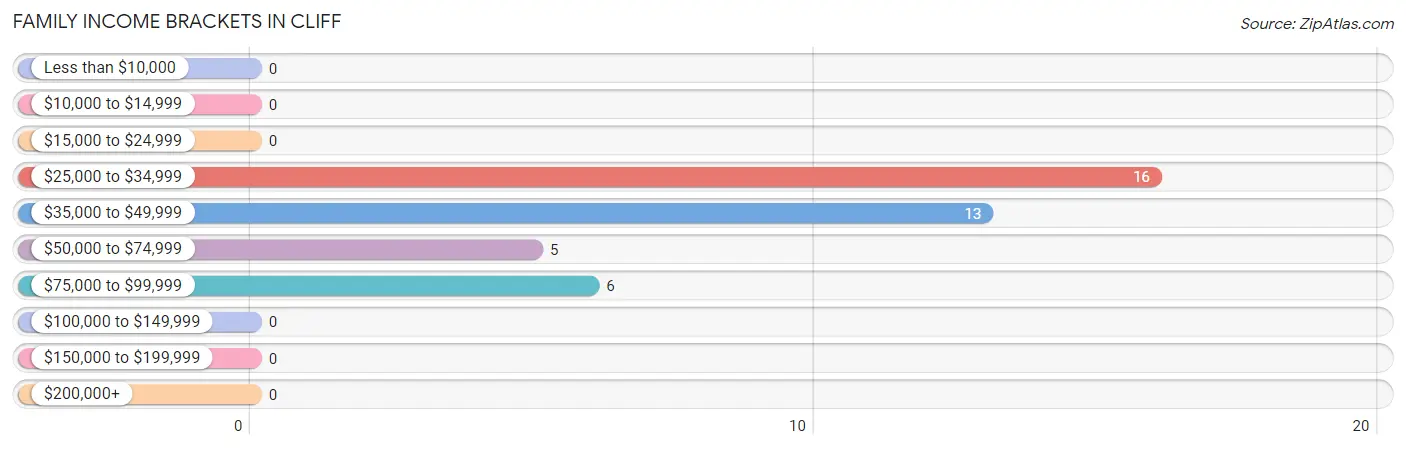
| Income Bracket | # Families | % Families |
| Less than $10,000 | 0 | 0.0% |
| $10,000 to $14,999 | 0 | 0.0% |
| $15,000 to $24,999 | 0 | 0.0% |
| $25,000 to $34,999 | 16 | 40.0% |
| $35,000 to $49,999 | 13 | 32.5% |
| $50,000 to $74,999 | 5 | 12.5% |
| $75,000 to $99,999 | 6 | 15.0% |
| $100,000 to $149,999 | 0 | 0.0% |
| $150,000 to $199,999 | 0 | 0.0% |
| $200,000+ | 0 | 0.0% |
Family Income by Famaliy Size in Cliff
2-person families (40 | 100.0%) account for the highest median family income in Cliff with $44,500 per family, while 2-person families (40 | 100.0%) have the highest median income of $22,250 per family member.
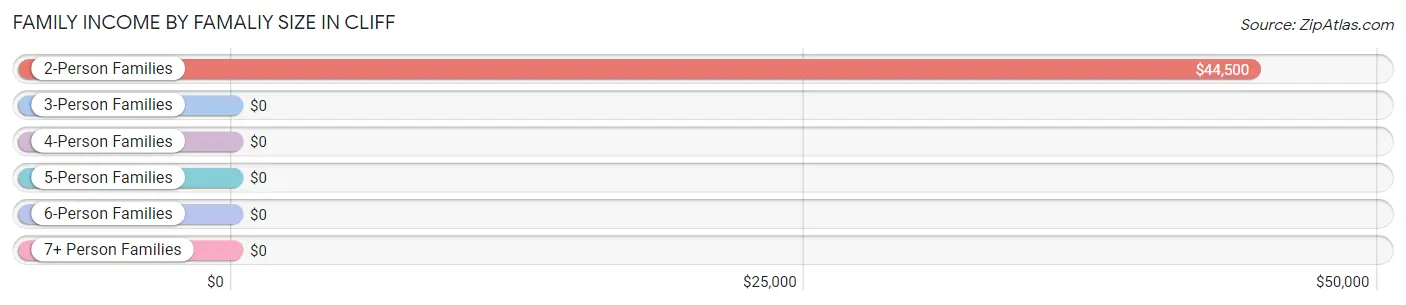
| Income Bracket | # Families | Median Income |
| 2-Person Families | 40 (100.0%) | $44,500 |
| 3-Person Families | 0 (0.0%) | $0 |
| 4-Person Families | 0 (0.0%) | $0 |
| 5-Person Families | 0 (0.0%) | $0 |
| 6-Person Families | 0 (0.0%) | $0 |
| 7+ Person Families | 0 (0.0%) | $0 |
| Total | 40 (100.0%) | $44,500 |
Family Income by Number of Earners in Cliff
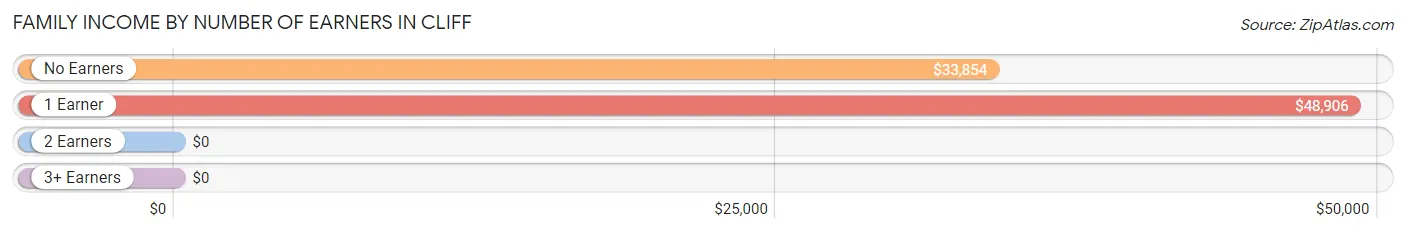
| Number of Earners | # Families | Median Income |
| No Earners | 21 (52.5%) | $33,854 |
| 1 Earner | 19 (47.5%) | $48,906 |
| 2 Earners | 0 (0.0%) | $0 |
| 3+ Earners | 0 (0.0%) | $0 |
| Total | 40 (100.0%) | $44,500 |
Household Income in Cliff
Household Income Brackets in Cliff
With 40 households falling in the category, the $35,000 to $49,999 income range is the most frequent in Cliff, accounting for 40.8% of all households.
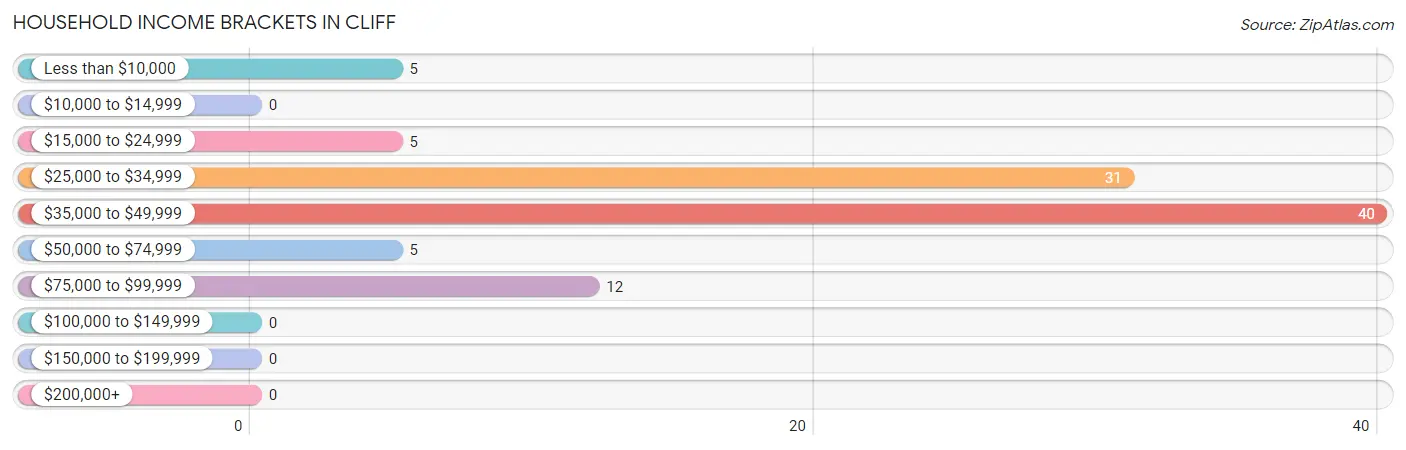
| Income Bracket | # Households | % Households |
| Less than $10,000 | 5 | 5.1% |
| $10,000 to $14,999 | 0 | 0.0% |
| $15,000 to $24,999 | 5 | 5.1% |
| $25,000 to $34,999 | 31 | 31.6% |
| $35,000 to $49,999 | 40 | 40.8% |
| $50,000 to $74,999 | 5 | 5.1% |
| $75,000 to $99,999 | 12 | 12.2% |
| $100,000 to $149,999 | 0 | 0.0% |
| $150,000 to $199,999 | 0 | 0.0% |
| $200,000+ | 0 | 0.0% |
Household Income by Householder Age in Cliff
The median household income in Cliff is $36,000, with the highest median household income of $34,583 found in the 65+ years age bracket for the primary householder. A total of 78 households (79.6%) fall into this category.
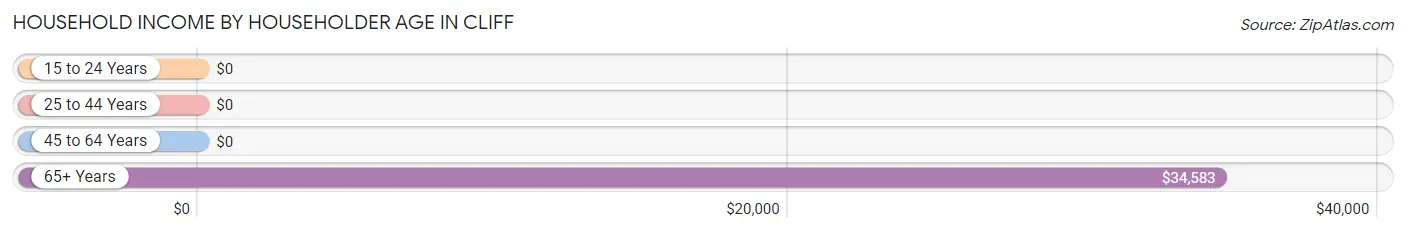
| Income Bracket | # Households | Median Income |
| 15 to 24 Years | 0 (0.0%) | $0 |
| 25 to 44 Years | 0 (0.0%) | $0 |
| 45 to 64 Years | 20 (20.4%) | $0 |
| 65+ Years | 78 (79.6%) | $34,583 |
| Total | 98 (100.0%) | $36,000 |
Poverty in Cliff
Income Below Poverty by Sex and Age in Cliff
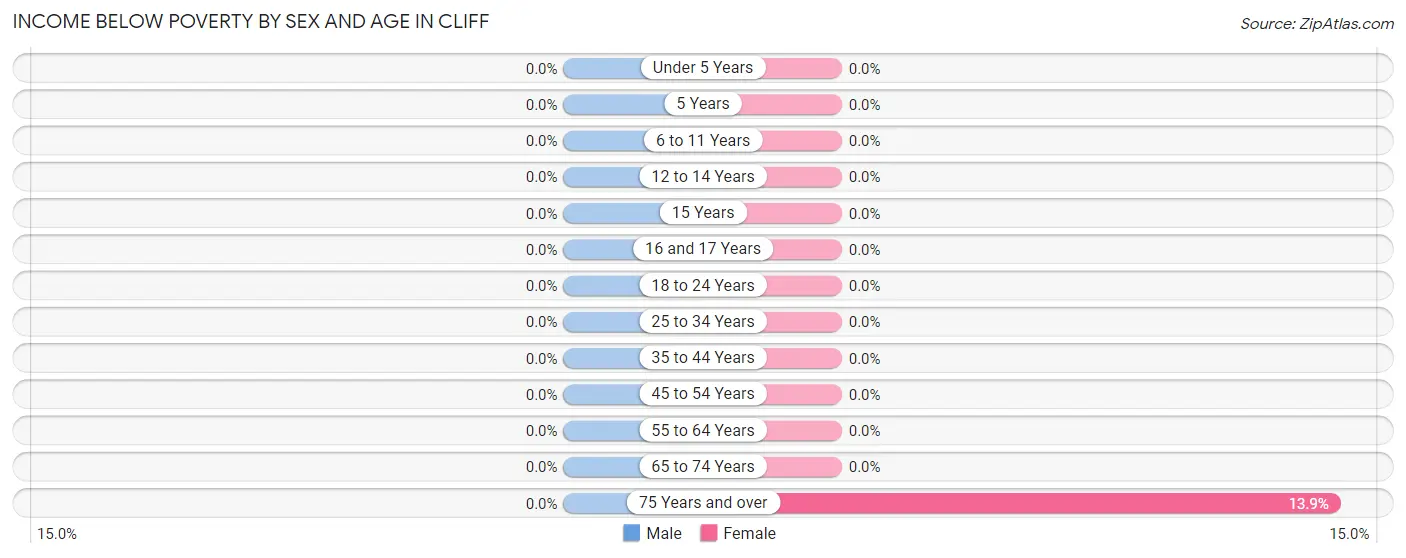
| Age Bracket | Male | Female |
| Under 5 Years | 0 (0.0%) | 0 (0.0%) |
| 5 Years | 0 (0.0%) | 0 (0.0%) |
| 6 to 11 Years | 0 (0.0%) | 0 (0.0%) |
| 12 to 14 Years | 0 (0.0%) | 0 (0.0%) |
| 15 Years | 0 (0.0%) | 0 (0.0%) |
| 16 and 17 Years | 0 (0.0%) | 0 (0.0%) |
| 18 to 24 Years | 0 (0.0%) | 0 (0.0%) |
| 25 to 34 Years | 0 (0.0%) | 0 (0.0%) |
| 35 to 44 Years | 0 (0.0%) | 0 (0.0%) |
| 45 to 54 Years | 0 (0.0%) | 0 (0.0%) |
| 55 to 64 Years | 0 (0.0%) | 0 (0.0%) |
| 65 to 74 Years | 0 (0.0%) | 0 (0.0%) |
| 75 Years and over | 0 (0.0%) | 5 (13.9%) |
| Total | 0 (0.0%) | 5 (6.9%) |
Income Above Poverty by Sex and Age in Cliff
According to the poverty statistics in Cliff, males aged 45 to 54 years and females aged 55 to 64 years are the age groups that are most secure financially, with 100.0% of males and 100.0% of females in these age groups living above the poverty line.
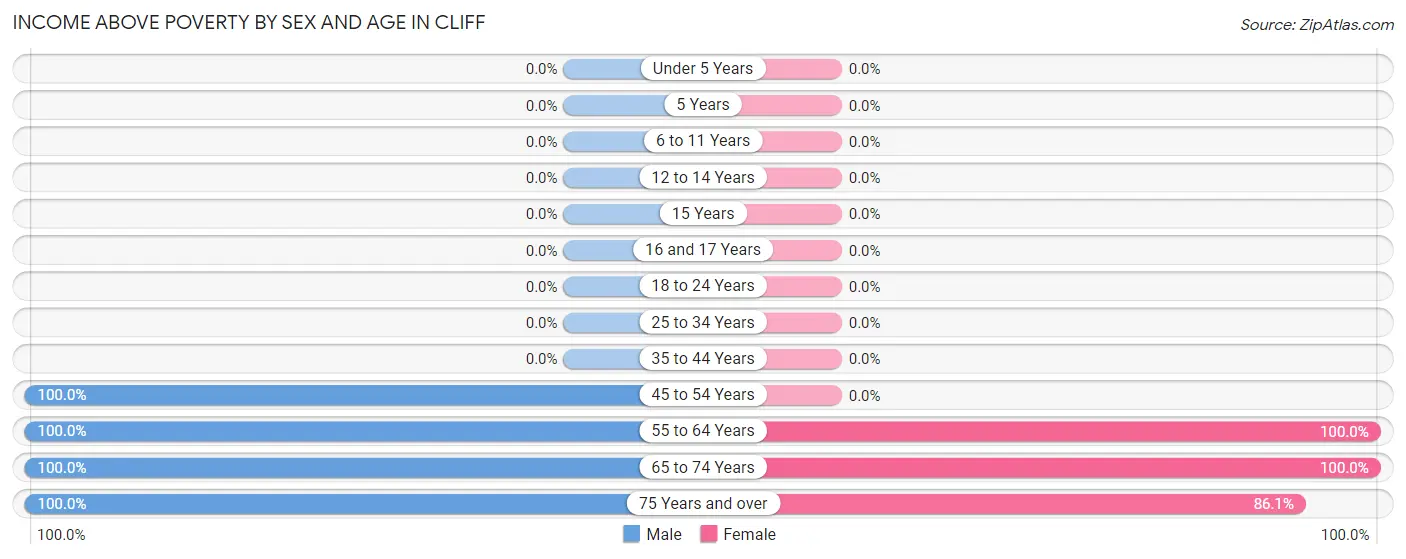
| Age Bracket | Male | Female |
| Under 5 Years | 0 (0.0%) | 0 (0.0%) |
| 5 Years | 0 (0.0%) | 0 (0.0%) |
| 6 to 11 Years | 0 (0.0%) | 0 (0.0%) |
| 12 to 14 Years | 0 (0.0%) | 0 (0.0%) |
| 15 Years | 0 (0.0%) | 0 (0.0%) |
| 16 and 17 Years | 0 (0.0%) | 0 (0.0%) |
| 18 to 24 Years | 0 (0.0%) | 0 (0.0%) |
| 25 to 34 Years | 0 (0.0%) | 0 (0.0%) |
| 35 to 44 Years | 0 (0.0%) | 0 (0.0%) |
| 45 to 54 Years | 35 (100.0%) | 0 (0.0%) |
| 55 to 64 Years | 28 (100.0%) | 5 (100.0%) |
| 65 to 74 Years | 10 (100.0%) | 32 (100.0%) |
| 75 Years and over | 19 (100.0%) | 31 (86.1%) |
| Total | 92 (100.0%) | 68 (93.1%) |
Income Below Poverty Among Married-Couple Families in Cliff
| Children | Above Poverty | Below Poverty |
| No Children | 21 (100.0%) | 0 (0.0%) |
| 1 or 2 Children | 0 (0.0%) | 0 (0.0%) |
| 3 or 4 Children | 0 (0.0%) | 0 (0.0%) |
| 5 or more Children | 0 (0.0%) | 0 (0.0%) |
| Total | 21 (100.0%) | 0 (0.0%) |
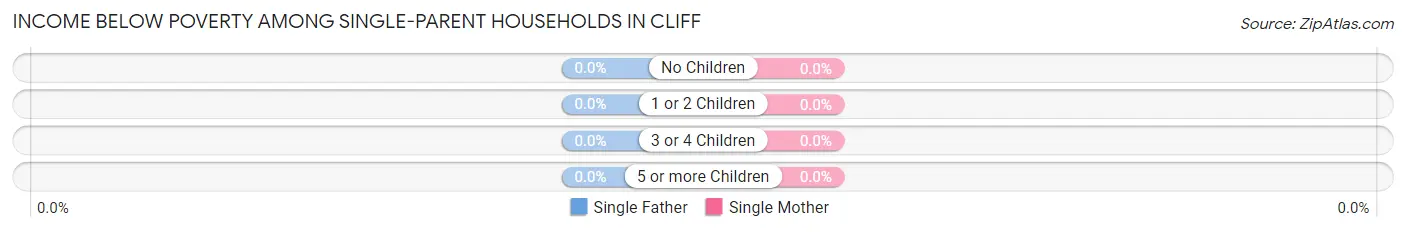
Income Below Poverty Among Single-Parent Households in Cliff
| Children | Single Father | Single Mother |
| No Children | 0 (0.0%) | 0 (0.0%) |
| 1 or 2 Children | 0 (0.0%) | 0 (0.0%) |
| 3 or 4 Children | 0 (0.0%) | 0 (0.0%) |
| 5 or more Children | 0 (0.0%) | 0 (0.0%) |
| Total | 0 (0.0%) | 0 (0.0%) |
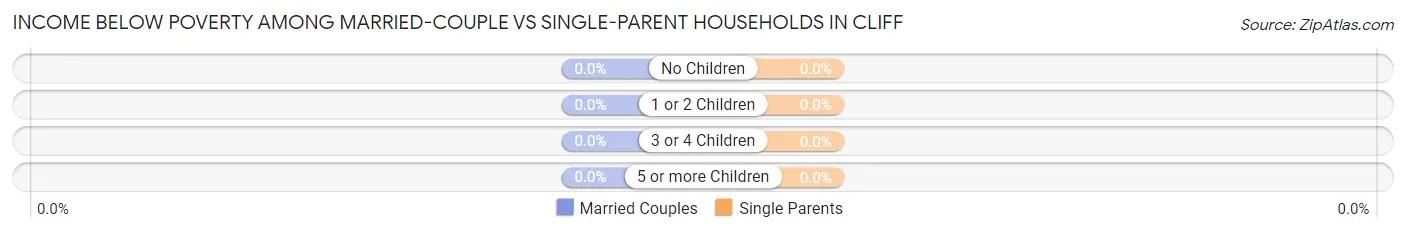
Income Below Poverty Among Married-Couple vs Single-Parent Households in Cliff
| Children | Married-Couple Families | Single-Parent Households |
| No Children | 0 (0.0%) | 0 (0.0%) |
| 1 or 2 Children | 0 (0.0%) | 0 (0.0%) |
| 3 or 4 Children | 0 (0.0%) | 0 (0.0%) |
| 5 or more Children | 0 (0.0%) | 0 (0.0%) |
| Total | 0 (0.0%) | 0 (0.0%) |
Race in Cliff
The most populous races in Cliff are White / Caucasian (156 | 94.6%), Hispanic or Latino (42 | 25.5%), and Two or more Races (9 | 5.4%).
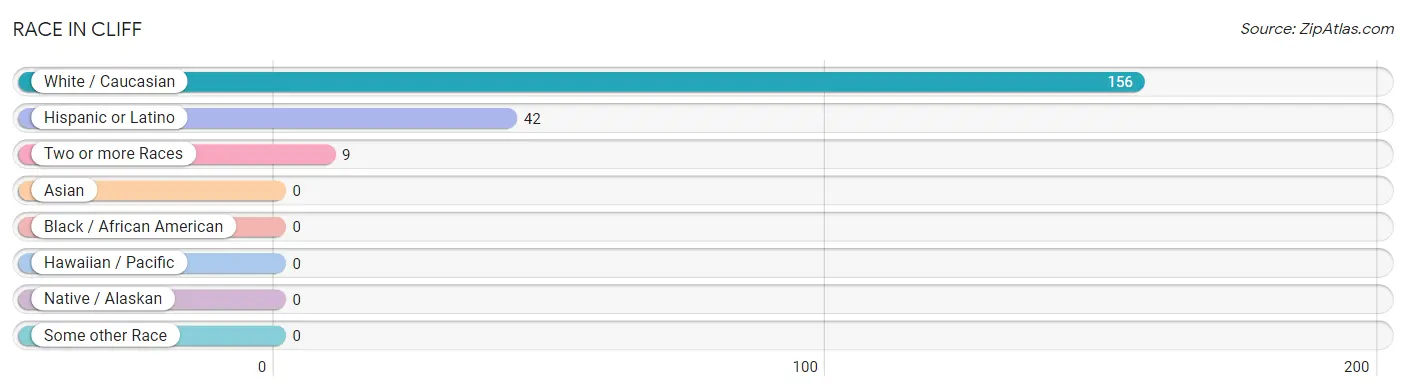
| Race | # Population | % Population |
| Asian | 0 | 0.0% |
| Black / African American | 0 | 0.0% |
| Hawaiian / Pacific | 0 | 0.0% |
| Hispanic or Latino | 42 | 25.5% |
| Native / Alaskan | 0 | 0.0% |
| White / Caucasian | 156 | 94.6% |
| Two or more Races | 9 | 5.4% |
| Some other Race | 0 | 0.0% |
| Total | 165 | 100.0% |
Ancestry in Cliff
The most populous ancestries reported in Cliff are American (41 | 24.8%), English (30 | 18.2%), Mexican (27 | 16.4%), Irish (15 | 9.1%), and Spaniard (15 | 9.1%), together accounting for 77.6% of all Cliff residents.
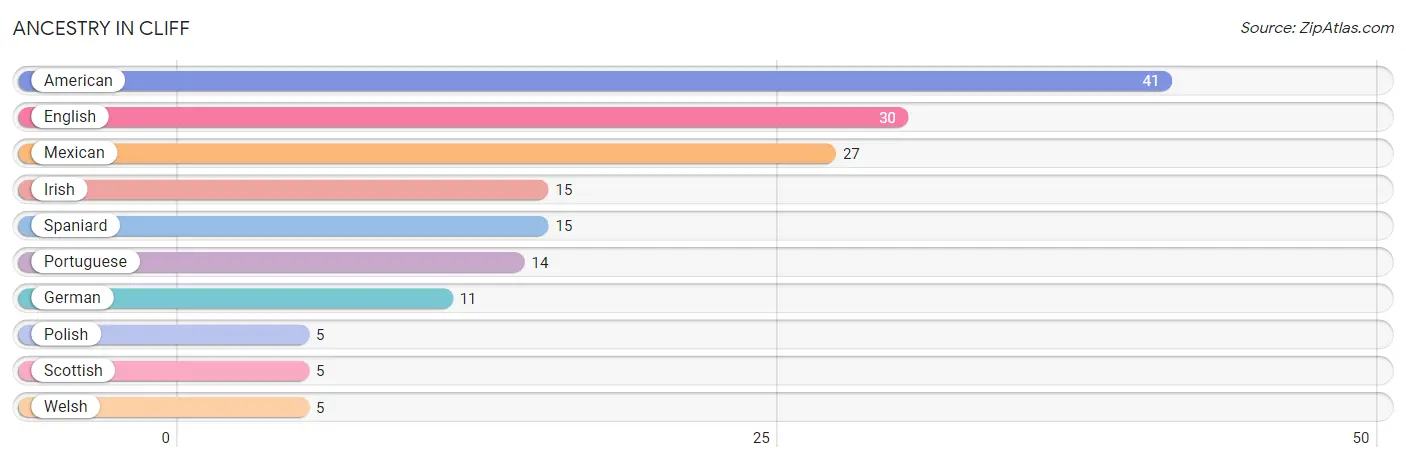
| Ancestry | # Population | % Population |
| American | 41 | 24.8% |
| English | 30 | 18.2% |
| German | 11 | 6.7% |
| Irish | 15 | 9.1% |
| Mexican | 27 | 16.4% |
| Polish | 5 | 3.0% |
| Portuguese | 14 | 8.5% |
| Scottish | 5 | 3.0% |
| Spaniard | 15 | 9.1% |
| Welsh | 5 | 3.0% | View All 10 Rows |
Immigrants in Cliff

| Immigration Origin | # Population | % Population | View All 0 Rows |
Sex and Age in Cliff
Sex and Age in Cliff
The most populous age groups in Cliff are 50 to 54 Years (35 | 38.0%) for men and 75 to 79 Years (31 | 42.5%) for women.
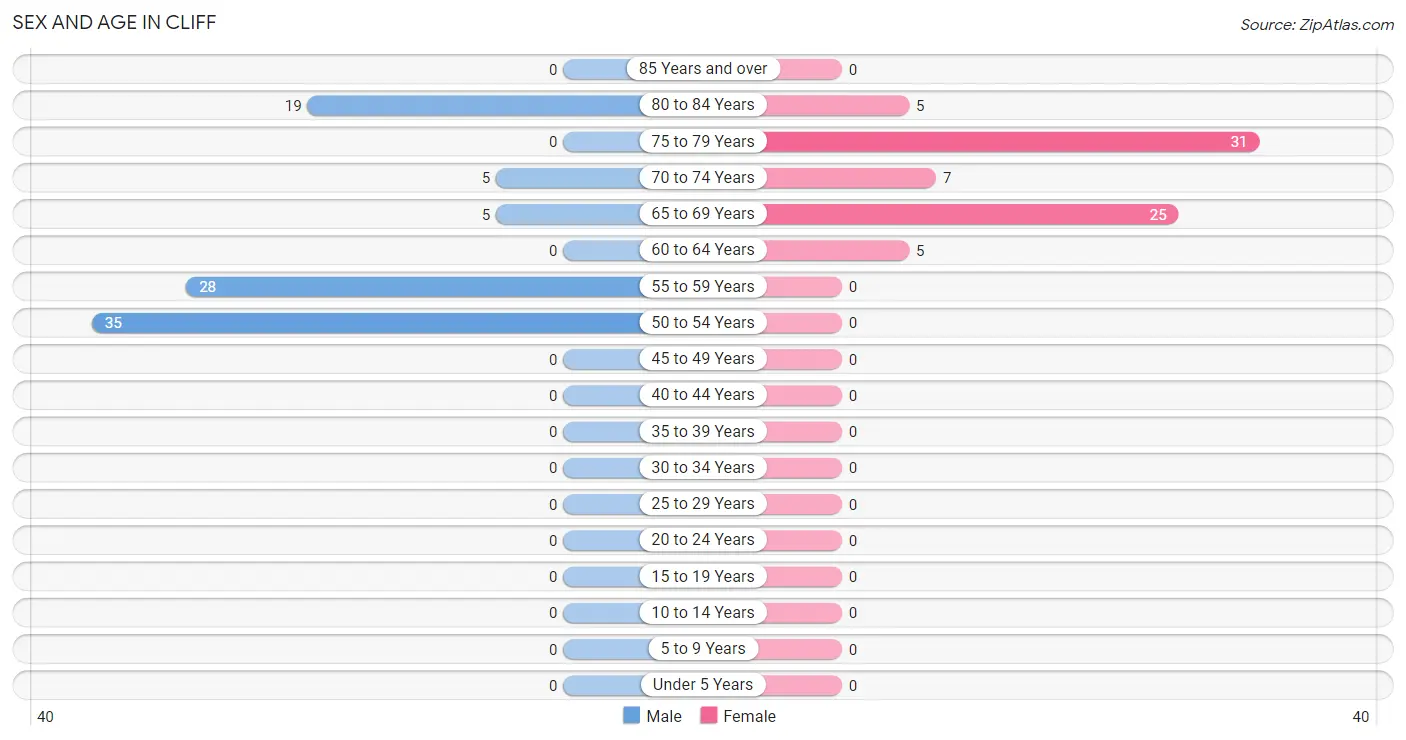
| Age Bracket | Male | Female |
| Under 5 Years | 0 (0.0%) | 0 (0.0%) |
| 5 to 9 Years | 0 (0.0%) | 0 (0.0%) |
| 10 to 14 Years | 0 (0.0%) | 0 (0.0%) |
| 15 to 19 Years | 0 (0.0%) | 0 (0.0%) |
| 20 to 24 Years | 0 (0.0%) | 0 (0.0%) |
| 25 to 29 Years | 0 (0.0%) | 0 (0.0%) |
| 30 to 34 Years | 0 (0.0%) | 0 (0.0%) |
| 35 to 39 Years | 0 (0.0%) | 0 (0.0%) |
| 40 to 44 Years | 0 (0.0%) | 0 (0.0%) |
| 45 to 49 Years | 0 (0.0%) | 0 (0.0%) |
| 50 to 54 Years | 35 (38.0%) | 0 (0.0%) |
| 55 to 59 Years | 28 (30.4%) | 0 (0.0%) |
| 60 to 64 Years | 0 (0.0%) | 5 (6.9%) |
| 65 to 69 Years | 5 (5.4%) | 25 (34.3%) |
| 70 to 74 Years | 5 (5.4%) | 7 (9.6%) |
| 75 to 79 Years | 0 (0.0%) | 31 (42.5%) |
| 80 to 84 Years | 19 (20.6%) | 5 (6.9%) |
| 85 Years and over | 0 (0.0%) | 0 (0.0%) |
| Total | 92 (100.0%) | 73 (100.0%) |
Families and Households in Cliff
Median Family Size in Cliff
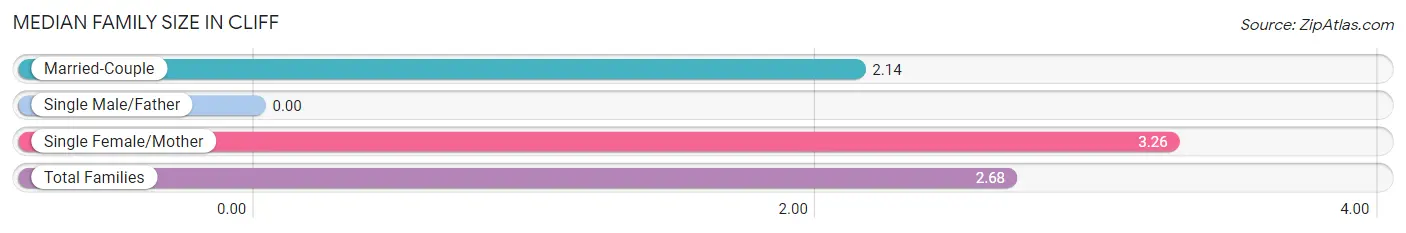
| Family Type | # Families | Family Size |
| Married-Couple | 21 (52.5%) | 2.14 |
| Single Male/Father | 0 (0.0%) | - |
| Single Female/Mother | 19 (47.5%) | 3.26 |
| Total Families | 40 (100.0%) | 2.68 |
Median Household Size in Cliff
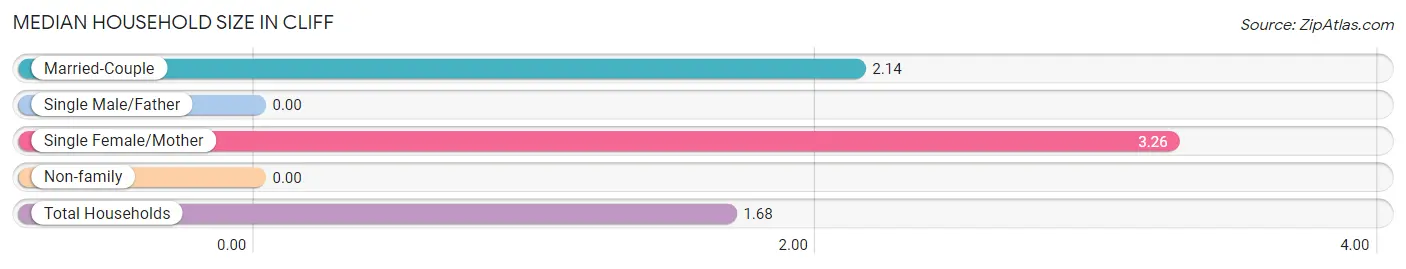
| Household Type | # Households | Household Size |
| Married-Couple | 21 (21.4%) | 2.14 |
| Single Male/Father | 0 (0.0%) | - |
| Single Female/Mother | 19 (19.4%) | 3.26 |
| Non-family | 58 (59.2%) | - |
| Total Households | 98 (100.0%) | 1.68 |
Household Size by Marriage Status in Cliff
Out of a total of 98 households in Cliff, 40 (40.8%) are family households, while 58 (59.2%) are nonfamily households. The most numerous type of family households are 2-person households, comprising 40, and the most common type of nonfamily households are 1-person households, comprising 58.
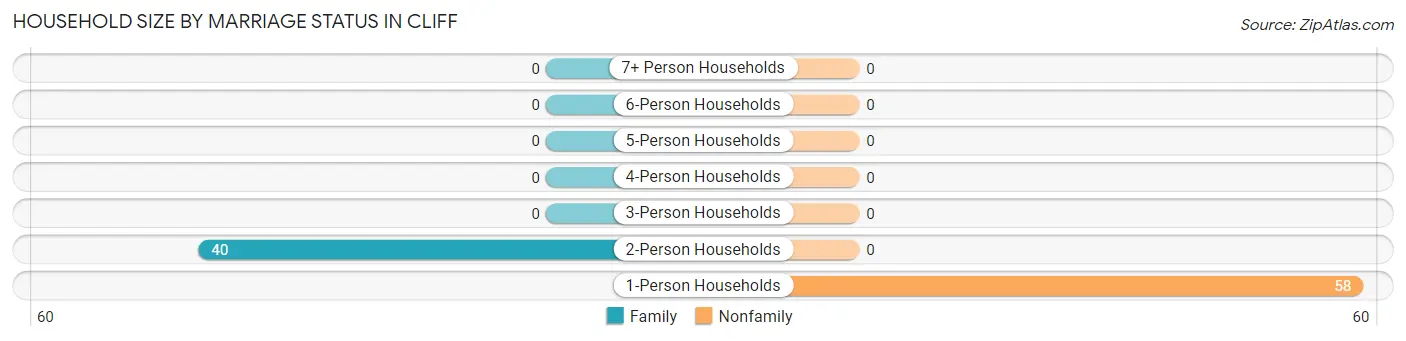
| Household Size | Family Households | Nonfamily Households |
| 1-Person Households | - | 58 (59.2%) |
| 2-Person Households | 40 (40.8%) | 0 (0.0%) |
| 3-Person Households | 0 (0.0%) | 0 (0.0%) |
| 4-Person Households | 0 (0.0%) | 0 (0.0%) |
| 5-Person Households | 0 (0.0%) | 0 (0.0%) |
| 6-Person Households | 0 (0.0%) | 0 (0.0%) |
| 7+ Person Households | 0 (0.0%) | 0 (0.0%) |
| Total | 40 (40.8%) | 58 (59.2%) |
Female Fertility in Cliff
Fertility by Age in Cliff
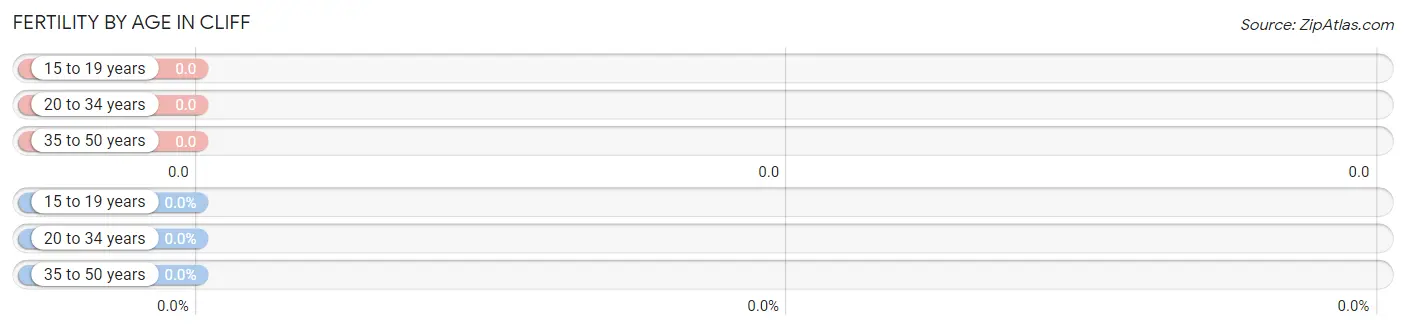
| Age Bracket | Women with Births | Births / 1,000 Women |
| 15 to 19 years | 0 (0.0%) | 0.0 |
| 20 to 34 years | 0 (0.0%) | 0.0 |
| 35 to 50 years | 0 (0.0%) | 0.0 |
| Total | 0 (0.0%) | 0.0 |
Fertility by Age by Marriage Status in Cliff
| Age Bracket | Married | Unmarried |
| 15 to 19 years | 0 (0.0%) | 0 (0.0%) |
| 20 to 34 years | 0 (0.0%) | 0 (0.0%) |
| 35 to 50 years | 0 (0.0%) | 0 (0.0%) |
| Total | 0 (0.0%) | 0 (0.0%) |
Fertility by Education in Cliff
| Educational Attainment | Women with Births | Births / 1,000 Women |
| Less than High School | 0 (0.0%) | 0.0 |
| High School Diploma | 0 (0.0%) | 0.0 |
| College or Associate's Degree | 0 (0.0%) | 0.0 |
| Bachelor's Degree | 0 (0.0%) | 0.0 |
| Graduate Degree | 0 (0.0%) | 0.0 |
| Total | 0 (0.0%) | 0.0 |
Fertility by Education by Marriage Status in Cliff
| Educational Attainment | Married | Unmarried |
| Less than High School | 0 (0.0%) | 0 (0.0%) |
| High School Diploma | 0 (0.0%) | 0 (0.0%) |
| College or Associate's Degree | 0 (0.0%) | 0 (0.0%) |
| Bachelor's Degree | 0 (0.0%) | 0 (0.0%) |
| Graduate Degree | 0 (0.0%) | 0 (0.0%) |
| Total | 0 (0.0%) | 0 (0.0%) |
Employment Characteristics in Cliff
Employment by Class of Employer in Cliff
Among the 52 employed individuals in Cliff, private company employees (35 | 67.3%), self-employed (not incorporated) (11 | 21.1%), and not-for-profit organizations (6 | 11.5%) make up the most common classes of employment.
| Employer Class | # Employees | % Employees |
| Private Company Employees | 35 | 67.3% |
| Self-Employed (Incorporated) | 0 | 0.0% |
| Self-Employed (Not Incorporated) | 11 | 21.1% |
| Not-for-profit Organizations | 6 | 11.5% |
| Local Government Employees | 0 | 0.0% |
| State Government Employees | 0 | 0.0% |
| Federal Government Employees | 0 | 0.0% |
| Unpaid Family Workers | 0 | 0.0% |
| Total | 52 | 100.0% |
Employment Status by Age in Cliff
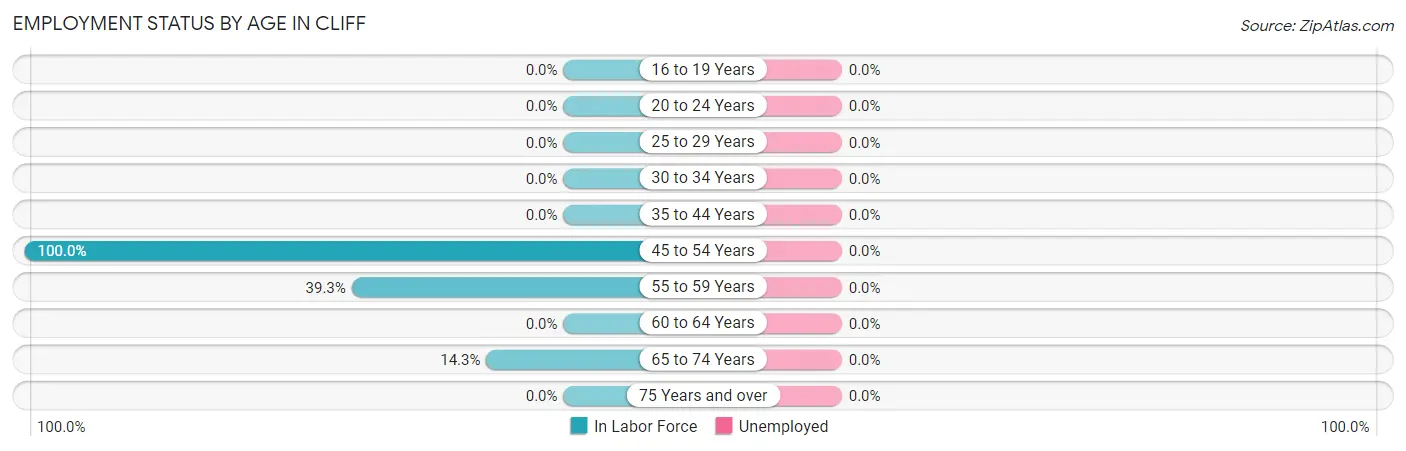
| Age Bracket | In Labor Force | Unemployed |
| 16 to 19 Years | 0 (0.0%) | 0 (0.0%) |
| 20 to 24 Years | 0 (0.0%) | 0 (0.0%) |
| 25 to 29 Years | 0 (0.0%) | 0 (0.0%) |
| 30 to 34 Years | 0 (0.0%) | 0 (0.0%) |
| 35 to 44 Years | 0 (0.0%) | 0 (0.0%) |
| 45 to 54 Years | 35 (100.0%) | 0 (0.0%) |
| 55 to 59 Years | 11 (39.3%) | 0 (0.0%) |
| 60 to 64 Years | 0 (0.0%) | 0 (0.0%) |
| 65 to 74 Years | 6 (14.3%) | 0 (0.0%) |
| 75 Years and over | 0 (0.0%) | 0 (0.0%) |
| Total | 52 (31.5%) | 0 (0.0%) |
Employment Status by Educational Attainment in Cliff
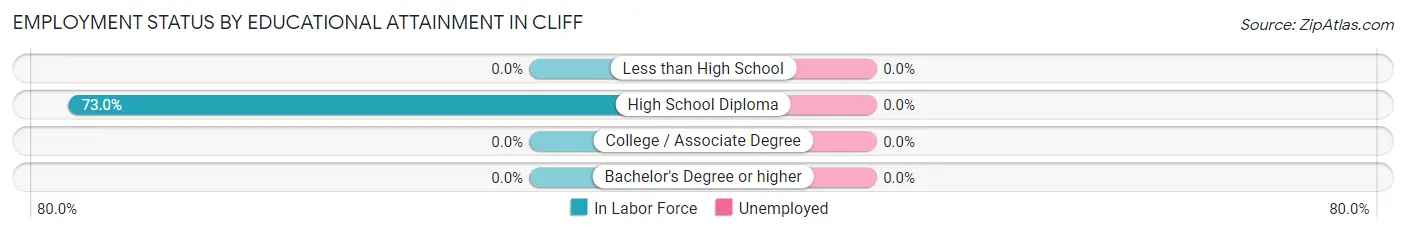
| Educational Attainment | In Labor Force | Unemployed |
| Less than High School | 0 (0.0%) | 0 (0.0%) |
| High School Diploma | 46 (73.0%) | 0 (0.0%) |
| College / Associate Degree | 0 (0.0%) | 0 (0.0%) |
| Bachelor's Degree or higher | 0 (0.0%) | 0 (0.0%) |
| Total | 46 (67.6%) | 0 (0.0%) |
Employment Occupations by Sex in Cliff
Management, Business, Science and Arts Occupations
The most common Management, Business, Science and Arts occupations in Cliff are , and Health Diagnosing & Treating (6 | 11.5%).
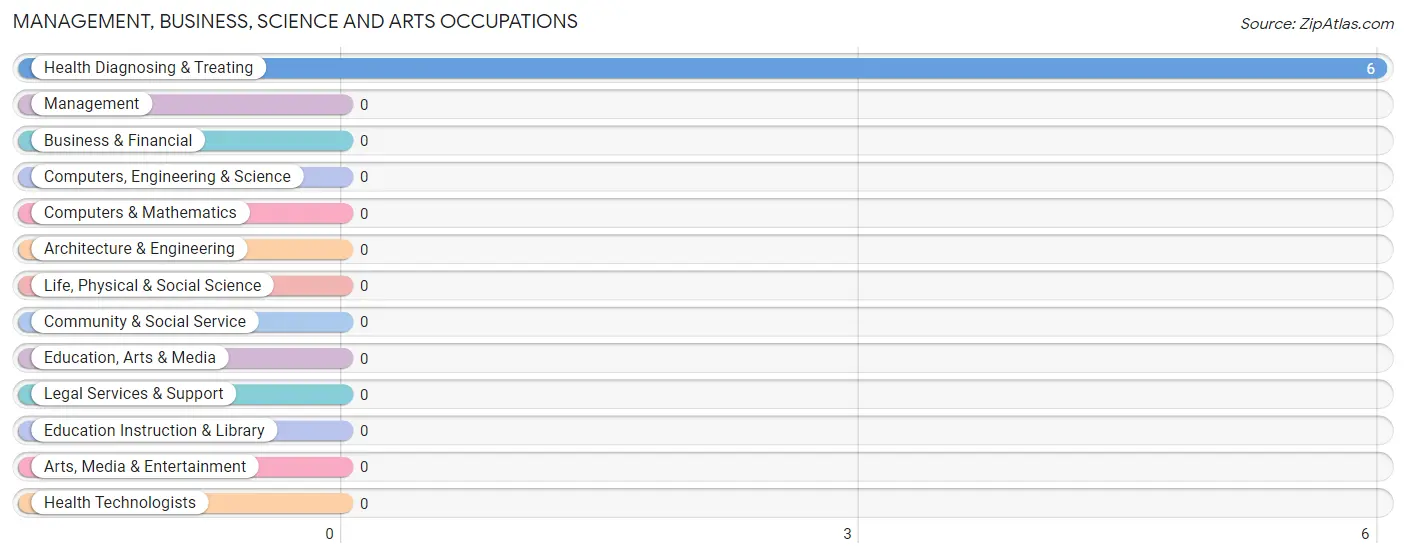
Management, Business, Science and Arts Occupations by Sex
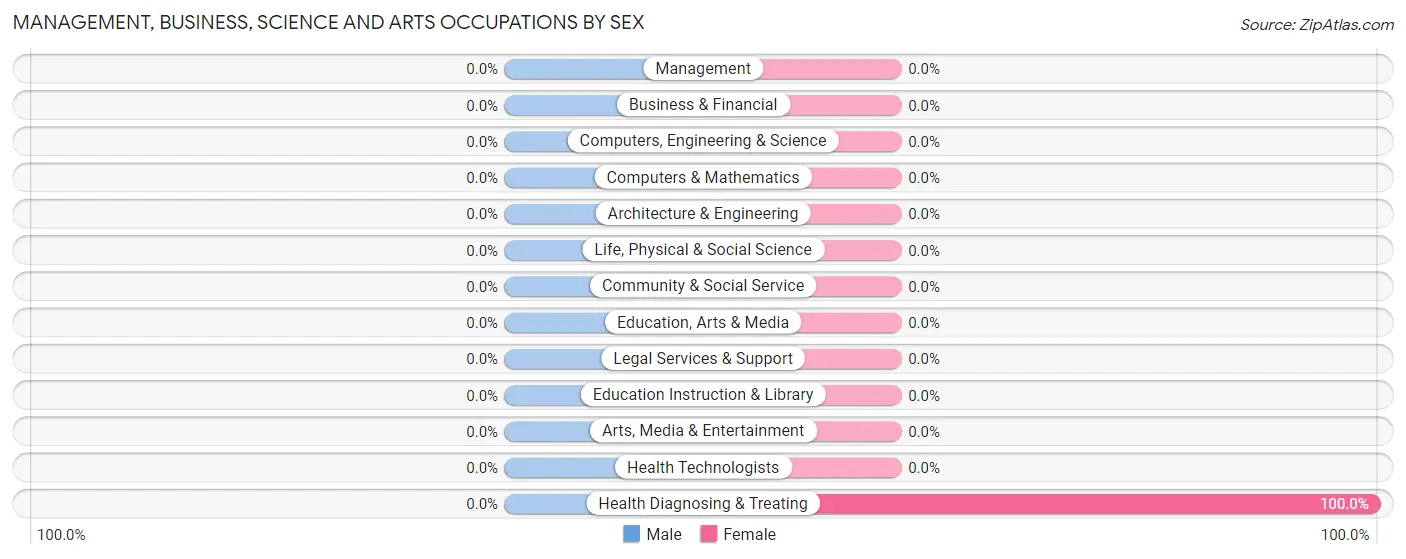
| Occupation | Male | Female |
| Management | 0 (0.0%) | 0 (0.0%) |
| Business & Financial | 0 (0.0%) | 0 (0.0%) |
| Computers, Engineering & Science | 0 (0.0%) | 0 (0.0%) |
| Computers & Mathematics | 0 (0.0%) | 0 (0.0%) |
| Architecture & Engineering | 0 (0.0%) | 0 (0.0%) |
| Life, Physical & Social Science | 0 (0.0%) | 0 (0.0%) |
| Community & Social Service | 0 (0.0%) | 0 (0.0%) |
| Education, Arts & Media | 0 (0.0%) | 0 (0.0%) |
| Legal Services & Support | 0 (0.0%) | 0 (0.0%) |
| Education Instruction & Library | 0 (0.0%) | 0 (0.0%) |
| Arts, Media & Entertainment | 0 (0.0%) | 0 (0.0%) |
| Health Diagnosing & Treating | 0 (0.0%) | 6 (100.0%) |
| Health Technologists | 0 (0.0%) | 0 (0.0%) |
| Total (Category) | 0 (0.0%) | 6 (100.0%) |
| Total (Overall) | 46 (88.5%) | 6 (11.5%) |
Services Occupations
Services Occupations by Sex
| Occupation | Male | Female |
| Healthcare Support | 0 (0.0%) | 0 (0.0%) |
| Security & Protection | 0 (0.0%) | 0 (0.0%) |
| Firefighting & Prevention | 0 (0.0%) | 0 (0.0%) |
| Law Enforcement | 0 (0.0%) | 0 (0.0%) |
| Food Preparation & Serving | 0 (0.0%) | 0 (0.0%) |
| Cleaning & Maintenance | 0 (0.0%) | 0 (0.0%) |
| Personal Care & Service | 0 (0.0%) | 0 (0.0%) |
| Total (Category) | 0 (0.0%) | 0 (0.0%) |
| Total (Overall) | 46 (88.5%) | 6 (11.5%) |
Sales and Office Occupations
Sales and Office Occupations by Sex
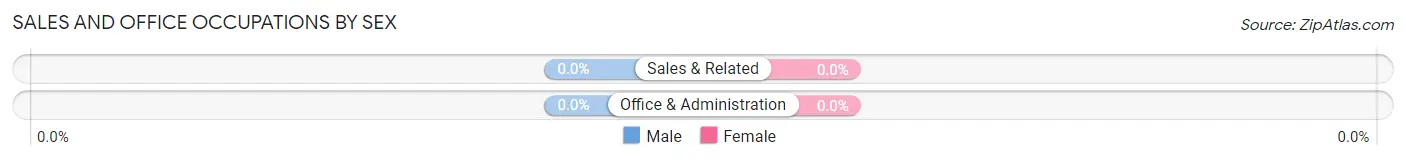
| Occupation | Male | Female |
| Sales & Related | 0 (0.0%) | 0 (0.0%) |
| Office & Administration | 0 (0.0%) | 0 (0.0%) |
| Total (Category) | 0 (0.0%) | 0 (0.0%) |
| Total (Overall) | 46 (88.5%) | 6 (11.5%) |
Natural Resources, Construction and Maintenance Occupations
The most common Natural Resources, Construction and Maintenance occupations in Cliff are Construction & Extraction (20 | 38.5%), and Installation, Maintenance & Repair (15 | 28.8%).
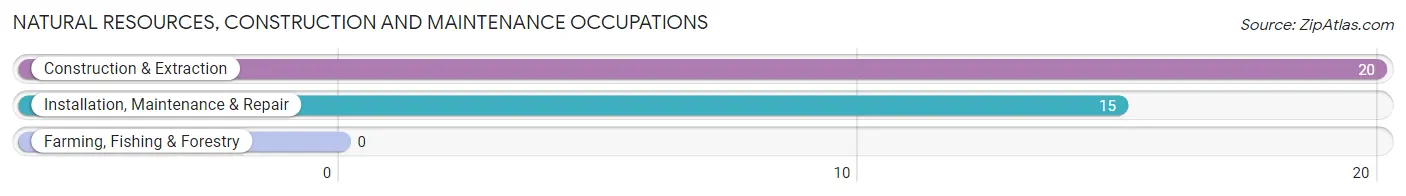
Natural Resources, Construction and Maintenance Occupations by Sex
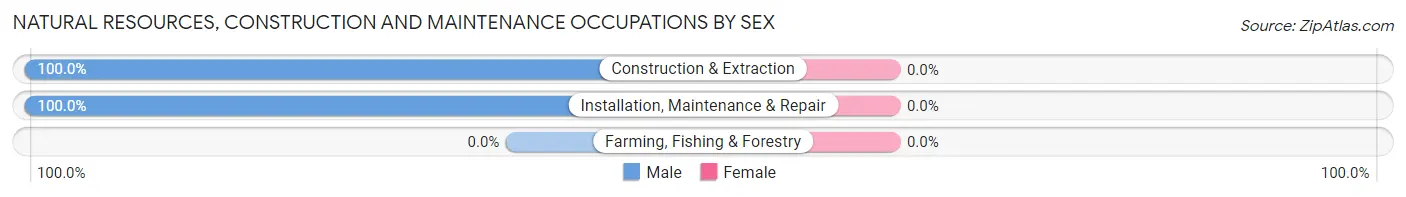
| Occupation | Male | Female |
| Farming, Fishing & Forestry | 0 (0.0%) | 0 (0.0%) |
| Construction & Extraction | 20 (100.0%) | 0 (0.0%) |
| Installation, Maintenance & Repair | 15 (100.0%) | 0 (0.0%) |
| Total (Category) | 35 (100.0%) | 0 (0.0%) |
| Total (Overall) | 46 (88.5%) | 6 (11.5%) |
Production, Transportation and Moving Occupations
The most common Production, Transportation and Moving occupations in Cliff are , and Production (11 | 21.1%).
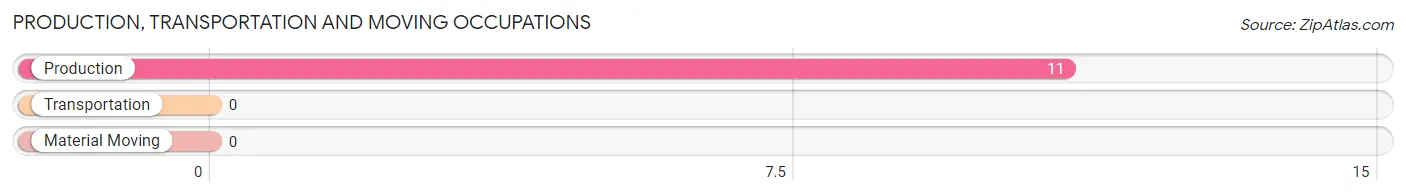
Production, Transportation and Moving Occupations by Sex
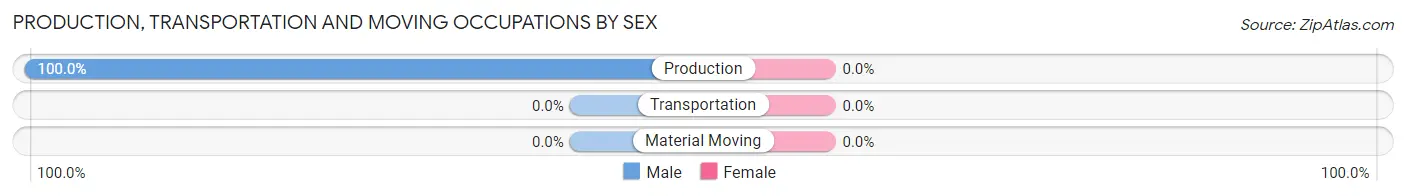
| Occupation | Male | Female |
| Production | 11 (100.0%) | 0 (0.0%) |
| Transportation | 0 (0.0%) | 0 (0.0%) |
| Material Moving | 0 (0.0%) | 0 (0.0%) |
| Total (Category) | 11 (100.0%) | 0 (0.0%) |
| Total (Overall) | 46 (88.5%) | 6 (11.5%) |
Employment Industries by Sex in Cliff
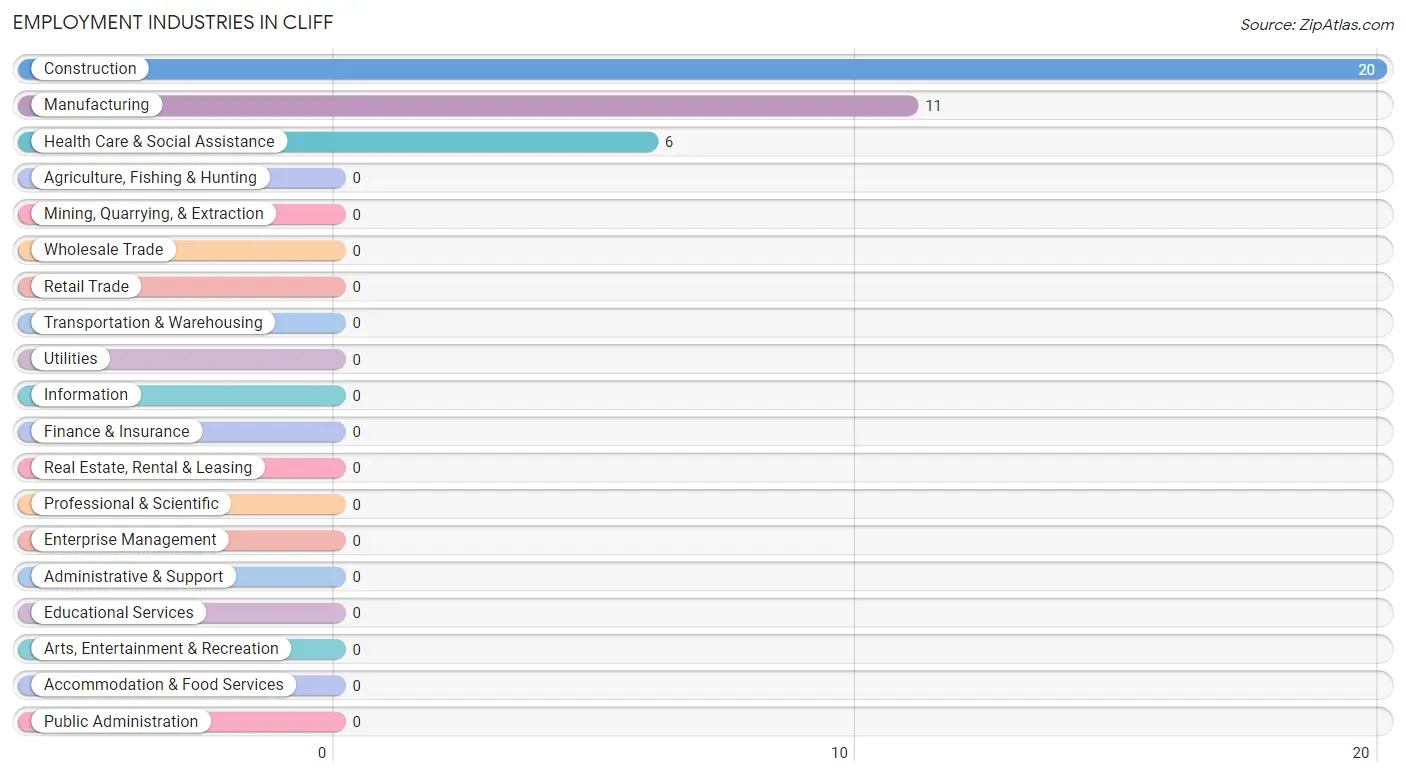
Employment Industries in Cliff
The major employment industries in Cliff include Construction (20 | 38.5%), Manufacturing (11 | 21.1%), and Health Care & Social Assistance (6 | 11.5%).
Employment Industries by Sex in Cliff
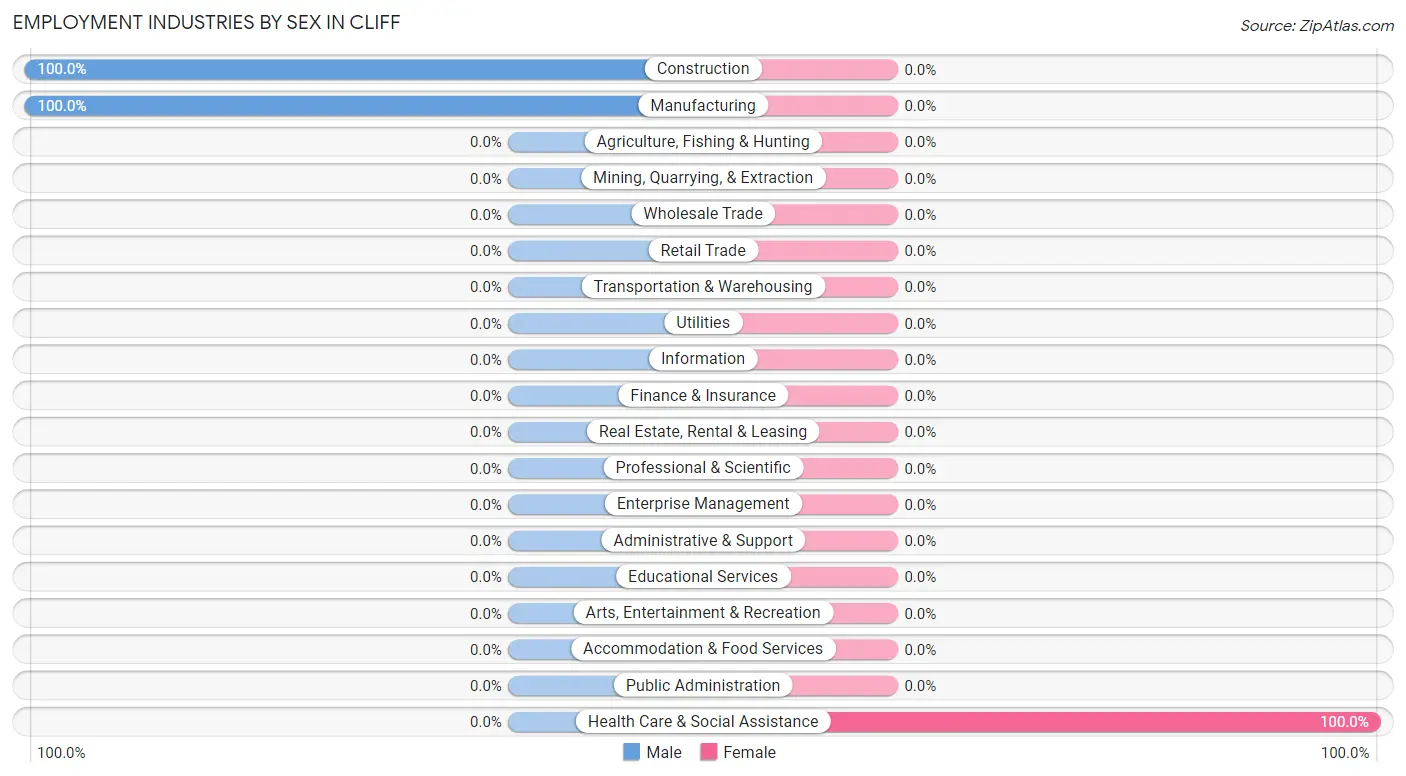
| Industry | Male | Female |
| Agriculture, Fishing & Hunting | 0 (0.0%) | 0 (0.0%) |
| Mining, Quarrying, & Extraction | 0 (0.0%) | 0 (0.0%) |
| Construction | 20 (100.0%) | 0 (0.0%) |
| Manufacturing | 11 (100.0%) | 0 (0.0%) |
| Wholesale Trade | 0 (0.0%) | 0 (0.0%) |
| Retail Trade | 0 (0.0%) | 0 (0.0%) |
| Transportation & Warehousing | 0 (0.0%) | 0 (0.0%) |
| Utilities | 0 (0.0%) | 0 (0.0%) |
| Information | 0 (0.0%) | 0 (0.0%) |
| Finance & Insurance | 0 (0.0%) | 0 (0.0%) |
| Real Estate, Rental & Leasing | 0 (0.0%) | 0 (0.0%) |
| Professional & Scientific | 0 (0.0%) | 0 (0.0%) |
| Enterprise Management | 0 (0.0%) | 0 (0.0%) |
| Administrative & Support | 0 (0.0%) | 0 (0.0%) |
| Educational Services | 0 (0.0%) | 0 (0.0%) |
| Health Care & Social Assistance | 0 (0.0%) | 6 (100.0%) |
| Arts, Entertainment & Recreation | 0 (0.0%) | 0 (0.0%) |
| Accommodation & Food Services | 0 (0.0%) | 0 (0.0%) |
| Public Administration | 0 (0.0%) | 0 (0.0%) |
| Total | 46 (88.5%) | 6 (11.5%) |
Education in Cliff
School Enrollment in Cliff
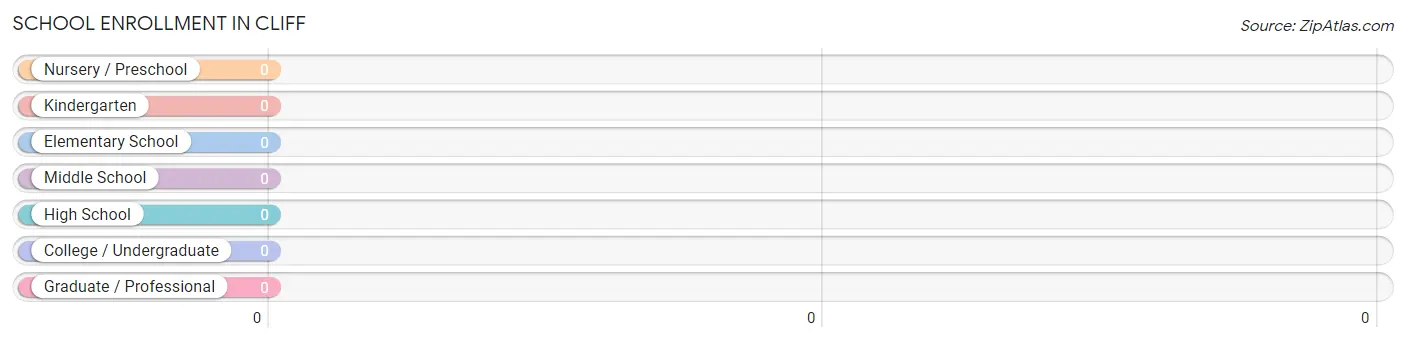
| School Level | # Students | % Students |
| Nursery / Preschool | 0 | 0.0% |
| Kindergarten | 0 | 0.0% |
| Elementary School | 0 | 0.0% |
| Middle School | 0 | 0.0% |
| High School | 0 | 0.0% |
| College / Undergraduate | 0 | 0.0% |
| Graduate / Professional | 0 | 0.0% |
| Total | 0 | 0.0% |
School Enrollment by Age by Funding Source in Cliff
| Age Bracket | Public School | Private School |
| 3 to 4 Year Olds | 0 (0.0%) | 0 (0.0%) |
| 5 to 9 Year Old | 0 (0.0%) | 0 (0.0%) |
| 10 to 14 Year Olds | 0 (0.0%) | 0 (0.0%) |
| 15 to 17 Year Olds | 0 (0.0%) | 0 (0.0%) |
| 18 to 19 Year Olds | 0 (0.0%) | 0 (0.0%) |
| 20 to 24 Year Olds | 0 (0.0%) | 0 (0.0%) |
| 25 to 34 Year Olds | 0 (0.0%) | 0 (0.0%) |
| 35 Years and over | 0 (0.0%) | 0 (0.0%) |
| Total | 0 (0.0%) | 0 (0.0%) |
Educational Attainment by Field of Study in Cliff
Science & technology (14 | 46.7%), education (11 | 36.7%), and bio, nature & agricultural (5 | 16.7%) are the most common fields of study among 30 individuals in Cliff who have obtained a bachelor's degree or higher.
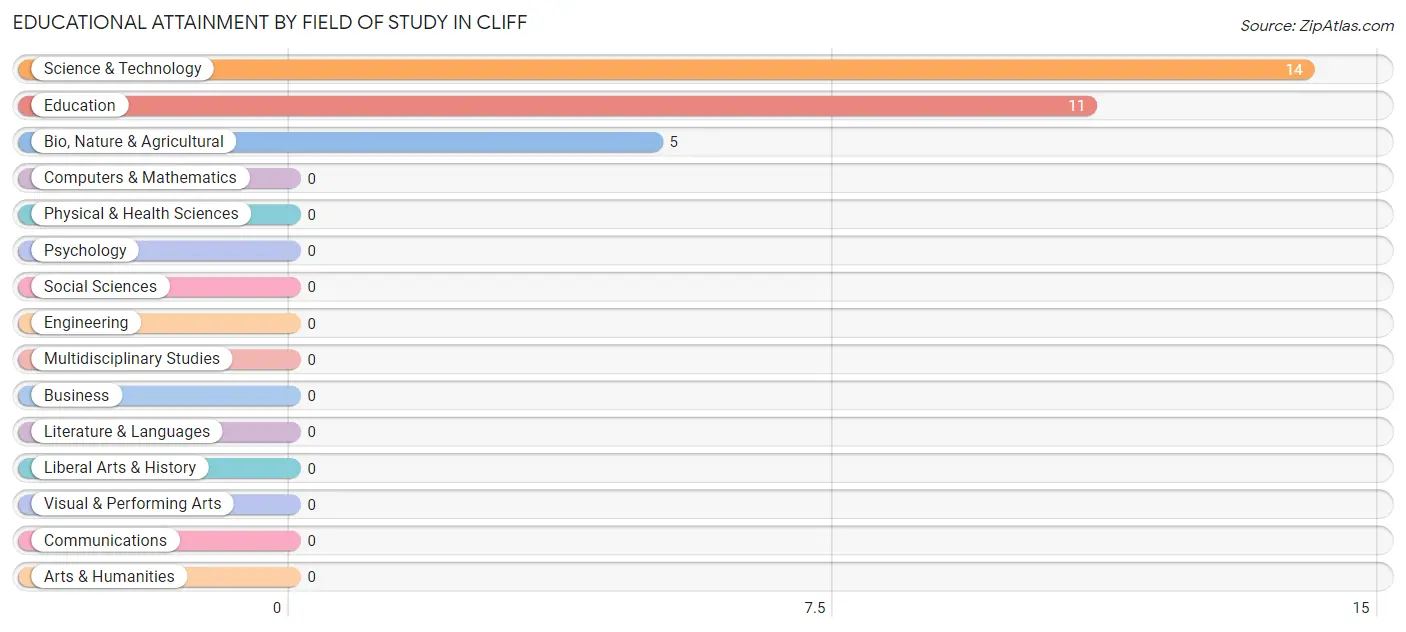
| Field of Study | # Graduates | % Graduates |
| Computers & Mathematics | 0 | 0.0% |
| Bio, Nature & Agricultural | 5 | 16.7% |
| Physical & Health Sciences | 0 | 0.0% |
| Psychology | 0 | 0.0% |
| Social Sciences | 0 | 0.0% |
| Engineering | 0 | 0.0% |
| Multidisciplinary Studies | 0 | 0.0% |
| Science & Technology | 14 | 46.7% |
| Business | 0 | 0.0% |
| Education | 11 | 36.7% |
| Literature & Languages | 0 | 0.0% |
| Liberal Arts & History | 0 | 0.0% |
| Visual & Performing Arts | 0 | 0.0% |
| Communications | 0 | 0.0% |
| Arts & Humanities | 0 | 0.0% |
| Total | 30 | 100.0% |
Transportation & Commute in Cliff
Vehicle Availability by Sex in Cliff
The most prevalent vehicle ownership categories in Cliff are males with 2 vehicles (20, accounting for 43.5%) and females with 2 vehicles (0, making up 333.3%).
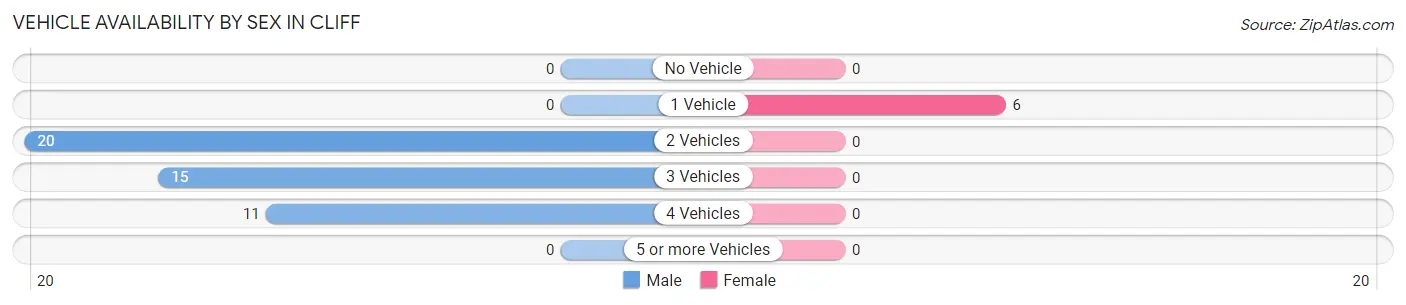
| Vehicles Available | Male | Female |
| No Vehicle | 0 (0.0%) | 0 (0.0%) |
| 1 Vehicle | 0 (0.0%) | 6 (100.0%) |
| 2 Vehicles | 20 (43.5%) | 0 (0.0%) |
| 3 Vehicles | 15 (32.6%) | 0 (0.0%) |
| 4 Vehicles | 11 (23.9%) | 0 (0.0%) |
| 5 or more Vehicles | 0 (0.0%) | 0 (0.0%) |
| Total | 46 (100.0%) | 6 (100.0%) |
Commute Time in Cliff
The most frequently occuring commute durations in Cliff are 45 to 59 minutes (35 commuters, 67.3%), less than 5 minutes (11 commuters, 21.1%), and 30 to 34 minutes (6 commuters, 11.5%).
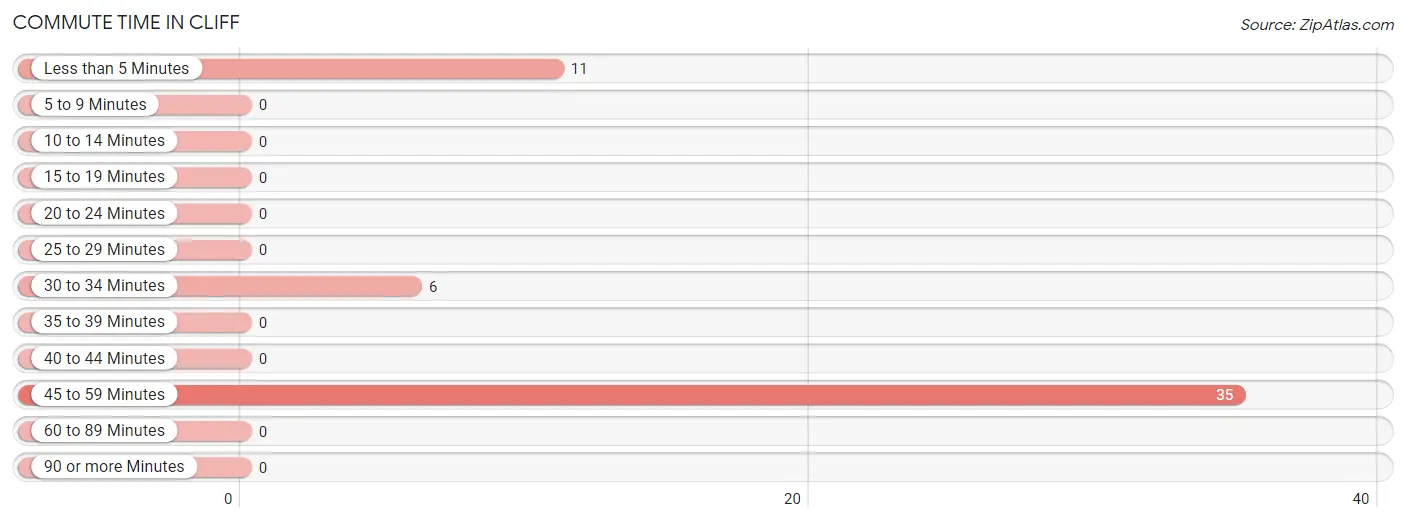
| Commute Time | # Commuters | % Commuters |
| Less than 5 Minutes | 11 | 21.1% |
| 5 to 9 Minutes | 0 | 0.0% |
| 10 to 14 Minutes | 0 | 0.0% |
| 15 to 19 Minutes | 0 | 0.0% |
| 20 to 24 Minutes | 0 | 0.0% |
| 25 to 29 Minutes | 0 | 0.0% |
| 30 to 34 Minutes | 6 | 11.5% |
| 35 to 39 Minutes | 0 | 0.0% |
| 40 to 44 Minutes | 0 | 0.0% |
| 45 to 59 Minutes | 35 | 67.3% |
| 60 to 89 Minutes | 0 | 0.0% |
| 90 or more Minutes | 0 | 0.0% |
Commute Time by Sex in Cliff
The most common commute times in Cliff are 45 to 59 minutes (35 commuters, 76.1%) for males and 30 to 34 minutes (6 commuters, 100.0%) for females.
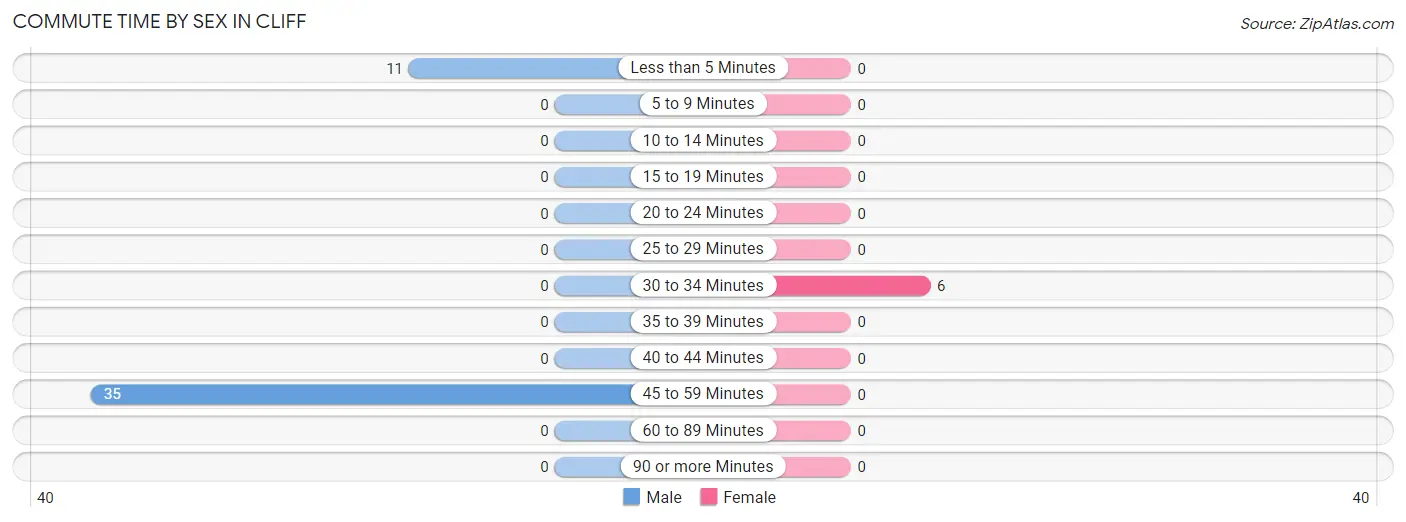
| Commute Time | Male | Female |
| Less than 5 Minutes | 11 (23.9%) | 0 (0.0%) |
| 5 to 9 Minutes | 0 (0.0%) | 0 (0.0%) |
| 10 to 14 Minutes | 0 (0.0%) | 0 (0.0%) |
| 15 to 19 Minutes | 0 (0.0%) | 0 (0.0%) |
| 20 to 24 Minutes | 0 (0.0%) | 0 (0.0%) |
| 25 to 29 Minutes | 0 (0.0%) | 0 (0.0%) |
| 30 to 34 Minutes | 0 (0.0%) | 6 (100.0%) |
| 35 to 39 Minutes | 0 (0.0%) | 0 (0.0%) |
| 40 to 44 Minutes | 0 (0.0%) | 0 (0.0%) |
| 45 to 59 Minutes | 35 (76.1%) | 0 (0.0%) |
| 60 to 89 Minutes | 0 (0.0%) | 0 (0.0%) |
| 90 or more Minutes | 0 (0.0%) | 0 (0.0%) |
Time of Departure to Work by Sex in Cliff
The most frequent times of departure to work in Cliff are 9:00 AM to 9:59 AM (26, 56.5%) for males and 6:00 AM to 6:29 AM (6, 100.0%) for females.
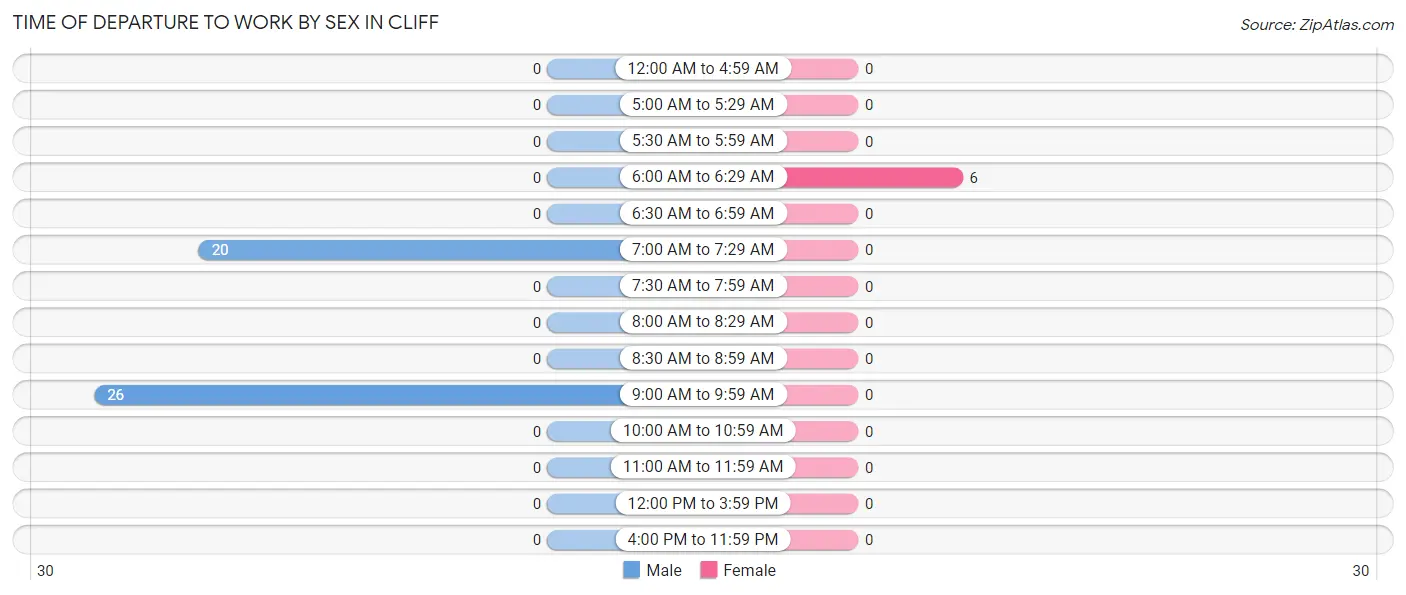
| Time of Departure | Male | Female |
| 12:00 AM to 4:59 AM | 0 (0.0%) | 0 (0.0%) |
| 5:00 AM to 5:29 AM | 0 (0.0%) | 0 (0.0%) |
| 5:30 AM to 5:59 AM | 0 (0.0%) | 0 (0.0%) |
| 6:00 AM to 6:29 AM | 0 (0.0%) | 6 (100.0%) |
| 6:30 AM to 6:59 AM | 0 (0.0%) | 0 (0.0%) |
| 7:00 AM to 7:29 AM | 20 (43.5%) | 0 (0.0%) |
| 7:30 AM to 7:59 AM | 0 (0.0%) | 0 (0.0%) |
| 8:00 AM to 8:29 AM | 0 (0.0%) | 0 (0.0%) |
| 8:30 AM to 8:59 AM | 0 (0.0%) | 0 (0.0%) |
| 9:00 AM to 9:59 AM | 26 (56.5%) | 0 (0.0%) |
| 10:00 AM to 10:59 AM | 0 (0.0%) | 0 (0.0%) |
| 11:00 AM to 11:59 AM | 0 (0.0%) | 0 (0.0%) |
| 12:00 PM to 3:59 PM | 0 (0.0%) | 0 (0.0%) |
| 4:00 PM to 11:59 PM | 0 (0.0%) | 0 (0.0%) |
| Total | 46 (100.0%) | 6 (100.0%) |
Housing Occupancy in Cliff
Occupancy by Ownership in Cliff
Of the total 98 dwellings in Cliff, owner-occupied units account for 78 (79.6%), while renter-occupied units make up 20 (20.4%).
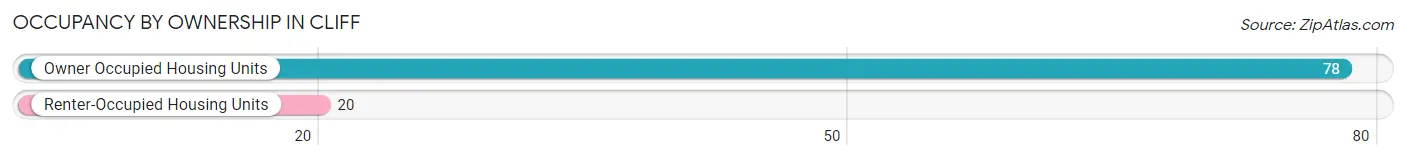
| Occupancy | # Housing Units | % Housing Units |
| Owner Occupied Housing Units | 78 | 79.6% |
| Renter-Occupied Housing Units | 20 | 20.4% |
| Total Occupied Housing Units | 98 | 100.0% |
Occupancy by Household Size in Cliff
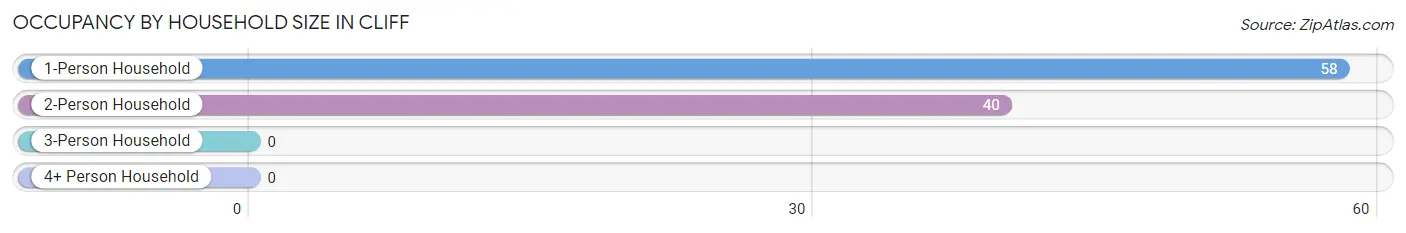
| Household Size | # Housing Units | % Housing Units |
| 1-Person Household | 58 | 59.2% |
| 2-Person Household | 40 | 40.8% |
| 3-Person Household | 0 | 0.0% |
| 4+ Person Household | 0 | 0.0% |
| Total Housing Units | 98 | 100.0% |
Occupancy by Ownership by Household Size in Cliff
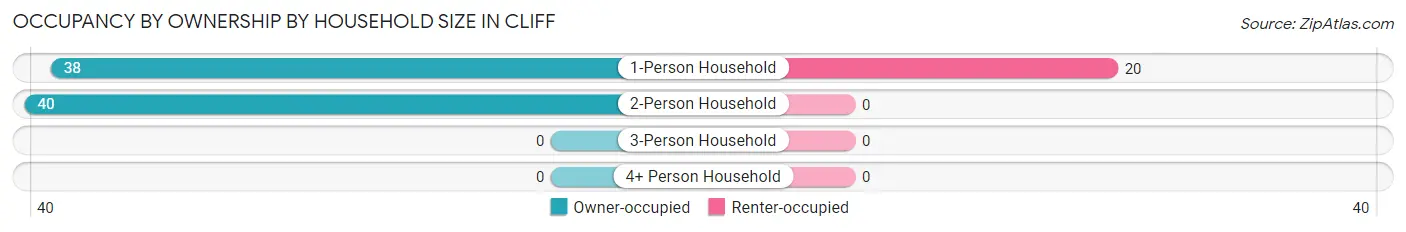
| Household Size | Owner-occupied | Renter-occupied |
| 1-Person Household | 38 (65.5%) | 20 (34.5%) |
| 2-Person Household | 40 (100.0%) | 0 (0.0%) |
| 3-Person Household | 0 (0.0%) | 0 (0.0%) |
| 4+ Person Household | 0 (0.0%) | 0 (0.0%) |
| Total Housing Units | 78 (79.6%) | 20 (20.4%) |
Occupancy by Educational Attainment in Cliff
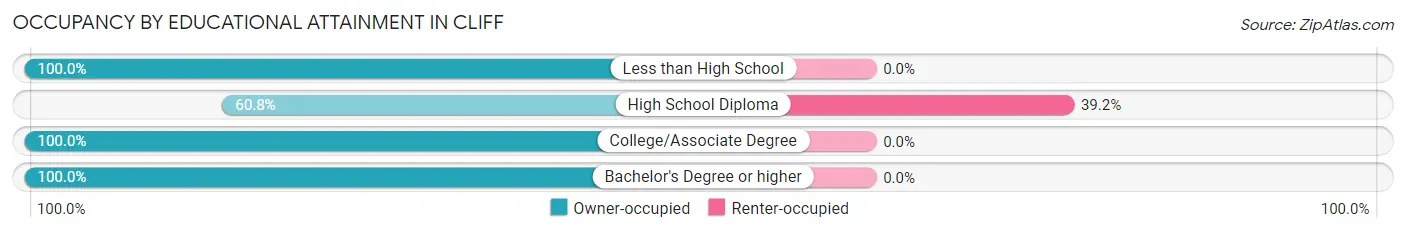
| Household Size | Owner-occupied | Renter-occupied |
| Less than High School | 5 (100.0%) | 0 (0.0%) |
| High School Diploma | 31 (60.8%) | 20 (39.2%) |
| College/Associate Degree | 22 (100.0%) | 0 (0.0%) |
| Bachelor's Degree or higher | 20 (100.0%) | 0 (0.0%) |
Occupancy by Age of Householder in Cliff
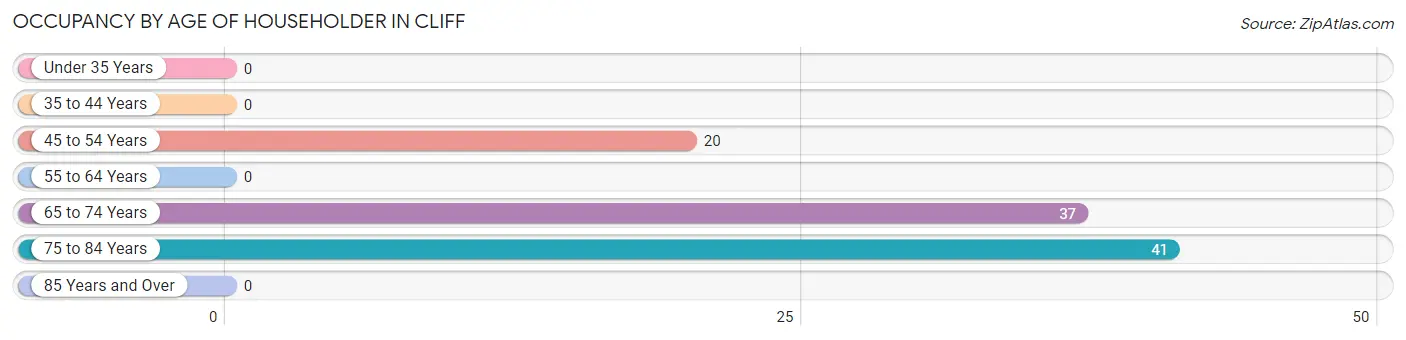
| Age Bracket | # Households | % Households |
| Under 35 Years | 0 | 0.0% |
| 35 to 44 Years | 0 | 0.0% |
| 45 to 54 Years | 20 | 20.4% |
| 55 to 64 Years | 0 | 0.0% |
| 65 to 74 Years | 37 | 37.8% |
| 75 to 84 Years | 41 | 41.8% |
| 85 Years and Over | 0 | 0.0% |
| Total | 98 | 100.0% |
Housing Finances in Cliff
Median Income by Occupancy in Cliff
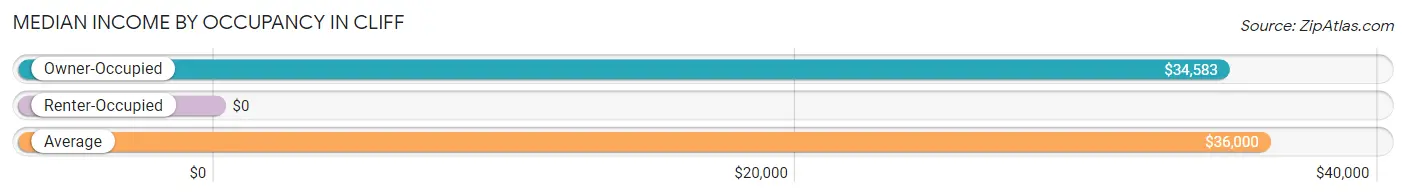
| Occupancy Type | # Households | Median Income |
| Owner-Occupied | 78 (79.6%) | $34,583 |
| Renter-Occupied | 20 (20.4%) | $0 |
| Average | 98 (100.0%) | $36,000 |
Occupancy by Householder Income Bracket in Cliff
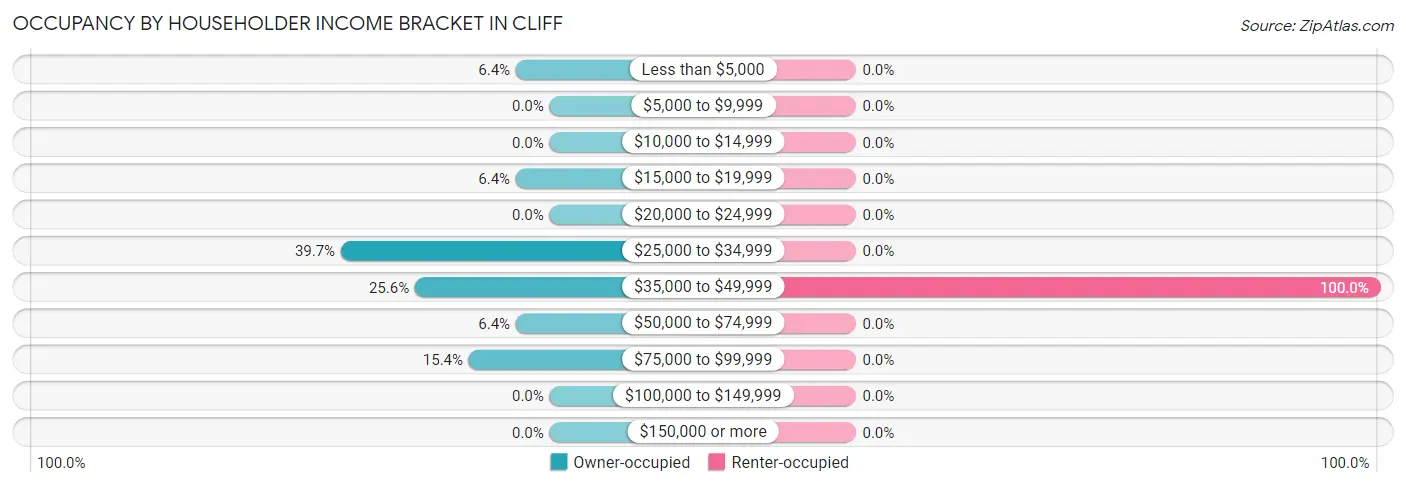
| Income Bracket | Owner-occupied | Renter-occupied |
| Less than $5,000 | 5 (6.4%) | 0 (0.0%) |
| $5,000 to $9,999 | 0 (0.0%) | 0 (0.0%) |
| $10,000 to $14,999 | 0 (0.0%) | 0 (0.0%) |
| $15,000 to $19,999 | 5 (6.4%) | 0 (0.0%) |
| $20,000 to $24,999 | 0 (0.0%) | 0 (0.0%) |
| $25,000 to $34,999 | 31 (39.7%) | 0 (0.0%) |
| $35,000 to $49,999 | 20 (25.6%) | 20 (100.0%) |
| $50,000 to $74,999 | 5 (6.4%) | 0 (0.0%) |
| $75,000 to $99,999 | 12 (15.4%) | 0 (0.0%) |
| $100,000 to $149,999 | 0 (0.0%) | 0 (0.0%) |
| $150,000 or more | 0 (0.0%) | 0 (0.0%) |
| Total | 78 (100.0%) | 20 (100.0%) |
Monthly Housing Cost Tiers in Cliff
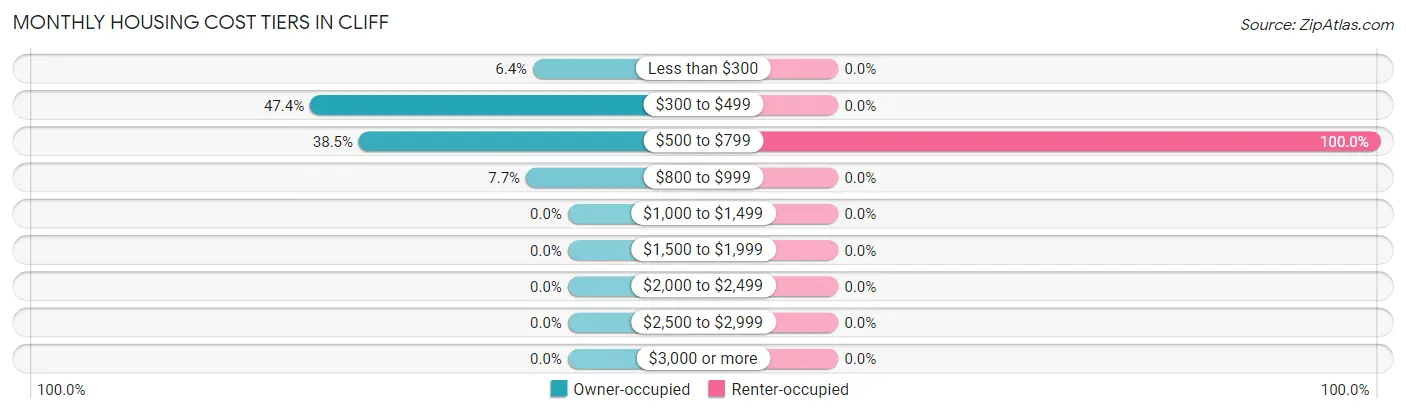
| Monthly Cost | Owner-occupied | Renter-occupied |
| Less than $300 | 5 (6.4%) | 0 (0.0%) |
| $300 to $499 | 37 (47.4%) | 0 (0.0%) |
| $500 to $799 | 30 (38.5%) | 20 (100.0%) |
| $800 to $999 | 6 (7.7%) | 0 (0.0%) |
| $1,000 to $1,499 | 0 (0.0%) | 0 (0.0%) |
| $1,500 to $1,999 | 0 (0.0%) | 0 (0.0%) |
| $2,000 to $2,499 | 0 (0.0%) | 0 (0.0%) |
| $2,500 to $2,999 | 0 (0.0%) | 0 (0.0%) |
| $3,000 or more | 0 (0.0%) | 0 (0.0%) |
| Total | 78 (100.0%) | 20 (100.0%) |
Physical Housing Characteristics in Cliff
Housing Structures in Cliff
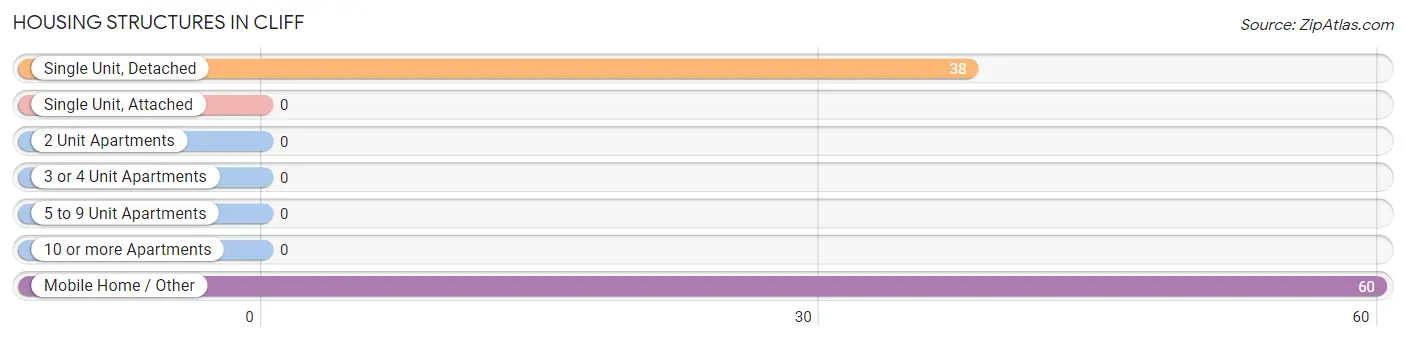
| Structure Type | # Housing Units | % Housing Units |
| Single Unit, Detached | 38 | 38.8% |
| Single Unit, Attached | 0 | 0.0% |
| 2 Unit Apartments | 0 | 0.0% |
| 3 or 4 Unit Apartments | 0 | 0.0% |
| 5 to 9 Unit Apartments | 0 | 0.0% |
| 10 or more Apartments | 0 | 0.0% |
| Mobile Home / Other | 60 | 61.2% |
| Total | 98 | 100.0% |
Housing Structures by Occupancy in Cliff
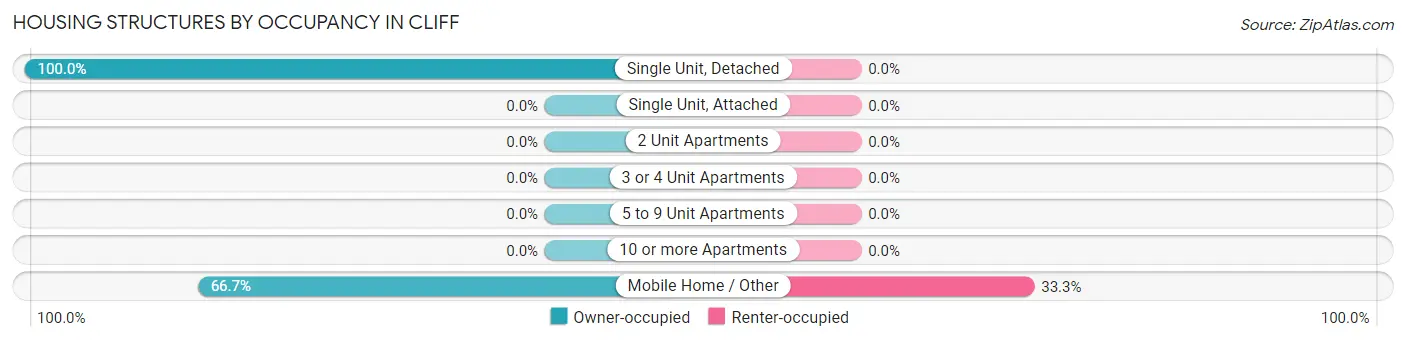
| Structure Type | Owner-occupied | Renter-occupied |
| Single Unit, Detached | 38 (100.0%) | 0 (0.0%) |
| Single Unit, Attached | 0 (0.0%) | 0 (0.0%) |
| 2 Unit Apartments | 0 (0.0%) | 0 (0.0%) |
| 3 or 4 Unit Apartments | 0 (0.0%) | 0 (0.0%) |
| 5 to 9 Unit Apartments | 0 (0.0%) | 0 (0.0%) |
| 10 or more Apartments | 0 (0.0%) | 0 (0.0%) |
| Mobile Home / Other | 40 (66.7%) | 20 (33.3%) |
| Total | 78 (79.6%) | 20 (20.4%) |
Housing Structures by Number of Rooms in Cliff
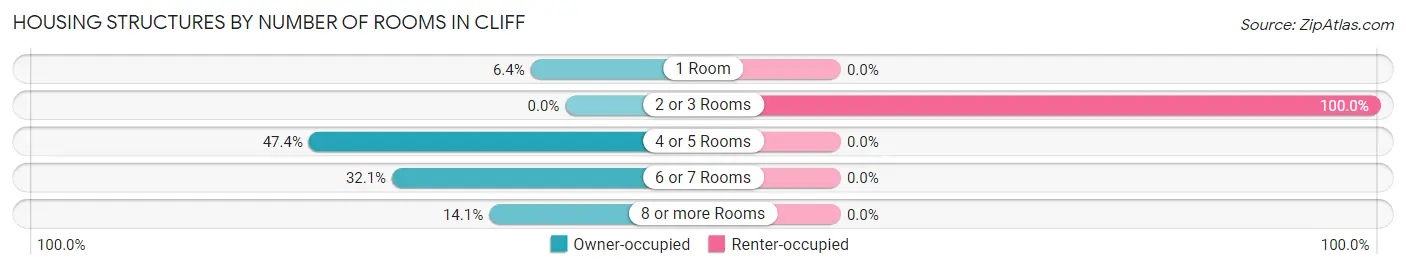
| Number of Rooms | Owner-occupied | Renter-occupied |
| 1 Room | 5 (6.4%) | 0 (0.0%) |
| 2 or 3 Rooms | 0 (0.0%) | 20 (100.0%) |
| 4 or 5 Rooms | 37 (47.4%) | 0 (0.0%) |
| 6 or 7 Rooms | 25 (32.1%) | 0 (0.0%) |
| 8 or more Rooms | 11 (14.1%) | 0 (0.0%) |
| Total | 78 (100.0%) | 20 (100.0%) |
Housing Structure by Heating Type in Cliff
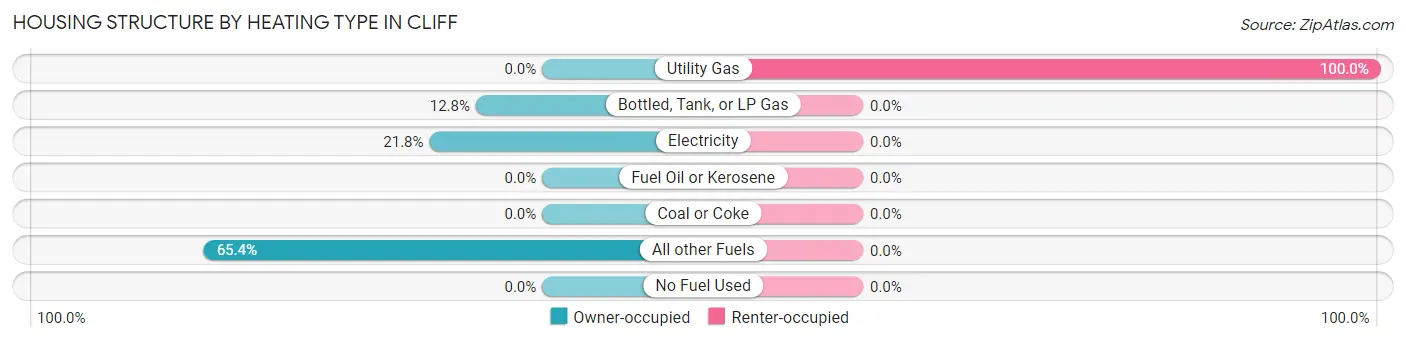
| Heating Type | Owner-occupied | Renter-occupied |
| Utility Gas | 0 (0.0%) | 20 (100.0%) |
| Bottled, Tank, or LP Gas | 10 (12.8%) | 0 (0.0%) |
| Electricity | 17 (21.8%) | 0 (0.0%) |
| Fuel Oil or Kerosene | 0 (0.0%) | 0 (0.0%) |
| Coal or Coke | 0 (0.0%) | 0 (0.0%) |
| All other Fuels | 51 (65.4%) | 0 (0.0%) |
| No Fuel Used | 0 (0.0%) | 0 (0.0%) |
| Total | 78 (100.0%) | 20 (100.0%) |
Household Vehicle Usage in Cliff
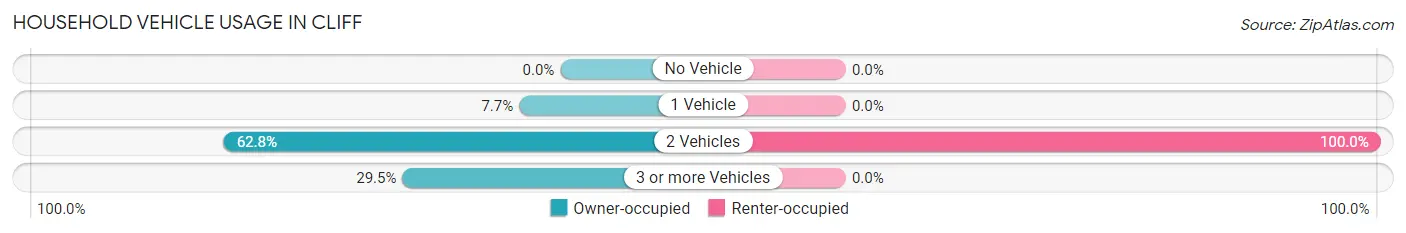
| Vehicles per Household | Owner-occupied | Renter-occupied |
| No Vehicle | 0 (0.0%) | 0 (0.0%) |
| 1 Vehicle | 6 (7.7%) | 0 (0.0%) |
| 2 Vehicles | 49 (62.8%) | 20 (100.0%) |
| 3 or more Vehicles | 23 (29.5%) | 0 (0.0%) |
| Total | 78 (100.0%) | 20 (100.0%) |
Real Estate & Mortgages in Cliff
Real Estate and Mortgage Overview in Cliff
| Characteristic | Without Mortgage | With Mortgage |
| Housing Units | 72 | 6 |
| Median Property Value | $269,600 | $0 |
| Median Household Income | $33,958 | $0 |
| Monthly Housing Costs | $467 | $0 |
| Real Estate Taxes | $1,176 | $0 |
Property Value by Mortgage Status in Cliff
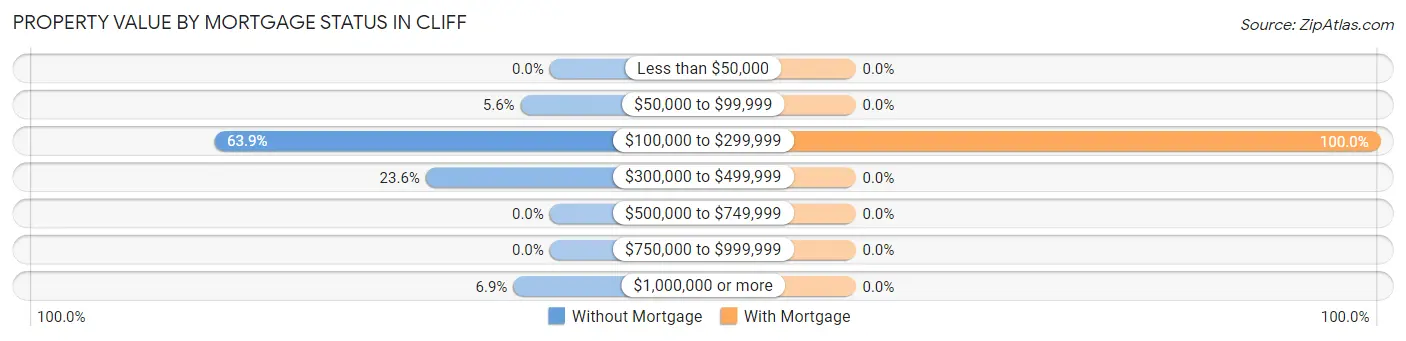
| Property Value | Without Mortgage | With Mortgage |
| Less than $50,000 | 0 (0.0%) | 0 (0.0%) |
| $50,000 to $99,999 | 4 (5.6%) | 0 (0.0%) |
| $100,000 to $299,999 | 46 (63.9%) | 6 (100.0%) |
| $300,000 to $499,999 | 17 (23.6%) | 0 (0.0%) |
| $500,000 to $749,999 | 0 (0.0%) | 0 (0.0%) |
| $750,000 to $999,999 | 0 (0.0%) | 0 (0.0%) |
| $1,000,000 or more | 5 (6.9%) | 0 (0.0%) |
| Total | 72 (100.0%) | 6 (100.0%) |
Household Income by Mortgage Status in Cliff
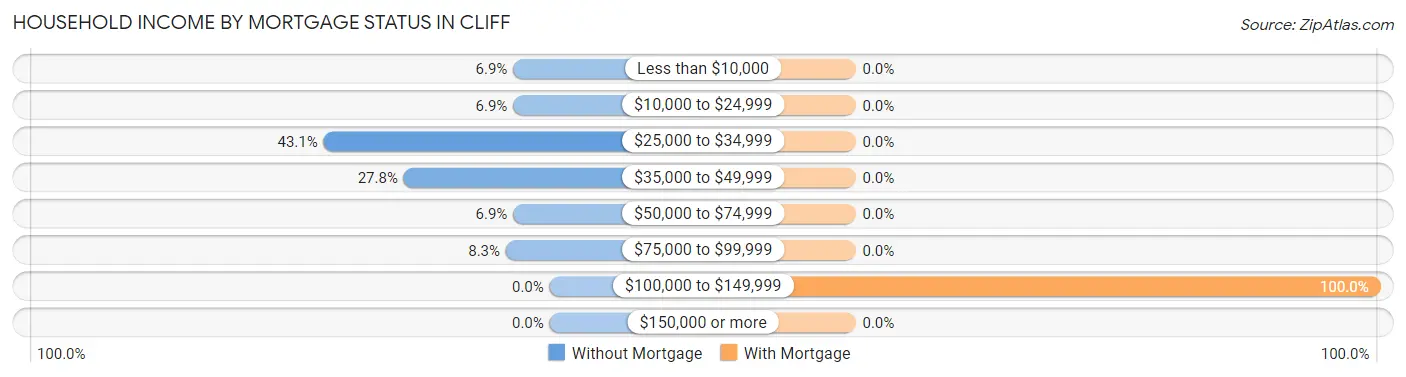
| Household Income | Without Mortgage | With Mortgage |
| Less than $10,000 | 5 (6.9%) | 0 (0.0%) |
| $10,000 to $24,999 | 5 (6.9%) | 0 (0.0%) |
| $25,000 to $34,999 | 31 (43.1%) | 0 (0.0%) |
| $35,000 to $49,999 | 20 (27.8%) | 0 (0.0%) |
| $50,000 to $74,999 | 5 (6.9%) | 0 (0.0%) |
| $75,000 to $99,999 | 6 (8.3%) | 0 (0.0%) |
| $100,000 to $149,999 | 0 (0.0%) | 6 (100.0%) |
| $150,000 or more | 0 (0.0%) | 0 (0.0%) |
| Total | 72 (100.0%) | 6 (100.0%) |
Property Value to Household Income Ratio in Cliff
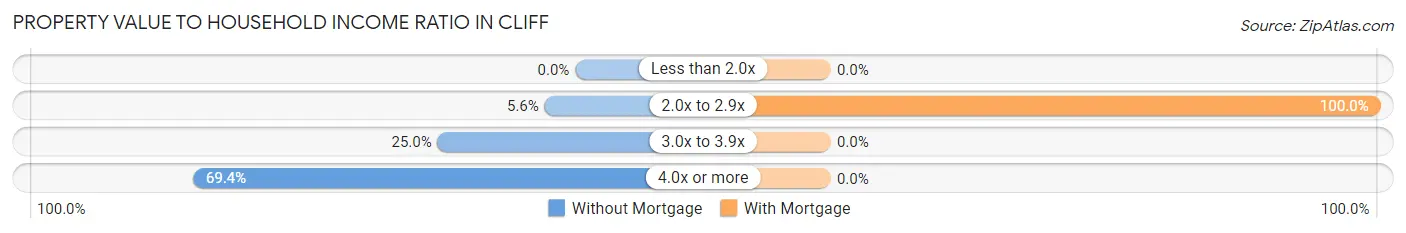
| Value-to-Income Ratio | Without Mortgage | With Mortgage |
| Less than 2.0x | 0 (0.0%) | 0 (0.0%) |
| 2.0x to 2.9x | 4 (5.6%) | 6 (100.0%) |
| 3.0x to 3.9x | 18 (25.0%) | 0 (0.0%) |
| 4.0x or more | 50 (69.4%) | 0 (0.0%) |
| Total | 72 (100.0%) | 6 (100.0%) |
Real Estate Taxes by Mortgage Status in Cliff
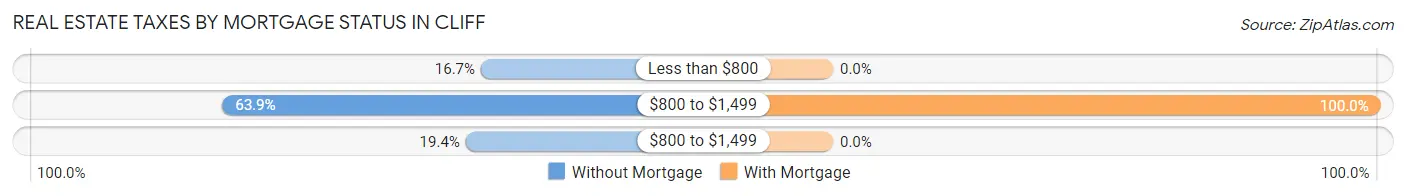
| Property Taxes | Without Mortgage | With Mortgage |
| Less than $800 | 12 (16.7%) | 0 (0.0%) |
| $800 to $1,499 | 46 (63.9%) | 6 (100.0%) |
| $800 to $1,499 | 14 (19.4%) | 0 (0.0%) |
| Total | 72 (100.0%) | 6 (100.0%) |
Health & Disability in Cliff
Health Insurance Coverage by Age in Cliff
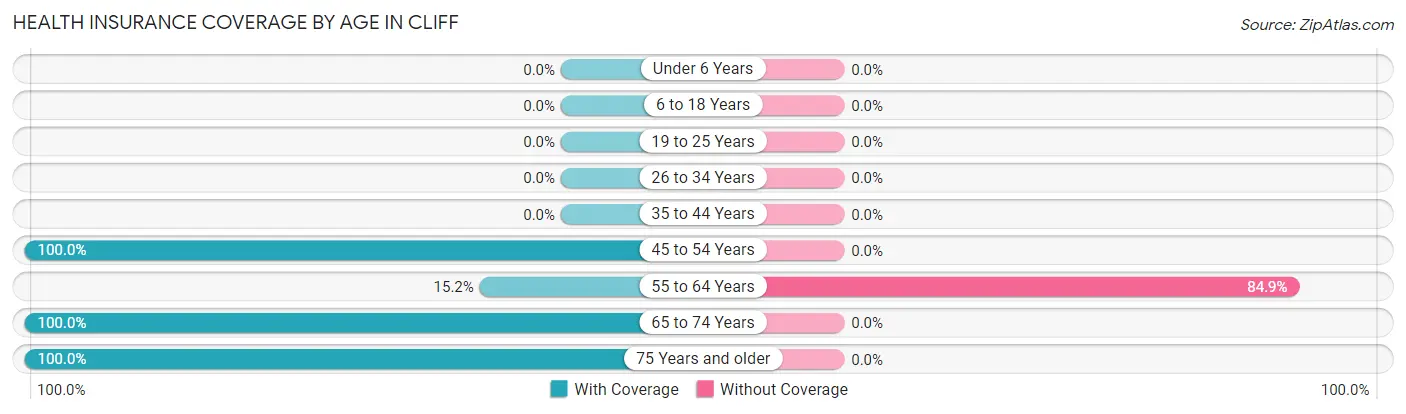
| Age Bracket | With Coverage | Without Coverage |
| Under 6 Years | 0 (0.0%) | 0 (0.0%) |
| 6 to 18 Years | 0 (0.0%) | 0 (0.0%) |
| 19 to 25 Years | 0 (0.0%) | 0 (0.0%) |
| 26 to 34 Years | 0 (0.0%) | 0 (0.0%) |
| 35 to 44 Years | 0 (0.0%) | 0 (0.0%) |
| 45 to 54 Years | 35 (100.0%) | 0 (0.0%) |
| 55 to 64 Years | 5 (15.1%) | 28 (84.9%) |
| 65 to 74 Years | 42 (100.0%) | 0 (0.0%) |
| 75 Years and older | 55 (100.0%) | 0 (0.0%) |
| Total | 137 (83.0%) | 28 (17.0%) |
Health Insurance Coverage by Citizenship Status in Cliff
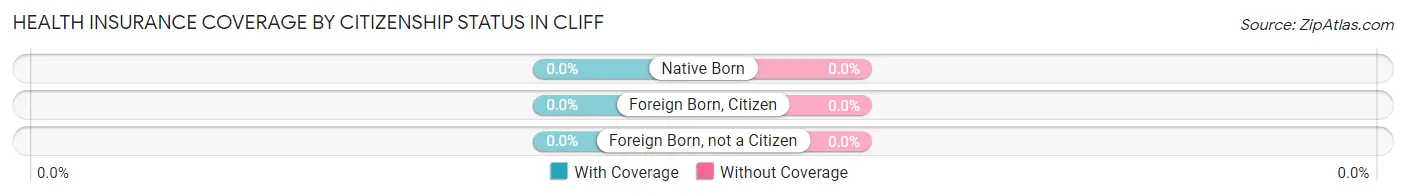
| Citizenship Status | With Coverage | Without Coverage |
| Native Born | 0 (0.0%) | 0 (0.0%) |
| Foreign Born, Citizen | 0 (0.0%) | 0 (0.0%) |
| Foreign Born, not a Citizen | 0 (0.0%) | 0 (0.0%) |
Health Insurance Coverage by Household Income in Cliff
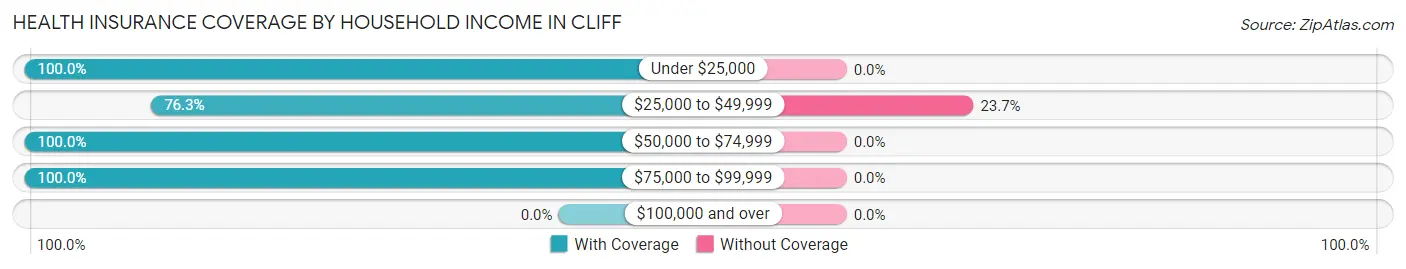
| Household Income | With Coverage | Without Coverage |
| Under $25,000 | 10 (100.0%) | 0 (0.0%) |
| $25,000 to $49,999 | 90 (76.3%) | 28 (23.7%) |
| $50,000 to $74,999 | 10 (100.0%) | 0 (0.0%) |
| $75,000 to $99,999 | 27 (100.0%) | 0 (0.0%) |
| $100,000 and over | 0 (0.0%) | 0 (0.0%) |
Public vs Private Health Insurance Coverage by Age in Cliff
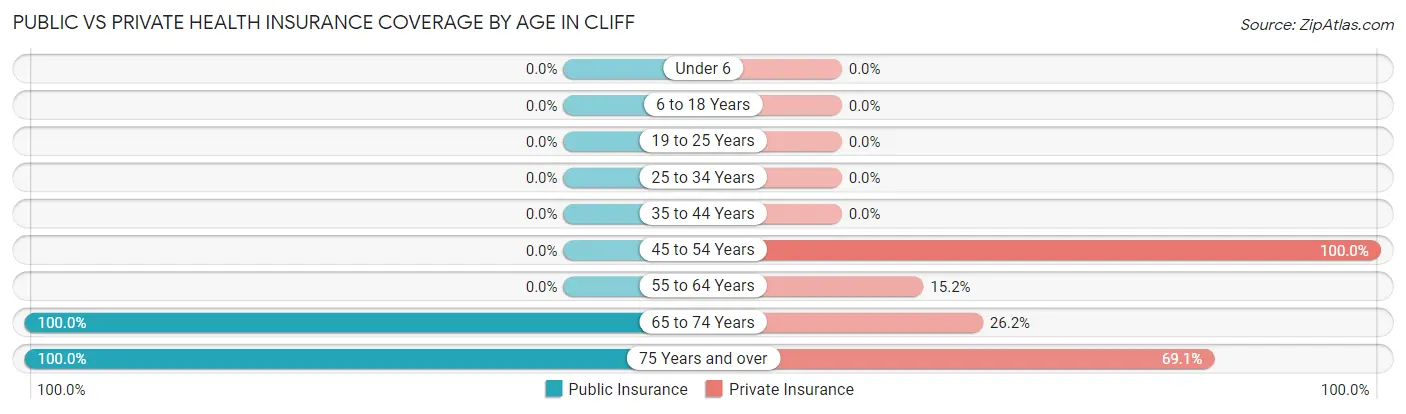
| Age Bracket | Public Insurance | Private Insurance |
| Under 6 | 0 (0.0%) | 0 (0.0%) |
| 6 to 18 Years | 0 (0.0%) | 0 (0.0%) |
| 19 to 25 Years | 0 (0.0%) | 0 (0.0%) |
| 25 to 34 Years | 0 (0.0%) | 0 (0.0%) |
| 35 to 44 Years | 0 (0.0%) | 0 (0.0%) |
| 45 to 54 Years | 0 (0.0%) | 35 (100.0%) |
| 55 to 64 Years | 0 (0.0%) | 5 (15.1%) |
| 65 to 74 Years | 42 (100.0%) | 11 (26.2%) |
| 75 Years and over | 55 (100.0%) | 38 (69.1%) |
| Total | 97 (58.8%) | 89 (53.9%) |
Disability Status by Sex by Age in Cliff
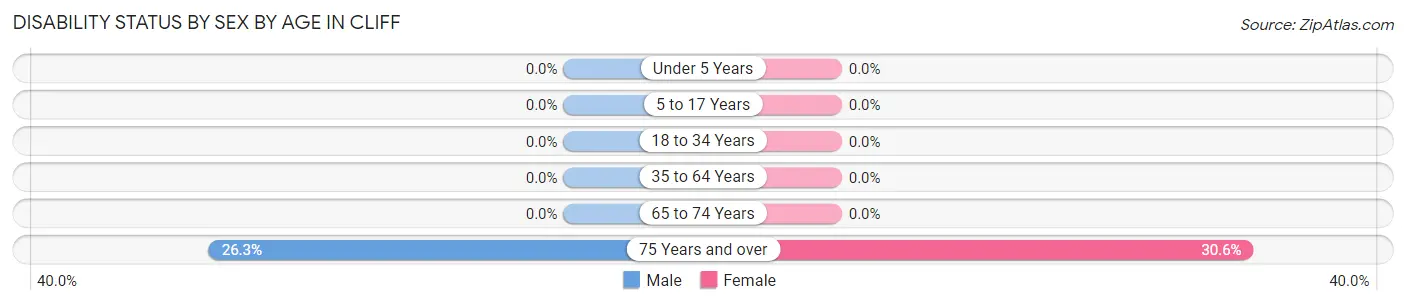
| Age Bracket | Male | Female |
| Under 5 Years | 0 (0.0%) | 0 (0.0%) |
| 5 to 17 Years | 0 (0.0%) | 0 (0.0%) |
| 18 to 34 Years | 0 (0.0%) | 0 (0.0%) |
| 35 to 64 Years | 0 (0.0%) | 0 (0.0%) |
| 65 to 74 Years | 0 (0.0%) | 0 (0.0%) |
| 75 Years and over | 5 (26.3%) | 11 (30.6%) |
Disability Class by Sex by Age in Cliff
Disability Class: Hearing Difficulty
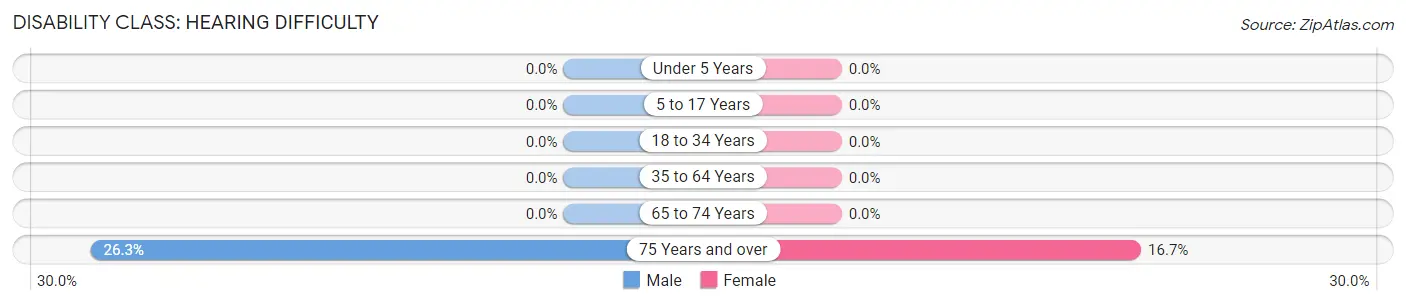
| Age Bracket | Male | Female |
| Under 5 Years | 0 (0.0%) | 0 (0.0%) |
| 5 to 17 Years | 0 (0.0%) | 0 (0.0%) |
| 18 to 34 Years | 0 (0.0%) | 0 (0.0%) |
| 35 to 64 Years | 0 (0.0%) | 0 (0.0%) |
| 65 to 74 Years | 0 (0.0%) | 0 (0.0%) |
| 75 Years and over | 5 (26.3%) | 6 (16.7%) |
Disability Class: Vision Difficulty
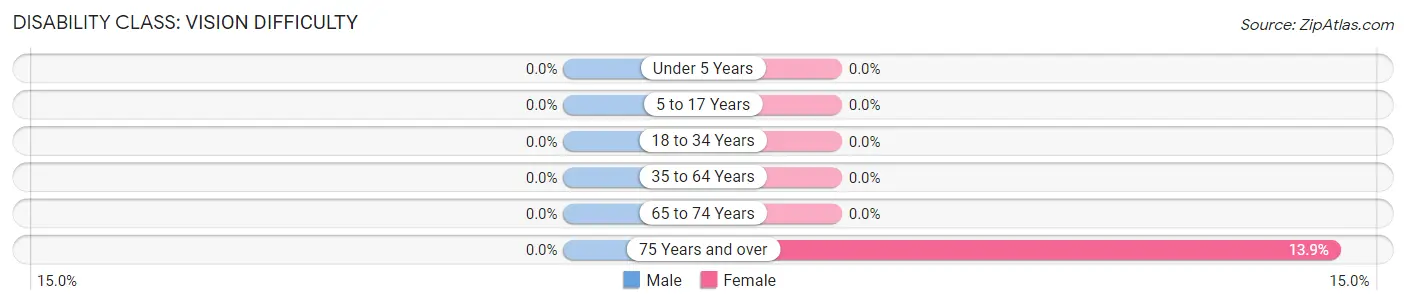
| Age Bracket | Male | Female |
| Under 5 Years | 0 (0.0%) | 0 (0.0%) |
| 5 to 17 Years | 0 (0.0%) | 0 (0.0%) |
| 18 to 34 Years | 0 (0.0%) | 0 (0.0%) |
| 35 to 64 Years | 0 (0.0%) | 0 (0.0%) |
| 65 to 74 Years | 0 (0.0%) | 0 (0.0%) |
| 75 Years and over | 0 (0.0%) | 5 (13.9%) |
Disability Class: Cognitive Difficulty

| Age Bracket | Male | Female |
| 5 to 17 Years | 0 (0.0%) | 0 (0.0%) |
| 18 to 34 Years | 0 (0.0%) | 0 (0.0%) |
| 35 to 64 Years | 0 (0.0%) | 0 (0.0%) |
| 65 to 74 Years | 0 (0.0%) | 0 (0.0%) |
| 75 Years and over | 0 (0.0%) | 0 (0.0%) |
Disability Class: Ambulatory Difficulty
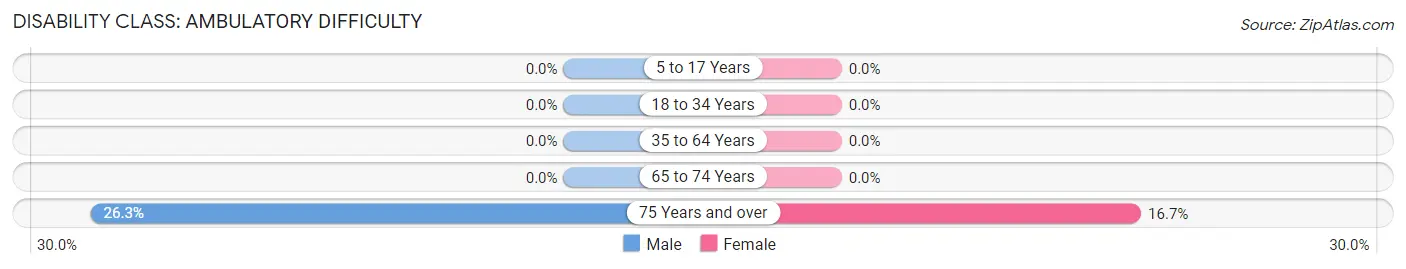
| Age Bracket | Male | Female |
| 5 to 17 Years | 0 (0.0%) | 0 (0.0%) |
| 18 to 34 Years | 0 (0.0%) | 0 (0.0%) |
| 35 to 64 Years | 0 (0.0%) | 0 (0.0%) |
| 65 to 74 Years | 0 (0.0%) | 0 (0.0%) |
| 75 Years and over | 5 (26.3%) | 6 (16.7%) |
Disability Class: Self-Care Difficulty
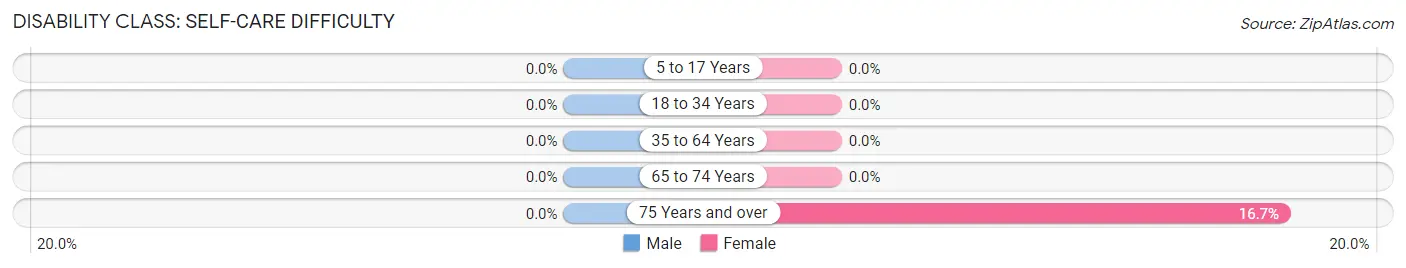
| Age Bracket | Male | Female |
| 5 to 17 Years | 0 (0.0%) | 0 (0.0%) |
| 18 to 34 Years | 0 (0.0%) | 0 (0.0%) |
| 35 to 64 Years | 0 (0.0%) | 0 (0.0%) |
| 65 to 74 Years | 0 (0.0%) | 0 (0.0%) |
| 75 Years and over | 0 (0.0%) | 6 (16.7%) |
Technology Access in Cliff
Computing Device Access in Cliff
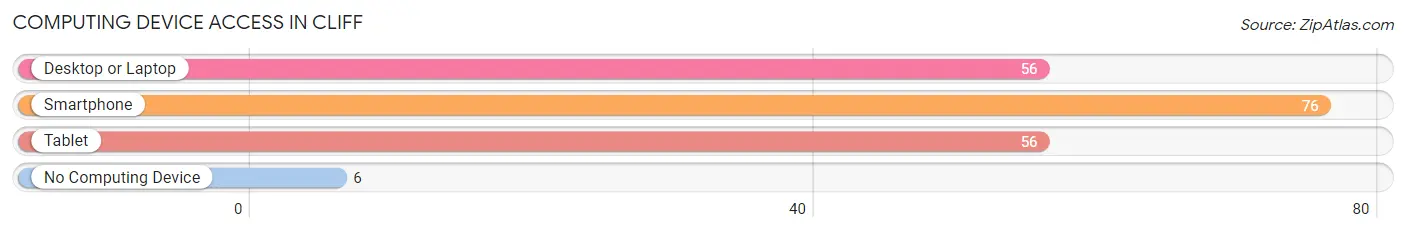
| Device Type | # Households | % Households |
| Desktop or Laptop | 56 | 57.1% |
| Smartphone | 76 | 77.5% |
| Tablet | 56 | 57.1% |
| No Computing Device | 6 | 6.1% |
| Total | 98 | 100.0% |
Internet Access in Cliff
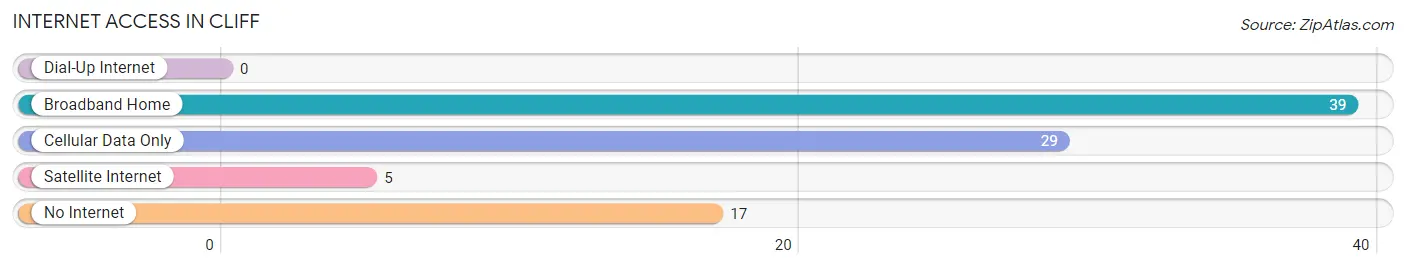
| Internet Type | # Households | % Households |
| Dial-Up Internet | 0 | 0.0% |
| Broadband Home | 39 | 39.8% |
| Cellular Data Only | 29 | 29.6% |
| Satellite Internet | 5 | 5.1% |
| No Internet | 17 | 17.3% |
| Total | 98 | 100.0% |
Cliff Summary
Cliff is a small unincorporated community located in Grant County, New Mexico. It is situated in the foothills of the Black Range Mountains, approximately 25 miles south of Silver City. The population of Cliff was estimated to be around 200 people in 2020.
History
Cliff was founded in 1881 by a group of miners who were searching for silver and gold in the area. The town was originally called “Cliff City”, but the name was later shortened to “Cliff”. The town was a popular stop for travelers on the stagecoach line between Silver City and Lordsburg.
In the early 1900s, Cliff was a thriving mining town with a population of over 1,000 people. The town had several stores, a hotel, a post office, a school, and a newspaper. The mines in the area produced silver, gold, copper, and lead.
In the 1920s, the mining industry in Cliff began to decline and the population began to dwindle. By the 1940s, the population had dropped to around 200 people. The town has remained relatively small since then.
Geography
Cliff is located in the foothills of the Black Range Mountains in southwestern New Mexico. The town is situated at an elevation of 5,400 feet above sea level. The climate in Cliff is semi-arid, with hot summers and cold winters.
The town is surrounded by the Gila National Forest, which is home to a variety of wildlife, including deer, elk, and bighorn sheep. The nearby Gila River is a popular spot for fishing and rafting.
Economy
The economy of Cliff is largely based on ranching and farming. The town is home to several ranches, which raise cattle, sheep, and horses. The nearby Gila National Forest provides timber for the local lumber industry.
The town also has a small tourism industry, with visitors coming to the area to enjoy the scenery and outdoor activities. There are several restaurants and lodging options in the area.
Demographics
The population of Cliff was estimated to be around 200 people in 2020. The town is predominantly white, with a small Hispanic population. The median household income in Cliff is around $30,000. The town has a high poverty rate, with nearly one-third of the population living below the poverty line.
Cliff is served by the Cliff-Gila School District, which includes one elementary school and one high school. The town is also home to a small library and a community center.
Conclusion
Cliff is a small unincorporated community located in Grant County, New Mexico. It is situated in the foothills of the Black Range Mountains, approximately 25 miles south of Silver City. The town has a long history of mining and ranching, and the economy is largely based on these industries. The population of Cliff was estimated to be around 200 people in 2020. The town is predominantly white, with a small Hispanic population. The median household income in Cliff is around $30,000 and the town has a high poverty rate. Cliff is served by the Cliff-Gila School District and is home to a small library and a community center.
Common Questions
What is Per Capita Income in Cliff?
Per Capita income in Cliff is $28,957.
What is the Median Family Income in Cliff?
Median Family Income in Cliff is $44,500.
What is the Median Household income in Cliff?
Median Household Income in Cliff is $36,000.
What is Inequality or Gini Index in Cliff?
Inequality or Gini Index in Cliff is 0.27.
What is the Total Population of Cliff?
Total Population of Cliff is 165.
What is the Total Male Population of Cliff?
Total Male Population of Cliff is 92.
What is the Total Female Population of Cliff?
Total Female Population of Cliff is 73.
What is the Ratio of Males per 100 Females in Cliff?
There are 126.03 Males per 100 Females in Cliff.
What is the Ratio of Females per 100 Males in Cliff?
There are 79.35 Females per 100 Males in Cliff.
What is the Median Population Age in Cliff?
Median Population Age in Cliff is 68.3 Years.
What is the Average Family Size in Cliff
Average Family Size in Cliff is 2.7 People.
What is the Average Household Size in Cliff
Average Household Size in Cliff is 1.7 People.
How Large is the Labor Force in Cliff?
There are 52 People in the Labor Forcein in Cliff.
What is the Percentage of People in the Labor Force in Cliff?
31.5% of People are in the Labor Force in Cliff.