Rock Springs, NM Map & Demographics
Rock Springs Map
Rock Springs Overview
$28,437
PER CAPITA INCOME
50.1%
WAGE / INCOME GAP [ % ]
49.9¢/ $1
WAGE / INCOME GAP [ $ ]
0.41
INEQUALITY / GINI INDEX
999
TOTAL POPULATION
398
MALE POPULATION
601
FEMALE POPULATION
66.22
MALES / 100 FEMALES
151.01
FEMALES / 100 MALES
39.6
MEDIAN AGE
5.4
AVG FAMILY SIZE
4.8
AVG HOUSEHOLD SIZE
499
LABOR FORCE [ PEOPLE ]
61.5%
PERCENT IN LABOR FORCE
3.8%
UNEMPLOYMENT RATE
Income in Rock Springs
Income Overview in Rock Springs
| Characteristic | Number | Measure |
| Per Capita Income | 999 | $28,437 |
| Median Family Income | 177 | $0 |
| Mean Family Income | 177 | $84,416 |
| Median Household Income | 210 | $0 |
| Mean Household Income | 210 | $77,500 |
| Income Deficit | 177 | $0 |
| Wage / Income Gap (%) | 999 | 50.14% |
| Wage / Income Gap ($) | 999 | 49.86¢ per $1 |
| Gini / Inequality Index | 999 | 0.41 |
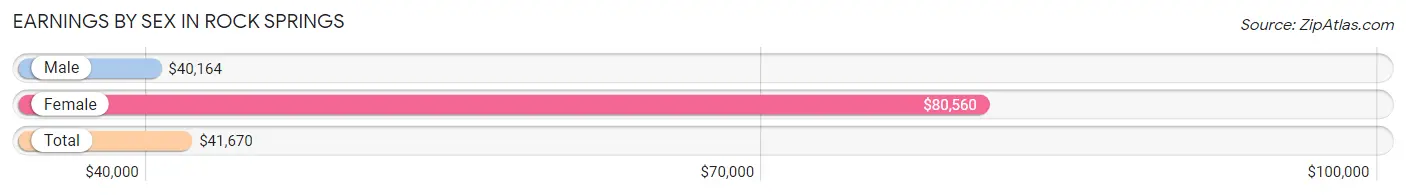
Earnings by Sex in Rock Springs
Average Earnings in Rock Springs are $41,670, $40,164 for men and $80,560 for women, a difference of 50.1%.
| Sex | Number | Average Earnings |
| Male | 237 (45.8%) | $40,164 |
| Female | 280 (54.2%) | $80,560 |
| Total | 517 (100.0%) | $41,670 |
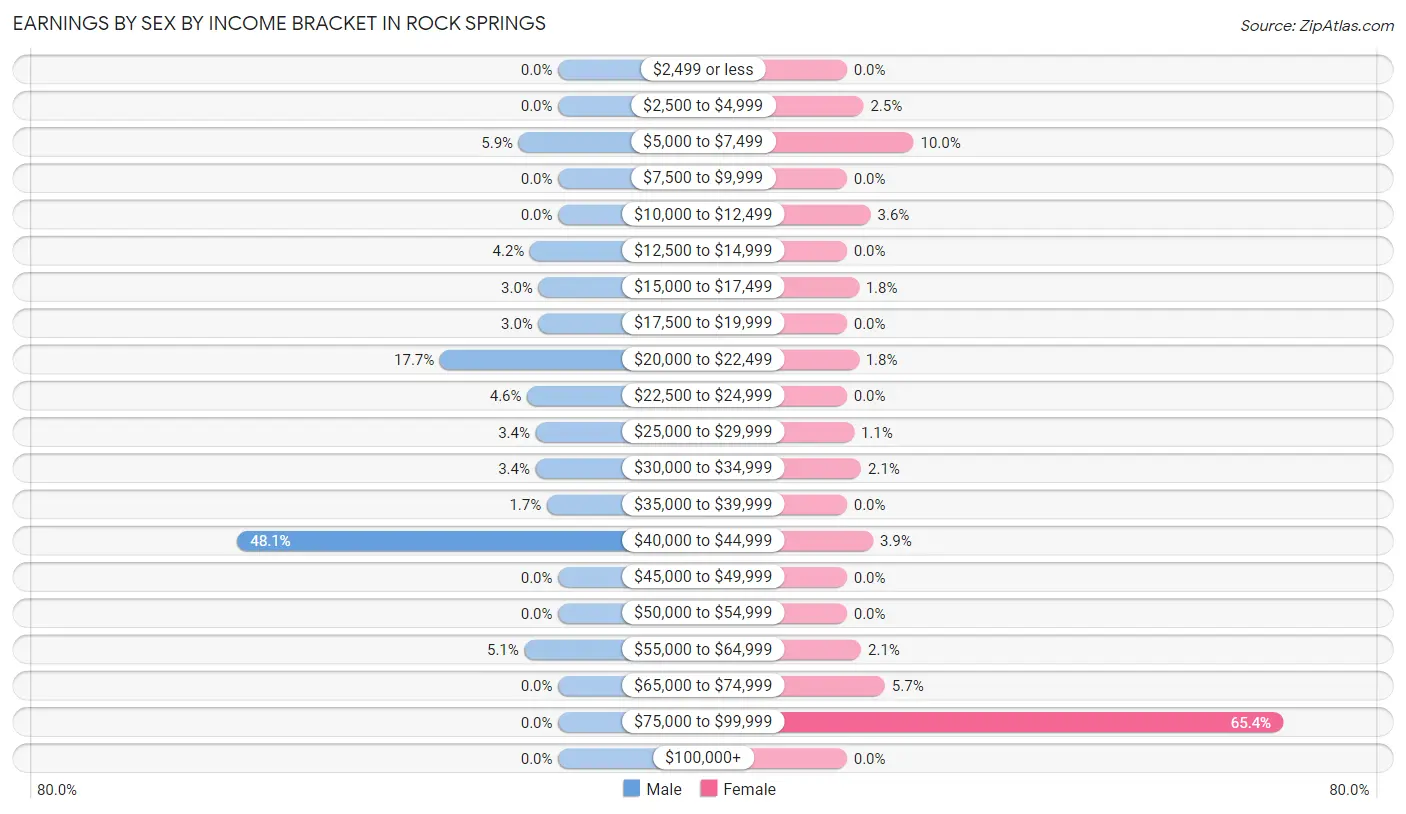
Earnings by Sex by Income Bracket in Rock Springs
The most common earnings brackets in Rock Springs are $40,000 to $44,999 for men (114 | 48.1%) and $75,000 to $99,999 for women (183 | 65.4%).
| Income | Male | Female |
| $2,499 or less | 0 (0.0%) | 0 (0.0%) |
| $2,500 to $4,999 | 0 (0.0%) | 7 (2.5%) |
| $5,000 to $7,499 | 14 (5.9%) | 28 (10.0%) |
| $7,500 to $9,999 | 0 (0.0%) | 0 (0.0%) |
| $10,000 to $12,499 | 0 (0.0%) | 10 (3.6%) |
| $12,500 to $14,999 | 10 (4.2%) | 0 (0.0%) |
| $15,000 to $17,499 | 7 (2.9%) | 5 (1.8%) |
| $17,500 to $19,999 | 7 (2.9%) | 0 (0.0%) |
| $20,000 to $22,499 | 42 (17.7%) | 5 (1.8%) |
| $22,500 to $24,999 | 11 (4.6%) | 0 (0.0%) |
| $25,000 to $29,999 | 8 (3.4%) | 3 (1.1%) |
| $30,000 to $34,999 | 8 (3.4%) | 6 (2.1%) |
| $35,000 to $39,999 | 4 (1.7%) | 0 (0.0%) |
| $40,000 to $44,999 | 114 (48.1%) | 11 (3.9%) |
| $45,000 to $49,999 | 0 (0.0%) | 0 (0.0%) |
| $50,000 to $54,999 | 0 (0.0%) | 0 (0.0%) |
| $55,000 to $64,999 | 12 (5.1%) | 6 (2.1%) |
| $65,000 to $74,999 | 0 (0.0%) | 16 (5.7%) |
| $75,000 to $99,999 | 0 (0.0%) | 183 (65.4%) |
| $100,000+ | 0 (0.0%) | 0 (0.0%) |
| Total | 237 (100.0%) | 280 (100.0%) |
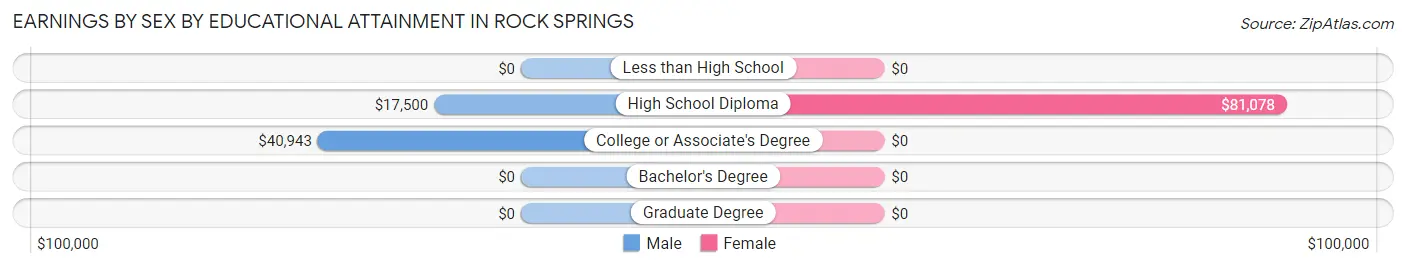
Earnings by Sex by Educational Attainment in Rock Springs
Average earnings in Rock Springs are $40,285 for men and $80,704 for women, a difference of 50.1%. Men with an educational attainment of college or associate's degree enjoy the highest average annual earnings of $40,943, while those with high school diploma education earn the least with $17,500. Women with an educational attainment of high school diploma earn the most with the average annual earnings of $81,078, while those with high school diploma education have the smallest earnings of $81,078.
| Educational Attainment | Male Income | Female Income |
| Less than High School | - | - |
| High School Diploma | $17,500 | $81,078 |
| College or Associate's Degree | $40,943 | $0 |
| Bachelor's Degree | - | - |
| Graduate Degree | - | - |
| Total | $40,285 | $80,704 |
Family Income in Rock Springs
Family Income Brackets in Rock Springs
According to the Rock Springs family income data, there are 79 families falling into the $100,000 to $149,999 income range, which is the most common income bracket and makes up 44.6% of all families.
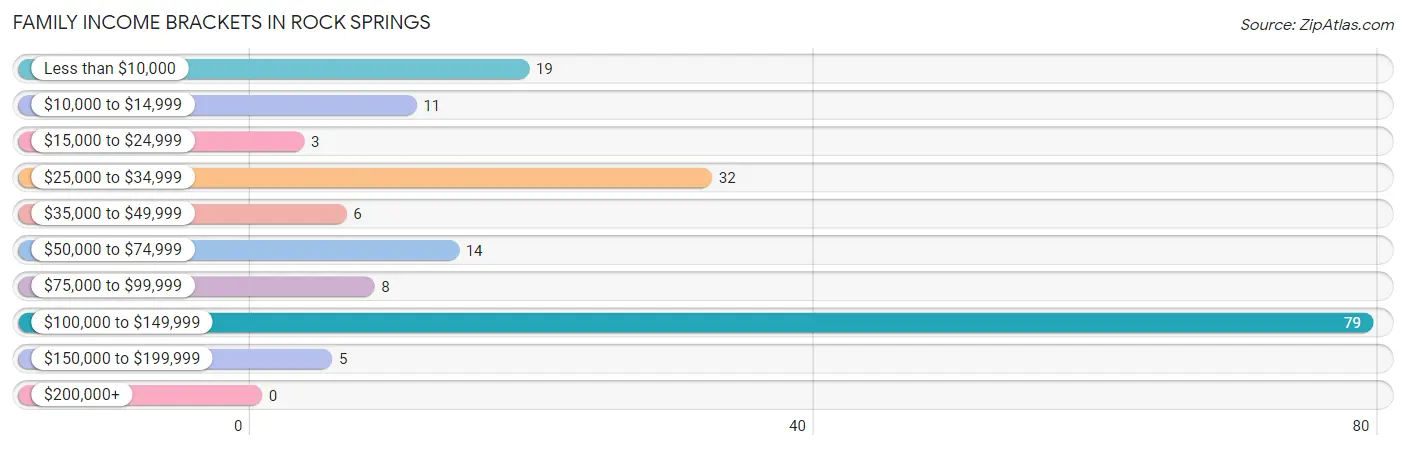
| Income Bracket | # Families | % Families |
| Less than $10,000 | 19 | 10.7% |
| $10,000 to $14,999 | 11 | 6.2% |
| $15,000 to $24,999 | 3 | 1.7% |
| $25,000 to $34,999 | 32 | 18.1% |
| $35,000 to $49,999 | 6 | 3.4% |
| $50,000 to $74,999 | 14 | 7.9% |
| $75,000 to $99,999 | 8 | 4.5% |
| $100,000 to $149,999 | 79 | 44.6% |
| $150,000 to $199,999 | 5 | 2.8% |
| $200,000+ | 0 | 0.0% |
Family Income by Famaliy Size in Rock Springs
3-person families (21 | 11.9%) account for the highest median family income in Rock Springs with $127,813 per family, while 3-person families (21 | 11.9%) have the highest median income of $42,604 per family member.
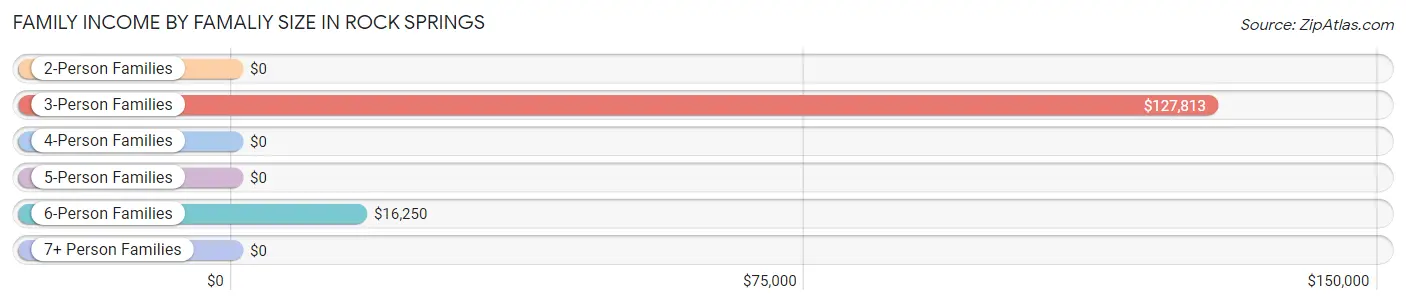
| Income Bracket | # Families | Median Income |
| 2-Person Families | 21 (11.9%) | $0 |
| 3-Person Families | 21 (11.9%) | $127,813 |
| 4-Person Families | 115 (65.0%) | $0 |
| 5-Person Families | 0 (0.0%) | $0 |
| 6-Person Families | 7 (4.0%) | $16,250 |
| 7+ Person Families | 13 (7.3%) | $0 |
| Total | 177 (100.0%) | $0 |
Family Income by Number of Earners in Rock Springs
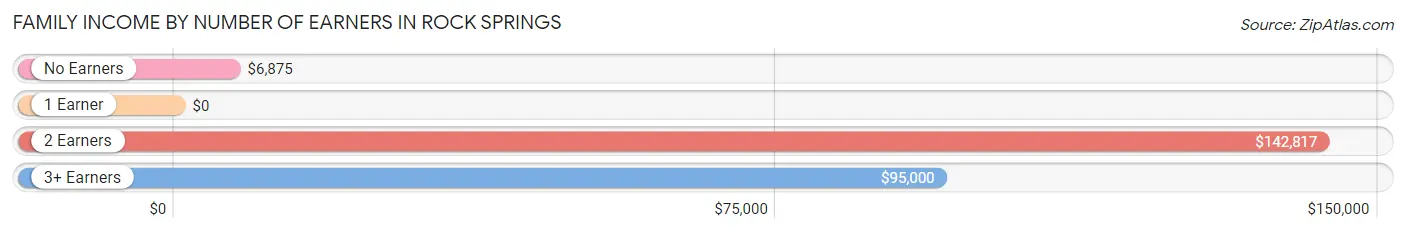
| Number of Earners | # Families | Median Income |
| No Earners | 21 (11.9%) | $6,875 |
| 1 Earner | 28 (15.8%) | $0 |
| 2 Earners | 110 (62.2%) | $142,817 |
| 3+ Earners | 18 (10.2%) | $95,000 |
| Total | 177 (100.0%) | $0 |
Household Income in Rock Springs
Household Income Brackets in Rock Springs
With 79 households falling in the category, the $100,000 to $149,999 income range is the most frequent in Rock Springs, accounting for 37.6% of all households.
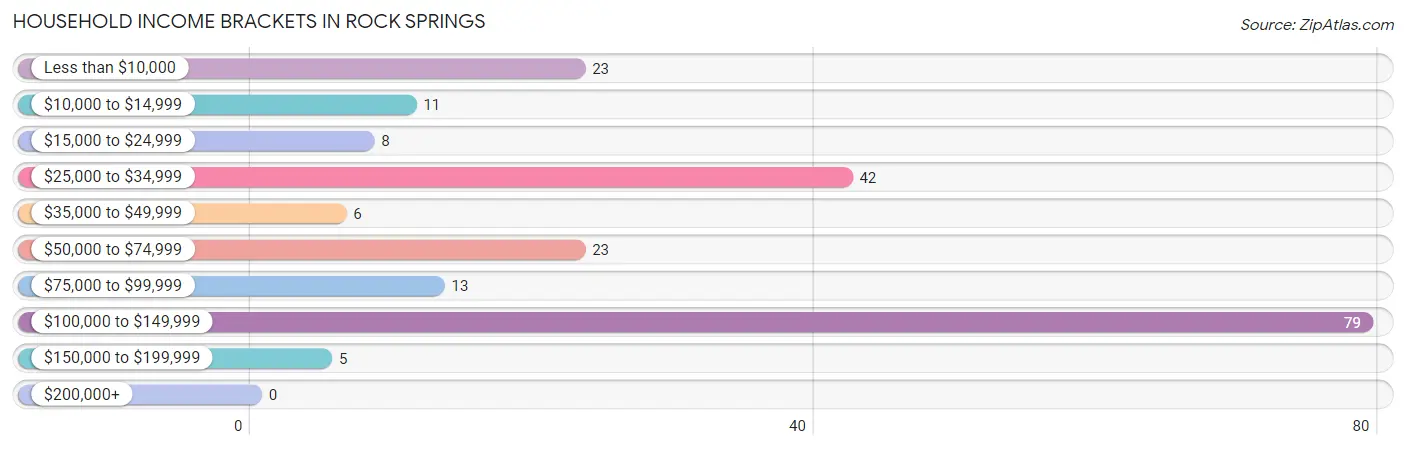
| Income Bracket | # Households | % Households |
| Less than $10,000 | 23 | 11.0% |
| $10,000 to $14,999 | 11 | 5.2% |
| $15,000 to $24,999 | 8 | 3.8% |
| $25,000 to $34,999 | 42 | 20.0% |
| $35,000 to $49,999 | 6 | 2.9% |
| $50,000 to $74,999 | 23 | 11.0% |
| $75,000 to $99,999 | 13 | 6.2% |
| $100,000 to $149,999 | 79 | 37.6% |
| $150,000 to $199,999 | 5 | 2.4% |
| $200,000+ | 0 | 0.0% |
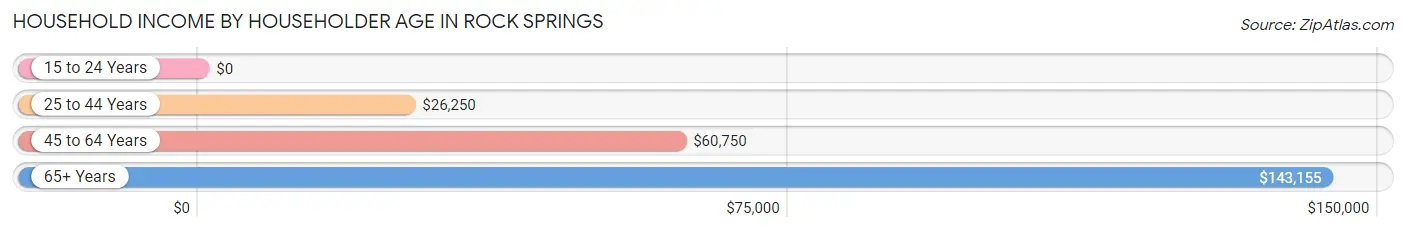
Household Income by Householder Age in Rock Springs
The median household income in Rock Springs is $0, with the highest median household income of $143,155 found in the 65+ years age bracket for the primary householder. A total of 93 households (44.3%) fall into this category.
| Income Bracket | # Households | Median Income |
| 15 to 24 Years | 0 (0.0%) | $0 |
| 25 to 44 Years | 58 (27.6%) | $26,250 |
| 45 to 64 Years | 59 (28.1%) | $60,750 |
| 65+ Years | 93 (44.3%) | $143,155 |
| Total | 210 (100.0%) | $0 |
Poverty in Rock Springs
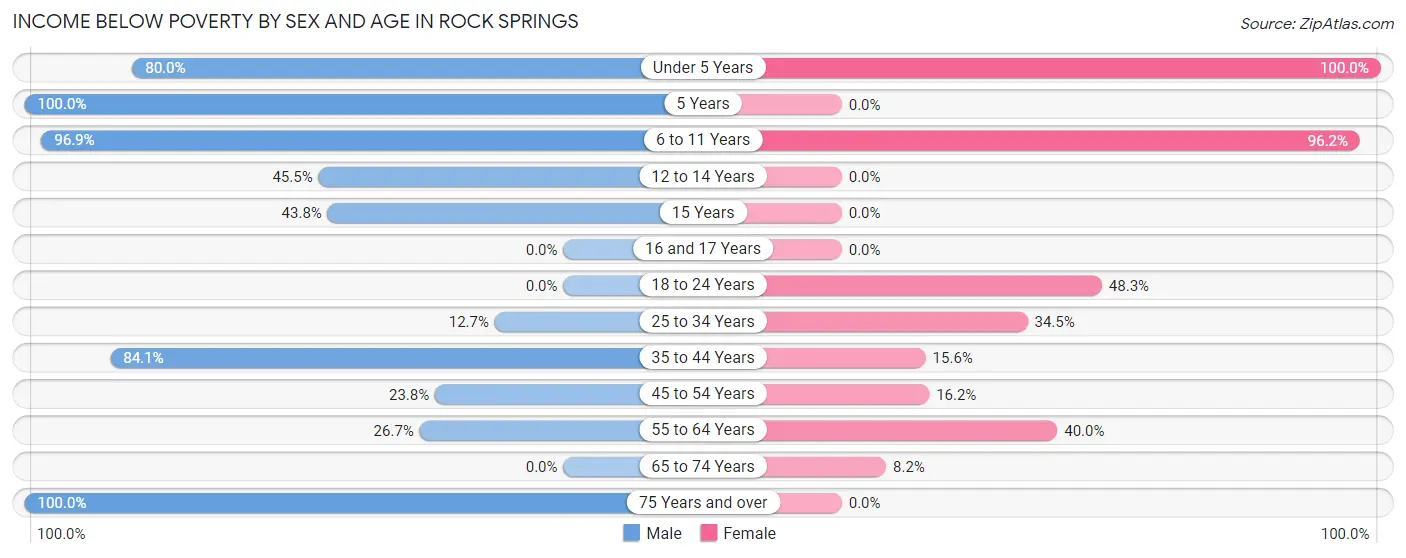
Income Below Poverty by Sex and Age in Rock Springs
With 41.2% poverty level for males and 23.3% for females among the residents of Rock Springs, 5 year old males and under 5 year old females are the most vulnerable to poverty, with 30 males (100.0%) and 11 females (100.0%) in their respective age groups living below the poverty level.
| Age Bracket | Male | Female |
| Under 5 Years | 16 (80.0%) | 11 (100.0%) |
| 5 Years | 30 (100.0%) | 0 (0.0%) |
| 6 to 11 Years | 31 (96.9%) | 50 (96.2%) |
| 12 to 14 Years | 5 (45.5%) | 0 (0.0%) |
| 15 Years | 7 (43.8%) | 0 (0.0%) |
| 16 and 17 Years | 0 (0.0%) | 0 (0.0%) |
| 18 to 24 Years | 0 (0.0%) | 14 (48.3%) |
| 25 to 34 Years | 21 (12.7%) | 10 (34.5%) |
| 35 to 44 Years | 37 (84.1%) | 33 (15.6%) |
| 45 to 54 Years | 5 (23.8%) | 6 (16.2%) |
| 55 to 64 Years | 8 (26.7%) | 10 (40.0%) |
| 65 to 74 Years | 0 (0.0%) | 6 (8.2%) |
| 75 Years and over | 4 (100.0%) | 0 (0.0%) |
| Total | 164 (41.2%) | 140 (23.3%) |
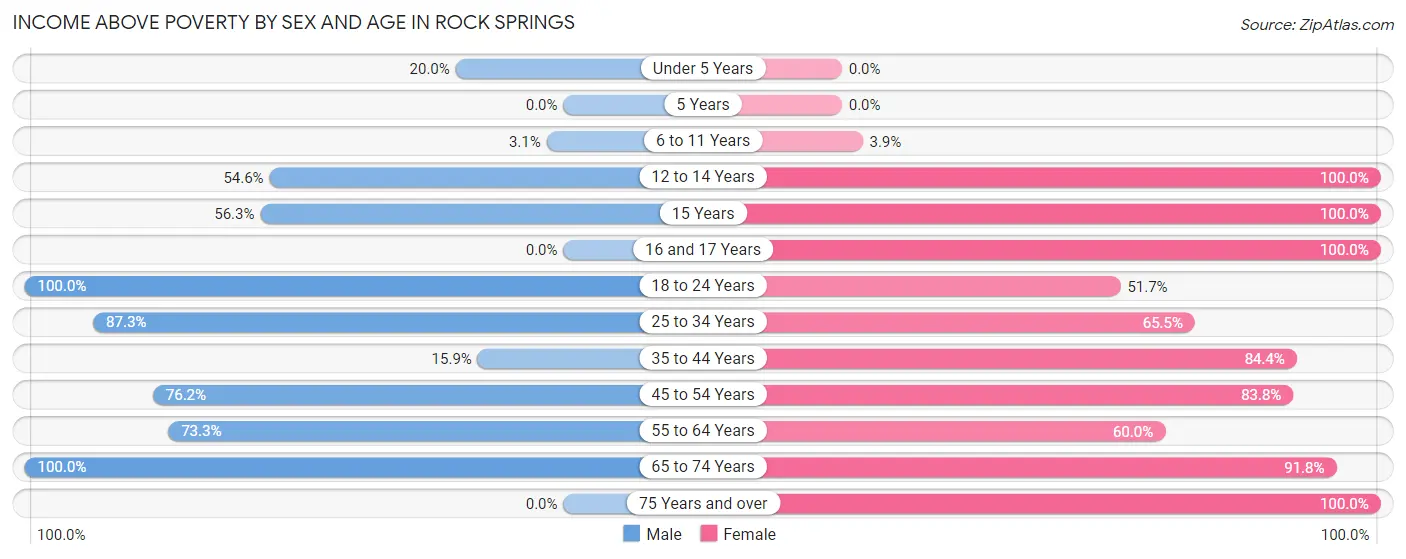
Income Above Poverty by Sex and Age in Rock Springs
According to the poverty statistics in Rock Springs, males aged 18 to 24 years and females aged 12 to 14 years are the age groups that are most secure financially, with 100.0% of males and 100.0% of females in these age groups living above the poverty line.
| Age Bracket | Male | Female |
| Under 5 Years | 4 (20.0%) | 0 (0.0%) |
| 5 Years | 0 (0.0%) | 0 (0.0%) |
| 6 to 11 Years | 1 (3.1%) | 2 (3.8%) |
| 12 to 14 Years | 6 (54.5%) | 10 (100.0%) |
| 15 Years | 9 (56.2%) | 6 (100.0%) |
| 16 and 17 Years | 0 (0.0%) | 10 (100.0%) |
| 18 to 24 Years | 14 (100.0%) | 15 (51.7%) |
| 25 to 34 Years | 144 (87.3%) | 19 (65.5%) |
| 35 to 44 Years | 7 (15.9%) | 179 (84.4%) |
| 45 to 54 Years | 16 (76.2%) | 31 (83.8%) |
| 55 to 64 Years | 22 (73.3%) | 15 (60.0%) |
| 65 to 74 Years | 11 (100.0%) | 67 (91.8%) |
| 75 Years and over | 0 (0.0%) | 107 (100.0%) |
| Total | 234 (58.8%) | 461 (76.7%) |
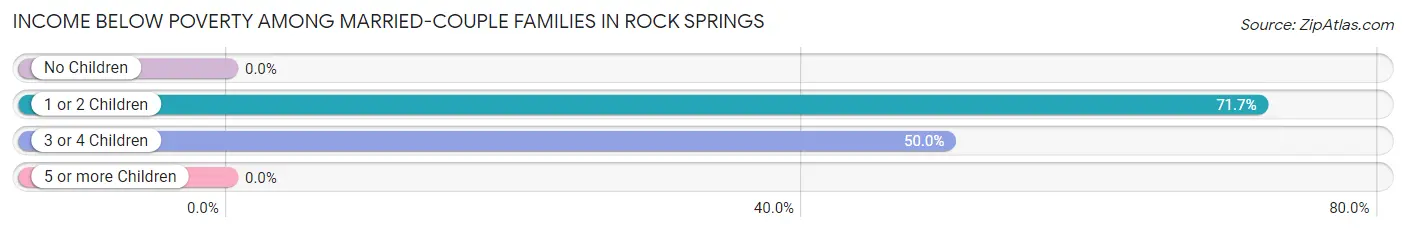
Income Below Poverty Among Married-Couple Families in Rock Springs
The poverty statistics for married-couple families in Rock Springs show that 60.3% or 35 of the total 58 families live below the poverty line. Families with 1 or 2 children have the highest poverty rate of 71.7%, comprising of 33 families. On the other hand, families with no children have the lowest poverty rate of 0.0%, which includes 0 families.
| Children | Above Poverty | Below Poverty |
| No Children | 8 (100.0%) | 0 (0.0%) |
| 1 or 2 Children | 13 (28.3%) | 33 (71.7%) |
| 3 or 4 Children | 2 (50.0%) | 2 (50.0%) |
| 5 or more Children | 0 (0.0%) | 0 (0.0%) |
| Total | 23 (39.7%) | 35 (60.3%) |
Income Below Poverty Among Single-Parent Households in Rock Springs
According to the poverty data in Rock Springs, 71.4% or 10 single-father households and 15.2% or 16 single-mother households are living below the poverty line. Among single-father households, those with no children have the highest poverty rate, with 4 households (100.0%) experiencing poverty. Likewise, among single-mother households, those with 5 or more children have the highest poverty rate, with 3 households (100.0%) falling below the poverty line.
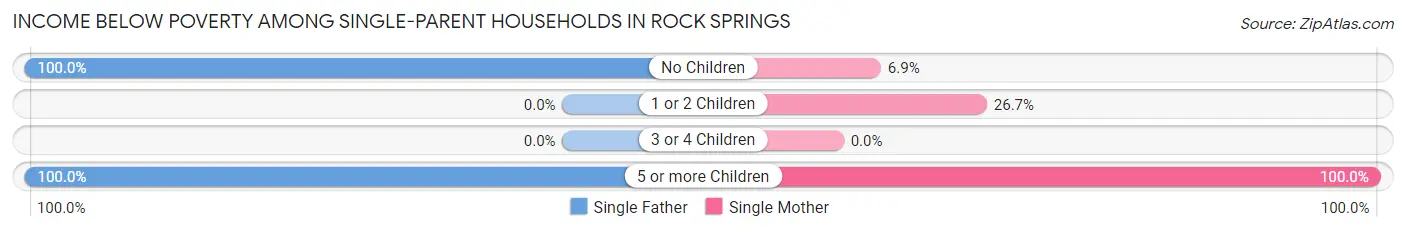
| Children | Single Father | Single Mother |
| No Children | 4 (100.0%) | 5 (6.9%) |
| 1 or 2 Children | 0 (0.0%) | 8 (26.7%) |
| 3 or 4 Children | 0 (0.0%) | 0 (0.0%) |
| 5 or more Children | 6 (100.0%) | 3 (100.0%) |
| Total | 10 (71.4%) | 16 (15.2%) |
Income Below Poverty Among Married-Couple vs Single-Parent Households in Rock Springs
The poverty data for Rock Springs shows that 35 of the married-couple family households (60.3%) and 26 of the single-parent households (21.8%) are living below the poverty level. Within the married-couple family households, those with 1 or 2 children have the highest poverty rate, with 33 households (71.7%) falling below the poverty line. Among the single-parent households, those with 5 or more children have the highest poverty rate, with 9 household (100.0%) living below poverty.
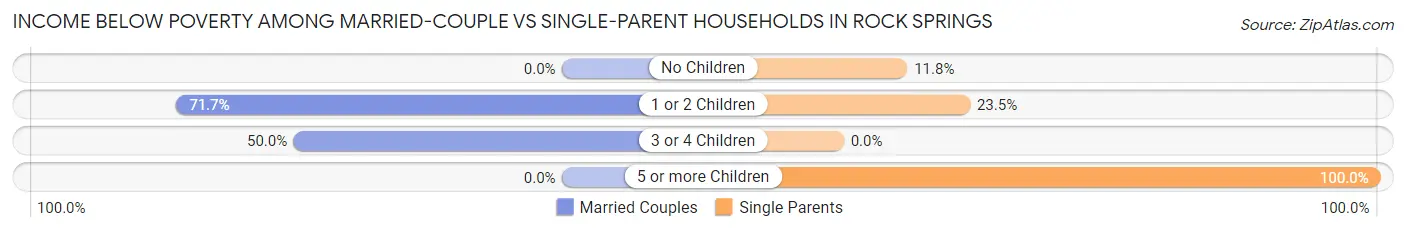
| Children | Married-Couple Families | Single-Parent Households |
| No Children | 0 (0.0%) | 9 (11.8%) |
| 1 or 2 Children | 33 (71.7%) | 8 (23.5%) |
| 3 or 4 Children | 2 (50.0%) | 0 (0.0%) |
| 5 or more Children | 0 (0.0%) | 9 (100.0%) |
| Total | 35 (60.3%) | 26 (21.8%) |
Race in Rock Springs
The most populous races in Rock Springs are , and Native / Alaskan (999 | 100.0%).
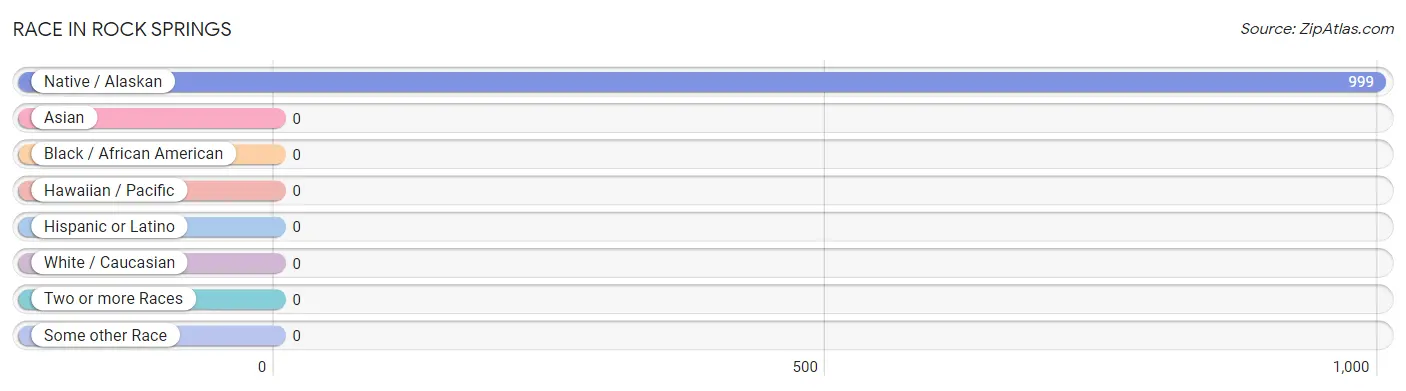
| Race | # Population | % Population |
| Asian | 0 | 0.0% |
| Black / African American | 0 | 0.0% |
| Hawaiian / Pacific | 0 | 0.0% |
| Hispanic or Latino | 0 | 0.0% |
| Native / Alaskan | 999 | 100.0% |
| White / Caucasian | 0 | 0.0% |
| Two or more Races | 0 | 0.0% |
| Some other Race | 0 | 0.0% |
| Total | 999 | 100.0% |
Ancestry in Rock Springs
The most populous ancestries reported in Rock Springs are , and Navajo (999 | 100.0%), together accounting for 100.0% of all Rock Springs residents.

| Ancestry | # Population | % Population |
| Navajo | 999 | 100.0% | View All 1 Rows |
Immigrants in Rock Springs

| Immigration Origin | # Population | % Population | View All 0 Rows |
Sex and Age in Rock Springs
Sex and Age in Rock Springs
The most populous age groups in Rock Springs are 30 to 34 Years (135 | 33.9%) for men and 40 to 44 Years (174 | 28.9%) for women.
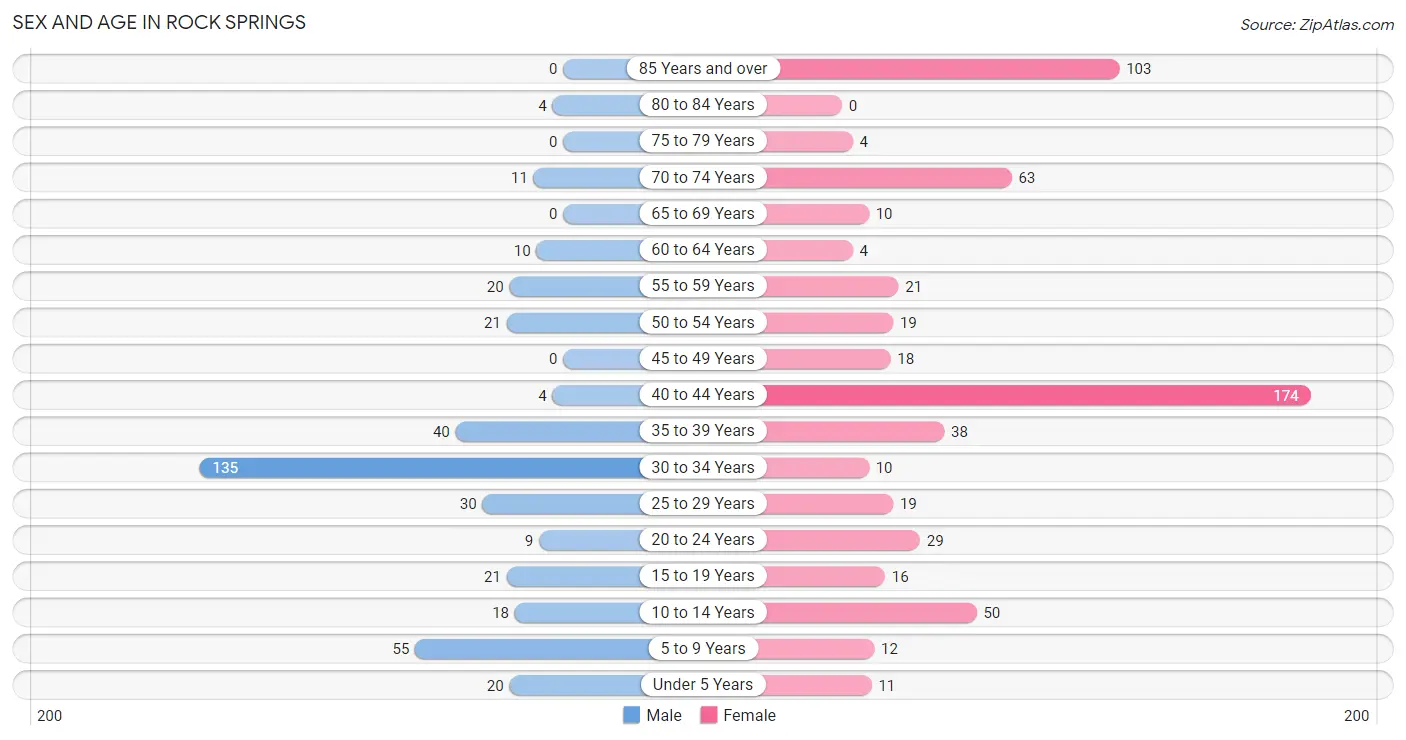
| Age Bracket | Male | Female |
| Under 5 Years | 20 (5.0%) | 11 (1.8%) |
| 5 to 9 Years | 55 (13.8%) | 12 (2.0%) |
| 10 to 14 Years | 18 (4.5%) | 50 (8.3%) |
| 15 to 19 Years | 21 (5.3%) | 16 (2.7%) |
| 20 to 24 Years | 9 (2.3%) | 29 (4.8%) |
| 25 to 29 Years | 30 (7.5%) | 19 (3.2%) |
| 30 to 34 Years | 135 (33.9%) | 10 (1.7%) |
| 35 to 39 Years | 40 (10.1%) | 38 (6.3%) |
| 40 to 44 Years | 4 (1.0%) | 174 (28.9%) |
| 45 to 49 Years | 0 (0.0%) | 18 (3.0%) |
| 50 to 54 Years | 21 (5.3%) | 19 (3.2%) |
| 55 to 59 Years | 20 (5.0%) | 21 (3.5%) |
| 60 to 64 Years | 10 (2.5%) | 4 (0.7%) |
| 65 to 69 Years | 0 (0.0%) | 10 (1.7%) |
| 70 to 74 Years | 11 (2.8%) | 63 (10.5%) |
| 75 to 79 Years | 0 (0.0%) | 4 (0.7%) |
| 80 to 84 Years | 4 (1.0%) | 0 (0.0%) |
| 85 Years and over | 0 (0.0%) | 103 (17.1%) |
| Total | 398 (100.0%) | 601 (100.0%) |
Families and Households in Rock Springs
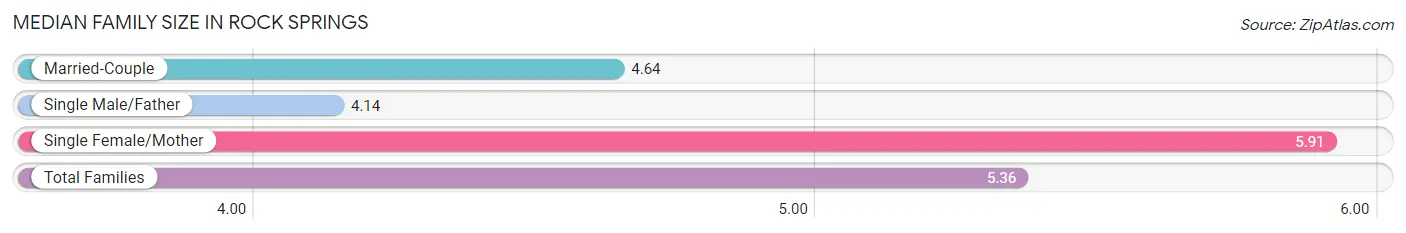
Median Family Size in Rock Springs
The median family size in Rock Springs is 5.36 persons per family, with single female/mother families (105 | 59.3%) accounting for the largest median family size of 5.91 persons per family. On the other hand, single male/father families (14 | 7.9%) represent the smallest median family size with 4.14 persons per family.
| Family Type | # Families | Family Size |
| Married-Couple | 58 (32.8%) | 4.64 |
| Single Male/Father | 14 (7.9%) | 4.14 |
| Single Female/Mother | 105 (59.3%) | 5.91 |
| Total Families | 177 (100.0%) | 5.36 |
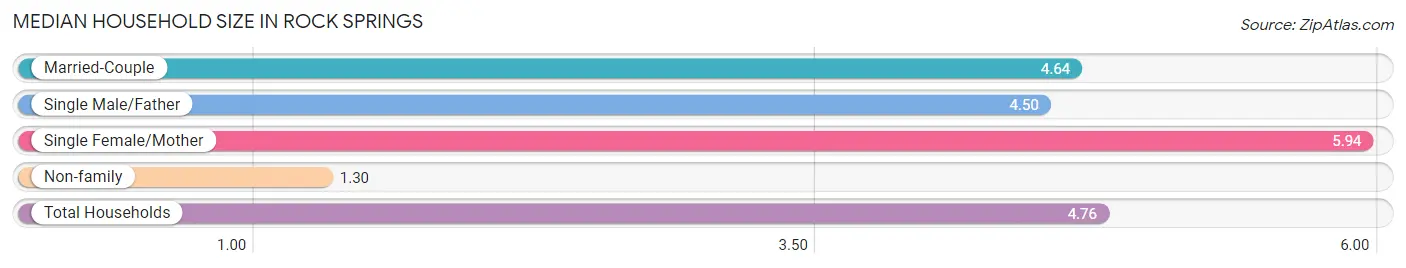
Median Household Size in Rock Springs
The median household size in Rock Springs is 4.76 persons per household, with single female/mother households (105 | 50.0%) accounting for the largest median household size of 5.94 persons per household. non-family households (33 | 15.7%) represent the smallest median household size with 1.30 persons per household.
| Household Type | # Households | Household Size |
| Married-Couple | 58 (27.6%) | 4.64 |
| Single Male/Father | 14 (6.7%) | 4.50 |
| Single Female/Mother | 105 (50.0%) | 5.94 |
| Non-family | 33 (15.7%) | 1.30 |
| Total Households | 210 (100.0%) | 4.76 |
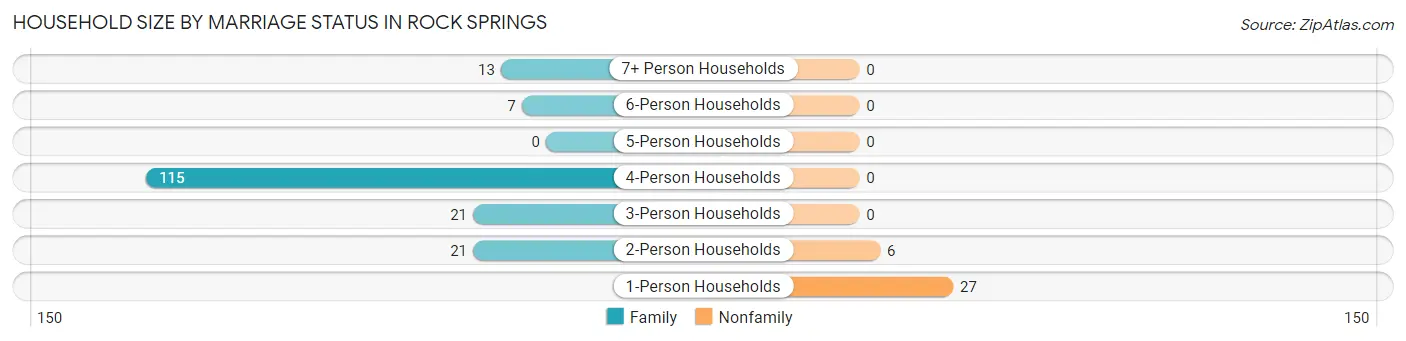
Household Size by Marriage Status in Rock Springs
Out of a total of 210 households in Rock Springs, 177 (84.3%) are family households, while 33 (15.7%) are nonfamily households. The most numerous type of family households are 4-person households, comprising 115, and the most common type of nonfamily households are 1-person households, comprising 27.
| Household Size | Family Households | Nonfamily Households |
| 1-Person Households | - | 27 (12.9%) |
| 2-Person Households | 21 (10.0%) | 6 (2.9%) |
| 3-Person Households | 21 (10.0%) | 0 (0.0%) |
| 4-Person Households | 115 (54.8%) | 0 (0.0%) |
| 5-Person Households | 0 (0.0%) | 0 (0.0%) |
| 6-Person Households | 7 (3.3%) | 0 (0.0%) |
| 7+ Person Households | 13 (6.2%) | 0 (0.0%) |
| Total | 177 (84.3%) | 33 (15.7%) |
Female Fertility in Rock Springs
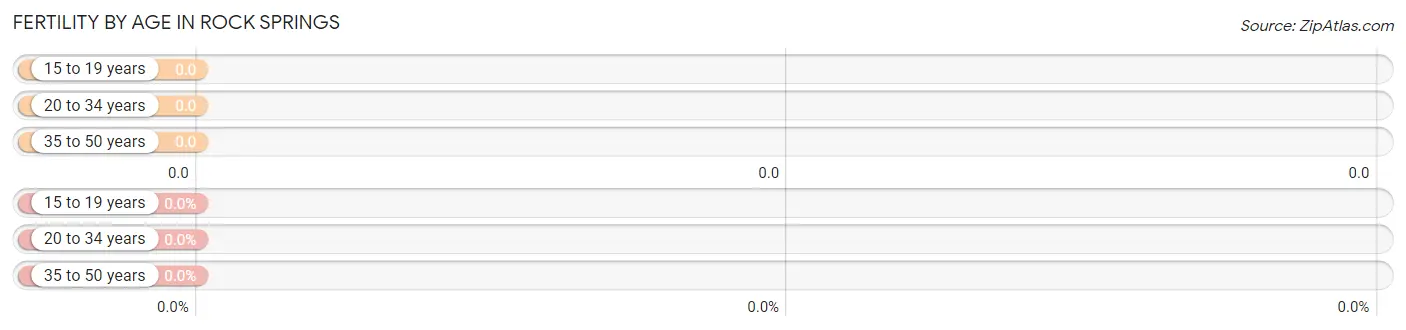
Fertility by Age in Rock Springs
| Age Bracket | Women with Births | Births / 1,000 Women |
| 15 to 19 years | 0 (0.0%) | 0.0 |
| 20 to 34 years | 0 (0.0%) | 0.0 |
| 35 to 50 years | 0 (0.0%) | 0.0 |
| Total | 0 (0.0%) | 0.0 |
Fertility by Age by Marriage Status in Rock Springs
| Age Bracket | Married | Unmarried |
| 15 to 19 years | 0 (0.0%) | 0 (0.0%) |
| 20 to 34 years | 0 (0.0%) | 0 (0.0%) |
| 35 to 50 years | 0 (0.0%) | 0 (0.0%) |
| Total | 0 (0.0%) | 0 (0.0%) |
Fertility by Education in Rock Springs
| Educational Attainment | Women with Births | Births / 1,000 Women |
| Less than High School | 0 (0.0%) | 0.0 |
| High School Diploma | 0 (0.0%) | 0.0 |
| College or Associate's Degree | 0 (0.0%) | 0.0 |
| Bachelor's Degree | 0 (0.0%) | 0.0 |
| Graduate Degree | 0 (0.0%) | 0.0 |
| Total | 0 (0.0%) | 0.0 |
Fertility by Education by Marriage Status in Rock Springs
| Educational Attainment | Married | Unmarried |
| Less than High School | 0 (0.0%) | 0 (0.0%) |
| High School Diploma | 0 (0.0%) | 0 (0.0%) |
| College or Associate's Degree | 0 (0.0%) | 0 (0.0%) |
| Bachelor's Degree | 0 (0.0%) | 0 (0.0%) |
| Graduate Degree | 0 (0.0%) | 0 (0.0%) |
| Total | 0 (0.0%) | 0 (0.0%) |
Employment Characteristics in Rock Springs
Employment by Class of Employer in Rock Springs
Among the 480 employed individuals in Rock Springs, private company employees (413 | 86.0%), federal government employees (32 | 6.7%), and self-employed (not incorporated) (19 | 4.0%) make up the most common classes of employment.
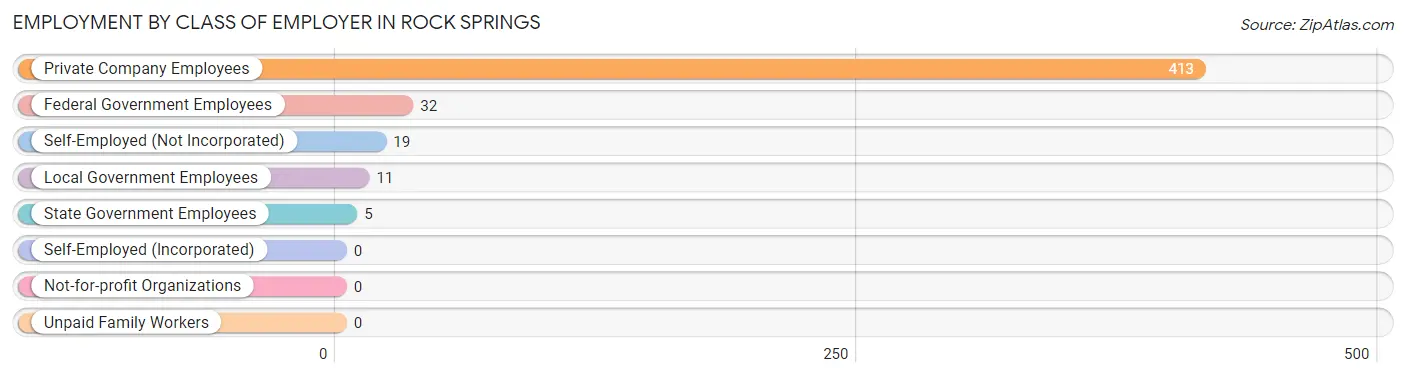
| Employer Class | # Employees | % Employees |
| Private Company Employees | 413 | 86.0% |
| Self-Employed (Incorporated) | 0 | 0.0% |
| Self-Employed (Not Incorporated) | 19 | 4.0% |
| Not-for-profit Organizations | 0 | 0.0% |
| Local Government Employees | 11 | 2.3% |
| State Government Employees | 5 | 1.0% |
| Federal Government Employees | 32 | 6.7% |
| Unpaid Family Workers | 0 | 0.0% |
| Total | 480 | 100.0% |
Employment Status by Age in Rock Springs
According to the labor force statistics for Rock Springs, out of the total population over 16 years of age (811), 61.5% or 499 individuals are in the labor force, with 3.8% or 19 of them unemployed. The age group with the highest labor force participation rate is 30 to 34 years, with 95.2% or 138 individuals in the labor force. Within the labor force, the 55 to 59 years age range has the highest percentage of unemployed individuals, with 32.1% or 9 of them being unemployed.
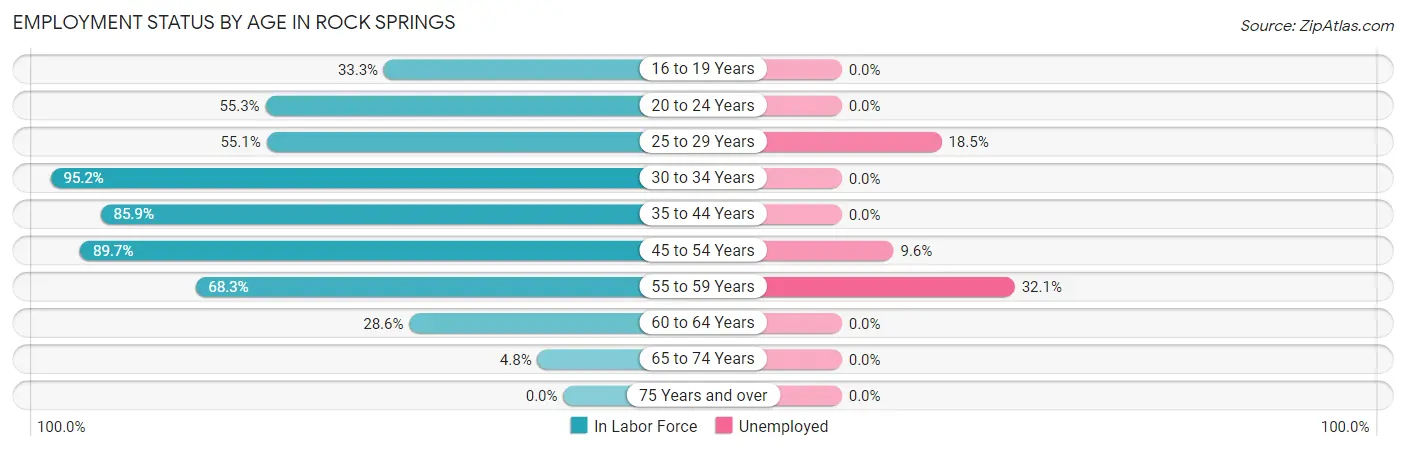
| Age Bracket | In Labor Force | Unemployed |
| 16 to 19 Years | 5 (33.3%) | 0 (0.0%) |
| 20 to 24 Years | 21 (55.3%) | 0 (0.0%) |
| 25 to 29 Years | 27 (55.1%) | 5 (18.5%) |
| 30 to 34 Years | 138 (95.2%) | 0 (0.0%) |
| 35 to 44 Years | 220 (85.9%) | 0 (0.0%) |
| 45 to 54 Years | 52 (89.7%) | 5 (9.6%) |
| 55 to 59 Years | 28 (68.3%) | 9 (32.1%) |
| 60 to 64 Years | 4 (28.6%) | 0 (0.0%) |
| 65 to 74 Years | 4 (4.8%) | 0 (0.0%) |
| 75 Years and over | 0 (0.0%) | 0 (0.0%) |
| Total | 499 (61.5%) | 19 (3.8%) |
Employment Status by Educational Attainment in Rock Springs
According to labor force statistics for Rock Springs, 83.3% of individuals (469) out of the total population between 25 and 64 years of age (563) are in the labor force, with 4.1% or 19 of them being unemployed. The group with the highest labor force participation rate are those with the educational attainment of high school diploma, with 94.0% or 251 individuals in the labor force. Within the labor force, individuals with less than high school education have the highest percentage of unemployment, with 40.9% or 9 of them being unemployed.
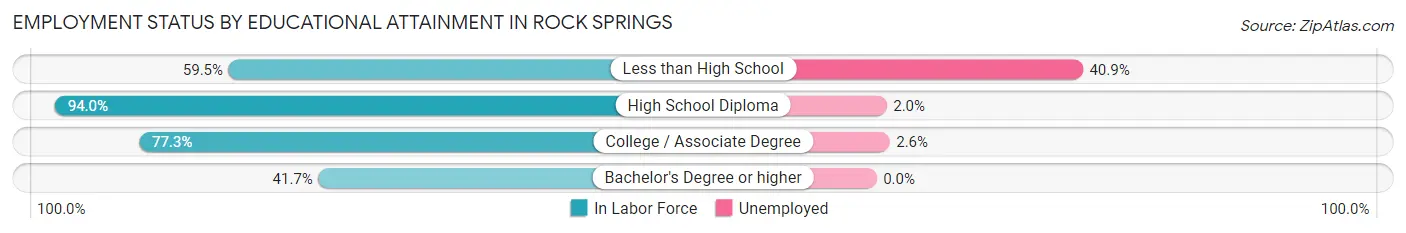
| Educational Attainment | In Labor Force | Unemployed |
| Less than High School | 22 (59.5%) | 15 (40.9%) |
| High School Diploma | 251 (94.0%) | 5 (2.0%) |
| College / Associate Degree | 191 (77.3%) | 6 (2.6%) |
| Bachelor's Degree or higher | 5 (41.7%) | 0 (0.0%) |
| Total | 469 (83.3%) | 23 (4.1%) |
Employment Occupations by Sex in Rock Springs
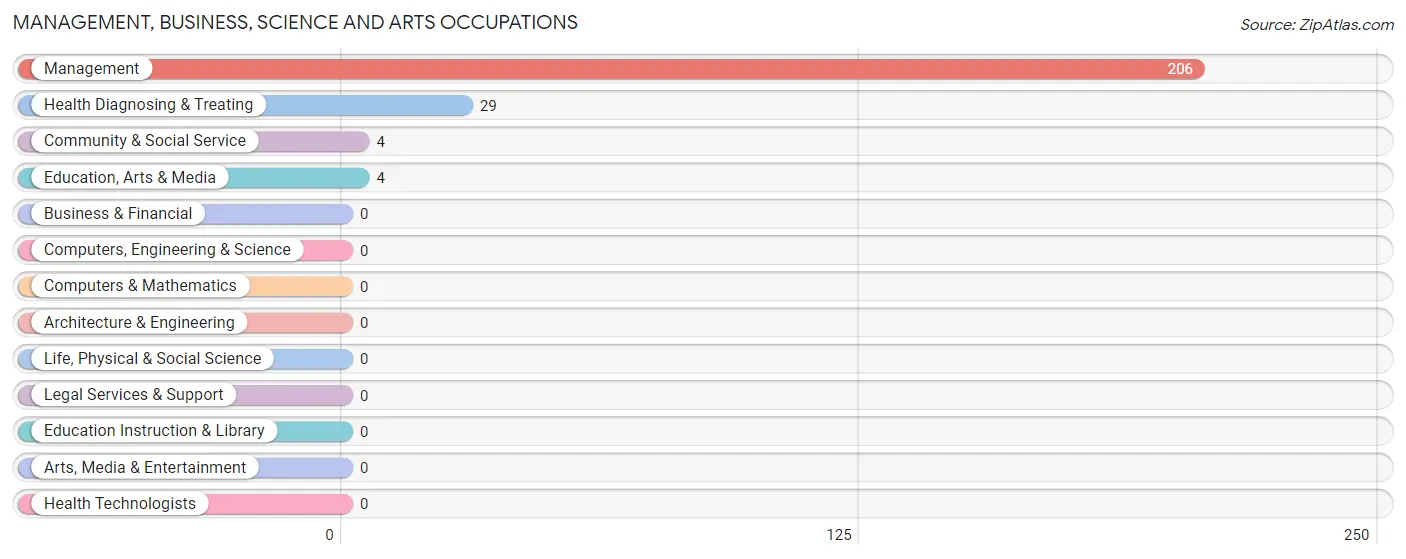
Management, Business, Science and Arts Occupations
The most common Management, Business, Science and Arts occupations in Rock Springs are Management (206 | 42.9%), Health Diagnosing & Treating (29 | 6.0%), Community & Social Service (4 | 0.8%), and Education, Arts & Media (4 | 0.8%).
Management, Business, Science and Arts Occupations by Sex
Within the Management, Business, Science and Arts occupations in Rock Springs, the most male-oriented occupations are Health Diagnosing & Treating (41.4%), and Management (15.5%), while the most female-oriented occupations are Community & Social Service (100.0%), Education, Arts & Media (100.0%), and Management (84.5%).
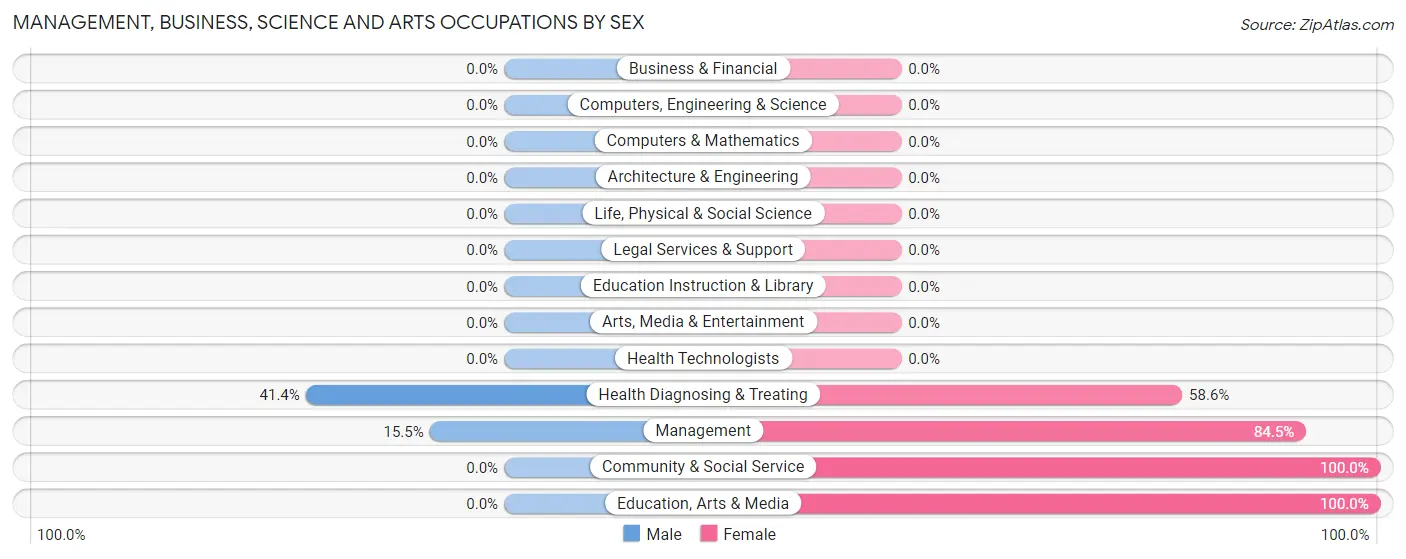
| Occupation | Male | Female |
| Management | 32 (15.5%) | 174 (84.5%) |
| Business & Financial | 0 (0.0%) | 0 (0.0%) |
| Computers, Engineering & Science | 0 (0.0%) | 0 (0.0%) |
| Computers & Mathematics | 0 (0.0%) | 0 (0.0%) |
| Architecture & Engineering | 0 (0.0%) | 0 (0.0%) |
| Life, Physical & Social Science | 0 (0.0%) | 0 (0.0%) |
| Community & Social Service | 0 (0.0%) | 4 (100.0%) |
| Education, Arts & Media | 0 (0.0%) | 4 (100.0%) |
| Legal Services & Support | 0 (0.0%) | 0 (0.0%) |
| Education Instruction & Library | 0 (0.0%) | 0 (0.0%) |
| Arts, Media & Entertainment | 0 (0.0%) | 0 (0.0%) |
| Health Diagnosing & Treating | 12 (41.4%) | 17 (58.6%) |
| Health Technologists | 0 (0.0%) | 0 (0.0%) |
| Total (Category) | 44 (18.4%) | 195 (81.6%) |
| Total (Overall) | 233 (48.5%) | 247 (51.5%) |
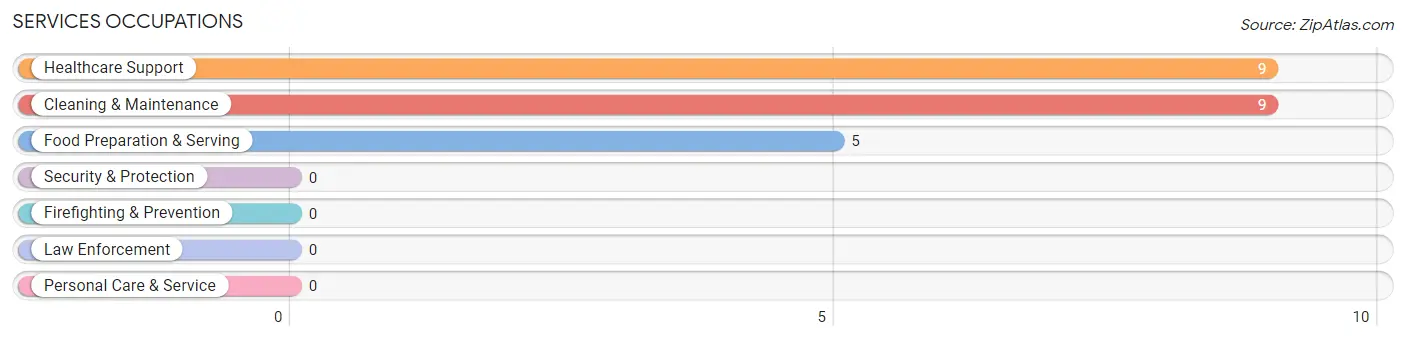
Services Occupations
The most common Services occupations in Rock Springs are Healthcare Support (9 | 1.9%), Cleaning & Maintenance (9 | 1.9%), and Food Preparation & Serving (5 | 1.0%).
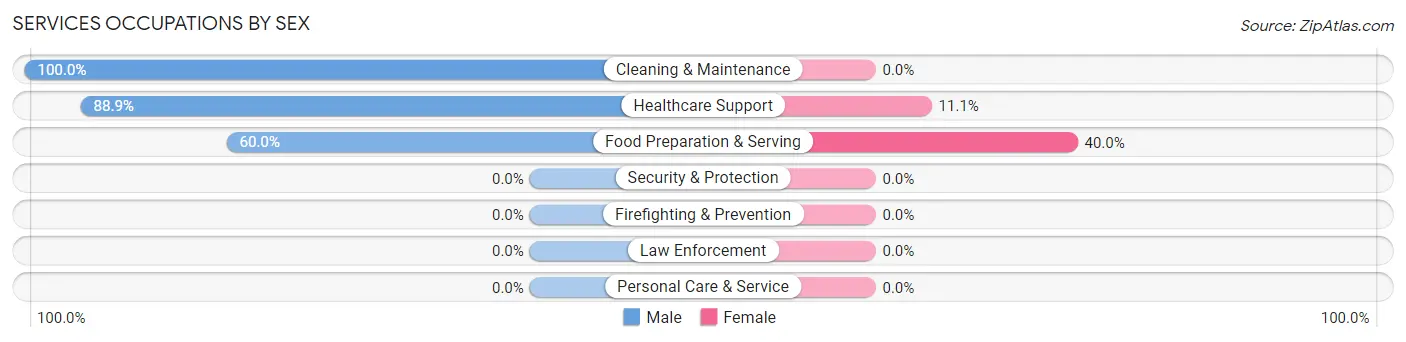
Services Occupations by Sex
Within the Services occupations in Rock Springs, the most male-oriented occupations are Cleaning & Maintenance (100.0%), Healthcare Support (88.9%), and Food Preparation & Serving (60.0%), while the most female-oriented occupations are Food Preparation & Serving (40.0%), and Healthcare Support (11.1%).
| Occupation | Male | Female |
| Healthcare Support | 8 (88.9%) | 1 (11.1%) |
| Security & Protection | 0 (0.0%) | 0 (0.0%) |
| Firefighting & Prevention | 0 (0.0%) | 0 (0.0%) |
| Law Enforcement | 0 (0.0%) | 0 (0.0%) |
| Food Preparation & Serving | 3 (60.0%) | 2 (40.0%) |
| Cleaning & Maintenance | 9 (100.0%) | 0 (0.0%) |
| Personal Care & Service | 0 (0.0%) | 0 (0.0%) |
| Total (Category) | 20 (87.0%) | 3 (13.0%) |
| Total (Overall) | 233 (48.5%) | 247 (51.5%) |
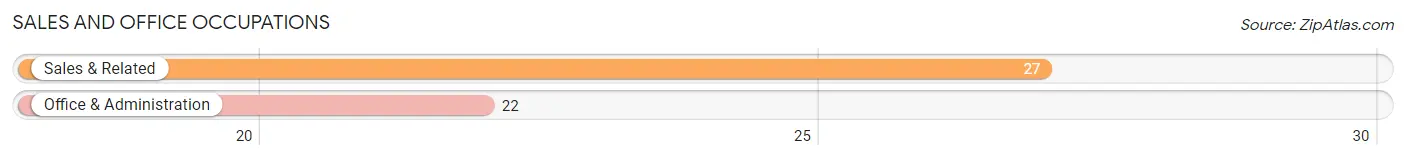
Sales and Office Occupations
The most common Sales and Office occupations in Rock Springs are Sales & Related (27 | 5.6%), and Office & Administration (22 | 4.6%).
Sales and Office Occupations by Sex

| Occupation | Male | Female |
| Sales & Related | 5 (18.5%) | 22 (81.5%) |
| Office & Administration | 6 (27.3%) | 16 (72.7%) |
| Total (Category) | 11 (22.5%) | 38 (77.5%) |
| Total (Overall) | 233 (48.5%) | 247 (51.5%) |
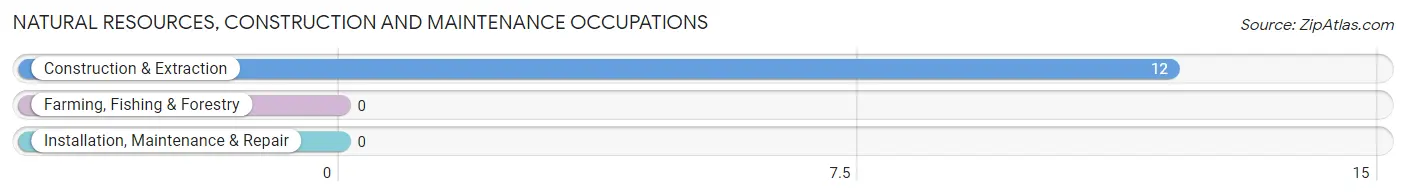
Natural Resources, Construction and Maintenance Occupations
The most common Natural Resources, Construction and Maintenance occupations in Rock Springs are , and Construction & Extraction (12 | 2.5%).
Natural Resources, Construction and Maintenance Occupations by Sex
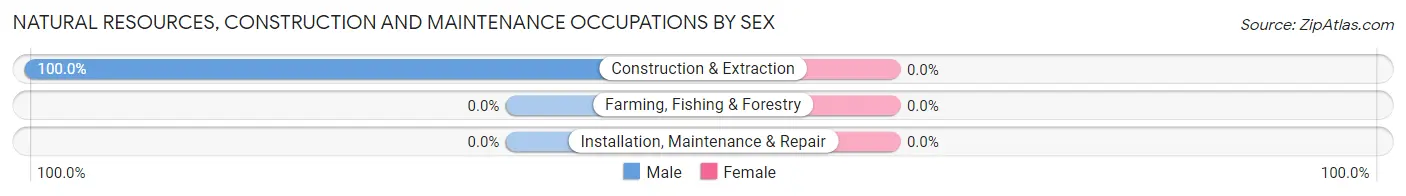
| Occupation | Male | Female |
| Farming, Fishing & Forestry | 0 (0.0%) | 0 (0.0%) |
| Construction & Extraction | 12 (100.0%) | 0 (0.0%) |
| Installation, Maintenance & Repair | 0 (0.0%) | 0 (0.0%) |
| Total (Category) | 12 (100.0%) | 0 (0.0%) |
| Total (Overall) | 233 (48.5%) | 247 (51.5%) |
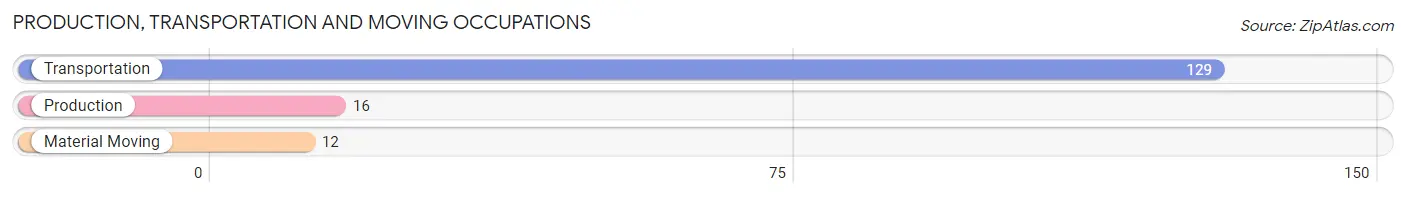
Production, Transportation and Moving Occupations
The most common Production, Transportation and Moving occupations in Rock Springs are Transportation (129 | 26.9%), Production (16 | 3.3%), and Material Moving (12 | 2.5%).
Production, Transportation and Moving Occupations by Sex
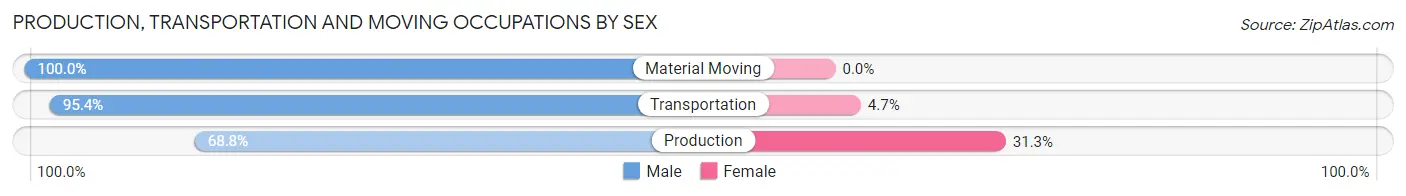
| Occupation | Male | Female |
| Production | 11 (68.8%) | 5 (31.2%) |
| Transportation | 123 (95.4%) | 6 (4.6%) |
| Material Moving | 12 (100.0%) | 0 (0.0%) |
| Total (Category) | 146 (93.0%) | 11 (7.0%) |
| Total (Overall) | 233 (48.5%) | 247 (51.5%) |
Employment Industries by Sex in Rock Springs
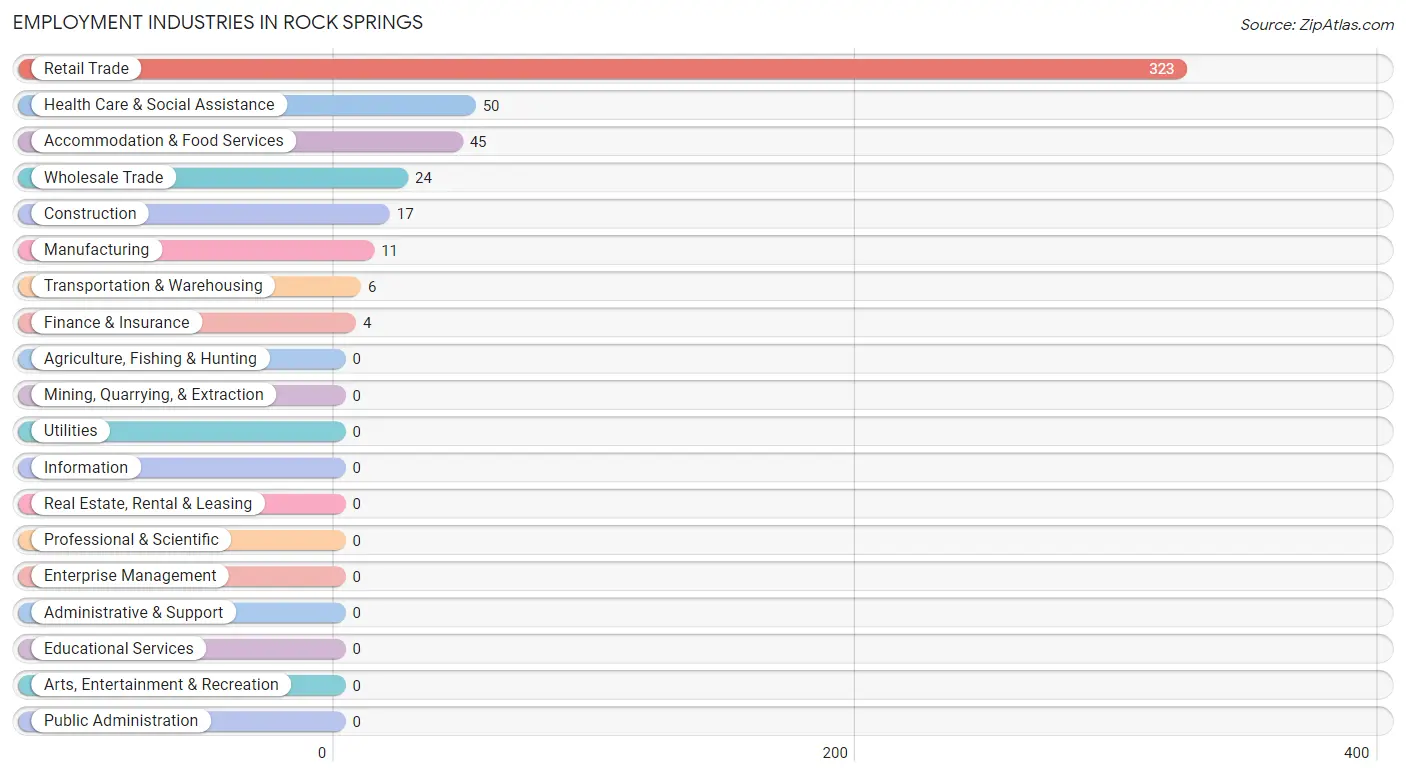
Employment Industries in Rock Springs
The major employment industries in Rock Springs include Retail Trade (323 | 67.3%), Health Care & Social Assistance (50 | 10.4%), Accommodation & Food Services (45 | 9.4%), Wholesale Trade (24 | 5.0%), and Construction (17 | 3.5%).
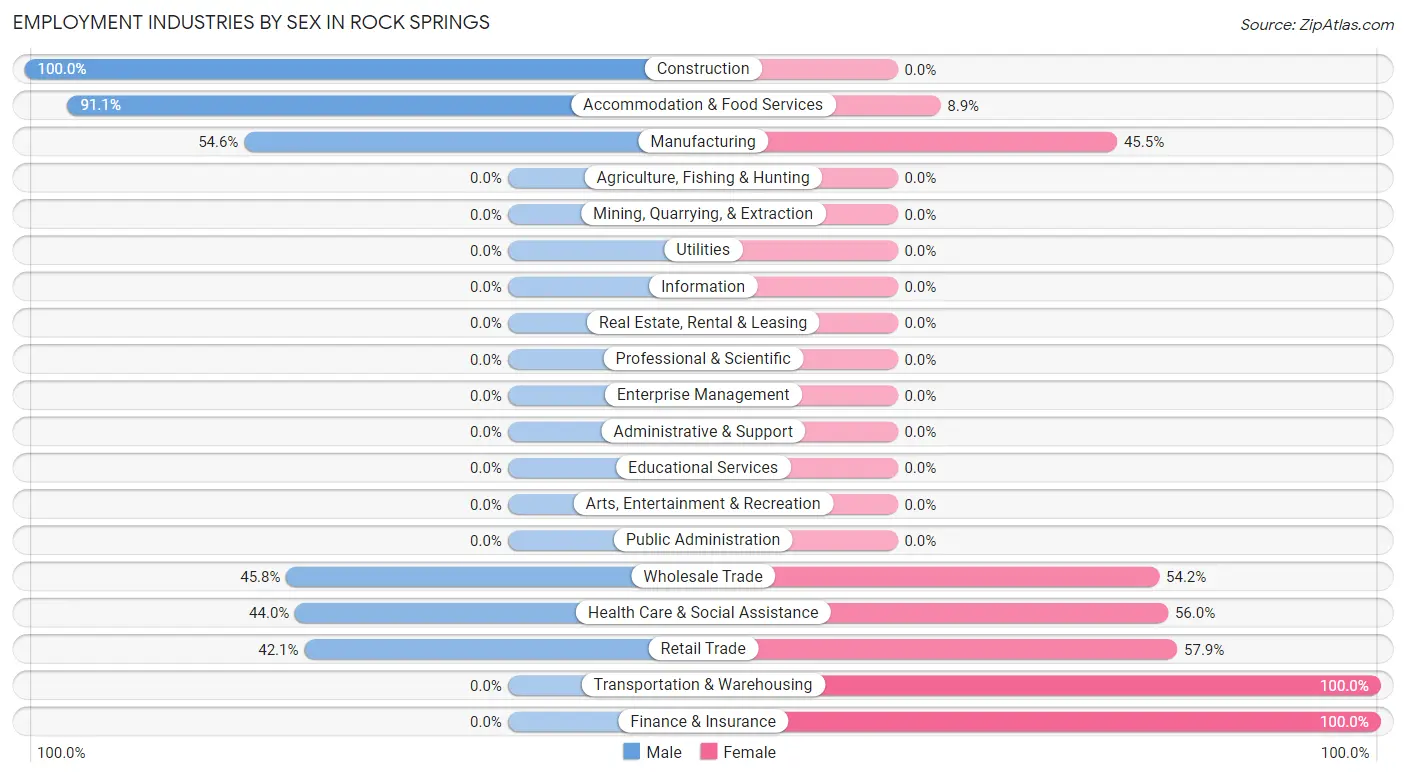
Employment Industries by Sex in Rock Springs
The Rock Springs industries that see more men than women are Construction (100.0%), Accommodation & Food Services (91.1%), and Manufacturing (54.5%), whereas the industries that tend to have a higher number of women are Transportation & Warehousing (100.0%), Finance & Insurance (100.0%), and Retail Trade (57.9%).
| Industry | Male | Female |
| Agriculture, Fishing & Hunting | 0 (0.0%) | 0 (0.0%) |
| Mining, Quarrying, & Extraction | 0 (0.0%) | 0 (0.0%) |
| Construction | 17 (100.0%) | 0 (0.0%) |
| Manufacturing | 6 (54.5%) | 5 (45.5%) |
| Wholesale Trade | 11 (45.8%) | 13 (54.2%) |
| Retail Trade | 136 (42.1%) | 187 (57.9%) |
| Transportation & Warehousing | 0 (0.0%) | 6 (100.0%) |
| Utilities | 0 (0.0%) | 0 (0.0%) |
| Information | 0 (0.0%) | 0 (0.0%) |
| Finance & Insurance | 0 (0.0%) | 4 (100.0%) |
| Real Estate, Rental & Leasing | 0 (0.0%) | 0 (0.0%) |
| Professional & Scientific | 0 (0.0%) | 0 (0.0%) |
| Enterprise Management | 0 (0.0%) | 0 (0.0%) |
| Administrative & Support | 0 (0.0%) | 0 (0.0%) |
| Educational Services | 0 (0.0%) | 0 (0.0%) |
| Health Care & Social Assistance | 22 (44.0%) | 28 (56.0%) |
| Arts, Entertainment & Recreation | 0 (0.0%) | 0 (0.0%) |
| Accommodation & Food Services | 41 (91.1%) | 4 (8.9%) |
| Public Administration | 0 (0.0%) | 0 (0.0%) |
| Total | 233 (48.5%) | 247 (51.5%) |
Education in Rock Springs
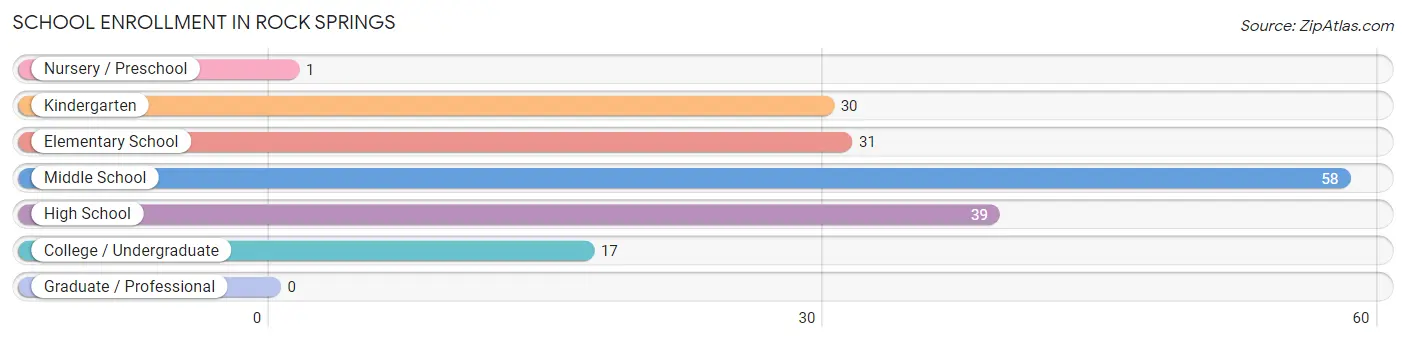
School Enrollment in Rock Springs
The most common levels of schooling among the 176 students in Rock Springs are middle school (58 | 33.0%), high school (39 | 22.2%), and elementary school (31 | 17.6%).
| School Level | # Students | % Students |
| Nursery / Preschool | 1 | 0.6% |
| Kindergarten | 30 | 17.1% |
| Elementary School | 31 | 17.6% |
| Middle School | 58 | 33.0% |
| High School | 39 | 22.2% |
| College / Undergraduate | 17 | 9.7% |
| Graduate / Professional | 0 | 0.0% |
| Total | 176 | 100.0% |
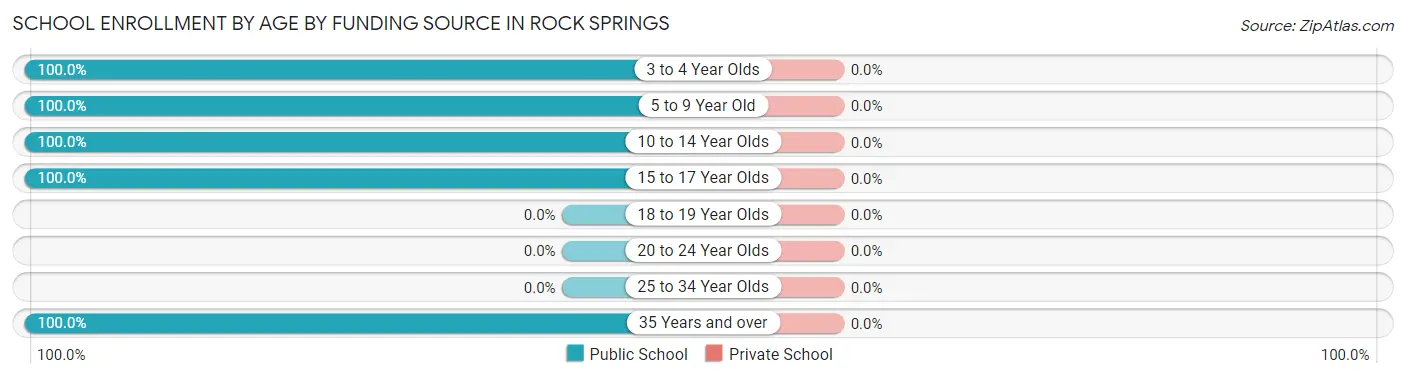
School Enrollment by Age by Funding Source in Rock Springs
| Age Bracket | Public School | Private School |
| 3 to 4 Year Olds | 1 (100.0%) | 0 (0.0%) |
| 5 to 9 Year Old | 62 (100.0%) | 0 (0.0%) |
| 10 to 14 Year Olds | 64 (100.0%) | 0 (0.0%) |
| 15 to 17 Year Olds | 32 (100.0%) | 0 (0.0%) |
| 18 to 19 Year Olds | 0 (0.0%) | 0 (0.0%) |
| 20 to 24 Year Olds | 0 (0.0%) | 0 (0.0%) |
| 25 to 34 Year Olds | 0 (0.0%) | 0 (0.0%) |
| 35 Years and over | 17 (100.0%) | 0 (0.0%) |
| Total | 176 (100.0%) | 0 (0.0%) |
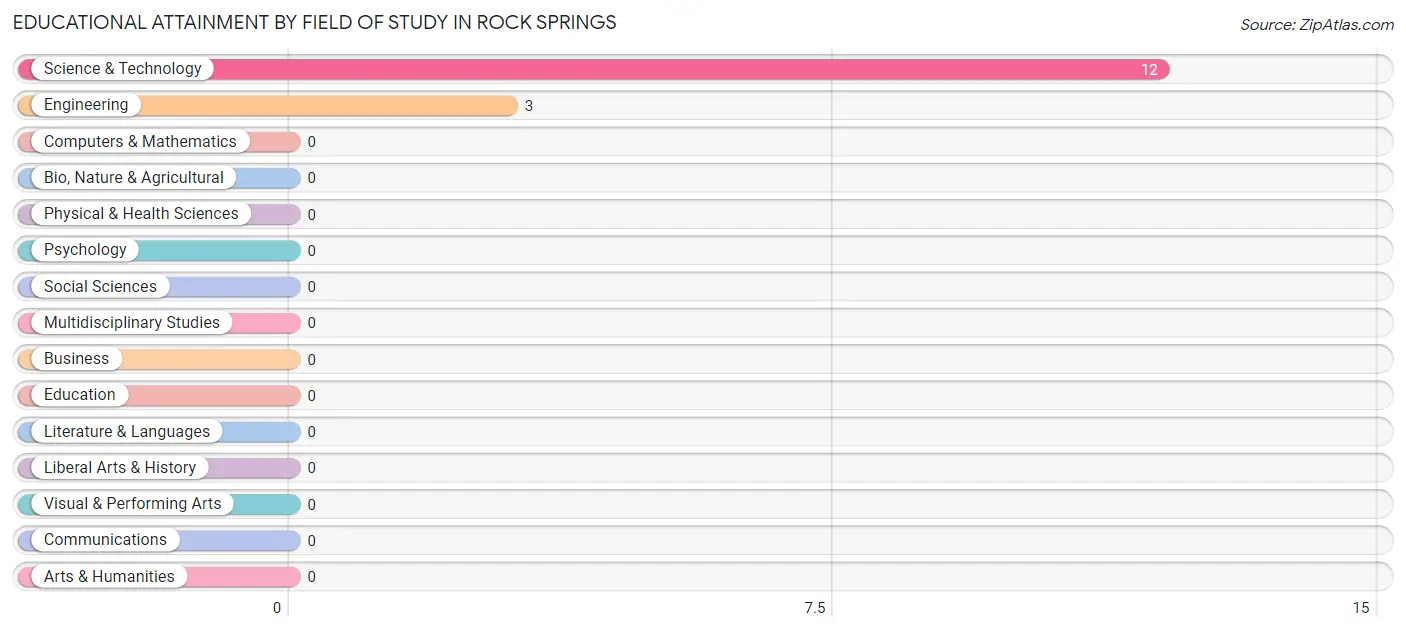
Educational Attainment by Field of Study in Rock Springs
Science & technology (12 | 80.0%), and engineering (3 | 20.0%) are the most common fields of study among 15 individuals in Rock Springs who have obtained a bachelor's degree or higher.
| Field of Study | # Graduates | % Graduates |
| Computers & Mathematics | 0 | 0.0% |
| Bio, Nature & Agricultural | 0 | 0.0% |
| Physical & Health Sciences | 0 | 0.0% |
| Psychology | 0 | 0.0% |
| Social Sciences | 0 | 0.0% |
| Engineering | 3 | 20.0% |
| Multidisciplinary Studies | 0 | 0.0% |
| Science & Technology | 12 | 80.0% |
| Business | 0 | 0.0% |
| Education | 0 | 0.0% |
| Literature & Languages | 0 | 0.0% |
| Liberal Arts & History | 0 | 0.0% |
| Visual & Performing Arts | 0 | 0.0% |
| Communications | 0 | 0.0% |
| Arts & Humanities | 0 | 0.0% |
| Total | 15 | 100.0% |
Transportation & Commute in Rock Springs
Vehicle Availability by Sex in Rock Springs
The most prevalent vehicle ownership categories in Rock Springs are males with 3 vehicles (132, accounting for 56.7%) and females with 3 vehicles (179, making up 53.4%).
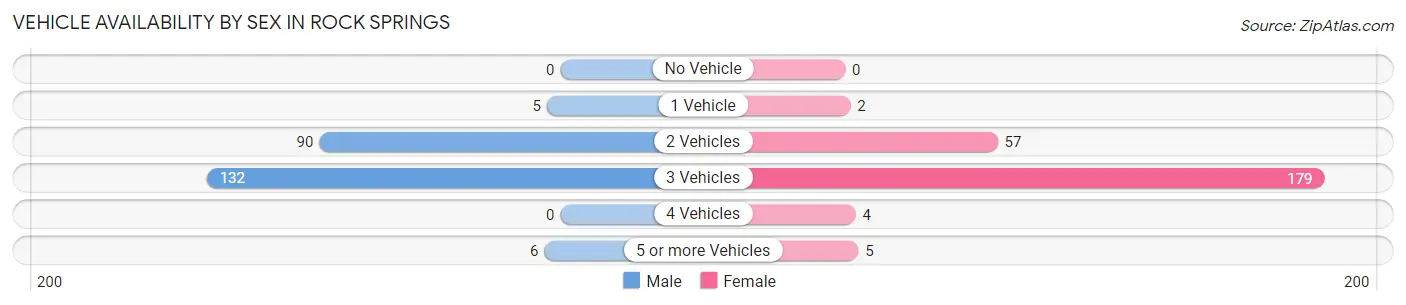
| Vehicles Available | Male | Female |
| No Vehicle | 0 (0.0%) | 0 (0.0%) |
| 1 Vehicle | 5 (2.1%) | 2 (0.8%) |
| 2 Vehicles | 90 (38.6%) | 57 (23.1%) |
| 3 Vehicles | 132 (56.7%) | 179 (72.5%) |
| 4 Vehicles | 0 (0.0%) | 4 (1.6%) |
| 5 or more Vehicles | 6 (2.6%) | 5 (2.0%) |
| Total | 233 (100.0%) | 247 (100.0%) |
Commute Time in Rock Springs
The most frequently occuring commute durations in Rock Springs are 20 to 24 minutes (353 commuters, 75.3%), 30 to 34 minutes (57 commuters, 12.1%), and 25 to 29 minutes (23 commuters, 4.9%).
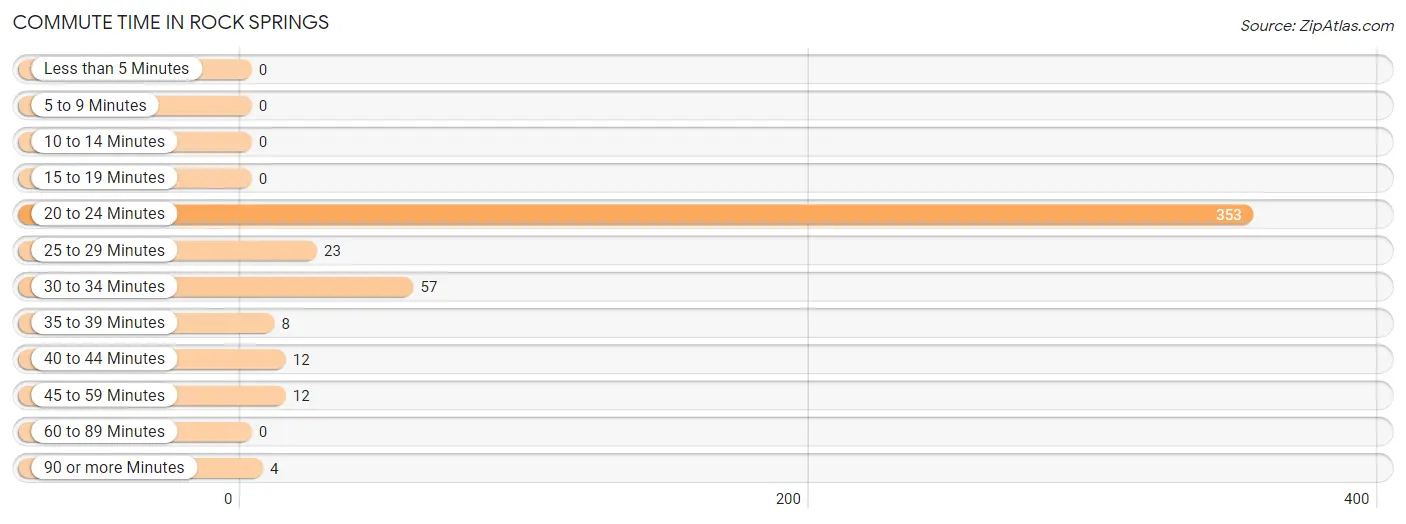
| Commute Time | # Commuters | % Commuters |
| Less than 5 Minutes | 0 | 0.0% |
| 5 to 9 Minutes | 0 | 0.0% |
| 10 to 14 Minutes | 0 | 0.0% |
| 15 to 19 Minutes | 0 | 0.0% |
| 20 to 24 Minutes | 353 | 75.3% |
| 25 to 29 Minutes | 23 | 4.9% |
| 30 to 34 Minutes | 57 | 12.1% |
| 35 to 39 Minutes | 8 | 1.7% |
| 40 to 44 Minutes | 12 | 2.6% |
| 45 to 59 Minutes | 12 | 2.6% |
| 60 to 89 Minutes | 0 | 0.0% |
| 90 or more Minutes | 4 | 0.9% |
Commute Time by Sex in Rock Springs
The most common commute times in Rock Springs are 20 to 24 minutes (175 commuters, 77.1%) for males and 20 to 24 minutes (178 commuters, 73.6%) for females.
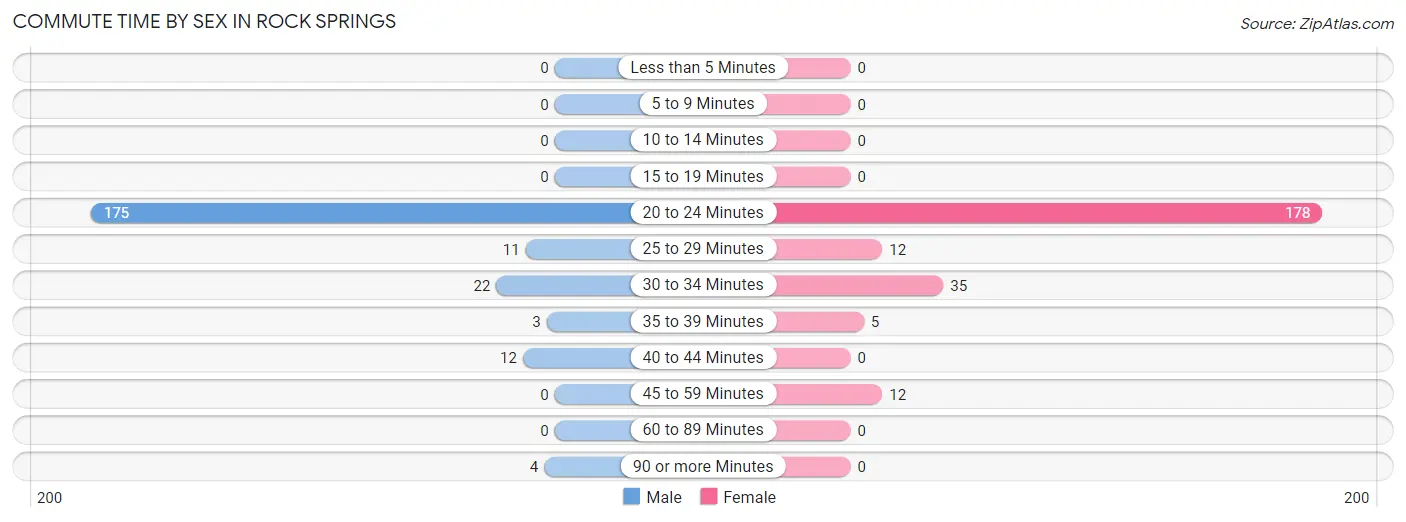
| Commute Time | Male | Female |
| Less than 5 Minutes | 0 (0.0%) | 0 (0.0%) |
| 5 to 9 Minutes | 0 (0.0%) | 0 (0.0%) |
| 10 to 14 Minutes | 0 (0.0%) | 0 (0.0%) |
| 15 to 19 Minutes | 0 (0.0%) | 0 (0.0%) |
| 20 to 24 Minutes | 175 (77.1%) | 178 (73.6%) |
| 25 to 29 Minutes | 11 (4.9%) | 12 (5.0%) |
| 30 to 34 Minutes | 22 (9.7%) | 35 (14.5%) |
| 35 to 39 Minutes | 3 (1.3%) | 5 (2.1%) |
| 40 to 44 Minutes | 12 (5.3%) | 0 (0.0%) |
| 45 to 59 Minutes | 0 (0.0%) | 12 (5.0%) |
| 60 to 89 Minutes | 0 (0.0%) | 0 (0.0%) |
| 90 or more Minutes | 4 (1.8%) | 0 (0.0%) |
Time of Departure to Work by Sex in Rock Springs
The most frequent times of departure to work in Rock Springs are 12:00 AM to 4:59 AM (123, 54.2%) for males and 7:00 AM to 7:29 AM (188, 77.7%) for females.
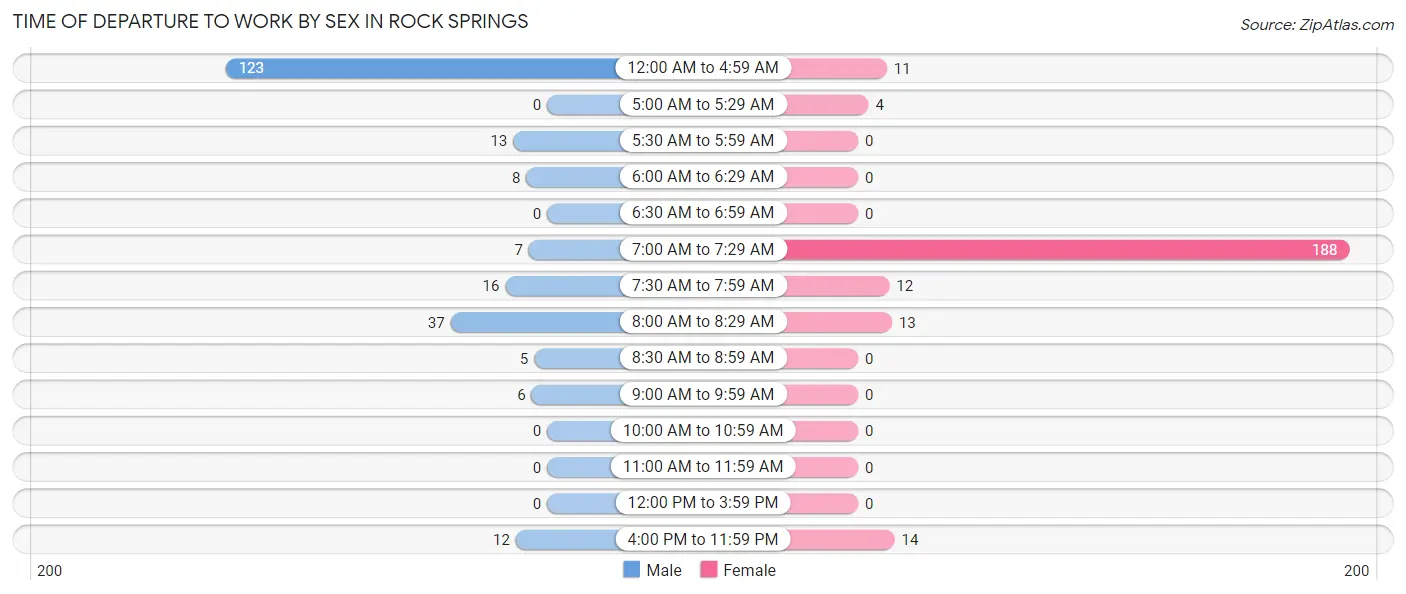
| Time of Departure | Male | Female |
| 12:00 AM to 4:59 AM | 123 (54.2%) | 11 (4.5%) |
| 5:00 AM to 5:29 AM | 0 (0.0%) | 4 (1.7%) |
| 5:30 AM to 5:59 AM | 13 (5.7%) | 0 (0.0%) |
| 6:00 AM to 6:29 AM | 8 (3.5%) | 0 (0.0%) |
| 6:30 AM to 6:59 AM | 0 (0.0%) | 0 (0.0%) |
| 7:00 AM to 7:29 AM | 7 (3.1%) | 188 (77.7%) |
| 7:30 AM to 7:59 AM | 16 (7.0%) | 12 (5.0%) |
| 8:00 AM to 8:29 AM | 37 (16.3%) | 13 (5.4%) |
| 8:30 AM to 8:59 AM | 5 (2.2%) | 0 (0.0%) |
| 9:00 AM to 9:59 AM | 6 (2.6%) | 0 (0.0%) |
| 10:00 AM to 10:59 AM | 0 (0.0%) | 0 (0.0%) |
| 11:00 AM to 11:59 AM | 0 (0.0%) | 0 (0.0%) |
| 12:00 PM to 3:59 PM | 0 (0.0%) | 0 (0.0%) |
| 4:00 PM to 11:59 PM | 12 (5.3%) | 14 (5.8%) |
| Total | 227 (100.0%) | 242 (100.0%) |
Housing Occupancy in Rock Springs
Occupancy by Ownership in Rock Springs
Of the total 210 dwellings in Rock Springs, owner-occupied units account for 210 (100.0%), while renter-occupied units make up 0 (0.0%).
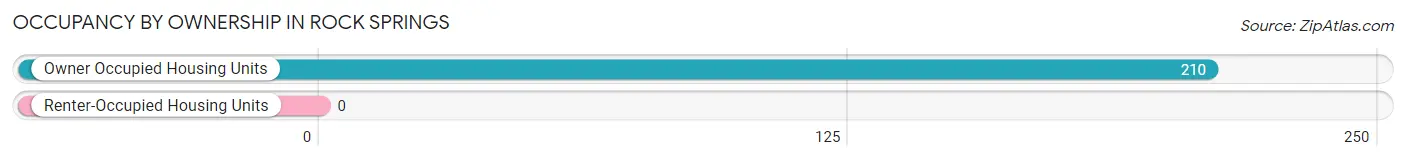
| Occupancy | # Housing Units | % Housing Units |
| Owner Occupied Housing Units | 210 | 100.0% |
| Renter-Occupied Housing Units | 0 | 0.0% |
| Total Occupied Housing Units | 210 | 100.0% |
Occupancy by Household Size in Rock Springs
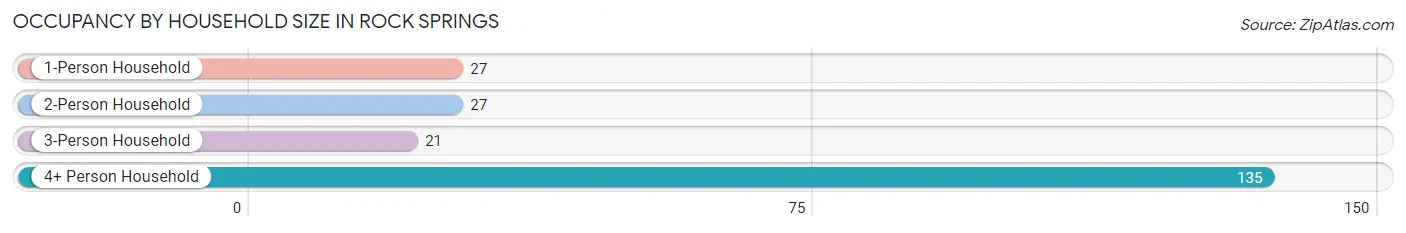
| Household Size | # Housing Units | % Housing Units |
| 1-Person Household | 27 | 12.9% |
| 2-Person Household | 27 | 12.9% |
| 3-Person Household | 21 | 10.0% |
| 4+ Person Household | 135 | 64.3% |
| Total Housing Units | 210 | 100.0% |
Occupancy by Ownership by Household Size in Rock Springs
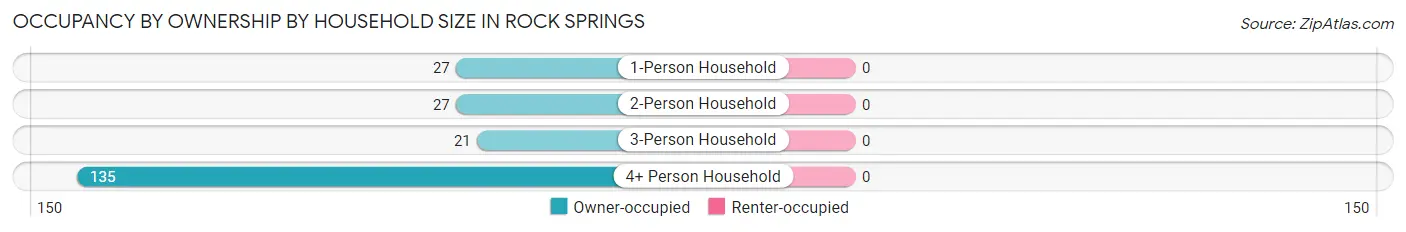
| Household Size | Owner-occupied | Renter-occupied |
| 1-Person Household | 27 (100.0%) | 0 (0.0%) |
| 2-Person Household | 27 (100.0%) | 0 (0.0%) |
| 3-Person Household | 21 (100.0%) | 0 (0.0%) |
| 4+ Person Household | 135 (100.0%) | 0 (0.0%) |
| Total Housing Units | 210 (100.0%) | 0 (0.0%) |
Occupancy by Educational Attainment in Rock Springs
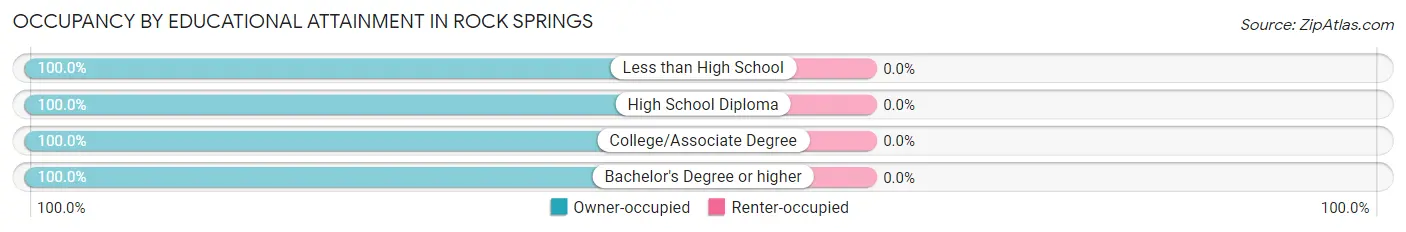
| Household Size | Owner-occupied | Renter-occupied |
| Less than High School | 34 (100.0%) | 0 (0.0%) |
| High School Diploma | 95 (100.0%) | 0 (0.0%) |
| College/Associate Degree | 73 (100.0%) | 0 (0.0%) |
| Bachelor's Degree or higher | 8 (100.0%) | 0 (0.0%) |
Occupancy by Age of Householder in Rock Springs
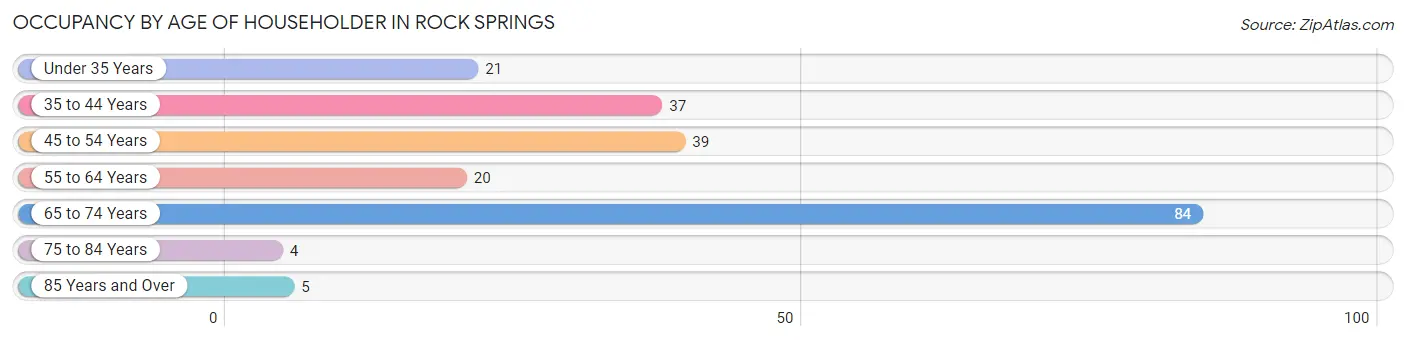
| Age Bracket | # Households | % Households |
| Under 35 Years | 21 | 10.0% |
| 35 to 44 Years | 37 | 17.6% |
| 45 to 54 Years | 39 | 18.6% |
| 55 to 64 Years | 20 | 9.5% |
| 65 to 74 Years | 84 | 40.0% |
| 75 to 84 Years | 4 | 1.9% |
| 85 Years and Over | 5 | 2.4% |
| Total | 210 | 100.0% |
Housing Finances in Rock Springs
Median Income by Occupancy in Rock Springs
| Occupancy Type | # Households | Median Income |
| Owner-Occupied | 210 (100.0%) | $0 |
| Renter-Occupied | 0 (0.0%) | $0 |
| Average | 210 (100.0%) | $0 |
Occupancy by Householder Income Bracket in Rock Springs
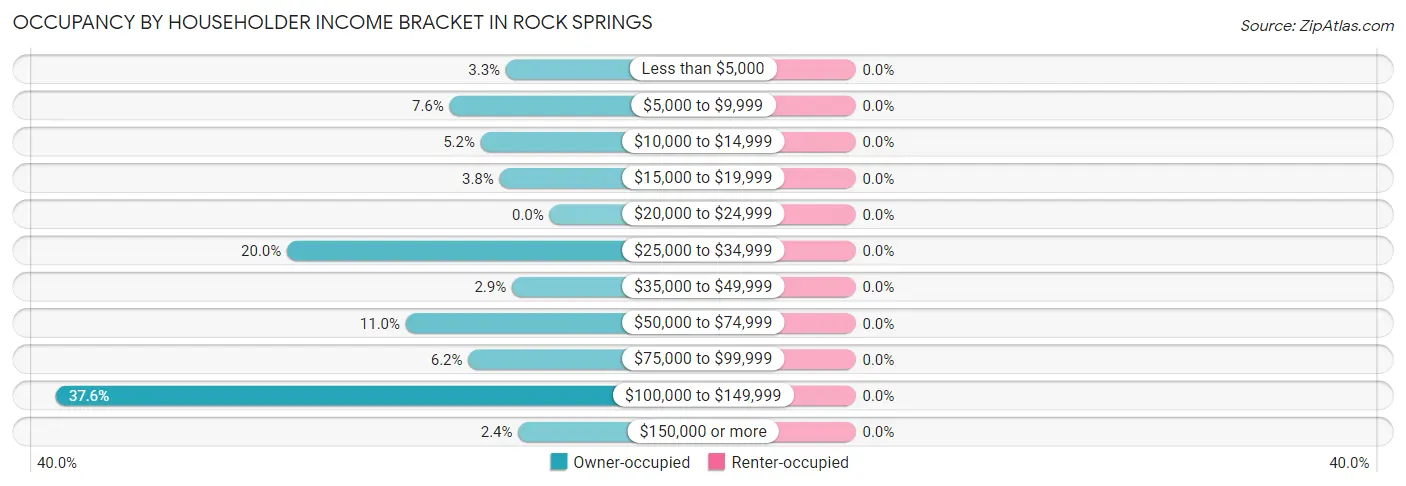
| Income Bracket | Owner-occupied | Renter-occupied |
| Less than $5,000 | 7 (3.3%) | 0 (0.0%) |
| $5,000 to $9,999 | 16 (7.6%) | 0 (0.0%) |
| $10,000 to $14,999 | 11 (5.2%) | 0 (0.0%) |
| $15,000 to $19,999 | 8 (3.8%) | 0 (0.0%) |
| $20,000 to $24,999 | 0 (0.0%) | 0 (0.0%) |
| $25,000 to $34,999 | 42 (20.0%) | 0 (0.0%) |
| $35,000 to $49,999 | 6 (2.9%) | 0 (0.0%) |
| $50,000 to $74,999 | 23 (11.0%) | 0 (0.0%) |
| $75,000 to $99,999 | 13 (6.2%) | 0 (0.0%) |
| $100,000 to $149,999 | 79 (37.6%) | 0 (0.0%) |
| $150,000 or more | 5 (2.4%) | 0 (0.0%) |
| Total | 210 (100.0%) | 0 (0.0%) |
Monthly Housing Cost Tiers in Rock Springs
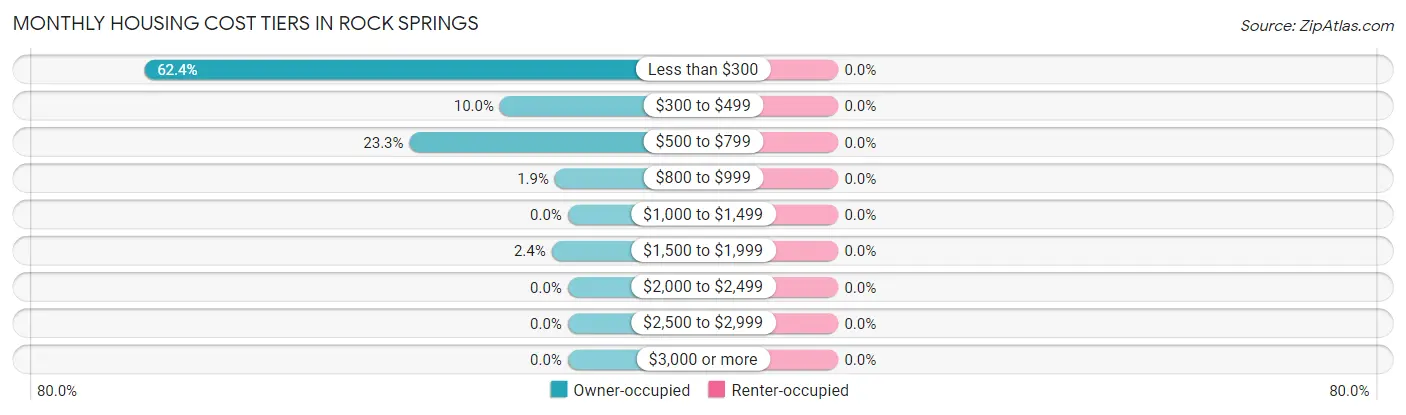
| Monthly Cost | Owner-occupied | Renter-occupied |
| Less than $300 | 131 (62.4%) | 0 (0.0%) |
| $300 to $499 | 21 (10.0%) | 0 (0.0%) |
| $500 to $799 | 49 (23.3%) | 0 (0.0%) |
| $800 to $999 | 4 (1.9%) | 0 (0.0%) |
| $1,000 to $1,499 | 0 (0.0%) | 0 (0.0%) |
| $1,500 to $1,999 | 5 (2.4%) | 0 (0.0%) |
| $2,000 to $2,499 | 0 (0.0%) | 0 (0.0%) |
| $2,500 to $2,999 | 0 (0.0%) | 0 (0.0%) |
| $3,000 or more | 0 (0.0%) | 0 (0.0%) |
| Total | 210 (100.0%) | 0 (0.0%) |
Physical Housing Characteristics in Rock Springs
Housing Structures in Rock Springs
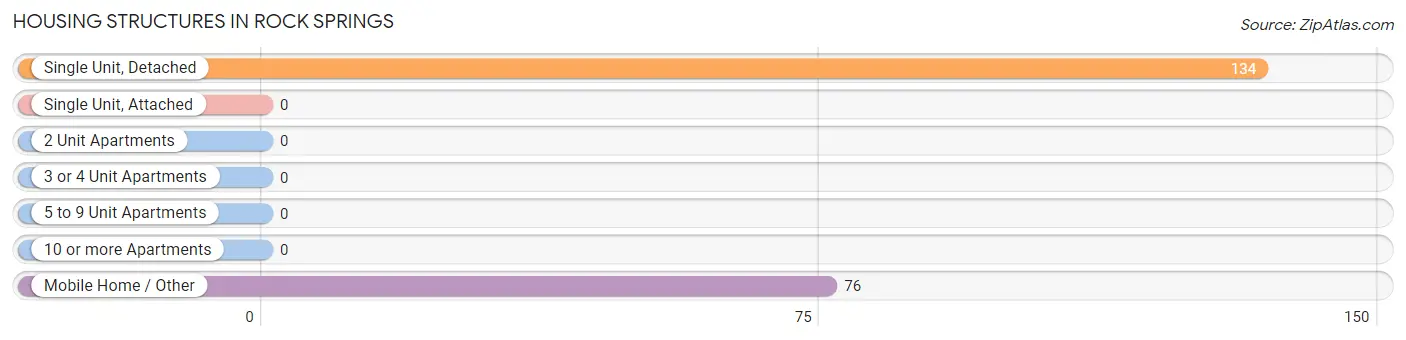
| Structure Type | # Housing Units | % Housing Units |
| Single Unit, Detached | 134 | 63.8% |
| Single Unit, Attached | 0 | 0.0% |
| 2 Unit Apartments | 0 | 0.0% |
| 3 or 4 Unit Apartments | 0 | 0.0% |
| 5 to 9 Unit Apartments | 0 | 0.0% |
| 10 or more Apartments | 0 | 0.0% |
| Mobile Home / Other | 76 | 36.2% |
| Total | 210 | 100.0% |
Housing Structures by Occupancy in Rock Springs
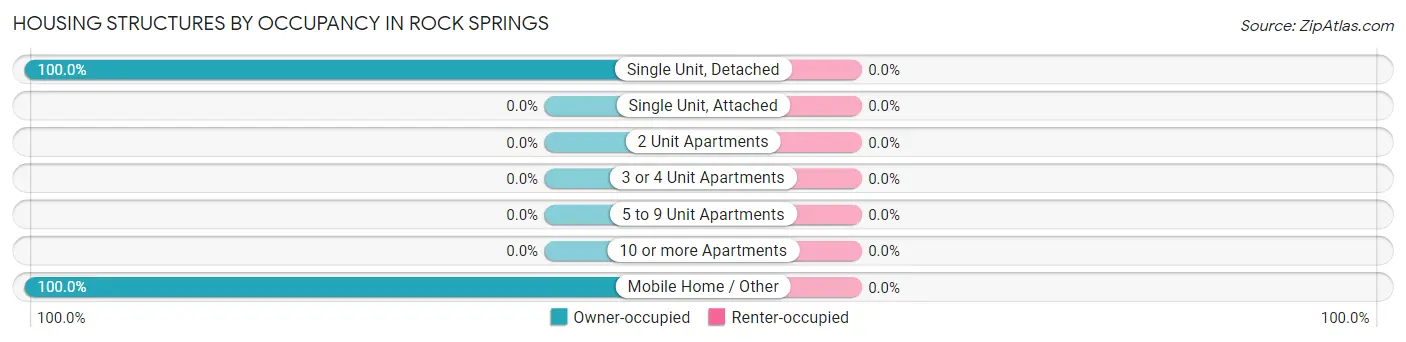
| Structure Type | Owner-occupied | Renter-occupied |
| Single Unit, Detached | 134 (100.0%) | 0 (0.0%) |
| Single Unit, Attached | 0 (0.0%) | 0 (0.0%) |
| 2 Unit Apartments | 0 (0.0%) | 0 (0.0%) |
| 3 or 4 Unit Apartments | 0 (0.0%) | 0 (0.0%) |
| 5 to 9 Unit Apartments | 0 (0.0%) | 0 (0.0%) |
| 10 or more Apartments | 0 (0.0%) | 0 (0.0%) |
| Mobile Home / Other | 76 (100.0%) | 0 (0.0%) |
| Total | 210 (100.0%) | 0 (0.0%) |
Housing Structures by Number of Rooms in Rock Springs
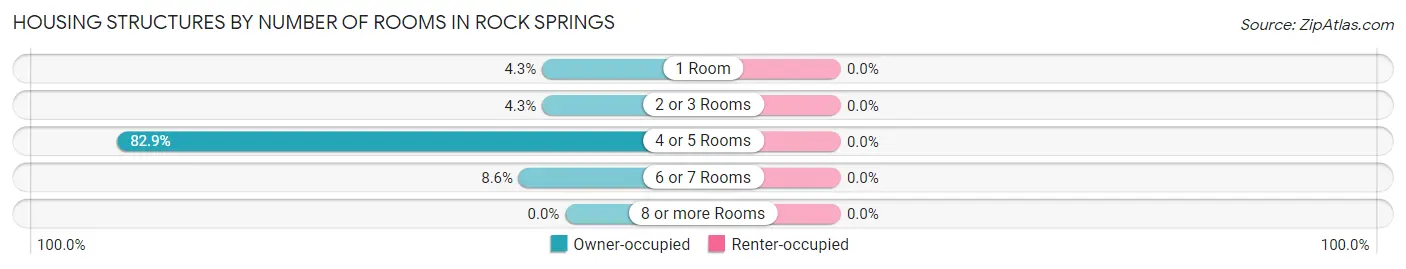
| Number of Rooms | Owner-occupied | Renter-occupied |
| 1 Room | 9 (4.3%) | 0 (0.0%) |
| 2 or 3 Rooms | 9 (4.3%) | 0 (0.0%) |
| 4 or 5 Rooms | 174 (82.9%) | 0 (0.0%) |
| 6 or 7 Rooms | 18 (8.6%) | 0 (0.0%) |
| 8 or more Rooms | 0 (0.0%) | 0 (0.0%) |
| Total | 210 (100.0%) | 0 (0.0%) |
Housing Structure by Heating Type in Rock Springs
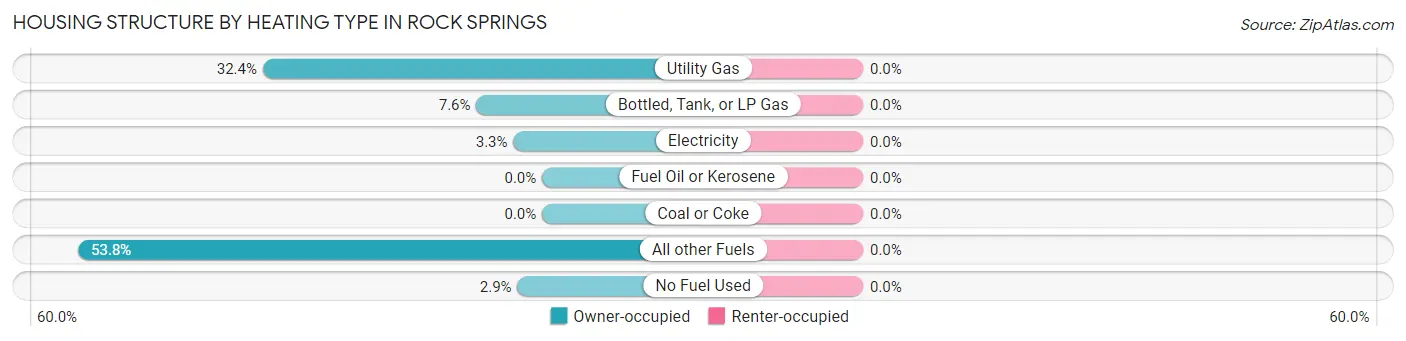
| Heating Type | Owner-occupied | Renter-occupied |
| Utility Gas | 68 (32.4%) | 0 (0.0%) |
| Bottled, Tank, or LP Gas | 16 (7.6%) | 0 (0.0%) |
| Electricity | 7 (3.3%) | 0 (0.0%) |
| Fuel Oil or Kerosene | 0 (0.0%) | 0 (0.0%) |
| Coal or Coke | 0 (0.0%) | 0 (0.0%) |
| All other Fuels | 113 (53.8%) | 0 (0.0%) |
| No Fuel Used | 6 (2.9%) | 0 (0.0%) |
| Total | 210 (100.0%) | 0 (0.0%) |
Household Vehicle Usage in Rock Springs
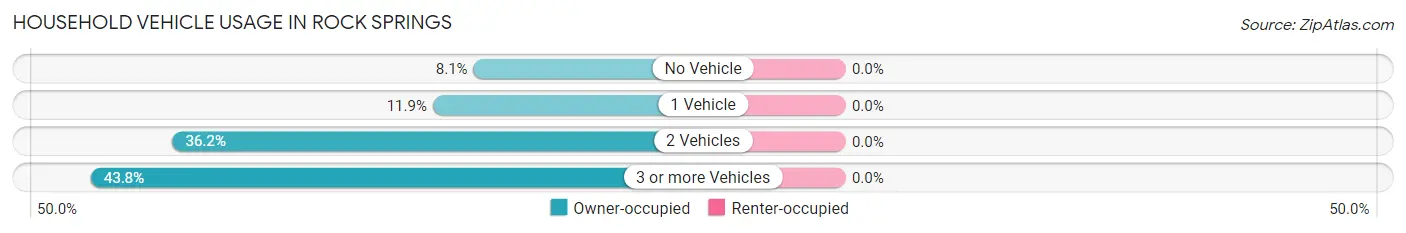
| Vehicles per Household | Owner-occupied | Renter-occupied |
| No Vehicle | 17 (8.1%) | 0 (0.0%) |
| 1 Vehicle | 25 (11.9%) | 0 (0.0%) |
| 2 Vehicles | 76 (36.2%) | 0 (0.0%) |
| 3 or more Vehicles | 92 (43.8%) | 0 (0.0%) |
| Total | 210 (100.0%) | 0 (0.0%) |
Real Estate & Mortgages in Rock Springs
Real Estate and Mortgage Overview in Rock Springs
| Characteristic | Without Mortgage | With Mortgage |
| Housing Units | 161 | 49 |
| Median Property Value | $18,300 | $94,500 |
| Median Household Income | - | - |
| Monthly Housing Costs | $266 | $0 |
| Real Estate Taxes | - | - |
Property Value by Mortgage Status in Rock Springs
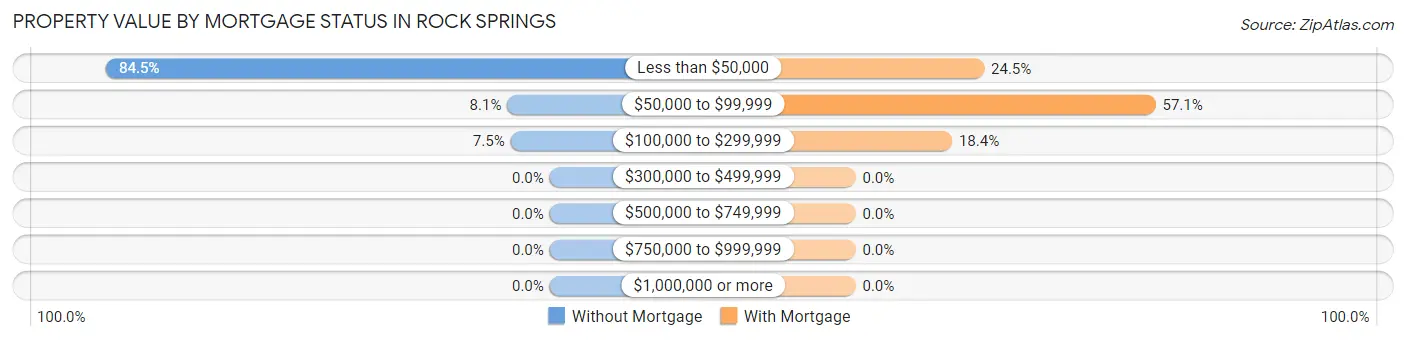
| Property Value | Without Mortgage | With Mortgage |
| Less than $50,000 | 136 (84.5%) | 12 (24.5%) |
| $50,000 to $99,999 | 13 (8.1%) | 28 (57.1%) |
| $100,000 to $299,999 | 12 (7.4%) | 9 (18.4%) |
| $300,000 to $499,999 | 0 (0.0%) | 0 (0.0%) |
| $500,000 to $749,999 | 0 (0.0%) | 0 (0.0%) |
| $750,000 to $999,999 | 0 (0.0%) | 0 (0.0%) |
| $1,000,000 or more | 0 (0.0%) | 0 (0.0%) |
| Total | 161 (100.0%) | 49 (100.0%) |
Household Income by Mortgage Status in Rock Springs
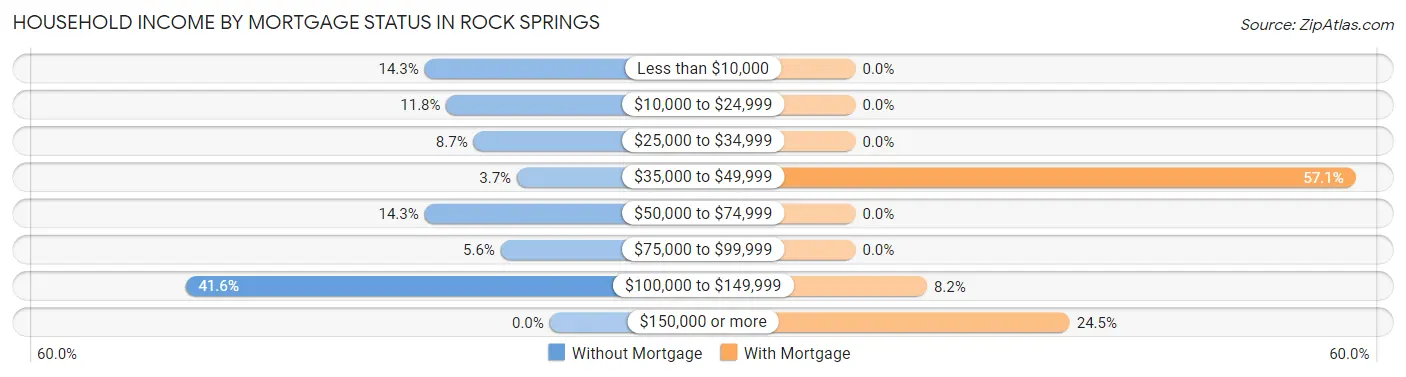
| Household Income | Without Mortgage | With Mortgage |
| Less than $10,000 | 23 (14.3%) | 0 (0.0%) |
| $10,000 to $24,999 | 19 (11.8%) | 0 (0.0%) |
| $25,000 to $34,999 | 14 (8.7%) | 0 (0.0%) |
| $35,000 to $49,999 | 6 (3.7%) | 28 (57.1%) |
| $50,000 to $74,999 | 23 (14.3%) | 0 (0.0%) |
| $75,000 to $99,999 | 9 (5.6%) | 0 (0.0%) |
| $100,000 to $149,999 | 67 (41.6%) | 4 (8.2%) |
| $150,000 or more | 0 (0.0%) | 12 (24.5%) |
| Total | 161 (100.0%) | 49 (100.0%) |
Property Value to Household Income Ratio in Rock Springs
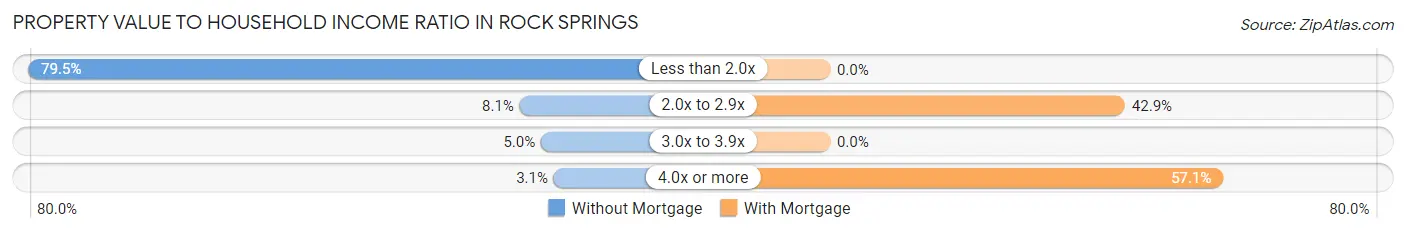
| Value-to-Income Ratio | Without Mortgage | With Mortgage |
| Less than 2.0x | 128 (79.5%) | 0 (0.0%) |
| 2.0x to 2.9x | 13 (8.1%) | 21 (42.9%) |
| 3.0x to 3.9x | 8 (5.0%) | 0 (0.0%) |
| 4.0x or more | 5 (3.1%) | 28 (57.1%) |
| Total | 161 (100.0%) | 49 (100.0%) |
Real Estate Taxes by Mortgage Status in Rock Springs
| Property Taxes | Without Mortgage | With Mortgage |
| Less than $800 | 0 (0.0%) | 0 (0.0%) |
| $800 to $1,499 | 0 (0.0%) | 0 (0.0%) |
| $800 to $1,499 | 0 (0.0%) | 0 (0.0%) |
| Total | 161 (100.0%) | 49 (100.0%) |
Health & Disability in Rock Springs
Health Insurance Coverage by Age in Rock Springs
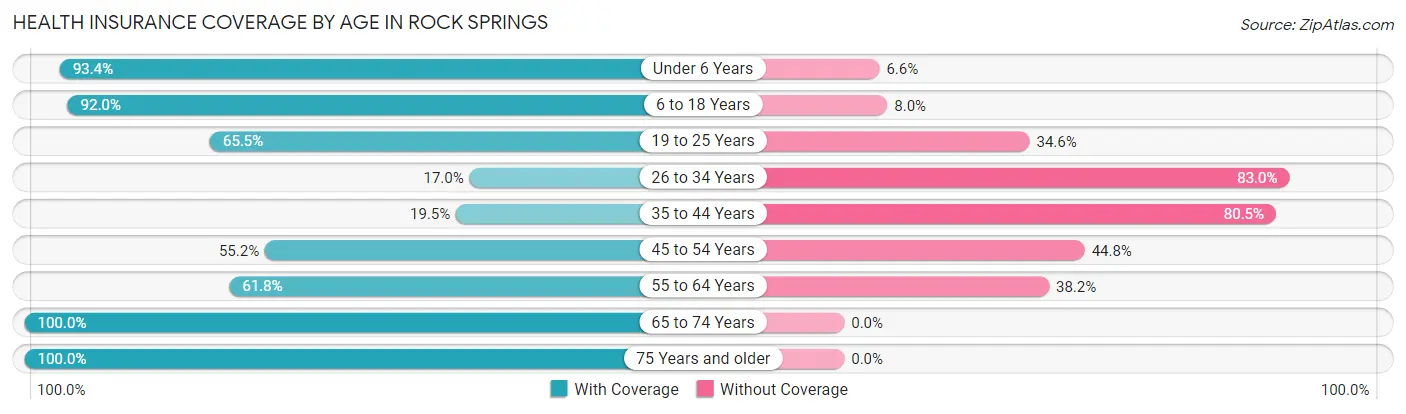
| Age Bracket | With Coverage | Without Coverage |
| Under 6 Years | 57 (93.4%) | 4 (6.6%) |
| 6 to 18 Years | 126 (92.0%) | 11 (8.0%) |
| 19 to 25 Years | 36 (65.4%) | 19 (34.5%) |
| 26 to 34 Years | 31 (17.0%) | 151 (83.0%) |
| 35 to 44 Years | 50 (19.5%) | 206 (80.5%) |
| 45 to 54 Years | 32 (55.2%) | 26 (44.8%) |
| 55 to 64 Years | 34 (61.8%) | 21 (38.2%) |
| 65 to 74 Years | 84 (100.0%) | 0 (0.0%) |
| 75 Years and older | 111 (100.0%) | 0 (0.0%) |
| Total | 561 (56.2%) | 438 (43.8%) |
Health Insurance Coverage by Citizenship Status in Rock Springs
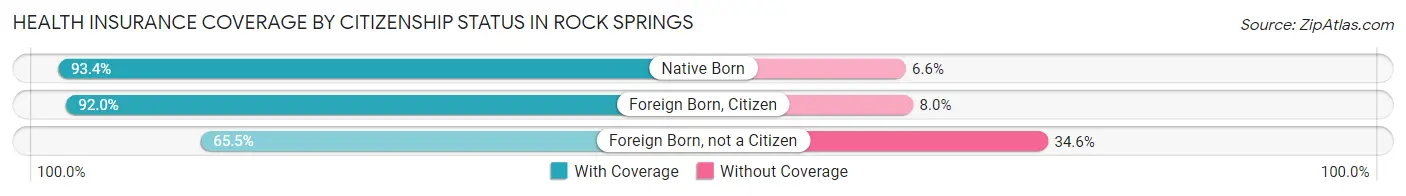
| Citizenship Status | With Coverage | Without Coverage |
| Native Born | 57 (93.4%) | 4 (6.6%) |
| Foreign Born, Citizen | 126 (92.0%) | 11 (8.0%) |
| Foreign Born, not a Citizen | 36 (65.4%) | 19 (34.5%) |
Health Insurance Coverage by Household Income in Rock Springs
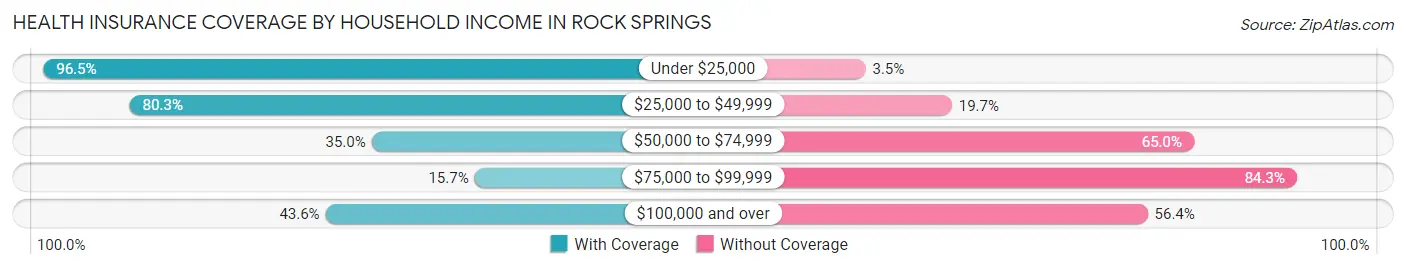
| Household Income | With Coverage | Without Coverage |
| Under $25,000 | 110 (96.5%) | 4 (3.5%) |
| $25,000 to $49,999 | 196 (80.3%) | 48 (19.7%) |
| $50,000 to $74,999 | 21 (35.0%) | 39 (65.0%) |
| $75,000 to $99,999 | 11 (15.7%) | 59 (84.3%) |
| $100,000 and over | 223 (43.6%) | 288 (56.4%) |
Public vs Private Health Insurance Coverage by Age in Rock Springs
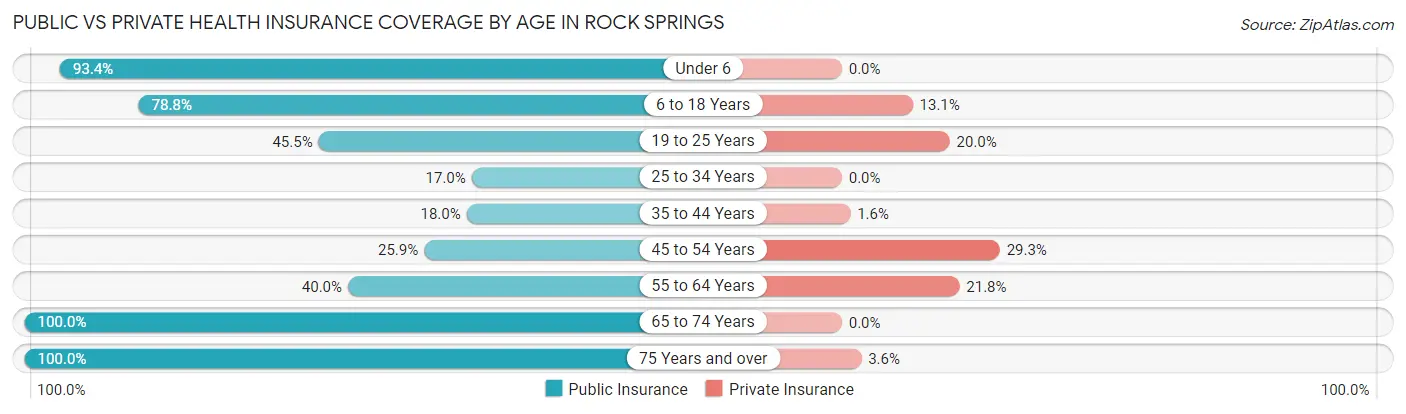
| Age Bracket | Public Insurance | Private Insurance |
| Under 6 | 57 (93.4%) | 0 (0.0%) |
| 6 to 18 Years | 108 (78.8%) | 18 (13.1%) |
| 19 to 25 Years | 25 (45.5%) | 11 (20.0%) |
| 25 to 34 Years | 31 (17.0%) | 0 (0.0%) |
| 35 to 44 Years | 46 (18.0%) | 4 (1.6%) |
| 45 to 54 Years | 15 (25.9%) | 17 (29.3%) |
| 55 to 64 Years | 22 (40.0%) | 12 (21.8%) |
| 65 to 74 Years | 84 (100.0%) | 0 (0.0%) |
| 75 Years and over | 111 (100.0%) | 4 (3.6%) |
| Total | 499 (49.9%) | 66 (6.6%) |
Disability Status by Sex by Age in Rock Springs
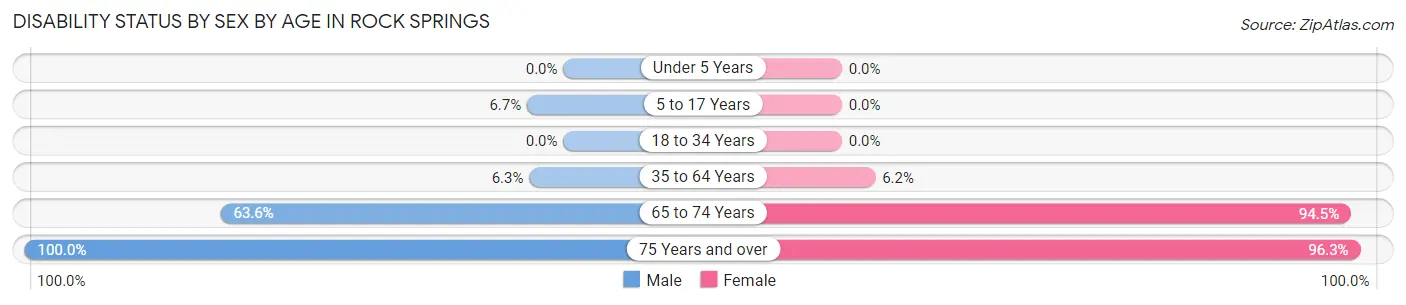
| Age Bracket | Male | Female |
| Under 5 Years | 0 (0.0%) | 0 (0.0%) |
| 5 to 17 Years | 6 (6.7%) | 0 (0.0%) |
| 18 to 34 Years | 0 (0.0%) | 0 (0.0%) |
| 35 to 64 Years | 6 (6.3%) | 17 (6.2%) |
| 65 to 74 Years | 7 (63.6%) | 69 (94.5%) |
| 75 Years and over | 4 (100.0%) | 103 (96.3%) |
Disability Class by Sex by Age in Rock Springs
Disability Class: Hearing Difficulty
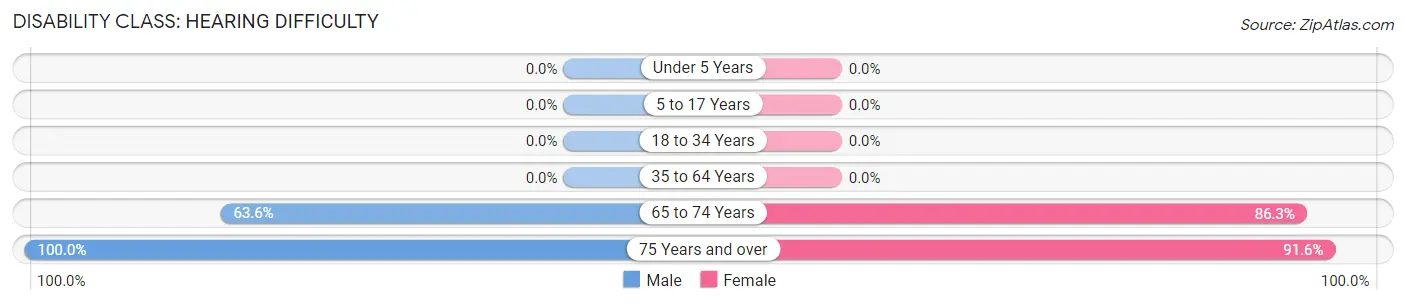
| Age Bracket | Male | Female |
| Under 5 Years | 0 (0.0%) | 0 (0.0%) |
| 5 to 17 Years | 0 (0.0%) | 0 (0.0%) |
| 18 to 34 Years | 0 (0.0%) | 0 (0.0%) |
| 35 to 64 Years | 0 (0.0%) | 0 (0.0%) |
| 65 to 74 Years | 7 (63.6%) | 63 (86.3%) |
| 75 Years and over | 4 (100.0%) | 98 (91.6%) |
Disability Class: Vision Difficulty
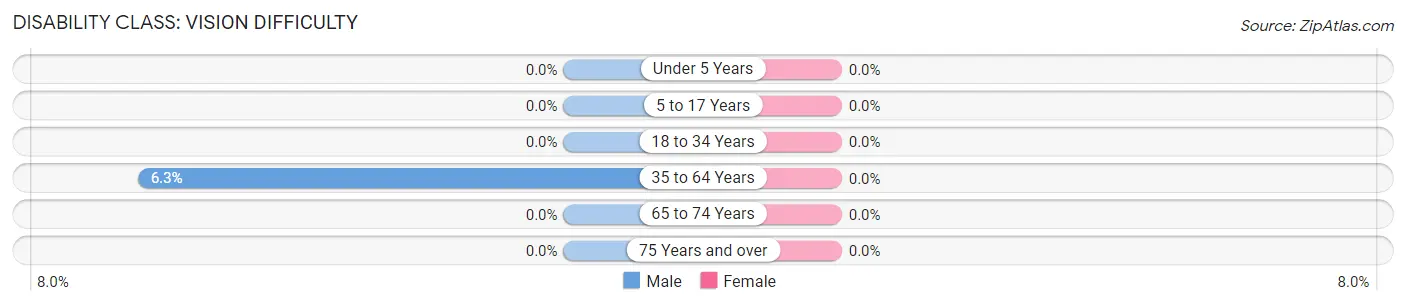
| Age Bracket | Male | Female |
| Under 5 Years | 0 (0.0%) | 0 (0.0%) |
| 5 to 17 Years | 0 (0.0%) | 0 (0.0%) |
| 18 to 34 Years | 0 (0.0%) | 0 (0.0%) |
| 35 to 64 Years | 6 (6.3%) | 0 (0.0%) |
| 65 to 74 Years | 0 (0.0%) | 0 (0.0%) |
| 75 Years and over | 0 (0.0%) | 0 (0.0%) |
Disability Class: Cognitive Difficulty
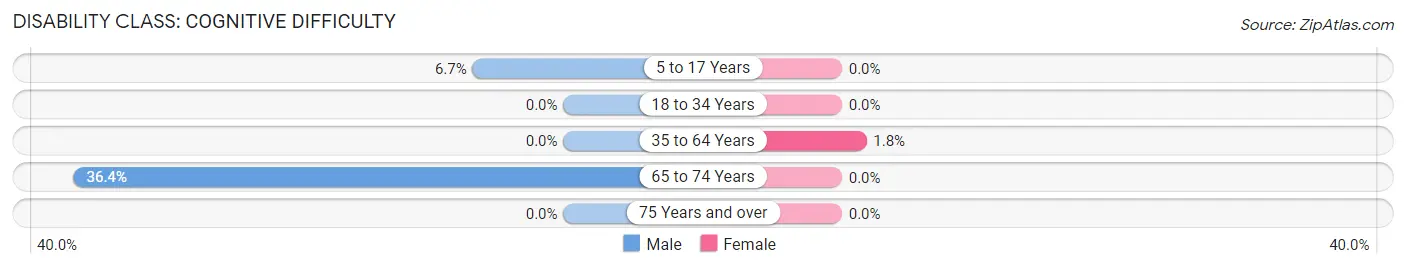
| Age Bracket | Male | Female |
| 5 to 17 Years | 6 (6.7%) | 0 (0.0%) |
| 18 to 34 Years | 0 (0.0%) | 0 (0.0%) |
| 35 to 64 Years | 0 (0.0%) | 5 (1.8%) |
| 65 to 74 Years | 4 (36.4%) | 0 (0.0%) |
| 75 Years and over | 0 (0.0%) | 0 (0.0%) |
Disability Class: Ambulatory Difficulty
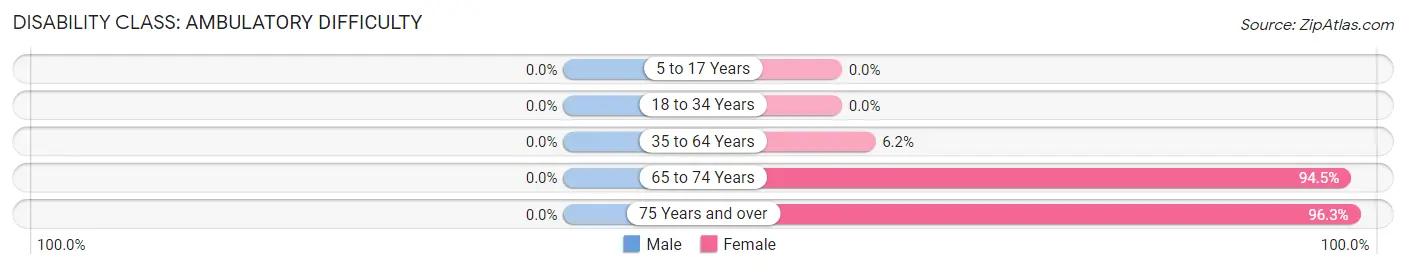
| Age Bracket | Male | Female |
| 5 to 17 Years | 0 (0.0%) | 0 (0.0%) |
| 18 to 34 Years | 0 (0.0%) | 0 (0.0%) |
| 35 to 64 Years | 0 (0.0%) | 17 (6.2%) |
| 65 to 74 Years | 0 (0.0%) | 69 (94.5%) |
| 75 Years and over | 0 (0.0%) | 103 (96.3%) |
Disability Class: Self-Care Difficulty
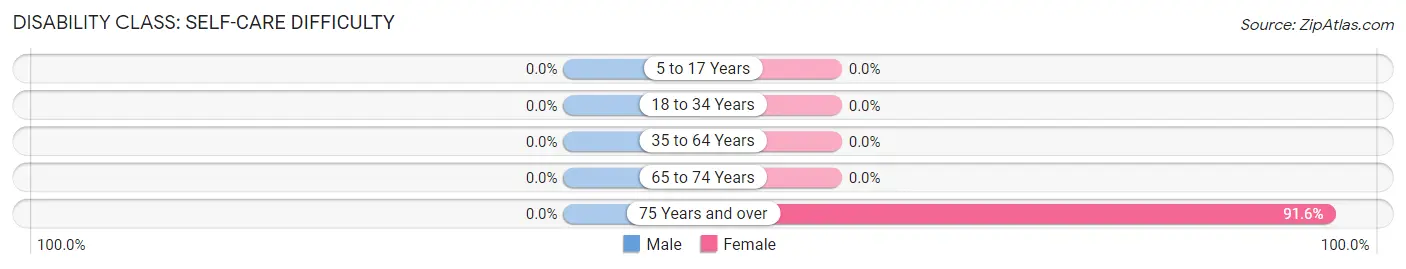
| Age Bracket | Male | Female |
| 5 to 17 Years | 0 (0.0%) | 0 (0.0%) |
| 18 to 34 Years | 0 (0.0%) | 0 (0.0%) |
| 35 to 64 Years | 0 (0.0%) | 0 (0.0%) |
| 65 to 74 Years | 0 (0.0%) | 0 (0.0%) |
| 75 Years and over | 0 (0.0%) | 98 (91.6%) |
Technology Access in Rock Springs
Computing Device Access in Rock Springs
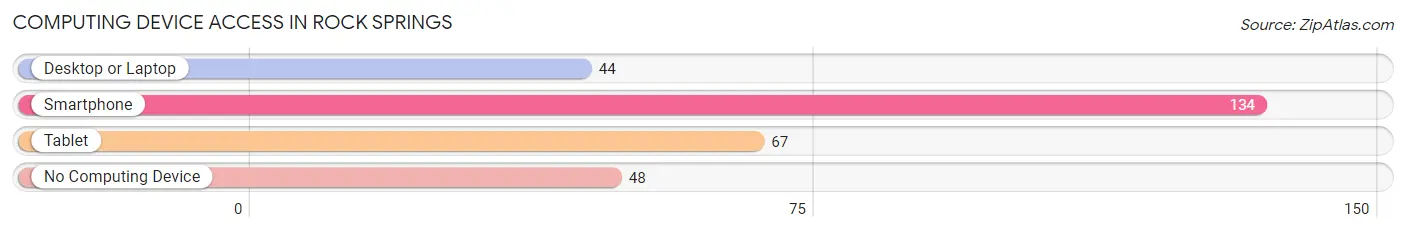
| Device Type | # Households | % Households |
| Desktop or Laptop | 44 | 20.9% |
| Smartphone | 134 | 63.8% |
| Tablet | 67 | 31.9% |
| No Computing Device | 48 | 22.9% |
| Total | 210 | 100.0% |
Internet Access in Rock Springs
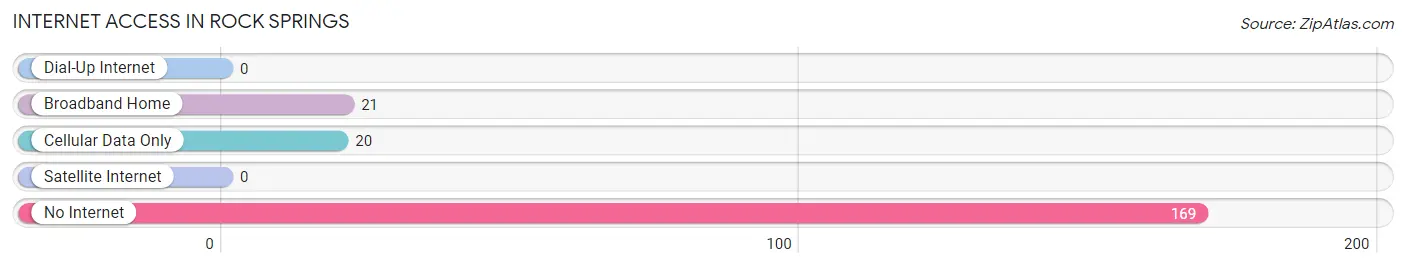
| Internet Type | # Households | % Households |
| Dial-Up Internet | 0 | 0.0% |
| Broadband Home | 21 | 10.0% |
| Cellular Data Only | 20 | 9.5% |
| Satellite Internet | 0 | 0.0% |
| No Internet | 169 | 80.5% |
| Total | 210 | 100.0% |
Rock Springs Summary
History
Rock Springs, New Mexico is a small town located in the southeastern corner of the state. It is situated in the foothills of the Sacramento Mountains, and is part of the Chihuahuan Desert. The town was founded in 1881 by the Santa Fe Railroad, and was named after the nearby springs that provided water for the railroad. The town quickly grew, and by the early 1900s, it had become a bustling center of commerce and industry.
The town was home to a variety of businesses, including a hotel, a general store, a blacksmith shop, and a saloon. The town also had a post office, a school, and a church. The town was also home to a number of ranches, and the surrounding area was used for cattle grazing.
In the early 1900s, the town was also home to a number of mines, including the Rock Springs Mine, which was one of the largest in the area. The mine was owned by the Santa Fe Railroad, and it produced a variety of minerals, including copper, lead, and zinc. The mine was in operation until the late 1940s, when it was closed due to declining demand for the minerals it produced.
In the 1950s, the town began to decline, as the railroad began to move its operations elsewhere. The town’s population dwindled, and many of the businesses closed. In the late 1970s, the town began to experience a resurgence, as new businesses began to move into the area. Today, Rock Springs is a small but vibrant community, with a population of around 500 people.
Geography
Rock Springs is located in the southeastern corner of New Mexico, in the foothills of the Sacramento Mountains. The town is situated at an elevation of 4,400 feet, and is part of the Chihuahuan Desert. The town is located near the border with Texas, and is about 30 miles from the city of El Paso.
The town is situated in a valley, and is surrounded by mountains on all sides. The nearby mountains provide a variety of recreational opportunities, including hiking, camping, and rock climbing. The nearby Rio Grande River also provides a variety of recreational activities, including fishing and boating.
Economy
Rock Springs is a small town, and its economy is largely based on tourism and agriculture. The town is home to a number of small businesses, including restaurants, shops, and a hotel. The town is also home to a number of ranches, and the surrounding area is used for cattle grazing.
The town is also home to a number of mines, including the Rock Springs Mine, which is one of the largest in the area. The mine is owned by the Santa Fe Railroad, and it produces a variety of minerals, including copper, lead, and zinc.
Demographics
As of the 2010 census, the population of Rock Springs was 498 people. The town is predominantly white, with a small Hispanic population. The median household income in the town is $31,250, and the median age is 44. The town has a high rate of poverty, with nearly 30% of the population living below the poverty line.
Common Questions
What is Per Capita Income in Rock Springs?
Per Capita income in Rock Springs is $28,437.
What is Income or Wage Gap in Rock Springs?
Income or Wage Gap in Rock Springs is 50.1%.
Women in Rock Springs earn 49.9 cents for every dollar earned by a man.
What is Inequality or Gini Index in Rock Springs?
Inequality or Gini Index in Rock Springs is 0.41.
What is the Total Population of Rock Springs?
Total Population of Rock Springs is 999.
What is the Total Male Population of Rock Springs?
Total Male Population of Rock Springs is 398.
What is the Total Female Population of Rock Springs?
Total Female Population of Rock Springs is 601.
What is the Ratio of Males per 100 Females in Rock Springs?
There are 66.22 Males per 100 Females in Rock Springs.
What is the Ratio of Females per 100 Males in Rock Springs?
There are 151.01 Females per 100 Males in Rock Springs.
What is the Median Population Age in Rock Springs?
Median Population Age in Rock Springs is 39.6 Years.
What is the Average Family Size in Rock Springs
Average Family Size in Rock Springs is 5.4 People.
What is the Average Household Size in Rock Springs
Average Household Size in Rock Springs is 4.8 People.
How Large is the Labor Force in Rock Springs?
There are 499 People in the Labor Forcein in Rock Springs.
What is the Percentage of People in the Labor Force in Rock Springs?
61.5% of People are in the Labor Force in Rock Springs.
What is the Unemployment Rate in Rock Springs?
Unemployment Rate in Rock Springs is 3.8%.