Des Moines, NM Map & Demographics
Des Moines Map
Des Moines Overview
$31,202
PER CAPITA INCOME
$54,750
AVG HOUSEHOLD INCOME
0.30
INEQUALITY / GINI INDEX
103
TOTAL POPULATION
67
MALE POPULATION
36
FEMALE POPULATION
186.11
MALES / 100 FEMALES
53.73
FEMALES / 100 MALES
60.5
MEDIAN AGE
3.4
AVG FAMILY SIZE
2.0
AVG HOUSEHOLD SIZE
24
LABOR FORCE [ PEOPLE ]
27.9%
PERCENT IN LABOR FORCE
Des Moines Zip Codes
Des Moines Area Codes
Income in Des Moines
Income Overview in Des Moines
| Characteristic | Number | Measure |
| Per Capita Income | 103 | $31,202 |
| Median Family Income | 22 | $0 |
| Mean Family Income | 22 | $85,264 |
| Median Household Income | 51 | $54,750 |
| Mean Household Income | 51 | $60,296 |
| Income Deficit | 22 | $0 |
| Wage / Income Gap (%) | 103 | 0.00% |
| Wage / Income Gap ($) | 103 | 100.00¢ per $1 |
| Gini / Inequality Index | 103 | 0.30 |
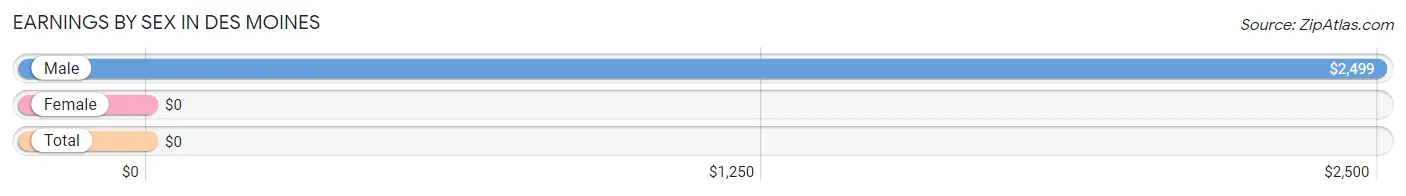
Earnings by Sex in Des Moines
| Sex | Number | Average Earnings |
| Male | 31 (67.4%) | $2,499 |
| Female | 15 (32.6%) | $0 |
| Total | 46 (100.0%) | $0 |
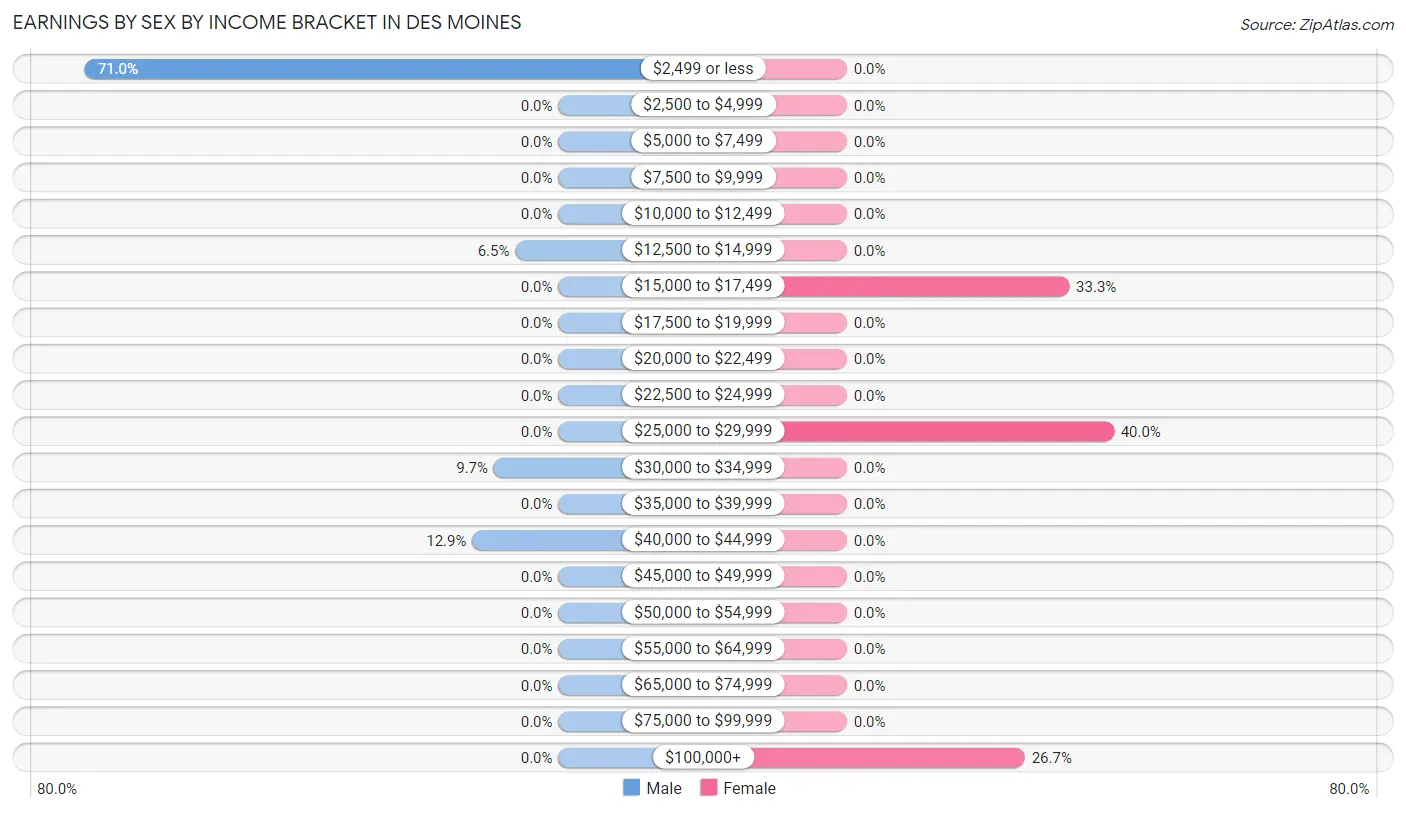
Earnings by Sex by Income Bracket in Des Moines
The most common earnings brackets in Des Moines are $2,499 or less for men (22 | 71.0%) and $25,000 to $29,999 for women (6 | 40.0%).
| Income | Male | Female |
| $2,499 or less | 22 (71.0%) | 0 (0.0%) |
| $2,500 to $4,999 | 0 (0.0%) | 0 (0.0%) |
| $5,000 to $7,499 | 0 (0.0%) | 0 (0.0%) |
| $7,500 to $9,999 | 0 (0.0%) | 0 (0.0%) |
| $10,000 to $12,499 | 0 (0.0%) | 0 (0.0%) |
| $12,500 to $14,999 | 2 (6.5%) | 0 (0.0%) |
| $15,000 to $17,499 | 0 (0.0%) | 5 (33.3%) |
| $17,500 to $19,999 | 0 (0.0%) | 0 (0.0%) |
| $20,000 to $22,499 | 0 (0.0%) | 0 (0.0%) |
| $22,500 to $24,999 | 0 (0.0%) | 0 (0.0%) |
| $25,000 to $29,999 | 0 (0.0%) | 6 (40.0%) |
| $30,000 to $34,999 | 3 (9.7%) | 0 (0.0%) |
| $35,000 to $39,999 | 0 (0.0%) | 0 (0.0%) |
| $40,000 to $44,999 | 4 (12.9%) | 0 (0.0%) |
| $45,000 to $49,999 | 0 (0.0%) | 0 (0.0%) |
| $50,000 to $54,999 | 0 (0.0%) | 0 (0.0%) |
| $55,000 to $64,999 | 0 (0.0%) | 0 (0.0%) |
| $65,000 to $74,999 | 0 (0.0%) | 0 (0.0%) |
| $75,000 to $99,999 | 0 (0.0%) | 0 (0.0%) |
| $100,000+ | 0 (0.0%) | 4 (26.7%) |
| Total | 31 (100.0%) | 15 (100.0%) |
Earnings by Sex by Educational Attainment in Des Moines
| Educational Attainment | Male Income | Female Income |
| Less than High School | - | - |
| High School Diploma | - | - |
| College or Associate's Degree | - | - |
| Bachelor's Degree | - | - |
| Graduate Degree | - | - |
| Total | $2,499 | $0 |
Family Income in Des Moines
Family Income Brackets in Des Moines
According to the Des Moines family income data, there are 13 families falling into the $50,000 to $74,999 income range, which is the most common income bracket and makes up 59.1% of all families.
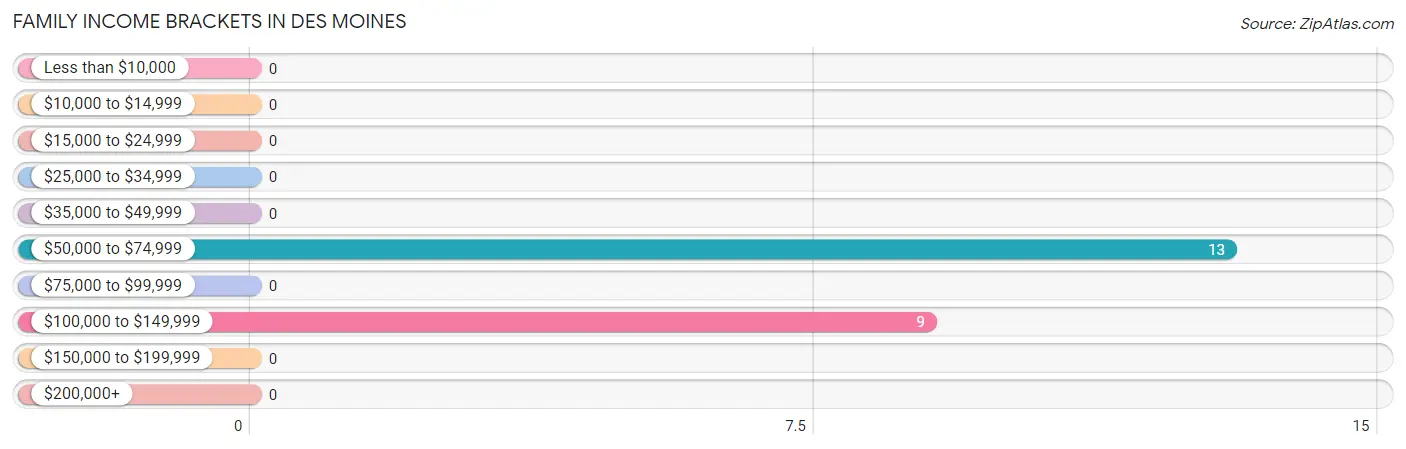
| Income Bracket | # Families | % Families |
| Less than $10,000 | 0 | 0.0% |
| $10,000 to $14,999 | 0 | 0.0% |
| $15,000 to $24,999 | 0 | 0.0% |
| $25,000 to $34,999 | 0 | 0.0% |
| $35,000 to $49,999 | 0 | 0.0% |
| $50,000 to $74,999 | 13 | 59.1% |
| $75,000 to $99,999 | 0 | 0.0% |
| $100,000 to $149,999 | 9 | 40.9% |
| $150,000 to $199,999 | 0 | 0.0% |
| $200,000+ | 0 | 0.0% |
Family Income by Famaliy Size in Des Moines
| Income Bracket | # Families | Median Income |
| 2-Person Families | 14 (63.6%) | $0 |
| 3-Person Families | 4 (18.2%) | $0 |
| 4-Person Families | 0 (0.0%) | $0 |
| 5-Person Families | 0 (0.0%) | $0 |
| 6-Person Families | 4 (18.2%) | $0 |
| 7+ Person Families | 0 (0.0%) | $0 |
| Total | 22 (100.0%) | $0 |
Family Income by Number of Earners in Des Moines
| Number of Earners | # Families | Median Income |
| No Earners | 9 (40.9%) | $0 |
| 1 Earner | 5 (22.7%) | $0 |
| 2 Earners | 4 (18.2%) | $0 |
| 3+ Earners | 4 (18.2%) | $0 |
| Total | 22 (100.0%) | $0 |
Household Income in Des Moines
Household Income Brackets in Des Moines
With 25 households falling in the category, the $50,000 to $74,999 income range is the most frequent in Des Moines, accounting for 49.0% of all households.
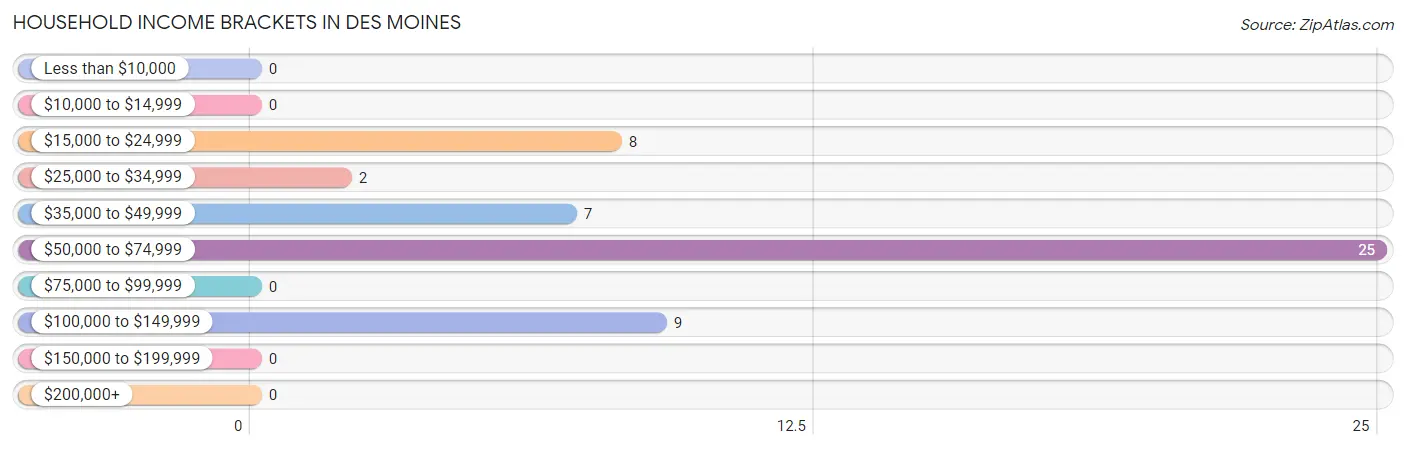
| Income Bracket | # Households | % Households |
| Less than $10,000 | 0 | 0.0% |
| $10,000 to $14,999 | 0 | 0.0% |
| $15,000 to $24,999 | 8 | 15.7% |
| $25,000 to $34,999 | 2 | 3.9% |
| $35,000 to $49,999 | 7 | 13.7% |
| $50,000 to $74,999 | 25 | 49.0% |
| $75,000 to $99,999 | 0 | 0.0% |
| $100,000 to $149,999 | 9 | 17.6% |
| $150,000 to $199,999 | 0 | 0.0% |
| $200,000+ | 0 | 0.0% |
Household Income by Householder Age in Des Moines
The median household income in Des Moines is $54,750, with the highest median household income of $58,021 found in the 45 to 64 years age bracket for the primary householder. A total of 19 households (37.2%) fall into this category.
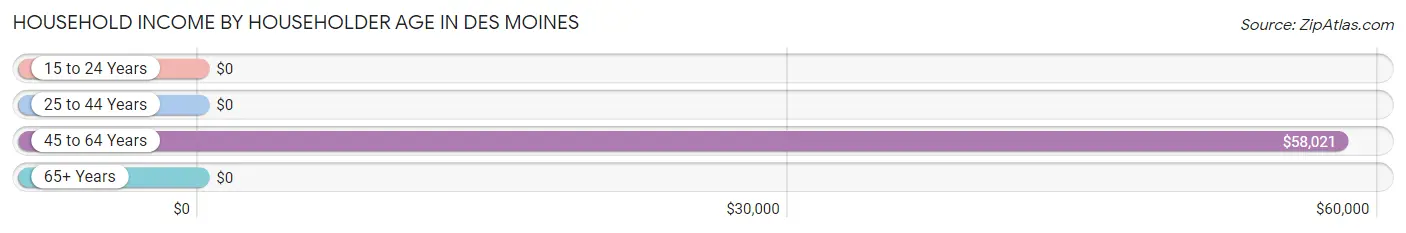
| Income Bracket | # Households | Median Income |
| 15 to 24 Years | 0 (0.0%) | $0 |
| 25 to 44 Years | 8 (15.7%) | $0 |
| 45 to 64 Years | 19 (37.2%) | $58,021 |
| 65+ Years | 24 (47.1%) | $0 |
| Total | 51 (100.0%) | $54,750 |
Poverty in Des Moines
Income Below Poverty by Sex and Age in Des Moines
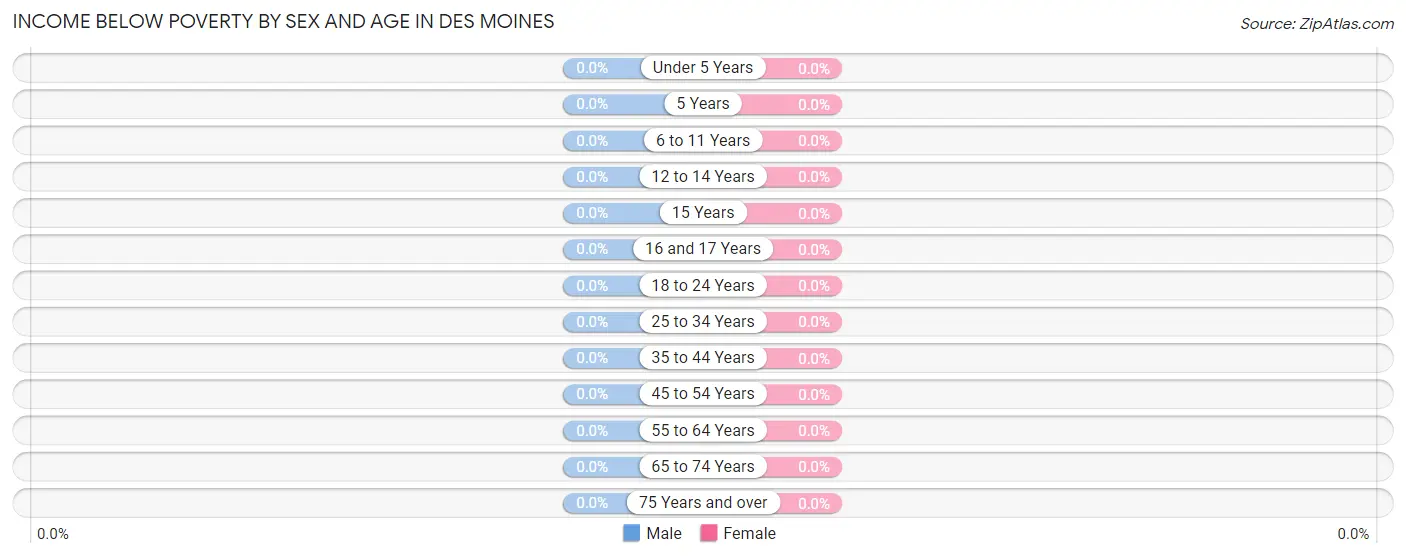
| Age Bracket | Male | Female |
| Under 5 Years | 0 (0.0%) | 0 (0.0%) |
| 5 Years | 0 (0.0%) | 0 (0.0%) |
| 6 to 11 Years | 0 (0.0%) | 0 (0.0%) |
| 12 to 14 Years | 0 (0.0%) | 0 (0.0%) |
| 15 Years | 0 (0.0%) | 0 (0.0%) |
| 16 and 17 Years | 0 (0.0%) | 0 (0.0%) |
| 18 to 24 Years | 0 (0.0%) | 0 (0.0%) |
| 25 to 34 Years | 0 (0.0%) | 0 (0.0%) |
| 35 to 44 Years | 0 (0.0%) | 0 (0.0%) |
| 45 to 54 Years | 0 (0.0%) | 0 (0.0%) |
| 55 to 64 Years | 0 (0.0%) | 0 (0.0%) |
| 65 to 74 Years | 0 (0.0%) | 0 (0.0%) |
| 75 Years and over | 0 (0.0%) | 0 (0.0%) |
| Total | 0 (0.0%) | 0 (0.0%) |
Income Above Poverty by Sex and Age in Des Moines
According to the poverty statistics in Des Moines, males aged under 5 years and females aged 6 to 11 years are the age groups that are most secure financially, with 100.0% of males and 100.0% of females in these age groups living above the poverty line.
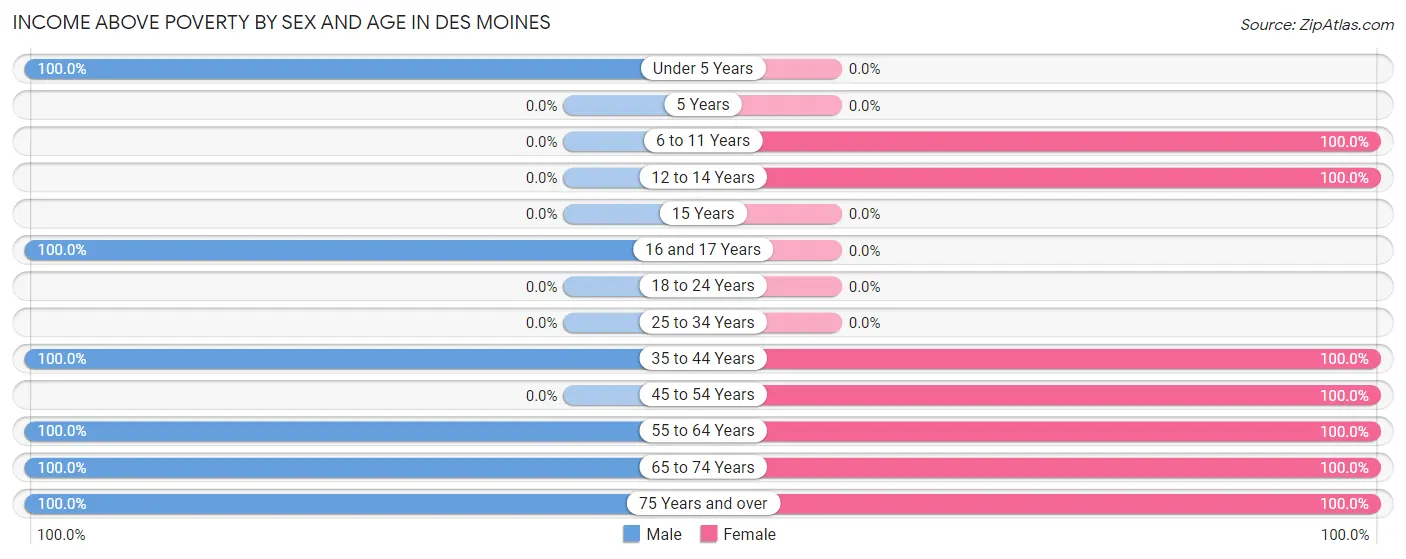
| Age Bracket | Male | Female |
| Under 5 Years | 9 (100.0%) | 0 (0.0%) |
| 5 Years | 0 (0.0%) | 0 (0.0%) |
| 6 to 11 Years | 0 (0.0%) | 4 (100.0%) |
| 12 to 14 Years | 0 (0.0%) | 4 (100.0%) |
| 15 Years | 0 (0.0%) | 0 (0.0%) |
| 16 and 17 Years | 10 (100.0%) | 0 (0.0%) |
| 18 to 24 Years | 0 (0.0%) | 0 (0.0%) |
| 25 to 34 Years | 0 (0.0%) | 0 (0.0%) |
| 35 to 44 Years | 7 (100.0%) | 4 (100.0%) |
| 45 to 54 Years | 0 (0.0%) | 6 (100.0%) |
| 55 to 64 Years | 29 (100.0%) | 5 (100.0%) |
| 65 to 74 Years | 2 (100.0%) | 12 (100.0%) |
| 75 Years and over | 10 (100.0%) | 1 (100.0%) |
| Total | 67 (100.0%) | 36 (100.0%) |
Income Below Poverty Among Married-Couple Families in Des Moines
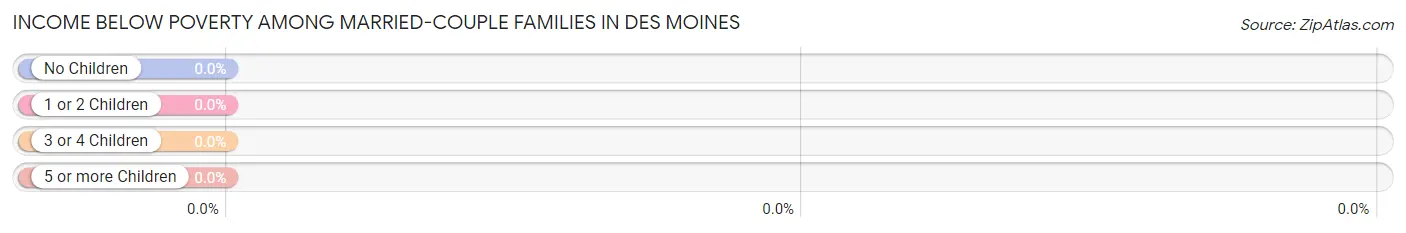
| Children | Above Poverty | Below Poverty |
| No Children | 9 (100.0%) | 0 (0.0%) |
| 1 or 2 Children | 4 (100.0%) | 0 (0.0%) |
| 3 or 4 Children | 4 (100.0%) | 0 (0.0%) |
| 5 or more Children | 0 (0.0%) | 0 (0.0%) |
| Total | 17 (100.0%) | 0 (0.0%) |
Income Below Poverty Among Single-Parent Households in Des Moines
| Children | Single Father | Single Mother |
| No Children | 0 (0.0%) | 0 (0.0%) |
| 1 or 2 Children | 0 (0.0%) | 0 (0.0%) |
| 3 or 4 Children | 0 (0.0%) | 0 (0.0%) |
| 5 or more Children | 0 (0.0%) | 0 (0.0%) |
| Total | 0 (0.0%) | 0 (0.0%) |
Income Below Poverty Among Married-Couple vs Single-Parent Households in Des Moines
| Children | Married-Couple Families | Single-Parent Households |
| No Children | 0 (0.0%) | 0 (0.0%) |
| 1 or 2 Children | 0 (0.0%) | 0 (0.0%) |
| 3 or 4 Children | 0 (0.0%) | 0 (0.0%) |
| 5 or more Children | 0 (0.0%) | 0 (0.0%) |
| Total | 0 (0.0%) | 0 (0.0%) |
Race in Des Moines
The most populous races in Des Moines are Hispanic or Latino (56 | 54.4%), White / Caucasian (47 | 45.6%), and Two or more Races (34 | 33.0%).
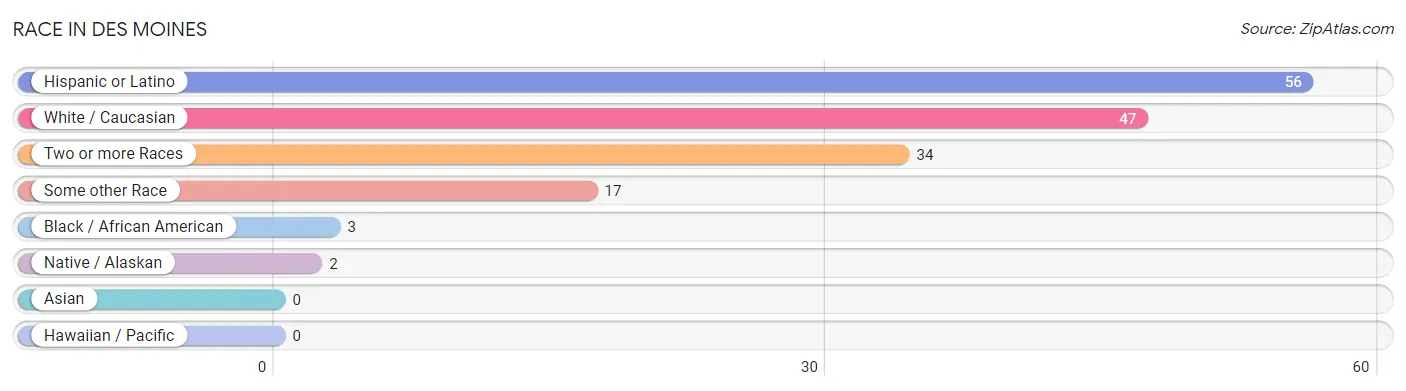
| Race | # Population | % Population |
| Asian | 0 | 0.0% |
| Black / African American | 3 | 2.9% |
| Hawaiian / Pacific | 0 | 0.0% |
| Hispanic or Latino | 56 | 54.4% |
| Native / Alaskan | 2 | 1.9% |
| White / Caucasian | 47 | 45.6% |
| Two or more Races | 34 | 33.0% |
| Some other Race | 17 | 16.5% |
| Total | 103 | 100.0% |
Ancestry in Des Moines
The most populous ancestries reported in Des Moines are Mexican (22 | 21.4%), Dutch (16 | 15.5%), Spaniard (16 | 15.5%), Scotch-Irish (12 | 11.7%), and German (10 | 9.7%), together accounting for 73.8% of all Des Moines residents.
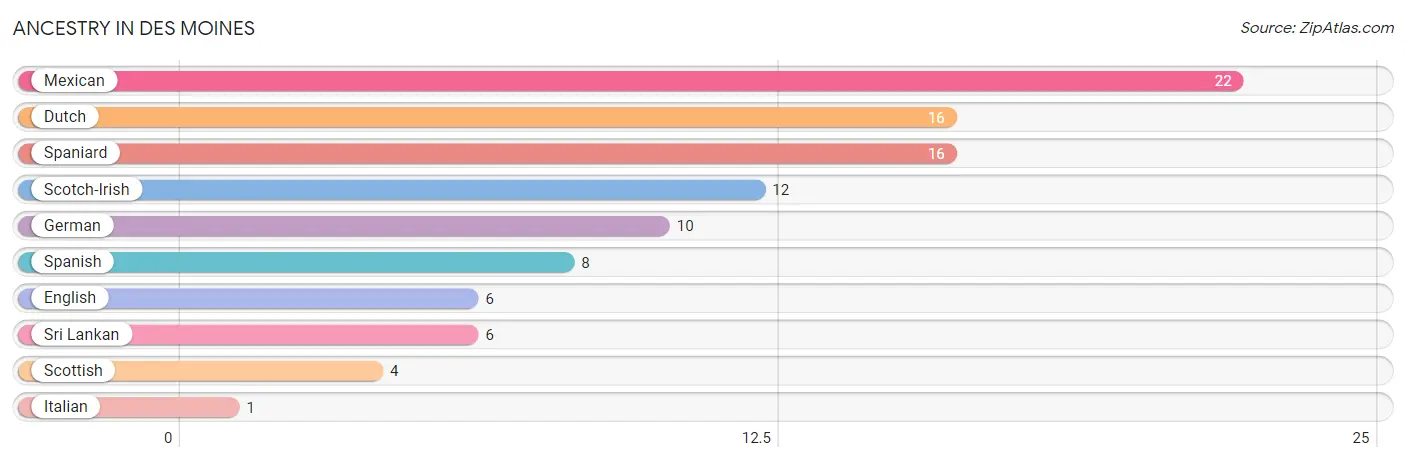
| Ancestry | # Population | % Population |
| Dutch | 16 | 15.5% |
| English | 6 | 5.8% |
| German | 10 | 9.7% |
| Italian | 1 | 1.0% |
| Mexican | 22 | 21.4% |
| Scotch-Irish | 12 | 11.7% |
| Scottish | 4 | 3.9% |
| Spaniard | 16 | 15.5% |
| Spanish | 8 | 7.8% |
| Sri Lankan | 6 | 5.8% | View All 10 Rows |
Immigrants in Des Moines

| Immigration Origin | # Population | % Population | View All 0 Rows |
Sex and Age in Des Moines
Sex and Age in Des Moines
The most populous age groups in Des Moines are 60 to 64 Years (29 | 43.3%) for men and 65 to 69 Years (11 | 30.6%) for women.
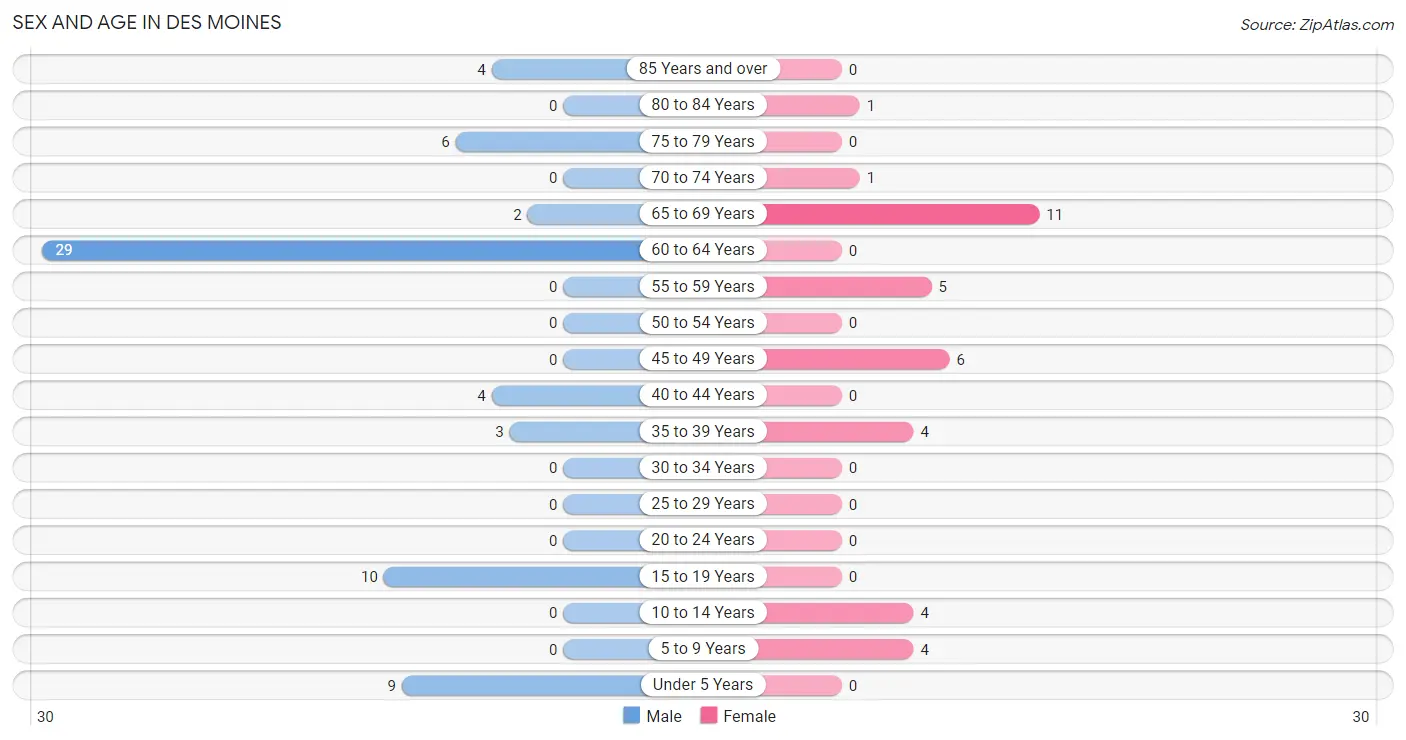
| Age Bracket | Male | Female |
| Under 5 Years | 9 (13.4%) | 0 (0.0%) |
| 5 to 9 Years | 0 (0.0%) | 4 (11.1%) |
| 10 to 14 Years | 0 (0.0%) | 4 (11.1%) |
| 15 to 19 Years | 10 (14.9%) | 0 (0.0%) |
| 20 to 24 Years | 0 (0.0%) | 0 (0.0%) |
| 25 to 29 Years | 0 (0.0%) | 0 (0.0%) |
| 30 to 34 Years | 0 (0.0%) | 0 (0.0%) |
| 35 to 39 Years | 3 (4.5%) | 4 (11.1%) |
| 40 to 44 Years | 4 (6.0%) | 0 (0.0%) |
| 45 to 49 Years | 0 (0.0%) | 6 (16.7%) |
| 50 to 54 Years | 0 (0.0%) | 0 (0.0%) |
| 55 to 59 Years | 0 (0.0%) | 5 (13.9%) |
| 60 to 64 Years | 29 (43.3%) | 0 (0.0%) |
| 65 to 69 Years | 2 (3.0%) | 11 (30.6%) |
| 70 to 74 Years | 0 (0.0%) | 1 (2.8%) |
| 75 to 79 Years | 6 (9.0%) | 0 (0.0%) |
| 80 to 84 Years | 0 (0.0%) | 1 (2.8%) |
| 85 Years and over | 4 (6.0%) | 0 (0.0%) |
| Total | 67 (100.0%) | 36 (100.0%) |
Families and Households in Des Moines
Median Family Size in Des Moines
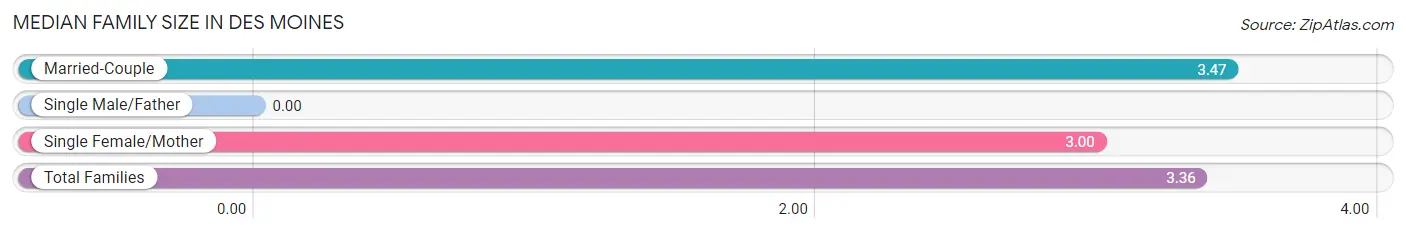
| Family Type | # Families | Family Size |
| Married-Couple | 17 (77.3%) | 3.47 |
| Single Male/Father | 0 (0.0%) | - |
| Single Female/Mother | 5 (22.7%) | 3.00 |
| Total Families | 22 (100.0%) | 3.36 |
Median Household Size in Des Moines
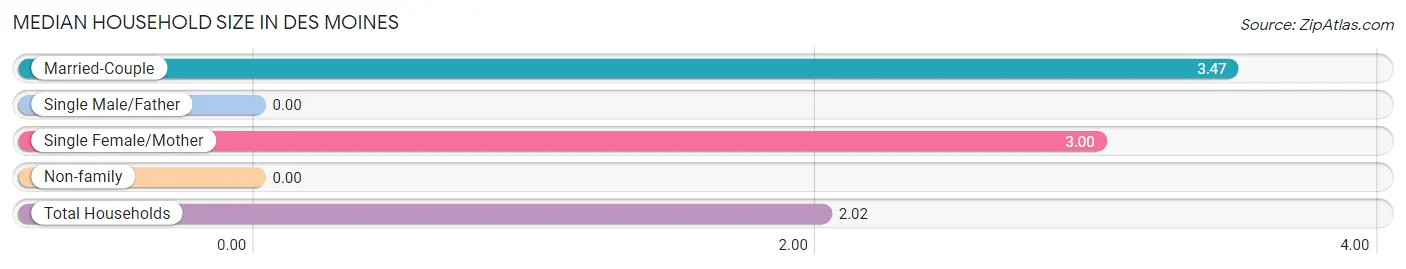
| Household Type | # Households | Household Size |
| Married-Couple | 17 (33.3%) | 3.47 |
| Single Male/Father | 0 (0.0%) | - |
| Single Female/Mother | 5 (9.8%) | 3.00 |
| Non-family | 29 (56.9%) | - |
| Total Households | 51 (100.0%) | 2.02 |
Household Size by Marriage Status in Des Moines
Out of a total of 51 households in Des Moines, 22 (43.1%) are family households, while 29 (56.9%) are nonfamily households. The most numerous type of family households are 2-person households, comprising 14, and the most common type of nonfamily households are 1-person households, comprising 29.
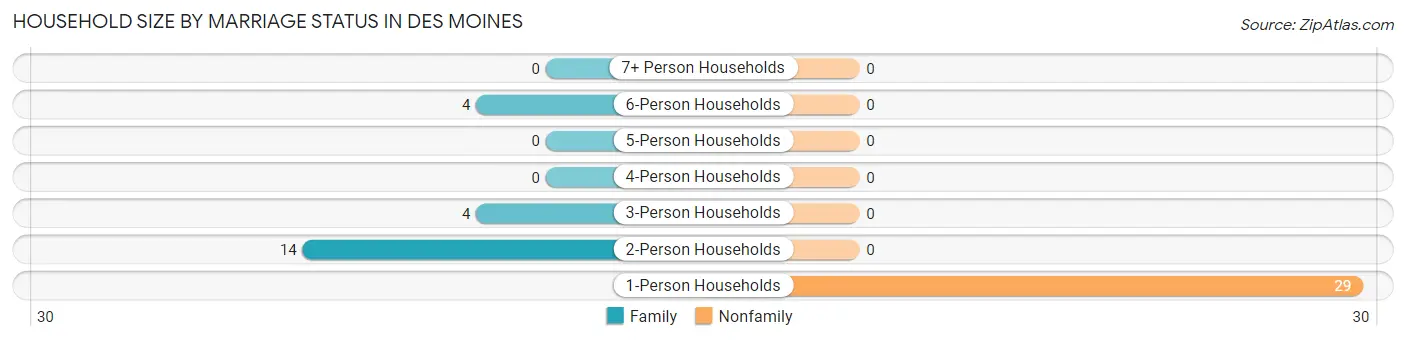
| Household Size | Family Households | Nonfamily Households |
| 1-Person Households | - | 29 (56.9%) |
| 2-Person Households | 14 (27.5%) | 0 (0.0%) |
| 3-Person Households | 4 (7.8%) | 0 (0.0%) |
| 4-Person Households | 0 (0.0%) | 0 (0.0%) |
| 5-Person Households | 0 (0.0%) | 0 (0.0%) |
| 6-Person Households | 4 (7.8%) | 0 (0.0%) |
| 7+ Person Households | 0 (0.0%) | 0 (0.0%) |
| Total | 22 (43.1%) | 29 (56.9%) |
Female Fertility in Des Moines
Fertility by Age in Des Moines
| Age Bracket | Women with Births | Births / 1,000 Women |
| 15 to 19 years | 0 (0.0%) | 0.0 |
| 20 to 34 years | 0 (0.0%) | 0.0 |
| 35 to 50 years | 0 (0.0%) | 0.0 |
| Total | 0 (0.0%) | 0.0 |
Fertility by Age by Marriage Status in Des Moines
| Age Bracket | Married | Unmarried |
| 15 to 19 years | 0 (0.0%) | 0 (0.0%) |
| 20 to 34 years | 0 (0.0%) | 0 (0.0%) |
| 35 to 50 years | 0 (0.0%) | 0 (0.0%) |
| Total | 0 (0.0%) | 0 (0.0%) |
Fertility by Education in Des Moines
| Educational Attainment | Women with Births | Births / 1,000 Women |
| Less than High School | 0 (0.0%) | 0.0 |
| High School Diploma | 0 (0.0%) | 0.0 |
| College or Associate's Degree | 0 (0.0%) | 0.0 |
| Bachelor's Degree | 0 (0.0%) | 0.0 |
| Graduate Degree | 0 (0.0%) | 0.0 |
| Total | 0 (0.0%) | 0.0 |
Fertility by Education by Marriage Status in Des Moines
| Educational Attainment | Married | Unmarried |
| Less than High School | 0 (0.0%) | 0 (0.0%) |
| High School Diploma | 0 (0.0%) | 0 (0.0%) |
| College or Associate's Degree | 0 (0.0%) | 0 (0.0%) |
| Bachelor's Degree | 0 (0.0%) | 0 (0.0%) |
| Graduate Degree | 0 (0.0%) | 0 (0.0%) |
| Total | 0 (0.0%) | 0 (0.0%) |
Employment Characteristics in Des Moines
Employment by Class of Employer in Des Moines
Among the 24 employed individuals in Des Moines, private company employees (9 | 37.5%), state government employees (7 | 29.2%), and self-employed (not incorporated) (4 | 16.7%) make up the most common classes of employment.
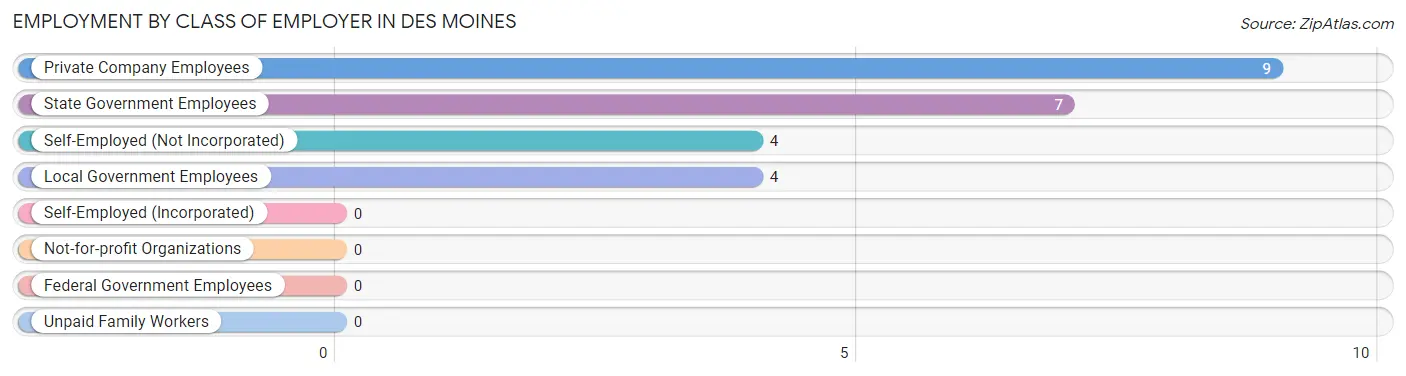
| Employer Class | # Employees | % Employees |
| Private Company Employees | 9 | 37.5% |
| Self-Employed (Incorporated) | 0 | 0.0% |
| Self-Employed (Not Incorporated) | 4 | 16.7% |
| Not-for-profit Organizations | 0 | 0.0% |
| Local Government Employees | 4 | 16.7% |
| State Government Employees | 7 | 29.2% |
| Federal Government Employees | 0 | 0.0% |
| Unpaid Family Workers | 0 | 0.0% |
| Total | 24 | 100.0% |
Employment Status by Age in Des Moines
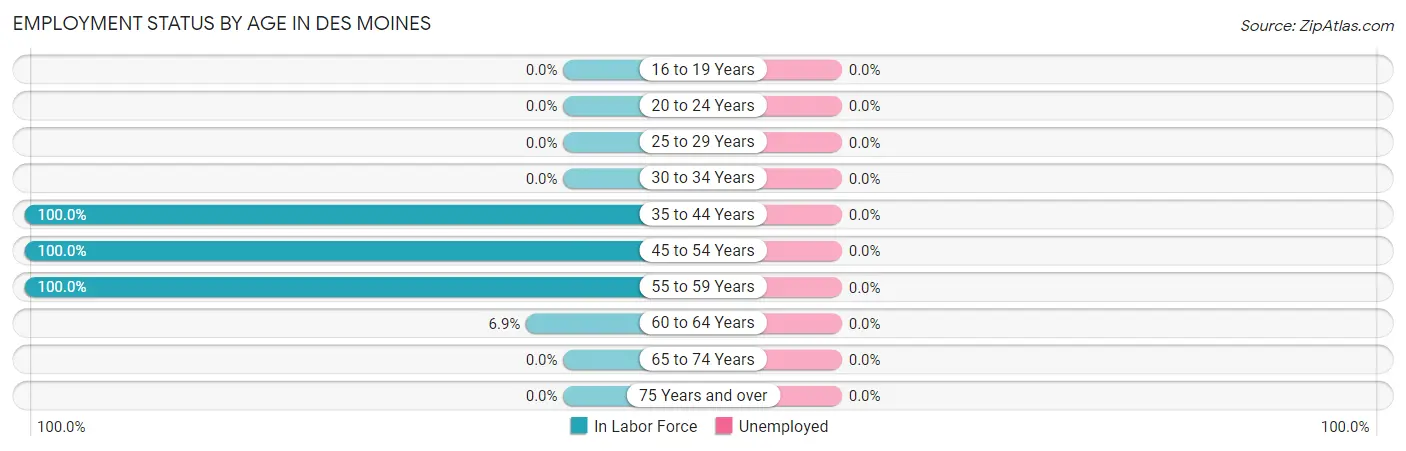
| Age Bracket | In Labor Force | Unemployed |
| 16 to 19 Years | 0 (0.0%) | 0 (0.0%) |
| 20 to 24 Years | 0 (0.0%) | 0 (0.0%) |
| 25 to 29 Years | 0 (0.0%) | 0 (0.0%) |
| 30 to 34 Years | 0 (0.0%) | 0 (0.0%) |
| 35 to 44 Years | 11 (100.0%) | 0 (0.0%) |
| 45 to 54 Years | 6 (100.0%) | 0 (0.0%) |
| 55 to 59 Years | 5 (100.0%) | 0 (0.0%) |
| 60 to 64 Years | 2 (6.9%) | 0 (0.0%) |
| 65 to 74 Years | 0 (0.0%) | 0 (0.0%) |
| 75 Years and over | 0 (0.0%) | 0 (0.0%) |
| Total | 24 (27.9%) | 0 (0.0%) |
Employment Status by Educational Attainment in Des Moines
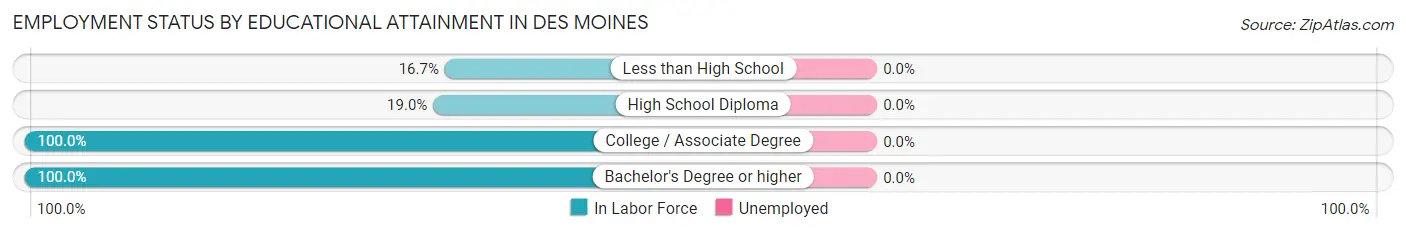
| Educational Attainment | In Labor Force | Unemployed |
| Less than High School | 2 (16.7%) | 0 (0.0%) |
| High School Diploma | 4 (19.0%) | 0 (0.0%) |
| College / Associate Degree | 5 (100.0%) | 0 (0.0%) |
| Bachelor's Degree or higher | 13 (100.0%) | 0 (0.0%) |
| Total | 24 (47.1%) | 0 (0.0%) |
Employment Occupations by Sex in Des Moines
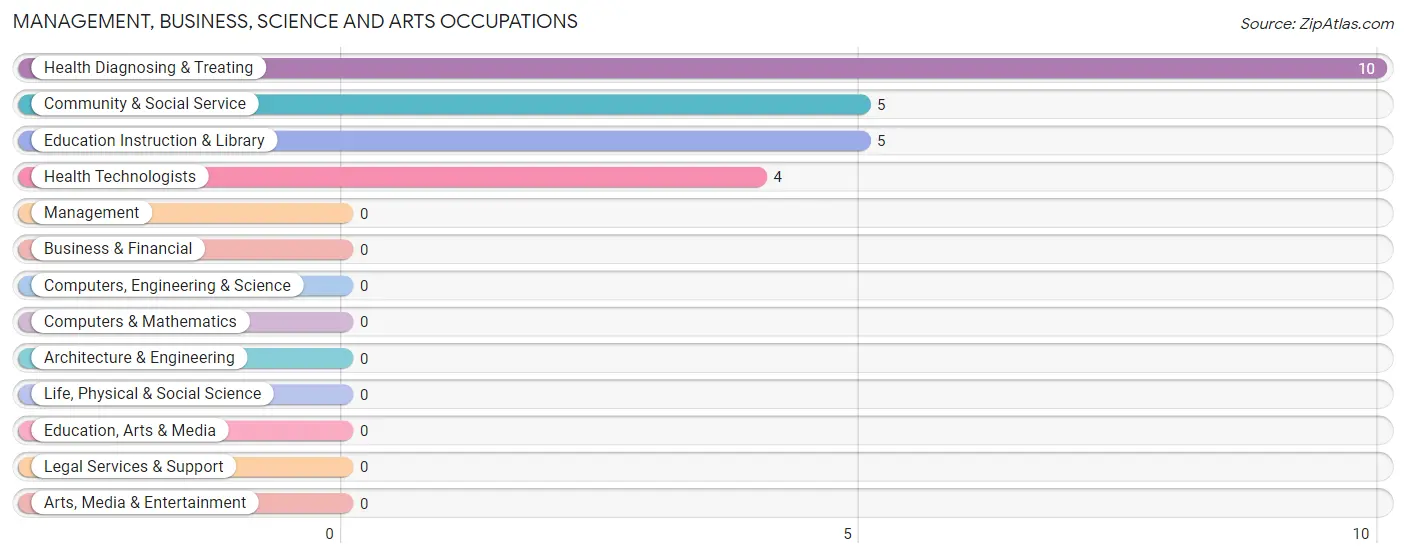
Management, Business, Science and Arts Occupations
The most common Management, Business, Science and Arts occupations in Des Moines are Health Diagnosing & Treating (10 | 41.7%), Community & Social Service (5 | 20.8%), Education Instruction & Library (5 | 20.8%), and Health Technologists (4 | 16.7%).
Management, Business, Science and Arts Occupations by Sex
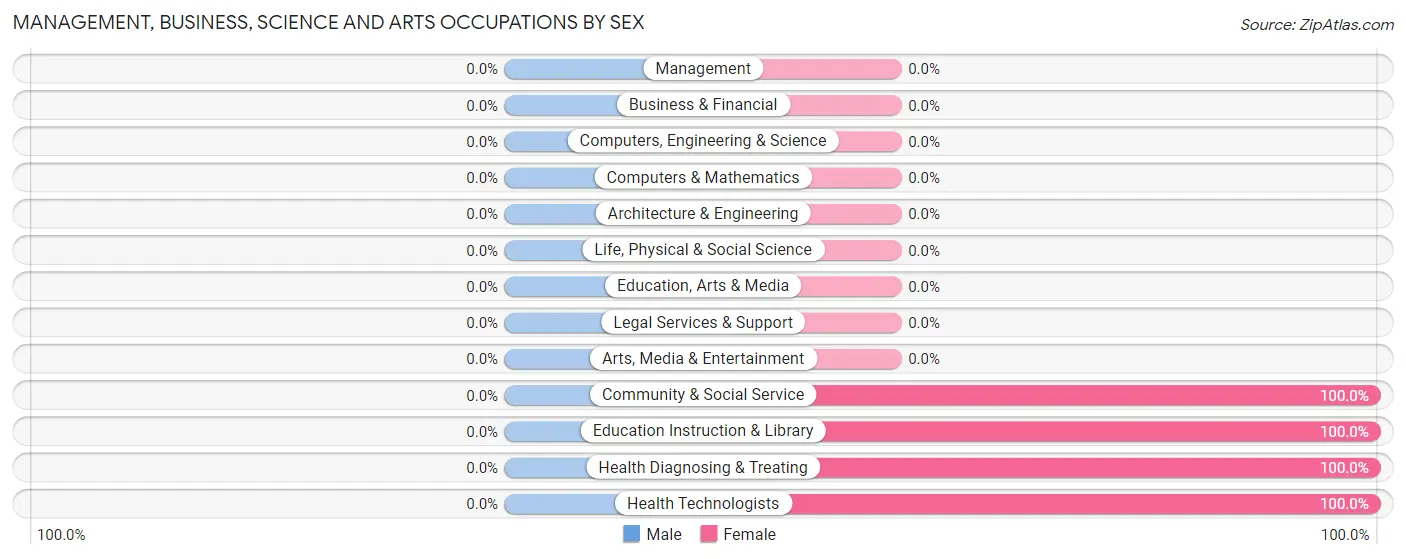
| Occupation | Male | Female |
| Management | 0 (0.0%) | 0 (0.0%) |
| Business & Financial | 0 (0.0%) | 0 (0.0%) |
| Computers, Engineering & Science | 0 (0.0%) | 0 (0.0%) |
| Computers & Mathematics | 0 (0.0%) | 0 (0.0%) |
| Architecture & Engineering | 0 (0.0%) | 0 (0.0%) |
| Life, Physical & Social Science | 0 (0.0%) | 0 (0.0%) |
| Community & Social Service | 0 (0.0%) | 5 (100.0%) |
| Education, Arts & Media | 0 (0.0%) | 0 (0.0%) |
| Legal Services & Support | 0 (0.0%) | 0 (0.0%) |
| Education Instruction & Library | 0 (0.0%) | 5 (100.0%) |
| Arts, Media & Entertainment | 0 (0.0%) | 0 (0.0%) |
| Health Diagnosing & Treating | 0 (0.0%) | 10 (100.0%) |
| Health Technologists | 0 (0.0%) | 4 (100.0%) |
| Total (Category) | 0 (0.0%) | 15 (100.0%) |
| Total (Overall) | 9 (37.5%) | 15 (62.5%) |
Services Occupations
The most common Services occupations in Des Moines are , and Cleaning & Maintenance (6 | 25.0%).
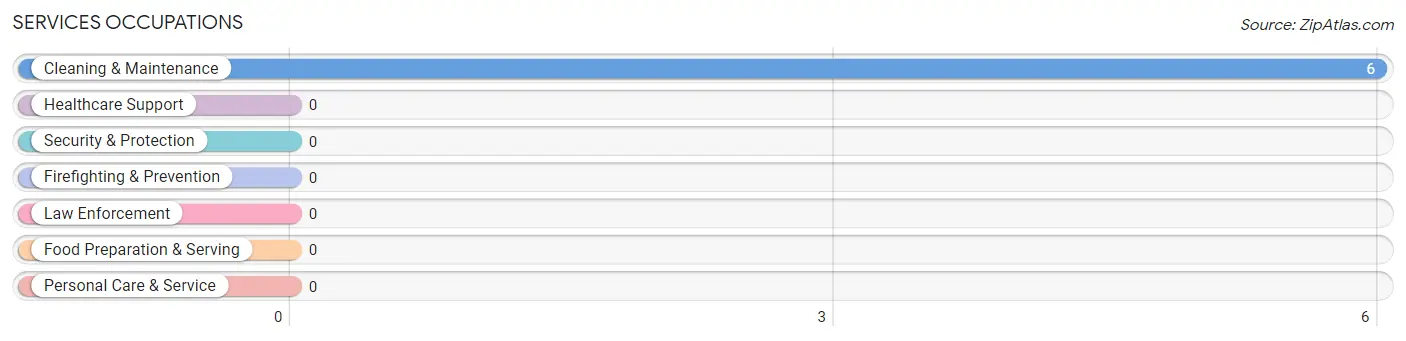
Services Occupations by Sex
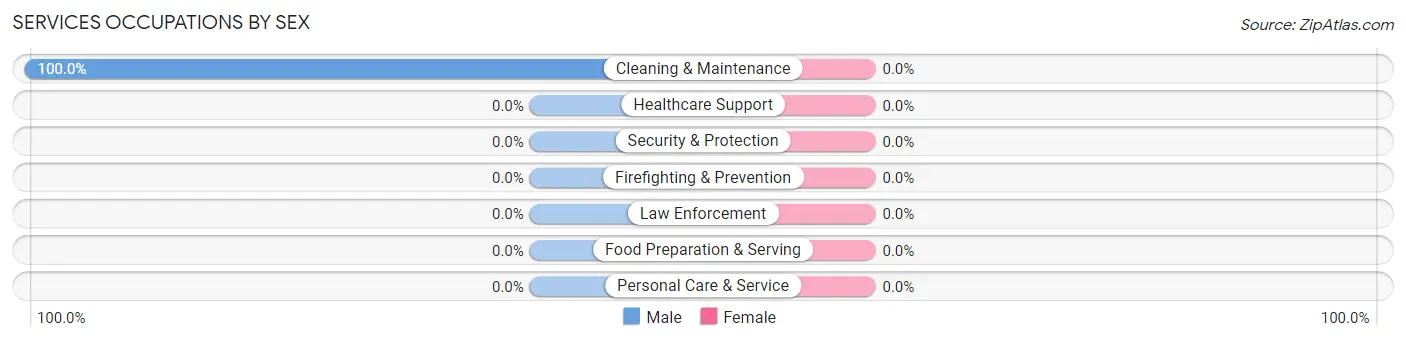
| Occupation | Male | Female |
| Healthcare Support | 0 (0.0%) | 0 (0.0%) |
| Security & Protection | 0 (0.0%) | 0 (0.0%) |
| Firefighting & Prevention | 0 (0.0%) | 0 (0.0%) |
| Law Enforcement | 0 (0.0%) | 0 (0.0%) |
| Food Preparation & Serving | 0 (0.0%) | 0 (0.0%) |
| Cleaning & Maintenance | 6 (100.0%) | 0 (0.0%) |
| Personal Care & Service | 0 (0.0%) | 0 (0.0%) |
| Total (Category) | 6 (100.0%) | 0 (0.0%) |
| Total (Overall) | 9 (37.5%) | 15 (62.5%) |
Sales and Office Occupations
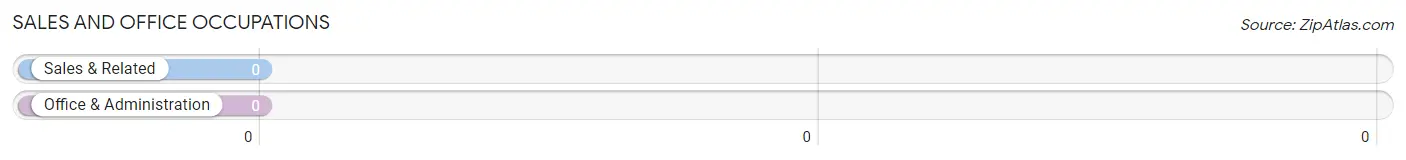
Sales and Office Occupations by Sex
| Occupation | Male | Female |
| Sales & Related | 0 (0.0%) | 0 (0.0%) |
| Office & Administration | 0 (0.0%) | 0 (0.0%) |
| Total (Category) | 0 (0.0%) | 0 (0.0%) |
| Total (Overall) | 9 (37.5%) | 15 (62.5%) |
Natural Resources, Construction and Maintenance Occupations
Natural Resources, Construction and Maintenance Occupations by Sex
| Occupation | Male | Female |
| Farming, Fishing & Forestry | 0 (0.0%) | 0 (0.0%) |
| Construction & Extraction | 0 (0.0%) | 0 (0.0%) |
| Installation, Maintenance & Repair | 0 (0.0%) | 0 (0.0%) |
| Total (Category) | 0 (0.0%) | 0 (0.0%) |
| Total (Overall) | 9 (37.5%) | 15 (62.5%) |
Production, Transportation and Moving Occupations
The most common Production, Transportation and Moving occupations in Des Moines are , and Transportation (3 | 12.5%).
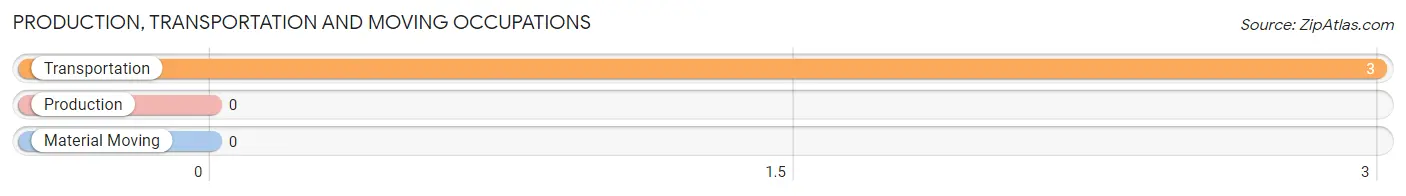
Production, Transportation and Moving Occupations by Sex
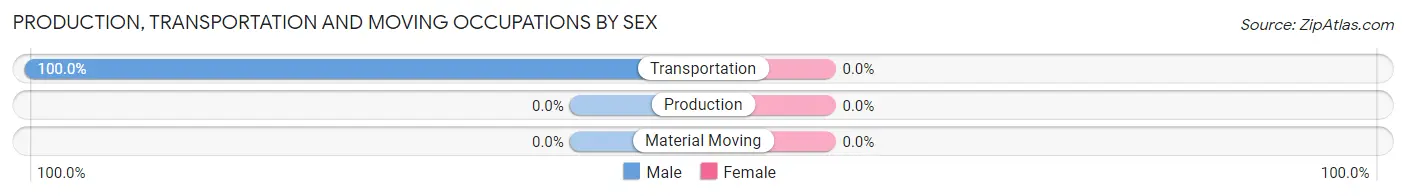
| Occupation | Male | Female |
| Production | 0 (0.0%) | 0 (0.0%) |
| Transportation | 3 (100.0%) | 0 (0.0%) |
| Material Moving | 0 (0.0%) | 0 (0.0%) |
| Total (Category) | 3 (100.0%) | 0 (0.0%) |
| Total (Overall) | 9 (37.5%) | 15 (62.5%) |
Employment Industries by Sex in Des Moines
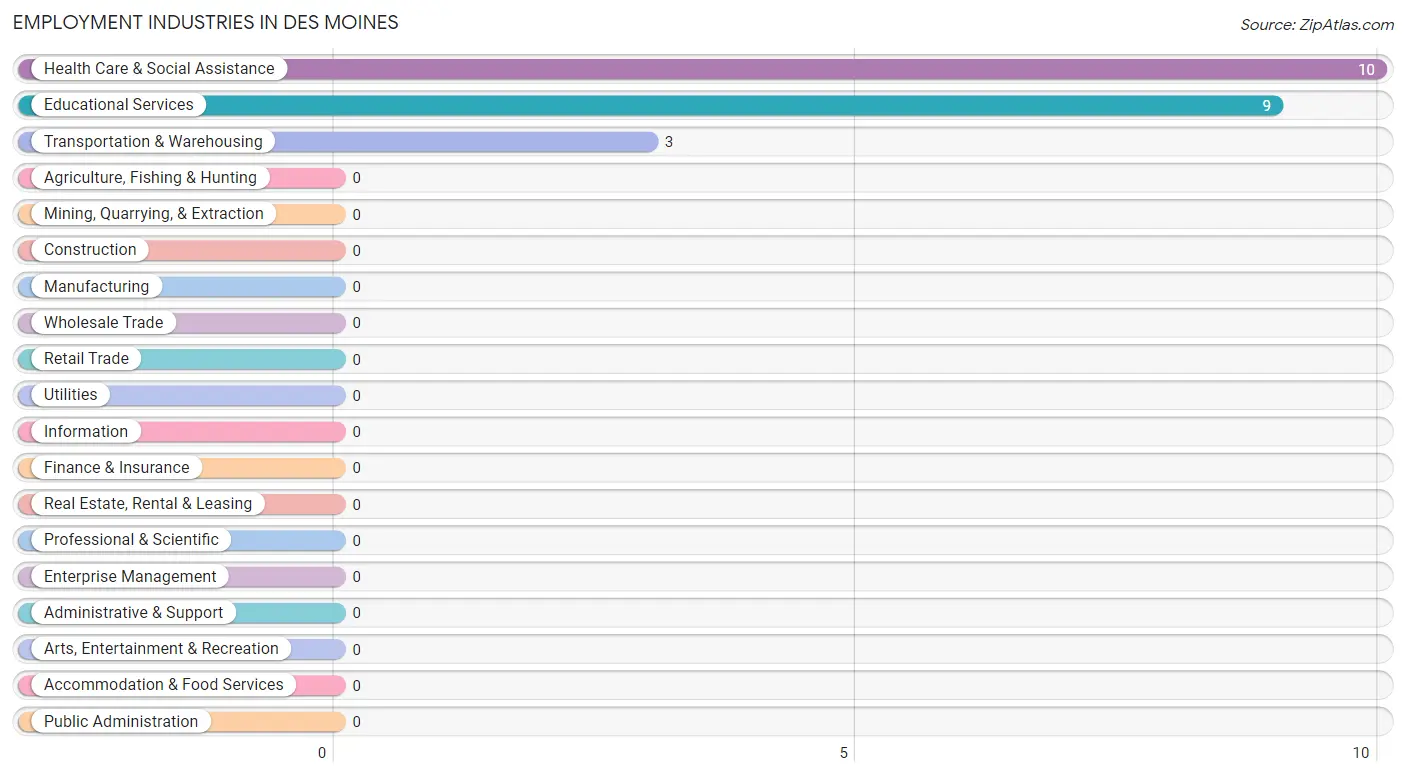
Employment Industries in Des Moines
The major employment industries in Des Moines include Health Care & Social Assistance (10 | 41.7%), Educational Services (9 | 37.5%), and Transportation & Warehousing (3 | 12.5%).
Employment Industries by Sex in Des Moines
The Des Moines industries that see more men than women are Transportation & Warehousing (100.0%), and Educational Services (44.4%), whereas the industries that tend to have a higher number of women are Health Care & Social Assistance (100.0%), and Educational Services (55.6%).
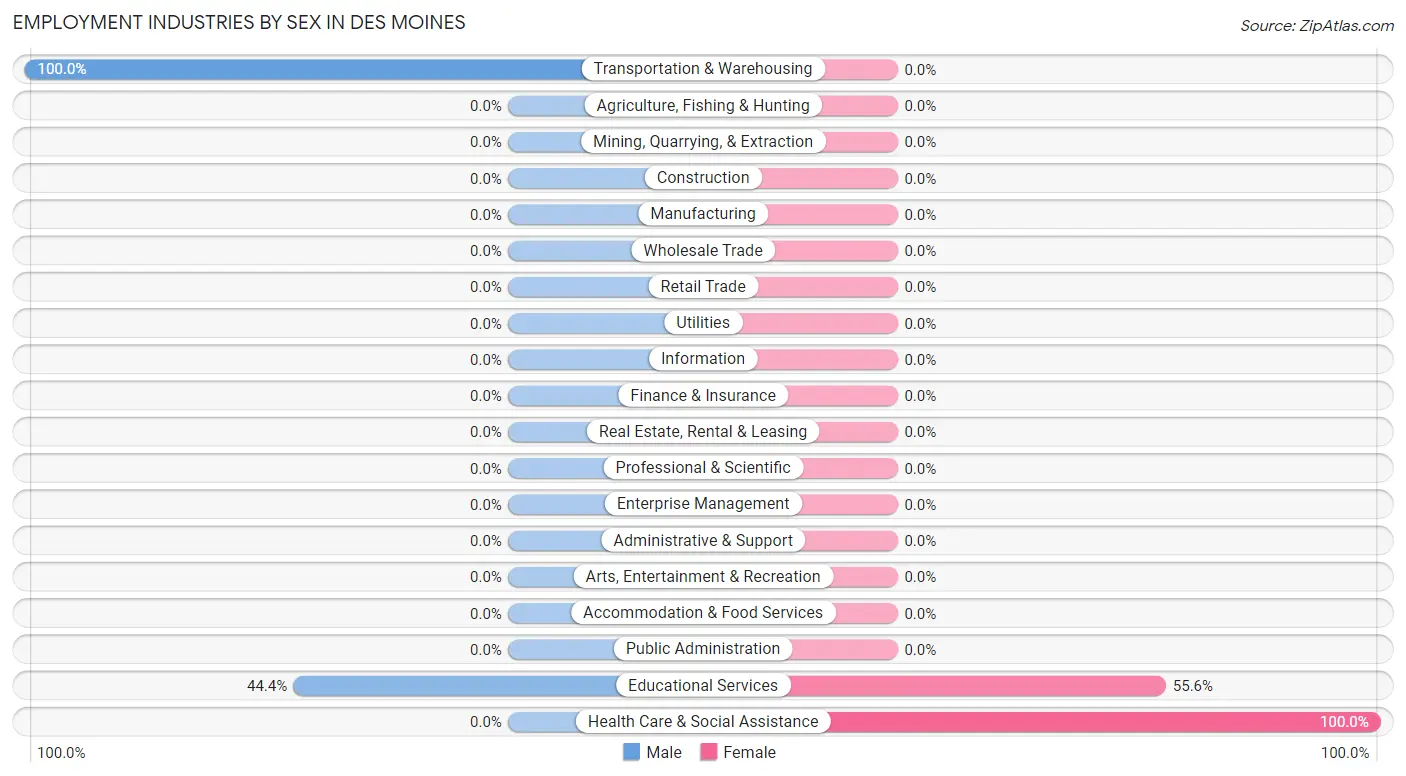
| Industry | Male | Female |
| Agriculture, Fishing & Hunting | 0 (0.0%) | 0 (0.0%) |
| Mining, Quarrying, & Extraction | 0 (0.0%) | 0 (0.0%) |
| Construction | 0 (0.0%) | 0 (0.0%) |
| Manufacturing | 0 (0.0%) | 0 (0.0%) |
| Wholesale Trade | 0 (0.0%) | 0 (0.0%) |
| Retail Trade | 0 (0.0%) | 0 (0.0%) |
| Transportation & Warehousing | 3 (100.0%) | 0 (0.0%) |
| Utilities | 0 (0.0%) | 0 (0.0%) |
| Information | 0 (0.0%) | 0 (0.0%) |
| Finance & Insurance | 0 (0.0%) | 0 (0.0%) |
| Real Estate, Rental & Leasing | 0 (0.0%) | 0 (0.0%) |
| Professional & Scientific | 0 (0.0%) | 0 (0.0%) |
| Enterprise Management | 0 (0.0%) | 0 (0.0%) |
| Administrative & Support | 0 (0.0%) | 0 (0.0%) |
| Educational Services | 4 (44.4%) | 5 (55.6%) |
| Health Care & Social Assistance | 0 (0.0%) | 10 (100.0%) |
| Arts, Entertainment & Recreation | 0 (0.0%) | 0 (0.0%) |
| Accommodation & Food Services | 0 (0.0%) | 0 (0.0%) |
| Public Administration | 0 (0.0%) | 0 (0.0%) |
| Total | 9 (37.5%) | 15 (62.5%) |
Education in Des Moines
School Enrollment in Des Moines
The most common levels of schooling among the 42 students in Des Moines are high school (25 | 59.5%), nursery / preschool (9 | 21.4%), and kindergarten (4 | 9.5%).
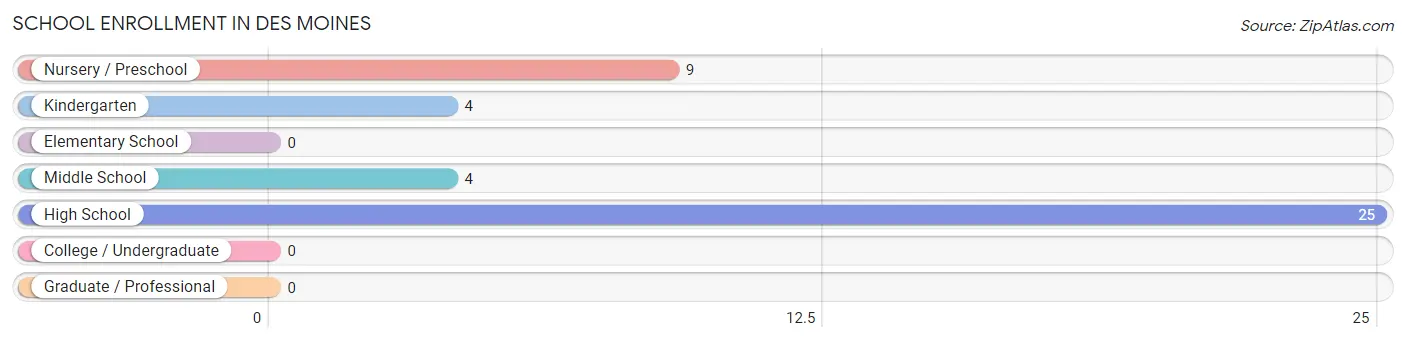
| School Level | # Students | % Students |
| Nursery / Preschool | 9 | 21.4% |
| Kindergarten | 4 | 9.5% |
| Elementary School | 0 | 0.0% |
| Middle School | 4 | 9.5% |
| High School | 25 | 59.5% |
| College / Undergraduate | 0 | 0.0% |
| Graduate / Professional | 0 | 0.0% |
| Total | 42 | 100.0% |
School Enrollment by Age by Funding Source in Des Moines
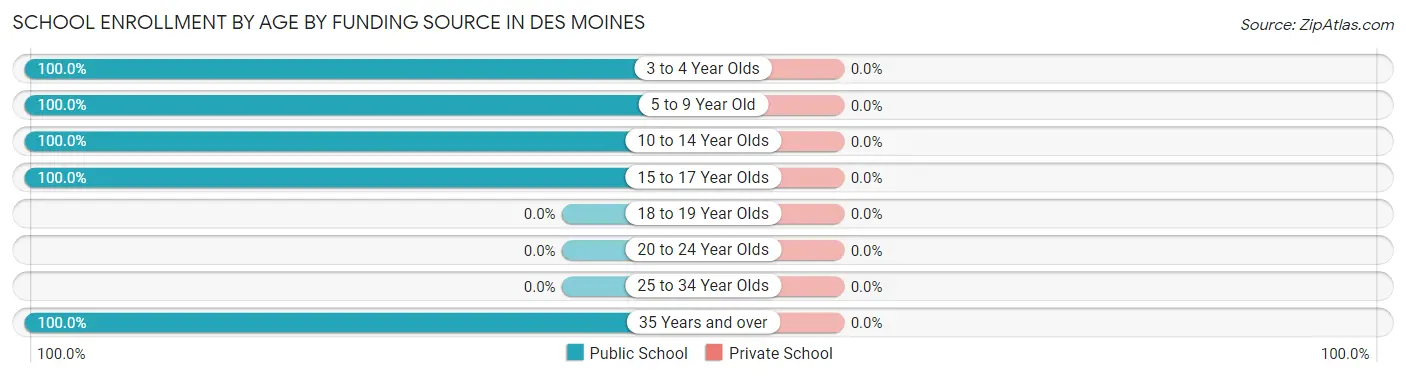
| Age Bracket | Public School | Private School |
| 3 to 4 Year Olds | 9 (100.0%) | 0 (0.0%) |
| 5 to 9 Year Old | 4 (100.0%) | 0 (0.0%) |
| 10 to 14 Year Olds | 4 (100.0%) | 0 (0.0%) |
| 15 to 17 Year Olds | 10 (100.0%) | 0 (0.0%) |
| 18 to 19 Year Olds | 0 (0.0%) | 0 (0.0%) |
| 20 to 24 Year Olds | 0 (0.0%) | 0 (0.0%) |
| 25 to 34 Year Olds | 0 (0.0%) | 0 (0.0%) |
| 35 Years and over | 15 (100.0%) | 0 (0.0%) |
| Total | 42 (100.0%) | 0 (0.0%) |
Educational Attainment by Field of Study in Des Moines
Science & technology (6 | 42.9%), psychology (4 | 28.6%), business (3 | 21.4%), and education (1 | 7.1%) are the most common fields of study among 14 individuals in Des Moines who have obtained a bachelor's degree or higher.
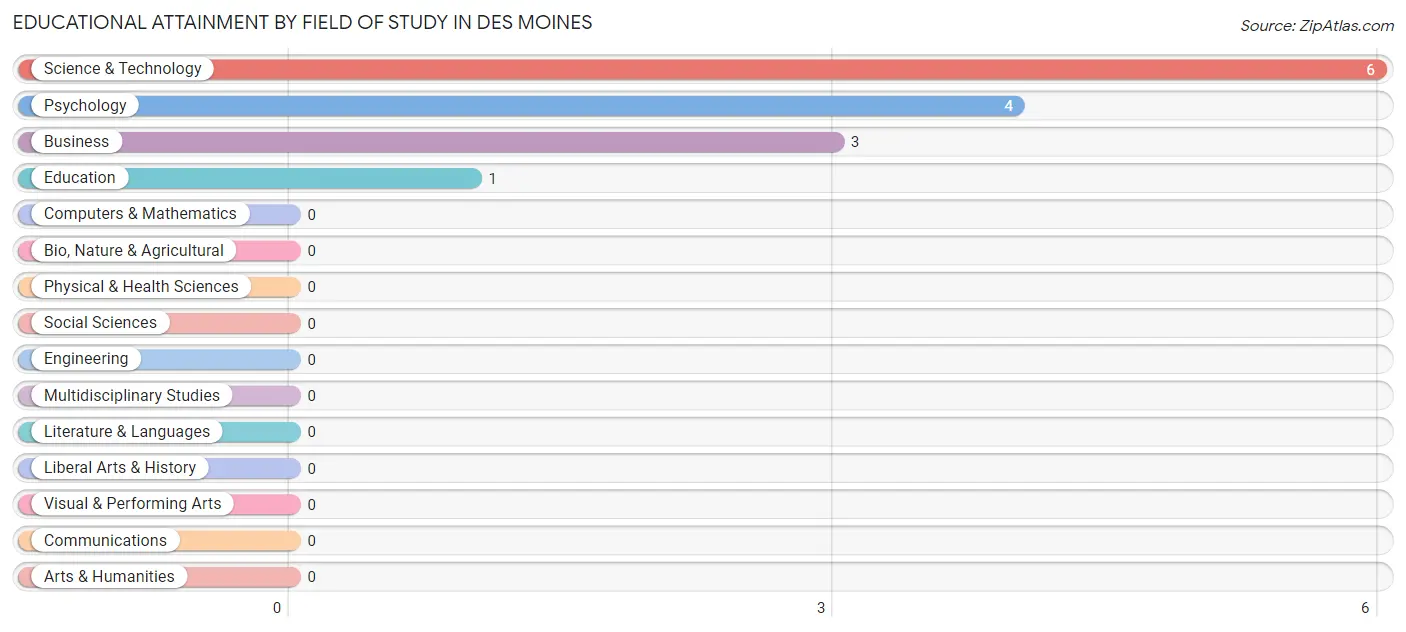
| Field of Study | # Graduates | % Graduates |
| Computers & Mathematics | 0 | 0.0% |
| Bio, Nature & Agricultural | 0 | 0.0% |
| Physical & Health Sciences | 0 | 0.0% |
| Psychology | 4 | 28.6% |
| Social Sciences | 0 | 0.0% |
| Engineering | 0 | 0.0% |
| Multidisciplinary Studies | 0 | 0.0% |
| Science & Technology | 6 | 42.9% |
| Business | 3 | 21.4% |
| Education | 1 | 7.1% |
| Literature & Languages | 0 | 0.0% |
| Liberal Arts & History | 0 | 0.0% |
| Visual & Performing Arts | 0 | 0.0% |
| Communications | 0 | 0.0% |
| Arts & Humanities | 0 | 0.0% |
| Total | 14 | 100.0% |
Transportation & Commute in Des Moines
Vehicle Availability by Sex in Des Moines
The most prevalent vehicle ownership categories in Des Moines are males with 2 vehicles (7, accounting for 77.8%) and females with 2 vehicles (10, making up 46.7%).
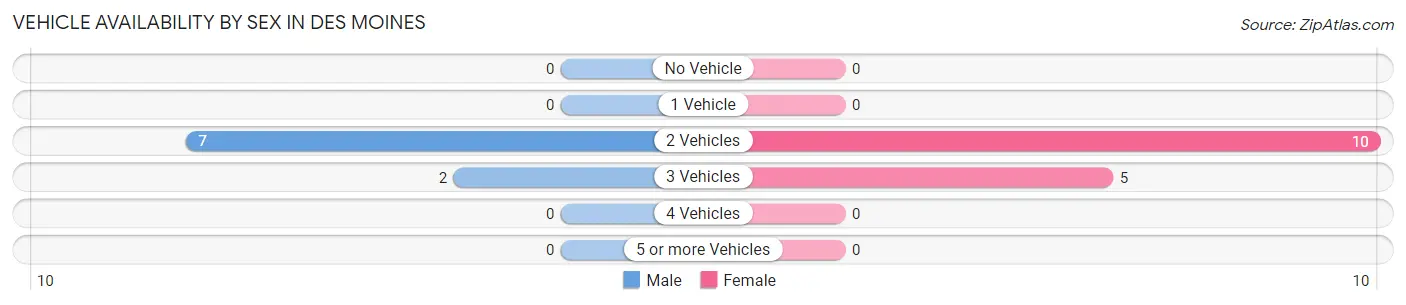
| Vehicles Available | Male | Female |
| No Vehicle | 0 (0.0%) | 0 (0.0%) |
| 1 Vehicle | 0 (0.0%) | 0 (0.0%) |
| 2 Vehicles | 7 (77.8%) | 10 (66.7%) |
| 3 Vehicles | 2 (22.2%) | 5 (33.3%) |
| 4 Vehicles | 0 (0.0%) | 0 (0.0%) |
| 5 or more Vehicles | 0 (0.0%) | 0 (0.0%) |
| Total | 9 (100.0%) | 15 (100.0%) |
Commute Time in Des Moines
The most frequently occuring commute durations in Des Moines are less than 5 minutes (12 commuters, 60.0%), 45 to 59 minutes (6 commuters, 30.0%), and 15 to 19 minutes (2 commuters, 10.0%).
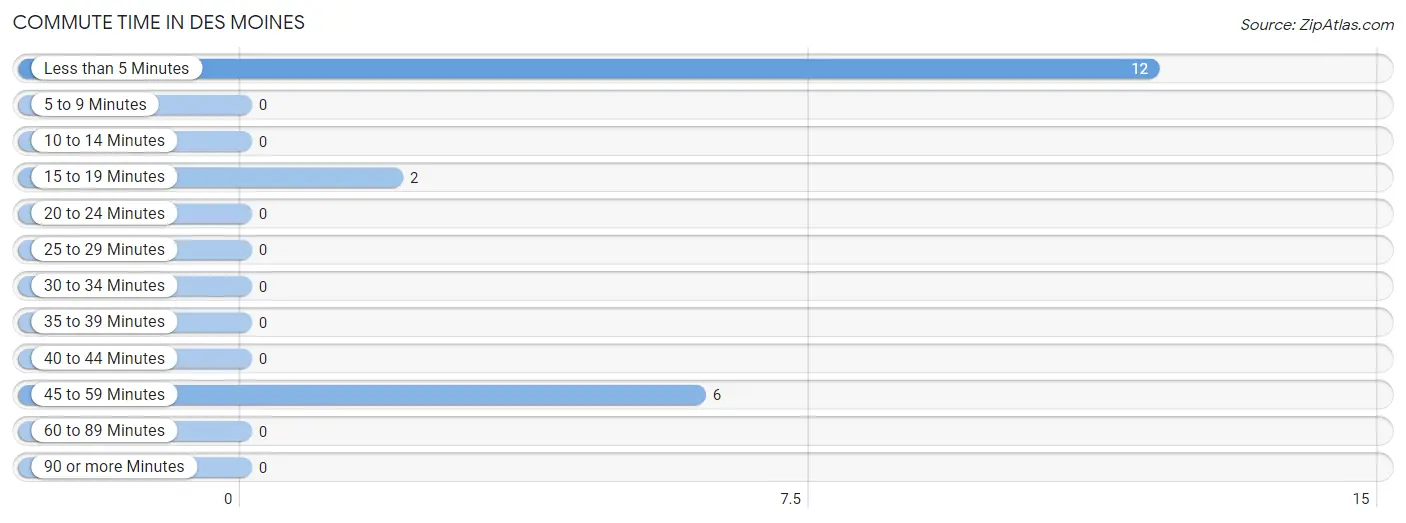
| Commute Time | # Commuters | % Commuters |
| Less than 5 Minutes | 12 | 60.0% |
| 5 to 9 Minutes | 0 | 0.0% |
| 10 to 14 Minutes | 0 | 0.0% |
| 15 to 19 Minutes | 2 | 10.0% |
| 20 to 24 Minutes | 0 | 0.0% |
| 25 to 29 Minutes | 0 | 0.0% |
| 30 to 34 Minutes | 0 | 0.0% |
| 35 to 39 Minutes | 0 | 0.0% |
| 40 to 44 Minutes | 0 | 0.0% |
| 45 to 59 Minutes | 6 | 30.0% |
| 60 to 89 Minutes | 0 | 0.0% |
| 90 or more Minutes | 0 | 0.0% |
Commute Time by Sex in Des Moines
The most common commute times in Des Moines are less than 5 minutes (7 commuters, 77.8%) for males and 45 to 59 minutes (6 commuters, 54.5%) for females.
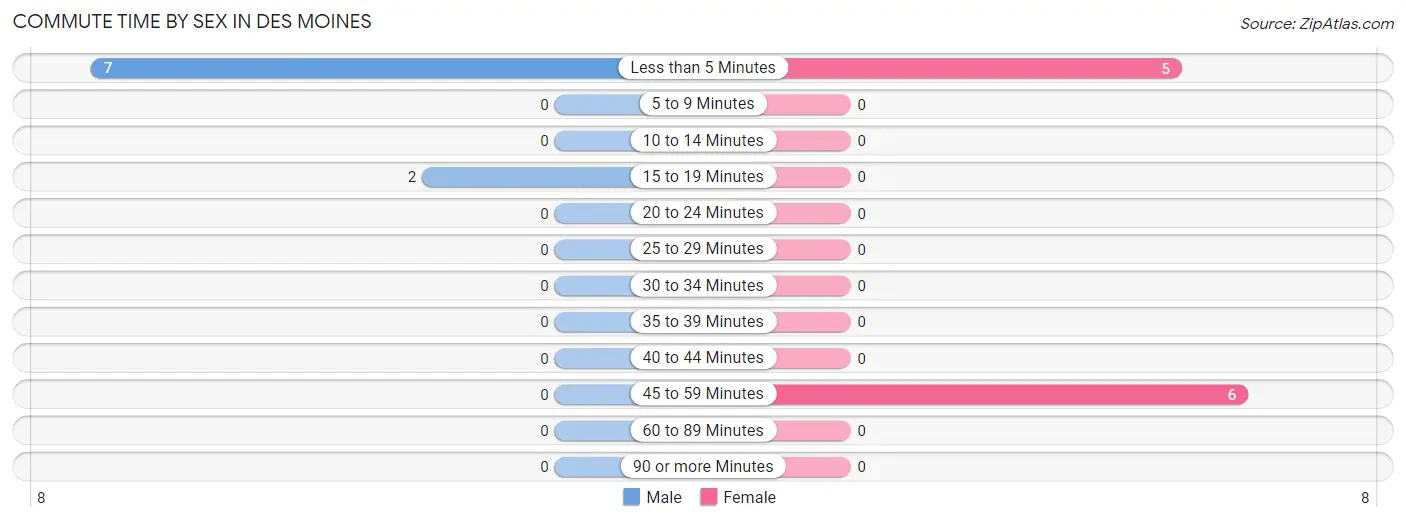
| Commute Time | Male | Female |
| Less than 5 Minutes | 7 (77.8%) | 5 (45.5%) |
| 5 to 9 Minutes | 0 (0.0%) | 0 (0.0%) |
| 10 to 14 Minutes | 0 (0.0%) | 0 (0.0%) |
| 15 to 19 Minutes | 2 (22.2%) | 0 (0.0%) |
| 20 to 24 Minutes | 0 (0.0%) | 0 (0.0%) |
| 25 to 29 Minutes | 0 (0.0%) | 0 (0.0%) |
| 30 to 34 Minutes | 0 (0.0%) | 0 (0.0%) |
| 35 to 39 Minutes | 0 (0.0%) | 0 (0.0%) |
| 40 to 44 Minutes | 0 (0.0%) | 0 (0.0%) |
| 45 to 59 Minutes | 0 (0.0%) | 6 (54.5%) |
| 60 to 89 Minutes | 0 (0.0%) | 0 (0.0%) |
| 90 or more Minutes | 0 (0.0%) | 0 (0.0%) |
Time of Departure to Work by Sex in Des Moines
The most frequent times of departure to work in Des Moines are 5:30 AM to 5:59 AM (4, 44.4%) for males and 6:30 AM to 6:59 AM (6, 54.5%) for females.
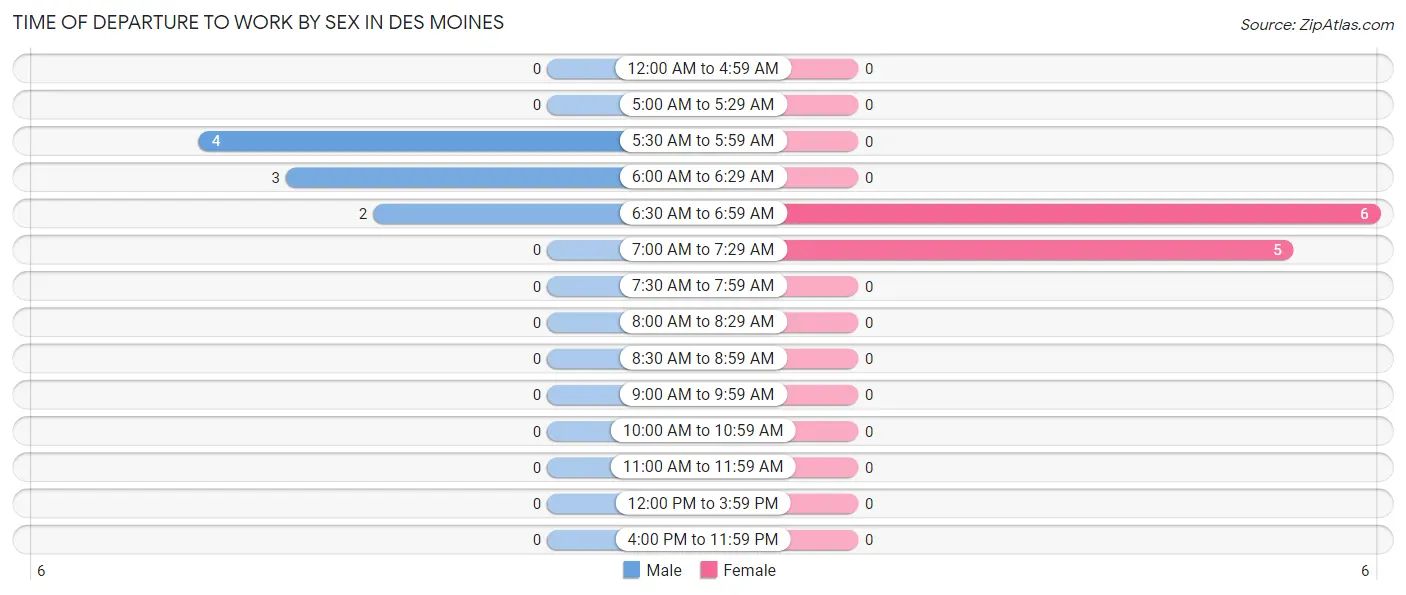
| Time of Departure | Male | Female |
| 12:00 AM to 4:59 AM | 0 (0.0%) | 0 (0.0%) |
| 5:00 AM to 5:29 AM | 0 (0.0%) | 0 (0.0%) |
| 5:30 AM to 5:59 AM | 4 (44.4%) | 0 (0.0%) |
| 6:00 AM to 6:29 AM | 3 (33.3%) | 0 (0.0%) |
| 6:30 AM to 6:59 AM | 2 (22.2%) | 6 (54.5%) |
| 7:00 AM to 7:29 AM | 0 (0.0%) | 5 (45.5%) |
| 7:30 AM to 7:59 AM | 0 (0.0%) | 0 (0.0%) |
| 8:00 AM to 8:29 AM | 0 (0.0%) | 0 (0.0%) |
| 8:30 AM to 8:59 AM | 0 (0.0%) | 0 (0.0%) |
| 9:00 AM to 9:59 AM | 0 (0.0%) | 0 (0.0%) |
| 10:00 AM to 10:59 AM | 0 (0.0%) | 0 (0.0%) |
| 11:00 AM to 11:59 AM | 0 (0.0%) | 0 (0.0%) |
| 12:00 PM to 3:59 PM | 0 (0.0%) | 0 (0.0%) |
| 4:00 PM to 11:59 PM | 0 (0.0%) | 0 (0.0%) |
| Total | 9 (100.0%) | 11 (100.0%) |
Housing Occupancy in Des Moines
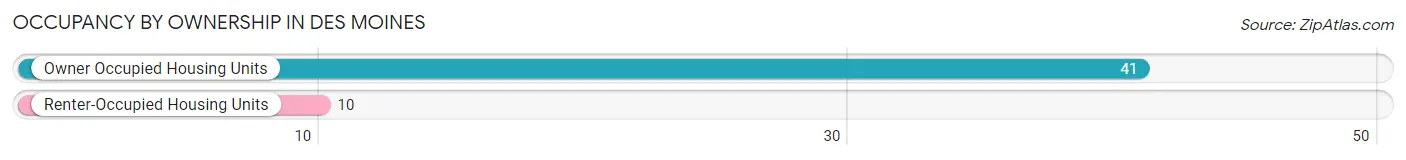
Occupancy by Ownership in Des Moines
Of the total 51 dwellings in Des Moines, owner-occupied units account for 41 (80.4%), while renter-occupied units make up 10 (19.6%).
| Occupancy | # Housing Units | % Housing Units |
| Owner Occupied Housing Units | 41 | 80.4% |
| Renter-Occupied Housing Units | 10 | 19.6% |
| Total Occupied Housing Units | 51 | 100.0% |
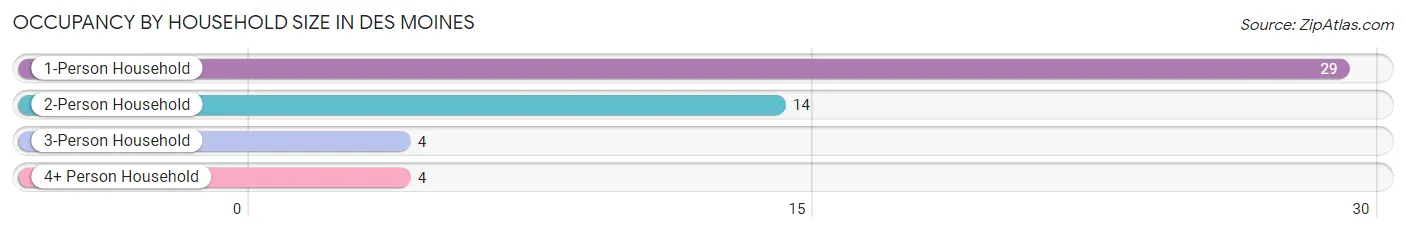
Occupancy by Household Size in Des Moines
| Household Size | # Housing Units | % Housing Units |
| 1-Person Household | 29 | 56.9% |
| 2-Person Household | 14 | 27.5% |
| 3-Person Household | 4 | 7.8% |
| 4+ Person Household | 4 | 7.8% |
| Total Housing Units | 51 | 100.0% |
Occupancy by Ownership by Household Size in Des Moines
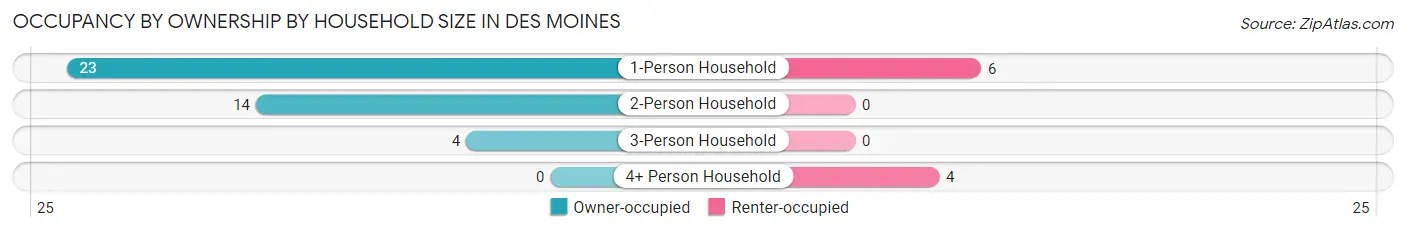
| Household Size | Owner-occupied | Renter-occupied |
| 1-Person Household | 23 (79.3%) | 6 (20.7%) |
| 2-Person Household | 14 (100.0%) | 0 (0.0%) |
| 3-Person Household | 4 (100.0%) | 0 (0.0%) |
| 4+ Person Household | 0 (0.0%) | 4 (100.0%) |
| Total Housing Units | 41 (80.4%) | 10 (19.6%) |
Occupancy by Educational Attainment in Des Moines
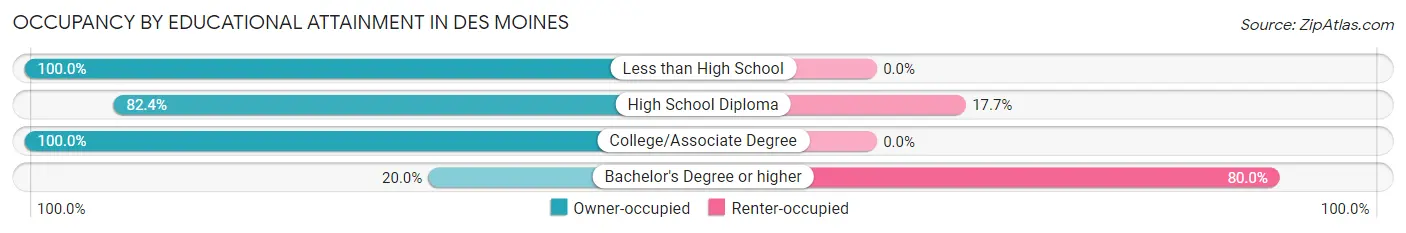
| Household Size | Owner-occupied | Renter-occupied |
| Less than High School | 2 (100.0%) | 0 (0.0%) |
| High School Diploma | 28 (82.4%) | 6 (17.6%) |
| College/Associate Degree | 10 (100.0%) | 0 (0.0%) |
| Bachelor's Degree or higher | 1 (20.0%) | 4 (80.0%) |
Occupancy by Age of Householder in Des Moines
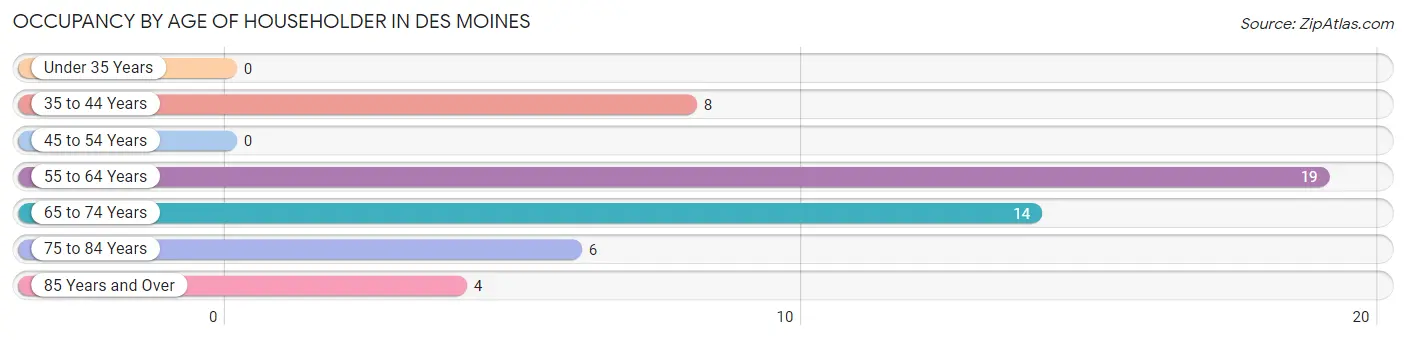
| Age Bracket | # Households | % Households |
| Under 35 Years | 0 | 0.0% |
| 35 to 44 Years | 8 | 15.7% |
| 45 to 54 Years | 0 | 0.0% |
| 55 to 64 Years | 19 | 37.2% |
| 65 to 74 Years | 14 | 27.5% |
| 75 to 84 Years | 6 | 11.8% |
| 85 Years and Over | 4 | 7.8% |
| Total | 51 | 100.0% |
Housing Finances in Des Moines
Median Income by Occupancy in Des Moines
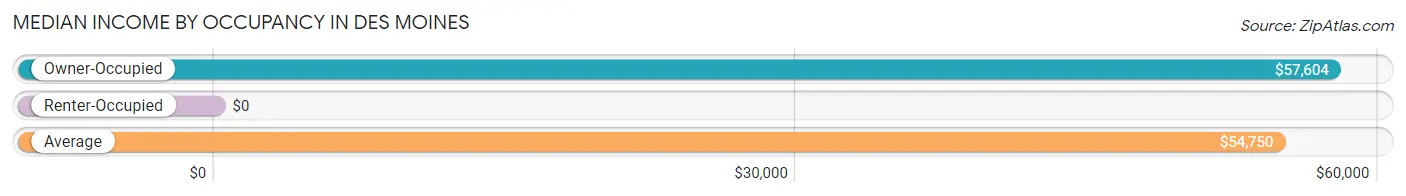
| Occupancy Type | # Households | Median Income |
| Owner-Occupied | 41 (80.4%) | $57,604 |
| Renter-Occupied | 10 (19.6%) | $0 |
| Average | 51 (100.0%) | $54,750 |
Occupancy by Householder Income Bracket in Des Moines
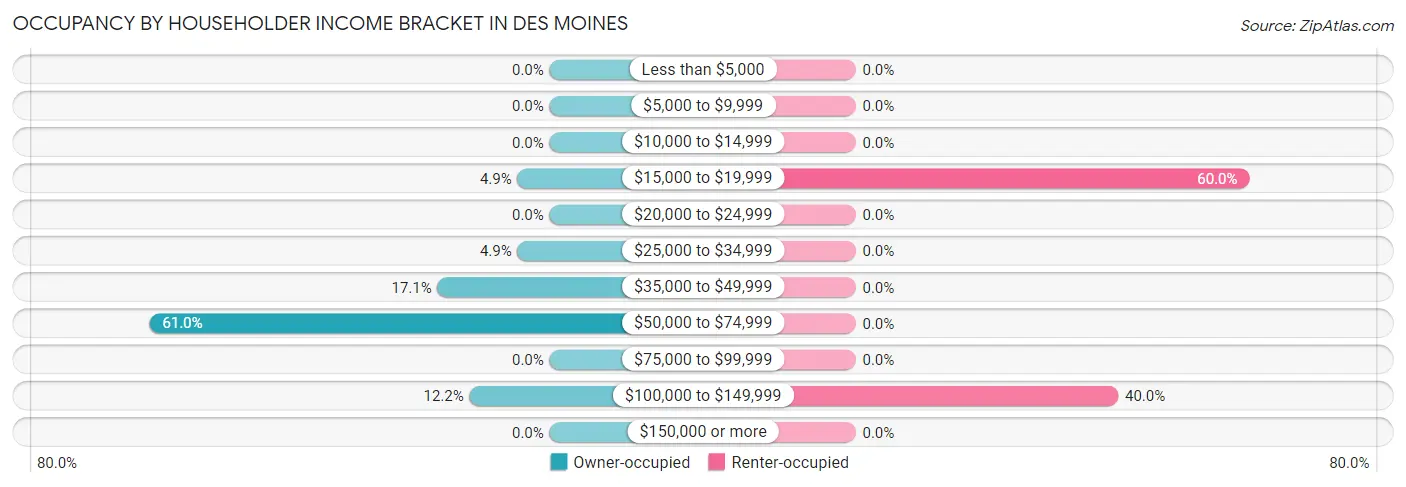
| Income Bracket | Owner-occupied | Renter-occupied |
| Less than $5,000 | 0 (0.0%) | 0 (0.0%) |
| $5,000 to $9,999 | 0 (0.0%) | 0 (0.0%) |
| $10,000 to $14,999 | 0 (0.0%) | 0 (0.0%) |
| $15,000 to $19,999 | 2 (4.9%) | 6 (60.0%) |
| $20,000 to $24,999 | 0 (0.0%) | 0 (0.0%) |
| $25,000 to $34,999 | 2 (4.9%) | 0 (0.0%) |
| $35,000 to $49,999 | 7 (17.1%) | 0 (0.0%) |
| $50,000 to $74,999 | 25 (61.0%) | 0 (0.0%) |
| $75,000 to $99,999 | 0 (0.0%) | 0 (0.0%) |
| $100,000 to $149,999 | 5 (12.2%) | 4 (40.0%) |
| $150,000 or more | 0 (0.0%) | 0 (0.0%) |
| Total | 41 (100.0%) | 10 (100.0%) |
Monthly Housing Cost Tiers in Des Moines
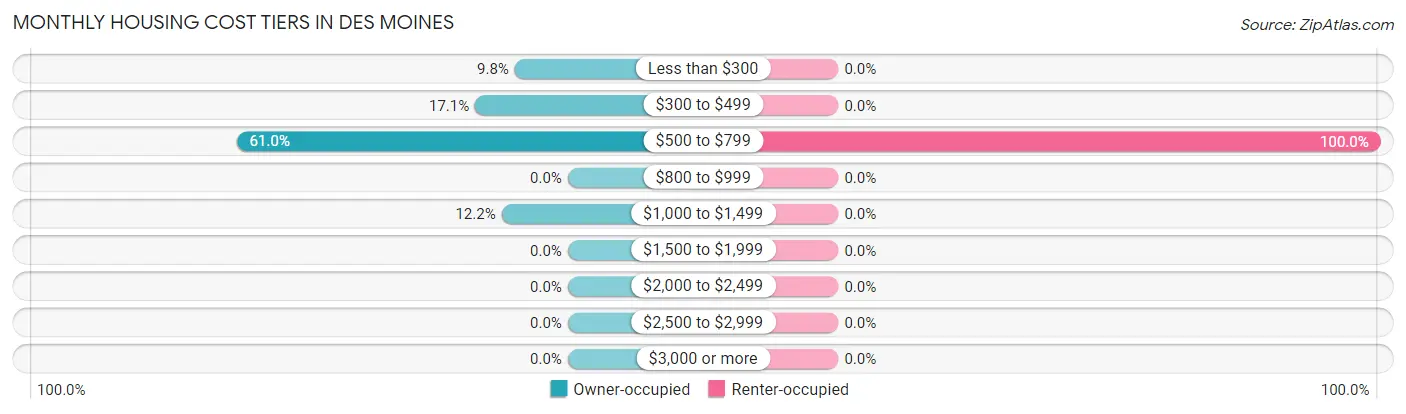
| Monthly Cost | Owner-occupied | Renter-occupied |
| Less than $300 | 4 (9.8%) | 0 (0.0%) |
| $300 to $499 | 7 (17.1%) | 0 (0.0%) |
| $500 to $799 | 25 (61.0%) | 10 (100.0%) |
| $800 to $999 | 0 (0.0%) | 0 (0.0%) |
| $1,000 to $1,499 | 5 (12.2%) | 0 (0.0%) |
| $1,500 to $1,999 | 0 (0.0%) | 0 (0.0%) |
| $2,000 to $2,499 | 0 (0.0%) | 0 (0.0%) |
| $2,500 to $2,999 | 0 (0.0%) | 0 (0.0%) |
| $3,000 or more | 0 (0.0%) | 0 (0.0%) |
| Total | 41 (100.0%) | 10 (100.0%) |
Physical Housing Characteristics in Des Moines
Housing Structures in Des Moines
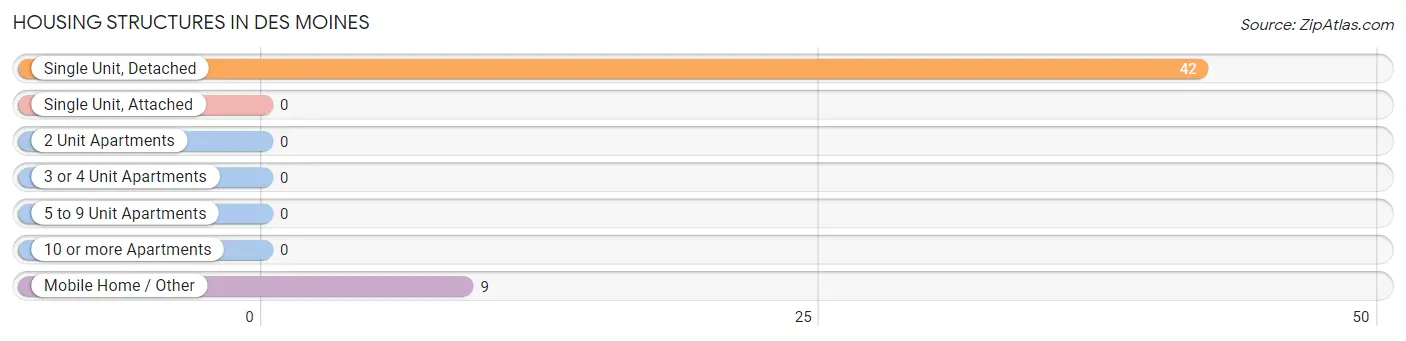
| Structure Type | # Housing Units | % Housing Units |
| Single Unit, Detached | 42 | 82.4% |
| Single Unit, Attached | 0 | 0.0% |
| 2 Unit Apartments | 0 | 0.0% |
| 3 or 4 Unit Apartments | 0 | 0.0% |
| 5 to 9 Unit Apartments | 0 | 0.0% |
| 10 or more Apartments | 0 | 0.0% |
| Mobile Home / Other | 9 | 17.6% |
| Total | 51 | 100.0% |
Housing Structures by Occupancy in Des Moines
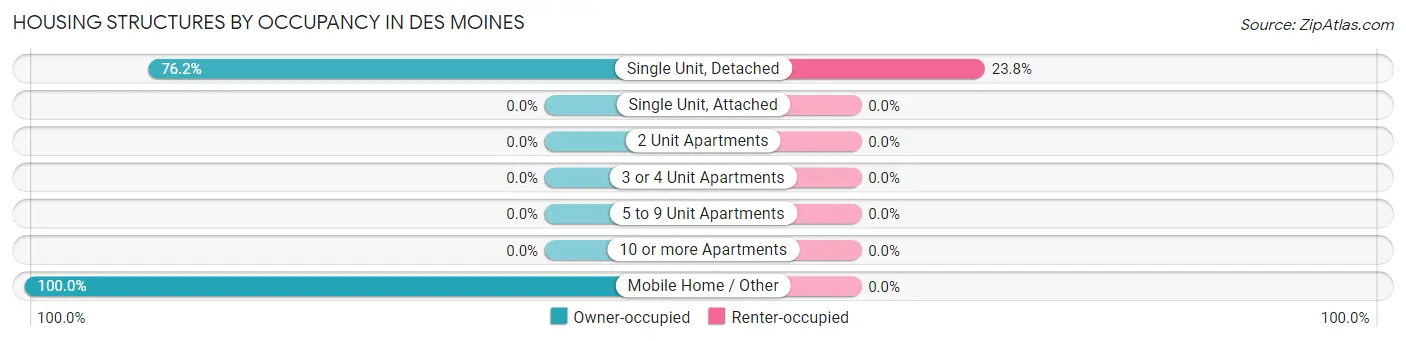
| Structure Type | Owner-occupied | Renter-occupied |
| Single Unit, Detached | 32 (76.2%) | 10 (23.8%) |
| Single Unit, Attached | 0 (0.0%) | 0 (0.0%) |
| 2 Unit Apartments | 0 (0.0%) | 0 (0.0%) |
| 3 or 4 Unit Apartments | 0 (0.0%) | 0 (0.0%) |
| 5 to 9 Unit Apartments | 0 (0.0%) | 0 (0.0%) |
| 10 or more Apartments | 0 (0.0%) | 0 (0.0%) |
| Mobile Home / Other | 9 (100.0%) | 0 (0.0%) |
| Total | 41 (80.4%) | 10 (19.6%) |
Housing Structures by Number of Rooms in Des Moines
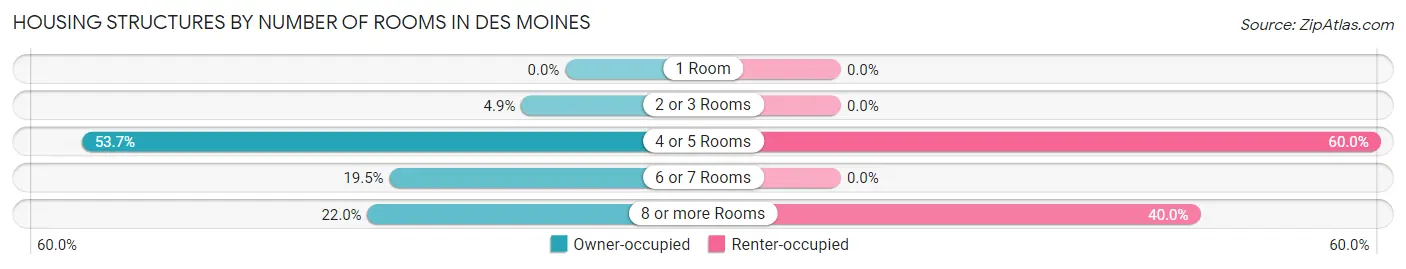
| Number of Rooms | Owner-occupied | Renter-occupied |
| 1 Room | 0 (0.0%) | 0 (0.0%) |
| 2 or 3 Rooms | 2 (4.9%) | 0 (0.0%) |
| 4 or 5 Rooms | 22 (53.7%) | 6 (60.0%) |
| 6 or 7 Rooms | 8 (19.5%) | 0 (0.0%) |
| 8 or more Rooms | 9 (22.0%) | 4 (40.0%) |
| Total | 41 (100.0%) | 10 (100.0%) |
Housing Structure by Heating Type in Des Moines
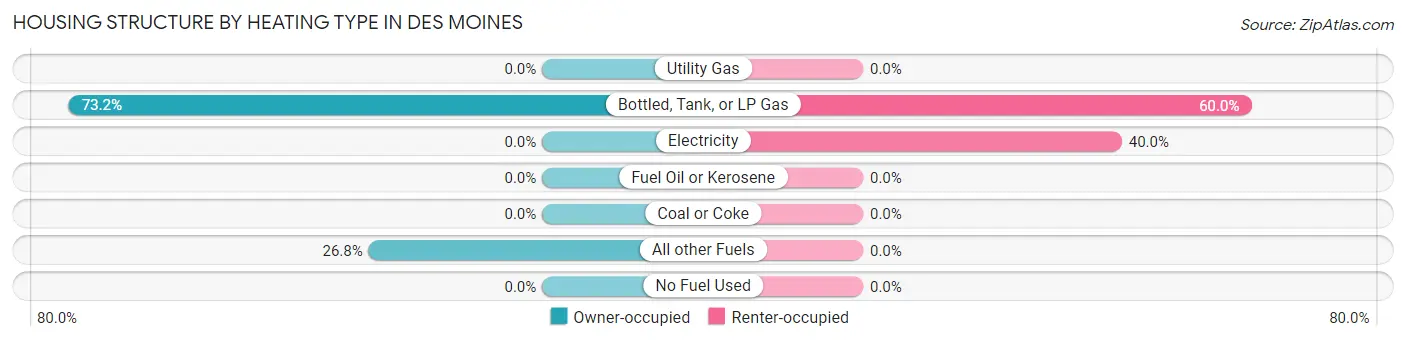
| Heating Type | Owner-occupied | Renter-occupied |
| Utility Gas | 0 (0.0%) | 0 (0.0%) |
| Bottled, Tank, or LP Gas | 30 (73.2%) | 6 (60.0%) |
| Electricity | 0 (0.0%) | 4 (40.0%) |
| Fuel Oil or Kerosene | 0 (0.0%) | 0 (0.0%) |
| Coal or Coke | 0 (0.0%) | 0 (0.0%) |
| All other Fuels | 11 (26.8%) | 0 (0.0%) |
| No Fuel Used | 0 (0.0%) | 0 (0.0%) |
| Total | 41 (100.0%) | 10 (100.0%) |
Household Vehicle Usage in Des Moines
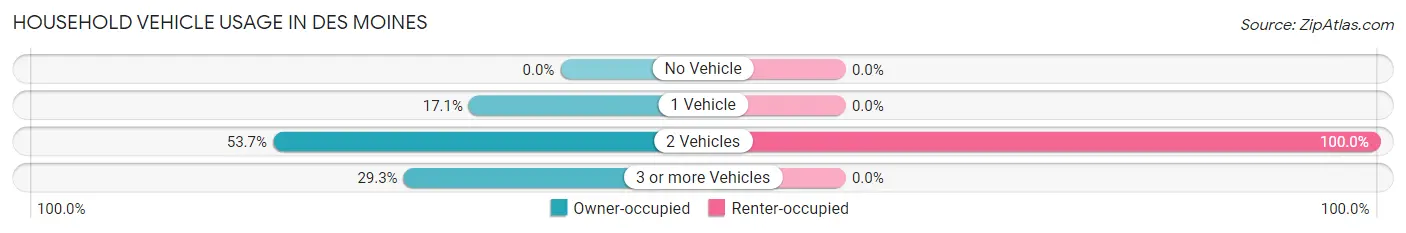
| Vehicles per Household | Owner-occupied | Renter-occupied |
| No Vehicle | 0 (0.0%) | 0 (0.0%) |
| 1 Vehicle | 7 (17.1%) | 0 (0.0%) |
| 2 Vehicles | 22 (53.7%) | 10 (100.0%) |
| 3 or more Vehicles | 12 (29.3%) | 0 (0.0%) |
| Total | 41 (100.0%) | 10 (100.0%) |
Real Estate & Mortgages in Des Moines
Real Estate and Mortgage Overview in Des Moines
| Characteristic | Without Mortgage | With Mortgage |
| Housing Units | 36 | 5 |
| Median Property Value | - | - |
| Median Household Income | $58,125 | $0 |
| Monthly Housing Costs | $541 | $0 |
| Real Estate Taxes | $350 | $0 |
Property Value by Mortgage Status in Des Moines
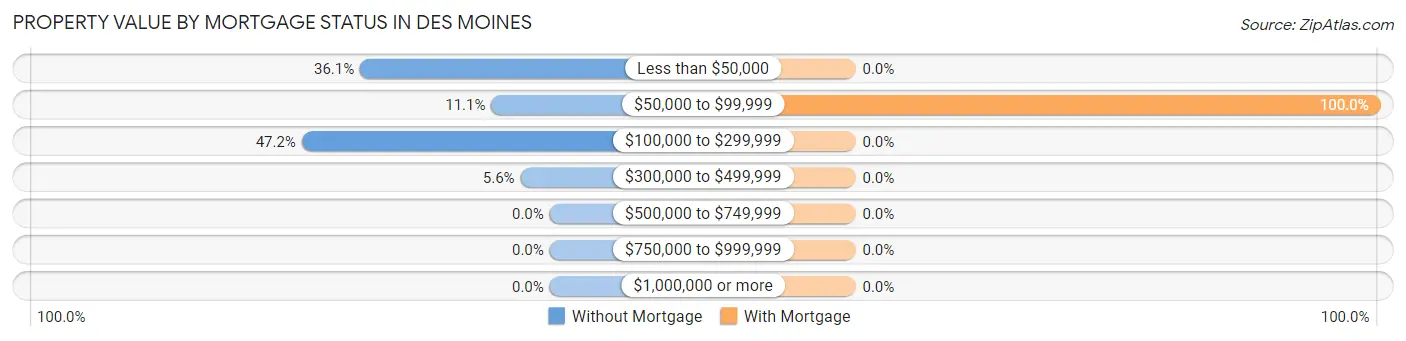
| Property Value | Without Mortgage | With Mortgage |
| Less than $50,000 | 13 (36.1%) | 0 (0.0%) |
| $50,000 to $99,999 | 4 (11.1%) | 5 (100.0%) |
| $100,000 to $299,999 | 17 (47.2%) | 0 (0.0%) |
| $300,000 to $499,999 | 2 (5.6%) | 0 (0.0%) |
| $500,000 to $749,999 | 0 (0.0%) | 0 (0.0%) |
| $750,000 to $999,999 | 0 (0.0%) | 0 (0.0%) |
| $1,000,000 or more | 0 (0.0%) | 0 (0.0%) |
| Total | 36 (100.0%) | 5 (100.0%) |
Household Income by Mortgage Status in Des Moines
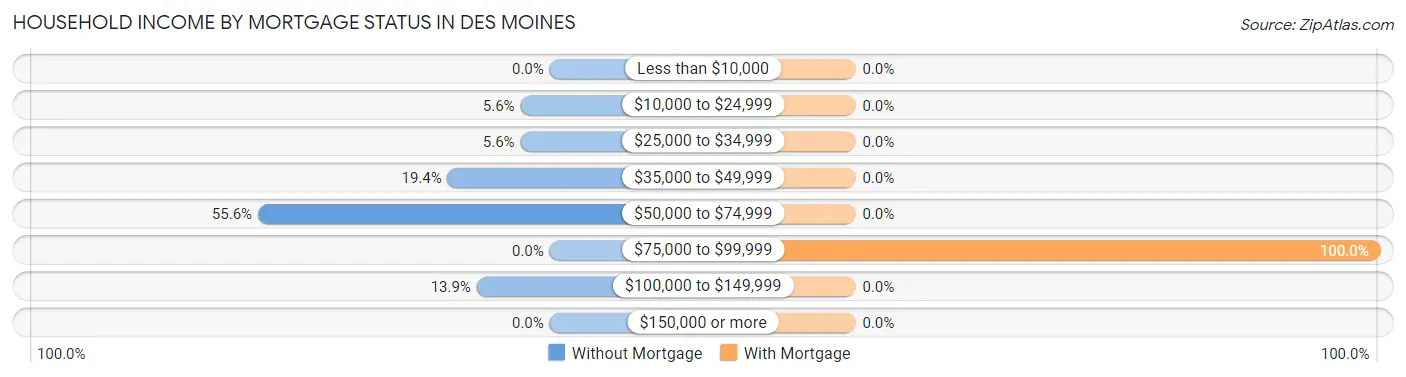
| Household Income | Without Mortgage | With Mortgage |
| Less than $10,000 | 0 (0.0%) | 0 (0.0%) |
| $10,000 to $24,999 | 2 (5.6%) | 0 (0.0%) |
| $25,000 to $34,999 | 2 (5.6%) | 0 (0.0%) |
| $35,000 to $49,999 | 7 (19.4%) | 0 (0.0%) |
| $50,000 to $74,999 | 20 (55.6%) | 0 (0.0%) |
| $75,000 to $99,999 | 0 (0.0%) | 5 (100.0%) |
| $100,000 to $149,999 | 5 (13.9%) | 0 (0.0%) |
| $150,000 or more | 0 (0.0%) | 0 (0.0%) |
| Total | 36 (100.0%) | 5 (100.0%) |
Property Value to Household Income Ratio in Des Moines
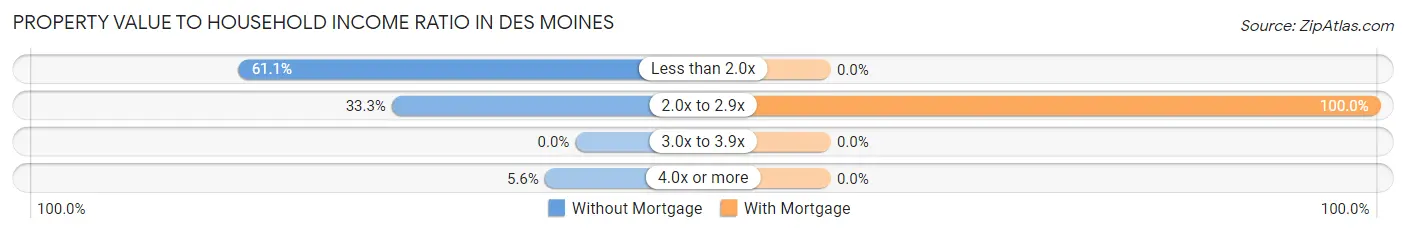
| Value-to-Income Ratio | Without Mortgage | With Mortgage |
| Less than 2.0x | 22 (61.1%) | 0 (0.0%) |
| 2.0x to 2.9x | 12 (33.3%) | 5 (100.0%) |
| 3.0x to 3.9x | 0 (0.0%) | 0 (0.0%) |
| 4.0x or more | 2 (5.6%) | 0 (0.0%) |
| Total | 36 (100.0%) | 5 (100.0%) |
Real Estate Taxes by Mortgage Status in Des Moines
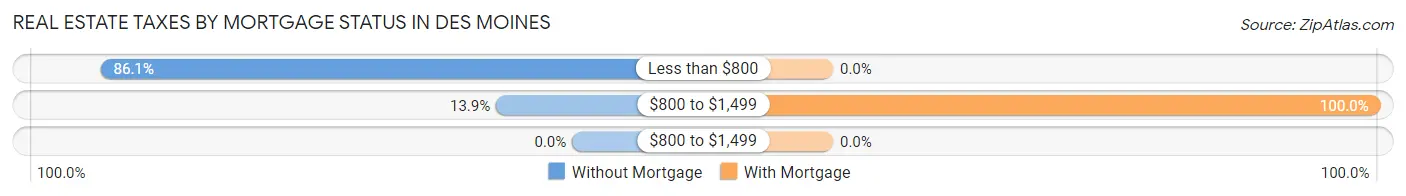
| Property Taxes | Without Mortgage | With Mortgage |
| Less than $800 | 31 (86.1%) | 0 (0.0%) |
| $800 to $1,499 | 5 (13.9%) | 5 (100.0%) |
| $800 to $1,499 | 0 (0.0%) | 0 (0.0%) |
| Total | 36 (100.0%) | 5 (100.0%) |
Health & Disability in Des Moines
Health Insurance Coverage by Age in Des Moines
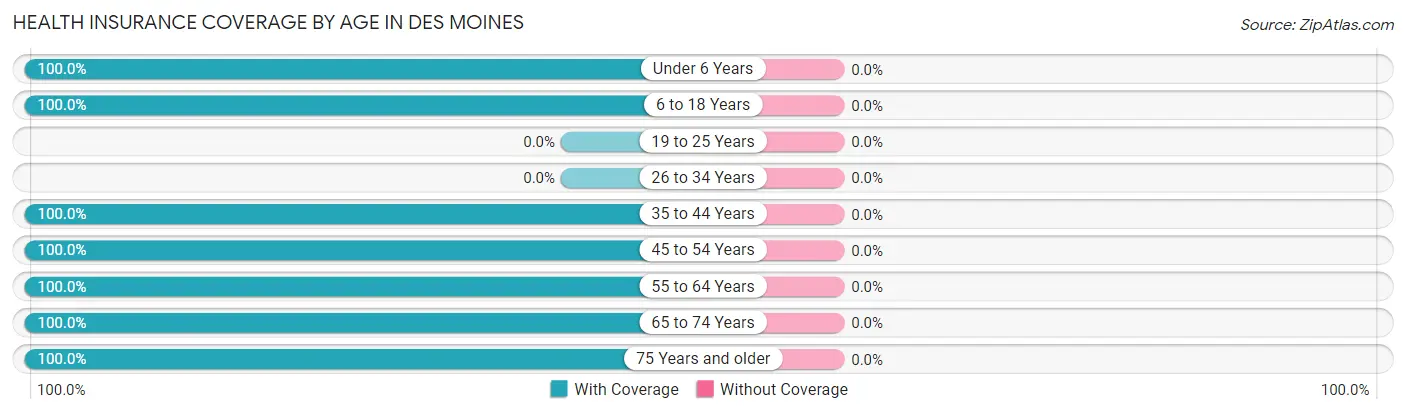
| Age Bracket | With Coverage | Without Coverage |
| Under 6 Years | 9 (100.0%) | 0 (0.0%) |
| 6 to 18 Years | 18 (100.0%) | 0 (0.0%) |
| 19 to 25 Years | 0 (0.0%) | 0 (0.0%) |
| 26 to 34 Years | 0 (0.0%) | 0 (0.0%) |
| 35 to 44 Years | 11 (100.0%) | 0 (0.0%) |
| 45 to 54 Years | 6 (100.0%) | 0 (0.0%) |
| 55 to 64 Years | 34 (100.0%) | 0 (0.0%) |
| 65 to 74 Years | 14 (100.0%) | 0 (0.0%) |
| 75 Years and older | 11 (100.0%) | 0 (0.0%) |
| Total | 103 (100.0%) | 0 (0.0%) |
Health Insurance Coverage by Citizenship Status in Des Moines
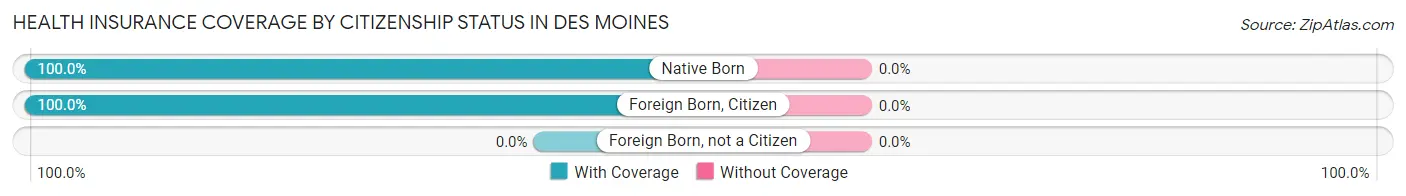
| Citizenship Status | With Coverage | Without Coverage |
| Native Born | 9 (100.0%) | 0 (0.0%) |
| Foreign Born, Citizen | 18 (100.0%) | 0 (0.0%) |
| Foreign Born, not a Citizen | 0 (0.0%) | 0 (0.0%) |
Health Insurance Coverage by Household Income in Des Moines
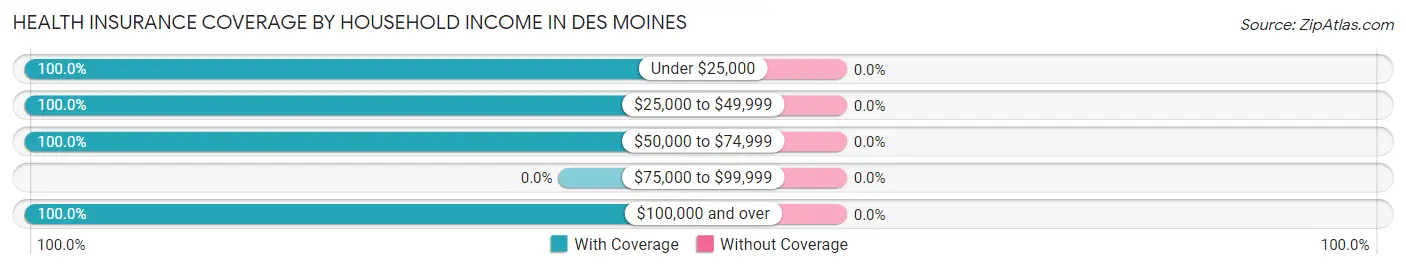
| Household Income | With Coverage | Without Coverage |
| Under $25,000 | 8 (100.0%) | 0 (0.0%) |
| $25,000 to $49,999 | 9 (100.0%) | 0 (0.0%) |
| $50,000 to $74,999 | 47 (100.0%) | 0 (0.0%) |
| $75,000 to $99,999 | 0 (0.0%) | 0 (0.0%) |
| $100,000 and over | 39 (100.0%) | 0 (0.0%) |
Public vs Private Health Insurance Coverage by Age in Des Moines
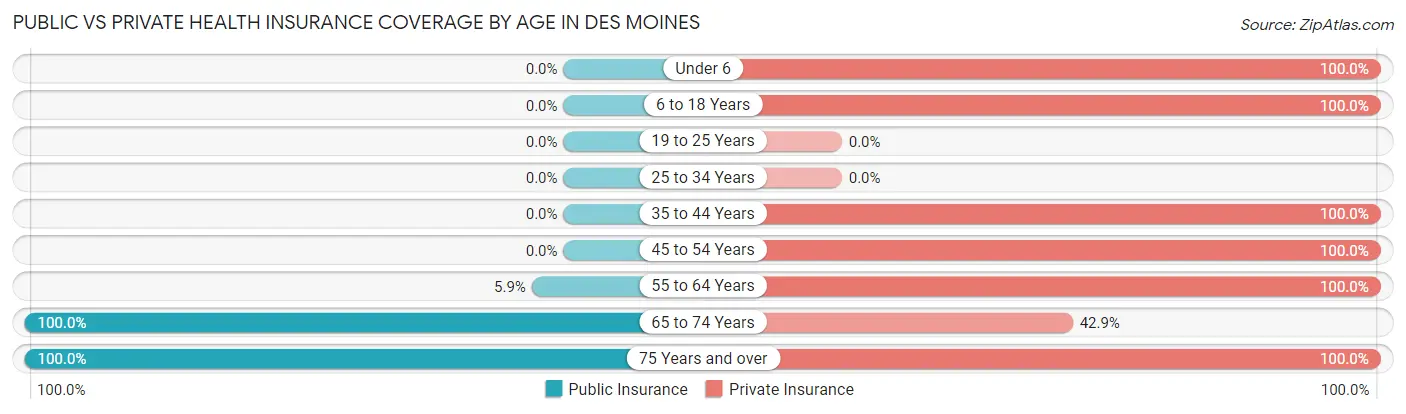
| Age Bracket | Public Insurance | Private Insurance |
| Under 6 | 0 (0.0%) | 9 (100.0%) |
| 6 to 18 Years | 0 (0.0%) | 18 (100.0%) |
| 19 to 25 Years | 0 (0.0%) | 0 (0.0%) |
| 25 to 34 Years | 0 (0.0%) | 0 (0.0%) |
| 35 to 44 Years | 0 (0.0%) | 11 (100.0%) |
| 45 to 54 Years | 0 (0.0%) | 6 (100.0%) |
| 55 to 64 Years | 2 (5.9%) | 34 (100.0%) |
| 65 to 74 Years | 14 (100.0%) | 6 (42.9%) |
| 75 Years and over | 11 (100.0%) | 11 (100.0%) |
| Total | 27 (26.2%) | 95 (92.2%) |
Disability Status by Sex by Age in Des Moines
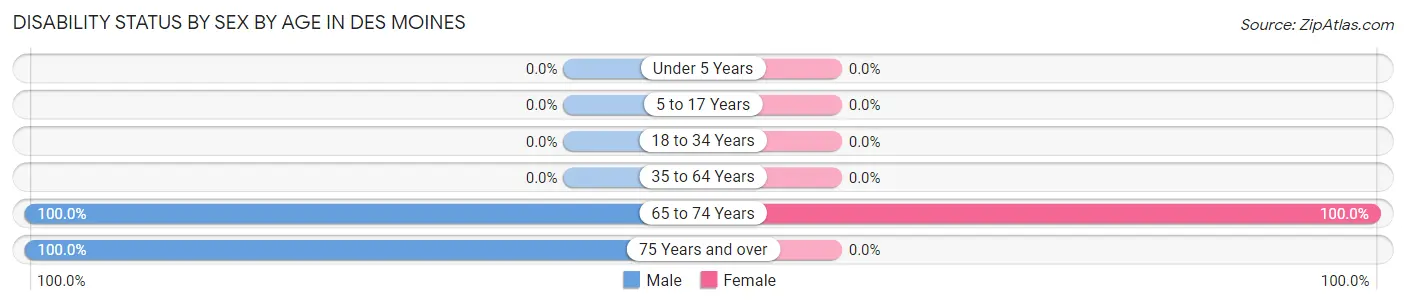
| Age Bracket | Male | Female |
| Under 5 Years | 0 (0.0%) | 0 (0.0%) |
| 5 to 17 Years | 0 (0.0%) | 0 (0.0%) |
| 18 to 34 Years | 0 (0.0%) | 0 (0.0%) |
| 35 to 64 Years | 0 (0.0%) | 0 (0.0%) |
| 65 to 74 Years | 2 (100.0%) | 12 (100.0%) |
| 75 Years and over | 10 (100.0%) | 0 (0.0%) |
Disability Class by Sex by Age in Des Moines
Disability Class: Hearing Difficulty
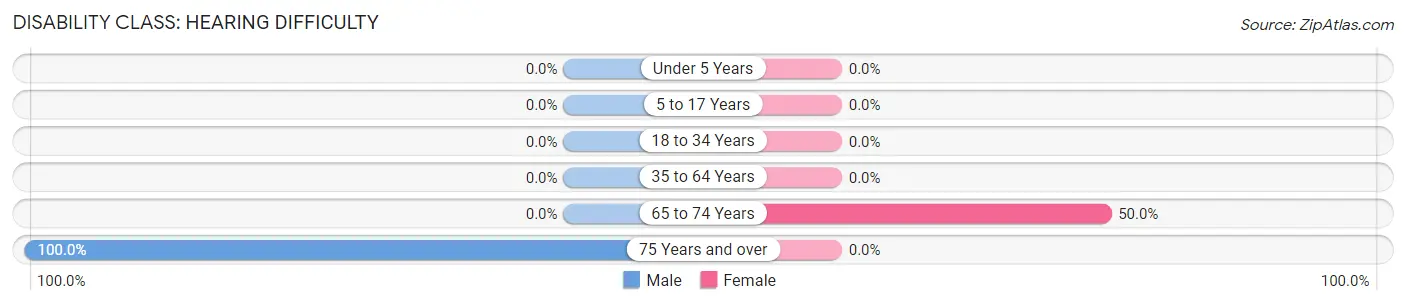
| Age Bracket | Male | Female |
| Under 5 Years | 0 (0.0%) | 0 (0.0%) |
| 5 to 17 Years | 0 (0.0%) | 0 (0.0%) |
| 18 to 34 Years | 0 (0.0%) | 0 (0.0%) |
| 35 to 64 Years | 0 (0.0%) | 0 (0.0%) |
| 65 to 74 Years | 0 (0.0%) | 6 (50.0%) |
| 75 Years and over | 10 (100.0%) | 0 (0.0%) |
Disability Class: Vision Difficulty
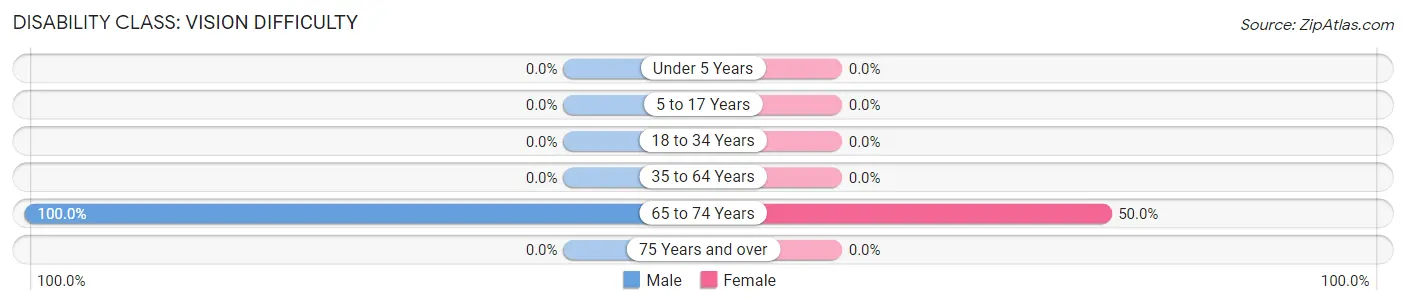
| Age Bracket | Male | Female |
| Under 5 Years | 0 (0.0%) | 0 (0.0%) |
| 5 to 17 Years | 0 (0.0%) | 0 (0.0%) |
| 18 to 34 Years | 0 (0.0%) | 0 (0.0%) |
| 35 to 64 Years | 0 (0.0%) | 0 (0.0%) |
| 65 to 74 Years | 2 (100.0%) | 6 (50.0%) |
| 75 Years and over | 0 (0.0%) | 0 (0.0%) |
Disability Class: Cognitive Difficulty
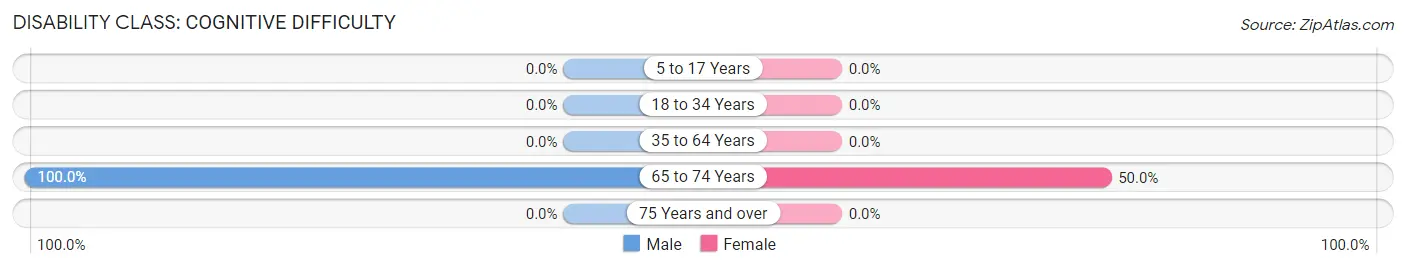
| Age Bracket | Male | Female |
| 5 to 17 Years | 0 (0.0%) | 0 (0.0%) |
| 18 to 34 Years | 0 (0.0%) | 0 (0.0%) |
| 35 to 64 Years | 0 (0.0%) | 0 (0.0%) |
| 65 to 74 Years | 2 (100.0%) | 6 (50.0%) |
| 75 Years and over | 0 (0.0%) | 0 (0.0%) |
Disability Class: Ambulatory Difficulty
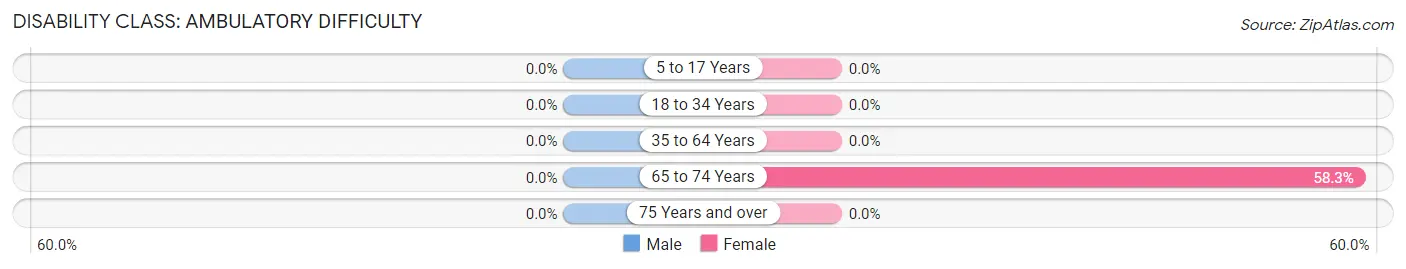
| Age Bracket | Male | Female |
| 5 to 17 Years | 0 (0.0%) | 0 (0.0%) |
| 18 to 34 Years | 0 (0.0%) | 0 (0.0%) |
| 35 to 64 Years | 0 (0.0%) | 0 (0.0%) |
| 65 to 74 Years | 0 (0.0%) | 7 (58.3%) |
| 75 Years and over | 0 (0.0%) | 0 (0.0%) |
Disability Class: Self-Care Difficulty
| Age Bracket | Male | Female |
| 5 to 17 Years | 0 (0.0%) | 0 (0.0%) |
| 18 to 34 Years | 0 (0.0%) | 0 (0.0%) |
| 35 to 64 Years | 0 (0.0%) | 0 (0.0%) |
| 65 to 74 Years | 0 (0.0%) | 0 (0.0%) |
| 75 Years and over | 0 (0.0%) | 0 (0.0%) |
Technology Access in Des Moines
Computing Device Access in Des Moines
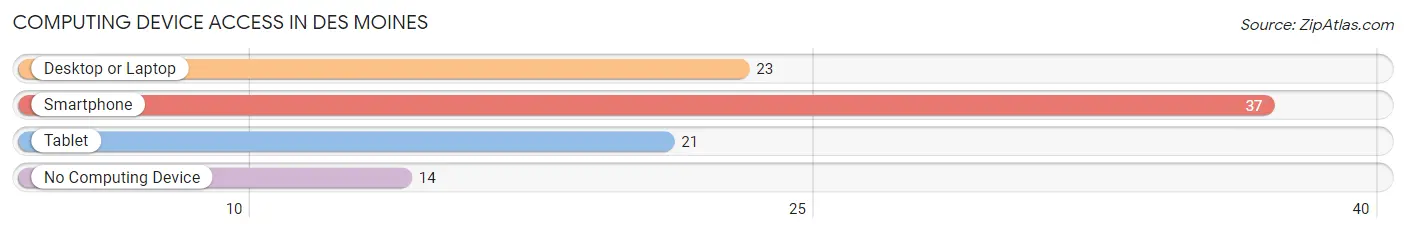
| Device Type | # Households | % Households |
| Desktop or Laptop | 23 | 45.1% |
| Smartphone | 37 | 72.6% |
| Tablet | 21 | 41.2% |
| No Computing Device | 14 | 27.5% |
| Total | 51 | 100.0% |
Internet Access in Des Moines
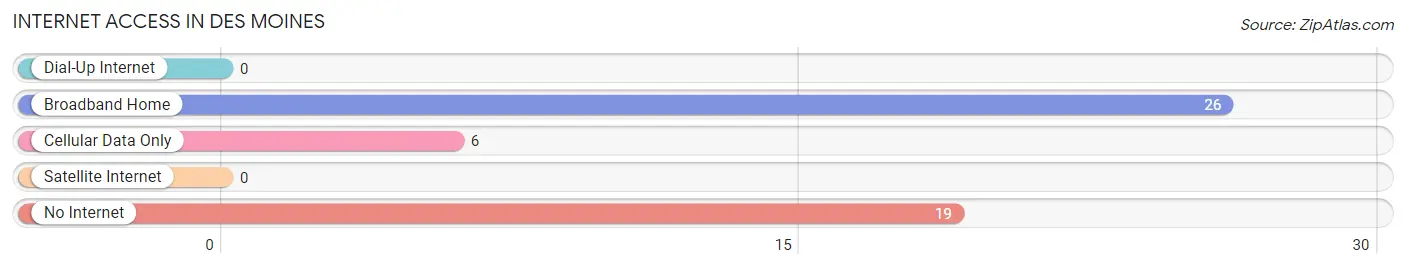
| Internet Type | # Households | % Households |
| Dial-Up Internet | 0 | 0.0% |
| Broadband Home | 26 | 51.0% |
| Cellular Data Only | 6 | 11.8% |
| Satellite Internet | 0 | 0.0% |
| No Internet | 19 | 37.2% |
| Total | 51 | 100.0% |
Des Moines Summary
Des Moines, NM is a small town located in the state of New Mexico. It is situated in the southeastern corner of the state, near the border with Texas. The town has a population of approximately 1,000 people and is part of the Chaves County. Des Moines is a rural community with a rich history and culture.
Geography
Des Moines is located in the southeastern corner of New Mexico, near the border with Texas. The town is situated in the Chaves County, and is surrounded by the towns of Roswell, Artesia, and Carlsbad. The town is located in the Chihuahuan Desert, and is characterized by its dry climate and sparse vegetation. The town is situated at an elevation of 4,000 feet, and is located in the foothills of the Sacramento Mountains. The town is located near the Pecos River, which provides a source of water for the town.
History
Des Moines was founded in 1881 by a group of settlers from Texas. The town was named after the Des Moines River in Iowa, and was originally intended to be a trading post for the local Native American tribes. The town quickly grew, and by the early 1900s, it had become a bustling center of commerce and industry. The town was home to several businesses, including a hotel, a general store, and a saloon.
In the early 1900s, the town was also home to a large number of sheep and cattle ranches. The town was also home to a large number of miners, who worked in the nearby mines. The town was also home to a large number of farmers, who grew crops such as corn, wheat, and alfalfa.
In the late 1900s, the town began to decline in population, as many of the businesses and ranches closed down. The town was also affected by the Great Depression, and many of the residents left in search of work. In the late 1990s, the town began to experience a resurgence, as new businesses and industries began to move into the area.
Economy
The economy of Des Moines is largely based on agriculture and tourism. The town is home to several large farms, which produce a variety of crops, including corn, wheat, and alfalfa. The town is also home to several ranches, which raise cattle and sheep. The town is also home to several small businesses, including restaurants, shops, and hotels.
The town is also home to several tourist attractions, including the Des Moines Museum, the Des Moines Art Gallery, and the Des Moines Zoo. The town is also home to several festivals and events, such as the Des Moines Music Festival and the Des Moines Rodeo.
Demographics
As of the 2010 census, the population of Des Moines was 1,000. The town is predominantly white, with a small Hispanic population. The median age of the population is 37. The median household income is $35,000, and the median home value is $90,000. The town has a high rate of poverty, with approximately 25% of the population living below the poverty line.
Conclusion
Des Moines, NM is a small town located in the southeastern corner of New Mexico. The town has a rich history and culture, and is home to a variety of businesses and industries. The town is predominantly white, with a small Hispanic population. The town is largely based on agriculture and tourism, and is home to several tourist attractions. The town has a high rate of poverty, with approximately 25% of the population living below the poverty line.
Common Questions
What is Per Capita Income in Des Moines?
Per Capita income in Des Moines is $31,202.
What is the Median Household income in Des Moines?
Median Household Income in Des Moines is $54,750.
What is Inequality or Gini Index in Des Moines?
Inequality or Gini Index in Des Moines is 0.30.
What is the Total Population of Des Moines?
Total Population of Des Moines is 103.
What is the Total Male Population of Des Moines?
Total Male Population of Des Moines is 67.
What is the Total Female Population of Des Moines?
Total Female Population of Des Moines is 36.
What is the Ratio of Males per 100 Females in Des Moines?
There are 186.11 Males per 100 Females in Des Moines.
What is the Ratio of Females per 100 Males in Des Moines?
There are 53.73 Females per 100 Males in Des Moines.
What is the Median Population Age in Des Moines?
Median Population Age in Des Moines is 60.5 Years.
What is the Average Family Size in Des Moines
Average Family Size in Des Moines is 3.4 People.
What is the Average Household Size in Des Moines
Average Household Size in Des Moines is 2.0 People.
How Large is the Labor Force in Des Moines?
There are 24 People in the Labor Forcein in Des Moines.
What is the Percentage of People in the Labor Force in Des Moines?
27.9% of People are in the Labor Force in Des Moines.