Adelino, NM Map & Demographics
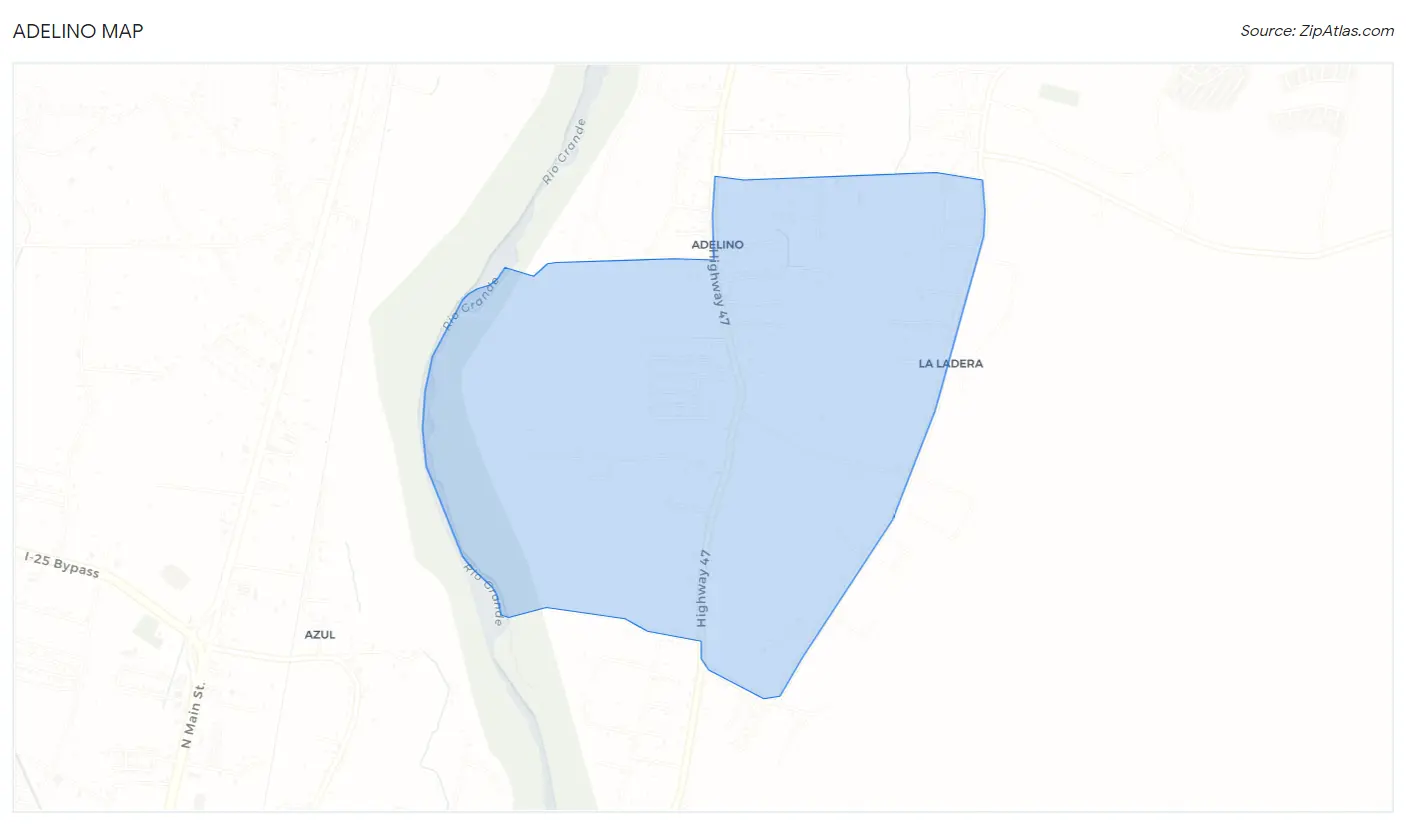
Adelino Map
Adelino Overview
$29,445
PER CAPITA INCOME
$48,892
AVG HOUSEHOLD INCOME
0.43
INEQUALITY / GINI INDEX
790
TOTAL POPULATION
445
MALE POPULATION
345
FEMALE POPULATION
128.99
MALES / 100 FEMALES
77.53
FEMALES / 100 MALES
36.9
MEDIAN AGE
3.5
AVG FAMILY SIZE
2.3
AVG HOUSEHOLD SIZE
392
LABOR FORCE [ PEOPLE ]
54.4%
PERCENT IN LABOR FORCE
Income in Adelino
Income Overview in Adelino
| Characteristic | Number | Measure |
| Per Capita Income | 790 | $29,445 |
| Median Family Income | 175 | $0 |
| Mean Family Income | 175 | $79,641 |
| Median Household Income | 343 | $48,892 |
| Mean Household Income | 343 | $61,131 |
| Income Deficit | 175 | $0 |
| Wage / Income Gap (%) | 790 | 0.00% |
| Wage / Income Gap ($) | 790 | 100.00¢ per $1 |
| Gini / Inequality Index | 790 | 0.43 |
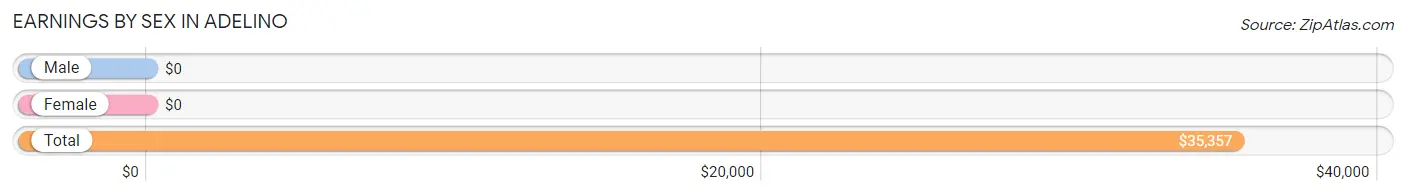
Earnings by Sex in Adelino
| Sex | Number | Average Earnings |
| Male | 198 (46.3%) | $0 |
| Female | 230 (53.7%) | $0 |
| Total | 428 (100.0%) | $35,357 |
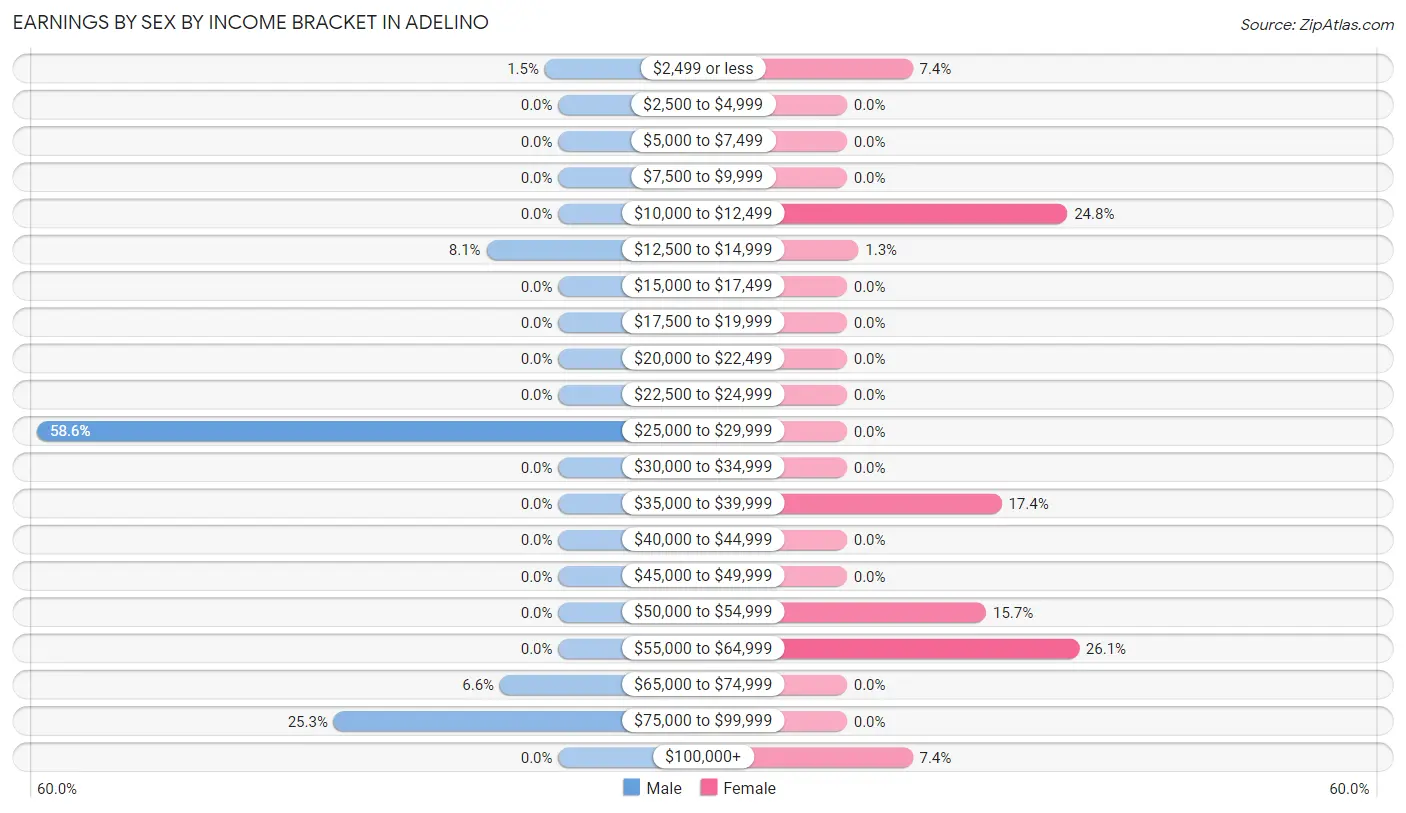
Earnings by Sex by Income Bracket in Adelino
The most common earnings brackets in Adelino are $25,000 to $29,999 for men (116 | 58.6%) and $55,000 to $64,999 for women (60 | 26.1%).
| Income | Male | Female |
| $2,499 or less | 3 (1.5%) | 17 (7.4%) |
| $2,500 to $4,999 | 0 (0.0%) | 0 (0.0%) |
| $5,000 to $7,499 | 0 (0.0%) | 0 (0.0%) |
| $7,500 to $9,999 | 0 (0.0%) | 0 (0.0%) |
| $10,000 to $12,499 | 0 (0.0%) | 57 (24.8%) |
| $12,500 to $14,999 | 16 (8.1%) | 3 (1.3%) |
| $15,000 to $17,499 | 0 (0.0%) | 0 (0.0%) |
| $17,500 to $19,999 | 0 (0.0%) | 0 (0.0%) |
| $20,000 to $22,499 | 0 (0.0%) | 0 (0.0%) |
| $22,500 to $24,999 | 0 (0.0%) | 0 (0.0%) |
| $25,000 to $29,999 | 116 (58.6%) | 0 (0.0%) |
| $30,000 to $34,999 | 0 (0.0%) | 0 (0.0%) |
| $35,000 to $39,999 | 0 (0.0%) | 40 (17.4%) |
| $40,000 to $44,999 | 0 (0.0%) | 0 (0.0%) |
| $45,000 to $49,999 | 0 (0.0%) | 0 (0.0%) |
| $50,000 to $54,999 | 0 (0.0%) | 36 (15.7%) |
| $55,000 to $64,999 | 0 (0.0%) | 60 (26.1%) |
| $65,000 to $74,999 | 13 (6.6%) | 0 (0.0%) |
| $75,000 to $99,999 | 50 (25.3%) | 0 (0.0%) |
| $100,000+ | 0 (0.0%) | 17 (7.4%) |
| Total | 198 (100.0%) | 230 (100.0%) |
Earnings by Sex by Educational Attainment in Adelino
| Educational Attainment | Male Income | Female Income |
| Less than High School | - | - |
| High School Diploma | - | - |
| College or Associate's Degree | - | - |
| Bachelor's Degree | - | - |
| Graduate Degree | - | - |
| Total | - | - |
Family Income in Adelino
Family Income Brackets in Adelino
According to the Adelino family income data, there are 86 families falling into the $100,000 to $149,999 income range, which is the most common income bracket and makes up 49.1% of all families.
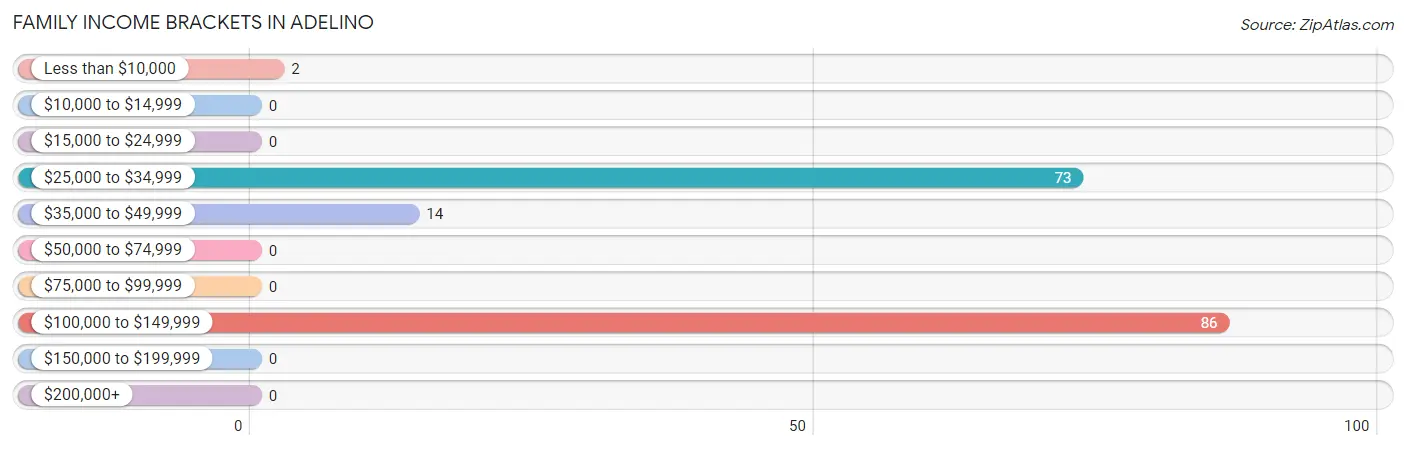
| Income Bracket | # Families | % Families |
| Less than $10,000 | 2 | 1.1% |
| $10,000 to $14,999 | 0 | 0.0% |
| $15,000 to $24,999 | 0 | 0.0% |
| $25,000 to $34,999 | 73 | 41.7% |
| $35,000 to $49,999 | 14 | 8.0% |
| $50,000 to $74,999 | 0 | 0.0% |
| $75,000 to $99,999 | 0 | 0.0% |
| $100,000 to $149,999 | 86 | 49.1% |
| $150,000 to $199,999 | 0 | 0.0% |
| $200,000+ | 0 | 0.0% |
Family Income by Famaliy Size in Adelino
3-person families (43 | 24.6%) account for the highest median family income in Adelino with $108,942 per family, while 3-person families (43 | 24.6%) have the highest median income of $36,314 per family member.
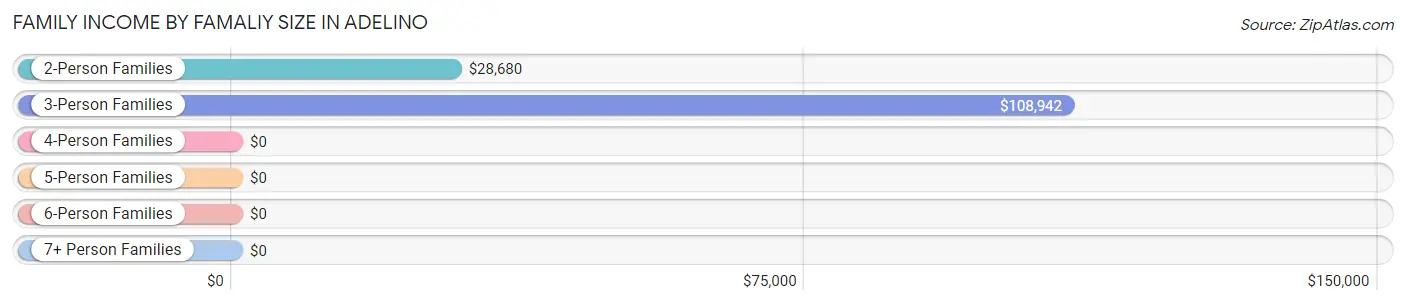
| Income Bracket | # Families | Median Income |
| 2-Person Families | 75 (42.9%) | $28,680 |
| 3-Person Families | 43 (24.6%) | $108,942 |
| 4-Person Families | 0 (0.0%) | $0 |
| 5-Person Families | 0 (0.0%) | $0 |
| 6-Person Families | 57 (32.6%) | $0 |
| 7+ Person Families | 0 (0.0%) | $0 |
| Total | 175 (100.0%) | $0 |
Family Income by Number of Earners in Adelino
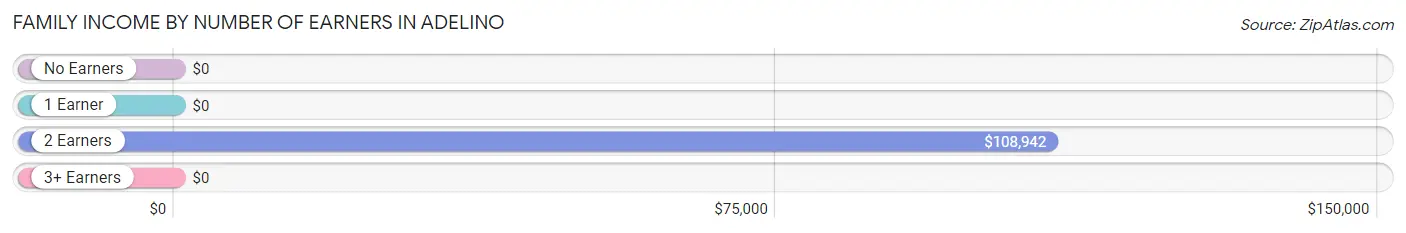
| Number of Earners | # Families | Median Income |
| No Earners | 4 (2.3%) | $0 |
| 1 Earner | 71 (40.6%) | $0 |
| 2 Earners | 43 (24.6%) | $108,942 |
| 3+ Earners | 57 (32.6%) | $0 |
| Total | 175 (100.0%) | $0 |
Household Income in Adelino
Household Income Brackets in Adelino
With 103 households falling in the category, the $100,000 to $149,999 income range is the most frequent in Adelino, accounting for 30.0% of all households.
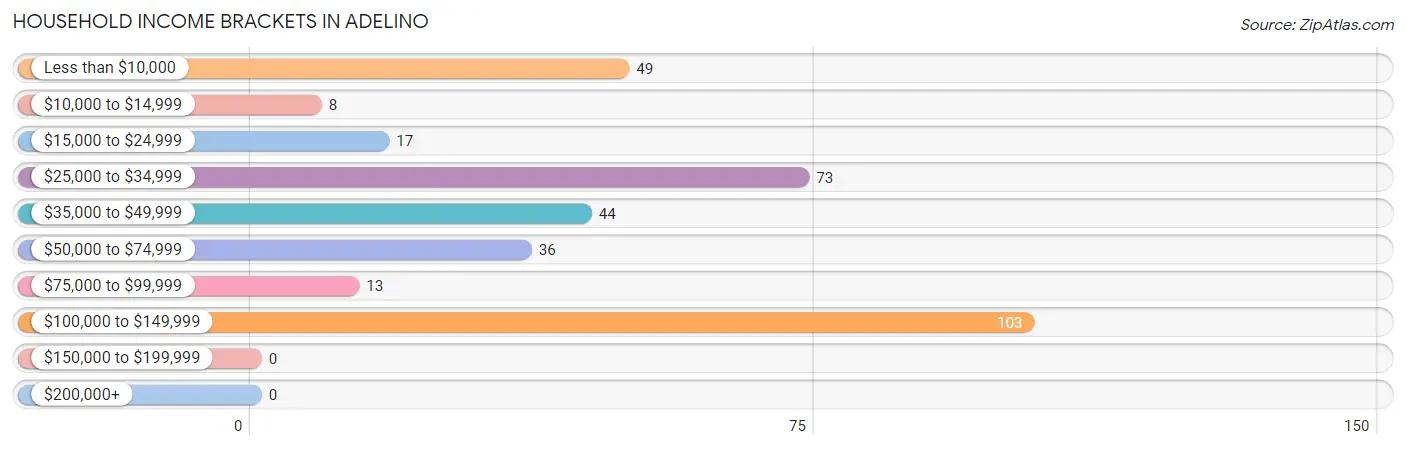
| Income Bracket | # Households | % Households |
| Less than $10,000 | 49 | 14.3% |
| $10,000 to $14,999 | 8 | 2.3% |
| $15,000 to $24,999 | 17 | 5.0% |
| $25,000 to $34,999 | 73 | 21.3% |
| $35,000 to $49,999 | 44 | 12.8% |
| $50,000 to $74,999 | 36 | 10.5% |
| $75,000 to $99,999 | 13 | 3.8% |
| $100,000 to $149,999 | 103 | 30.0% |
| $150,000 to $199,999 | 0 | 0.0% |
| $200,000+ | 0 | 0.0% |
Household Income by Householder Age in Adelino
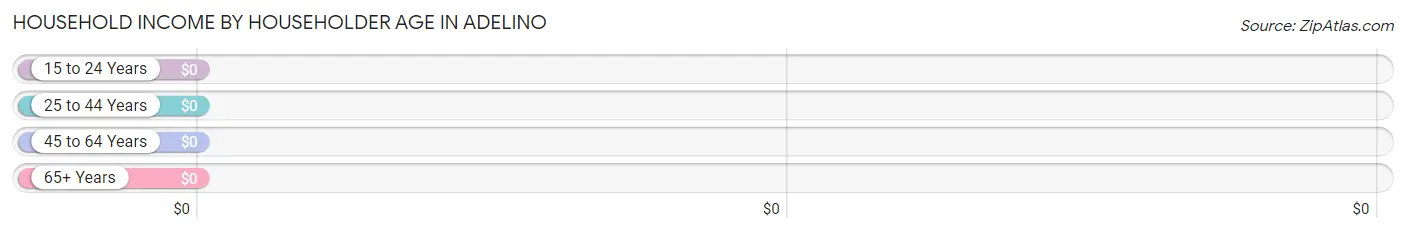
| Income Bracket | # Households | Median Income |
| 15 to 24 Years | 0 (0.0%) | $0 |
| 25 to 44 Years | 71 (20.7%) | $0 |
| 45 to 64 Years | 168 (49.0%) | $0 |
| 65+ Years | 104 (30.3%) | $0 |
| Total | 343 (100.0%) | $48,892 |
Poverty in Adelino
Income Below Poverty by Sex and Age in Adelino
With 0.4% poverty level for males and 16.5% for females among the residents of Adelino, 75 year old and over males and 65 to 74 year old females are the most vulnerable to poverty, with 2 males (100.0%) and 16 females (41.0%) in their respective age groups living below the poverty level.
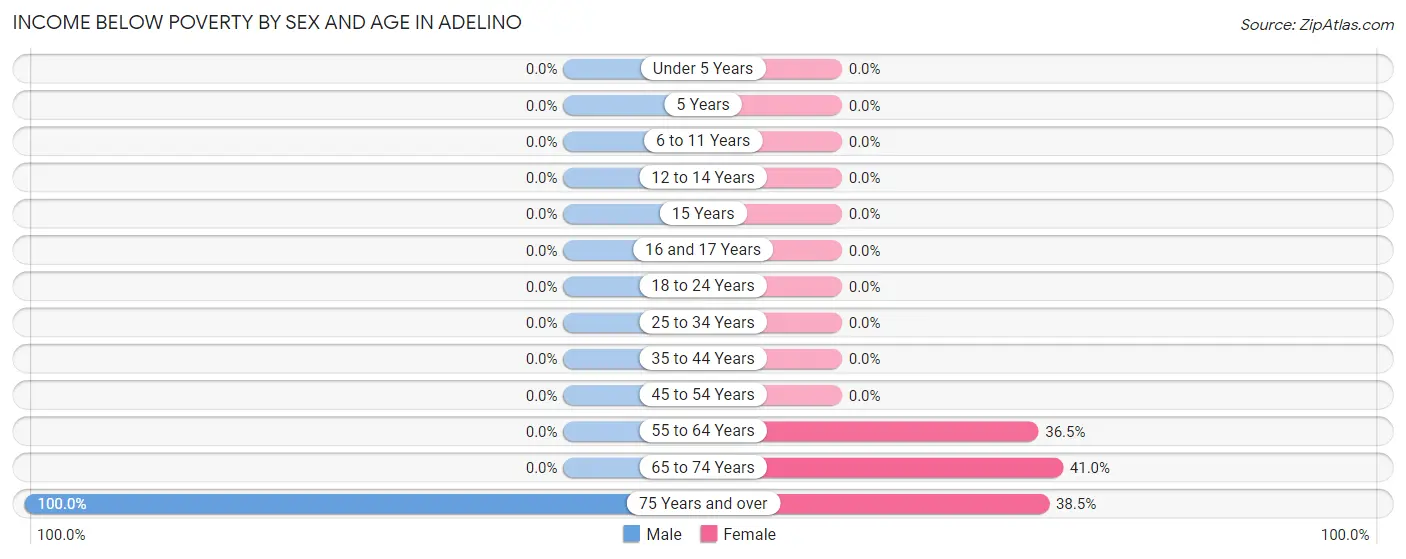
| Age Bracket | Male | Female |
| Under 5 Years | 0 (0.0%) | 0 (0.0%) |
| 5 Years | 0 (0.0%) | 0 (0.0%) |
| 6 to 11 Years | 0 (0.0%) | 0 (0.0%) |
| 12 to 14 Years | 0 (0.0%) | 0 (0.0%) |
| 15 Years | 0 (0.0%) | 0 (0.0%) |
| 16 and 17 Years | 0 (0.0%) | 0 (0.0%) |
| 18 to 24 Years | 0 (0.0%) | 0 (0.0%) |
| 25 to 34 Years | 0 (0.0%) | 0 (0.0%) |
| 35 to 44 Years | 0 (0.0%) | 0 (0.0%) |
| 45 to 54 Years | 0 (0.0%) | 0 (0.0%) |
| 55 to 64 Years | 0 (0.0%) | 31 (36.5%) |
| 65 to 74 Years | 0 (0.0%) | 16 (41.0%) |
| 75 Years and over | 2 (100.0%) | 10 (38.5%) |
| Total | 2 (0.4%) | 57 (16.5%) |
Income Above Poverty by Sex and Age in Adelino
According to the poverty statistics in Adelino, males aged 6 to 11 years and females aged 15 years are the age groups that are most secure financially, with 100.0% of males and 100.0% of females in these age groups living above the poverty line.
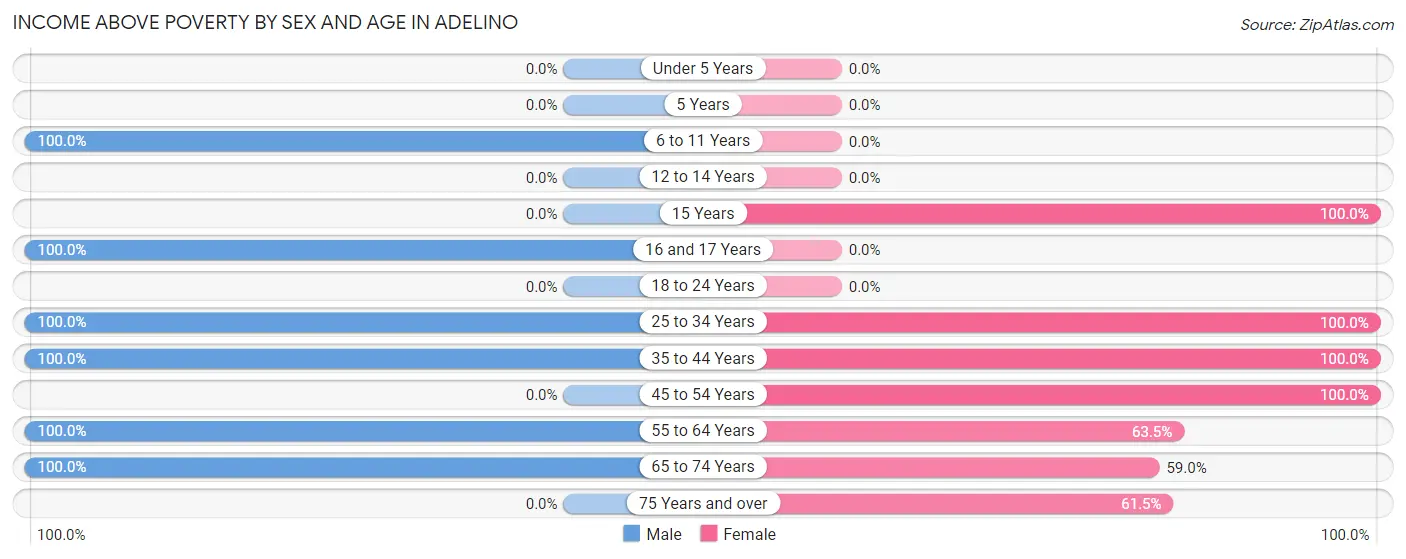
| Age Bracket | Male | Female |
| Under 5 Years | 0 (0.0%) | 0 (0.0%) |
| 5 Years | 0 (0.0%) | 0 (0.0%) |
| 6 to 11 Years | 49 (100.0%) | 0 (0.0%) |
| 12 to 14 Years | 0 (0.0%) | 0 (0.0%) |
| 15 Years | 0 (0.0%) | 21 (100.0%) |
| 16 and 17 Years | 17 (100.0%) | 0 (0.0%) |
| 18 to 24 Years | 0 (0.0%) | 0 (0.0%) |
| 25 to 34 Years | 187 (100.0%) | 26 (100.0%) |
| 35 to 44 Years | 61 (100.0%) | 131 (100.0%) |
| 45 to 54 Years | 0 (0.0%) | 17 (100.0%) |
| 55 to 64 Years | 84 (100.0%) | 54 (63.5%) |
| 65 to 74 Years | 45 (100.0%) | 23 (59.0%) |
| 75 Years and over | 0 (0.0%) | 16 (61.5%) |
| Total | 443 (99.6%) | 288 (83.5%) |
Income Below Poverty Among Married-Couple Families in Adelino
The poverty statistics for married-couple families in Adelino show that 2.3% or 2 of the total 88 families live below the poverty line. Families with no children have the highest poverty rate of 11.8%, comprising of 2 families. On the other hand, families with 1 or 2 children have the lowest poverty rate of 0.0%, which includes 0 families.
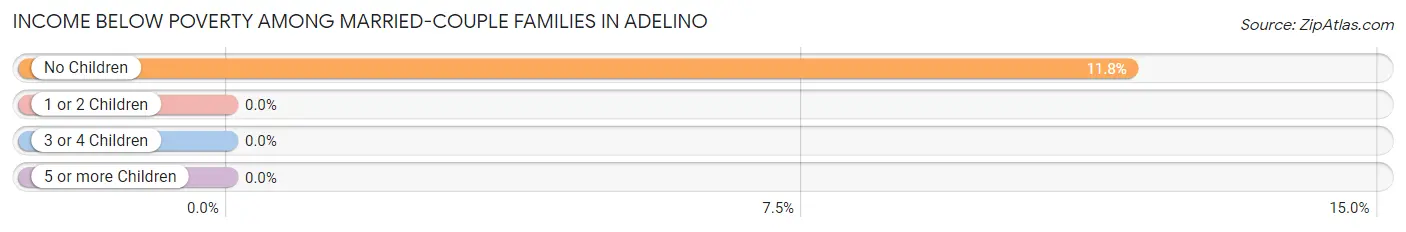
| Children | Above Poverty | Below Poverty |
| No Children | 15 (88.2%) | 2 (11.8%) |
| 1 or 2 Children | 14 (100.0%) | 0 (0.0%) |
| 3 or 4 Children | 57 (100.0%) | 0 (0.0%) |
| 5 or more Children | 0 (0.0%) | 0 (0.0%) |
| Total | 86 (97.7%) | 2 (2.3%) |
Income Below Poverty Among Single-Parent Households in Adelino
| Children | Single Father | Single Mother |
| No Children | 0 (0.0%) | 0 (0.0%) |
| 1 or 2 Children | 0 (0.0%) | 0 (0.0%) |
| 3 or 4 Children | 0 (0.0%) | 0 (0.0%) |
| 5 or more Children | 0 (0.0%) | 0 (0.0%) |
| Total | 0 (0.0%) | 0 (0.0%) |
Income Below Poverty Among Married-Couple vs Single-Parent Households in Adelino
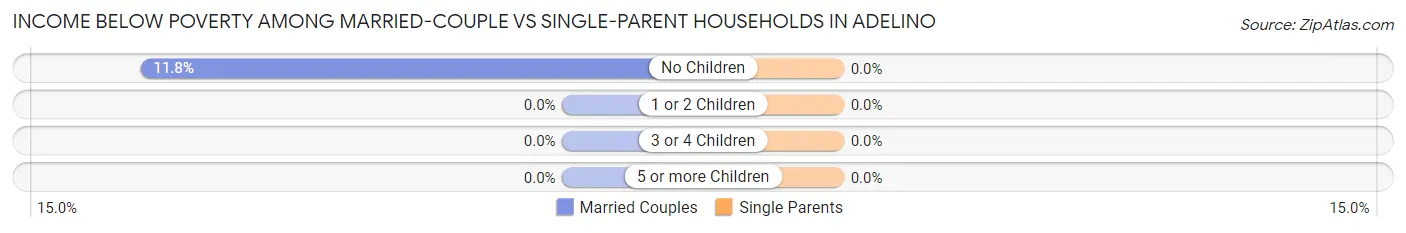
| Children | Married-Couple Families | Single-Parent Households |
| No Children | 2 (11.8%) | 0 (0.0%) |
| 1 or 2 Children | 0 (0.0%) | 0 (0.0%) |
| 3 or 4 Children | 0 (0.0%) | 0 (0.0%) |
| 5 or more Children | 0 (0.0%) | 0 (0.0%) |
| Total | 2 (2.3%) | 0 (0.0%) |
Race in Adelino
The most populous races in Adelino are Hispanic or Latino (669 | 84.7%), White / Caucasian (469 | 59.4%), and Two or more Races (262 | 33.2%).
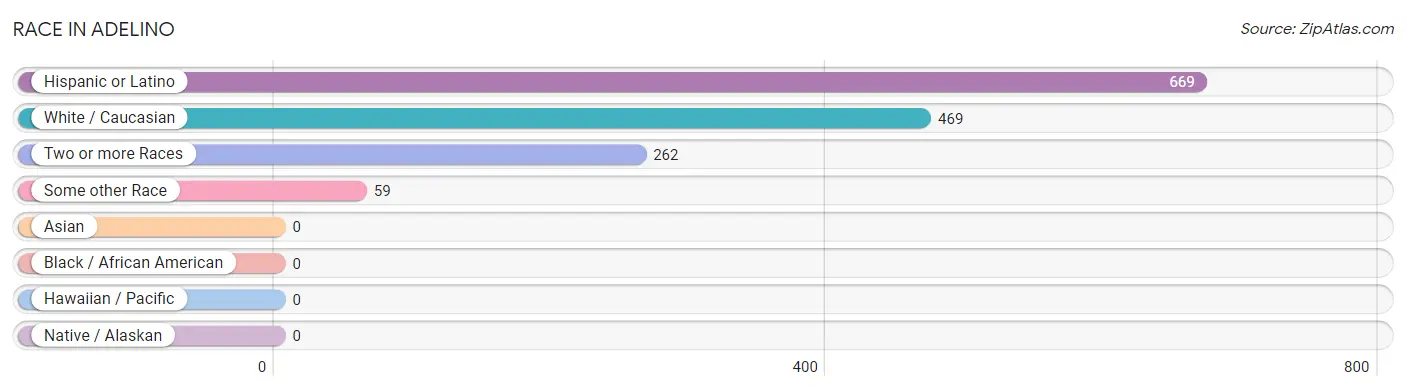
| Race | # Population | % Population |
| Asian | 0 | 0.0% |
| Black / African American | 0 | 0.0% |
| Hawaiian / Pacific | 0 | 0.0% |
| Hispanic or Latino | 669 | 84.7% |
| Native / Alaskan | 0 | 0.0% |
| White / Caucasian | 469 | 59.4% |
| Two or more Races | 262 | 33.2% |
| Some other Race | 59 | 7.5% |
| Total | 790 | 100.0% |
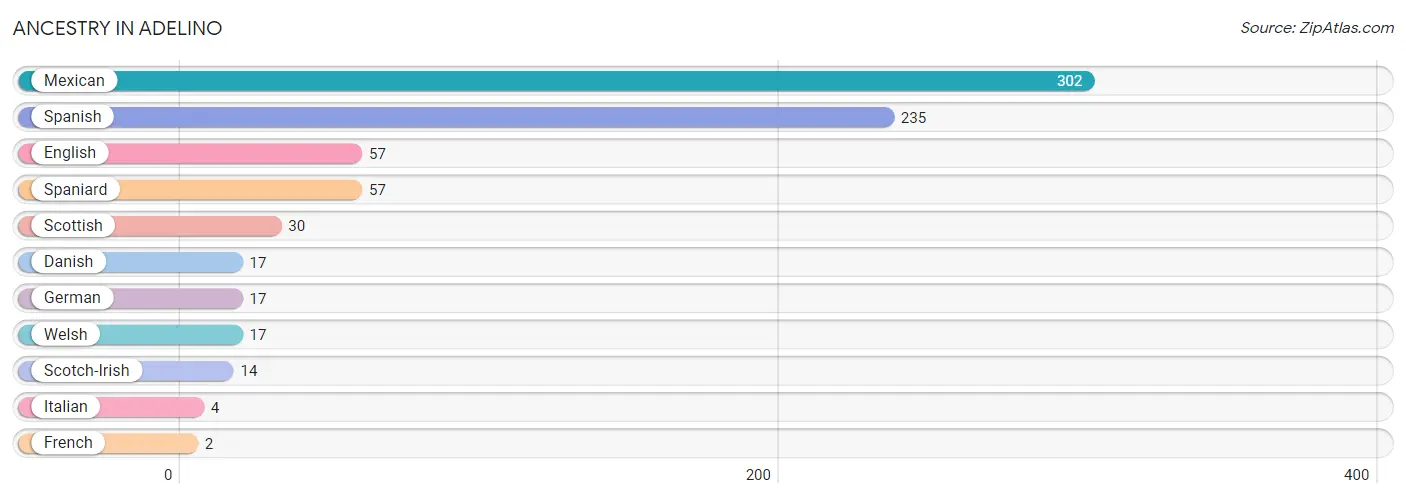
Ancestry in Adelino
The most populous ancestries reported in Adelino are Mexican (302 | 38.2%), Spanish (235 | 29.7%), English (57 | 7.2%), Spaniard (57 | 7.2%), and Scottish (30 | 3.8%), together accounting for 86.2% of all Adelino residents.
| Ancestry | # Population | % Population |
| Danish | 17 | 2.1% |
| English | 57 | 7.2% |
| French | 2 | 0.3% |
| German | 17 | 2.1% |
| Italian | 4 | 0.5% |
| Mexican | 302 | 38.2% |
| Scotch-Irish | 14 | 1.8% |
| Scottish | 30 | 3.8% |
| Spaniard | 57 | 7.2% |
| Spanish | 235 | 29.7% |
| Welsh | 17 | 2.1% | View All 11 Rows |
Immigrants in Adelino
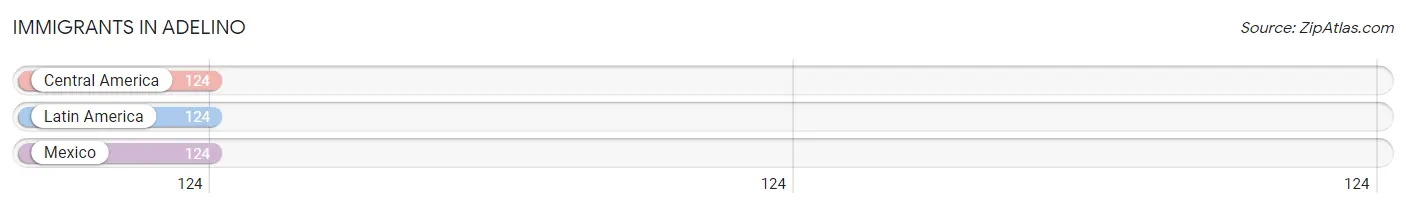
The most numerous immigrant groups reported in Adelino came from Central America (124 | 15.7%), Latin America (124 | 15.7%), and Mexico (124 | 15.7%), together accounting for 47.1% of all Adelino residents.
| Immigration Origin | # Population | % Population |
| Central America | 124 | 15.7% |
| Latin America | 124 | 15.7% |
| Mexico | 124 | 15.7% | View All 3 Rows |
Sex and Age in Adelino
Sex and Age in Adelino
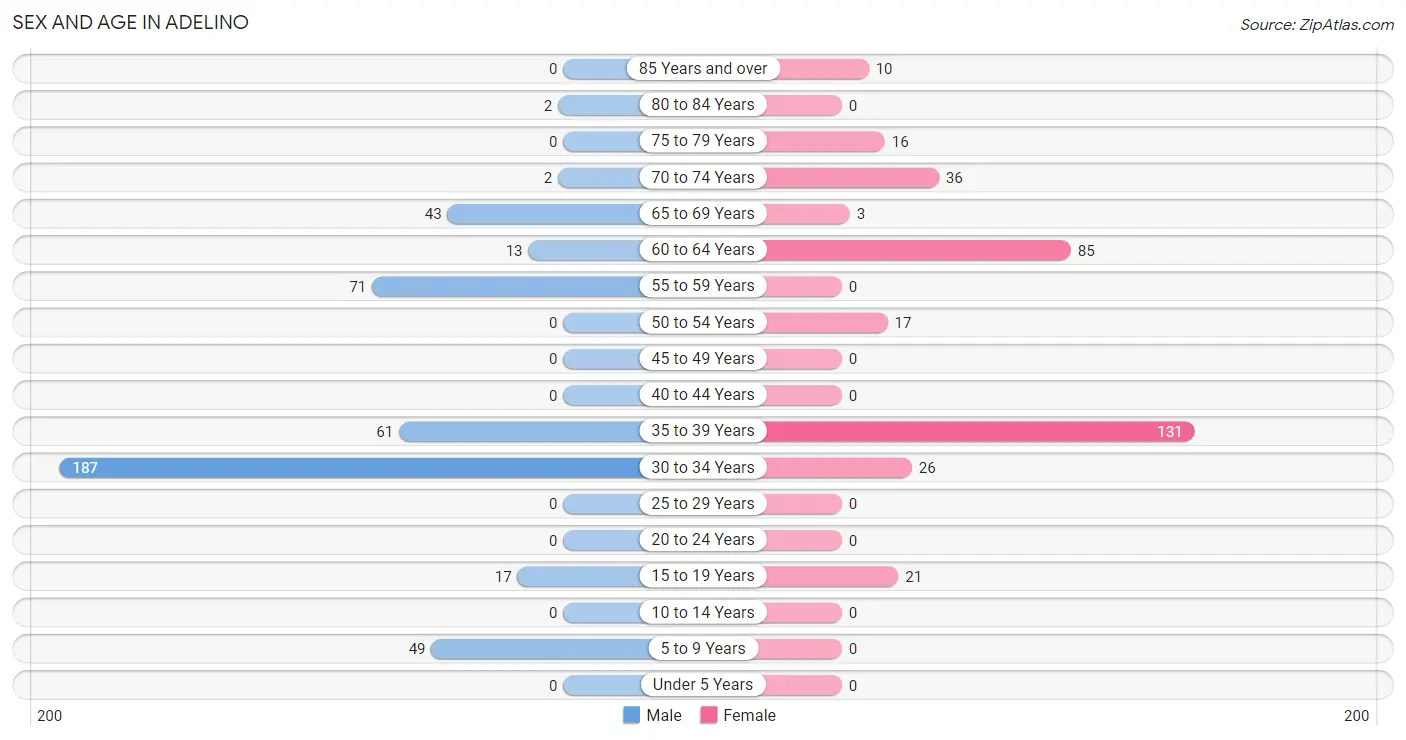
The most populous age groups in Adelino are 30 to 34 Years (187 | 42.0%) for men and 35 to 39 Years (131 | 38.0%) for women.
| Age Bracket | Male | Female |
| Under 5 Years | 0 (0.0%) | 0 (0.0%) |
| 5 to 9 Years | 49 (11.0%) | 0 (0.0%) |
| 10 to 14 Years | 0 (0.0%) | 0 (0.0%) |
| 15 to 19 Years | 17 (3.8%) | 21 (6.1%) |
| 20 to 24 Years | 0 (0.0%) | 0 (0.0%) |
| 25 to 29 Years | 0 (0.0%) | 0 (0.0%) |
| 30 to 34 Years | 187 (42.0%) | 26 (7.5%) |
| 35 to 39 Years | 61 (13.7%) | 131 (38.0%) |
| 40 to 44 Years | 0 (0.0%) | 0 (0.0%) |
| 45 to 49 Years | 0 (0.0%) | 0 (0.0%) |
| 50 to 54 Years | 0 (0.0%) | 17 (4.9%) |
| 55 to 59 Years | 71 (16.0%) | 0 (0.0%) |
| 60 to 64 Years | 13 (2.9%) | 85 (24.6%) |
| 65 to 69 Years | 43 (9.7%) | 3 (0.9%) |
| 70 to 74 Years | 2 (0.4%) | 36 (10.4%) |
| 75 to 79 Years | 0 (0.0%) | 16 (4.6%) |
| 80 to 84 Years | 2 (0.4%) | 0 (0.0%) |
| 85 Years and over | 0 (0.0%) | 10 (2.9%) |
| Total | 445 (100.0%) | 345 (100.0%) |
Families and Households in Adelino
Median Family Size in Adelino
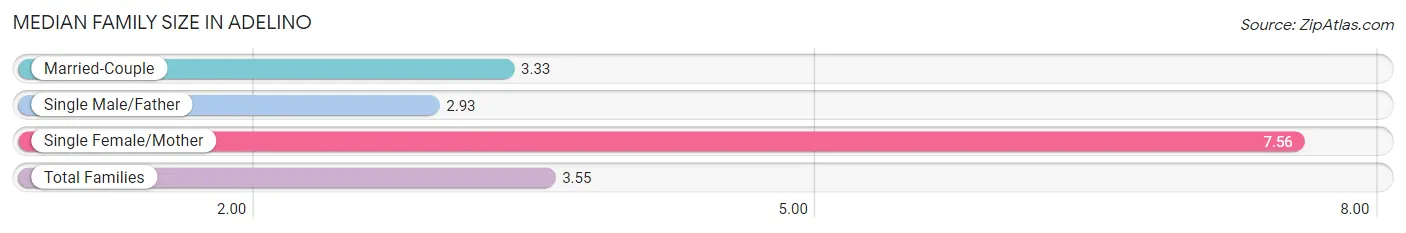
The median family size in Adelino is 3.55 persons per family, with single female/mother families (16 | 9.1%) accounting for the largest median family size of 7.56 persons per family. On the other hand, single male/father families (71 | 40.6%) represent the smallest median family size with 2.93 persons per family.
| Family Type | # Families | Family Size |
| Married-Couple | 88 (50.3%) | 3.33 |
| Single Male/Father | 71 (40.6%) | 2.93 |
| Single Female/Mother | 16 (9.1%) | 7.56 |
| Total Families | 175 (100.0%) | 3.55 |
Median Household Size in Adelino
| Household Type | # Households | Household Size |
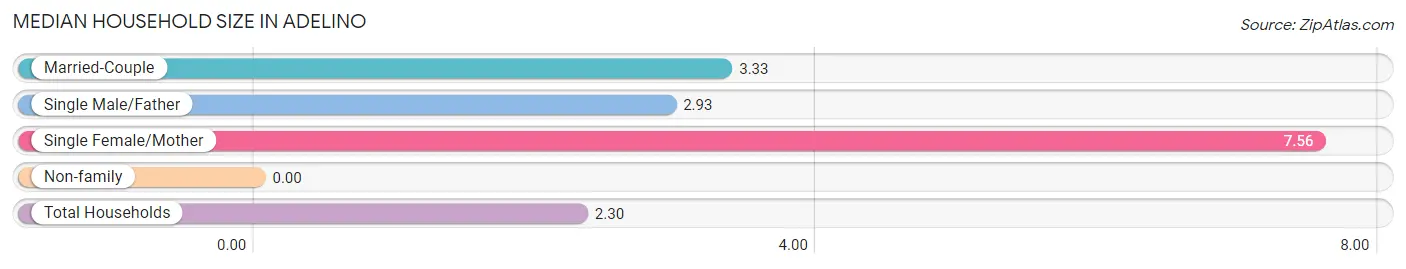
| Married-Couple | 88 (25.7%) | 3.33 |
| Single Male/Father | 71 (20.7%) | 2.93 |
| Single Female/Mother | 16 (4.7%) | 7.56 |
| Non-family | 168 (49.0%) | - |
| Total Households | 343 (100.0%) | 2.30 |
Household Size by Marriage Status in Adelino
Out of a total of 343 households in Adelino, 175 (51.0%) are family households, while 168 (49.0%) are nonfamily households. The most numerous type of family households are 2-person households, comprising 75, and the most common type of nonfamily households are 1-person households, comprising 168.
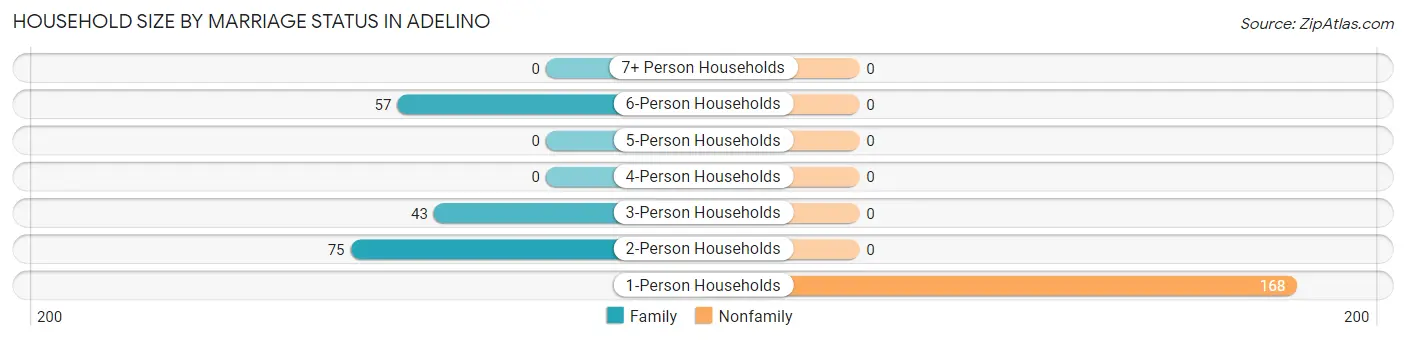
| Household Size | Family Households | Nonfamily Households |
| 1-Person Households | - | 168 (49.0%) |
| 2-Person Households | 75 (21.9%) | 0 (0.0%) |
| 3-Person Households | 43 (12.5%) | 0 (0.0%) |
| 4-Person Households | 0 (0.0%) | 0 (0.0%) |
| 5-Person Households | 0 (0.0%) | 0 (0.0%) |
| 6-Person Households | 57 (16.6%) | 0 (0.0%) |
| 7+ Person Households | 0 (0.0%) | 0 (0.0%) |
| Total | 175 (51.0%) | 168 (49.0%) |
Female Fertility in Adelino
Fertility by Age in Adelino
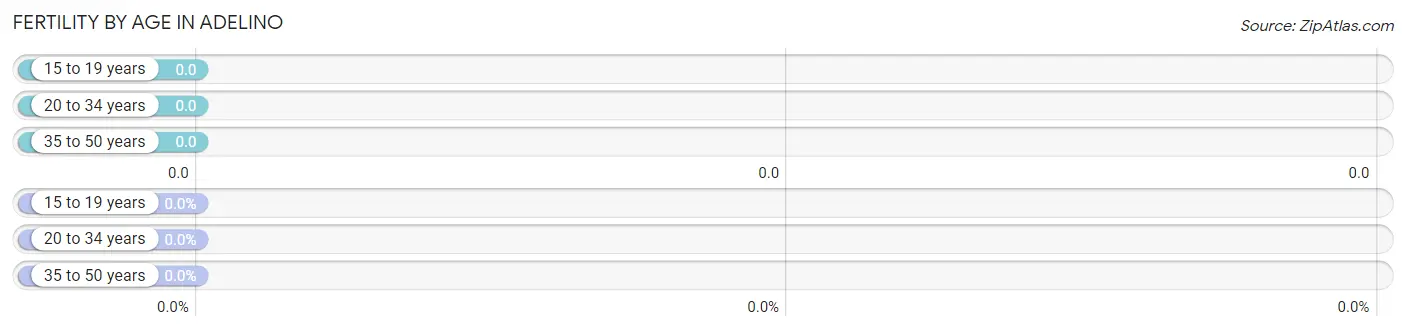
| Age Bracket | Women with Births | Births / 1,000 Women |
| 15 to 19 years | 0 (0.0%) | 0.0 |
| 20 to 34 years | 0 (0.0%) | 0.0 |
| 35 to 50 years | 0 (0.0%) | 0.0 |
| Total | 0 (0.0%) | 0.0 |
Fertility by Age by Marriage Status in Adelino
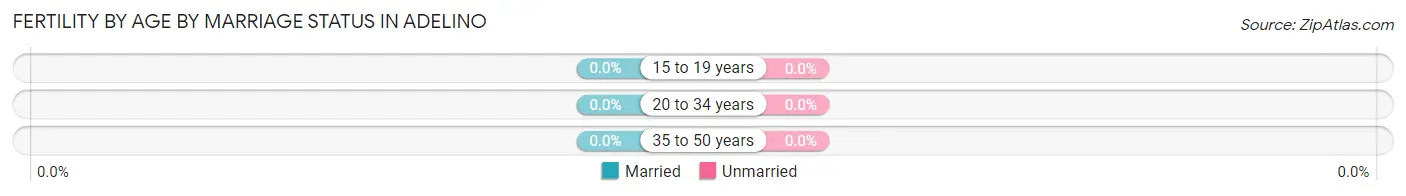
| Age Bracket | Married | Unmarried |
| 15 to 19 years | 0 (0.0%) | 0 (0.0%) |
| 20 to 34 years | 0 (0.0%) | 0 (0.0%) |
| 35 to 50 years | 0 (0.0%) | 0 (0.0%) |
| Total | 0 (0.0%) | 0 (0.0%) |
Fertility by Education in Adelino
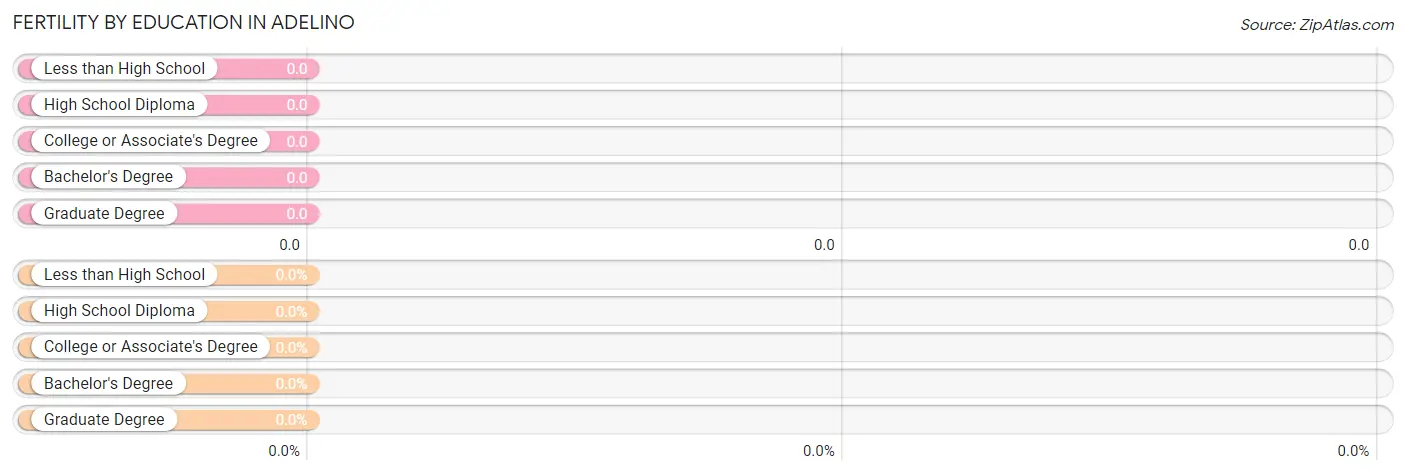
| Educational Attainment | Women with Births | Births / 1,000 Women |
| Less than High School | 0 (0.0%) | 0.0 |
| High School Diploma | 0 (0.0%) | 0.0 |
| College or Associate's Degree | 0 (0.0%) | 0.0 |
| Bachelor's Degree | 0 (0.0%) | 0.0 |
| Graduate Degree | 0 (0.0%) | 0.0 |
| Total | 0 (0.0%) | 0.0 |
Fertility by Education by Marriage Status in Adelino
| Educational Attainment | Married | Unmarried |
| Less than High School | 0 (0.0%) | 0 (0.0%) |
| High School Diploma | 0 (0.0%) | 0 (0.0%) |
| College or Associate's Degree | 0 (0.0%) | 0 (0.0%) |
| Bachelor's Degree | 0 (0.0%) | 0 (0.0%) |
| Graduate Degree | 0 (0.0%) | 0 (0.0%) |
| Total | 0 (0.0%) | 0 (0.0%) |
Employment Characteristics in Adelino
Employment by Class of Employer in Adelino
Among the 392 employed individuals in Adelino, private company employees (241 | 61.5%), not-for-profit organizations (88 | 22.5%), and state government employees (60 | 15.3%) make up the most common classes of employment.
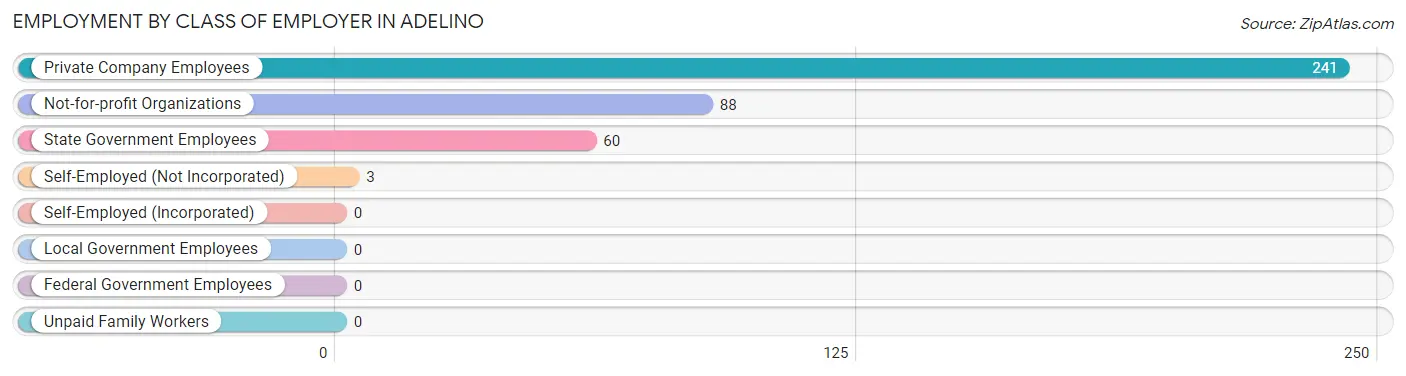
| Employer Class | # Employees | % Employees |
| Private Company Employees | 241 | 61.5% |
| Self-Employed (Incorporated) | 0 | 0.0% |
| Self-Employed (Not Incorporated) | 3 | 0.8% |
| Not-for-profit Organizations | 88 | 22.5% |
| Local Government Employees | 0 | 0.0% |
| State Government Employees | 60 | 15.3% |
| Federal Government Employees | 0 | 0.0% |
| Unpaid Family Workers | 0 | 0.0% |
| Total | 392 | 100.0% |
Employment Status by Age in Adelino
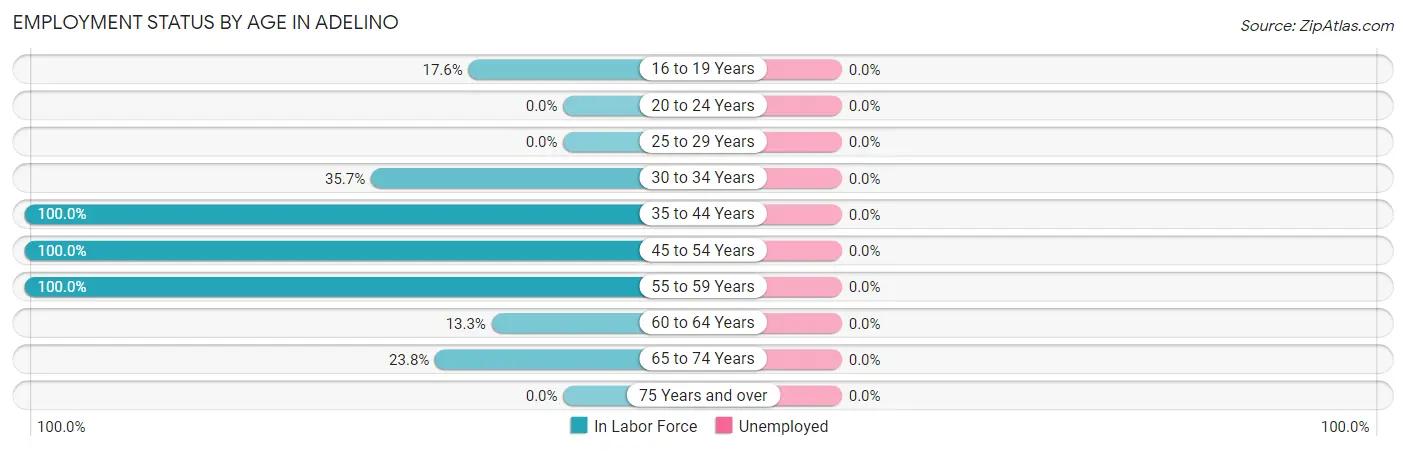
| Age Bracket | In Labor Force | Unemployed |
| 16 to 19 Years | 3 (17.6%) | 0 (0.0%) |
| 20 to 24 Years | 0 (0.0%) | 0 (0.0%) |
| 25 to 29 Years | 0 (0.0%) | 0 (0.0%) |
| 30 to 34 Years | 76 (35.7%) | 0 (0.0%) |
| 35 to 44 Years | 192 (100.0%) | 0 (0.0%) |
| 45 to 54 Years | 17 (100.0%) | 0 (0.0%) |
| 55 to 59 Years | 71 (100.0%) | 0 (0.0%) |
| 60 to 64 Years | 13 (13.3%) | 0 (0.0%) |
| 65 to 74 Years | 20 (23.8%) | 0 (0.0%) |
| 75 Years and over | 0 (0.0%) | 0 (0.0%) |
| Total | 392 (54.4%) | 0 (0.0%) |
Employment Status by Educational Attainment in Adelino
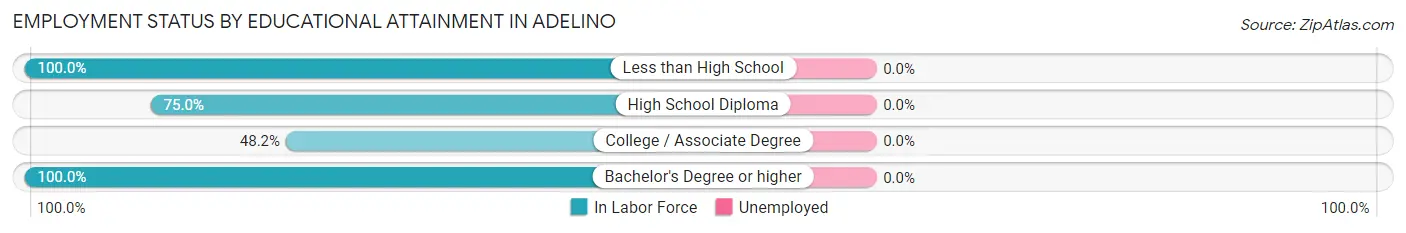
| Educational Attainment | In Labor Force | Unemployed |
| Less than High School | 71 (100.0%) | 0 (0.0%) |
| High School Diploma | 108 (75.0%) | 0 (0.0%) |
| College / Associate Degree | 173 (48.2%) | 0 (0.0%) |
| Bachelor's Degree or higher | 17 (100.0%) | 0 (0.0%) |
| Total | 369 (62.4%) | 0 (0.0%) |
Employment Occupations by Sex in Adelino
Management, Business, Science and Arts Occupations
The most common Management, Business, Science and Arts occupations in Adelino are Community & Social Service (134 | 34.2%), Arts, Media & Entertainment (77 | 19.6%), Management (67 | 17.1%), and Education Instruction & Library (57 | 14.5%).
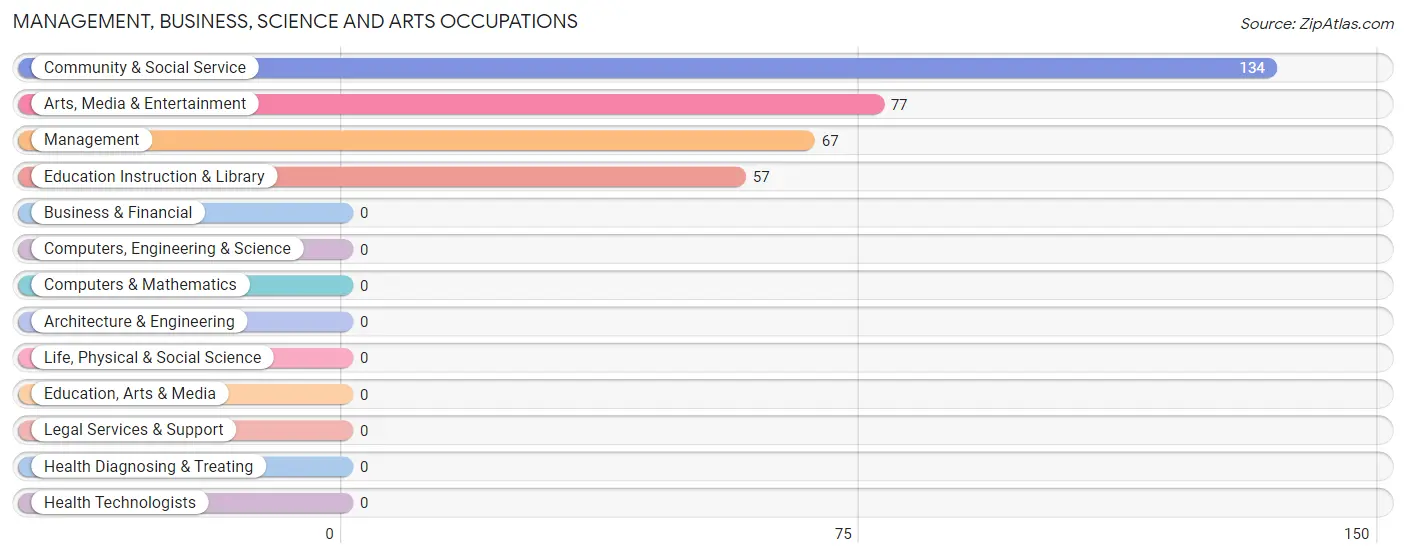
Management, Business, Science and Arts Occupations by Sex
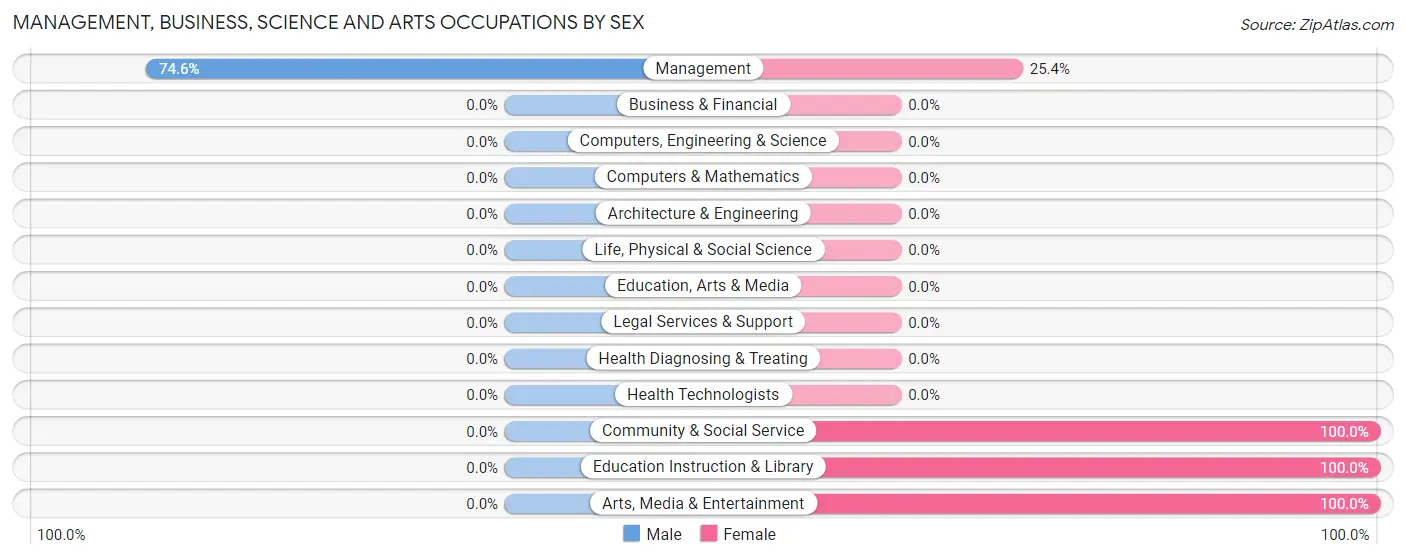
| Occupation | Male | Female |
| Management | 50 (74.6%) | 17 (25.4%) |
| Business & Financial | 0 (0.0%) | 0 (0.0%) |
| Computers, Engineering & Science | 0 (0.0%) | 0 (0.0%) |
| Computers & Mathematics | 0 (0.0%) | 0 (0.0%) |
| Architecture & Engineering | 0 (0.0%) | 0 (0.0%) |
| Life, Physical & Social Science | 0 (0.0%) | 0 (0.0%) |
| Community & Social Service | 0 (0.0%) | 134 (100.0%) |
| Education, Arts & Media | 0 (0.0%) | 0 (0.0%) |
| Legal Services & Support | 0 (0.0%) | 0 (0.0%) |
| Education Instruction & Library | 0 (0.0%) | 57 (100.0%) |
| Arts, Media & Entertainment | 0 (0.0%) | 77 (100.0%) |
| Health Diagnosing & Treating | 0 (0.0%) | 0 (0.0%) |
| Health Technologists | 0 (0.0%) | 0 (0.0%) |
| Total (Category) | 50 (24.9%) | 151 (75.1%) |
| Total (Overall) | 198 (50.5%) | 194 (49.5%) |
Services Occupations
The most common Services occupations in Adelino are Healthcare Support (71 | 18.1%), and Cleaning & Maintenance (19 | 4.9%).
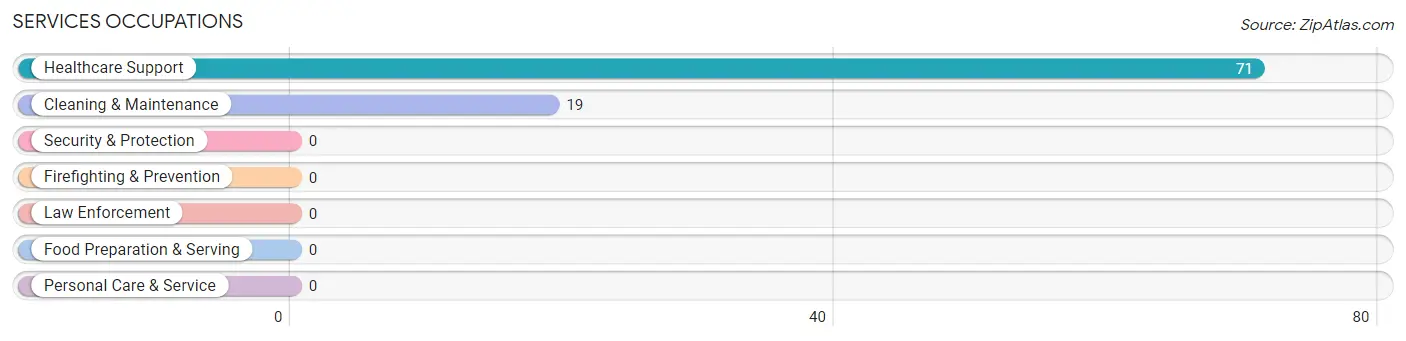
Services Occupations by Sex
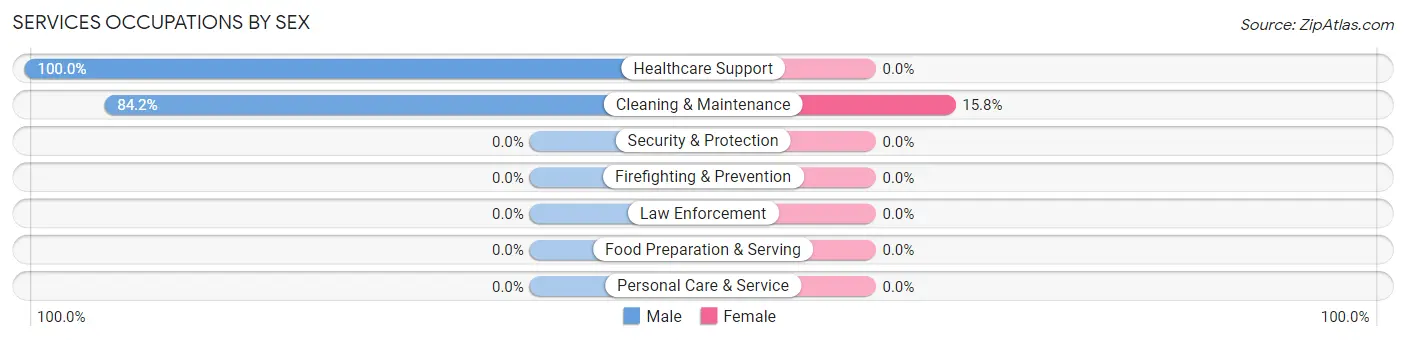
| Occupation | Male | Female |
| Healthcare Support | 71 (100.0%) | 0 (0.0%) |
| Security & Protection | 0 (0.0%) | 0 (0.0%) |
| Firefighting & Prevention | 0 (0.0%) | 0 (0.0%) |
| Law Enforcement | 0 (0.0%) | 0 (0.0%) |
| Food Preparation & Serving | 0 (0.0%) | 0 (0.0%) |
| Cleaning & Maintenance | 16 (84.2%) | 3 (15.8%) |
| Personal Care & Service | 0 (0.0%) | 0 (0.0%) |
| Total (Category) | 87 (96.7%) | 3 (3.3%) |
| Total (Overall) | 198 (50.5%) | 194 (49.5%) |
Sales and Office Occupations
The most common Sales and Office occupations in Adelino are Sales & Related (45 | 11.5%), and Office & Administration (27 | 6.9%).

Sales and Office Occupations by Sex

| Occupation | Male | Female |
| Sales & Related | 45 (100.0%) | 0 (0.0%) |
| Office & Administration | 13 (48.1%) | 14 (51.8%) |
| Total (Category) | 58 (80.6%) | 14 (19.4%) |
| Total (Overall) | 198 (50.5%) | 194 (49.5%) |
Natural Resources, Construction and Maintenance Occupations
The most common Natural Resources, Construction and Maintenance occupations in Adelino are , and Farming, Fishing & Forestry (3 | 0.8%).
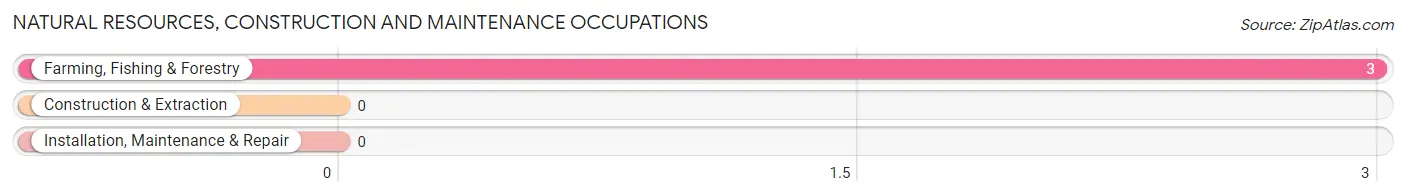
Natural Resources, Construction and Maintenance Occupations by Sex
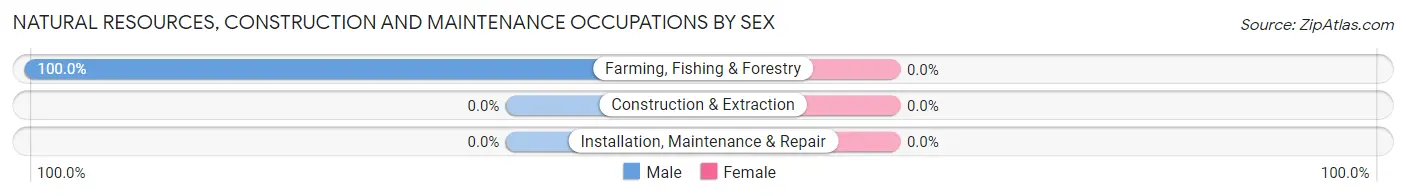
| Occupation | Male | Female |
| Farming, Fishing & Forestry | 3 (100.0%) | 0 (0.0%) |
| Construction & Extraction | 0 (0.0%) | 0 (0.0%) |
| Installation, Maintenance & Repair | 0 (0.0%) | 0 (0.0%) |
| Total (Category) | 3 (100.0%) | 0 (0.0%) |
| Total (Overall) | 198 (50.5%) | 194 (49.5%) |
Production, Transportation and Moving Occupations
The most common Production, Transportation and Moving occupations in Adelino are , and Transportation (26 | 6.6%).
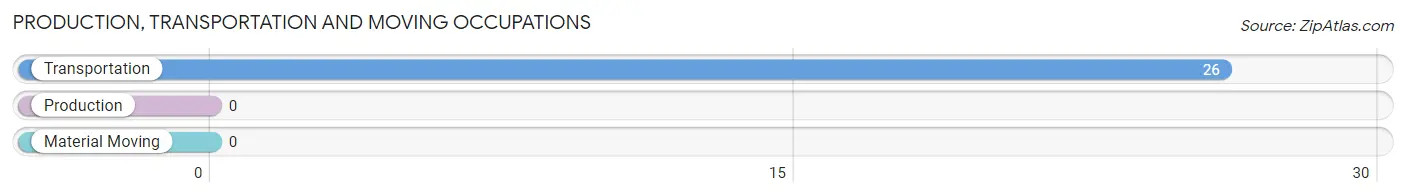
Production, Transportation and Moving Occupations by Sex
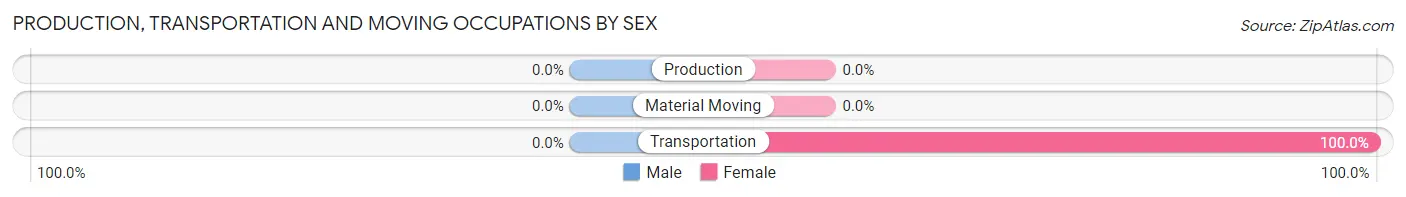
| Occupation | Male | Female |
| Production | 0 (0.0%) | 0 (0.0%) |
| Transportation | 0 (0.0%) | 26 (100.0%) |
| Material Moving | 0 (0.0%) | 0 (0.0%) |
| Total (Category) | 0 (0.0%) | 26 (100.0%) |
| Total (Overall) | 198 (50.5%) | 194 (49.5%) |
Employment Industries by Sex in Adelino
Employment Industries in Adelino
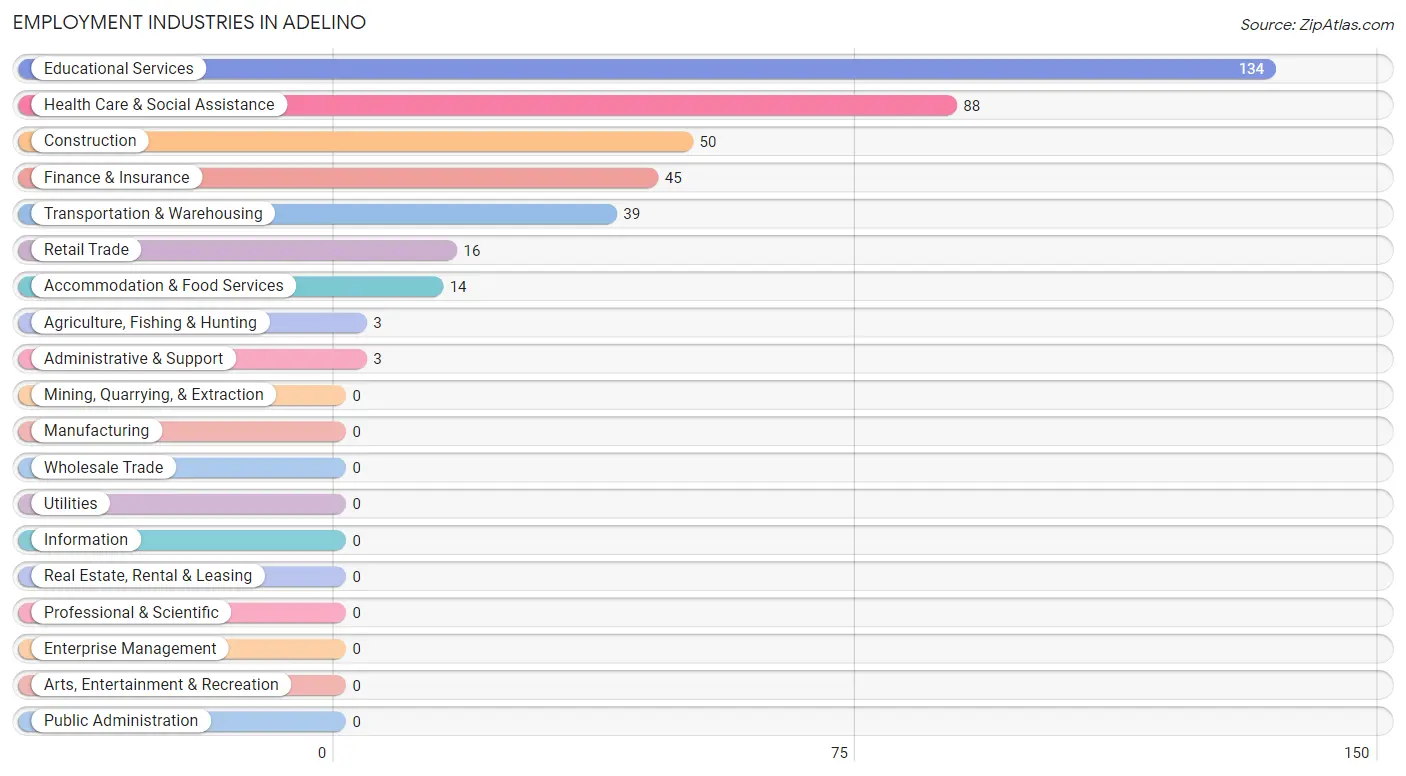
The major employment industries in Adelino include Educational Services (134 | 34.2%), Health Care & Social Assistance (88 | 22.5%), Construction (50 | 12.8%), Finance & Insurance (45 | 11.5%), and Transportation & Warehousing (39 | 10.0%).
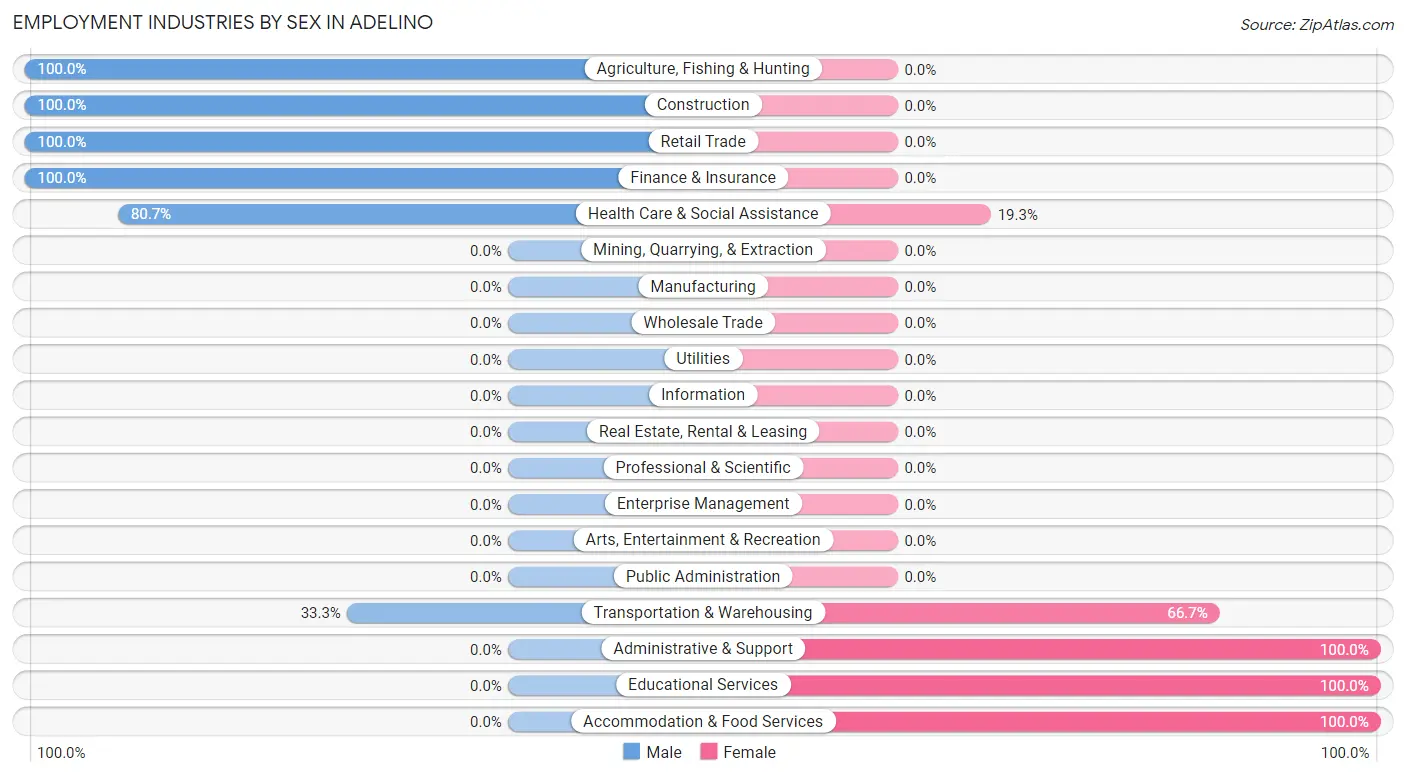
Employment Industries by Sex in Adelino
The Adelino industries that see more men than women are Agriculture, Fishing & Hunting (100.0%), Construction (100.0%), and Retail Trade (100.0%), whereas the industries that tend to have a higher number of women are Administrative & Support (100.0%), Educational Services (100.0%), and Accommodation & Food Services (100.0%).
| Industry | Male | Female |
| Agriculture, Fishing & Hunting | 3 (100.0%) | 0 (0.0%) |
| Mining, Quarrying, & Extraction | 0 (0.0%) | 0 (0.0%) |
| Construction | 50 (100.0%) | 0 (0.0%) |
| Manufacturing | 0 (0.0%) | 0 (0.0%) |
| Wholesale Trade | 0 (0.0%) | 0 (0.0%) |
| Retail Trade | 16 (100.0%) | 0 (0.0%) |
| Transportation & Warehousing | 13 (33.3%) | 26 (66.7%) |
| Utilities | 0 (0.0%) | 0 (0.0%) |
| Information | 0 (0.0%) | 0 (0.0%) |
| Finance & Insurance | 45 (100.0%) | 0 (0.0%) |
| Real Estate, Rental & Leasing | 0 (0.0%) | 0 (0.0%) |
| Professional & Scientific | 0 (0.0%) | 0 (0.0%) |
| Enterprise Management | 0 (0.0%) | 0 (0.0%) |
| Administrative & Support | 0 (0.0%) | 3 (100.0%) |
| Educational Services | 0 (0.0%) | 134 (100.0%) |
| Health Care & Social Assistance | 71 (80.7%) | 17 (19.3%) |
| Arts, Entertainment & Recreation | 0 (0.0%) | 0 (0.0%) |
| Accommodation & Food Services | 0 (0.0%) | 14 (100.0%) |
| Public Administration | 0 (0.0%) | 0 (0.0%) |
| Total | 198 (50.5%) | 194 (49.5%) |
Education in Adelino
School Enrollment in Adelino
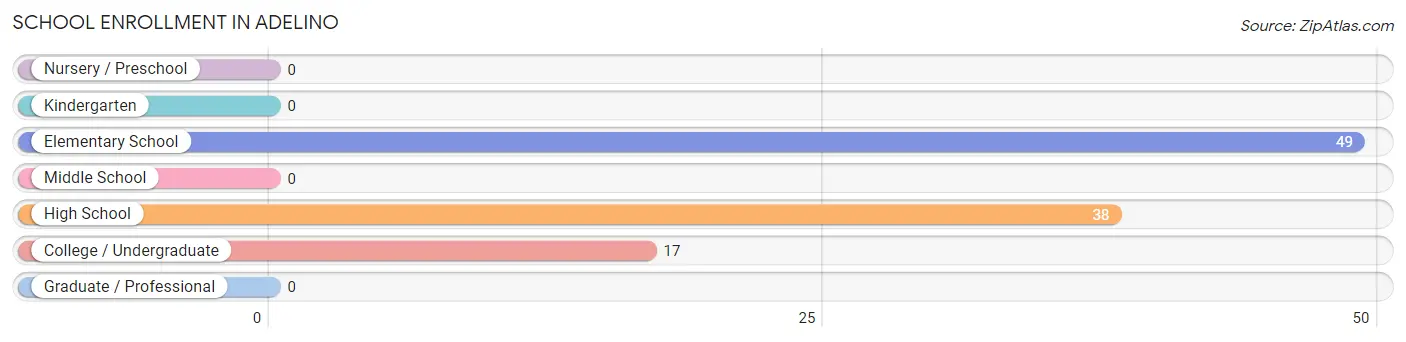
The most common levels of schooling among the 104 students in Adelino are elementary school (49 | 47.1%), high school (38 | 36.5%), and college / undergraduate (17 | 16.4%).
| School Level | # Students | % Students |
| Nursery / Preschool | 0 | 0.0% |
| Kindergarten | 0 | 0.0% |
| Elementary School | 49 | 47.1% |
| Middle School | 0 | 0.0% |
| High School | 38 | 36.5% |
| College / Undergraduate | 17 | 16.4% |
| Graduate / Professional | 0 | 0.0% |
| Total | 104 | 100.0% |
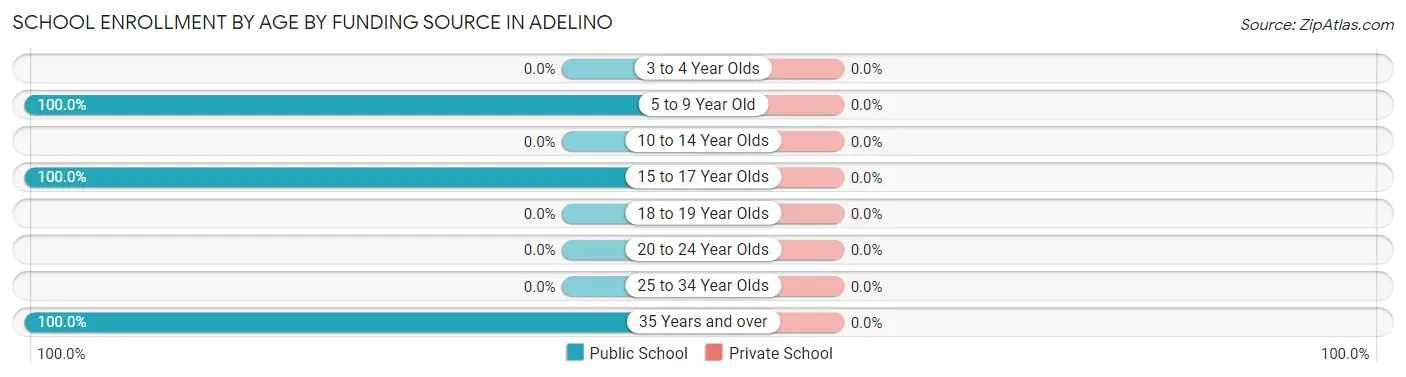
School Enrollment by Age by Funding Source in Adelino
| Age Bracket | Public School | Private School |
| 3 to 4 Year Olds | 0 (0.0%) | 0 (0.0%) |
| 5 to 9 Year Old | 49 (100.0%) | 0 (0.0%) |
| 10 to 14 Year Olds | 0 (0.0%) | 0 (0.0%) |
| 15 to 17 Year Olds | 38 (100.0%) | 0 (0.0%) |
| 18 to 19 Year Olds | 0 (0.0%) | 0 (0.0%) |
| 20 to 24 Year Olds | 0 (0.0%) | 0 (0.0%) |
| 25 to 34 Year Olds | 0 (0.0%) | 0 (0.0%) |
| 35 Years and over | 17 (100.0%) | 0 (0.0%) |
| Total | 104 (100.0%) | 0 (0.0%) |
Educational Attainment by Field of Study in Adelino
Science & technology (30 | 50.0%), arts & humanities (17 | 28.3%), and education (13 | 21.7%) are the most common fields of study among 60 individuals in Adelino who have obtained a bachelor's degree or higher.
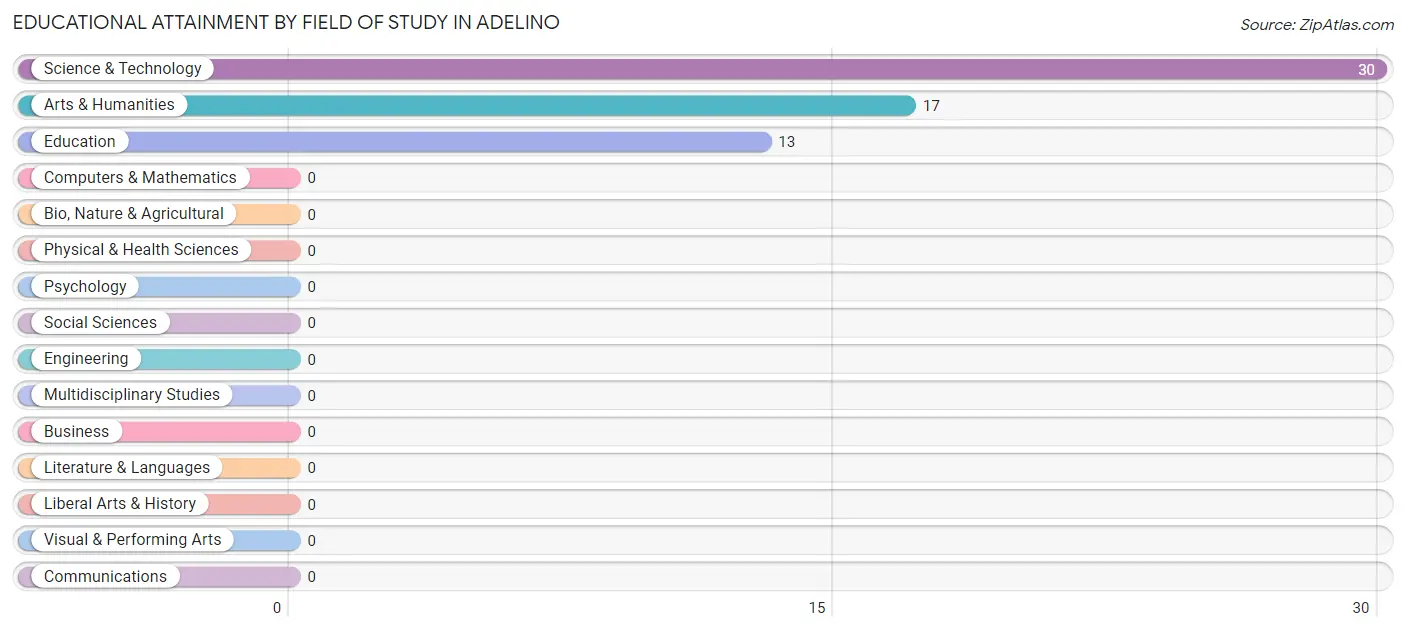
| Field of Study | # Graduates | % Graduates |
| Computers & Mathematics | 0 | 0.0% |
| Bio, Nature & Agricultural | 0 | 0.0% |
| Physical & Health Sciences | 0 | 0.0% |
| Psychology | 0 | 0.0% |
| Social Sciences | 0 | 0.0% |
| Engineering | 0 | 0.0% |
| Multidisciplinary Studies | 0 | 0.0% |
| Science & Technology | 30 | 50.0% |
| Business | 0 | 0.0% |
| Education | 13 | 21.7% |
| Literature & Languages | 0 | 0.0% |
| Liberal Arts & History | 0 | 0.0% |
| Visual & Performing Arts | 0 | 0.0% |
| Communications | 0 | 0.0% |
| Arts & Humanities | 17 | 28.3% |
| Total | 60 | 100.0% |
Transportation & Commute in Adelino
Vehicle Availability by Sex in Adelino
The most prevalent vehicle ownership categories in Adelino are males with 2 vehicles (87, accounting for 43.9%) and females with 2 vehicles (31, making up 44.9%).
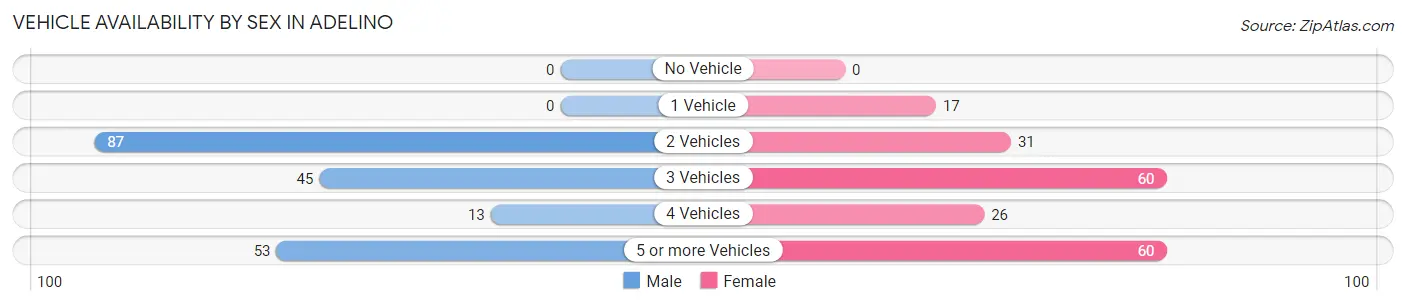
| Vehicles Available | Male | Female |
| No Vehicle | 0 (0.0%) | 0 (0.0%) |
| 1 Vehicle | 0 (0.0%) | 17 (8.8%) |
| 2 Vehicles | 87 (43.9%) | 31 (16.0%) |
| 3 Vehicles | 45 (22.7%) | 60 (30.9%) |
| 4 Vehicles | 13 (6.6%) | 26 (13.4%) |
| 5 or more Vehicles | 53 (26.8%) | 60 (30.9%) |
| Total | 198 (100.0%) | 194 (100.0%) |
Commute Time in Adelino
The most frequently occuring commute durations in Adelino are 15 to 19 minutes (131 commuters, 34.9%), 10 to 14 minutes (124 commuters, 33.1%), and 40 to 44 minutes (55 commuters, 14.7%).
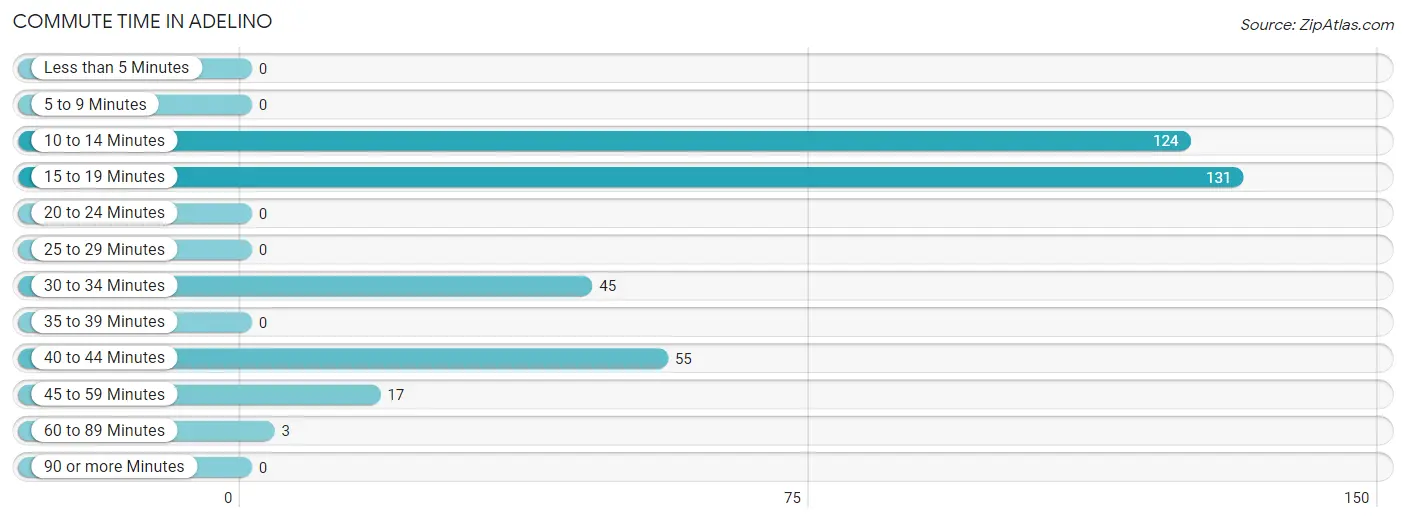
| Commute Time | # Commuters | % Commuters |
| Less than 5 Minutes | 0 | 0.0% |
| 5 to 9 Minutes | 0 | 0.0% |
| 10 to 14 Minutes | 124 | 33.1% |
| 15 to 19 Minutes | 131 | 34.9% |
| 20 to 24 Minutes | 0 | 0.0% |
| 25 to 29 Minutes | 0 | 0.0% |
| 30 to 34 Minutes | 45 | 12.0% |
| 35 to 39 Minutes | 0 | 0.0% |
| 40 to 44 Minutes | 55 | 14.7% |
| 45 to 59 Minutes | 17 | 4.5% |
| 60 to 89 Minutes | 3 | 0.8% |
| 90 or more Minutes | 0 | 0.0% |
Commute Time by Sex in Adelino
The most common commute times in Adelino are 10 to 14 minutes (124 commuters, 62.6%) for males and 15 to 19 minutes (131 commuters, 74.0%) for females.
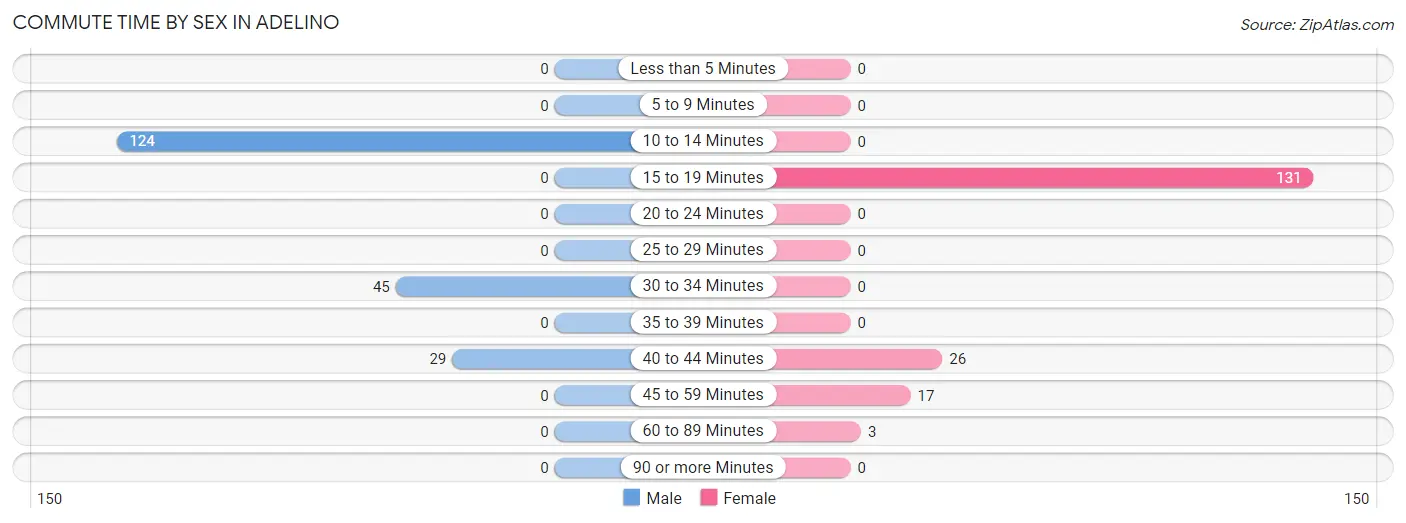
| Commute Time | Male | Female |
| Less than 5 Minutes | 0 (0.0%) | 0 (0.0%) |
| 5 to 9 Minutes | 0 (0.0%) | 0 (0.0%) |
| 10 to 14 Minutes | 124 (62.6%) | 0 (0.0%) |
| 15 to 19 Minutes | 0 (0.0%) | 131 (74.0%) |
| 20 to 24 Minutes | 0 (0.0%) | 0 (0.0%) |
| 25 to 29 Minutes | 0 (0.0%) | 0 (0.0%) |
| 30 to 34 Minutes | 45 (22.7%) | 0 (0.0%) |
| 35 to 39 Minutes | 0 (0.0%) | 0 (0.0%) |
| 40 to 44 Minutes | 29 (14.6%) | 26 (14.7%) |
| 45 to 59 Minutes | 0 (0.0%) | 17 (9.6%) |
| 60 to 89 Minutes | 0 (0.0%) | 3 (1.7%) |
| 90 or more Minutes | 0 (0.0%) | 0 (0.0%) |
Time of Departure to Work by Sex in Adelino
The most frequent times of departure to work in Adelino are 8:00 AM to 8:29 AM (71, 35.9%) for males and 6:30 AM to 6:59 AM (74, 41.8%) for females.
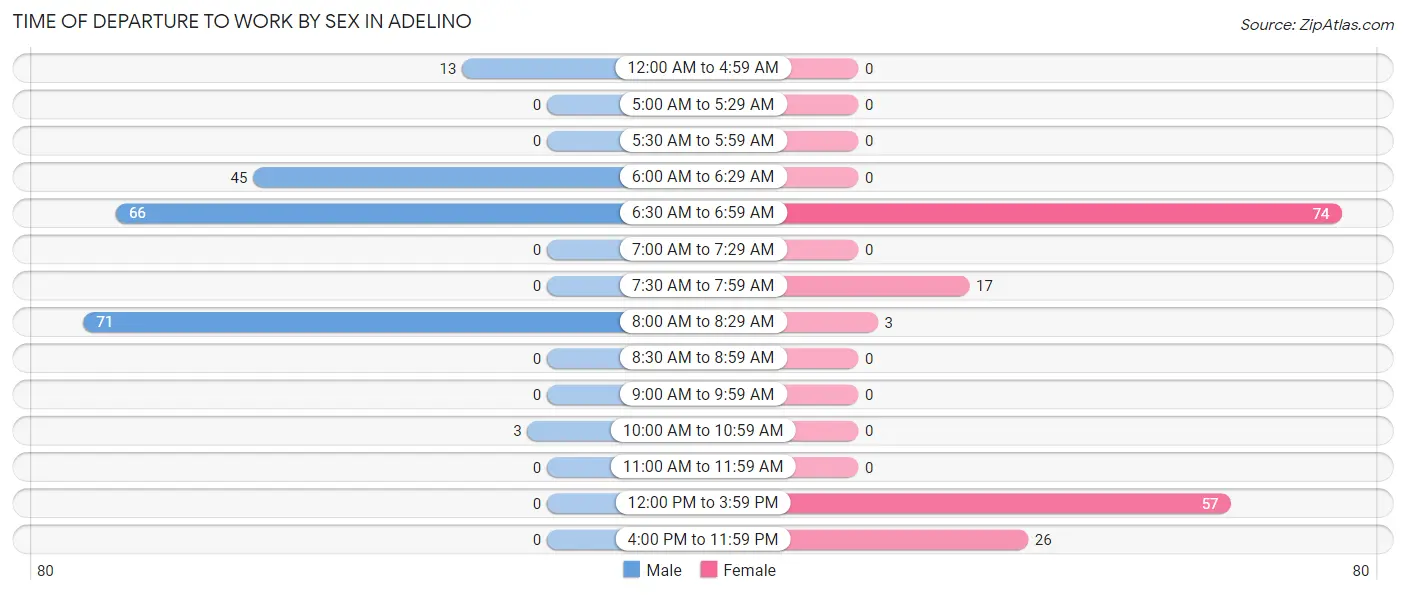
| Time of Departure | Male | Female |
| 12:00 AM to 4:59 AM | 13 (6.6%) | 0 (0.0%) |
| 5:00 AM to 5:29 AM | 0 (0.0%) | 0 (0.0%) |
| 5:30 AM to 5:59 AM | 0 (0.0%) | 0 (0.0%) |
| 6:00 AM to 6:29 AM | 45 (22.7%) | 0 (0.0%) |
| 6:30 AM to 6:59 AM | 66 (33.3%) | 74 (41.8%) |
| 7:00 AM to 7:29 AM | 0 (0.0%) | 0 (0.0%) |
| 7:30 AM to 7:59 AM | 0 (0.0%) | 17 (9.6%) |
| 8:00 AM to 8:29 AM | 71 (35.9%) | 3 (1.7%) |
| 8:30 AM to 8:59 AM | 0 (0.0%) | 0 (0.0%) |
| 9:00 AM to 9:59 AM | 0 (0.0%) | 0 (0.0%) |
| 10:00 AM to 10:59 AM | 3 (1.5%) | 0 (0.0%) |
| 11:00 AM to 11:59 AM | 0 (0.0%) | 0 (0.0%) |
| 12:00 PM to 3:59 PM | 0 (0.0%) | 57 (32.2%) |
| 4:00 PM to 11:59 PM | 0 (0.0%) | 26 (14.7%) |
| Total | 198 (100.0%) | 177 (100.0%) |
Housing Occupancy in Adelino
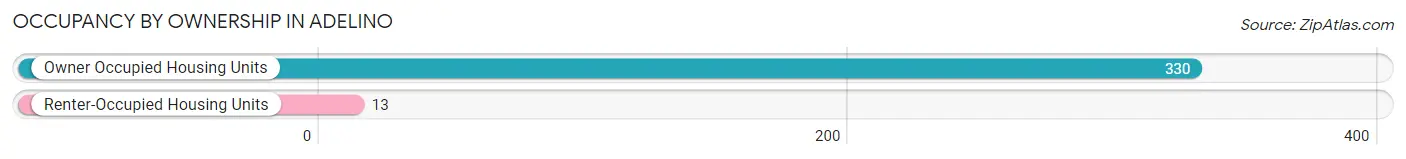
Occupancy by Ownership in Adelino
Of the total 343 dwellings in Adelino, owner-occupied units account for 330 (96.2%), while renter-occupied units make up 13 (3.8%).
| Occupancy | # Housing Units | % Housing Units |
| Owner Occupied Housing Units | 330 | 96.2% |
| Renter-Occupied Housing Units | 13 | 3.8% |
| Total Occupied Housing Units | 343 | 100.0% |
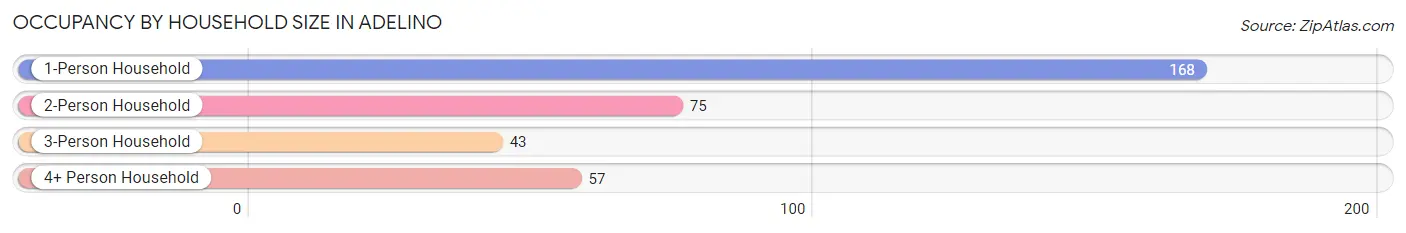
Occupancy by Household Size in Adelino
| Household Size | # Housing Units | % Housing Units |
| 1-Person Household | 168 | 49.0% |
| 2-Person Household | 75 | 21.9% |
| 3-Person Household | 43 | 12.5% |
| 4+ Person Household | 57 | 16.6% |
| Total Housing Units | 343 | 100.0% |
Occupancy by Ownership by Household Size in Adelino
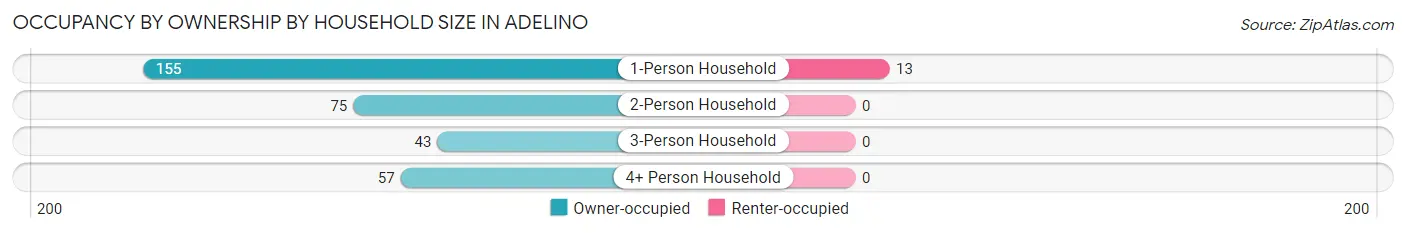
| Household Size | Owner-occupied | Renter-occupied |
| 1-Person Household | 155 (92.3%) | 13 (7.7%) |
| 2-Person Household | 75 (100.0%) | 0 (0.0%) |
| 3-Person Household | 43 (100.0%) | 0 (0.0%) |
| 4+ Person Household | 57 (100.0%) | 0 (0.0%) |
| Total Housing Units | 330 (96.2%) | 13 (3.8%) |
Occupancy by Educational Attainment in Adelino
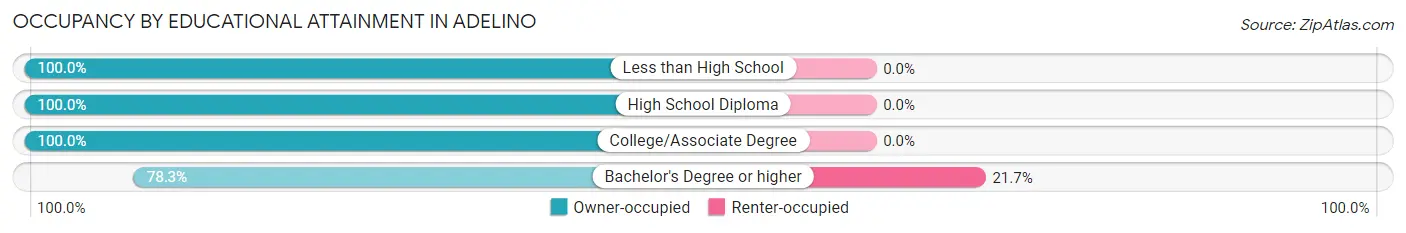
| Household Size | Owner-occupied | Renter-occupied |
| Less than High School | 79 (100.0%) | 0 (0.0%) |
| High School Diploma | 69 (100.0%) | 0 (0.0%) |
| College/Associate Degree | 135 (100.0%) | 0 (0.0%) |
| Bachelor's Degree or higher | 47 (78.3%) | 13 (21.7%) |
Occupancy by Age of Householder in Adelino
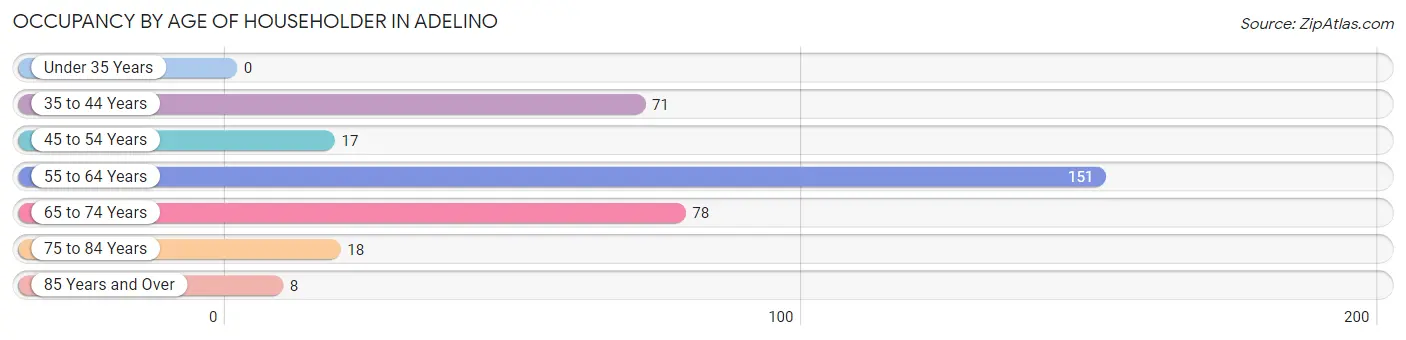
| Age Bracket | # Households | % Households |
| Under 35 Years | 0 | 0.0% |
| 35 to 44 Years | 71 | 20.7% |
| 45 to 54 Years | 17 | 5.0% |
| 55 to 64 Years | 151 | 44.0% |
| 65 to 74 Years | 78 | 22.7% |
| 75 to 84 Years | 18 | 5.2% |
| 85 Years and Over | 8 | 2.3% |
| Total | 343 | 100.0% |
Housing Finances in Adelino
Median Income by Occupancy in Adelino
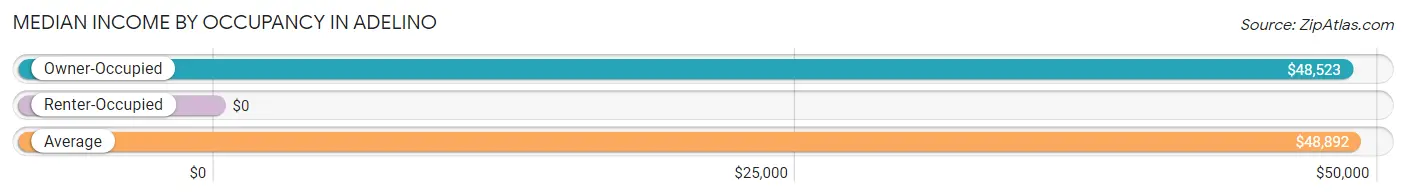
| Occupancy Type | # Households | Median Income |
| Owner-Occupied | 330 (96.2%) | $48,523 |
| Renter-Occupied | 13 (3.8%) | $0 |
| Average | 343 (100.0%) | $48,892 |
Occupancy by Householder Income Bracket in Adelino
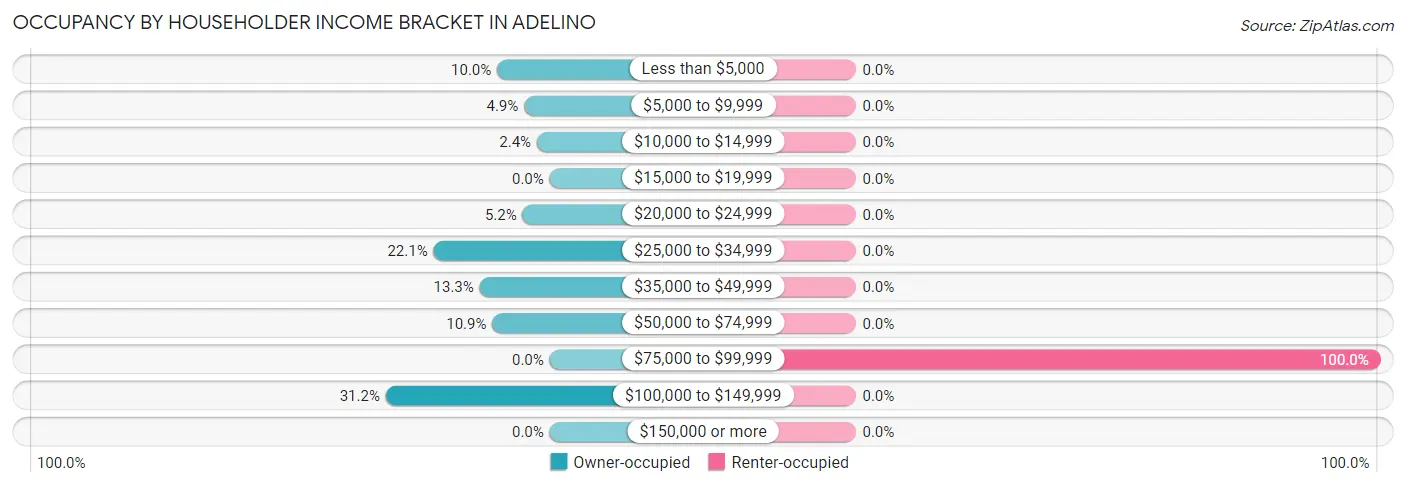
| Income Bracket | Owner-occupied | Renter-occupied |
| Less than $5,000 | 33 (10.0%) | 0 (0.0%) |
| $5,000 to $9,999 | 16 (4.9%) | 0 (0.0%) |
| $10,000 to $14,999 | 8 (2.4%) | 0 (0.0%) |
| $15,000 to $19,999 | 0 (0.0%) | 0 (0.0%) |
| $20,000 to $24,999 | 17 (5.1%) | 0 (0.0%) |
| $25,000 to $34,999 | 73 (22.1%) | 0 (0.0%) |
| $35,000 to $49,999 | 44 (13.3%) | 0 (0.0%) |
| $50,000 to $74,999 | 36 (10.9%) | 0 (0.0%) |
| $75,000 to $99,999 | 0 (0.0%) | 13 (100.0%) |
| $100,000 to $149,999 | 103 (31.2%) | 0 (0.0%) |
| $150,000 or more | 0 (0.0%) | 0 (0.0%) |
| Total | 330 (100.0%) | 13 (100.0%) |
Monthly Housing Cost Tiers in Adelino
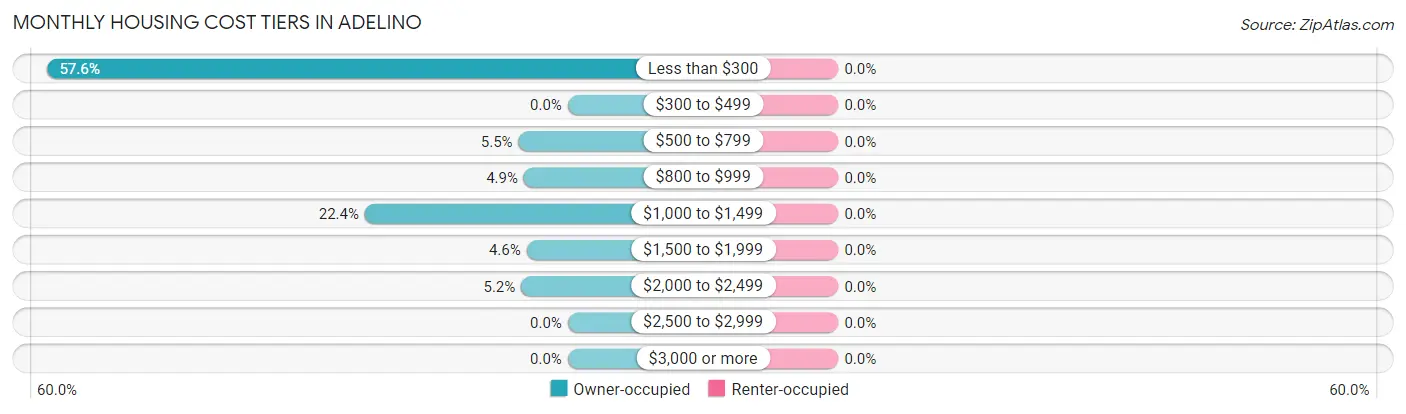
| Monthly Cost | Owner-occupied | Renter-occupied |
| Less than $300 | 190 (57.6%) | 0 (0.0%) |
| $300 to $499 | 0 (0.0%) | 0 (0.0%) |
| $500 to $799 | 18 (5.4%) | 0 (0.0%) |
| $800 to $999 | 16 (4.9%) | 0 (0.0%) |
| $1,000 to $1,499 | 74 (22.4%) | 0 (0.0%) |
| $1,500 to $1,999 | 15 (4.5%) | 0 (0.0%) |
| $2,000 to $2,499 | 17 (5.1%) | 0 (0.0%) |
| $2,500 to $2,999 | 0 (0.0%) | 0 (0.0%) |
| $3,000 or more | 0 (0.0%) | 0 (0.0%) |
| Total | 330 (100.0%) | 13 (100.0%) |
Physical Housing Characteristics in Adelino
Housing Structures in Adelino
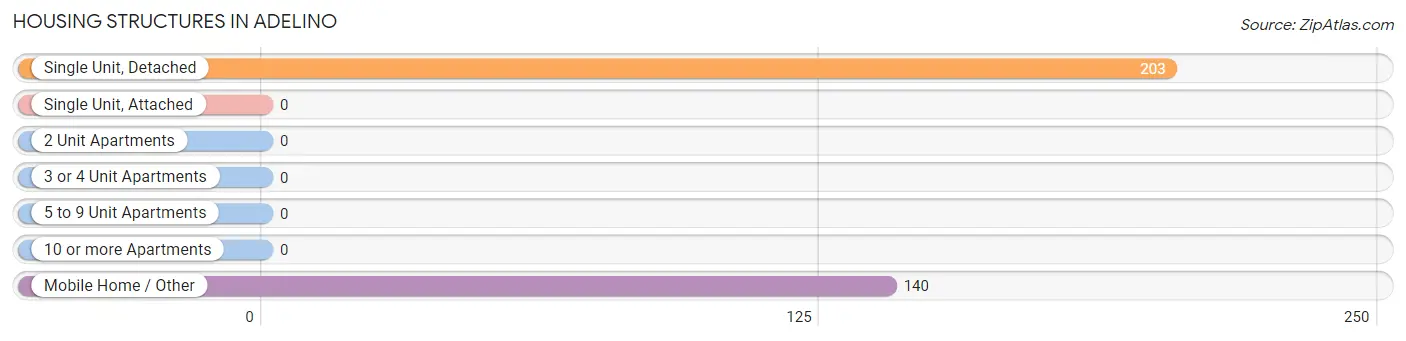
| Structure Type | # Housing Units | % Housing Units |
| Single Unit, Detached | 203 | 59.2% |
| Single Unit, Attached | 0 | 0.0% |
| 2 Unit Apartments | 0 | 0.0% |
| 3 or 4 Unit Apartments | 0 | 0.0% |
| 5 to 9 Unit Apartments | 0 | 0.0% |
| 10 or more Apartments | 0 | 0.0% |
| Mobile Home / Other | 140 | 40.8% |
| Total | 343 | 100.0% |
Housing Structures by Occupancy in Adelino
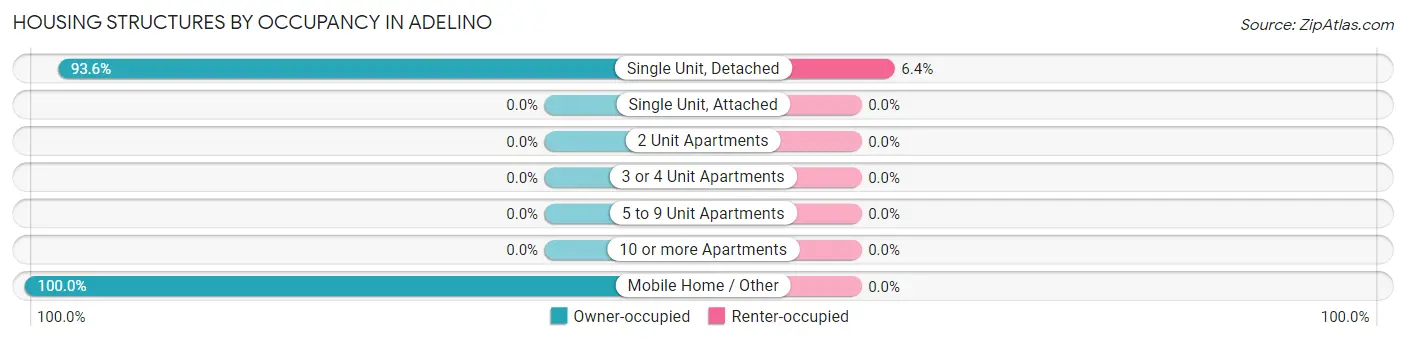
| Structure Type | Owner-occupied | Renter-occupied |
| Single Unit, Detached | 190 (93.6%) | 13 (6.4%) |
| Single Unit, Attached | 0 (0.0%) | 0 (0.0%) |
| 2 Unit Apartments | 0 (0.0%) | 0 (0.0%) |
| 3 or 4 Unit Apartments | 0 (0.0%) | 0 (0.0%) |
| 5 to 9 Unit Apartments | 0 (0.0%) | 0 (0.0%) |
| 10 or more Apartments | 0 (0.0%) | 0 (0.0%) |
| Mobile Home / Other | 140 (100.0%) | 0 (0.0%) |
| Total | 330 (96.2%) | 13 (3.8%) |
Housing Structures by Number of Rooms in Adelino
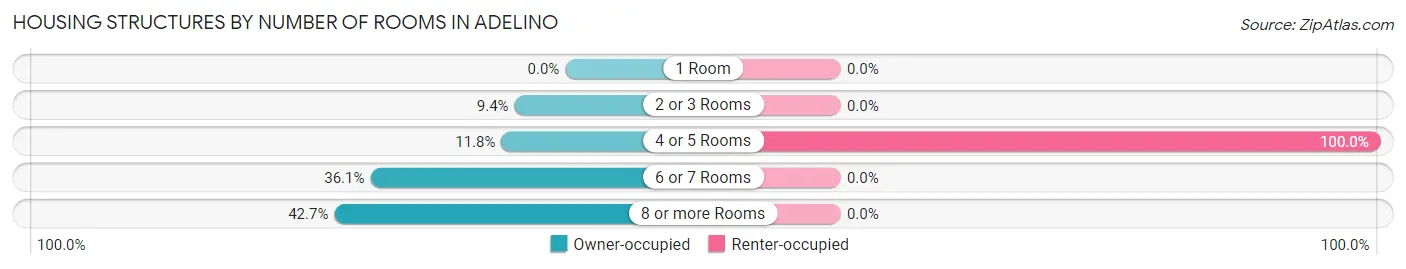
| Number of Rooms | Owner-occupied | Renter-occupied |
| 1 Room | 0 (0.0%) | 0 (0.0%) |
| 2 or 3 Rooms | 31 (9.4%) | 0 (0.0%) |
| 4 or 5 Rooms | 39 (11.8%) | 13 (100.0%) |
| 6 or 7 Rooms | 119 (36.1%) | 0 (0.0%) |
| 8 or more Rooms | 141 (42.7%) | 0 (0.0%) |
| Total | 330 (100.0%) | 13 (100.0%) |
Housing Structure by Heating Type in Adelino
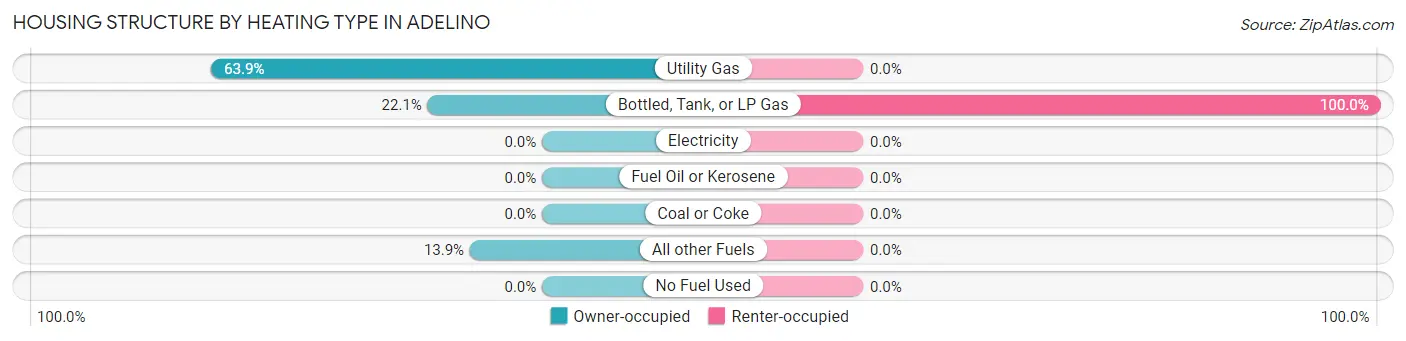
| Heating Type | Owner-occupied | Renter-occupied |
| Utility Gas | 211 (63.9%) | 0 (0.0%) |
| Bottled, Tank, or LP Gas | 73 (22.1%) | 13 (100.0%) |
| Electricity | 0 (0.0%) | 0 (0.0%) |
| Fuel Oil or Kerosene | 0 (0.0%) | 0 (0.0%) |
| Coal or Coke | 0 (0.0%) | 0 (0.0%) |
| All other Fuels | 46 (13.9%) | 0 (0.0%) |
| No Fuel Used | 0 (0.0%) | 0 (0.0%) |
| Total | 330 (100.0%) | 13 (100.0%) |
Household Vehicle Usage in Adelino
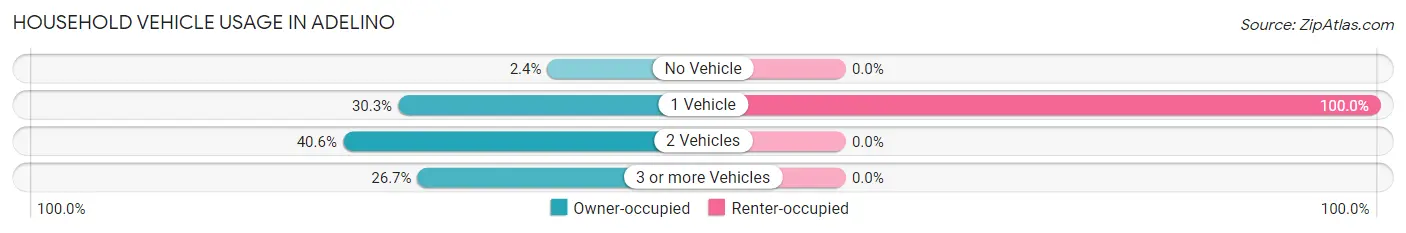
| Vehicles per Household | Owner-occupied | Renter-occupied |
| No Vehicle | 8 (2.4%) | 0 (0.0%) |
| 1 Vehicle | 100 (30.3%) | 13 (100.0%) |
| 2 Vehicles | 134 (40.6%) | 0 (0.0%) |
| 3 or more Vehicles | 88 (26.7%) | 0 (0.0%) |
| Total | 330 (100.0%) | 13 (100.0%) |
Real Estate & Mortgages in Adelino
Real Estate and Mortgage Overview in Adelino
| Characteristic | Without Mortgage | With Mortgage |
| Housing Units | 206 | 124 |
| Median Property Value | - | - |
| Median Household Income | $29,190 | $0 |
| Monthly Housing Costs | $267 | $0 |
| Real Estate Taxes | $693 | $0 |
Property Value by Mortgage Status in Adelino
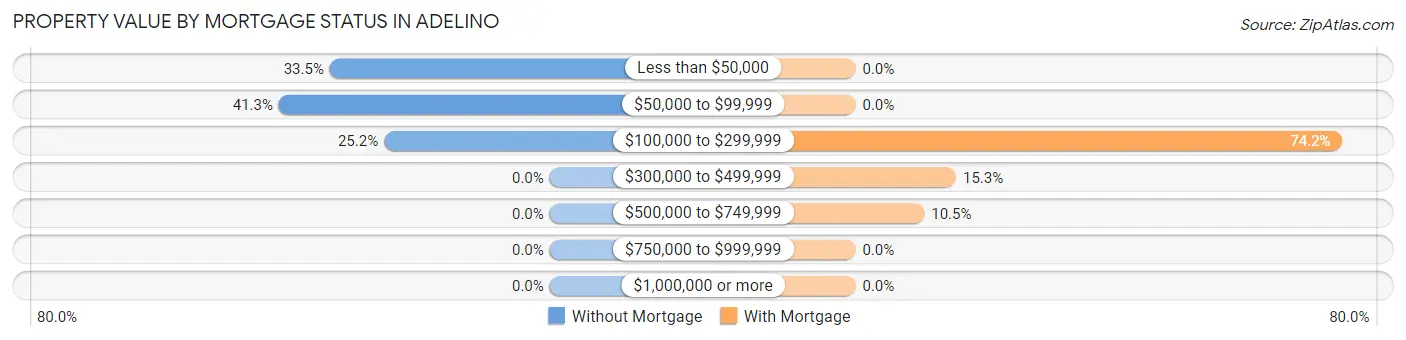
| Property Value | Without Mortgage | With Mortgage |
| Less than $50,000 | 69 (33.5%) | 0 (0.0%) |
| $50,000 to $99,999 | 85 (41.3%) | 0 (0.0%) |
| $100,000 to $299,999 | 52 (25.2%) | 92 (74.2%) |
| $300,000 to $499,999 | 0 (0.0%) | 19 (15.3%) |
| $500,000 to $749,999 | 0 (0.0%) | 13 (10.5%) |
| $750,000 to $999,999 | 0 (0.0%) | 0 (0.0%) |
| $1,000,000 or more | 0 (0.0%) | 0 (0.0%) |
| Total | 206 (100.0%) | 124 (100.0%) |
Household Income by Mortgage Status in Adelino
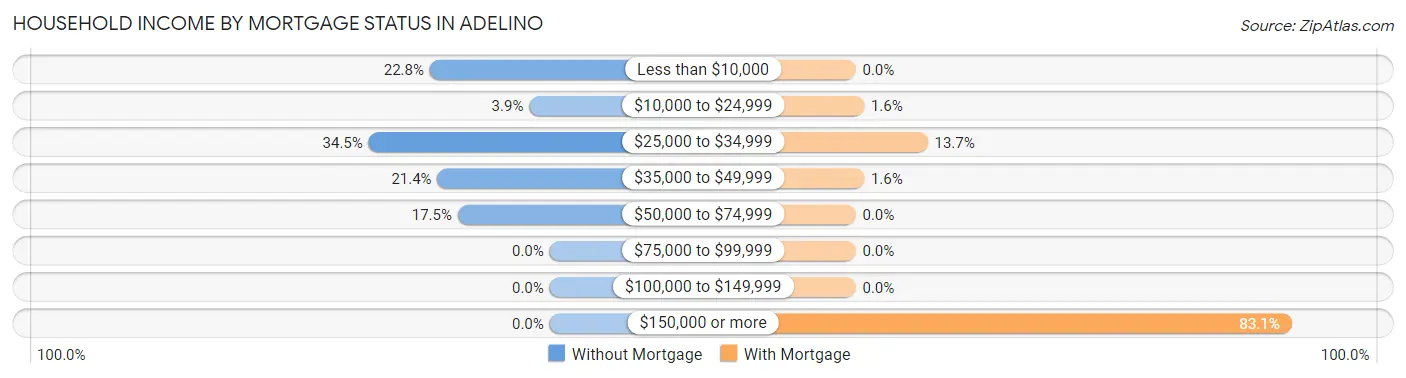
| Household Income | Without Mortgage | With Mortgage |
| Less than $10,000 | 47 (22.8%) | 0 (0.0%) |
| $10,000 to $24,999 | 8 (3.9%) | 2 (1.6%) |
| $25,000 to $34,999 | 71 (34.5%) | 17 (13.7%) |
| $35,000 to $49,999 | 44 (21.4%) | 2 (1.6%) |
| $50,000 to $74,999 | 36 (17.5%) | 0 (0.0%) |
| $75,000 to $99,999 | 0 (0.0%) | 0 (0.0%) |
| $100,000 to $149,999 | 0 (0.0%) | 0 (0.0%) |
| $150,000 or more | 0 (0.0%) | 103 (83.1%) |
| Total | 206 (100.0%) | 124 (100.0%) |
Property Value to Household Income Ratio in Adelino
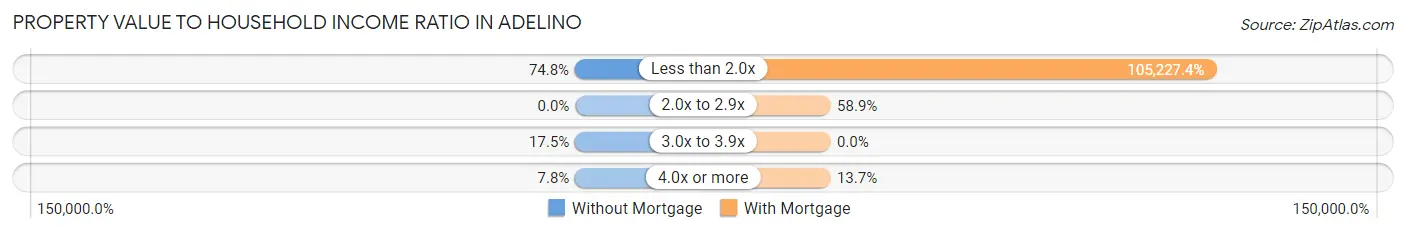
| Value-to-Income Ratio | Without Mortgage | With Mortgage |
| Less than 2.0x | 154 (74.8%) | 130,482 (105,227.4%) |
| 2.0x to 2.9x | 0 (0.0%) | 73 (58.9%) |
| 3.0x to 3.9x | 36 (17.5%) | 0 (0.0%) |
| 4.0x or more | 16 (7.8%) | 17 (13.7%) |
| Total | 206 (100.0%) | 124 (100.0%) |
Real Estate Taxes by Mortgage Status in Adelino
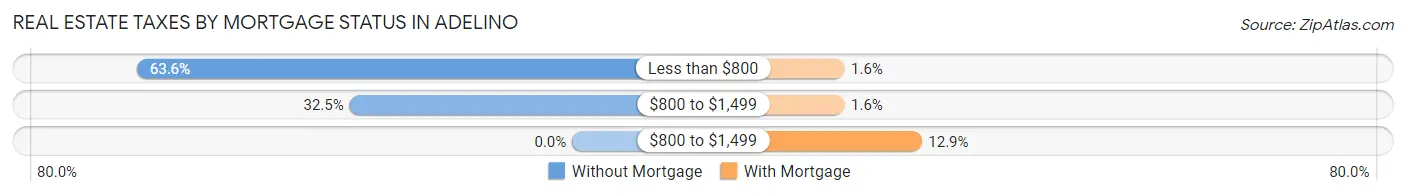
| Property Taxes | Without Mortgage | With Mortgage |
| Less than $800 | 131 (63.6%) | 2 (1.6%) |
| $800 to $1,499 | 67 (32.5%) | 2 (1.6%) |
| $800 to $1,499 | 0 (0.0%) | 16 (12.9%) |
| Total | 206 (100.0%) | 124 (100.0%) |
Health & Disability in Adelino
Health Insurance Coverage by Age in Adelino
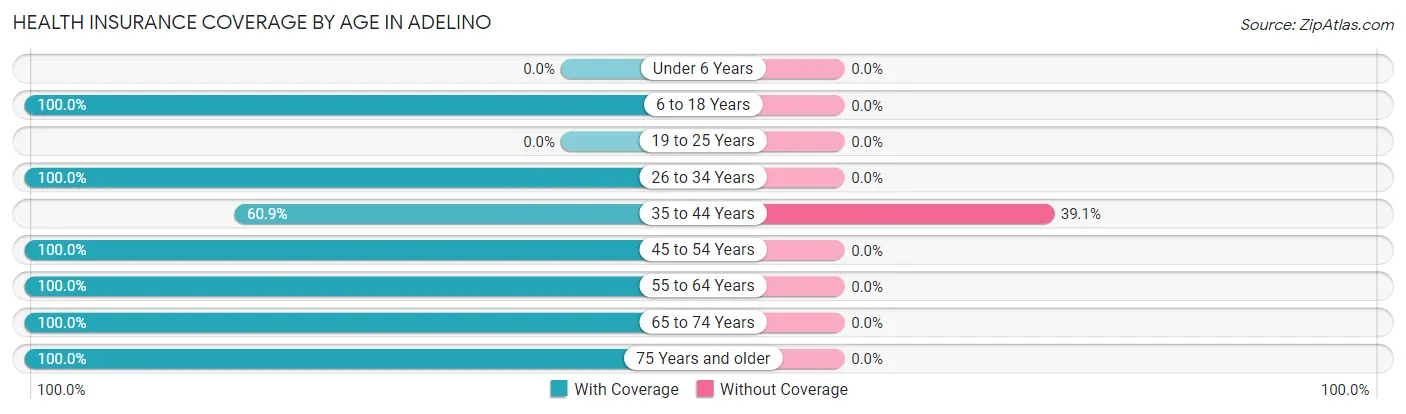
| Age Bracket | With Coverage | Without Coverage |
| Under 6 Years | 0 (0.0%) | 0 (0.0%) |
| 6 to 18 Years | 87 (100.0%) | 0 (0.0%) |
| 19 to 25 Years | 0 (0.0%) | 0 (0.0%) |
| 26 to 34 Years | 213 (100.0%) | 0 (0.0%) |
| 35 to 44 Years | 117 (60.9%) | 75 (39.1%) |
| 45 to 54 Years | 17 (100.0%) | 0 (0.0%) |
| 55 to 64 Years | 169 (100.0%) | 0 (0.0%) |
| 65 to 74 Years | 84 (100.0%) | 0 (0.0%) |
| 75 Years and older | 28 (100.0%) | 0 (0.0%) |
| Total | 715 (90.5%) | 75 (9.5%) |
Health Insurance Coverage by Citizenship Status in Adelino

| Citizenship Status | With Coverage | Without Coverage |
| Native Born | 0 (0.0%) | 0 (0.0%) |
| Foreign Born, Citizen | 87 (100.0%) | 0 (0.0%) |
| Foreign Born, not a Citizen | 0 (0.0%) | 0 (0.0%) |
Health Insurance Coverage by Household Income in Adelino
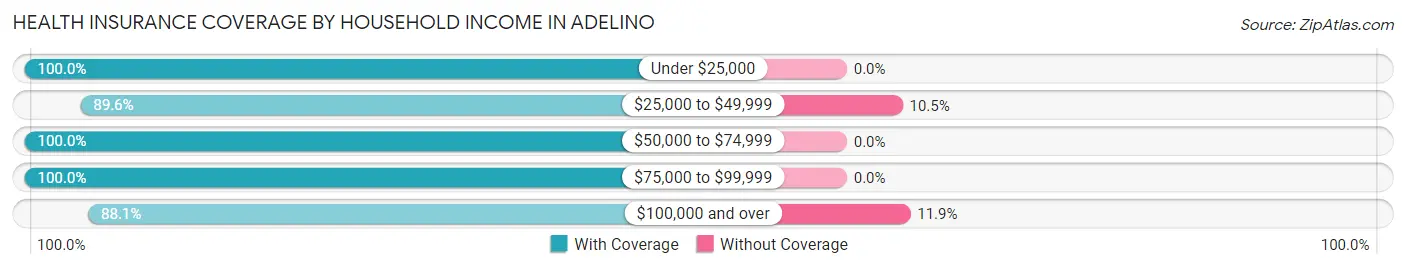
| Household Income | With Coverage | Without Coverage |
| Under $25,000 | 76 (100.0%) | 0 (0.0%) |
| $25,000 to $49,999 | 257 (89.5%) | 30 (10.4%) |
| $50,000 to $74,999 | 36 (100.0%) | 0 (0.0%) |
| $75,000 to $99,999 | 13 (100.0%) | 0 (0.0%) |
| $100,000 and over | 333 (88.1%) | 45 (11.9%) |
Public vs Private Health Insurance Coverage by Age in Adelino
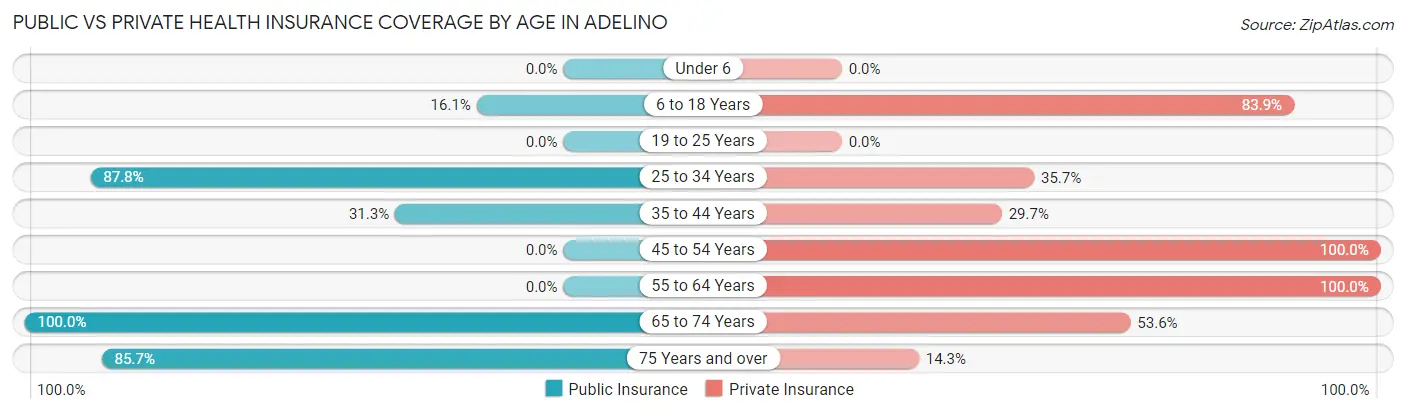
| Age Bracket | Public Insurance | Private Insurance |
| Under 6 | 0 (0.0%) | 0 (0.0%) |
| 6 to 18 Years | 14 (16.1%) | 73 (83.9%) |
| 19 to 25 Years | 0 (0.0%) | 0 (0.0%) |
| 25 to 34 Years | 187 (87.8%) | 76 (35.7%) |
| 35 to 44 Years | 60 (31.2%) | 57 (29.7%) |
| 45 to 54 Years | 0 (0.0%) | 17 (100.0%) |
| 55 to 64 Years | 0 (0.0%) | 169 (100.0%) |
| 65 to 74 Years | 84 (100.0%) | 45 (53.6%) |
| 75 Years and over | 24 (85.7%) | 4 (14.3%) |
| Total | 369 (46.7%) | 441 (55.8%) |
Disability Status by Sex by Age in Adelino
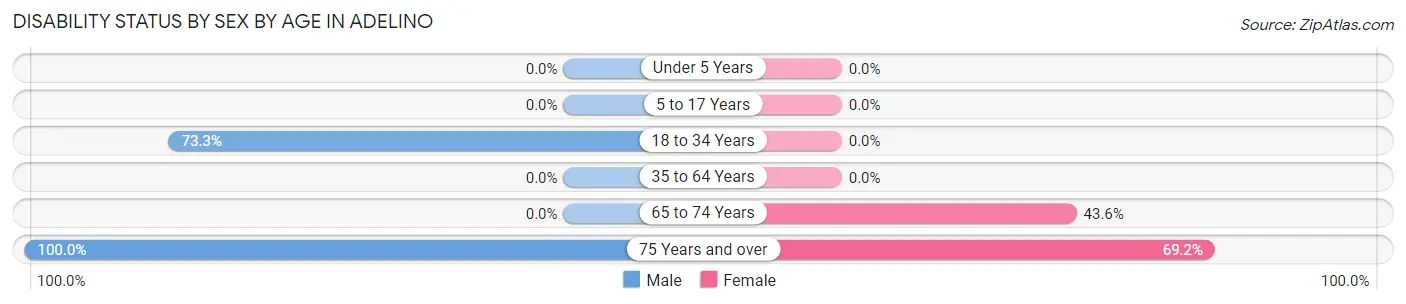
| Age Bracket | Male | Female |
| Under 5 Years | 0 (0.0%) | 0 (0.0%) |
| 5 to 17 Years | 0 (0.0%) | 0 (0.0%) |
| 18 to 34 Years | 137 (73.3%) | 0 (0.0%) |
| 35 to 64 Years | 0 (0.0%) | 0 (0.0%) |
| 65 to 74 Years | 0 (0.0%) | 17 (43.6%) |
| 75 Years and over | 2 (100.0%) | 18 (69.2%) |
Disability Class by Sex by Age in Adelino
Disability Class: Hearing Difficulty
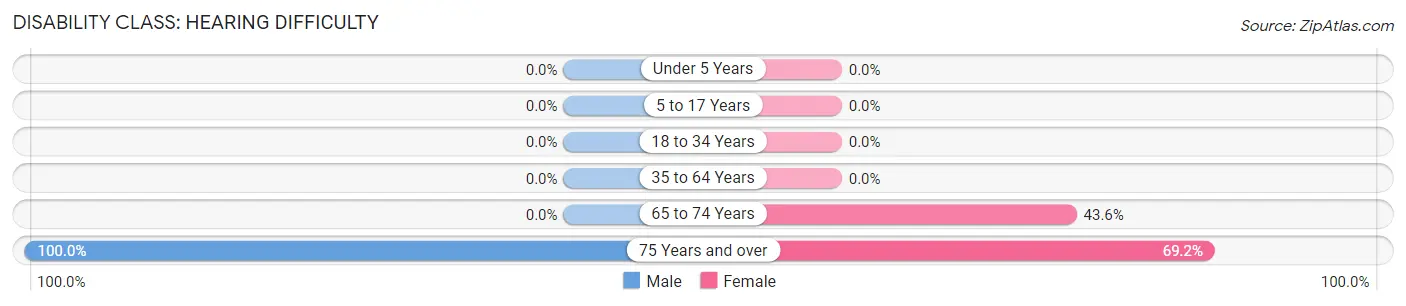
| Age Bracket | Male | Female |
| Under 5 Years | 0 (0.0%) | 0 (0.0%) |
| 5 to 17 Years | 0 (0.0%) | 0 (0.0%) |
| 18 to 34 Years | 0 (0.0%) | 0 (0.0%) |
| 35 to 64 Years | 0 (0.0%) | 0 (0.0%) |
| 65 to 74 Years | 0 (0.0%) | 17 (43.6%) |
| 75 Years and over | 2 (100.0%) | 18 (69.2%) |
Disability Class: Vision Difficulty
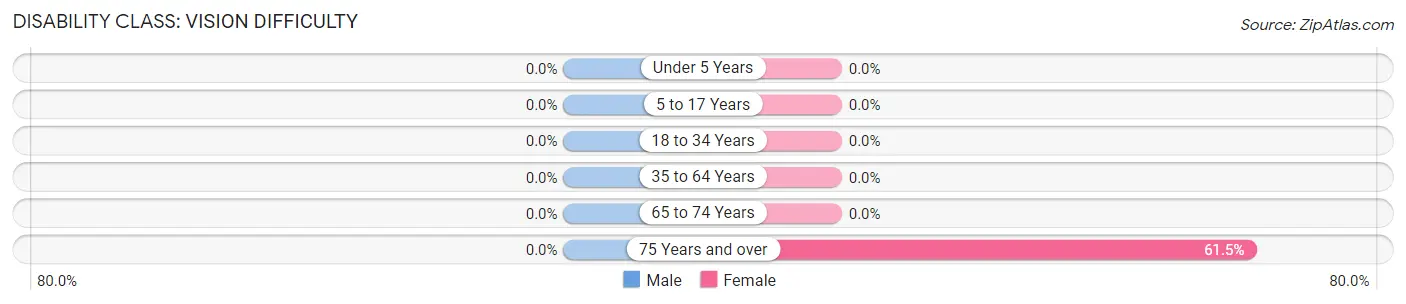
| Age Bracket | Male | Female |
| Under 5 Years | 0 (0.0%) | 0 (0.0%) |
| 5 to 17 Years | 0 (0.0%) | 0 (0.0%) |
| 18 to 34 Years | 0 (0.0%) | 0 (0.0%) |
| 35 to 64 Years | 0 (0.0%) | 0 (0.0%) |
| 65 to 74 Years | 0 (0.0%) | 0 (0.0%) |
| 75 Years and over | 0 (0.0%) | 16 (61.5%) |
Disability Class: Cognitive Difficulty
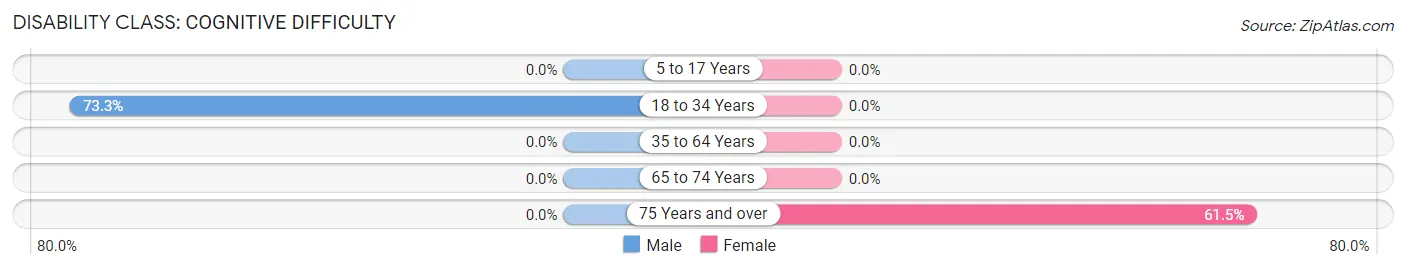
| Age Bracket | Male | Female |
| 5 to 17 Years | 0 (0.0%) | 0 (0.0%) |
| 18 to 34 Years | 137 (73.3%) | 0 (0.0%) |
| 35 to 64 Years | 0 (0.0%) | 0 (0.0%) |
| 65 to 74 Years | 0 (0.0%) | 0 (0.0%) |
| 75 Years and over | 0 (0.0%) | 16 (61.5%) |
Disability Class: Ambulatory Difficulty
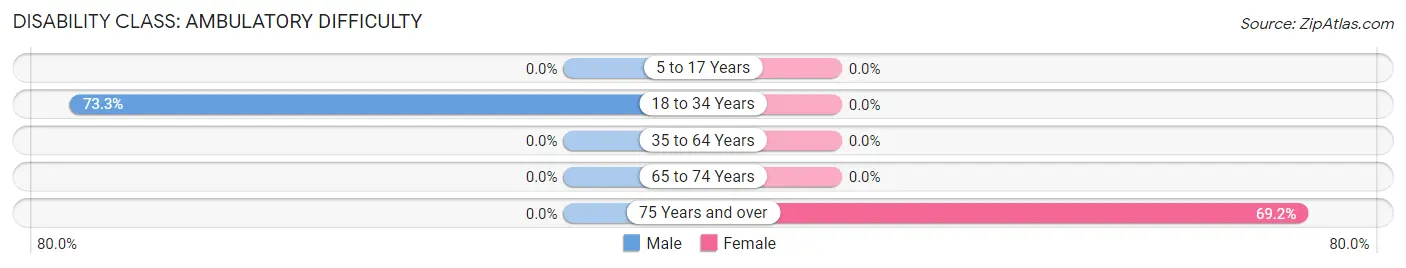
| Age Bracket | Male | Female |
| 5 to 17 Years | 0 (0.0%) | 0 (0.0%) |
| 18 to 34 Years | 137 (73.3%) | 0 (0.0%) |
| 35 to 64 Years | 0 (0.0%) | 0 (0.0%) |
| 65 to 74 Years | 0 (0.0%) | 0 (0.0%) |
| 75 Years and over | 0 (0.0%) | 18 (69.2%) |
Disability Class: Self-Care Difficulty
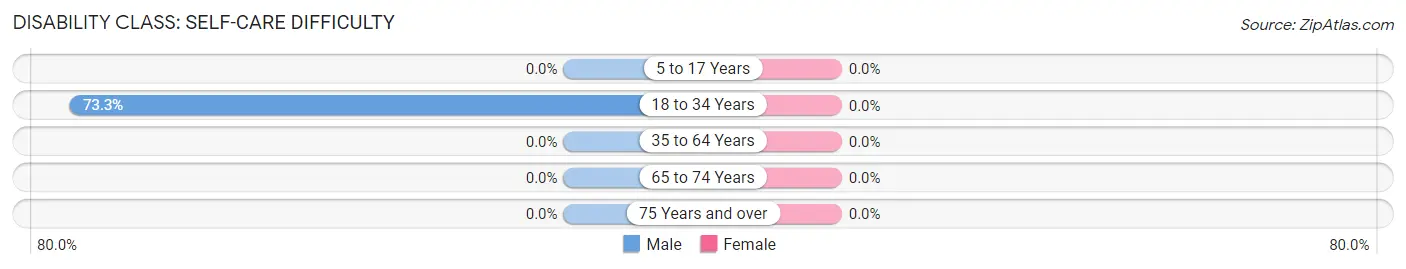
| Age Bracket | Male | Female |
| 5 to 17 Years | 0 (0.0%) | 0 (0.0%) |
| 18 to 34 Years | 137 (73.3%) | 0 (0.0%) |
| 35 to 64 Years | 0 (0.0%) | 0 (0.0%) |
| 65 to 74 Years | 0 (0.0%) | 0 (0.0%) |
| 75 Years and over | 0 (0.0%) | 0 (0.0%) |
Technology Access in Adelino
Computing Device Access in Adelino
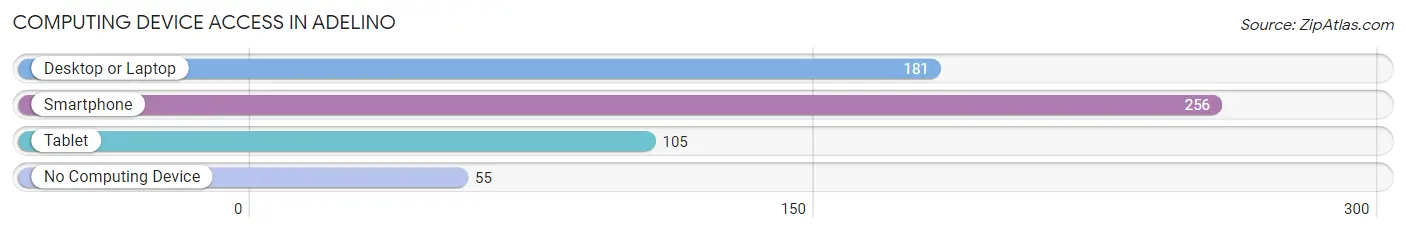
| Device Type | # Households | % Households |
| Desktop or Laptop | 181 | 52.8% |
| Smartphone | 256 | 74.6% |
| Tablet | 105 | 30.6% |
| No Computing Device | 55 | 16.0% |
| Total | 343 | 100.0% |
Internet Access in Adelino
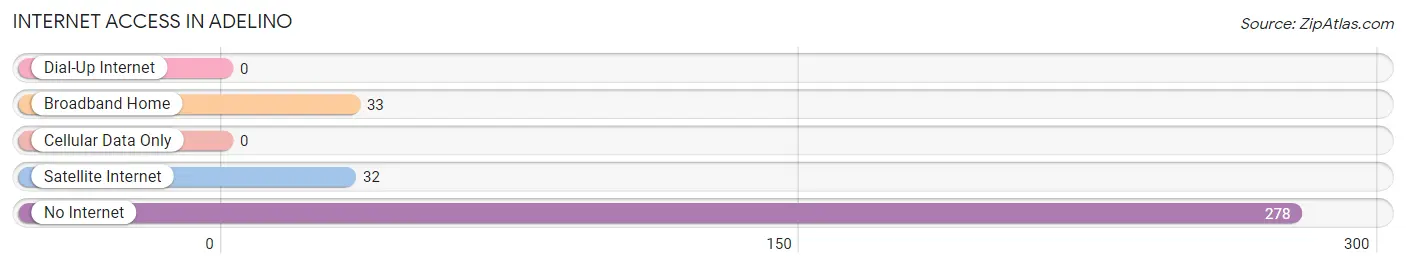
| Internet Type | # Households | % Households |
| Dial-Up Internet | 0 | 0.0% |
| Broadband Home | 33 | 9.6% |
| Cellular Data Only | 0 | 0.0% |
| Satellite Internet | 32 | 9.3% |
| No Internet | 278 | 81.0% |
| Total | 343 | 100.0% |
Adelino Summary
Adelino, New Mexico is a small unincorporated community located in the northern part of the state. It is situated in the foothills of the Sangre de Cristo Mountains, approximately 25 miles north of Santa Fe. Adelino is a rural community with a population of approximately 500 people.
History
Adelino was founded in the late 1800s by a group of settlers from the nearby town of Las Vegas. The settlers were attracted to the area due to its fertile soil and abundant water supply. The town was named after a local rancher, Adelino Martinez.
The town grew slowly over the years, but it was not until the early 1900s that it began to experience significant growth. This was due to the arrival of the railroad, which allowed for the transportation of goods and people to and from the area.
The town continued to grow throughout the 20th century, and by the year 2000, the population had reached 500 people.
Geography
Adelino is located in the northern part of New Mexico, in the foothills of the Sangre de Cristo Mountains. The town is situated at an elevation of 6,000 feet above sea level.
The climate in Adelino is semi-arid, with hot summers and cold winters. The average annual temperature is approximately 50 degrees Fahrenheit.
The town is located in a rural area, and the surrounding landscape is mostly flat with some rolling hills. The area is sparsely populated, with the nearest large city being Santa Fe, which is located approximately 25 miles to the south.
Economy
The economy of Adelino is largely based on agriculture. The town is home to several small farms, which produce a variety of crops, including corn, wheat, and hay.
The town also has a few small businesses, including a general store, a gas station, and a restaurant.
Demographics
As of the year 2000, the population of Adelino was approximately 500 people. The majority of the population is of Hispanic or Latino descent. The median household income is approximately $30,000 per year.
The town is served by a single school, Adelino Elementary School, which serves students in grades K-8. The school is part of the Santa Fe Public Schools system.
Conclusion
Adelino, New Mexico is a small unincorporated community located in the northern part of the state. It is situated in the foothills of the Sangre de Cristo Mountains, approximately 25 miles north of Santa Fe. Adelino is a rural community with a population of approximately 500 people. The town’s economy is largely based on agriculture, and the majority of the population is of Hispanic or Latino descent. Adelino is served by a single school, Adelino Elementary School, which serves students in grades K-8.
Common Questions
What is Per Capita Income in Adelino?
Per Capita income in Adelino is $29,445.
What is the Median Household income in Adelino?
Median Household Income in Adelino is $48,892.
What is Inequality or Gini Index in Adelino?
Inequality or Gini Index in Adelino is 0.43.
What is the Total Population of Adelino?
Total Population of Adelino is 790.
What is the Total Male Population of Adelino?
Total Male Population of Adelino is 445.
What is the Total Female Population of Adelino?
Total Female Population of Adelino is 345.
What is the Ratio of Males per 100 Females in Adelino?
There are 128.99 Males per 100 Females in Adelino.
What is the Ratio of Females per 100 Males in Adelino?
There are 77.53 Females per 100 Males in Adelino.
What is the Median Population Age in Adelino?
Median Population Age in Adelino is 36.9 Years.
What is the Average Family Size in Adelino
Average Family Size in Adelino is 3.5 People.
What is the Average Household Size in Adelino
Average Household Size in Adelino is 2.3 People.
How Large is the Labor Force in Adelino?
There are 392 People in the Labor Forcein in Adelino.
What is the Percentage of People in the Labor Force in Adelino?
54.4% of People are in the Labor Force in Adelino.