La Hacienda, NM Map & Demographics
La Hacienda Map
La Hacienda Overview
$15,568
PER CAPITA INCOME
0.31
INEQUALITY / GINI INDEX
656
TOTAL POPULATION
302
MALE POPULATION
354
FEMALE POPULATION
85.31
MALES / 100 FEMALES
117.22
FEMALES / 100 MALES
26.0
MEDIAN AGE
2.7
AVG FAMILY SIZE
2.9
AVG HOUSEHOLD SIZE
133
LABOR FORCE [ PEOPLE ]
29.8%
PERCENT IN LABOR FORCE
Income in La Hacienda
Income Overview in La Hacienda
| Characteristic | Number | Measure |
| Per Capita Income | 656 | $15,568 |
| Median Family Income | 227 | $0 |
| Mean Family Income | 227 | $35,729 |
| Median Household Income | 229 | $0 |
| Mean Household Income | 229 | $47,426 |
| Income Deficit | 227 | $0 |
| Wage / Income Gap (%) | 656 | 0.00% |
| Wage / Income Gap ($) | 656 | 100.00¢ per $1 |
| Gini / Inequality Index | 656 | 0.31 |
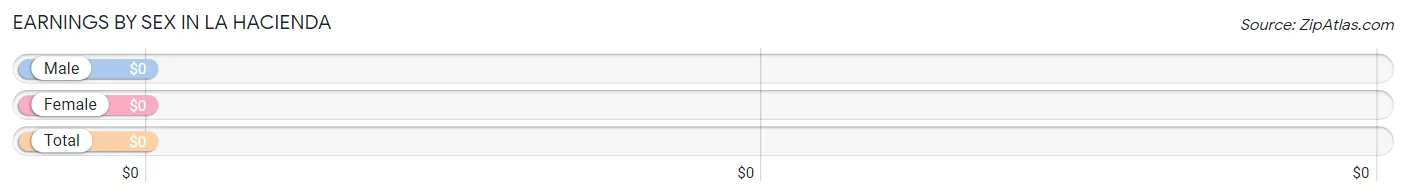
Earnings by Sex in La Hacienda
| Sex | Number | Average Earnings |
| Male | 86 (64.7%) | $0 |
| Female | 47 (35.3%) | $0 |
| Total | 133 (100.0%) | $0 |
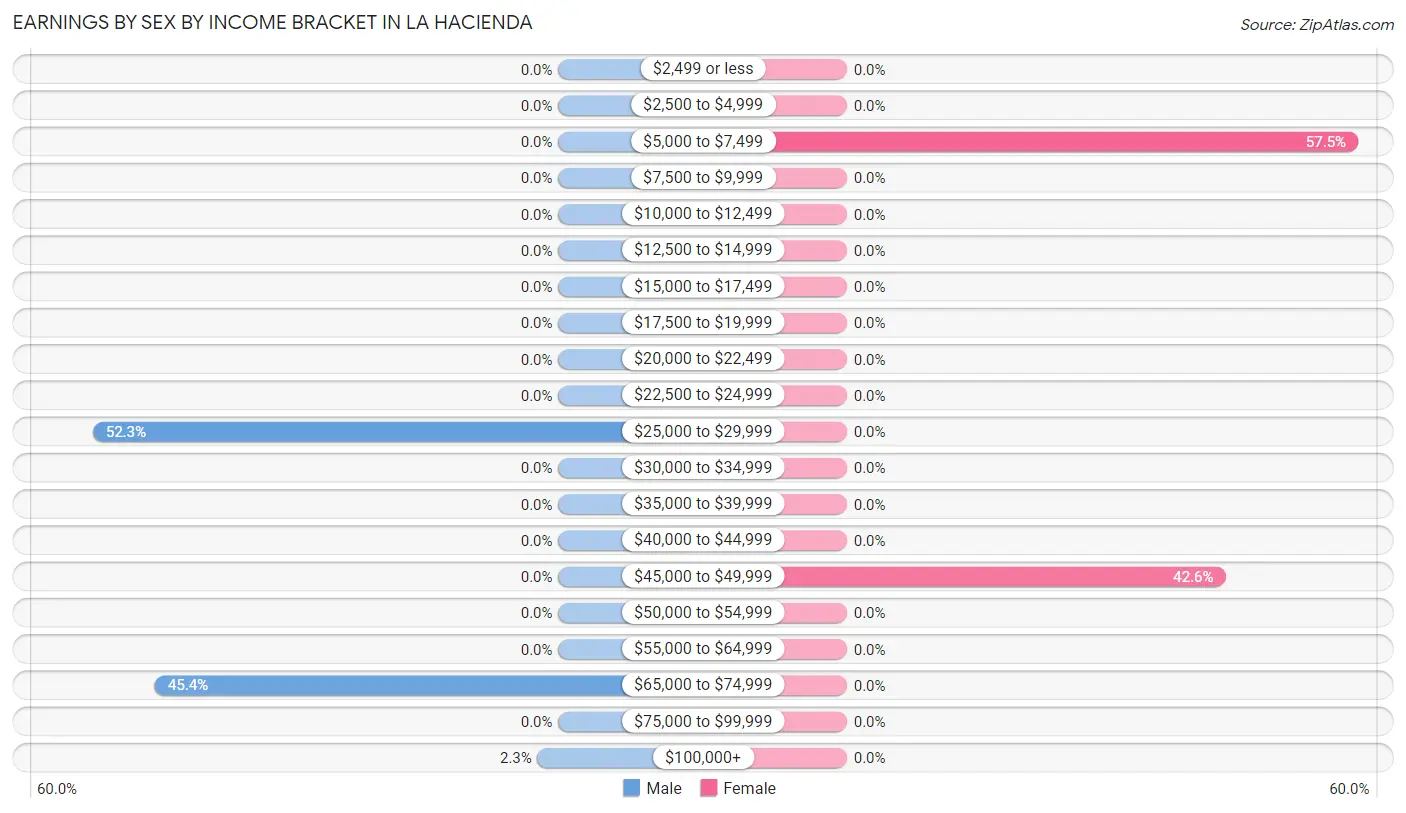
Earnings by Sex by Income Bracket in La Hacienda
The most common earnings brackets in La Hacienda are $25,000 to $29,999 for men (45 | 52.3%) and $5,000 to $7,499 for women (27 | 57.5%).
| Income | Male | Female |
| $2,499 or less | 0 (0.0%) | 0 (0.0%) |
| $2,500 to $4,999 | 0 (0.0%) | 0 (0.0%) |
| $5,000 to $7,499 | 0 (0.0%) | 27 (57.5%) |
| $7,500 to $9,999 | 0 (0.0%) | 0 (0.0%) |
| $10,000 to $12,499 | 0 (0.0%) | 0 (0.0%) |
| $12,500 to $14,999 | 0 (0.0%) | 0 (0.0%) |
| $15,000 to $17,499 | 0 (0.0%) | 0 (0.0%) |
| $17,500 to $19,999 | 0 (0.0%) | 0 (0.0%) |
| $20,000 to $22,499 | 0 (0.0%) | 0 (0.0%) |
| $22,500 to $24,999 | 0 (0.0%) | 0 (0.0%) |
| $25,000 to $29,999 | 45 (52.3%) | 0 (0.0%) |
| $30,000 to $34,999 | 0 (0.0%) | 0 (0.0%) |
| $35,000 to $39,999 | 0 (0.0%) | 0 (0.0%) |
| $40,000 to $44,999 | 0 (0.0%) | 0 (0.0%) |
| $45,000 to $49,999 | 0 (0.0%) | 20 (42.5%) |
| $50,000 to $54,999 | 0 (0.0%) | 0 (0.0%) |
| $55,000 to $64,999 | 0 (0.0%) | 0 (0.0%) |
| $65,000 to $74,999 | 39 (45.4%) | 0 (0.0%) |
| $75,000 to $99,999 | 0 (0.0%) | 0 (0.0%) |
| $100,000+ | 2 (2.3%) | 0 (0.0%) |
| Total | 86 (100.0%) | 47 (100.0%) |
Earnings by Sex by Educational Attainment in La Hacienda
| Educational Attainment | Male Income | Female Income |
| Less than High School | - | - |
| High School Diploma | - | - |
| College or Associate's Degree | - | - |
| Bachelor's Degree | - | - |
| Graduate Degree | - | - |
| Total | - | - |
Family Income in La Hacienda
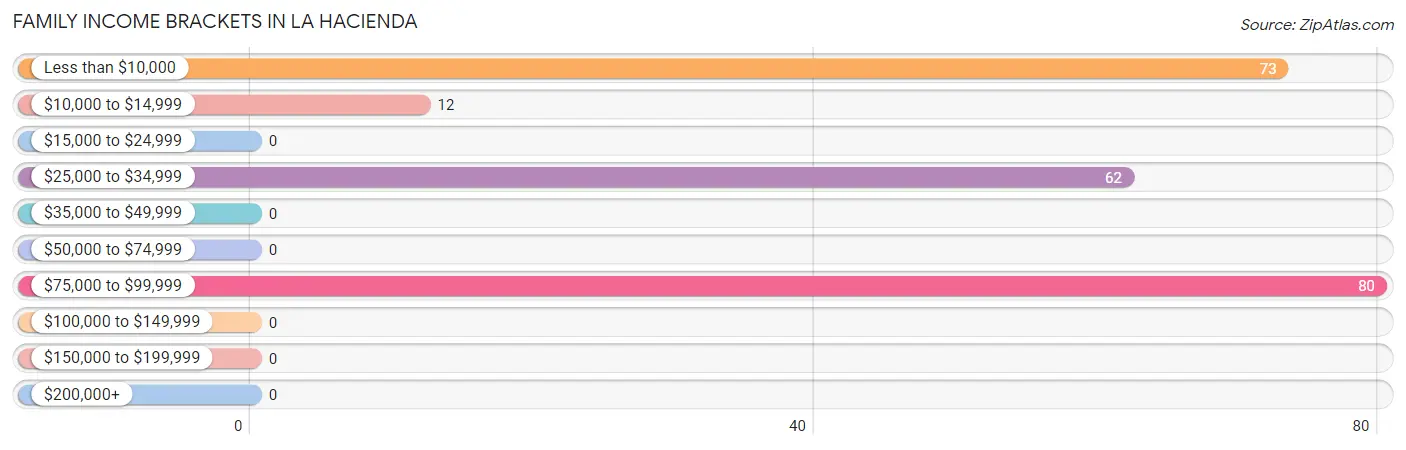
Family Income Brackets in La Hacienda
According to the La Hacienda family income data, there are 80 families falling into the $75,000 to $99,999 income range, which is the most common income bracket and makes up 35.2% of all families.
| Income Bracket | # Families | % Families |
| Less than $10,000 | 73 | 32.2% |
| $10,000 to $14,999 | 12 | 5.3% |
| $15,000 to $24,999 | 0 | 0.0% |
| $25,000 to $34,999 | 62 | 27.3% |
| $35,000 to $49,999 | 0 | 0.0% |
| $50,000 to $74,999 | 0 | 0.0% |
| $75,000 to $99,999 | 80 | 35.2% |
| $100,000 to $149,999 | 0 | 0.0% |
| $150,000 to $199,999 | 0 | 0.0% |
| $200,000+ | 0 | 0.0% |
Family Income by Famaliy Size in La Hacienda
| Income Bracket | # Families | Median Income |
| 2-Person Families | 127 (55.9%) | $0 |
| 3-Person Families | 73 (32.2%) | $0 |
| 4-Person Families | 27 (11.9%) | $0 |
| 5-Person Families | 0 (0.0%) | $0 |
| 6-Person Families | 0 (0.0%) | $0 |
| 7+ Person Families | 0 (0.0%) | $0 |
| Total | 227 (100.0%) | $0 |
Family Income by Number of Earners in La Hacienda
| Number of Earners | # Families | Median Income |
| No Earners | 180 (79.3%) | $0 |
| 1 Earner | 20 (8.8%) | $0 |
| 2 Earners | 27 (11.9%) | $0 |
| 3+ Earners | 0 (0.0%) | $0 |
| Total | 227 (100.0%) | $0 |
Household Income in La Hacienda
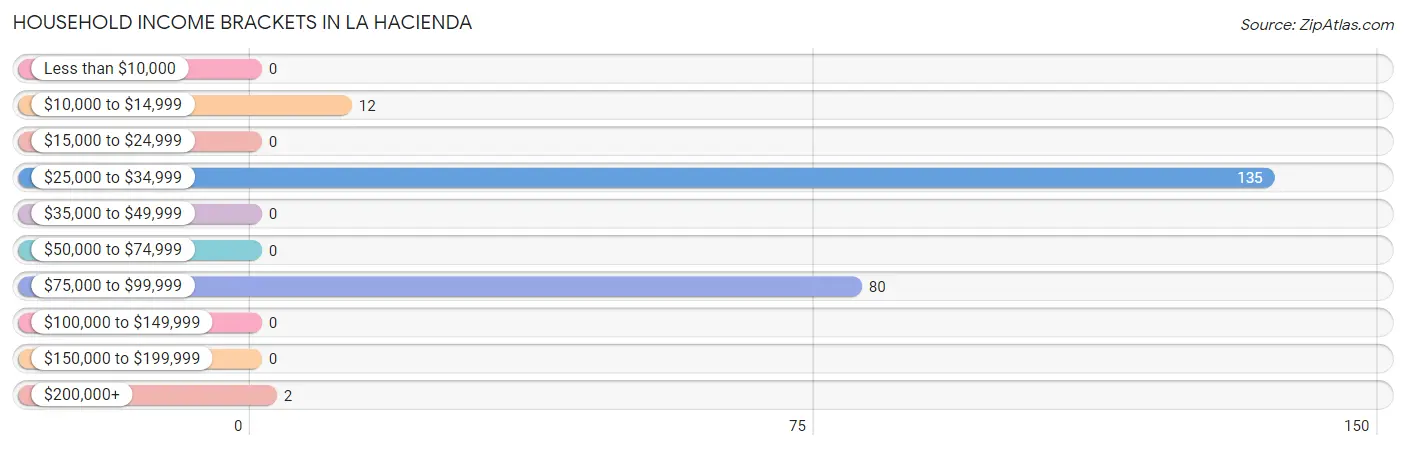
Household Income Brackets in La Hacienda
With 135 households falling in the category, the $25,000 to $34,999 income range is the most frequent in La Hacienda, accounting for 59.0% of all households.
| Income Bracket | # Households | % Households |
| Less than $10,000 | 0 | 0.0% |
| $10,000 to $14,999 | 12 | 5.2% |
| $15,000 to $24,999 | 0 | 0.0% |
| $25,000 to $34,999 | 135 | 59.0% |
| $35,000 to $49,999 | 0 | 0.0% |
| $50,000 to $74,999 | 0 | 0.0% |
| $75,000 to $99,999 | 80 | 34.9% |
| $100,000 to $149,999 | 0 | 0.0% |
| $150,000 to $199,999 | 0 | 0.0% |
| $200,000+ | 2 | 0.9% |
Household Income by Householder Age in La Hacienda
| Income Bracket | # Households | Median Income |
| 15 to 24 Years | 73 (31.9%) | $0 |
| 25 to 44 Years | 27 (11.8%) | $0 |
| 45 to 64 Years | 20 (8.7%) | $0 |
| 65+ Years | 109 (47.6%) | $0 |
| Total | 229 (100.0%) | $0 |
Poverty in La Hacienda
Income Below Poverty by Sex and Age in La Hacienda
With 18.5% poverty level for males and 52.3% for females among the residents of La Hacienda, 5 year old males and under 5 year old females are the most vulnerable to poverty, with 44 males (100.0%) and 92 females (100.0%) in their respective age groups living below the poverty level.
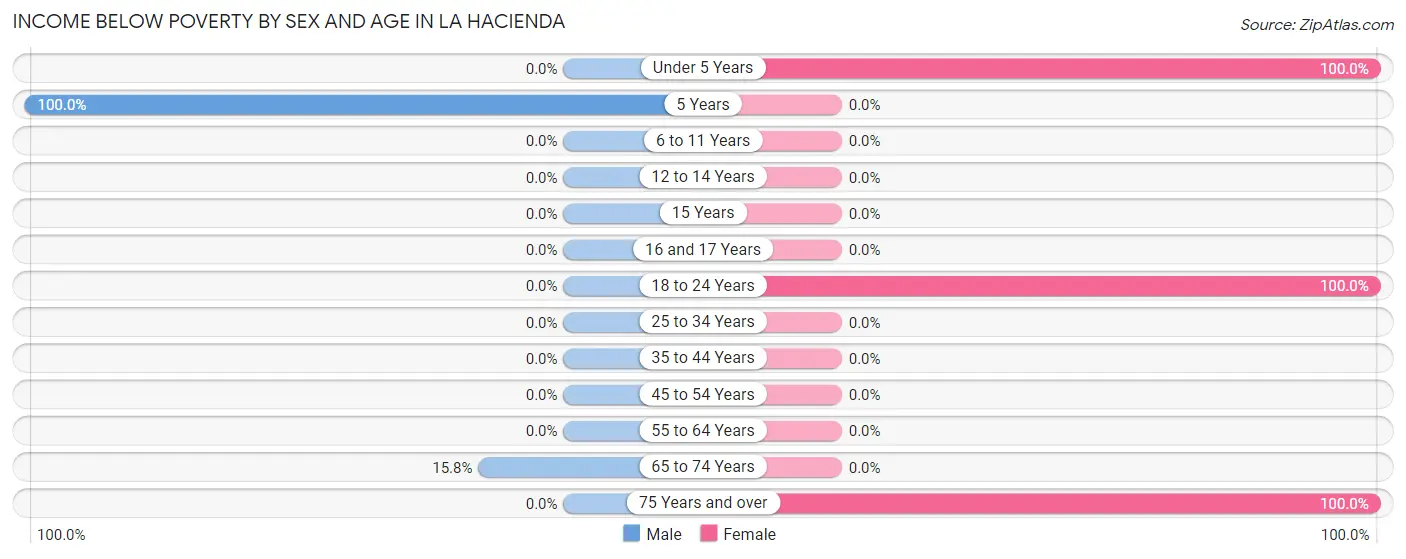
| Age Bracket | Male | Female |
| Under 5 Years | 0 (0.0%) | 92 (100.0%) |
| 5 Years | 44 (100.0%) | 0 (0.0%) |
| 6 to 11 Years | 0 (0.0%) | 0 (0.0%) |
| 12 to 14 Years | 0 (0.0%) | 0 (0.0%) |
| 15 Years | 0 (0.0%) | 0 (0.0%) |
| 16 and 17 Years | 0 (0.0%) | 0 (0.0%) |
| 18 to 24 Years | 0 (0.0%) | 73 (100.0%) |
| 25 to 34 Years | 0 (0.0%) | 0 (0.0%) |
| 35 to 44 Years | 0 (0.0%) | 0 (0.0%) |
| 45 to 54 Years | 0 (0.0%) | 0 (0.0%) |
| 55 to 64 Years | 0 (0.0%) | 0 (0.0%) |
| 65 to 74 Years | 12 (15.8%) | 0 (0.0%) |
| 75 Years and over | 0 (0.0%) | 20 (100.0%) |
| Total | 56 (18.5%) | 185 (52.3%) |
Income Above Poverty by Sex and Age in La Hacienda
According to the poverty statistics in La Hacienda, males aged 6 to 11 years and females aged 6 to 11 years are the age groups that are most secure financially, with 100.0% of males and 100.0% of females in these age groups living above the poverty line.
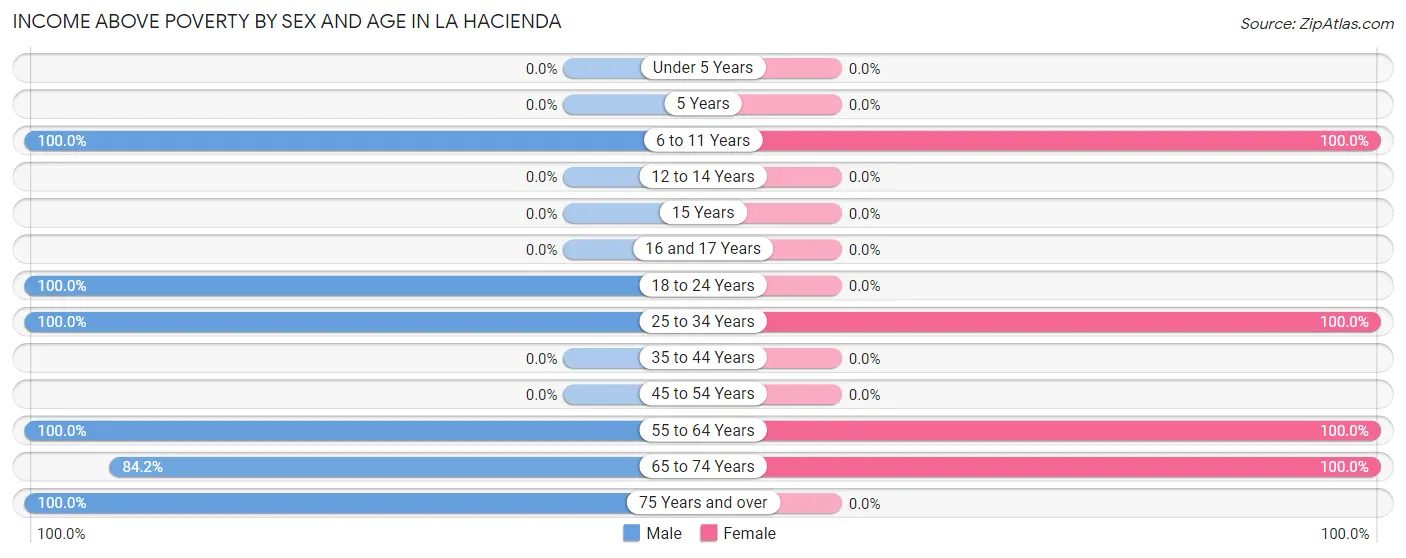
| Age Bracket | Male | Female |
| Under 5 Years | 0 (0.0%) | 0 (0.0%) |
| 5 Years | 0 (0.0%) | 0 (0.0%) |
| 6 to 11 Years | 34 (100.0%) | 40 (100.0%) |
| 12 to 14 Years | 0 (0.0%) | 0 (0.0%) |
| 15 Years | 0 (0.0%) | 0 (0.0%) |
| 16 and 17 Years | 0 (0.0%) | 0 (0.0%) |
| 18 to 24 Years | 45 (100.0%) | 0 (0.0%) |
| 25 to 34 Years | 39 (100.0%) | 27 (100.0%) |
| 35 to 44 Years | 0 (0.0%) | 0 (0.0%) |
| 45 to 54 Years | 0 (0.0%) | 0 (0.0%) |
| 55 to 64 Years | 31 (100.0%) | 87 (100.0%) |
| 65 to 74 Years | 64 (84.2%) | 15 (100.0%) |
| 75 Years and over | 33 (100.0%) | 0 (0.0%) |
| Total | 246 (81.5%) | 169 (47.7%) |
Income Below Poverty Among Married-Couple Families in La Hacienda
The poverty statistics for married-couple families in La Hacienda show that 7.8% or 12 of the total 154 families live below the poverty line. Families with no children have the highest poverty rate of 9.5%, comprising of 12 families. On the other hand, families with 1 or 2 children have the lowest poverty rate of 0.0%, which includes 0 families.
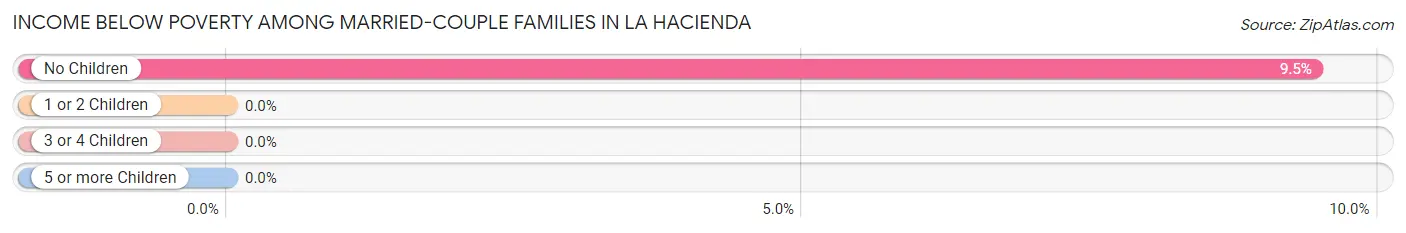
| Children | Above Poverty | Below Poverty |
| No Children | 115 (90.5%) | 12 (9.5%) |
| 1 or 2 Children | 27 (100.0%) | 0 (0.0%) |
| 3 or 4 Children | 0 (0.0%) | 0 (0.0%) |
| 5 or more Children | 0 (0.0%) | 0 (0.0%) |
| Total | 142 (92.2%) | 12 (7.8%) |
Income Below Poverty Among Single-Parent Households in La Hacienda
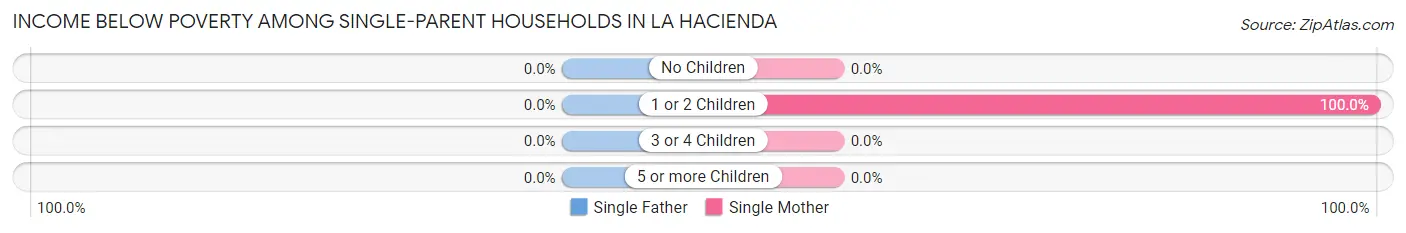
| Children | Single Father | Single Mother |
| No Children | 0 (0.0%) | 0 (0.0%) |
| 1 or 2 Children | 0 (0.0%) | 73 (100.0%) |
| 3 or 4 Children | 0 (0.0%) | 0 (0.0%) |
| 5 or more Children | 0 (0.0%) | 0 (0.0%) |
| Total | 0 (0.0%) | 73 (100.0%) |
Income Below Poverty Among Married-Couple vs Single-Parent Households in La Hacienda
The poverty data for La Hacienda shows that 12 of the married-couple family households (7.8%) and 73 of the single-parent households (100.0%) are living below the poverty level. Within the married-couple family households, those with no children have the highest poverty rate, with 12 households (9.5%) falling below the poverty line. Among the single-parent households, those with 1 or 2 children have the highest poverty rate, with 73 household (100.0%) living below poverty.
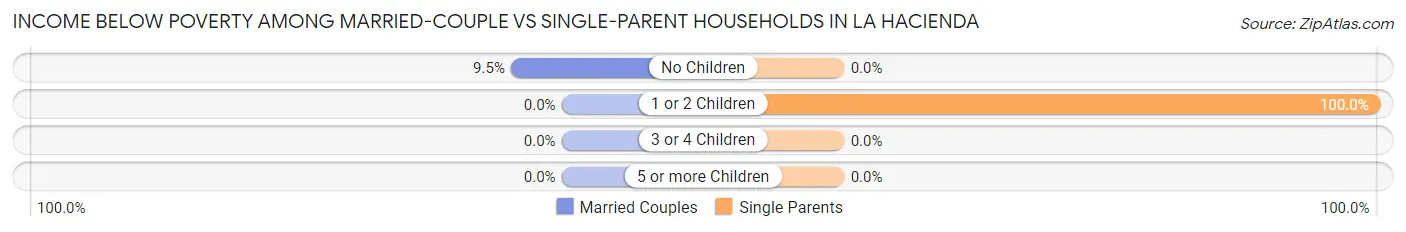
| Children | Married-Couple Families | Single-Parent Households |
| No Children | 12 (9.5%) | 0 (0.0%) |
| 1 or 2 Children | 0 (0.0%) | 73 (100.0%) |
| 3 or 4 Children | 0 (0.0%) | 0 (0.0%) |
| 5 or more Children | 0 (0.0%) | 0 (0.0%) |
| Total | 12 (7.8%) | 73 (100.0%) |
Race in La Hacienda
The most populous races in La Hacienda are Hispanic or Latino (561 | 85.5%), White / Caucasian (339 | 51.7%), and Two or more Races (199 | 30.3%).
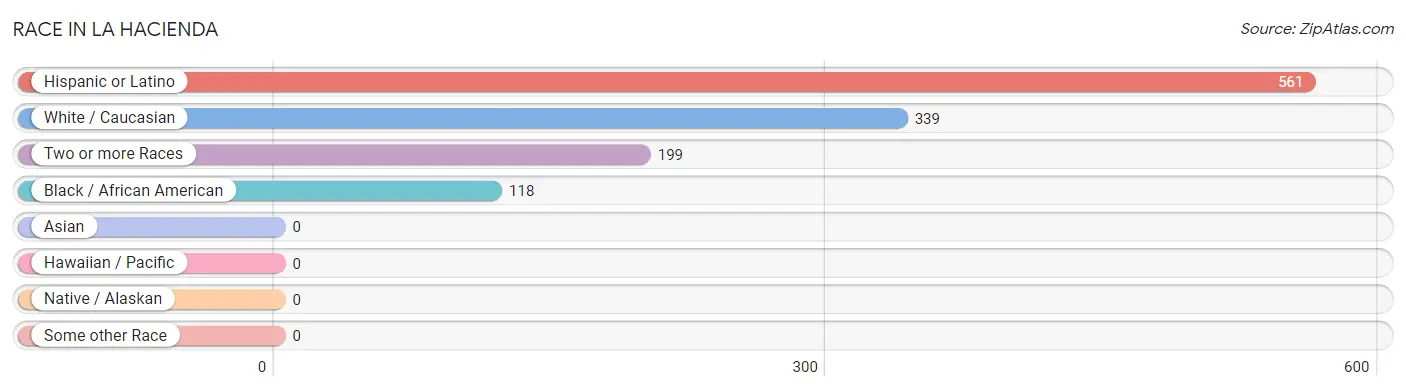
| Race | # Population | % Population |
| Asian | 0 | 0.0% |
| Black / African American | 118 | 18.0% |
| Hawaiian / Pacific | 0 | 0.0% |
| Hispanic or Latino | 561 | 85.5% |
| Native / Alaskan | 0 | 0.0% |
| White / Caucasian | 339 | 51.7% |
| Two or more Races | 199 | 30.3% |
| Some other Race | 0 | 0.0% |
| Total | 656 | 100.0% |
Ancestry in La Hacienda
The most populous ancestries reported in La Hacienda are Mexican (561 | 85.5%), German (48 | 7.3%), Danish (2 | 0.3%), and English (2 | 0.3%), together accounting for 93.4% of all La Hacienda residents.
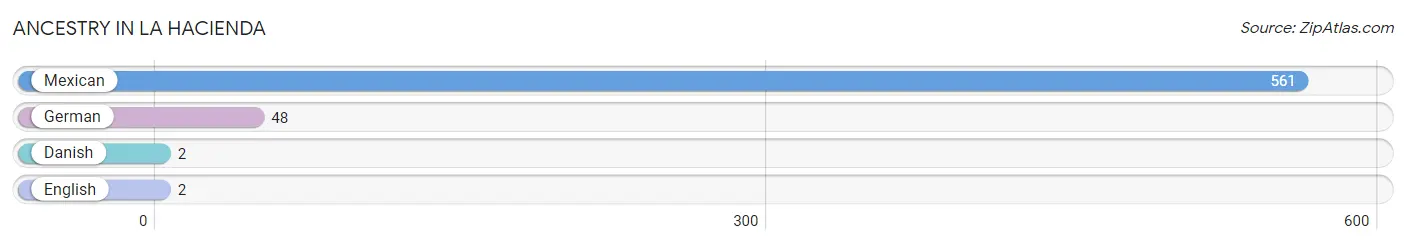
| Ancestry | # Population | % Population |
| Danish | 2 | 0.3% |
| English | 2 | 0.3% |
| German | 48 | 7.3% |
| Mexican | 561 | 85.5% | View All 4 Rows |
Immigrants in La Hacienda
The most numerous immigrant groups reported in La Hacienda came from Central America (161 | 24.5%), Latin America (161 | 24.5%), Mexico (149 | 22.7%), and Guatemala (12 | 1.8%), together accounting for 73.6% of all La Hacienda residents.
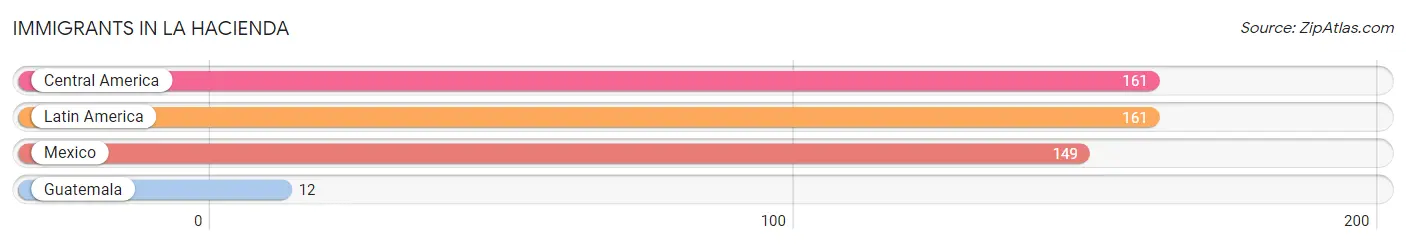
| Immigration Origin | # Population | % Population |
| Central America | 161 | 24.5% |
| Guatemala | 12 | 1.8% |
| Latin America | 161 | 24.5% |
| Mexico | 149 | 22.7% | View All 4 Rows |
Sex and Age in La Hacienda
Sex and Age in La Hacienda
The most populous age groups in La Hacienda are 5 to 9 Years (78 | 25.8%) for men and Under 5 Years (92 | 26.0%) for women.
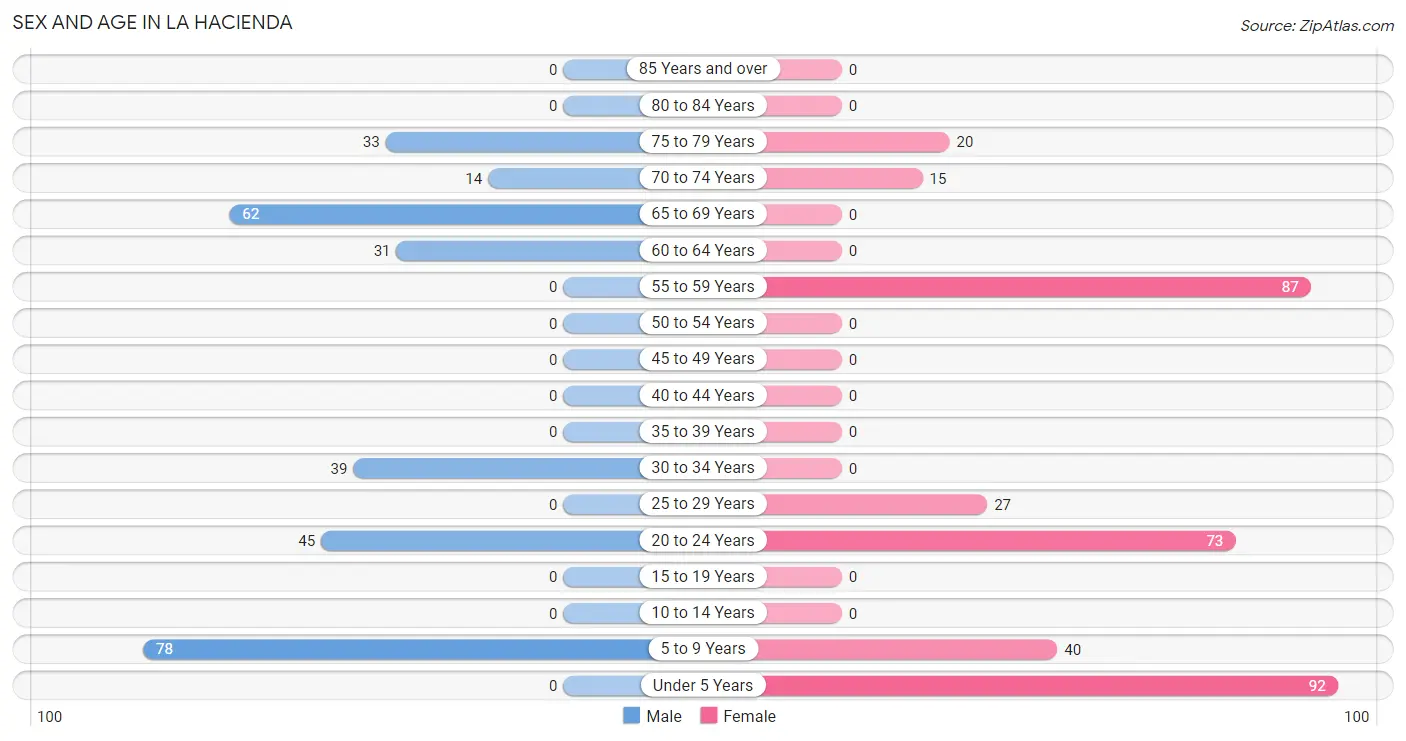
| Age Bracket | Male | Female |
| Under 5 Years | 0 (0.0%) | 92 (26.0%) |
| 5 to 9 Years | 78 (25.8%) | 40 (11.3%) |
| 10 to 14 Years | 0 (0.0%) | 0 (0.0%) |
| 15 to 19 Years | 0 (0.0%) | 0 (0.0%) |
| 20 to 24 Years | 45 (14.9%) | 73 (20.6%) |
| 25 to 29 Years | 0 (0.0%) | 27 (7.6%) |
| 30 to 34 Years | 39 (12.9%) | 0 (0.0%) |
| 35 to 39 Years | 0 (0.0%) | 0 (0.0%) |
| 40 to 44 Years | 0 (0.0%) | 0 (0.0%) |
| 45 to 49 Years | 0 (0.0%) | 0 (0.0%) |
| 50 to 54 Years | 0 (0.0%) | 0 (0.0%) |
| 55 to 59 Years | 0 (0.0%) | 87 (24.6%) |
| 60 to 64 Years | 31 (10.3%) | 0 (0.0%) |
| 65 to 69 Years | 62 (20.5%) | 0 (0.0%) |
| 70 to 74 Years | 14 (4.6%) | 15 (4.2%) |
| 75 to 79 Years | 33 (10.9%) | 20 (5.7%) |
| 80 to 84 Years | 0 (0.0%) | 0 (0.0%) |
| 85 Years and over | 0 (0.0%) | 0 (0.0%) |
| Total | 302 (100.0%) | 354 (100.0%) |
Families and Households in La Hacienda
Median Family Size in La Hacienda
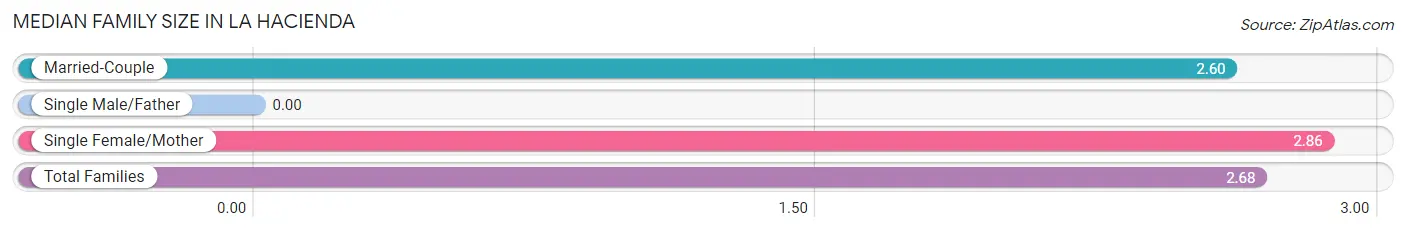
| Family Type | # Families | Family Size |
| Married-Couple | 154 (67.8%) | 2.60 |
| Single Male/Father | 0 (0.0%) | - |
| Single Female/Mother | 73 (32.2%) | 2.86 |
| Total Families | 227 (100.0%) | 2.68 |
Median Household Size in La Hacienda
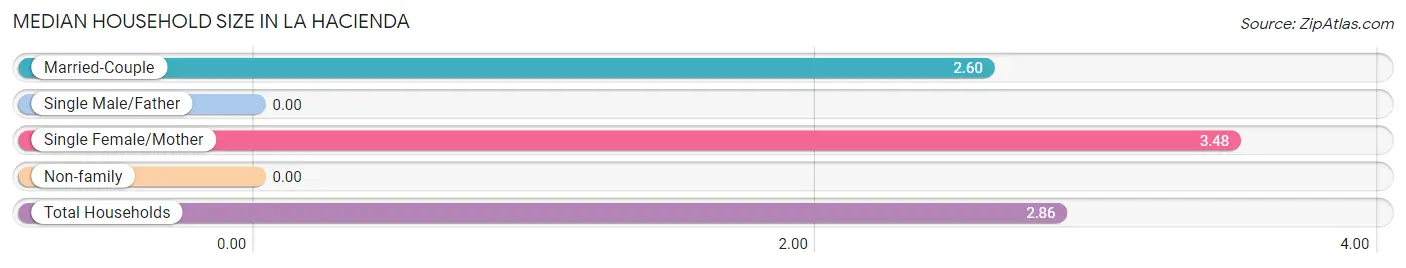
| Household Type | # Households | Household Size |
| Married-Couple | 154 (67.2%) | 2.60 |
| Single Male/Father | 0 (0.0%) | - |
| Single Female/Mother | 73 (31.9%) | 3.48 |
| Non-family | 2 (0.9%) | - |
| Total Households | 229 (100.0%) | 2.86 |
Household Size by Marriage Status in La Hacienda
Out of a total of 229 households in La Hacienda, 227 (99.1%) are family households, while 2 (0.9%) are nonfamily households. The most numerous type of family households are 2-person households, comprising 127, and the most common type of nonfamily households are 1-person households, comprising 2.
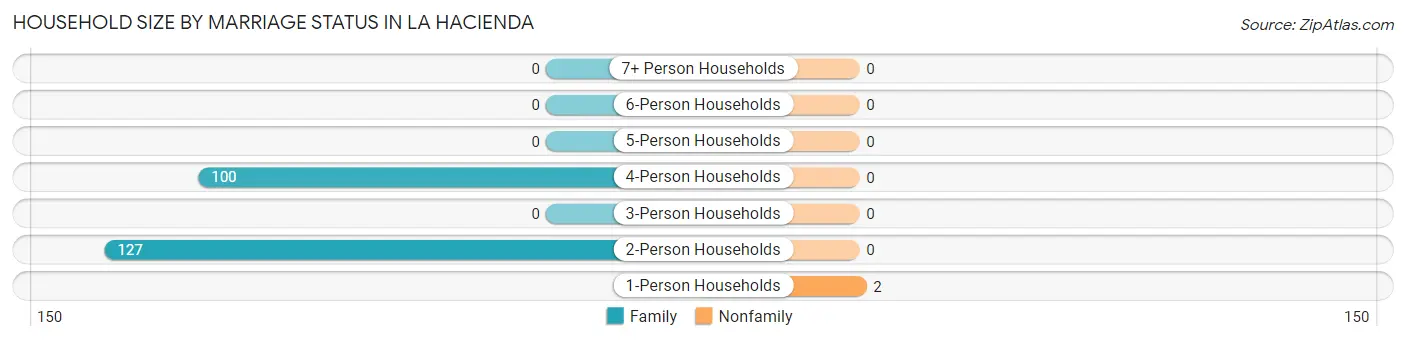
| Household Size | Family Households | Nonfamily Households |
| 1-Person Households | - | 2 (0.9%) |
| 2-Person Households | 127 (55.5%) | 0 (0.0%) |
| 3-Person Households | 0 (0.0%) | 0 (0.0%) |
| 4-Person Households | 100 (43.7%) | 0 (0.0%) |
| 5-Person Households | 0 (0.0%) | 0 (0.0%) |
| 6-Person Households | 0 (0.0%) | 0 (0.0%) |
| 7+ Person Households | 0 (0.0%) | 0 (0.0%) |
| Total | 227 (99.1%) | 2 (0.9%) |
Female Fertility in La Hacienda
Fertility by Age in La Hacienda
Average fertility rate in La Hacienda is 730.0 births per 1,000 women. Women in the age bracket of 20 to 34 years have the highest fertility rate with 730.0 births per 1,000 women. Women in the age bracket of 20 to 34 years acount for 100.0% of all women with births.
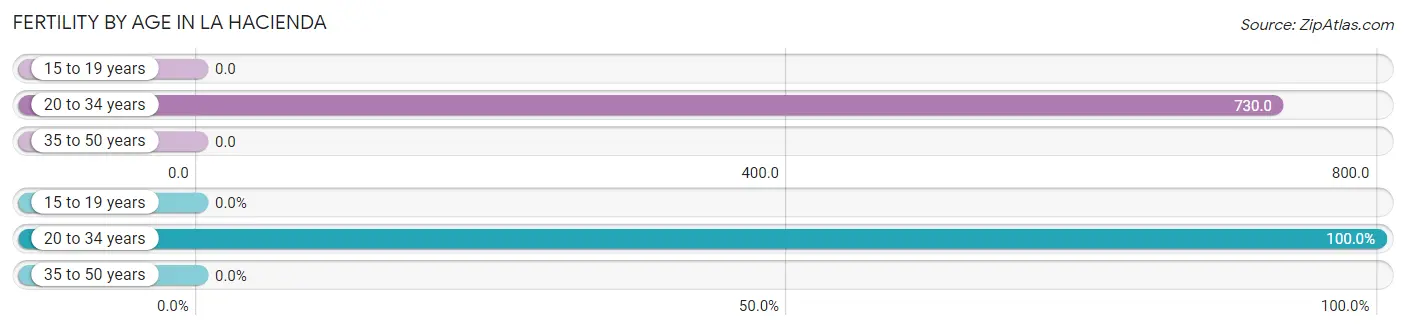
| Age Bracket | Women with Births | Births / 1,000 Women |
| 15 to 19 years | 0 (0.0%) | 0.0 |
| 20 to 34 years | 73 (100.0%) | 730.0 |
| 35 to 50 years | 0 (0.0%) | 0.0 |
| Total | 73 (100.0%) | 730.0 |
Fertility by Age by Marriage Status in La Hacienda
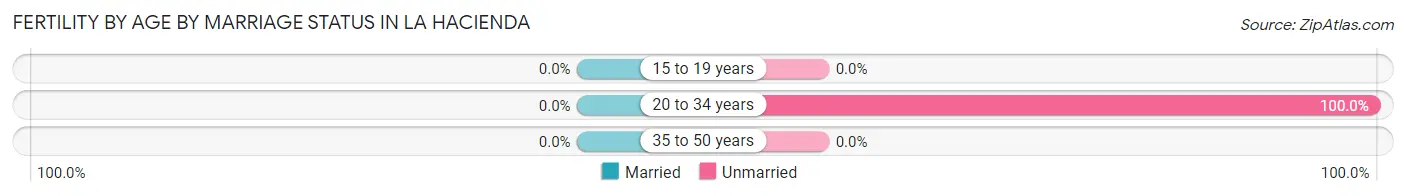
| Age Bracket | Married | Unmarried |
| 15 to 19 years | 0 (0.0%) | 0 (0.0%) |
| 20 to 34 years | 0 (0.0%) | 73 (100.0%) |
| 35 to 50 years | 0 (0.0%) | 0 (0.0%) |
| Total | 0 (0.0%) | 73 (100.0%) |
Fertility by Education in La Hacienda
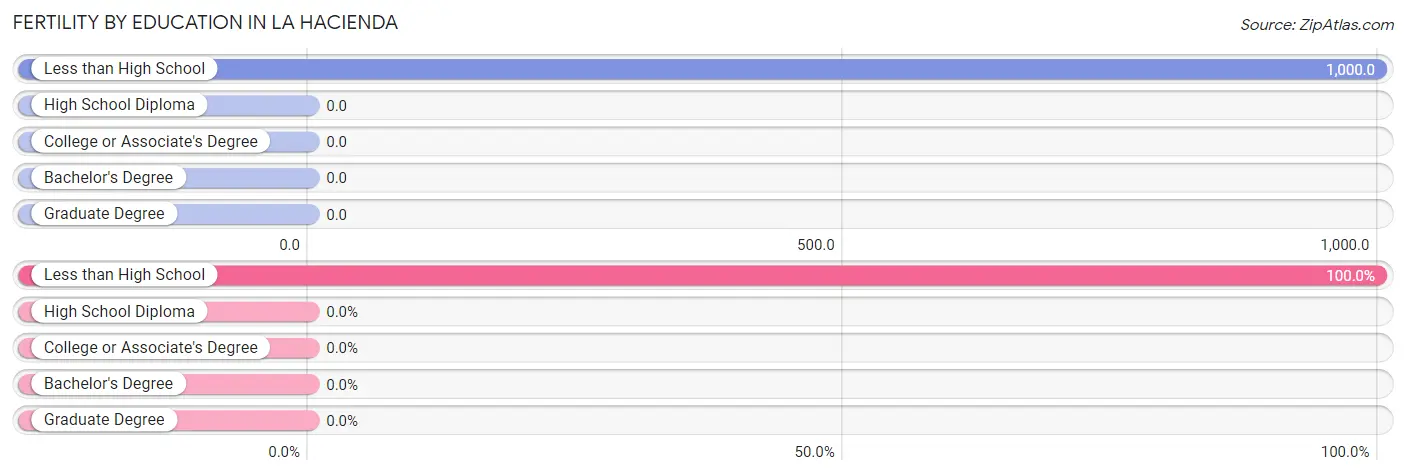
| Educational Attainment | Women with Births | Births / 1,000 Women |
| Less than High School | 73 (100.0%) | 1,000.0 |
| High School Diploma | 0 (0.0%) | 0.0 |
| College or Associate's Degree | 0 (0.0%) | 0.0 |
| Bachelor's Degree | 0 (0.0%) | 0.0 |
| Graduate Degree | 0 (0.0%) | 0.0 |
| Total | 73 (100.0%) | 730.0 |
Fertility by Education by Marriage Status in La Hacienda
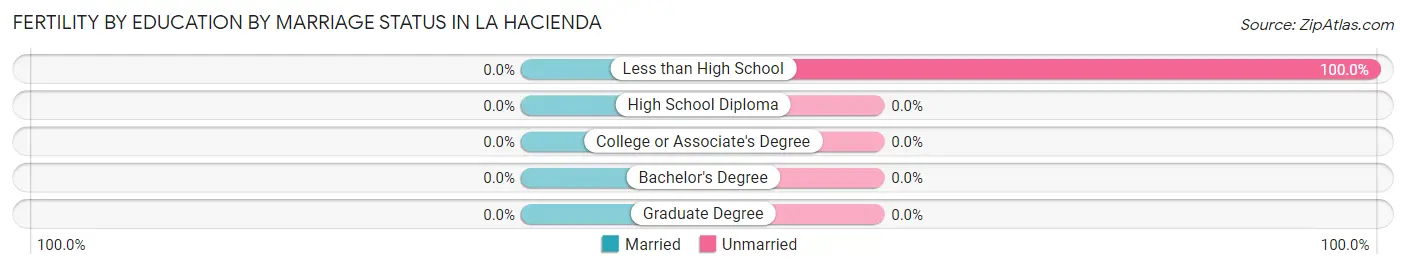
| Educational Attainment | Married | Unmarried |
| Less than High School | 0 (0.0%) | 73 (100.0%) |
| High School Diploma | 0 (0.0%) | 0 (0.0%) |
| College or Associate's Degree | 0 (0.0%) | 0 (0.0%) |
| Bachelor's Degree | 0 (0.0%) | 0 (0.0%) |
| Graduate Degree | 0 (0.0%) | 0 (0.0%) |
| Total | 0 (0.0%) | 73 (100.0%) |
Employment Characteristics in La Hacienda
Employment by Class of Employer in La Hacienda
Among the 133 employed individuals in La Hacienda, , and private company employees (133 | 100.0%) make up the most common classes of employment.
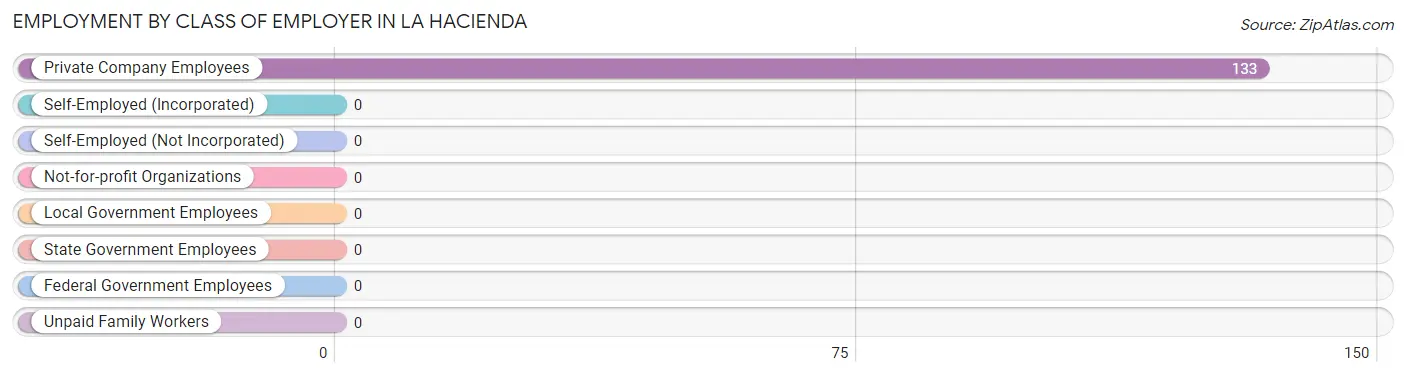
| Employer Class | # Employees | % Employees |
| Private Company Employees | 133 | 100.0% |
| Self-Employed (Incorporated) | 0 | 0.0% |
| Self-Employed (Not Incorporated) | 0 | 0.0% |
| Not-for-profit Organizations | 0 | 0.0% |
| Local Government Employees | 0 | 0.0% |
| State Government Employees | 0 | 0.0% |
| Federal Government Employees | 0 | 0.0% |
| Unpaid Family Workers | 0 | 0.0% |
| Total | 133 | 100.0% |
Employment Status by Age in La Hacienda
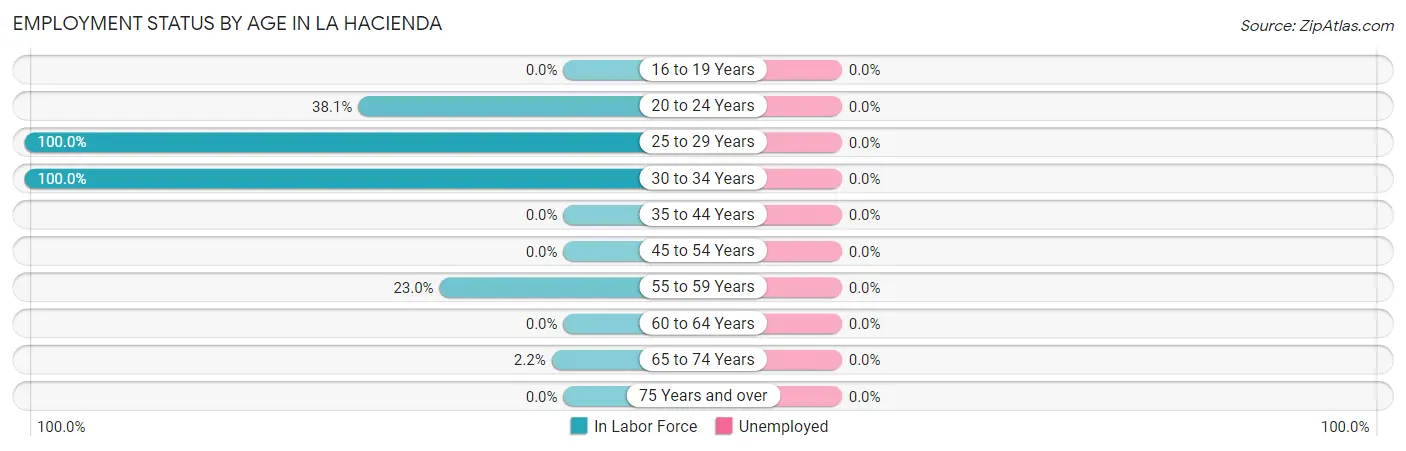
| Age Bracket | In Labor Force | Unemployed |
| 16 to 19 Years | 0 (0.0%) | 0 (0.0%) |
| 20 to 24 Years | 45 (38.1%) | 0 (0.0%) |
| 25 to 29 Years | 27 (100.0%) | 0 (0.0%) |
| 30 to 34 Years | 39 (100.0%) | 0 (0.0%) |
| 35 to 44 Years | 0 (0.0%) | 0 (0.0%) |
| 45 to 54 Years | 0 (0.0%) | 0 (0.0%) |
| 55 to 59 Years | 20 (23.0%) | 0 (0.0%) |
| 60 to 64 Years | 0 (0.0%) | 0 (0.0%) |
| 65 to 74 Years | 2 (2.2%) | 0 (0.0%) |
| 75 Years and over | 0 (0.0%) | 0 (0.0%) |
| Total | 133 (29.8%) | 0 (0.0%) |
Employment Status by Educational Attainment in La Hacienda
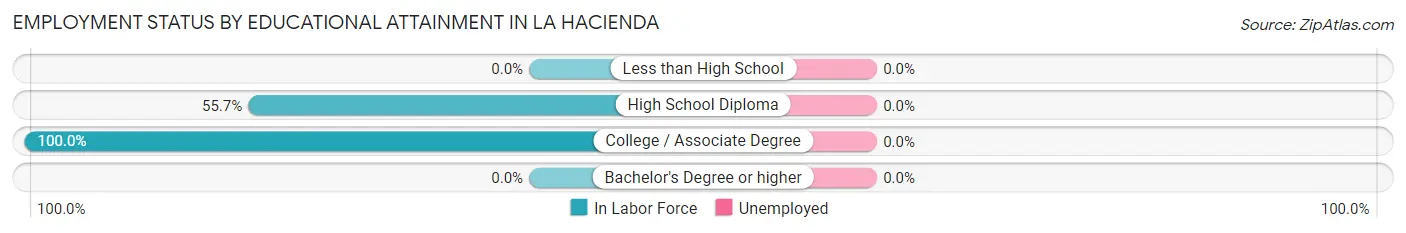
| Educational Attainment | In Labor Force | Unemployed |
| Less than High School | 0 (0.0%) | 0 (0.0%) |
| High School Diploma | 39 (55.7%) | 0 (0.0%) |
| College / Associate Degree | 47 (100.0%) | 0 (0.0%) |
| Bachelor's Degree or higher | 0 (0.0%) | 0 (0.0%) |
| Total | 86 (46.7%) | 0 (0.0%) |
Employment Occupations by Sex in La Hacienda
Management, Business, Science and Arts Occupations
The most common Management, Business, Science and Arts occupations in La Hacienda are Health Diagnosing & Treating (2 | 1.5%), and Health Technologists (2 | 1.5%).
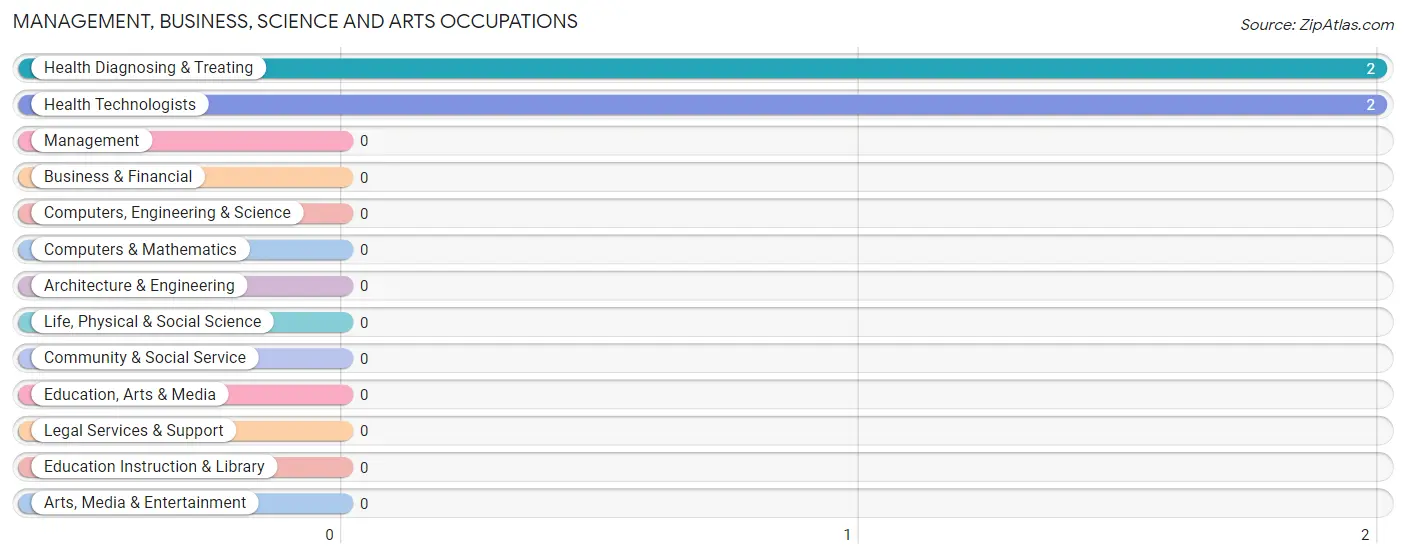
Management, Business, Science and Arts Occupations by Sex
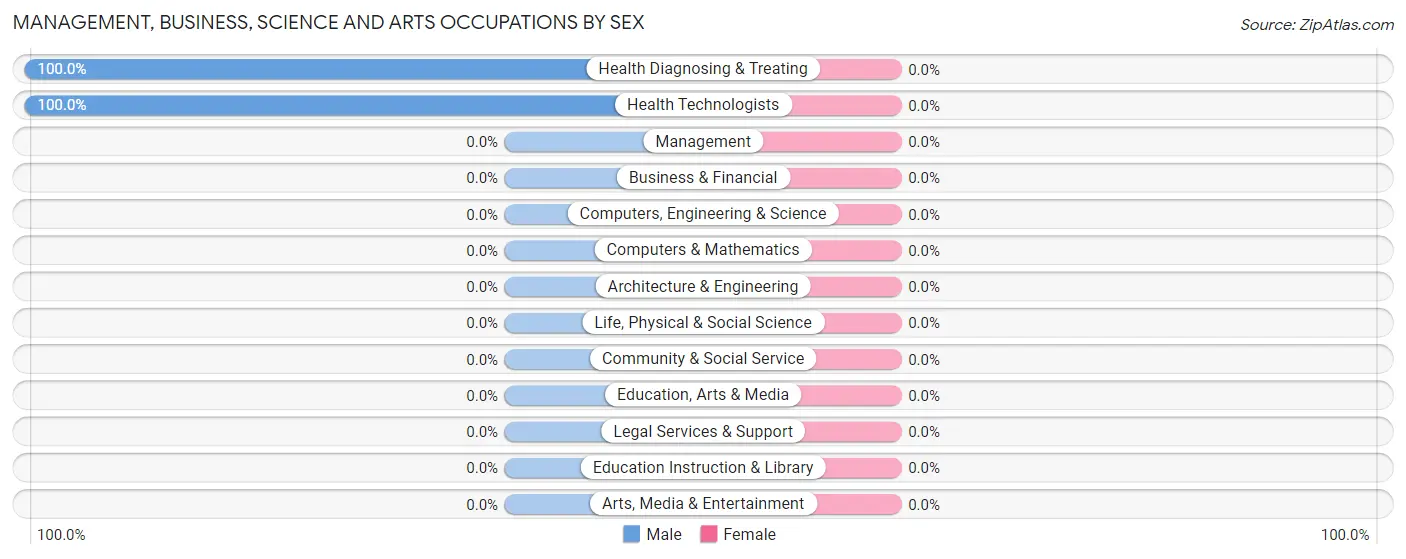
| Occupation | Male | Female |
| Management | 0 (0.0%) | 0 (0.0%) |
| Business & Financial | 0 (0.0%) | 0 (0.0%) |
| Computers, Engineering & Science | 0 (0.0%) | 0 (0.0%) |
| Computers & Mathematics | 0 (0.0%) | 0 (0.0%) |
| Architecture & Engineering | 0 (0.0%) | 0 (0.0%) |
| Life, Physical & Social Science | 0 (0.0%) | 0 (0.0%) |
| Community & Social Service | 0 (0.0%) | 0 (0.0%) |
| Education, Arts & Media | 0 (0.0%) | 0 (0.0%) |
| Legal Services & Support | 0 (0.0%) | 0 (0.0%) |
| Education Instruction & Library | 0 (0.0%) | 0 (0.0%) |
| Arts, Media & Entertainment | 0 (0.0%) | 0 (0.0%) |
| Health Diagnosing & Treating | 2 (100.0%) | 0 (0.0%) |
| Health Technologists | 2 (100.0%) | 0 (0.0%) |
| Total (Category) | 2 (100.0%) | 0 (0.0%) |
| Total (Overall) | 86 (64.7%) | 47 (35.3%) |
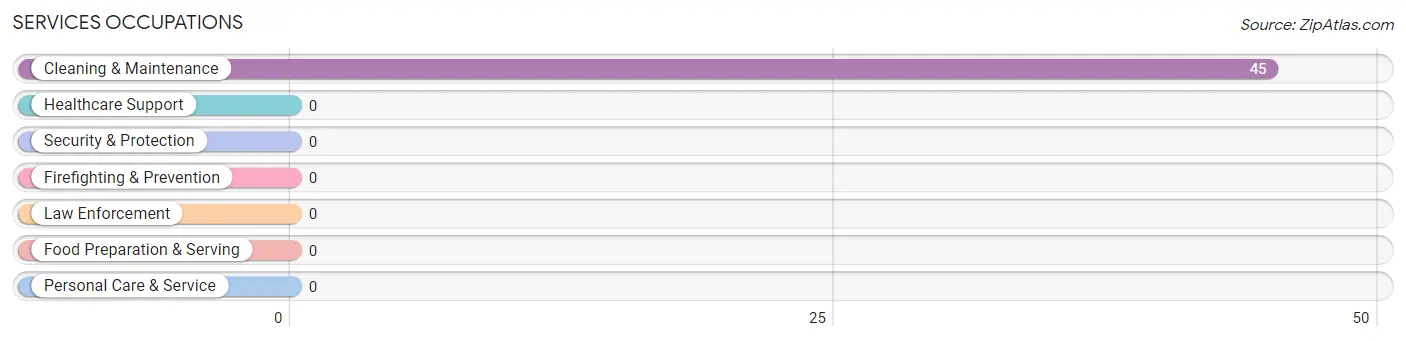
Services Occupations
The most common Services occupations in La Hacienda are , and Cleaning & Maintenance (45 | 33.8%).
Services Occupations by Sex
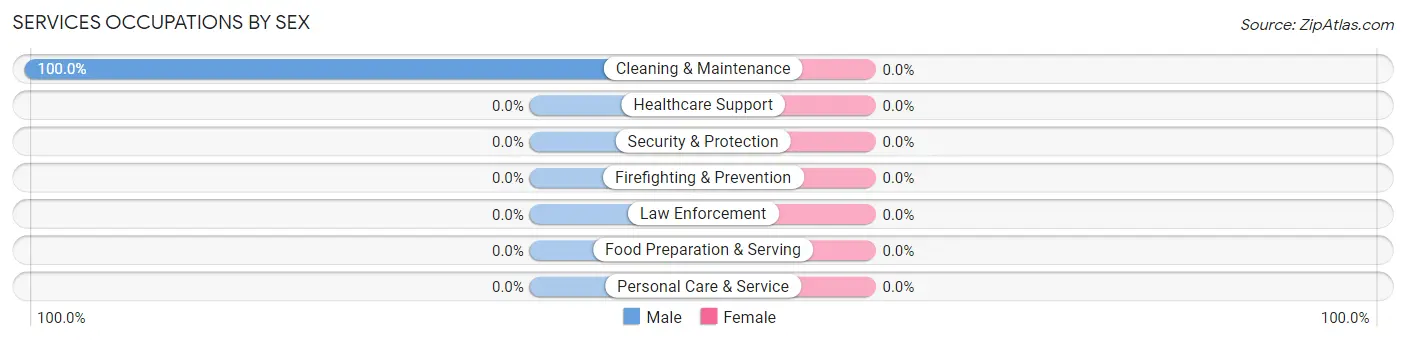
| Occupation | Male | Female |
| Healthcare Support | 0 (0.0%) | 0 (0.0%) |
| Security & Protection | 0 (0.0%) | 0 (0.0%) |
| Firefighting & Prevention | 0 (0.0%) | 0 (0.0%) |
| Law Enforcement | 0 (0.0%) | 0 (0.0%) |
| Food Preparation & Serving | 0 (0.0%) | 0 (0.0%) |
| Cleaning & Maintenance | 45 (100.0%) | 0 (0.0%) |
| Personal Care & Service | 0 (0.0%) | 0 (0.0%) |
| Total (Category) | 45 (100.0%) | 0 (0.0%) |
| Total (Overall) | 86 (64.7%) | 47 (35.3%) |
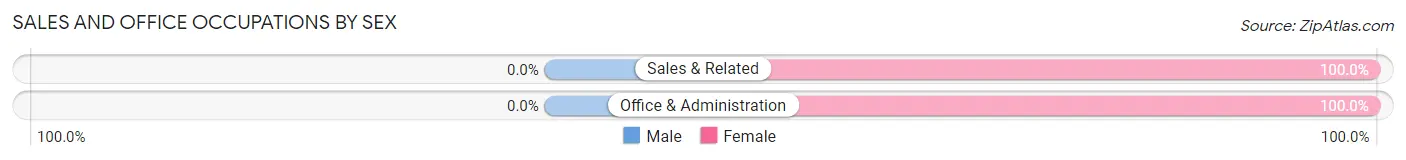
Sales and Office Occupations
The most common Sales and Office occupations in La Hacienda are Office & Administration (27 | 20.3%), and Sales & Related (20 | 15.0%).
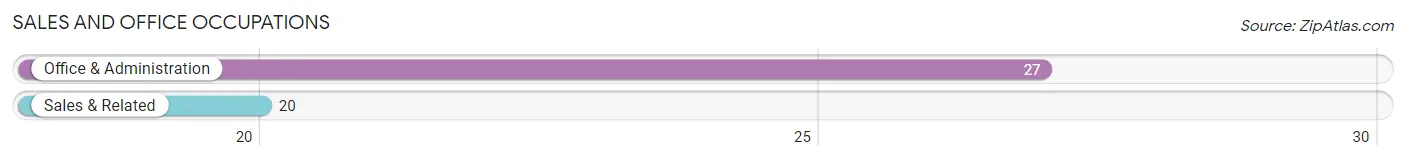
Sales and Office Occupations by Sex
| Occupation | Male | Female |
| Sales & Related | 0 (0.0%) | 20 (100.0%) |
| Office & Administration | 0 (0.0%) | 27 (100.0%) |
| Total (Category) | 0 (0.0%) | 47 (100.0%) |
| Total (Overall) | 86 (64.7%) | 47 (35.3%) |
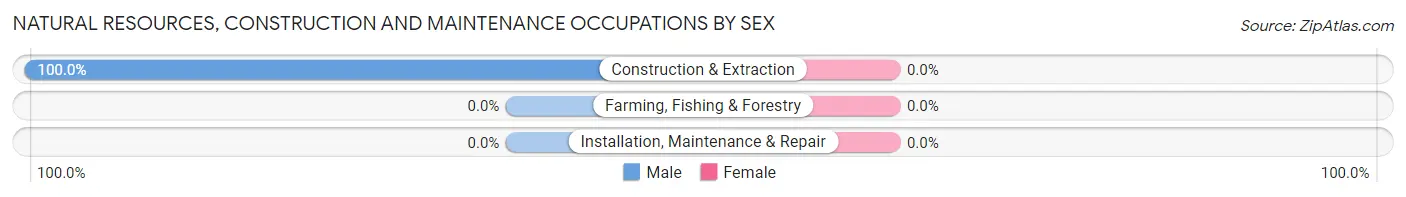
Natural Resources, Construction and Maintenance Occupations
The most common Natural Resources, Construction and Maintenance occupations in La Hacienda are , and Construction & Extraction (39 | 29.3%).
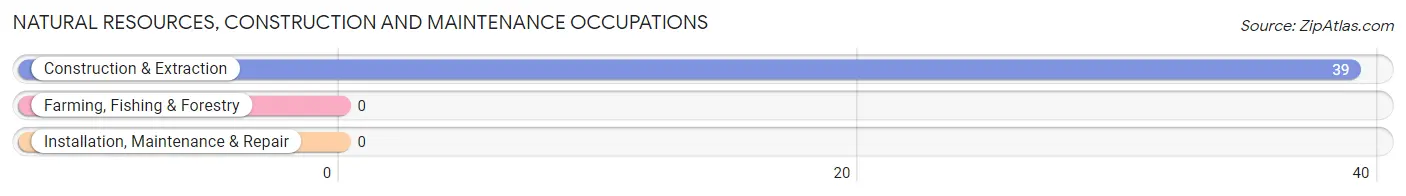
Natural Resources, Construction and Maintenance Occupations by Sex
| Occupation | Male | Female |
| Farming, Fishing & Forestry | 0 (0.0%) | 0 (0.0%) |
| Construction & Extraction | 39 (100.0%) | 0 (0.0%) |
| Installation, Maintenance & Repair | 0 (0.0%) | 0 (0.0%) |
| Total (Category) | 39 (100.0%) | 0 (0.0%) |
| Total (Overall) | 86 (64.7%) | 47 (35.3%) |
Production, Transportation and Moving Occupations
Production, Transportation and Moving Occupations by Sex
| Occupation | Male | Female |
| Production | 0 (0.0%) | 0 (0.0%) |
| Transportation | 0 (0.0%) | 0 (0.0%) |
| Material Moving | 0 (0.0%) | 0 (0.0%) |
| Total (Category) | 0 (0.0%) | 0 (0.0%) |
| Total (Overall) | 86 (64.7%) | 47 (35.3%) |
Employment Industries by Sex in La Hacienda
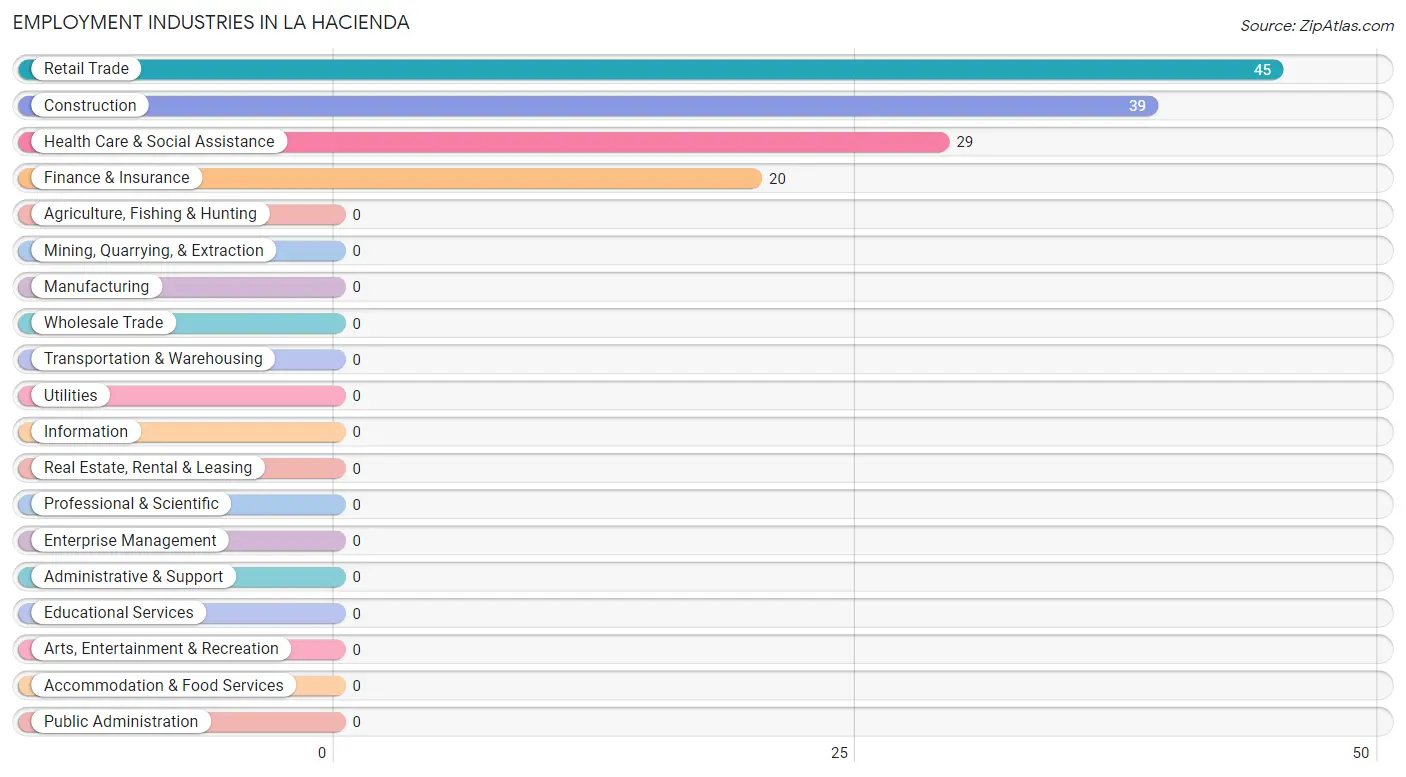
Employment Industries in La Hacienda
The major employment industries in La Hacienda include Retail Trade (45 | 33.8%), Construction (39 | 29.3%), Health Care & Social Assistance (29 | 21.8%), and Finance & Insurance (20 | 15.0%).
Employment Industries by Sex in La Hacienda
The La Hacienda industries that see more men than women are Construction (100.0%), Retail Trade (100.0%), and Health Care & Social Assistance (6.9%), whereas the industries that tend to have a higher number of women are Finance & Insurance (100.0%), and Health Care & Social Assistance (93.1%).
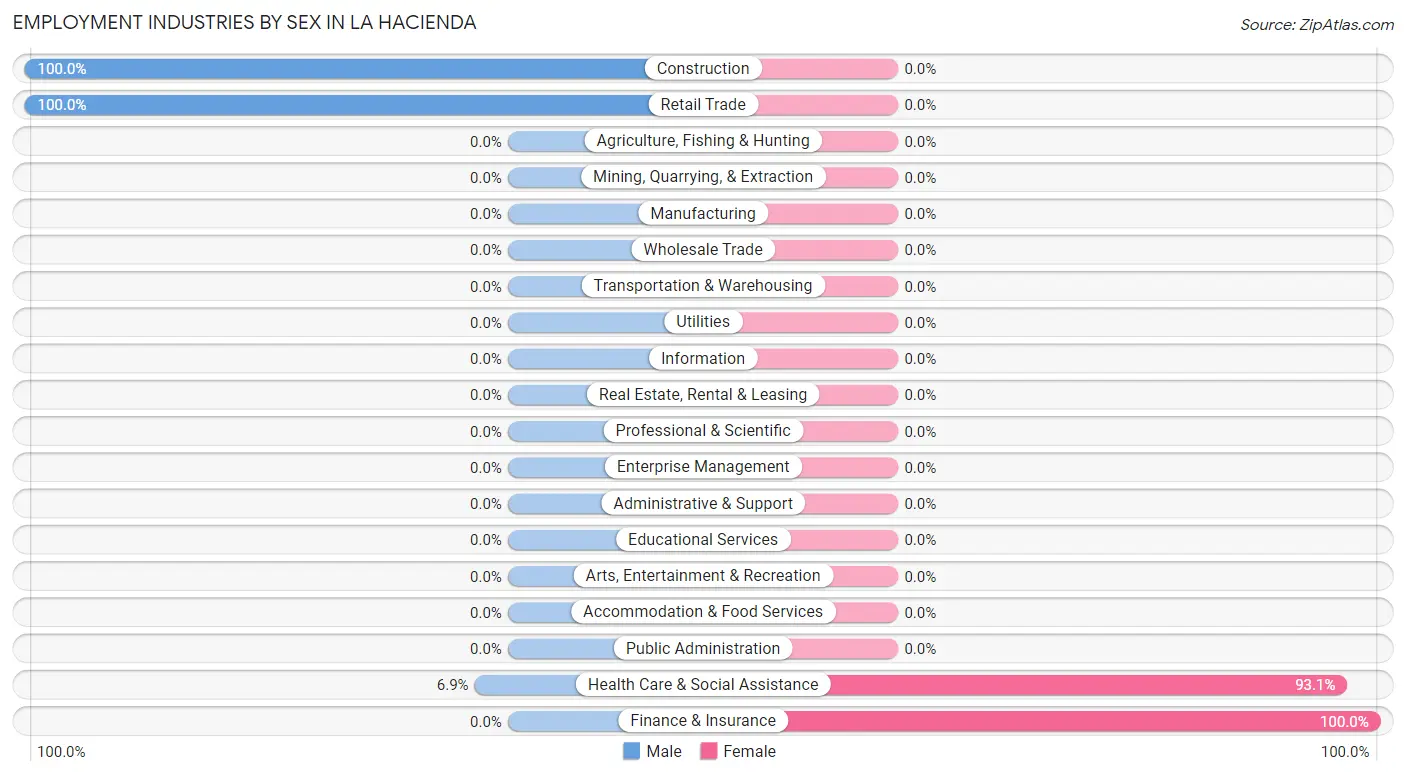
| Industry | Male | Female |
| Agriculture, Fishing & Hunting | 0 (0.0%) | 0 (0.0%) |
| Mining, Quarrying, & Extraction | 0 (0.0%) | 0 (0.0%) |
| Construction | 39 (100.0%) | 0 (0.0%) |
| Manufacturing | 0 (0.0%) | 0 (0.0%) |
| Wholesale Trade | 0 (0.0%) | 0 (0.0%) |
| Retail Trade | 45 (100.0%) | 0 (0.0%) |
| Transportation & Warehousing | 0 (0.0%) | 0 (0.0%) |
| Utilities | 0 (0.0%) | 0 (0.0%) |
| Information | 0 (0.0%) | 0 (0.0%) |
| Finance & Insurance | 0 (0.0%) | 20 (100.0%) |
| Real Estate, Rental & Leasing | 0 (0.0%) | 0 (0.0%) |
| Professional & Scientific | 0 (0.0%) | 0 (0.0%) |
| Enterprise Management | 0 (0.0%) | 0 (0.0%) |
| Administrative & Support | 0 (0.0%) | 0 (0.0%) |
| Educational Services | 0 (0.0%) | 0 (0.0%) |
| Health Care & Social Assistance | 2 (6.9%) | 27 (93.1%) |
| Arts, Entertainment & Recreation | 0 (0.0%) | 0 (0.0%) |
| Accommodation & Food Services | 0 (0.0%) | 0 (0.0%) |
| Public Administration | 0 (0.0%) | 0 (0.0%) |
| Total | 86 (64.7%) | 47 (35.3%) |
Education in La Hacienda
School Enrollment in La Hacienda
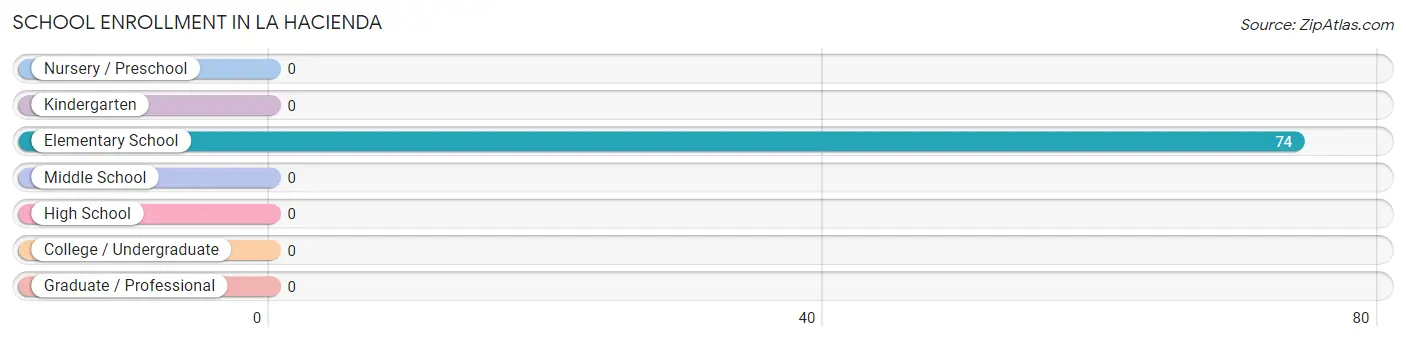
| School Level | # Students | % Students |
| Nursery / Preschool | 0 | 0.0% |
| Kindergarten | 0 | 0.0% |
| Elementary School | 74 | 100.0% |
| Middle School | 0 | 0.0% |
| High School | 0 | 0.0% |
| College / Undergraduate | 0 | 0.0% |
| Graduate / Professional | 0 | 0.0% |
| Total | 74 | 100.0% |
School Enrollment by Age by Funding Source in La Hacienda
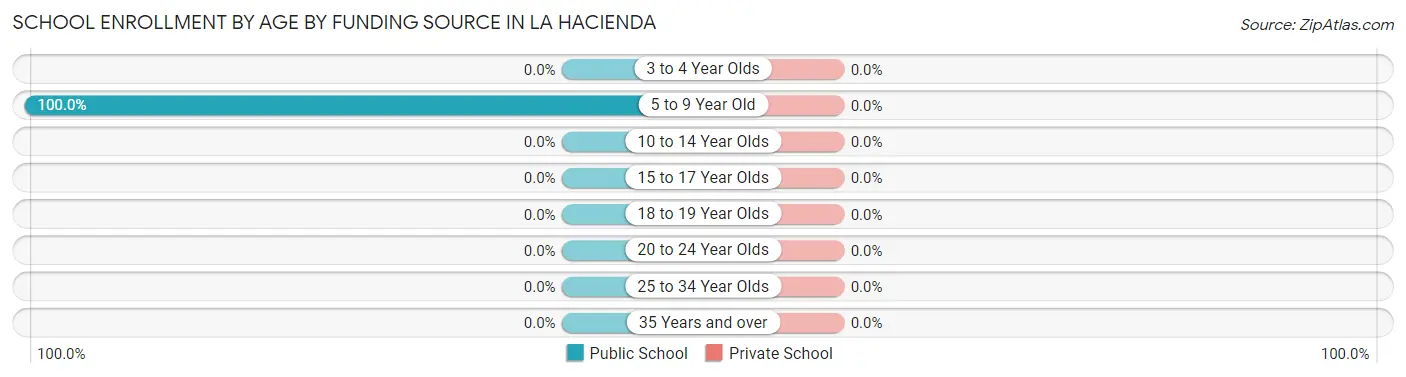
| Age Bracket | Public School | Private School |
| 3 to 4 Year Olds | 0 (0.0%) | 0 (0.0%) |
| 5 to 9 Year Old | 74 (100.0%) | 0 (0.0%) |
| 10 to 14 Year Olds | 0 (0.0%) | 0 (0.0%) |
| 15 to 17 Year Olds | 0 (0.0%) | 0 (0.0%) |
| 18 to 19 Year Olds | 0 (0.0%) | 0 (0.0%) |
| 20 to 24 Year Olds | 0 (0.0%) | 0 (0.0%) |
| 25 to 34 Year Olds | 0 (0.0%) | 0 (0.0%) |
| 35 Years and over | 0 (0.0%) | 0 (0.0%) |
| Total | 74 (100.0%) | 0 (0.0%) |
Educational Attainment by Field of Study in La Hacienda
Education (15 | 88.2%), and science & technology (2 | 11.8%) are the most common fields of study among 17 individuals in La Hacienda who have obtained a bachelor's degree or higher.
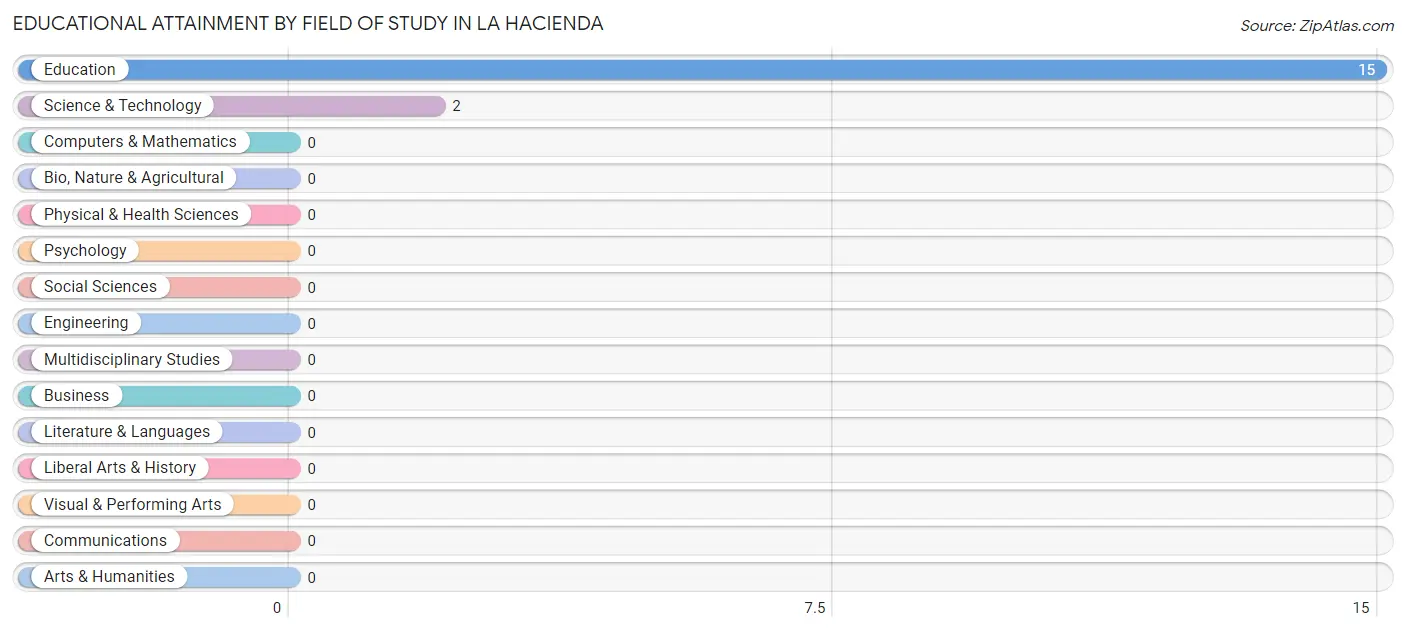
| Field of Study | # Graduates | % Graduates |
| Computers & Mathematics | 0 | 0.0% |
| Bio, Nature & Agricultural | 0 | 0.0% |
| Physical & Health Sciences | 0 | 0.0% |
| Psychology | 0 | 0.0% |
| Social Sciences | 0 | 0.0% |
| Engineering | 0 | 0.0% |
| Multidisciplinary Studies | 0 | 0.0% |
| Science & Technology | 2 | 11.8% |
| Business | 0 | 0.0% |
| Education | 15 | 88.2% |
| Literature & Languages | 0 | 0.0% |
| Liberal Arts & History | 0 | 0.0% |
| Visual & Performing Arts | 0 | 0.0% |
| Communications | 0 | 0.0% |
| Arts & Humanities | 0 | 0.0% |
| Total | 17 | 100.0% |
Transportation & Commute in La Hacienda
Vehicle Availability by Sex in La Hacienda
The most prevalent vehicle ownership categories in La Hacienda are males with 2 vehicles (84, accounting for 97.7%) and females with 2 vehicles (27, making up 178.7%).
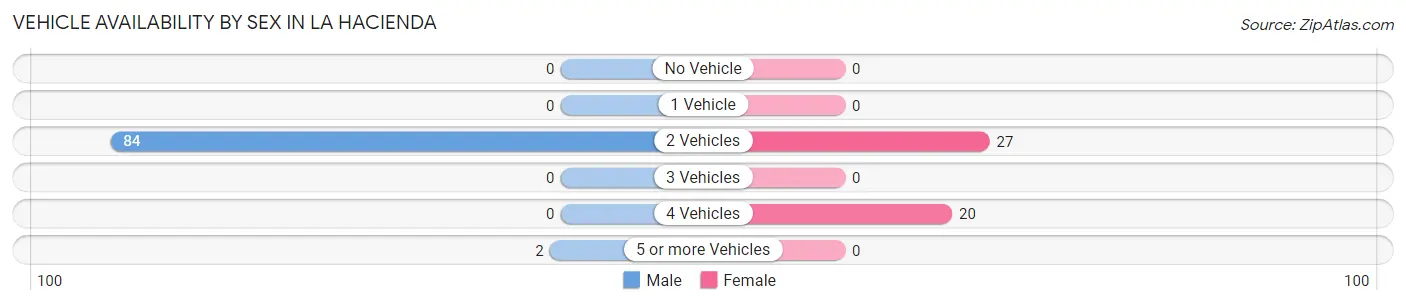
| Vehicles Available | Male | Female |
| No Vehicle | 0 (0.0%) | 0 (0.0%) |
| 1 Vehicle | 0 (0.0%) | 0 (0.0%) |
| 2 Vehicles | 84 (97.7%) | 27 (57.5%) |
| 3 Vehicles | 0 (0.0%) | 0 (0.0%) |
| 4 Vehicles | 0 (0.0%) | 20 (42.5%) |
| 5 or more Vehicles | 2 (2.3%) | 0 (0.0%) |
| Total | 86 (100.0%) | 47 (100.0%) |
Commute Time in La Hacienda
The most frequently occuring commute durations in La Hacienda are 15 to 19 minutes (65 commuters, 48.9%), 90 or more minutes (39 commuters, 29.3%), and 40 to 44 minutes (27 commuters, 20.3%).
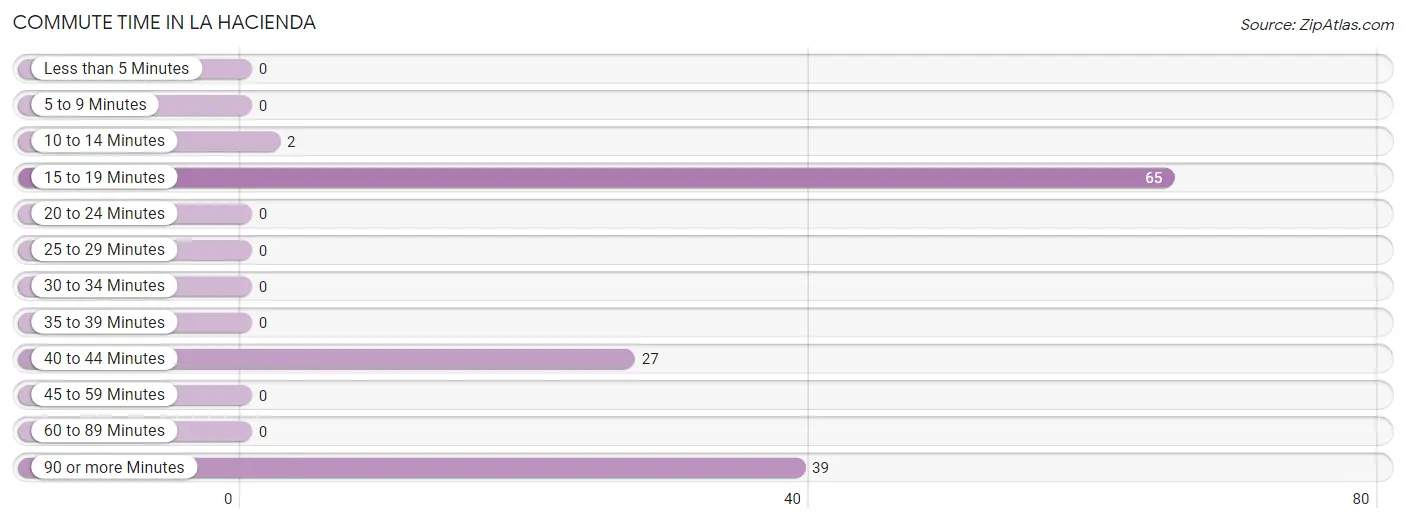
| Commute Time | # Commuters | % Commuters |
| Less than 5 Minutes | 0 | 0.0% |
| 5 to 9 Minutes | 0 | 0.0% |
| 10 to 14 Minutes | 2 | 1.5% |
| 15 to 19 Minutes | 65 | 48.9% |
| 20 to 24 Minutes | 0 | 0.0% |
| 25 to 29 Minutes | 0 | 0.0% |
| 30 to 34 Minutes | 0 | 0.0% |
| 35 to 39 Minutes | 0 | 0.0% |
| 40 to 44 Minutes | 27 | 20.3% |
| 45 to 59 Minutes | 0 | 0.0% |
| 60 to 89 Minutes | 0 | 0.0% |
| 90 or more Minutes | 39 | 29.3% |
Commute Time by Sex in La Hacienda
The most common commute times in La Hacienda are 15 to 19 minutes (45 commuters, 52.3%) for males and 40 to 44 minutes (27 commuters, 57.5%) for females.
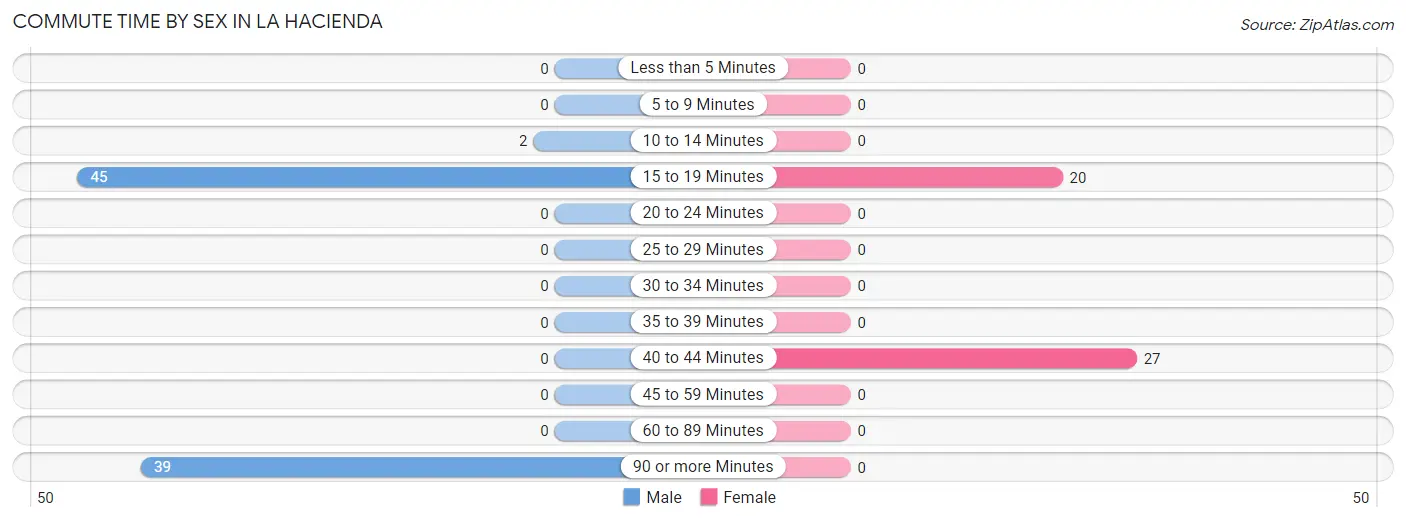
| Commute Time | Male | Female |
| Less than 5 Minutes | 0 (0.0%) | 0 (0.0%) |
| 5 to 9 Minutes | 0 (0.0%) | 0 (0.0%) |
| 10 to 14 Minutes | 2 (2.3%) | 0 (0.0%) |
| 15 to 19 Minutes | 45 (52.3%) | 20 (42.5%) |
| 20 to 24 Minutes | 0 (0.0%) | 0 (0.0%) |
| 25 to 29 Minutes | 0 (0.0%) | 0 (0.0%) |
| 30 to 34 Minutes | 0 (0.0%) | 0 (0.0%) |
| 35 to 39 Minutes | 0 (0.0%) | 0 (0.0%) |
| 40 to 44 Minutes | 0 (0.0%) | 27 (57.5%) |
| 45 to 59 Minutes | 0 (0.0%) | 0 (0.0%) |
| 60 to 89 Minutes | 0 (0.0%) | 0 (0.0%) |
| 90 or more Minutes | 39 (45.4%) | 0 (0.0%) |
Time of Departure to Work by Sex in La Hacienda
The most frequent times of departure to work in La Hacienda are 7:30 AM to 7:59 AM (45, 52.3%) for males and 12:00 PM to 3:59 PM (27, 57.5%) for females.
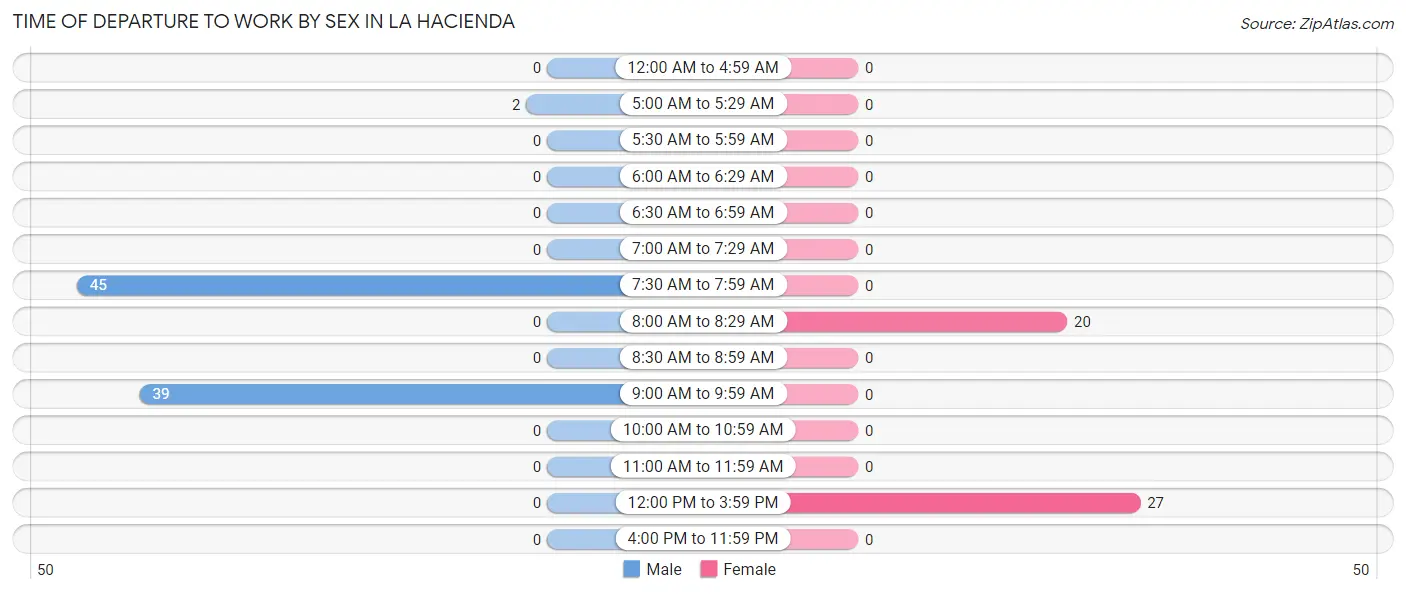
| Time of Departure | Male | Female |
| 12:00 AM to 4:59 AM | 0 (0.0%) | 0 (0.0%) |
| 5:00 AM to 5:29 AM | 2 (2.3%) | 0 (0.0%) |
| 5:30 AM to 5:59 AM | 0 (0.0%) | 0 (0.0%) |
| 6:00 AM to 6:29 AM | 0 (0.0%) | 0 (0.0%) |
| 6:30 AM to 6:59 AM | 0 (0.0%) | 0 (0.0%) |
| 7:00 AM to 7:29 AM | 0 (0.0%) | 0 (0.0%) |
| 7:30 AM to 7:59 AM | 45 (52.3%) | 0 (0.0%) |
| 8:00 AM to 8:29 AM | 0 (0.0%) | 20 (42.5%) |
| 8:30 AM to 8:59 AM | 0 (0.0%) | 0 (0.0%) |
| 9:00 AM to 9:59 AM | 39 (45.4%) | 0 (0.0%) |
| 10:00 AM to 10:59 AM | 0 (0.0%) | 0 (0.0%) |
| 11:00 AM to 11:59 AM | 0 (0.0%) | 0 (0.0%) |
| 12:00 PM to 3:59 PM | 0 (0.0%) | 27 (57.5%) |
| 4:00 PM to 11:59 PM | 0 (0.0%) | 0 (0.0%) |
| Total | 86 (100.0%) | 47 (100.0%) |
Housing Occupancy in La Hacienda
Occupancy by Ownership in La Hacienda
Of the total 229 dwellings in La Hacienda, owner-occupied units account for 156 (68.1%), while renter-occupied units make up 73 (31.9%).
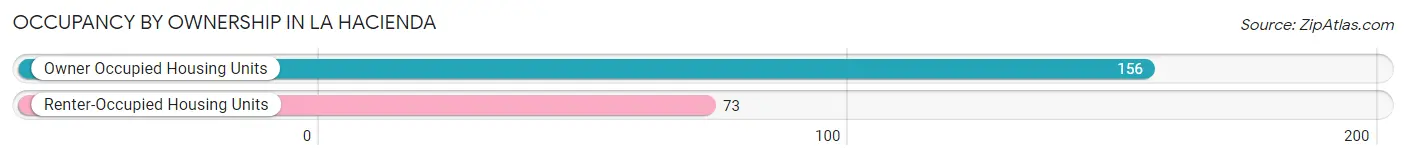
| Occupancy | # Housing Units | % Housing Units |
| Owner Occupied Housing Units | 156 | 68.1% |
| Renter-Occupied Housing Units | 73 | 31.9% |
| Total Occupied Housing Units | 229 | 100.0% |
Occupancy by Household Size in La Hacienda
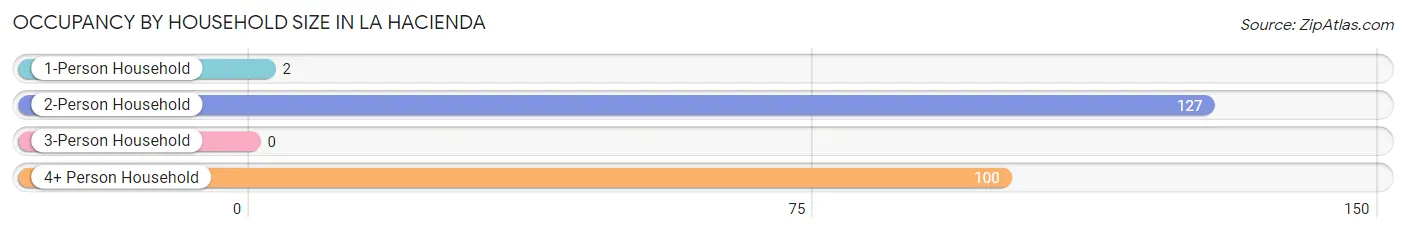
| Household Size | # Housing Units | % Housing Units |
| 1-Person Household | 2 | 0.9% |
| 2-Person Household | 127 | 55.5% |
| 3-Person Household | 0 | 0.0% |
| 4+ Person Household | 100 | 43.7% |
| Total Housing Units | 229 | 100.0% |
Occupancy by Ownership by Household Size in La Hacienda
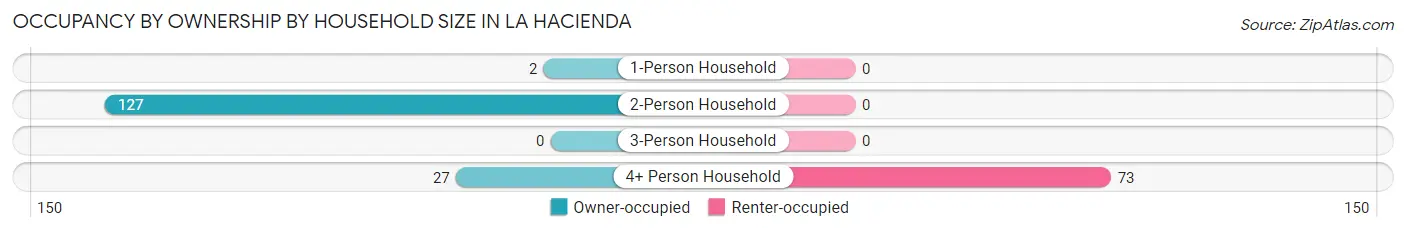
| Household Size | Owner-occupied | Renter-occupied |
| 1-Person Household | 2 (100.0%) | 0 (0.0%) |
| 2-Person Household | 127 (100.0%) | 0 (0.0%) |
| 3-Person Household | 0 (0.0%) | 0 (0.0%) |
| 4+ Person Household | 27 (27.0%) | 73 (73.0%) |
| Total Housing Units | 156 (68.1%) | 73 (31.9%) |
Occupancy by Educational Attainment in La Hacienda
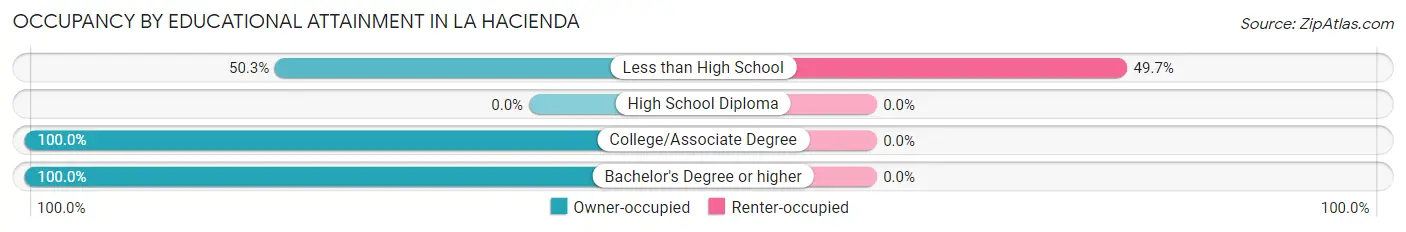
| Household Size | Owner-occupied | Renter-occupied |
| Less than High School | 74 (50.3%) | 73 (49.7%) |
| High School Diploma | 0 (0.0%) | 0 (0.0%) |
| College/Associate Degree | 80 (100.0%) | 0 (0.0%) |
| Bachelor's Degree or higher | 2 (100.0%) | 0 (0.0%) |
Occupancy by Age of Householder in La Hacienda
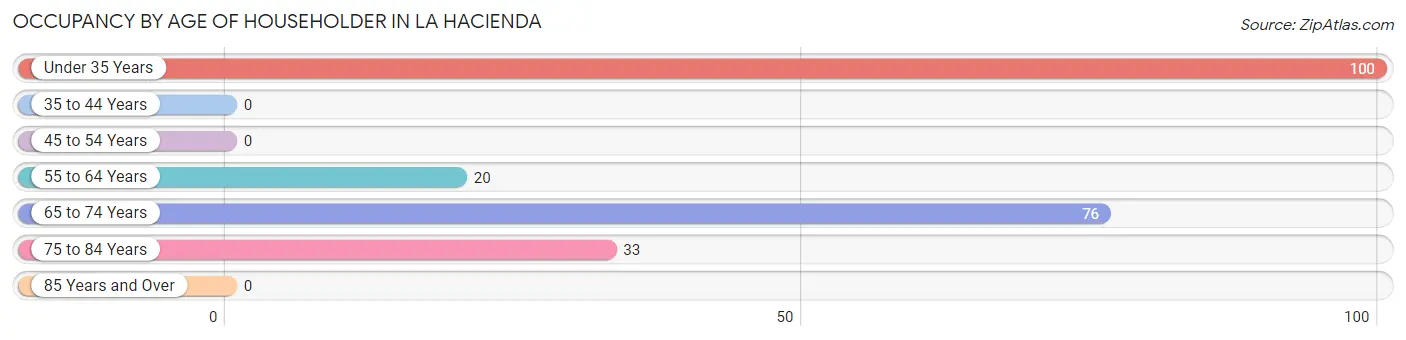
| Age Bracket | # Households | % Households |
| Under 35 Years | 100 | 43.7% |
| 35 to 44 Years | 0 | 0.0% |
| 45 to 54 Years | 0 | 0.0% |
| 55 to 64 Years | 20 | 8.7% |
| 65 to 74 Years | 76 | 33.2% |
| 75 to 84 Years | 33 | 14.4% |
| 85 Years and Over | 0 | 0.0% |
| Total | 229 | 100.0% |
Housing Finances in La Hacienda
Median Income by Occupancy in La Hacienda
| Occupancy Type | # Households | Median Income |
| Owner-Occupied | 156 (68.1%) | $0 |
| Renter-Occupied | 73 (31.9%) | $0 |
| Average | 229 (100.0%) | $0 |
Occupancy by Householder Income Bracket in La Hacienda
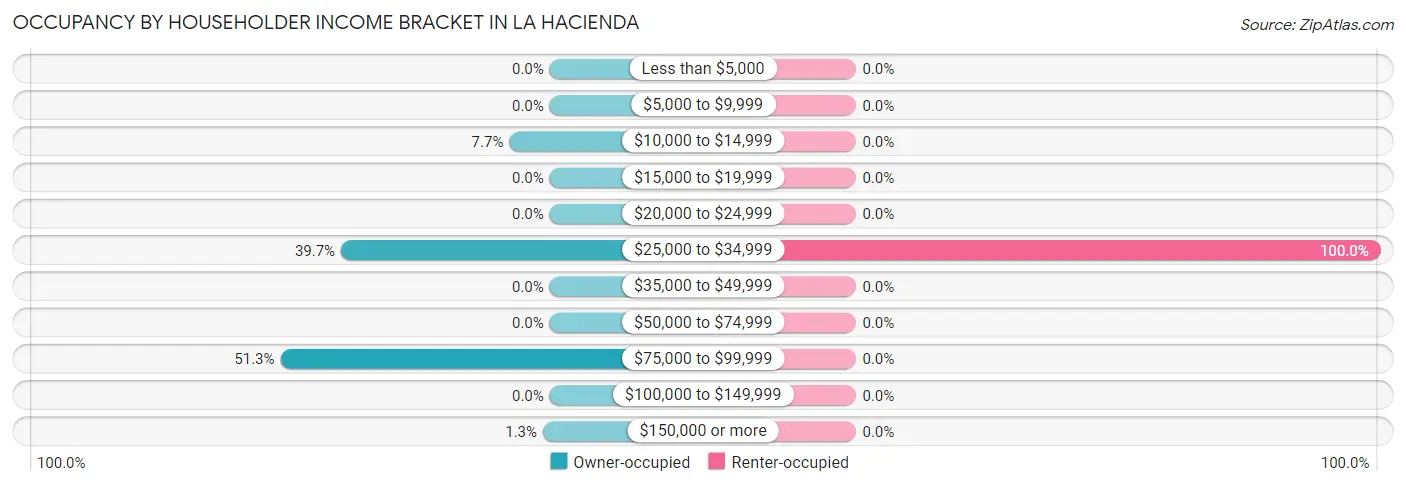
| Income Bracket | Owner-occupied | Renter-occupied |
| Less than $5,000 | 0 (0.0%) | 0 (0.0%) |
| $5,000 to $9,999 | 0 (0.0%) | 0 (0.0%) |
| $10,000 to $14,999 | 12 (7.7%) | 0 (0.0%) |
| $15,000 to $19,999 | 0 (0.0%) | 0 (0.0%) |
| $20,000 to $24,999 | 0 (0.0%) | 0 (0.0%) |
| $25,000 to $34,999 | 62 (39.7%) | 73 (100.0%) |
| $35,000 to $49,999 | 0 (0.0%) | 0 (0.0%) |
| $50,000 to $74,999 | 0 (0.0%) | 0 (0.0%) |
| $75,000 to $99,999 | 80 (51.3%) | 0 (0.0%) |
| $100,000 to $149,999 | 0 (0.0%) | 0 (0.0%) |
| $150,000 or more | 2 (1.3%) | 0 (0.0%) |
| Total | 156 (100.0%) | 73 (100.0%) |
Monthly Housing Cost Tiers in La Hacienda
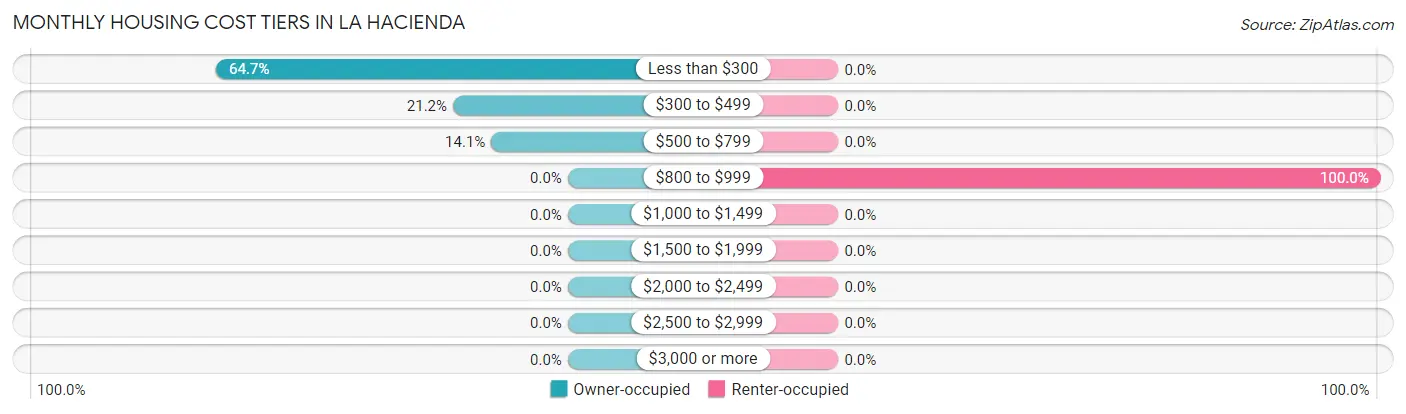
| Monthly Cost | Owner-occupied | Renter-occupied |
| Less than $300 | 101 (64.7%) | 0 (0.0%) |
| $300 to $499 | 33 (21.1%) | 0 (0.0%) |
| $500 to $799 | 22 (14.1%) | 0 (0.0%) |
| $800 to $999 | 0 (0.0%) | 73 (100.0%) |
| $1,000 to $1,499 | 0 (0.0%) | 0 (0.0%) |
| $1,500 to $1,999 | 0 (0.0%) | 0 (0.0%) |
| $2,000 to $2,499 | 0 (0.0%) | 0 (0.0%) |
| $2,500 to $2,999 | 0 (0.0%) | 0 (0.0%) |
| $3,000 or more | 0 (0.0%) | 0 (0.0%) |
| Total | 156 (100.0%) | 73 (100.0%) |
Physical Housing Characteristics in La Hacienda
Housing Structures in La Hacienda
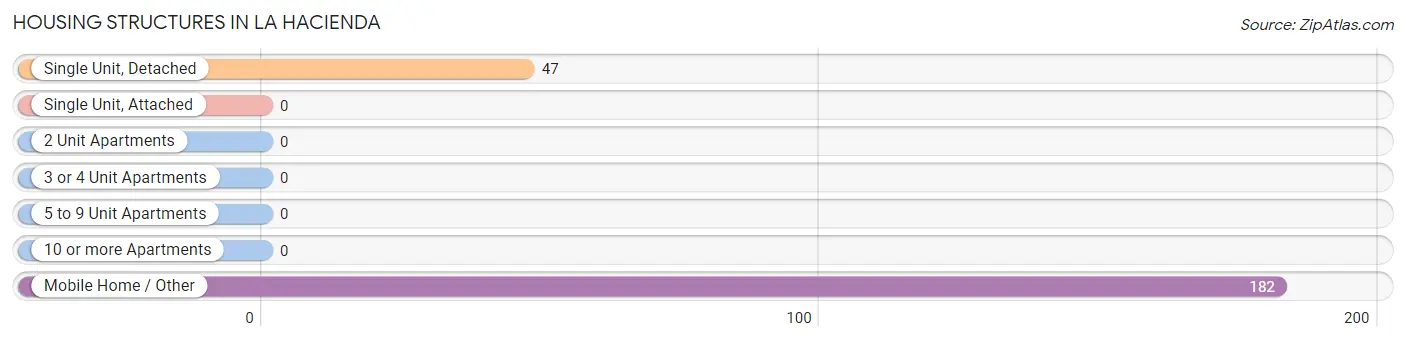
| Structure Type | # Housing Units | % Housing Units |
| Single Unit, Detached | 47 | 20.5% |
| Single Unit, Attached | 0 | 0.0% |
| 2 Unit Apartments | 0 | 0.0% |
| 3 or 4 Unit Apartments | 0 | 0.0% |
| 5 to 9 Unit Apartments | 0 | 0.0% |
| 10 or more Apartments | 0 | 0.0% |
| Mobile Home / Other | 182 | 79.5% |
| Total | 229 | 100.0% |
Housing Structures by Occupancy in La Hacienda
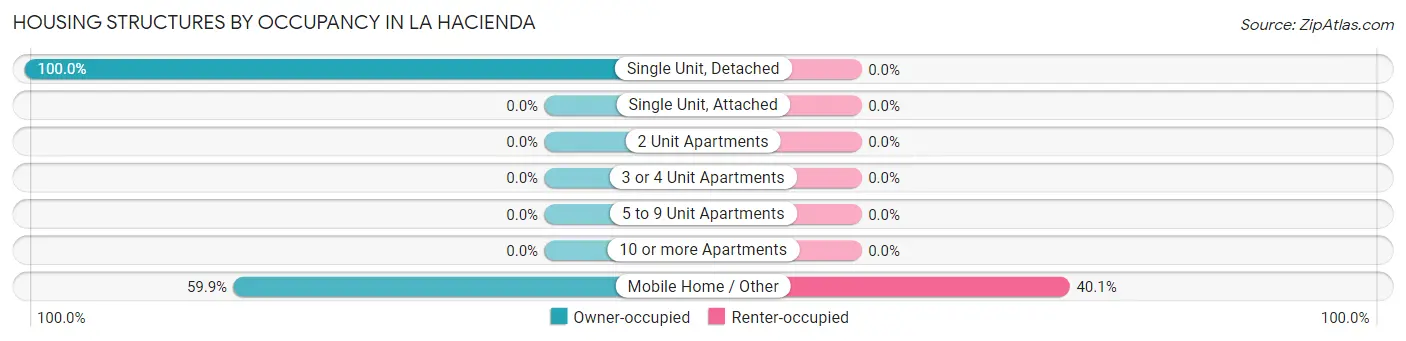
| Structure Type | Owner-occupied | Renter-occupied |
| Single Unit, Detached | 47 (100.0%) | 0 (0.0%) |
| Single Unit, Attached | 0 (0.0%) | 0 (0.0%) |
| 2 Unit Apartments | 0 (0.0%) | 0 (0.0%) |
| 3 or 4 Unit Apartments | 0 (0.0%) | 0 (0.0%) |
| 5 to 9 Unit Apartments | 0 (0.0%) | 0 (0.0%) |
| 10 or more Apartments | 0 (0.0%) | 0 (0.0%) |
| Mobile Home / Other | 109 (59.9%) | 73 (40.1%) |
| Total | 156 (68.1%) | 73 (31.9%) |
Housing Structures by Number of Rooms in La Hacienda
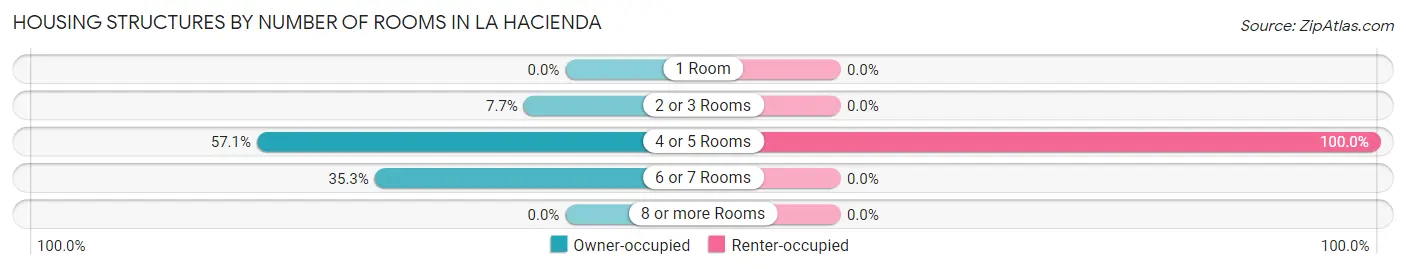
| Number of Rooms | Owner-occupied | Renter-occupied |
| 1 Room | 0 (0.0%) | 0 (0.0%) |
| 2 or 3 Rooms | 12 (7.7%) | 0 (0.0%) |
| 4 or 5 Rooms | 89 (57.1%) | 73 (100.0%) |
| 6 or 7 Rooms | 55 (35.3%) | 0 (0.0%) |
| 8 or more Rooms | 0 (0.0%) | 0 (0.0%) |
| Total | 156 (100.0%) | 73 (100.0%) |
Housing Structure by Heating Type in La Hacienda
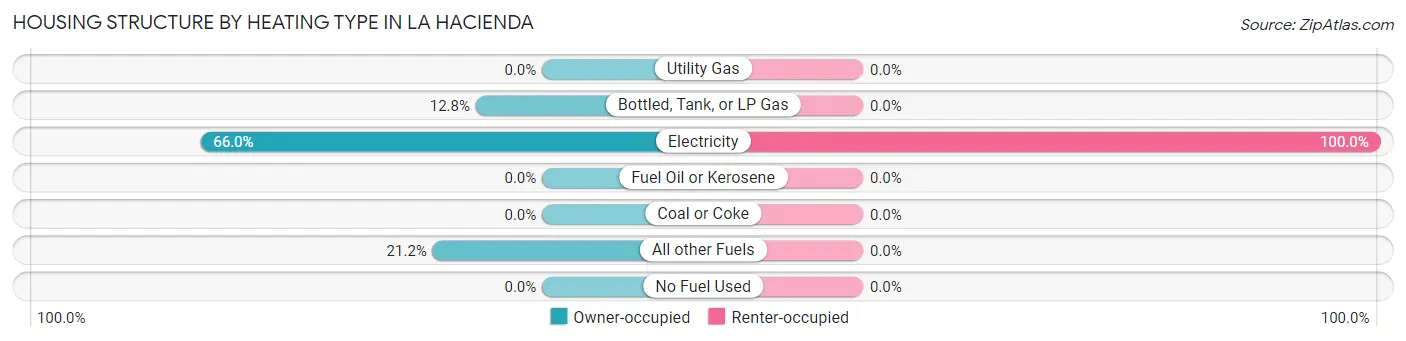
| Heating Type | Owner-occupied | Renter-occupied |
| Utility Gas | 0 (0.0%) | 0 (0.0%) |
| Bottled, Tank, or LP Gas | 20 (12.8%) | 0 (0.0%) |
| Electricity | 103 (66.0%) | 73 (100.0%) |
| Fuel Oil or Kerosene | 0 (0.0%) | 0 (0.0%) |
| Coal or Coke | 0 (0.0%) | 0 (0.0%) |
| All other Fuels | 33 (21.1%) | 0 (0.0%) |
| No Fuel Used | 0 (0.0%) | 0 (0.0%) |
| Total | 156 (100.0%) | 73 (100.0%) |
Household Vehicle Usage in La Hacienda
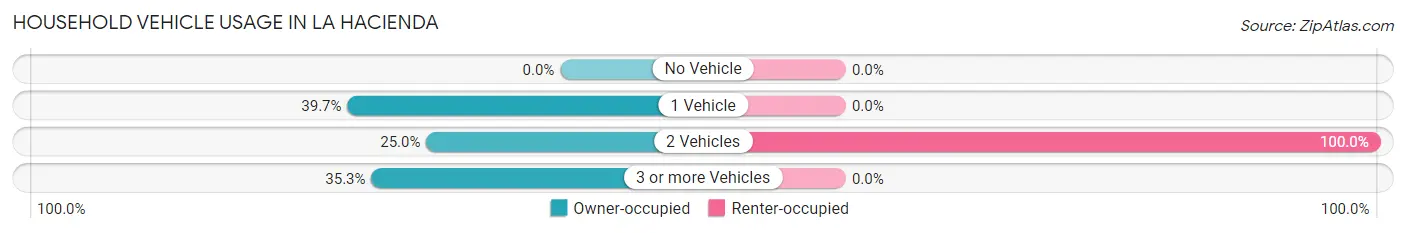
| Vehicles per Household | Owner-occupied | Renter-occupied |
| No Vehicle | 0 (0.0%) | 0 (0.0%) |
| 1 Vehicle | 62 (39.7%) | 0 (0.0%) |
| 2 Vehicles | 39 (25.0%) | 73 (100.0%) |
| 3 or more Vehicles | 55 (35.3%) | 0 (0.0%) |
| Total | 156 (100.0%) | 73 (100.0%) |
Real Estate & Mortgages in La Hacienda
Real Estate and Mortgage Overview in La Hacienda
| Characteristic | Without Mortgage | With Mortgage |
| Housing Units | 136 | 20 |
| Median Property Value | - | - |
| Median Household Income | - | - |
| Monthly Housing Costs | $223 | $0 |
| Real Estate Taxes | $511 | $0 |
Property Value by Mortgage Status in La Hacienda
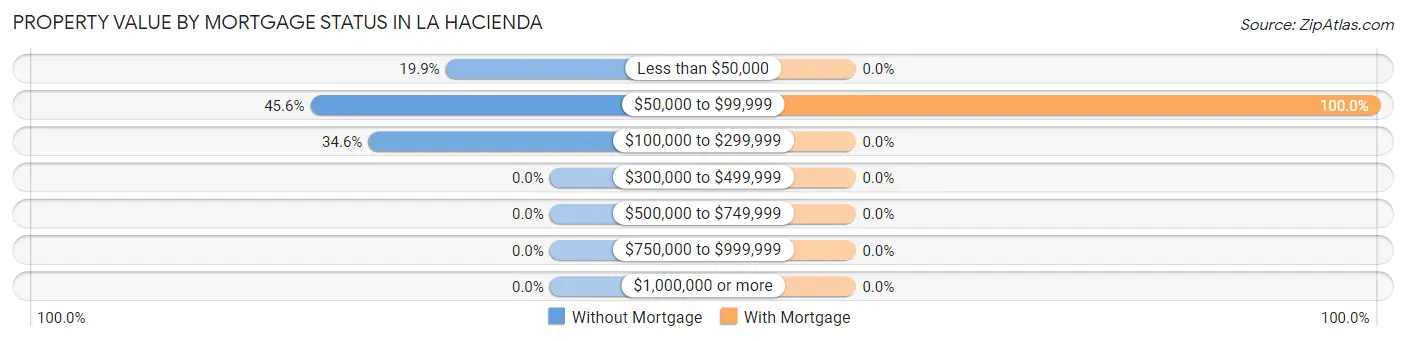
| Property Value | Without Mortgage | With Mortgage |
| Less than $50,000 | 27 (19.9%) | 0 (0.0%) |
| $50,000 to $99,999 | 62 (45.6%) | 20 (100.0%) |
| $100,000 to $299,999 | 47 (34.6%) | 0 (0.0%) |
| $300,000 to $499,999 | 0 (0.0%) | 0 (0.0%) |
| $500,000 to $749,999 | 0 (0.0%) | 0 (0.0%) |
| $750,000 to $999,999 | 0 (0.0%) | 0 (0.0%) |
| $1,000,000 or more | 0 (0.0%) | 0 (0.0%) |
| Total | 136 (100.0%) | 20 (100.0%) |
Household Income by Mortgage Status in La Hacienda
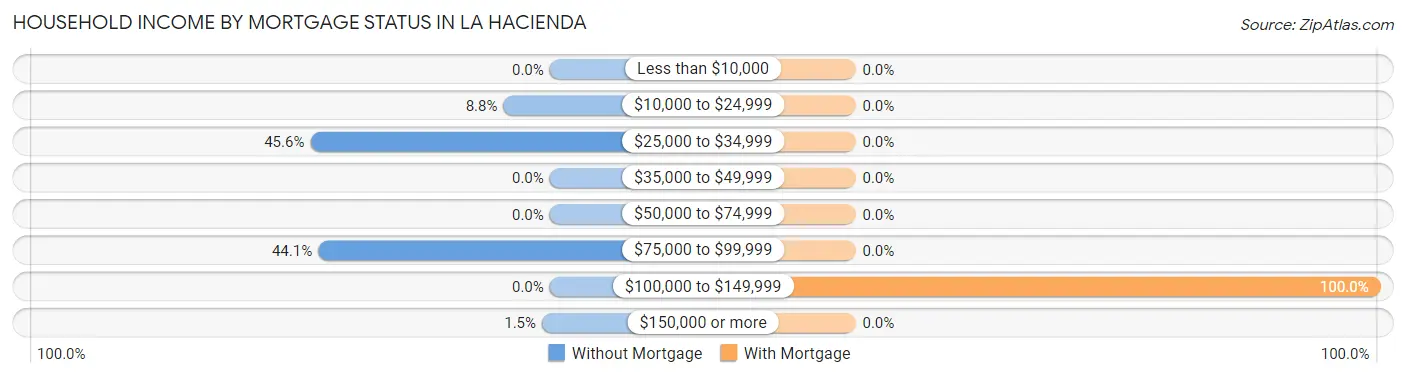
| Household Income | Without Mortgage | With Mortgage |
| Less than $10,000 | 0 (0.0%) | 0 (0.0%) |
| $10,000 to $24,999 | 12 (8.8%) | 0 (0.0%) |
| $25,000 to $34,999 | 62 (45.6%) | 0 (0.0%) |
| $35,000 to $49,999 | 0 (0.0%) | 0 (0.0%) |
| $50,000 to $74,999 | 0 (0.0%) | 0 (0.0%) |
| $75,000 to $99,999 | 60 (44.1%) | 0 (0.0%) |
| $100,000 to $149,999 | 0 (0.0%) | 20 (100.0%) |
| $150,000 or more | 2 (1.5%) | 0 (0.0%) |
| Total | 136 (100.0%) | 20 (100.0%) |
Property Value to Household Income Ratio in La Hacienda
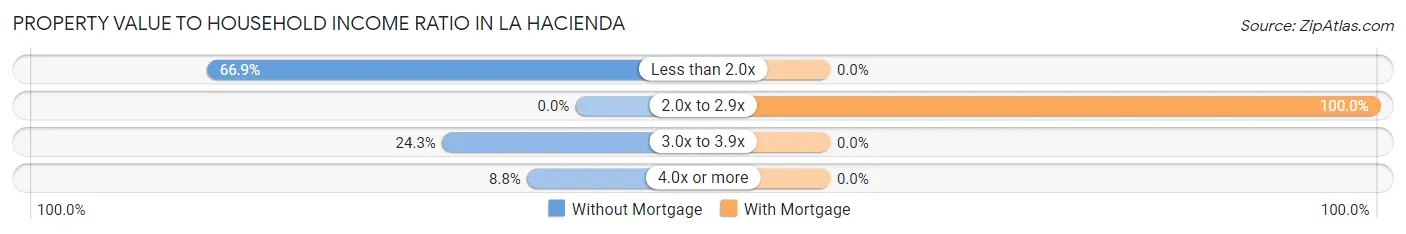
| Value-to-Income Ratio | Without Mortgage | With Mortgage |
| Less than 2.0x | 91 (66.9%) | 0 (0.0%) |
| 2.0x to 2.9x | 0 (0.0%) | 20 (100.0%) |
| 3.0x to 3.9x | 33 (24.3%) | 0 (0.0%) |
| 4.0x or more | 12 (8.8%) | 0 (0.0%) |
| Total | 136 (100.0%) | 20 (100.0%) |
Real Estate Taxes by Mortgage Status in La Hacienda
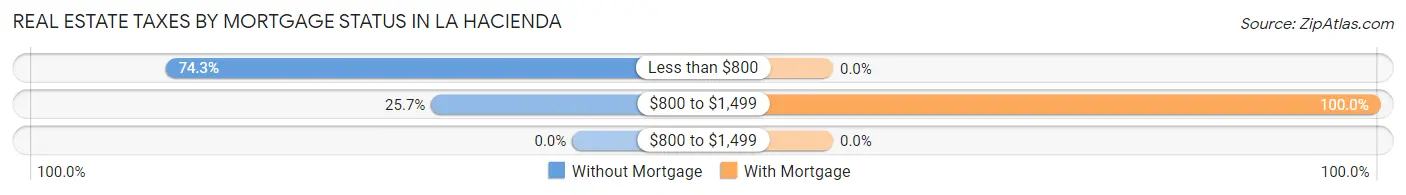
| Property Taxes | Without Mortgage | With Mortgage |
| Less than $800 | 101 (74.3%) | 0 (0.0%) |
| $800 to $1,499 | 35 (25.7%) | 20 (100.0%) |
| $800 to $1,499 | 0 (0.0%) | 0 (0.0%) |
| Total | 136 (100.0%) | 20 (100.0%) |
Health & Disability in La Hacienda
Health Insurance Coverage by Age in La Hacienda
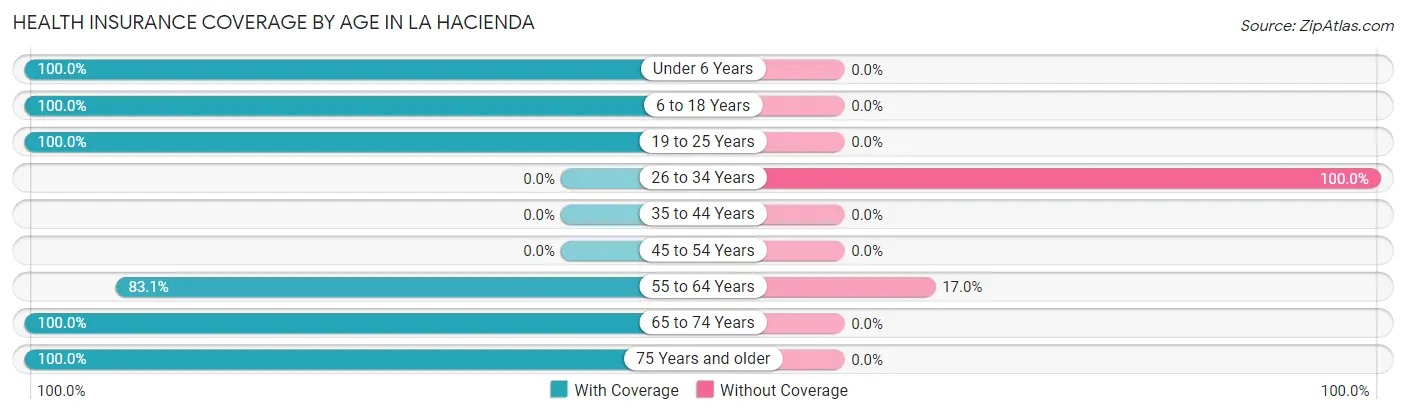
| Age Bracket | With Coverage | Without Coverage |
| Under 6 Years | 136 (100.0%) | 0 (0.0%) |
| 6 to 18 Years | 74 (100.0%) | 0 (0.0%) |
| 19 to 25 Years | 118 (100.0%) | 0 (0.0%) |
| 26 to 34 Years | 0 (0.0%) | 66 (100.0%) |
| 35 to 44 Years | 0 (0.0%) | 0 (0.0%) |
| 45 to 54 Years | 0 (0.0%) | 0 (0.0%) |
| 55 to 64 Years | 98 (83.1%) | 20 (17.0%) |
| 65 to 74 Years | 91 (100.0%) | 0 (0.0%) |
| 75 Years and older | 53 (100.0%) | 0 (0.0%) |
| Total | 570 (86.9%) | 86 (13.1%) |
Health Insurance Coverage by Citizenship Status in La Hacienda
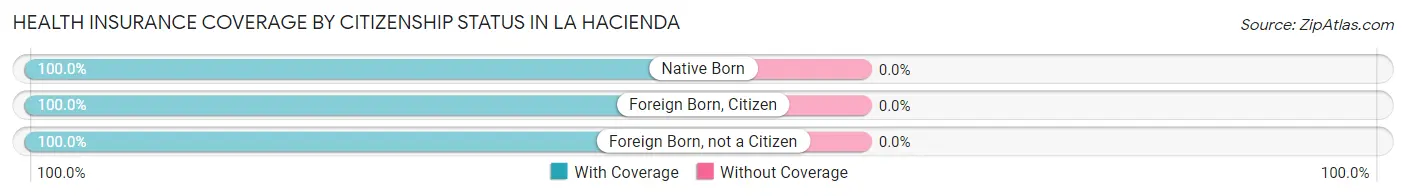
| Citizenship Status | With Coverage | Without Coverage |
| Native Born | 136 (100.0%) | 0 (0.0%) |
| Foreign Born, Citizen | 74 (100.0%) | 0 (0.0%) |
| Foreign Born, not a Citizen | 118 (100.0%) | 0 (0.0%) |
Health Insurance Coverage by Household Income in La Hacienda
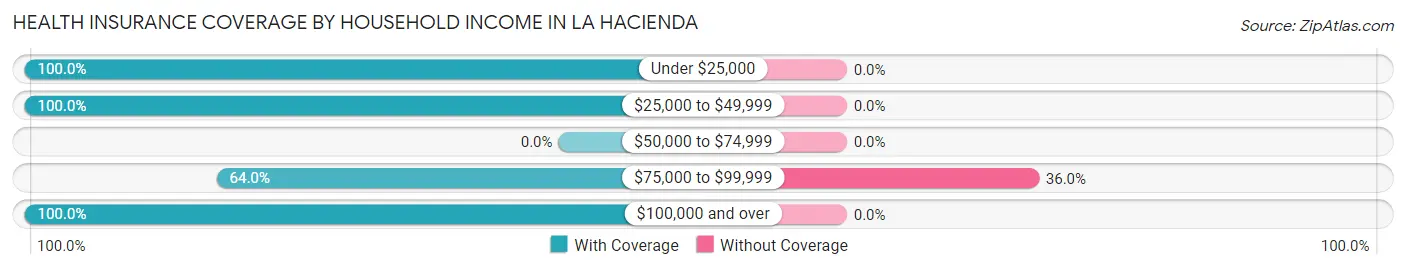
| Household Income | With Coverage | Without Coverage |
| Under $25,000 | 32 (100.0%) | 0 (0.0%) |
| $25,000 to $49,999 | 383 (100.0%) | 0 (0.0%) |
| $50,000 to $74,999 | 0 (0.0%) | 0 (0.0%) |
| $75,000 to $99,999 | 153 (64.0%) | 86 (36.0%) |
| $100,000 and over | 2 (100.0%) | 0 (0.0%) |
Public vs Private Health Insurance Coverage by Age in La Hacienda
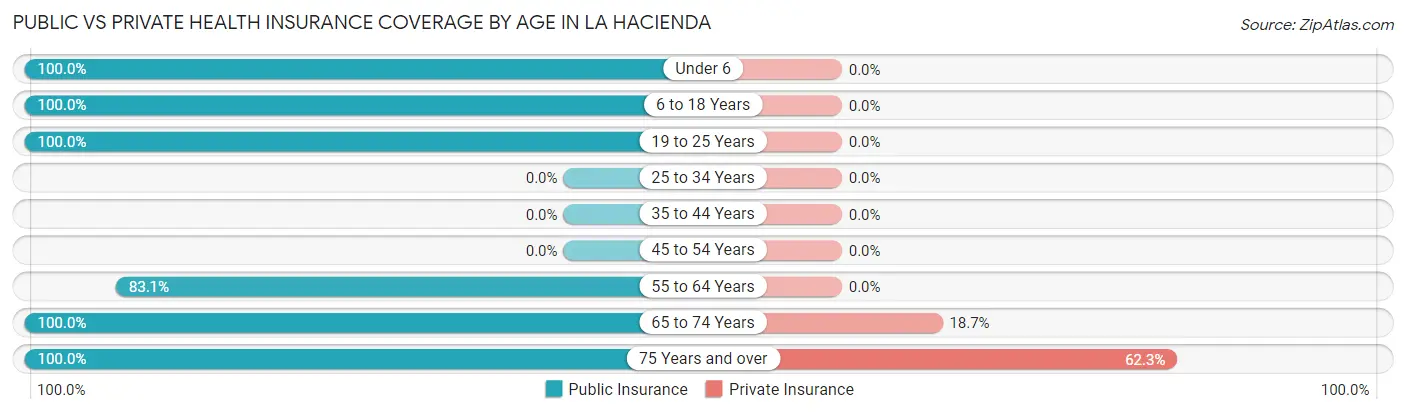
| Age Bracket | Public Insurance | Private Insurance |
| Under 6 | 136 (100.0%) | 0 (0.0%) |
| 6 to 18 Years | 74 (100.0%) | 0 (0.0%) |
| 19 to 25 Years | 118 (100.0%) | 0 (0.0%) |
| 25 to 34 Years | 0 (0.0%) | 0 (0.0%) |
| 35 to 44 Years | 0 (0.0%) | 0 (0.0%) |
| 45 to 54 Years | 0 (0.0%) | 0 (0.0%) |
| 55 to 64 Years | 98 (83.1%) | 0 (0.0%) |
| 65 to 74 Years | 91 (100.0%) | 17 (18.7%) |
| 75 Years and over | 53 (100.0%) | 33 (62.3%) |
| Total | 570 (86.9%) | 50 (7.6%) |
Disability Status by Sex by Age in La Hacienda
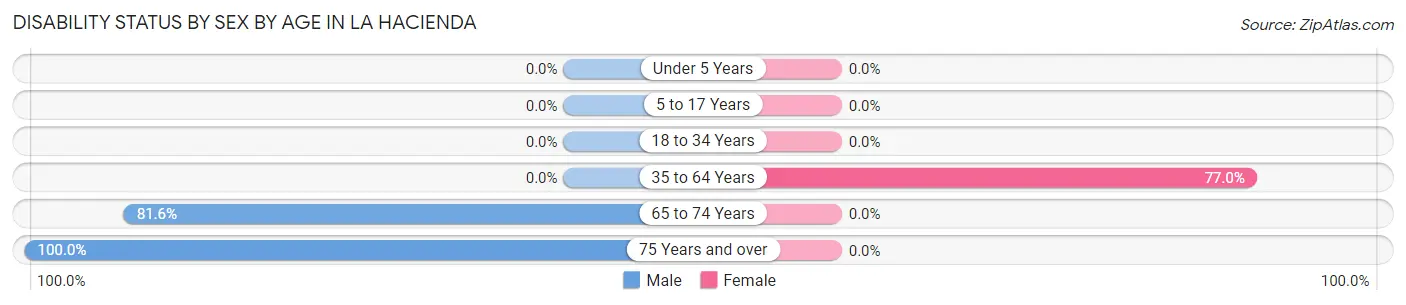
| Age Bracket | Male | Female |
| Under 5 Years | 0 (0.0%) | 0 (0.0%) |
| 5 to 17 Years | 0 (0.0%) | 0 (0.0%) |
| 18 to 34 Years | 0 (0.0%) | 0 (0.0%) |
| 35 to 64 Years | 0 (0.0%) | 67 (77.0%) |
| 65 to 74 Years | 62 (81.6%) | 0 (0.0%) |
| 75 Years and over | 33 (100.0%) | 0 (0.0%) |
Disability Class by Sex by Age in La Hacienda
Disability Class: Hearing Difficulty
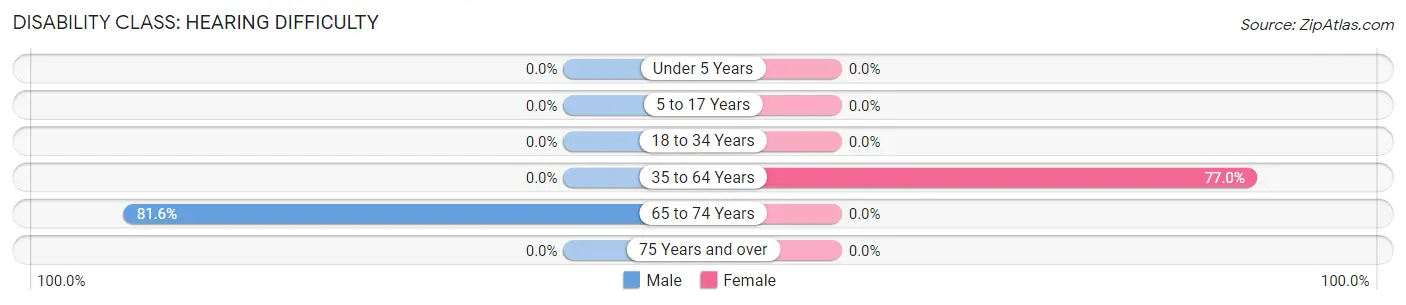
| Age Bracket | Male | Female |
| Under 5 Years | 0 (0.0%) | 0 (0.0%) |
| 5 to 17 Years | 0 (0.0%) | 0 (0.0%) |
| 18 to 34 Years | 0 (0.0%) | 0 (0.0%) |
| 35 to 64 Years | 0 (0.0%) | 67 (77.0%) |
| 65 to 74 Years | 62 (81.6%) | 0 (0.0%) |
| 75 Years and over | 0 (0.0%) | 0 (0.0%) |
Disability Class: Vision Difficulty
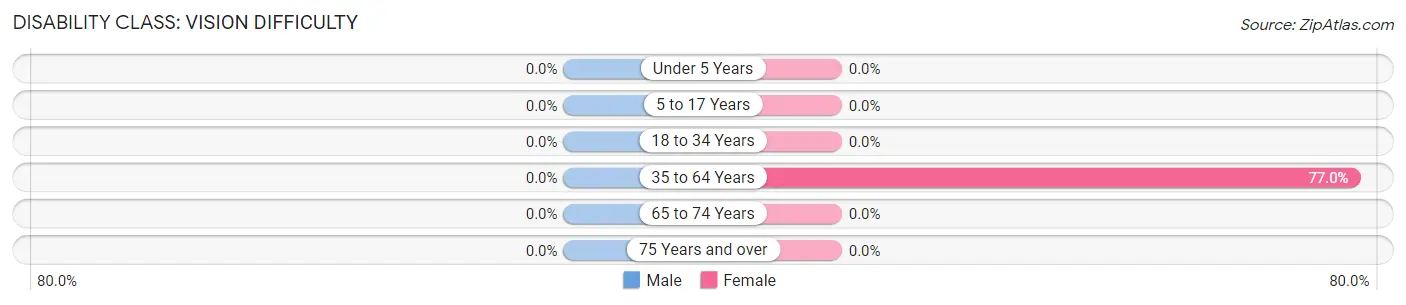
| Age Bracket | Male | Female |
| Under 5 Years | 0 (0.0%) | 0 (0.0%) |
| 5 to 17 Years | 0 (0.0%) | 0 (0.0%) |
| 18 to 34 Years | 0 (0.0%) | 0 (0.0%) |
| 35 to 64 Years | 0 (0.0%) | 67 (77.0%) |
| 65 to 74 Years | 0 (0.0%) | 0 (0.0%) |
| 75 Years and over | 0 (0.0%) | 0 (0.0%) |
Disability Class: Cognitive Difficulty
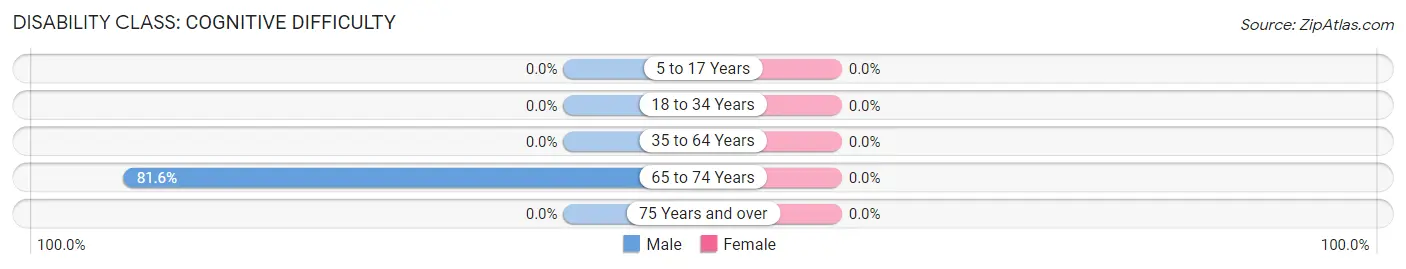
| Age Bracket | Male | Female |
| 5 to 17 Years | 0 (0.0%) | 0 (0.0%) |
| 18 to 34 Years | 0 (0.0%) | 0 (0.0%) |
| 35 to 64 Years | 0 (0.0%) | 0 (0.0%) |
| 65 to 74 Years | 62 (81.6%) | 0 (0.0%) |
| 75 Years and over | 0 (0.0%) | 0 (0.0%) |
Disability Class: Ambulatory Difficulty
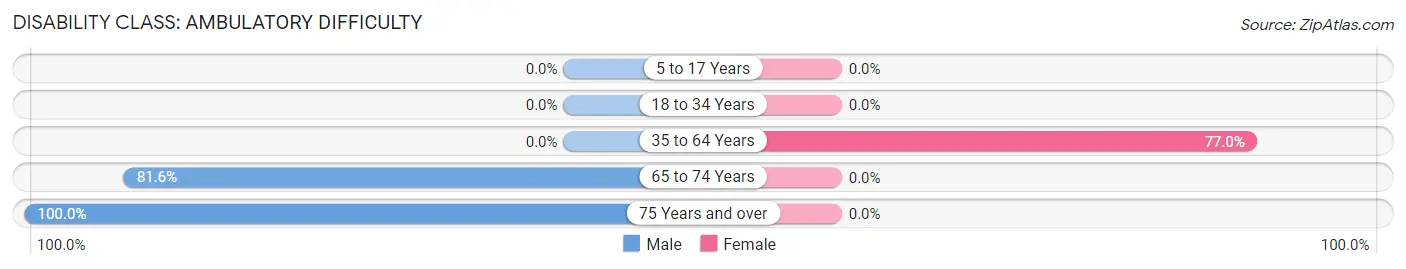
| Age Bracket | Male | Female |
| 5 to 17 Years | 0 (0.0%) | 0 (0.0%) |
| 18 to 34 Years | 0 (0.0%) | 0 (0.0%) |
| 35 to 64 Years | 0 (0.0%) | 67 (77.0%) |
| 65 to 74 Years | 62 (81.6%) | 0 (0.0%) |
| 75 Years and over | 33 (100.0%) | 0 (0.0%) |
Disability Class: Self-Care Difficulty
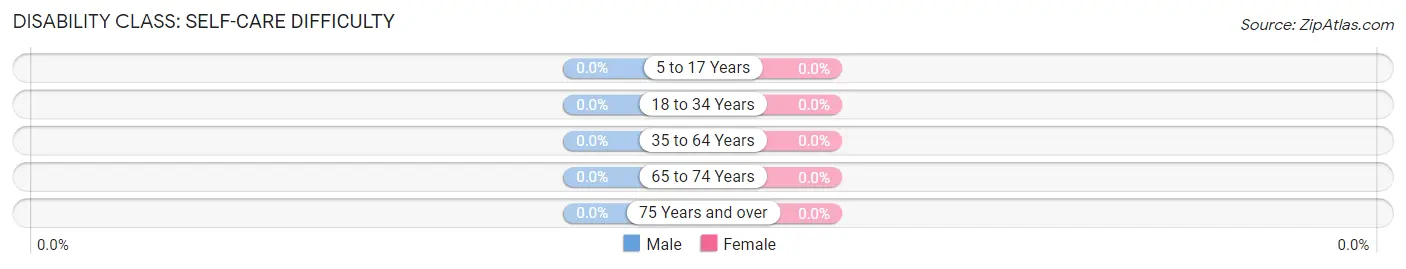
| Age Bracket | Male | Female |
| 5 to 17 Years | 0 (0.0%) | 0 (0.0%) |
| 18 to 34 Years | 0 (0.0%) | 0 (0.0%) |
| 35 to 64 Years | 0 (0.0%) | 0 (0.0%) |
| 65 to 74 Years | 0 (0.0%) | 0 (0.0%) |
| 75 Years and over | 0 (0.0%) | 0 (0.0%) |
Technology Access in La Hacienda
Computing Device Access in La Hacienda
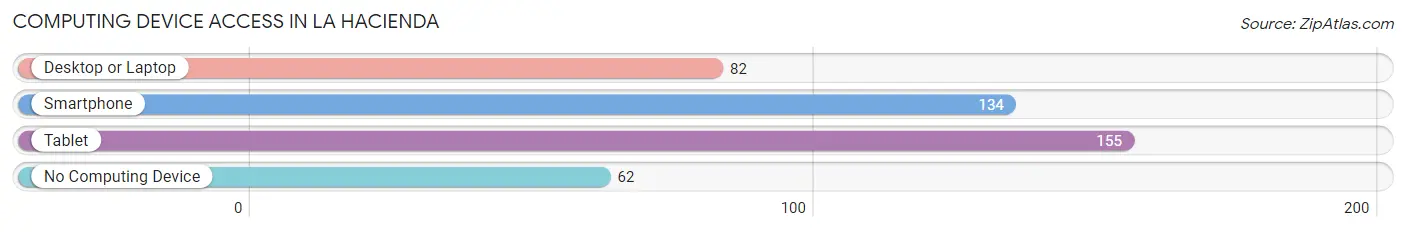
| Device Type | # Households | % Households |
| Desktop or Laptop | 82 | 35.8% |
| Smartphone | 134 | 58.5% |
| Tablet | 155 | 67.7% |
| No Computing Device | 62 | 27.1% |
| Total | 229 | 100.0% |
Internet Access in La Hacienda
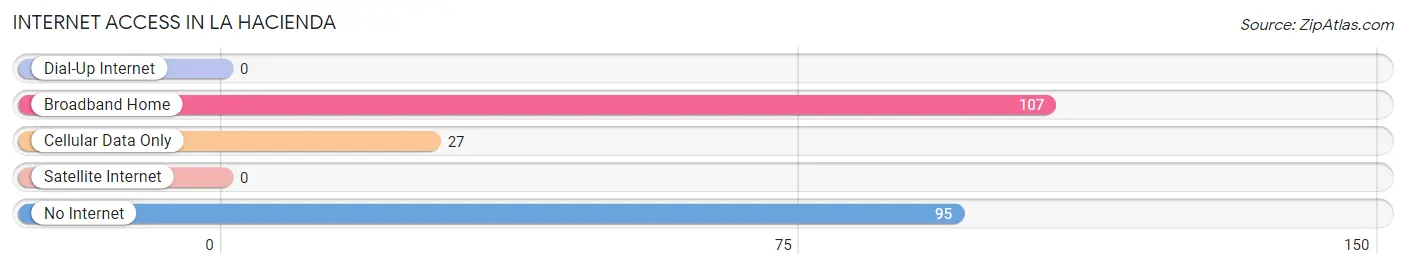
| Internet Type | # Households | % Households |
| Dial-Up Internet | 0 | 0.0% |
| Broadband Home | 107 | 46.7% |
| Cellular Data Only | 27 | 11.8% |
| Satellite Internet | 0 | 0.0% |
| No Internet | 95 | 41.5% |
| Total | 229 | 100.0% |
La Hacienda Summary
La Hacienda, New Mexico is a small unincorporated community located in the northern part of the state. It is situated in the foothills of the Sangre de Cristo Mountains, approximately 25 miles north of Santa Fe. The area is known for its scenic beauty and rural lifestyle.
History
La Hacienda was founded in the late 1800s by a group of Mexican settlers who were looking for a place to call home. The area was originally part of the Spanish land grant known as the Tierra Amarilla Land Grant. The settlers built a small village and named it La Hacienda, which translates to “the estate” in English.
The village grew slowly over the years, and by the early 1900s it had become a thriving community. The area was known for its agricultural production, and the local economy was largely based on farming and ranching. The village also had a small school, a post office, and a few stores.
In the mid-1900s, the area began to experience a population decline as many of the residents moved away in search of better economic opportunities. By the late 1970s, the population had dropped to just over 100 people.
Geography
La Hacienda is located in the northern part of New Mexico, in the foothills of the Sangre de Cristo Mountains. The area is known for its scenic beauty, with rolling hills, lush forests, and stunning views of the surrounding mountains. The climate is semi-arid, with hot summers and cold winters.
The village is situated at an elevation of 6,400 feet, and the surrounding area is mostly rural. The nearest major city is Santa Fe, which is located approximately 25 miles to the south.
Economy
The local economy is largely based on agriculture and ranching. The area is known for its production of hay, alfalfa, and other crops. Livestock production is also important, with cattle, sheep, and goats being raised in the area.
In recent years, the area has seen an increase in tourism, with visitors coming to enjoy the area’s scenic beauty and rural lifestyle. There are also a few small businesses in the area, including a few restaurants, a gas station, and a few stores.
Demographics
As of the 2010 census, the population of La Hacienda was estimated to be around 200 people. The majority of the population is of Hispanic or Latino origin, with a small percentage of Native American and White residents. The median household income is around $30,000, and the median age is around 40 years old.
La Hacienda is a small, rural community with a rich history and a unique culture. The area is known for its scenic beauty and rural lifestyle, and it is a popular destination for visitors looking to experience the beauty of northern New Mexico.
Common Questions
What is Per Capita Income in La Hacienda?
Per Capita income in La Hacienda is $15,568.
What is Inequality or Gini Index in La Hacienda?
Inequality or Gini Index in La Hacienda is 0.31.
What is the Total Population of La Hacienda?
Total Population of La Hacienda is 656.
What is the Total Male Population of La Hacienda?
Total Male Population of La Hacienda is 302.
What is the Total Female Population of La Hacienda?
Total Female Population of La Hacienda is 354.
What is the Ratio of Males per 100 Females in La Hacienda?
There are 85.31 Males per 100 Females in La Hacienda.
What is the Ratio of Females per 100 Males in La Hacienda?
There are 117.22 Females per 100 Males in La Hacienda.
What is the Median Population Age in La Hacienda?
Median Population Age in La Hacienda is 26.0 Years.
What is the Average Family Size in La Hacienda
Average Family Size in La Hacienda is 2.7 People.
What is the Average Household Size in La Hacienda
Average Household Size in La Hacienda is 2.9 People.
How Large is the Labor Force in La Hacienda?
There are 133 People in the Labor Forcein in La Hacienda.
What is the Percentage of People in the Labor Force in La Hacienda?
29.8% of People are in the Labor Force in La Hacienda.