Zip Codes with the Highest Percentage of Population Employed in Material Moving in Farmington, NM
RELATED REPORTS & OPTIONS
Material Moving
Farmington
Compare Zip Codes
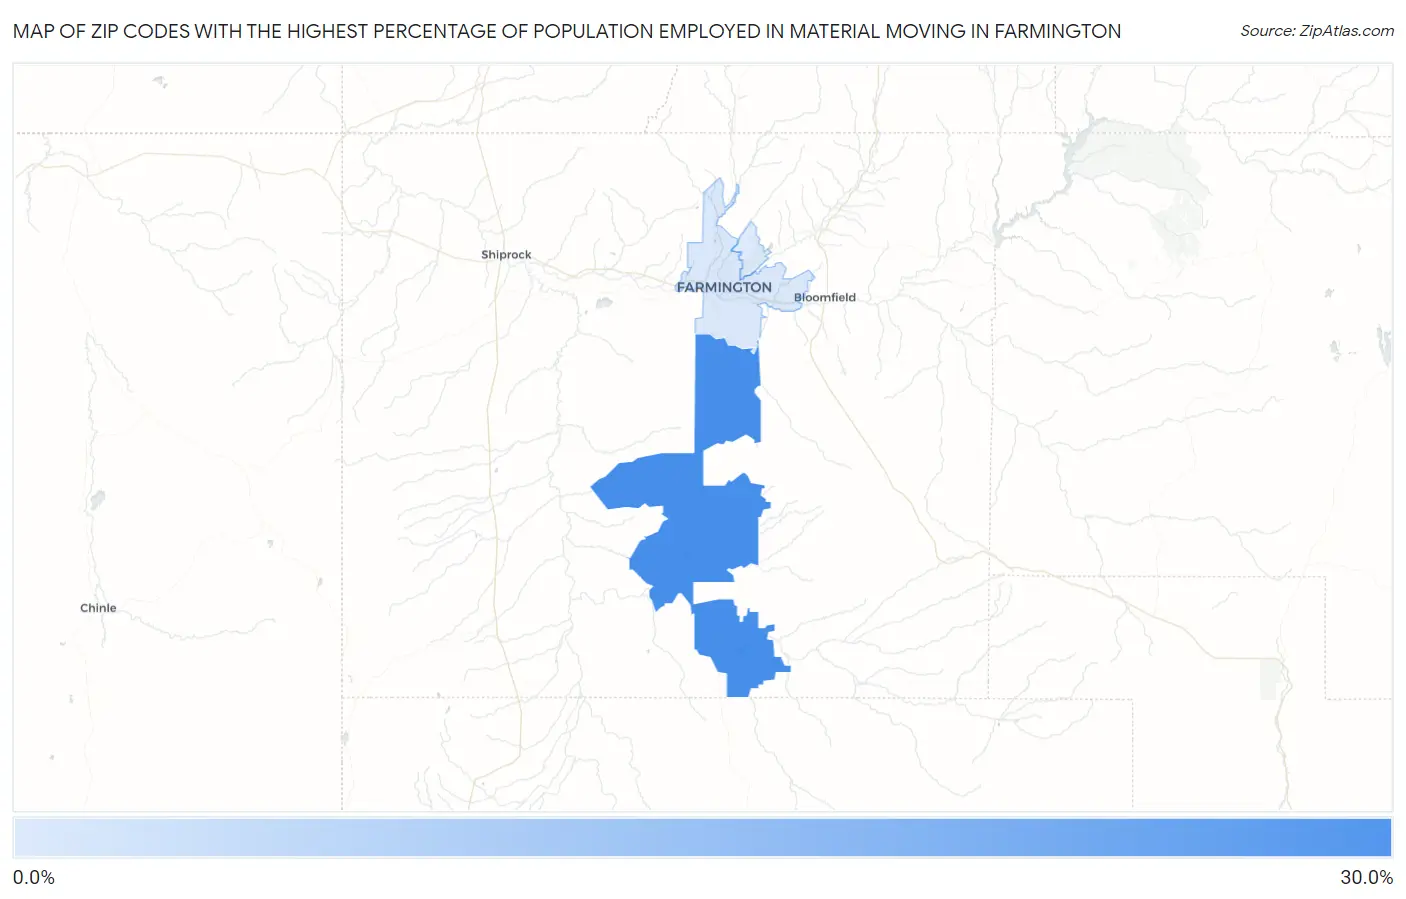
Map of Zip Codes with the Highest Percentage of Population Employed in Material Moving in Farmington
2.8%
28.3%
Zip Codes with the Highest Percentage of Population Employed in Material Moving in Farmington, NM
| Zip Code | % Employed | vs State | vs National | |
| 1. | 87499 | 28.3% | 3.2%(+25.1)#3 | 3.8%(+24.4)#186 |
| 2. | 87401 | 3.3% | 3.2%(+0.124)#89 | 3.8%(-0.540)#15,708 |
| 3. | 87402 | 2.8% | 3.2%(-0.389)#112 | 3.8%(-1.05)#17,978 |
1
Common Questions
What are the Top Zip Codes with the Highest Percentage of Population Employed in Material Moving in Farmington, NM?
Top Zip Codes with the Highest Percentage of Population Employed in Material Moving in Farmington, NM are:
What zip code has the Highest Percentage of Population Employed in Material Moving in Farmington, NM?
87499 has the Highest Percentage of Population Employed in Material Moving in Farmington, NM with 28.3%.
What is the Percentage of Population Employed in Material Moving in Farmington, NM?
Percentage of Population Employed in Material Moving in Farmington is 3.3%.
What is the Percentage of Population Employed in Material Moving in New Mexico?
Percentage of Population Employed in Material Moving in New Mexico is 3.2%.
What is the Percentage of Population Employed in Material Moving in the United States?
Percentage of Population Employed in Material Moving in the United States is 3.8%.