Columbus, NM Map & Demographics
Columbus Map
Columbus Overview
$14,725
PER CAPITA INCOME
$30,031
AVG FAMILY INCOME
$26,549
AVG HOUSEHOLD INCOME
57.6%
WAGE / INCOME GAP [ % ]
42.4¢/ $1
WAGE / INCOME GAP [ $ ]
0.43
INEQUALITY / GINI INDEX
1,281
TOTAL POPULATION
610
MALE POPULATION
671
FEMALE POPULATION
90.91
MALES / 100 FEMALES
110.00
FEMALES / 100 MALES
31.4
MEDIAN AGE
3.7
AVG FAMILY SIZE
2.9
AVG HOUSEHOLD SIZE
474
LABOR FORCE [ PEOPLE ]
51.5%
PERCENT IN LABOR FORCE
13.7%
UNEMPLOYMENT RATE
Columbus Zip Codes
Columbus Area Codes
Income in Columbus
Income Overview in Columbus
Per Capita Income in Columbus is $14,725, while median incomes of families and households are $30,031 and $26,549 respectively.
| Characteristic | Number | Measure |
| Per Capita Income | 1,281 | $14,725 |
| Median Family Income | 295 | $30,031 |
| Mean Family Income | 295 | $41,900 |
| Median Household Income | 445 | $26,549 |
| Mean Household Income | 445 | $34,022 |
| Income Deficit | 295 | $0 |
| Wage / Income Gap (%) | 1,281 | 57.61% |
| Wage / Income Gap ($) | 1,281 | 42.39¢ per $1 |
| Gini / Inequality Index | 1,281 | 0.43 |
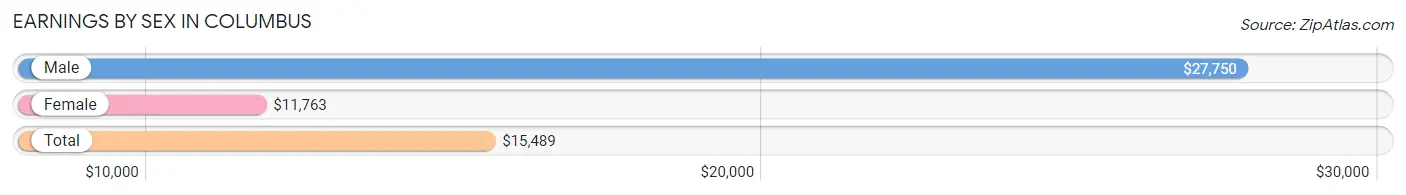
Earnings by Sex in Columbus
Average Earnings in Columbus are $15,489, $27,750 for men and $11,763 for women, a difference of 57.6%.
| Sex | Number | Average Earnings |
| Male | 266 (51.4%) | $27,750 |
| Female | 251 (48.5%) | $11,763 |
| Total | 517 (100.0%) | $15,489 |
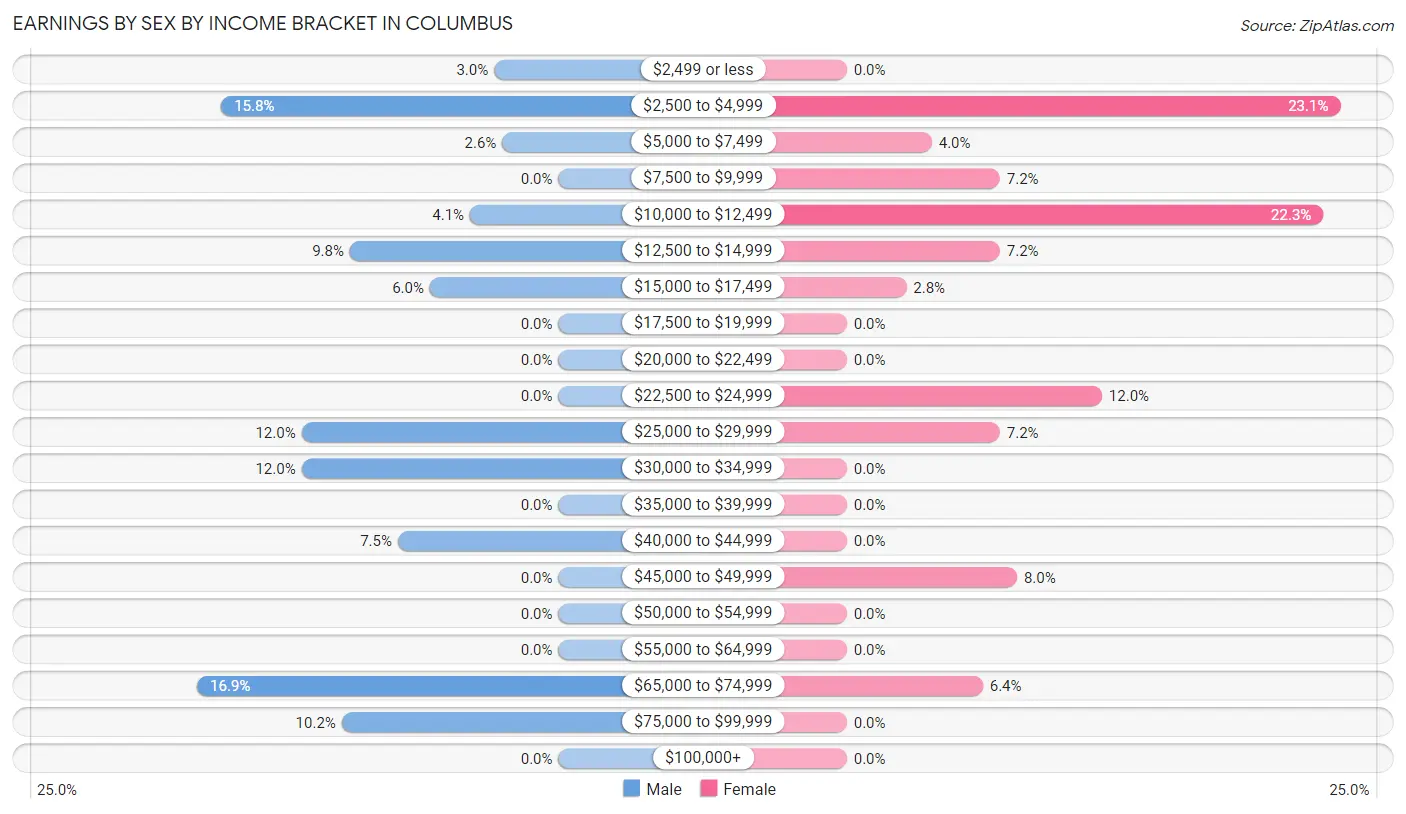
Earnings by Sex by Income Bracket in Columbus
The most common earnings brackets in Columbus are $65,000 to $74,999 for men (45 | 16.9%) and $2,500 to $4,999 for women (58 | 23.1%).
| Income | Male | Female |
| $2,499 or less | 8 (3.0%) | 0 (0.0%) |
| $2,500 to $4,999 | 42 (15.8%) | 58 (23.1%) |
| $5,000 to $7,499 | 7 (2.6%) | 10 (4.0%) |
| $7,500 to $9,999 | 0 (0.0%) | 18 (7.2%) |
| $10,000 to $12,499 | 11 (4.1%) | 56 (22.3%) |
| $12,500 to $14,999 | 26 (9.8%) | 18 (7.2%) |
| $15,000 to $17,499 | 16 (6.0%) | 7 (2.8%) |
| $17,500 to $19,999 | 0 (0.0%) | 0 (0.0%) |
| $20,000 to $22,499 | 0 (0.0%) | 0 (0.0%) |
| $22,500 to $24,999 | 0 (0.0%) | 30 (11.9%) |
| $25,000 to $29,999 | 32 (12.0%) | 18 (7.2%) |
| $30,000 to $34,999 | 32 (12.0%) | 0 (0.0%) |
| $35,000 to $39,999 | 0 (0.0%) | 0 (0.0%) |
| $40,000 to $44,999 | 20 (7.5%) | 0 (0.0%) |
| $45,000 to $49,999 | 0 (0.0%) | 20 (8.0%) |
| $50,000 to $54,999 | 0 (0.0%) | 0 (0.0%) |
| $55,000 to $64,999 | 0 (0.0%) | 0 (0.0%) |
| $65,000 to $74,999 | 45 (16.9%) | 16 (6.4%) |
| $75,000 to $99,999 | 27 (10.2%) | 0 (0.0%) |
| $100,000+ | 0 (0.0%) | 0 (0.0%) |
| Total | 266 (100.0%) | 251 (100.0%) |
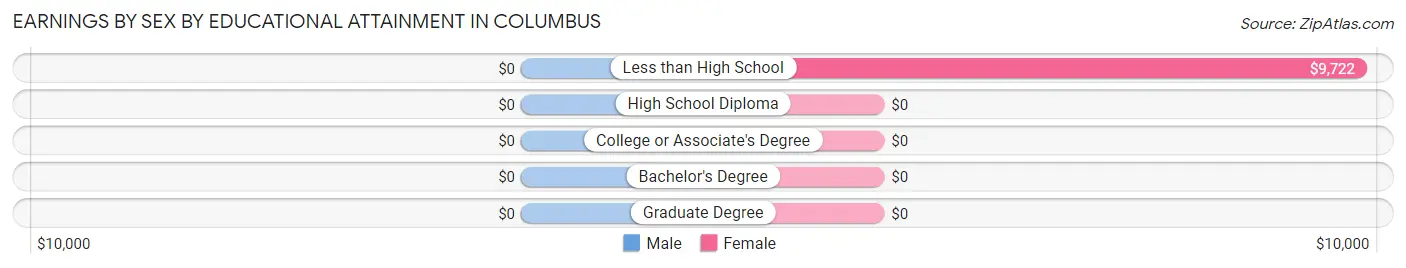
Earnings by Sex by Educational Attainment in Columbus
| Educational Attainment | Male Income | Female Income |
| Less than High School | - | - |
| High School Diploma | - | - |
| College or Associate's Degree | - | - |
| Bachelor's Degree | - | - |
| Graduate Degree | - | - |
| Total | $27,750 | $12,400 |
Family Income in Columbus
Family Income Brackets in Columbus
According to the Columbus family income data, there are 128 families falling into the $25,000 to $34,999 income range, which is the most common income bracket and makes up 43.4% of all families.
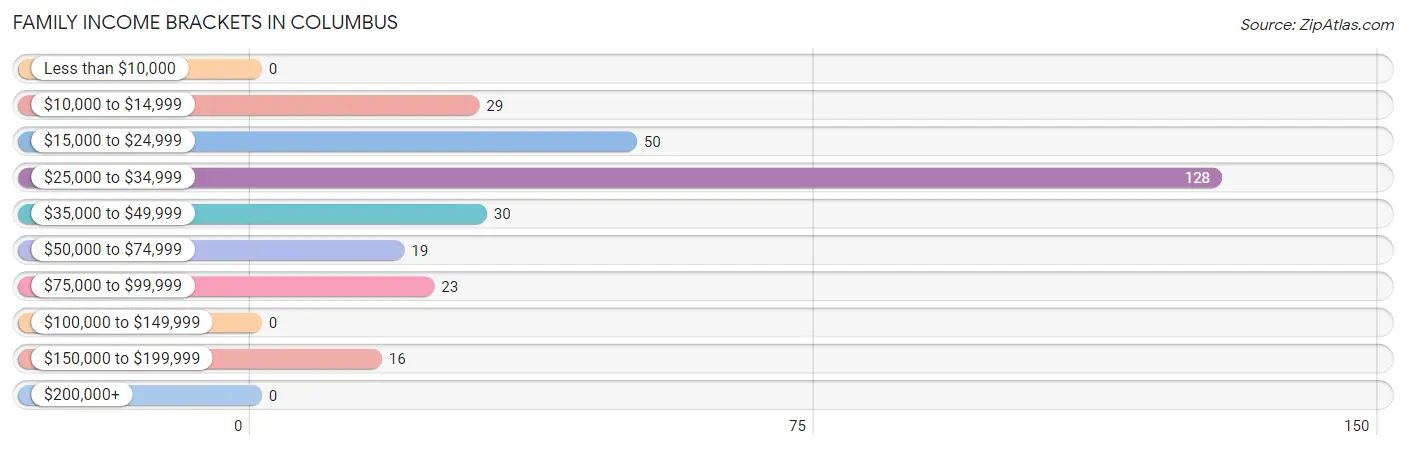
| Income Bracket | # Families | % Families |
| Less than $10,000 | 0 | 0.0% |
| $10,000 to $14,999 | 29 | 9.8% |
| $15,000 to $24,999 | 50 | 16.9% |
| $25,000 to $34,999 | 128 | 43.4% |
| $35,000 to $49,999 | 30 | 10.2% |
| $50,000 to $74,999 | 19 | 6.4% |
| $75,000 to $99,999 | 23 | 7.8% |
| $100,000 to $149,999 | 0 | 0.0% |
| $150,000 to $199,999 | 16 | 5.4% |
| $200,000+ | 0 | 0.0% |
Family Income by Famaliy Size in Columbus
4-person families (53 | 18.0%) account for the highest median family income in Columbus with $33,646 per family, while 3-person families (140 | 47.5%) have the highest median income of $8,848 per family member.
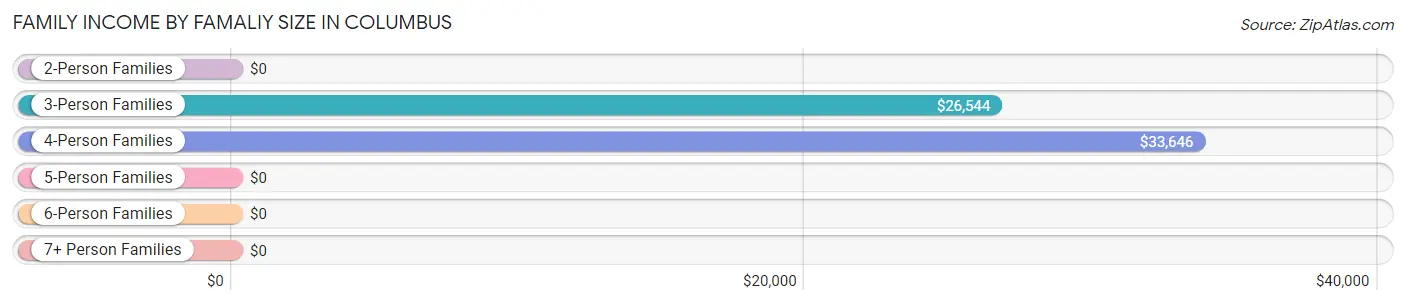
| Income Bracket | # Families | Median Income |
| 2-Person Families | 73 (24.7%) | $0 |
| 3-Person Families | 140 (47.5%) | $26,544 |
| 4-Person Families | 53 (18.0%) | $33,646 |
| 5-Person Families | 17 (5.8%) | $0 |
| 6-Person Families | 12 (4.1%) | $0 |
| 7+ Person Families | 0 (0.0%) | $0 |
| Total | 295 (100.0%) | $30,031 |
Family Income by Number of Earners in Columbus
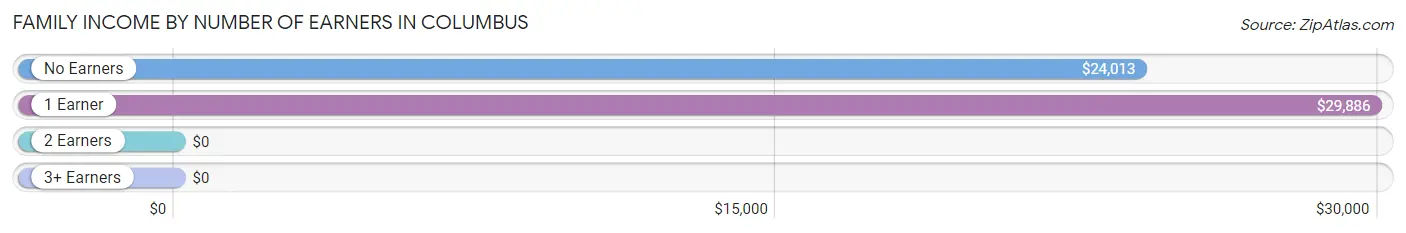
| Number of Earners | # Families | Median Income |
| No Earners | 31 (10.5%) | $24,013 |
| 1 Earner | 142 (48.1%) | $29,886 |
| 2 Earners | 115 (39.0%) | $0 |
| 3+ Earners | 7 (2.4%) | $0 |
| Total | 295 (100.0%) | $30,031 |
Household Income in Columbus
Household Income Brackets in Columbus
With 128 households falling in the category, the $25,000 to $34,999 income range is the most frequent in Columbus, accounting for 28.8% of all households.
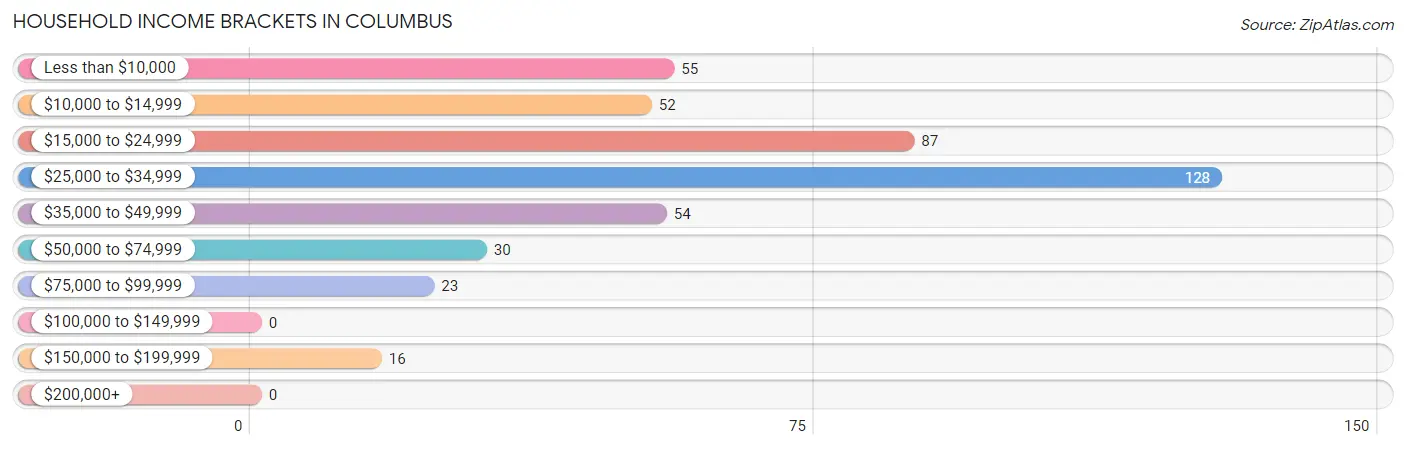
| Income Bracket | # Households | % Households |
| Less than $10,000 | 55 | 12.4% |
| $10,000 to $14,999 | 52 | 11.7% |
| $15,000 to $24,999 | 87 | 19.6% |
| $25,000 to $34,999 | 128 | 28.8% |
| $35,000 to $49,999 | 54 | 12.1% |
| $50,000 to $74,999 | 30 | 6.7% |
| $75,000 to $99,999 | 23 | 5.2% |
| $100,000 to $149,999 | 0 | 0.0% |
| $150,000 to $199,999 | 16 | 3.6% |
| $200,000+ | 0 | 0.0% |
Household Income by Householder Age in Columbus
The median household income in Columbus is $26,549, with the highest median household income of $30,060 found in the 45 to 64 years age bracket for the primary householder. A total of 147 households (33.0%) fall into this category.
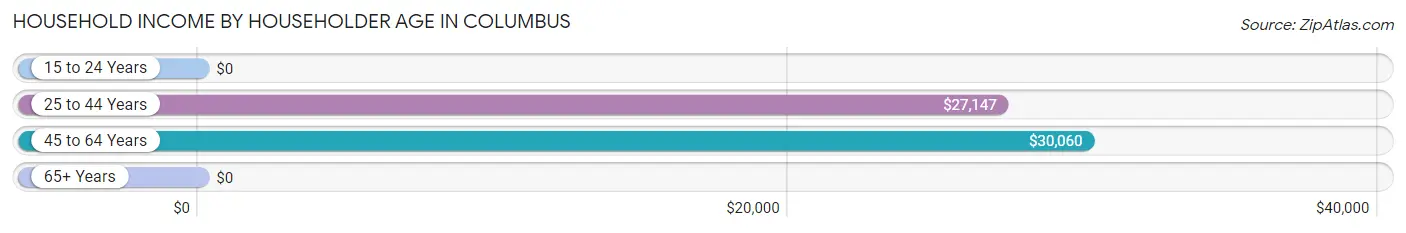
| Income Bracket | # Households | Median Income |
| 15 to 24 Years | 0 (0.0%) | $0 |
| 25 to 44 Years | 173 (38.9%) | $27,147 |
| 45 to 64 Years | 147 (33.0%) | $30,060 |
| 65+ Years | 125 (28.1%) | $0 |
| Total | 445 (100.0%) | $26,549 |
Poverty in Columbus
Income Below Poverty by Sex and Age in Columbus
With 26.6% poverty level for males and 28.8% for females among the residents of Columbus, 15 year old males and 75 year old and over females are the most vulnerable to poverty, with 32 males (100.0%) and 19 females (100.0%) in their respective age groups living below the poverty level.
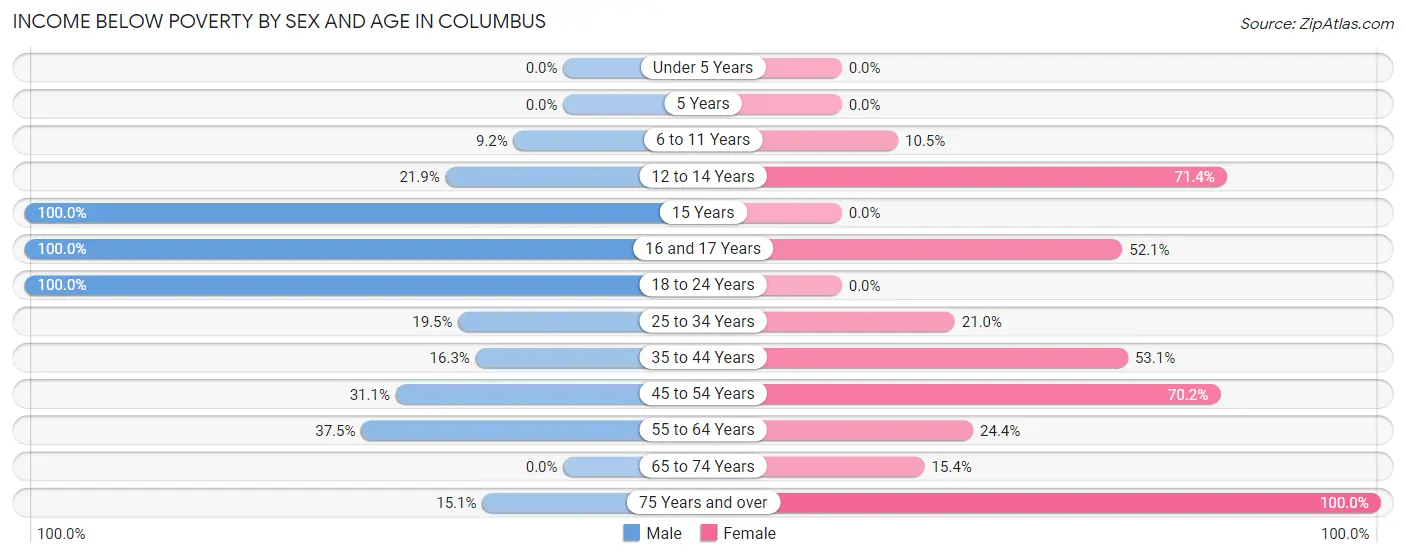
| Age Bracket | Male | Female |
| Under 5 Years | 0 (0.0%) | 0 (0.0%) |
| 5 Years | 0 (0.0%) | 0 (0.0%) |
| 6 to 11 Years | 6 (9.2%) | 7 (10.4%) |
| 12 to 14 Years | 14 (21.9%) | 25 (71.4%) |
| 15 Years | 32 (100.0%) | 0 (0.0%) |
| 16 and 17 Years | 15 (100.0%) | 25 (52.1%) |
| 18 to 24 Years | 11 (100.0%) | 0 (0.0%) |
| 25 to 34 Years | 23 (19.5%) | 17 (21.0%) |
| 35 to 44 Years | 7 (16.3%) | 34 (53.1%) |
| 45 to 54 Years | 28 (31.1%) | 33 (70.2%) |
| 55 to 64 Years | 12 (37.5%) | 29 (24.4%) |
| 65 to 74 Years | 0 (0.0%) | 4 (15.4%) |
| 75 Years and over | 14 (15.0%) | 19 (100.0%) |
| Total | 162 (26.6%) | 193 (28.8%) |
Income Above Poverty by Sex and Age in Columbus
According to the poverty statistics in Columbus, males aged under 5 years and females aged 5 years are the age groups that are most secure financially, with 100.0% of males and 100.0% of females in these age groups living above the poverty line.
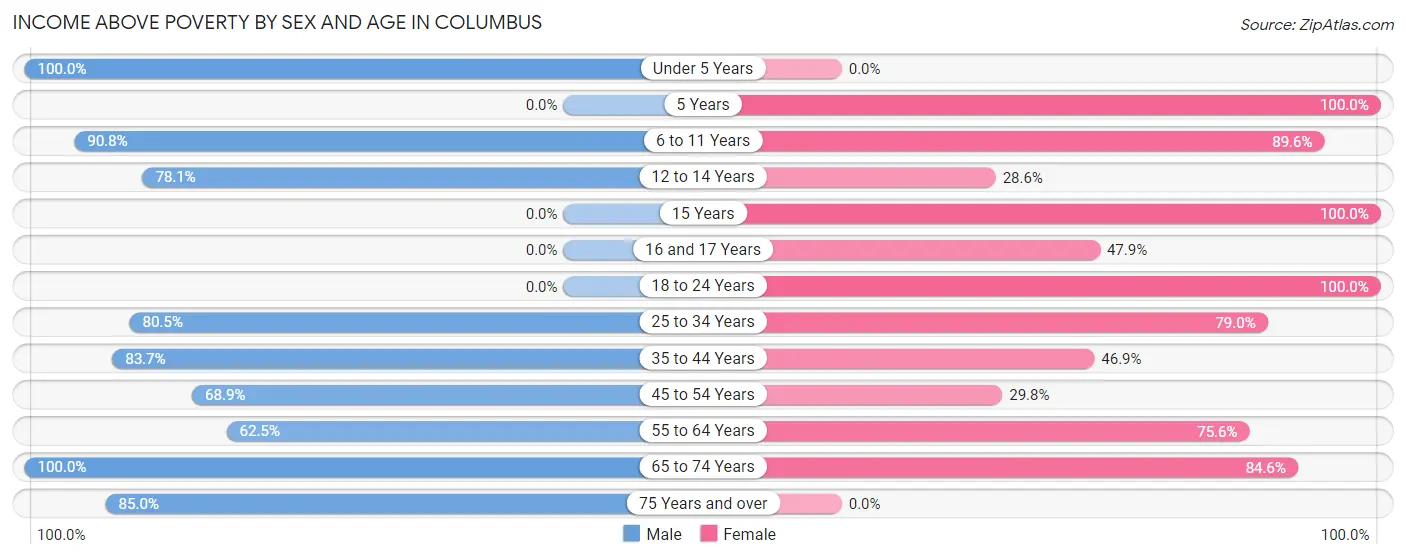
| Age Bracket | Male | Female |
| Under 5 Years | 8 (100.0%) | 0 (0.0%) |
| 5 Years | 0 (0.0%) | 34 (100.0%) |
| 6 to 11 Years | 59 (90.8%) | 60 (89.5%) |
| 12 to 14 Years | 50 (78.1%) | 10 (28.6%) |
| 15 Years | 0 (0.0%) | 56 (100.0%) |
| 16 and 17 Years | 0 (0.0%) | 23 (47.9%) |
| 18 to 24 Years | 0 (0.0%) | 75 (100.0%) |
| 25 to 34 Years | 95 (80.5%) | 64 (79.0%) |
| 35 to 44 Years | 36 (83.7%) | 30 (46.9%) |
| 45 to 54 Years | 62 (68.9%) | 14 (29.8%) |
| 55 to 64 Years | 20 (62.5%) | 90 (75.6%) |
| 65 to 74 Years | 39 (100.0%) | 22 (84.6%) |
| 75 Years and over | 79 (85.0%) | 0 (0.0%) |
| Total | 448 (73.4%) | 478 (71.2%) |
Income Below Poverty Among Married-Couple Families in Columbus
The poverty statistics for married-couple families in Columbus show that 21.0% or 36 of the total 171 families live below the poverty line. Families with 3 or 4 children have the highest poverty rate of 54.5%, comprising of 12 families. On the other hand, families with no children have the lowest poverty rate of 0.0%, which includes 0 families.
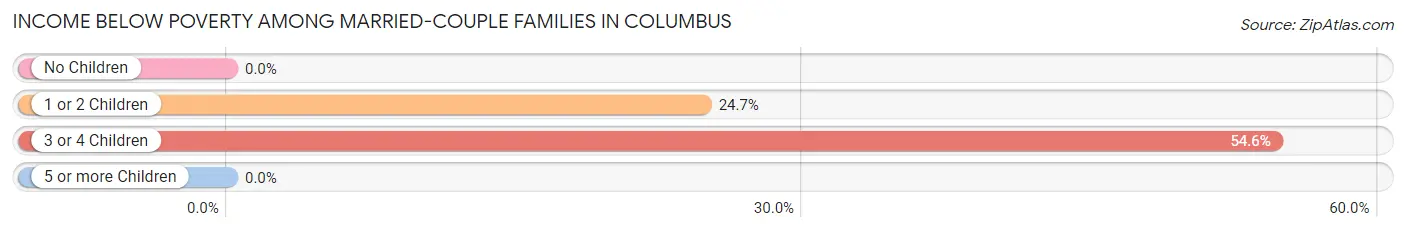
| Children | Above Poverty | Below Poverty |
| No Children | 52 (100.0%) | 0 (0.0%) |
| 1 or 2 Children | 73 (75.3%) | 24 (24.7%) |
| 3 or 4 Children | 10 (45.5%) | 12 (54.5%) |
| 5 or more Children | 0 (0.0%) | 0 (0.0%) |
| Total | 135 (78.9%) | 36 (21.0%) |
Income Below Poverty Among Single-Parent Households in Columbus
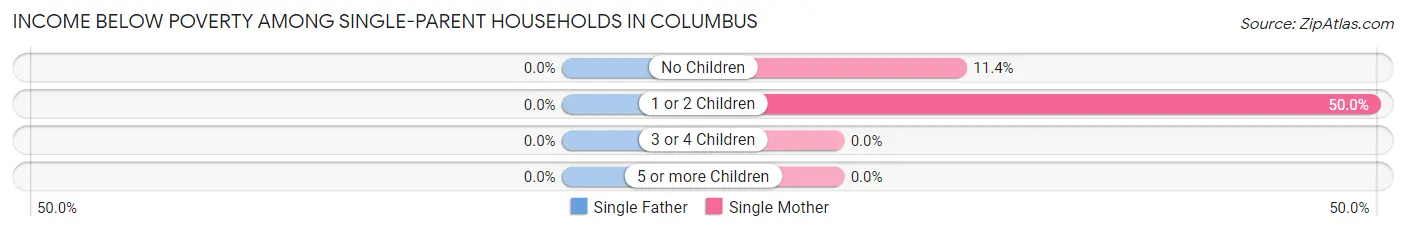
| Children | Single Father | Single Mother |
| No Children | 0 (0.0%) | 4 (11.4%) |
| 1 or 2 Children | 0 (0.0%) | 25 (50.0%) |
| 3 or 4 Children | 0 (0.0%) | 0 (0.0%) |
| 5 or more Children | 0 (0.0%) | 0 (0.0%) |
| Total | 0 (0.0%) | 29 (27.6%) |
Income Below Poverty Among Married-Couple vs Single-Parent Households in Columbus
The poverty data for Columbus shows that 36 of the married-couple family households (21.0%) and 29 of the single-parent households (23.4%) are living below the poverty level. Within the married-couple family households, those with 3 or 4 children have the highest poverty rate, with 12 households (54.5%) falling below the poverty line. Among the single-parent households, those with 1 or 2 children have the highest poverty rate, with 25 household (36.2%) living below poverty.
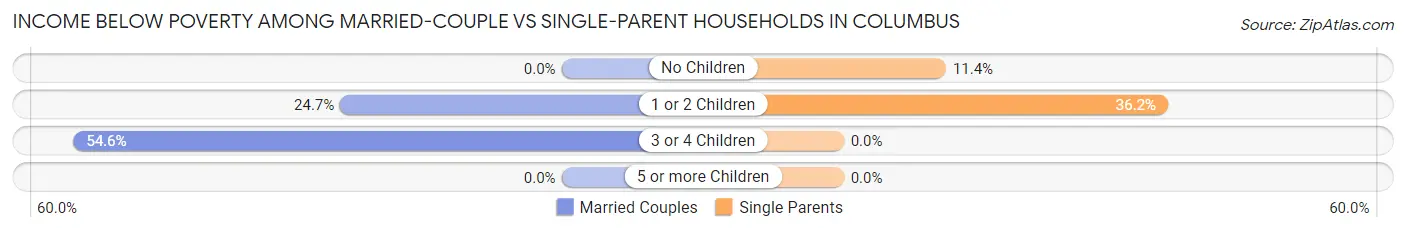
| Children | Married-Couple Families | Single-Parent Households |
| No Children | 0 (0.0%) | 4 (11.4%) |
| 1 or 2 Children | 24 (24.7%) | 25 (36.2%) |
| 3 or 4 Children | 12 (54.5%) | 0 (0.0%) |
| 5 or more Children | 0 (0.0%) | 0 (0.0%) |
| Total | 36 (21.0%) | 29 (23.4%) |
Race in Columbus
The most populous races in Columbus are Hispanic or Latino (1,157 | 90.3%), White / Caucasian (888 | 69.3%), and Two or more Races (393 | 30.7%).
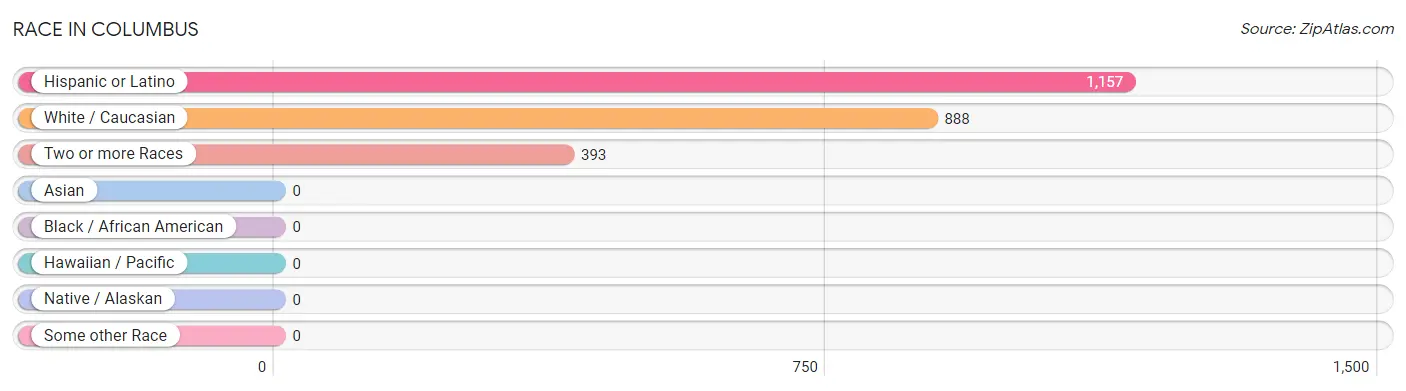
| Race | # Population | % Population |
| Asian | 0 | 0.0% |
| Black / African American | 0 | 0.0% |
| Hawaiian / Pacific | 0 | 0.0% |
| Hispanic or Latino | 1,157 | 90.3% |
| Native / Alaskan | 0 | 0.0% |
| White / Caucasian | 888 | 69.3% |
| Two or more Races | 393 | 30.7% |
| Some other Race | 0 | 0.0% |
| Total | 1,281 | 100.0% |
Ancestry in Columbus
The most populous ancestries reported in Columbus are Mexican (1,157 | 90.3%), Lithuanian (24 | 1.9%), Romanian (18 | 1.4%), English (14 | 1.1%), and Irish (14 | 1.1%), together accounting for 95.8% of all Columbus residents.
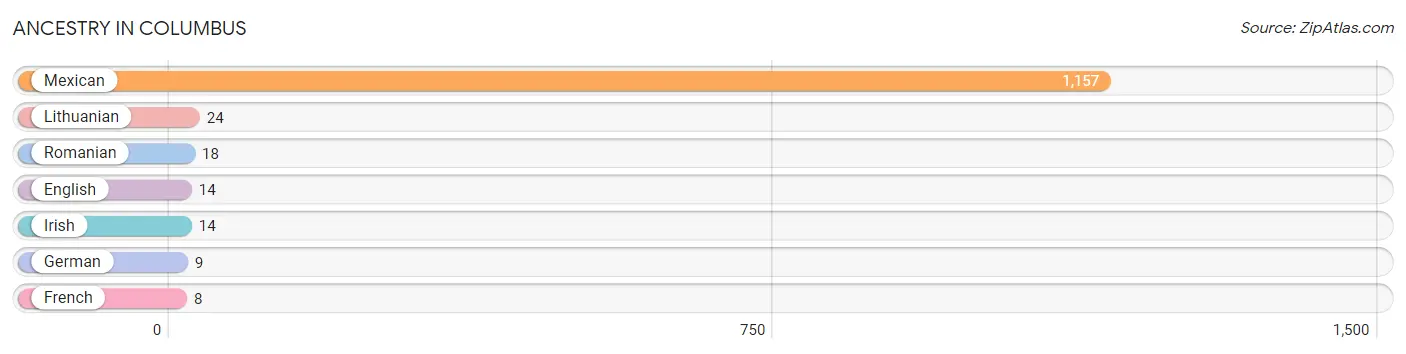
| Ancestry | # Population | % Population |
| English | 14 | 1.1% |
| French | 8 | 0.6% |
| German | 9 | 0.7% |
| Irish | 14 | 1.1% |
| Lithuanian | 24 | 1.9% |
| Mexican | 1,157 | 90.3% |
| Romanian | 18 | 1.4% | View All 7 Rows |
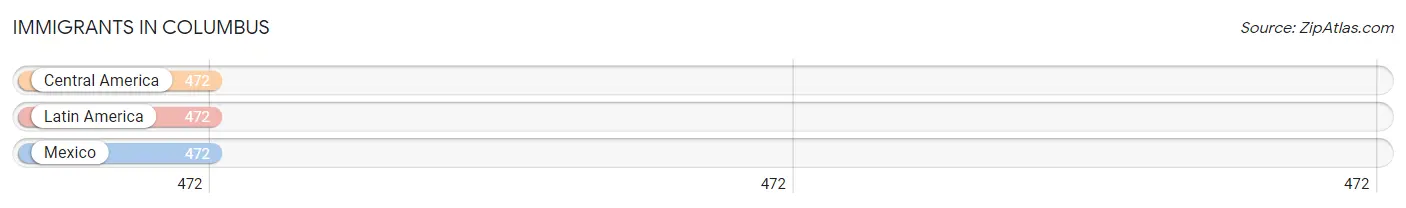
Immigrants in Columbus
The most numerous immigrant groups reported in Columbus came from Central America (472 | 36.8%), Latin America (472 | 36.8%), and Mexico (472 | 36.8%), together accounting for 110.5% of all Columbus residents.
| Immigration Origin | # Population | % Population |
| Central America | 472 | 36.8% |
| Latin America | 472 | 36.8% |
| Mexico | 472 | 36.8% | View All 3 Rows |
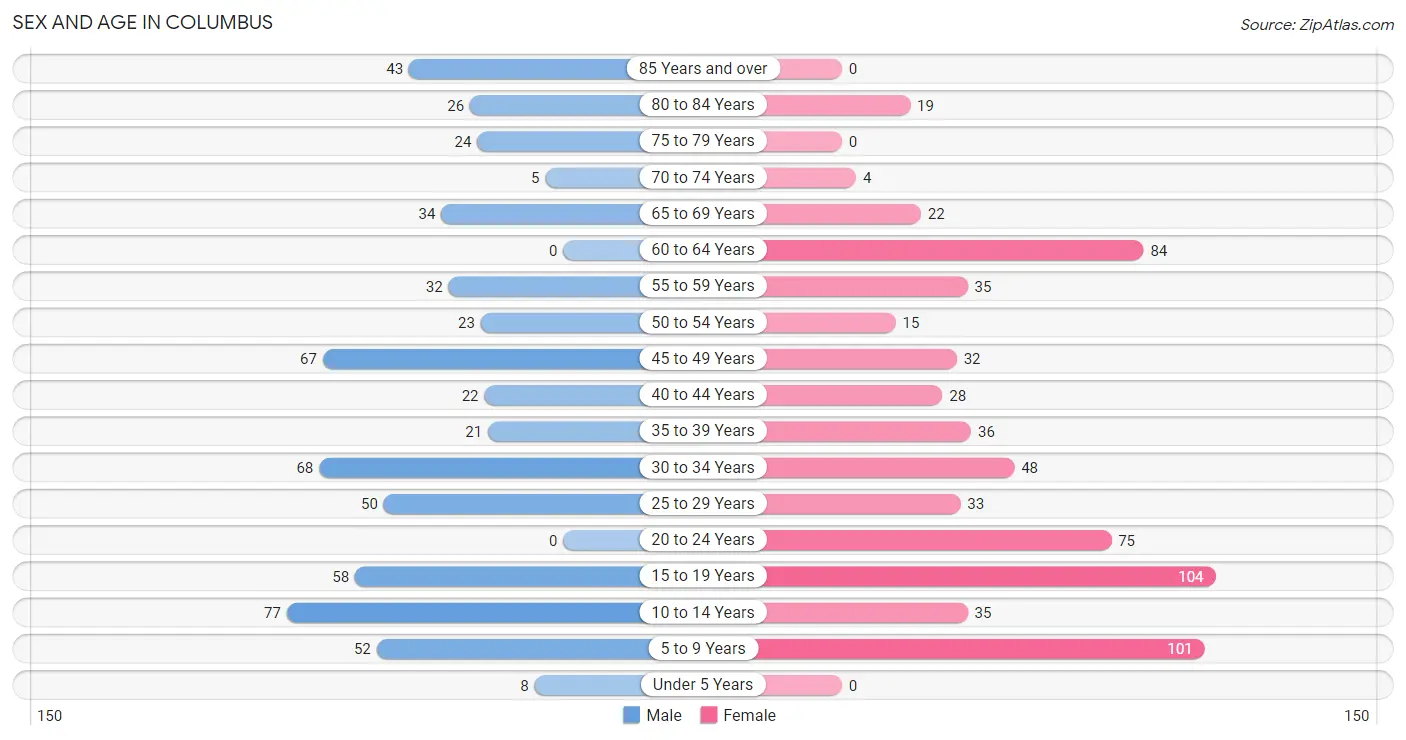
Sex and Age in Columbus
Sex and Age in Columbus
The most populous age groups in Columbus are 10 to 14 Years (77 | 12.6%) for men and 15 to 19 Years (104 | 15.5%) for women.
| Age Bracket | Male | Female |
| Under 5 Years | 8 (1.3%) | 0 (0.0%) |
| 5 to 9 Years | 52 (8.5%) | 101 (15.0%) |
| 10 to 14 Years | 77 (12.6%) | 35 (5.2%) |
| 15 to 19 Years | 58 (9.5%) | 104 (15.5%) |
| 20 to 24 Years | 0 (0.0%) | 75 (11.2%) |
| 25 to 29 Years | 50 (8.2%) | 33 (4.9%) |
| 30 to 34 Years | 68 (11.2%) | 48 (7.1%) |
| 35 to 39 Years | 21 (3.4%) | 36 (5.4%) |
| 40 to 44 Years | 22 (3.6%) | 28 (4.2%) |
| 45 to 49 Years | 67 (11.0%) | 32 (4.8%) |
| 50 to 54 Years | 23 (3.8%) | 15 (2.2%) |
| 55 to 59 Years | 32 (5.2%) | 35 (5.2%) |
| 60 to 64 Years | 0 (0.0%) | 84 (12.5%) |
| 65 to 69 Years | 34 (5.6%) | 22 (3.3%) |
| 70 to 74 Years | 5 (0.8%) | 4 (0.6%) |
| 75 to 79 Years | 24 (3.9%) | 0 (0.0%) |
| 80 to 84 Years | 26 (4.3%) | 19 (2.8%) |
| 85 Years and over | 43 (7.0%) | 0 (0.0%) |
| Total | 610 (100.0%) | 671 (100.0%) |
Families and Households in Columbus
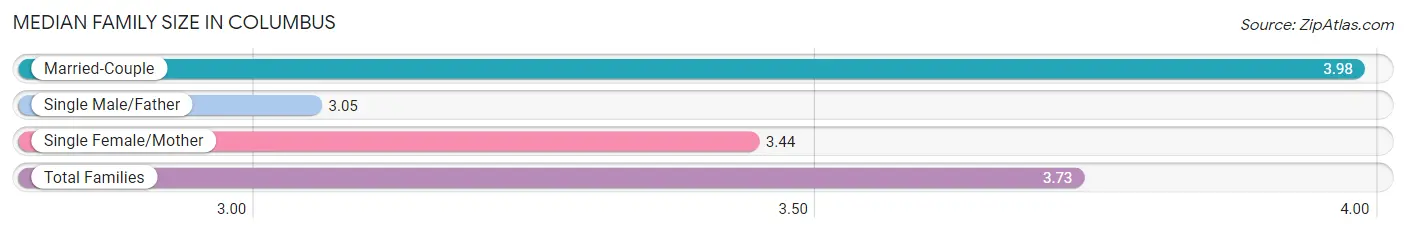
Median Family Size in Columbus
The median family size in Columbus is 3.73 persons per family, with married-couple families (171 | 58.0%) accounting for the largest median family size of 3.98 persons per family. On the other hand, single male/father families (19 | 6.4%) represent the smallest median family size with 3.05 persons per family.
| Family Type | # Families | Family Size |
| Married-Couple | 171 (58.0%) | 3.98 |
| Single Male/Father | 19 (6.4%) | 3.05 |
| Single Female/Mother | 105 (35.6%) | 3.44 |
| Total Families | 295 (100.0%) | 3.73 |
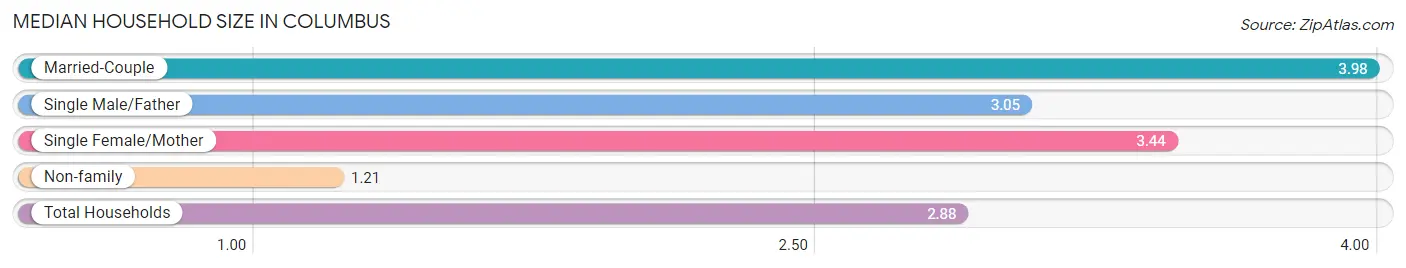
Median Household Size in Columbus
The median household size in Columbus is 2.88 persons per household, with married-couple households (171 | 38.4%) accounting for the largest median household size of 3.98 persons per household. non-family households (150 | 33.7%) represent the smallest median household size with 1.21 persons per household.
| Household Type | # Households | Household Size |
| Married-Couple | 171 (38.4%) | 3.98 |
| Single Male/Father | 19 (4.3%) | 3.05 |
| Single Female/Mother | 105 (23.6%) | 3.44 |
| Non-family | 150 (33.7%) | 1.21 |
| Total Households | 445 (100.0%) | 2.88 |
Household Size by Marriage Status in Columbus
Out of a total of 445 households in Columbus, 295 (66.3%) are family households, while 150 (33.7%) are nonfamily households. The most numerous type of family households are 3-person households, comprising 140, and the most common type of nonfamily households are 1-person households, comprising 115.
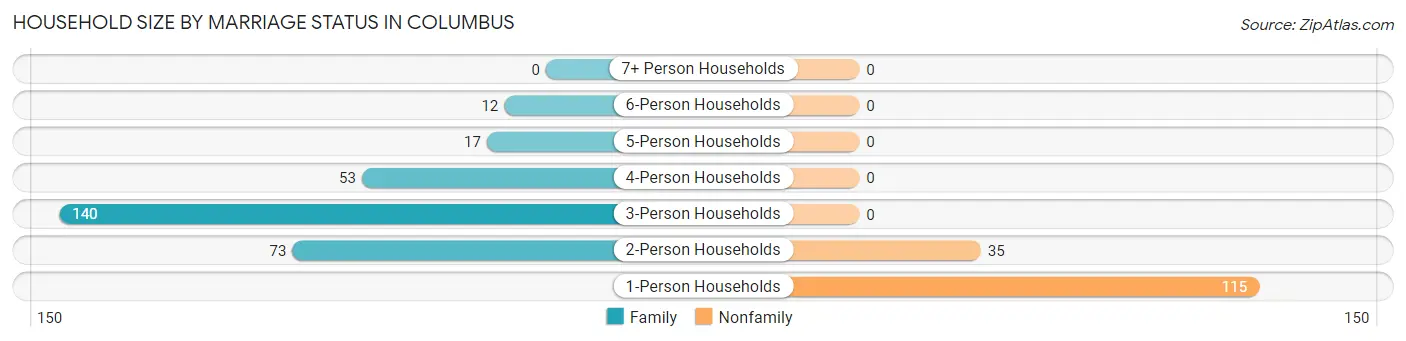
| Household Size | Family Households | Nonfamily Households |
| 1-Person Households | - | 115 (25.8%) |
| 2-Person Households | 73 (16.4%) | 35 (7.9%) |
| 3-Person Households | 140 (31.5%) | 0 (0.0%) |
| 4-Person Households | 53 (11.9%) | 0 (0.0%) |
| 5-Person Households | 17 (3.8%) | 0 (0.0%) |
| 6-Person Households | 12 (2.7%) | 0 (0.0%) |
| 7+ Person Households | 0 (0.0%) | 0 (0.0%) |
| Total | 295 (66.3%) | 150 (33.7%) |
Female Fertility in Columbus
Fertility by Age in Columbus
| Age Bracket | Women with Births | Births / 1,000 Women |
| 15 to 19 years | 0 (0.0%) | 0.0 |
| 20 to 34 years | 0 (0.0%) | 0.0 |
| 35 to 50 years | 0 (0.0%) | 0.0 |
| Total | 0 (0.0%) | 0.0 |
Fertility by Age by Marriage Status in Columbus
| Age Bracket | Married | Unmarried |
| 15 to 19 years | 0 (0.0%) | 0 (0.0%) |
| 20 to 34 years | 0 (0.0%) | 0 (0.0%) |
| 35 to 50 years | 0 (0.0%) | 0 (0.0%) |
| Total | 0 (0.0%) | 0 (0.0%) |
Fertility by Education in Columbus
| Educational Attainment | Women with Births | Births / 1,000 Women |
| Less than High School | 0 (0.0%) | 0.0 |
| High School Diploma | 0 (0.0%) | 0.0 |
| College or Associate's Degree | 0 (0.0%) | 0.0 |
| Bachelor's Degree | 0 (0.0%) | 0.0 |
| Graduate Degree | 0 (0.0%) | 0.0 |
| Total | 0 (0.0%) | 0.0 |
Fertility by Education by Marriage Status in Columbus
| Educational Attainment | Married | Unmarried |
| Less than High School | 0 (0.0%) | 0 (0.0%) |
| High School Diploma | 0 (0.0%) | 0 (0.0%) |
| College or Associate's Degree | 0 (0.0%) | 0 (0.0%) |
| Bachelor's Degree | 0 (0.0%) | 0 (0.0%) |
| Graduate Degree | 0 (0.0%) | 0 (0.0%) |
| Total | 0 (0.0%) | 0 (0.0%) |
Employment Characteristics in Columbus
Employment by Class of Employer in Columbus
Among the 409 employed individuals in Columbus, private company employees (303 | 74.1%), self-employed (not incorporated) (45 | 11.0%), and state government employees (43 | 10.5%) make up the most common classes of employment.
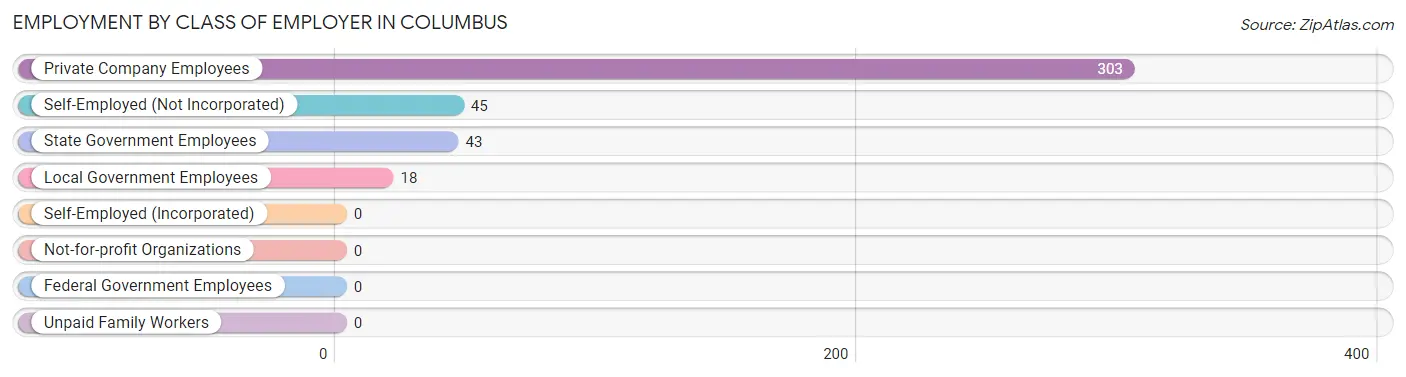
| Employer Class | # Employees | % Employees |
| Private Company Employees | 303 | 74.1% |
| Self-Employed (Incorporated) | 0 | 0.0% |
| Self-Employed (Not Incorporated) | 45 | 11.0% |
| Not-for-profit Organizations | 0 | 0.0% |
| Local Government Employees | 18 | 4.4% |
| State Government Employees | 43 | 10.5% |
| Federal Government Employees | 0 | 0.0% |
| Unpaid Family Workers | 0 | 0.0% |
| Total | 409 | 100.0% |
Employment Status by Age in Columbus
According to the labor force statistics for Columbus, out of the total population over 16 years of age (920), 51.5% or 474 individuals are in the labor force, with 13.7% or 65 of them unemployed. The age group with the highest labor force participation rate is 30 to 34 years, with 100.0% or 116 individuals in the labor force. Within the labor force, the 55 to 59 years age range has the highest percentage of unemployed individuals, with 53.5% or 23 of them being unemployed.
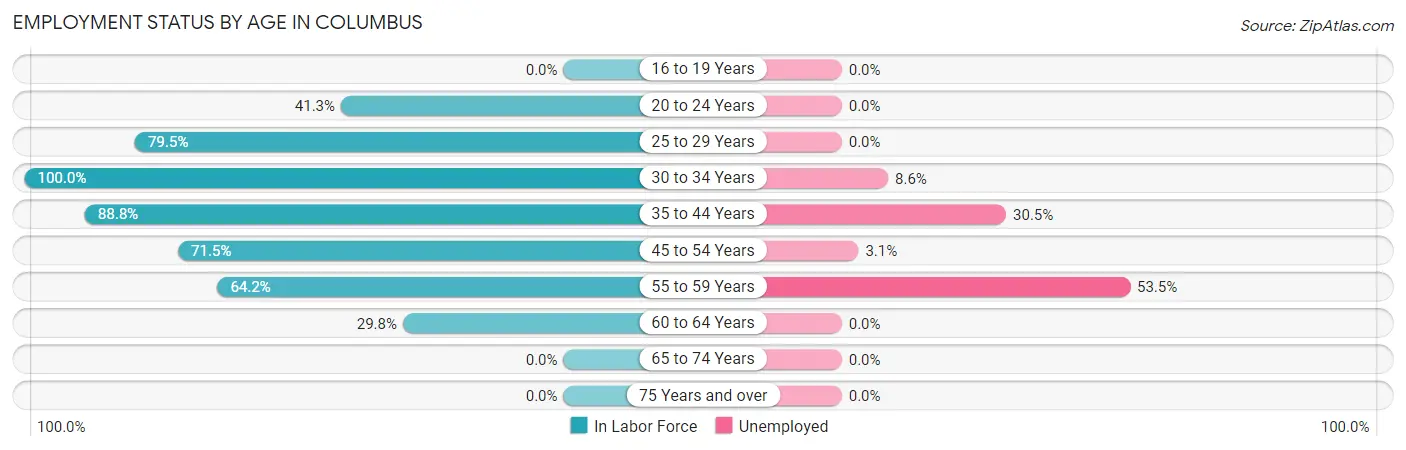
| Age Bracket | In Labor Force | Unemployed |
| 16 to 19 Years | 0 (0.0%) | 0 (0.0%) |
| 20 to 24 Years | 31 (41.3%) | 0 (0.0%) |
| 25 to 29 Years | 66 (79.5%) | 0 (0.0%) |
| 30 to 34 Years | 116 (100.0%) | 10 (8.6%) |
| 35 to 44 Years | 95 (88.8%) | 29 (30.5%) |
| 45 to 54 Years | 98 (71.5%) | 3 (3.1%) |
| 55 to 59 Years | 43 (64.2%) | 23 (53.5%) |
| 60 to 64 Years | 25 (29.8%) | 0 (0.0%) |
| 65 to 74 Years | 0 (0.0%) | 0 (0.0%) |
| 75 Years and over | 0 (0.0%) | 0 (0.0%) |
| Total | 474 (51.5%) | 65 (13.7%) |
Employment Status by Educational Attainment in Columbus
According to labor force statistics for Columbus, 74.6% of individuals (443) out of the total population between 25 and 64 years of age (594) are in the labor force, with 14.7% or 65 of them being unemployed. The group with the highest labor force participation rate are those with the educational attainment of college / associate degree, with 100.0% or 113 individuals in the labor force. Within the labor force, individuals with less than high school education have the highest percentage of unemployment, with 32.0% or 65 of them being unemployed.
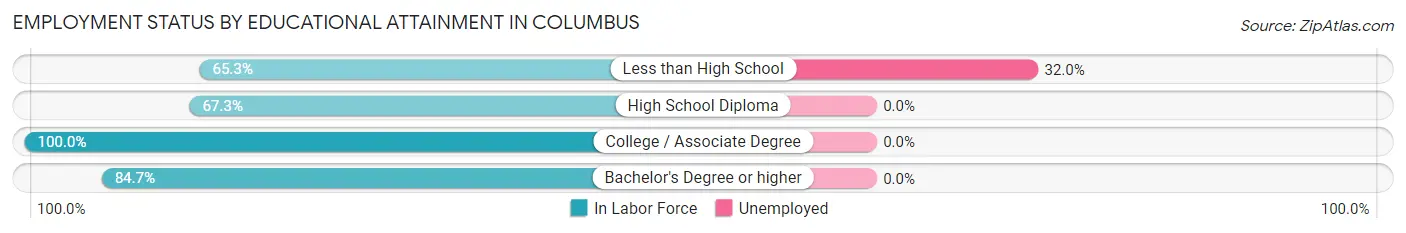
| Educational Attainment | In Labor Force | Unemployed |
| Less than High School | 203 (65.3%) | 100 (32.0%) |
| High School Diploma | 66 (67.3%) | 0 (0.0%) |
| College / Associate Degree | 113 (100.0%) | 0 (0.0%) |
| Bachelor's Degree or higher | 61 (84.7%) | 0 (0.0%) |
| Total | 443 (74.6%) | 87 (14.7%) |
Employment Occupations by Sex in Columbus
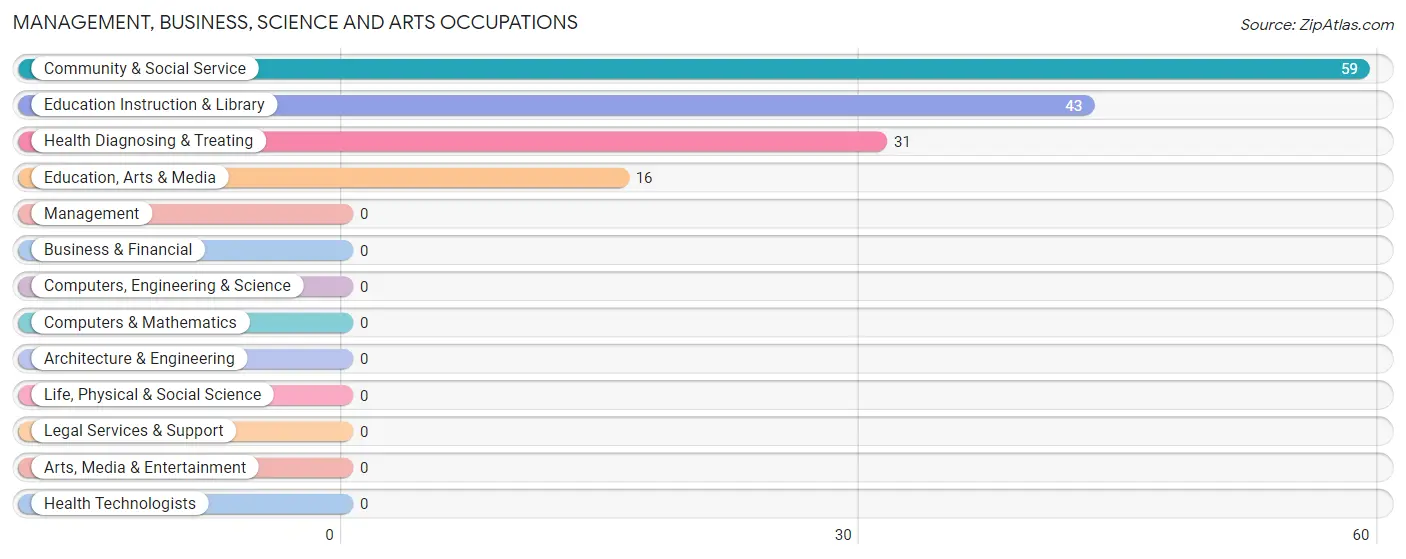
Management, Business, Science and Arts Occupations
The most common Management, Business, Science and Arts occupations in Columbus are Community & Social Service (59 | 14.4%), Education Instruction & Library (43 | 10.5%), Health Diagnosing & Treating (31 | 7.6%), and Education, Arts & Media (16 | 3.9%).
Management, Business, Science and Arts Occupations by Sex
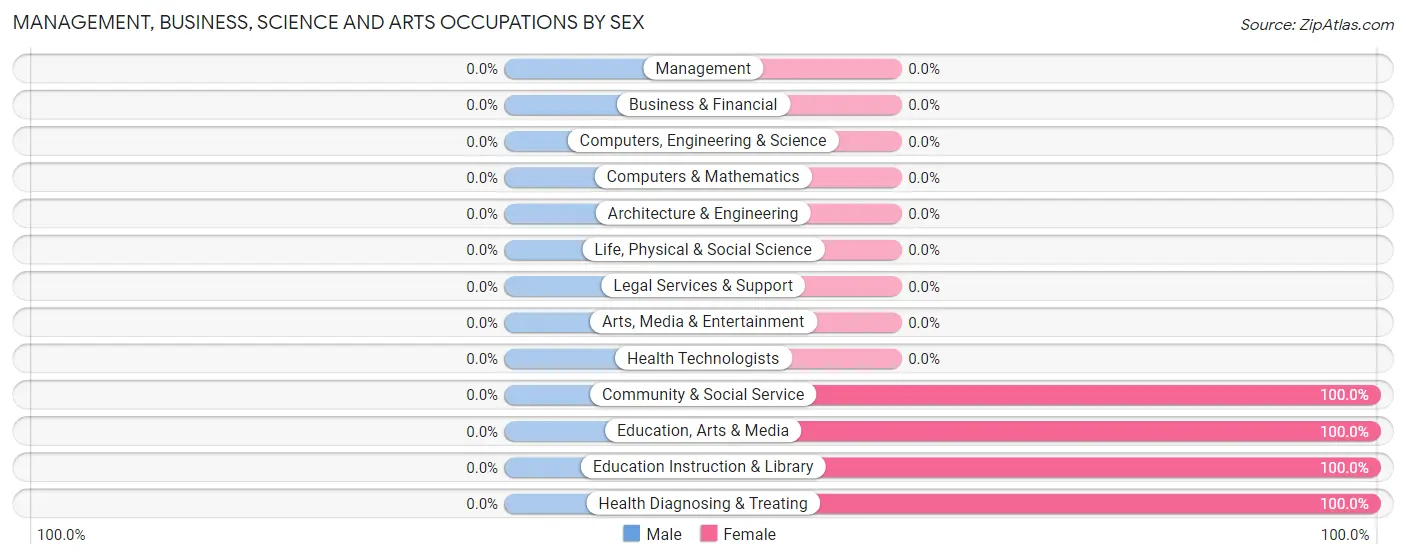
| Occupation | Male | Female |
| Management | 0 (0.0%) | 0 (0.0%) |
| Business & Financial | 0 (0.0%) | 0 (0.0%) |
| Computers, Engineering & Science | 0 (0.0%) | 0 (0.0%) |
| Computers & Mathematics | 0 (0.0%) | 0 (0.0%) |
| Architecture & Engineering | 0 (0.0%) | 0 (0.0%) |
| Life, Physical & Social Science | 0 (0.0%) | 0 (0.0%) |
| Community & Social Service | 0 (0.0%) | 59 (100.0%) |
| Education, Arts & Media | 0 (0.0%) | 16 (100.0%) |
| Legal Services & Support | 0 (0.0%) | 0 (0.0%) |
| Education Instruction & Library | 0 (0.0%) | 43 (100.0%) |
| Arts, Media & Entertainment | 0 (0.0%) | 0 (0.0%) |
| Health Diagnosing & Treating | 0 (0.0%) | 31 (100.0%) |
| Health Technologists | 0 (0.0%) | 0 (0.0%) |
| Total (Category) | 0 (0.0%) | 90 (100.0%) |
| Total (Overall) | 208 (50.9%) | 201 (49.1%) |
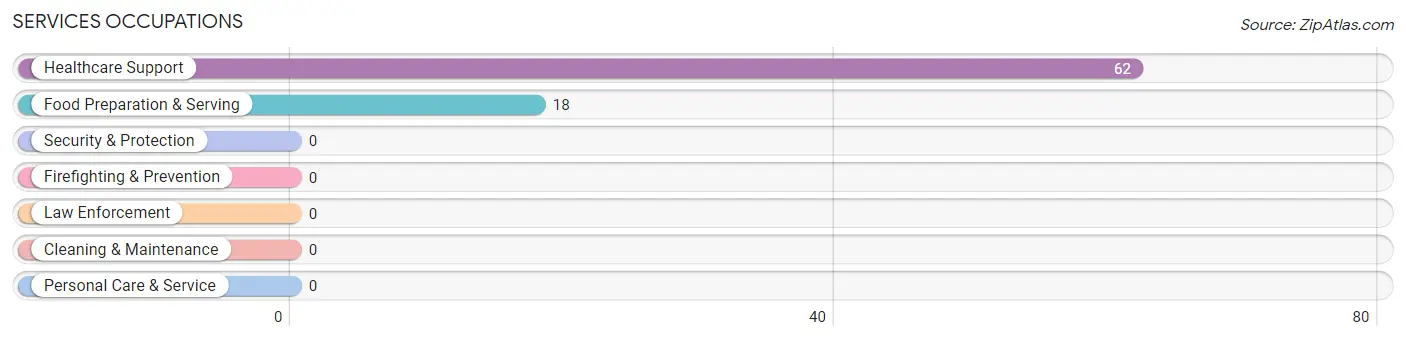
Services Occupations
The most common Services occupations in Columbus are Healthcare Support (62 | 15.2%), and Food Preparation & Serving (18 | 4.4%).
Services Occupations by Sex
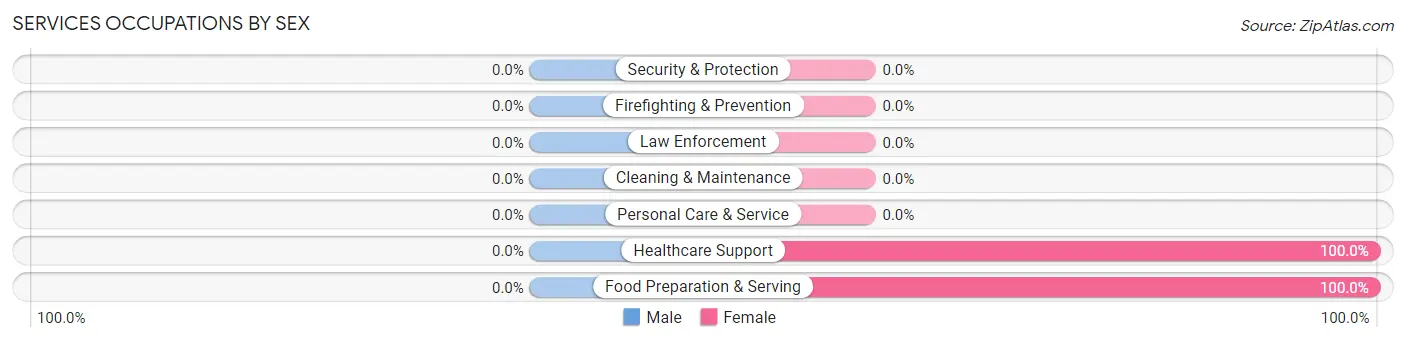
| Occupation | Male | Female |
| Healthcare Support | 0 (0.0%) | 62 (100.0%) |
| Security & Protection | 0 (0.0%) | 0 (0.0%) |
| Firefighting & Prevention | 0 (0.0%) | 0 (0.0%) |
| Law Enforcement | 0 (0.0%) | 0 (0.0%) |
| Food Preparation & Serving | 0 (0.0%) | 18 (100.0%) |
| Cleaning & Maintenance | 0 (0.0%) | 0 (0.0%) |
| Personal Care & Service | 0 (0.0%) | 0 (0.0%) |
| Total (Category) | 0 (0.0%) | 80 (100.0%) |
| Total (Overall) | 208 (50.9%) | 201 (49.1%) |
Sales and Office Occupations

Sales and Office Occupations by Sex

| Occupation | Male | Female |
| Sales & Related | 0 (0.0%) | 0 (0.0%) |
| Office & Administration | 0 (0.0%) | 0 (0.0%) |
| Total (Category) | 0 (0.0%) | 0 (0.0%) |
| Total (Overall) | 208 (50.9%) | 201 (49.1%) |
Natural Resources, Construction and Maintenance Occupations
The most common Natural Resources, Construction and Maintenance occupations in Columbus are Construction & Extraction (54 | 13.2%), and Farming, Fishing & Forestry (48 | 11.7%).
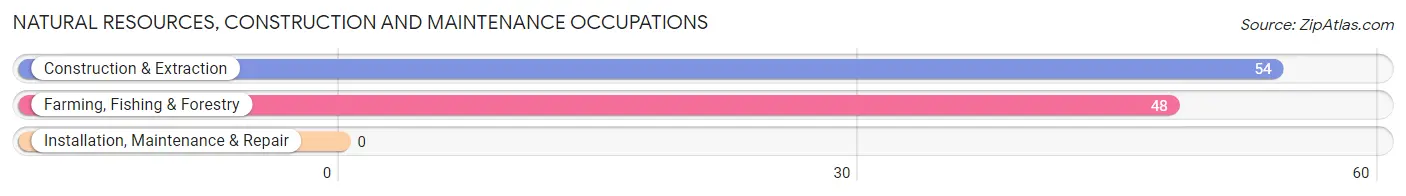
Natural Resources, Construction and Maintenance Occupations by Sex
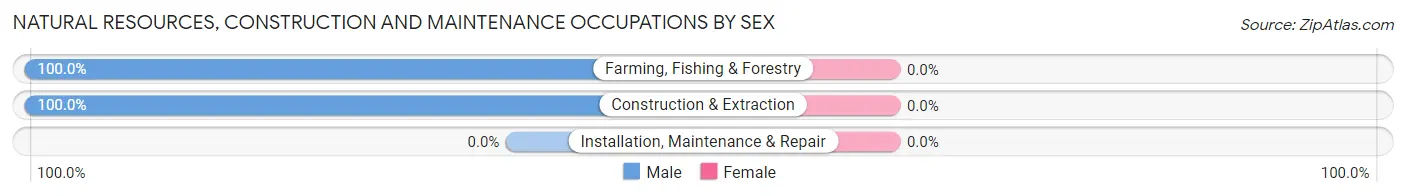
| Occupation | Male | Female |
| Farming, Fishing & Forestry | 48 (100.0%) | 0 (0.0%) |
| Construction & Extraction | 54 (100.0%) | 0 (0.0%) |
| Installation, Maintenance & Repair | 0 (0.0%) | 0 (0.0%) |
| Total (Category) | 102 (100.0%) | 0 (0.0%) |
| Total (Overall) | 208 (50.9%) | 201 (49.1%) |
Production, Transportation and Moving Occupations
The most common Production, Transportation and Moving occupations in Columbus are Transportation (55 | 13.5%), Material Moving (49 | 12.0%), and Production (33 | 8.1%).
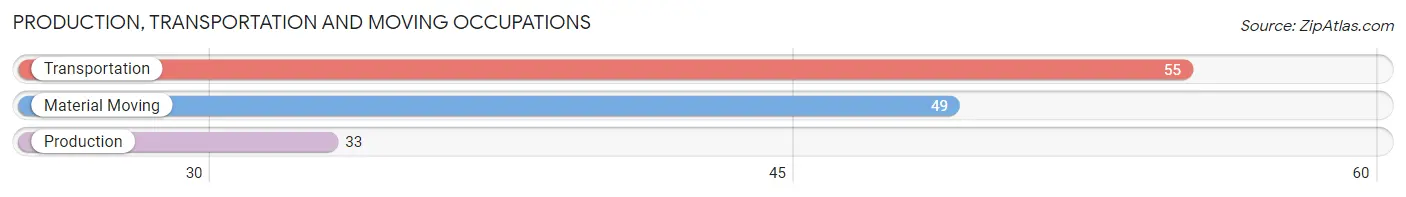
Production, Transportation and Moving Occupations by Sex
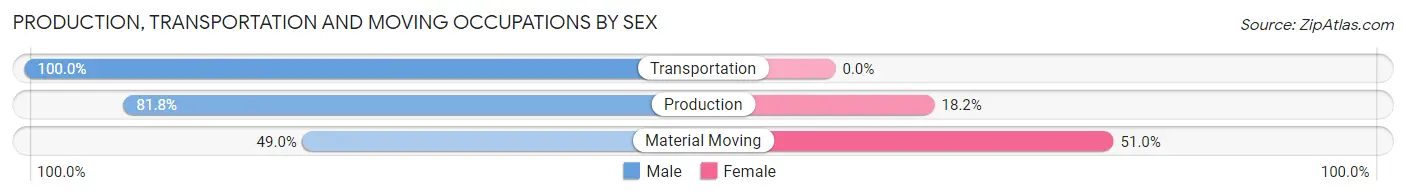
| Occupation | Male | Female |
| Production | 27 (81.8%) | 6 (18.2%) |
| Transportation | 55 (100.0%) | 0 (0.0%) |
| Material Moving | 24 (49.0%) | 25 (51.0%) |
| Total (Category) | 106 (77.4%) | 31 (22.6%) |
| Total (Overall) | 208 (50.9%) | 201 (49.1%) |
Employment Industries by Sex in Columbus
Employment Industries in Columbus
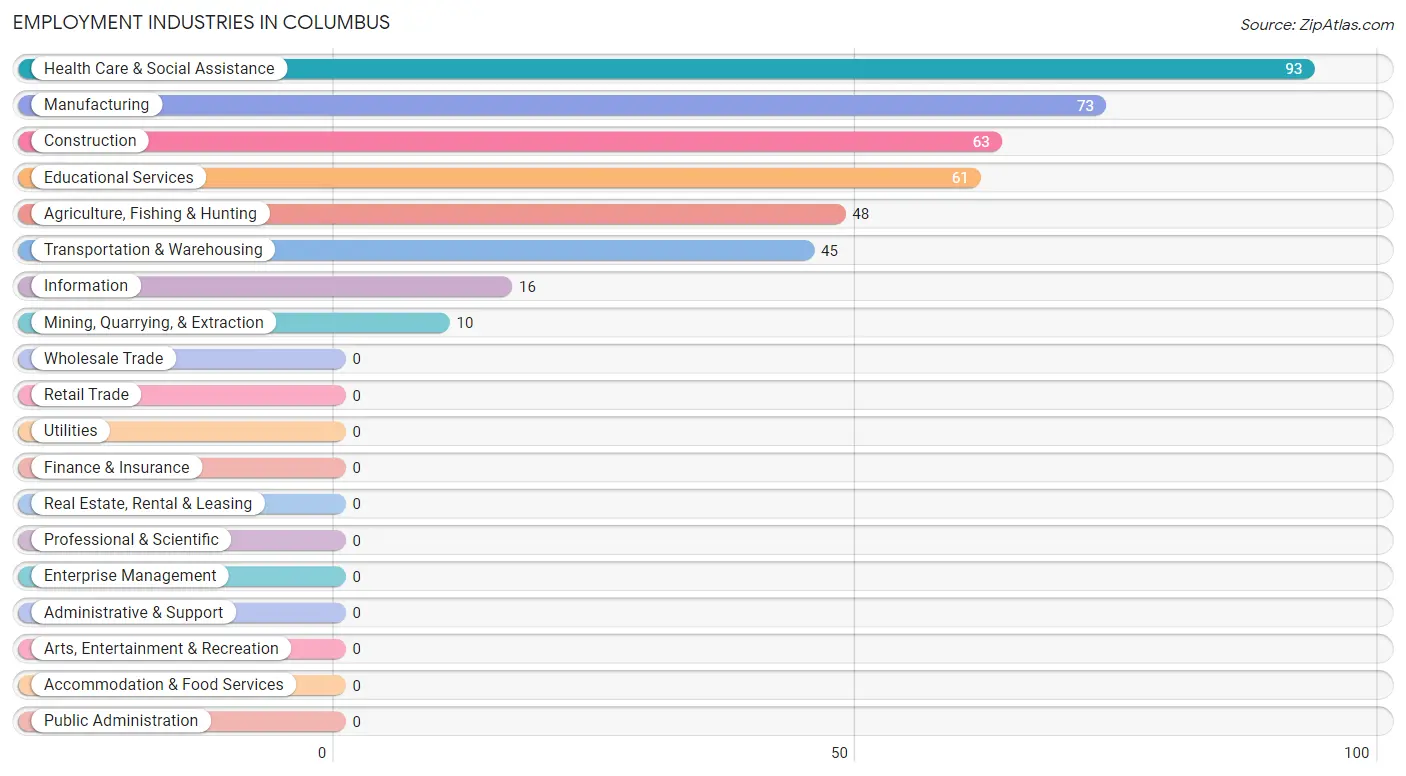
The major employment industries in Columbus include Health Care & Social Assistance (93 | 22.7%), Manufacturing (73 | 17.8%), Construction (63 | 15.4%), Educational Services (61 | 14.9%), and Agriculture, Fishing & Hunting (48 | 11.7%).
Employment Industries by Sex in Columbus
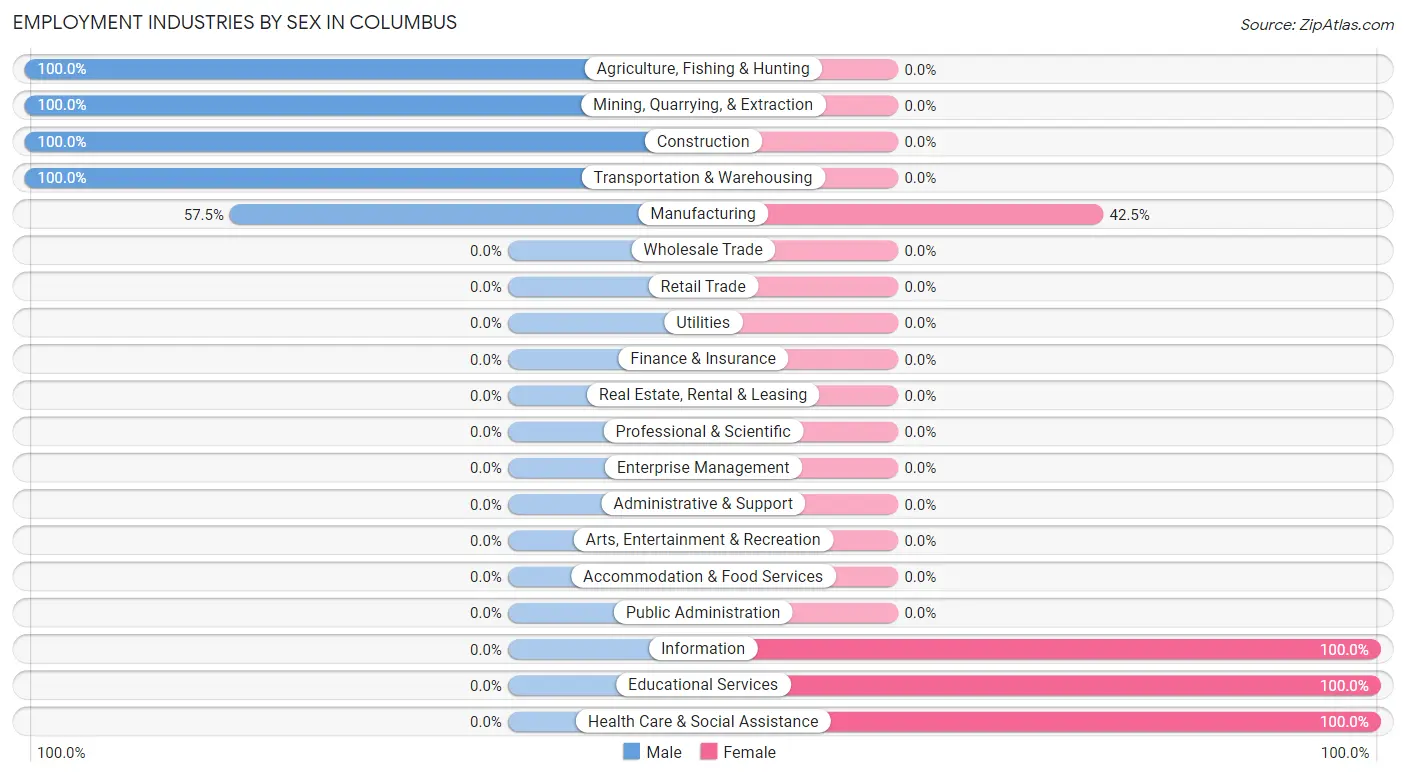
The Columbus industries that see more men than women are Agriculture, Fishing & Hunting (100.0%), Mining, Quarrying, & Extraction (100.0%), and Construction (100.0%), whereas the industries that tend to have a higher number of women are Information (100.0%), Educational Services (100.0%), and Health Care & Social Assistance (100.0%).
| Industry | Male | Female |
| Agriculture, Fishing & Hunting | 48 (100.0%) | 0 (0.0%) |
| Mining, Quarrying, & Extraction | 10 (100.0%) | 0 (0.0%) |
| Construction | 63 (100.0%) | 0 (0.0%) |
| Manufacturing | 42 (57.5%) | 31 (42.5%) |
| Wholesale Trade | 0 (0.0%) | 0 (0.0%) |
| Retail Trade | 0 (0.0%) | 0 (0.0%) |
| Transportation & Warehousing | 45 (100.0%) | 0 (0.0%) |
| Utilities | 0 (0.0%) | 0 (0.0%) |
| Information | 0 (0.0%) | 16 (100.0%) |
| Finance & Insurance | 0 (0.0%) | 0 (0.0%) |
| Real Estate, Rental & Leasing | 0 (0.0%) | 0 (0.0%) |
| Professional & Scientific | 0 (0.0%) | 0 (0.0%) |
| Enterprise Management | 0 (0.0%) | 0 (0.0%) |
| Administrative & Support | 0 (0.0%) | 0 (0.0%) |
| Educational Services | 0 (0.0%) | 61 (100.0%) |
| Health Care & Social Assistance | 0 (0.0%) | 93 (100.0%) |
| Arts, Entertainment & Recreation | 0 (0.0%) | 0 (0.0%) |
| Accommodation & Food Services | 0 (0.0%) | 0 (0.0%) |
| Public Administration | 0 (0.0%) | 0 (0.0%) |
| Total | 208 (50.9%) | 201 (49.1%) |
Education in Columbus
School Enrollment in Columbus
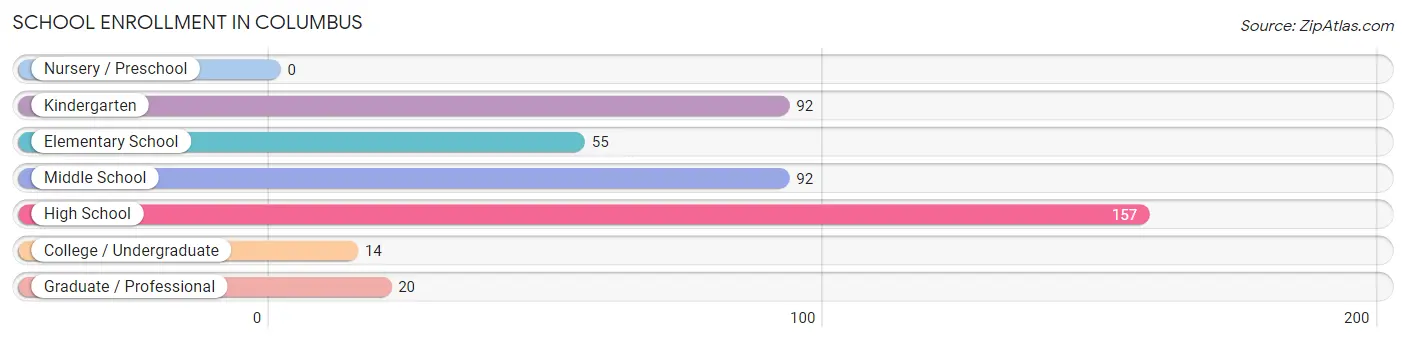
The most common levels of schooling among the 430 students in Columbus are high school (157 | 36.5%), kindergarten (92 | 21.4%), and middle school (92 | 21.4%).
| School Level | # Students | % Students |
| Nursery / Preschool | 0 | 0.0% |
| Kindergarten | 92 | 21.4% |
| Elementary School | 55 | 12.8% |
| Middle School | 92 | 21.4% |
| High School | 157 | 36.5% |
| College / Undergraduate | 14 | 3.3% |
| Graduate / Professional | 20 | 4.6% |
| Total | 430 | 100.0% |
School Enrollment by Age by Funding Source in Columbus
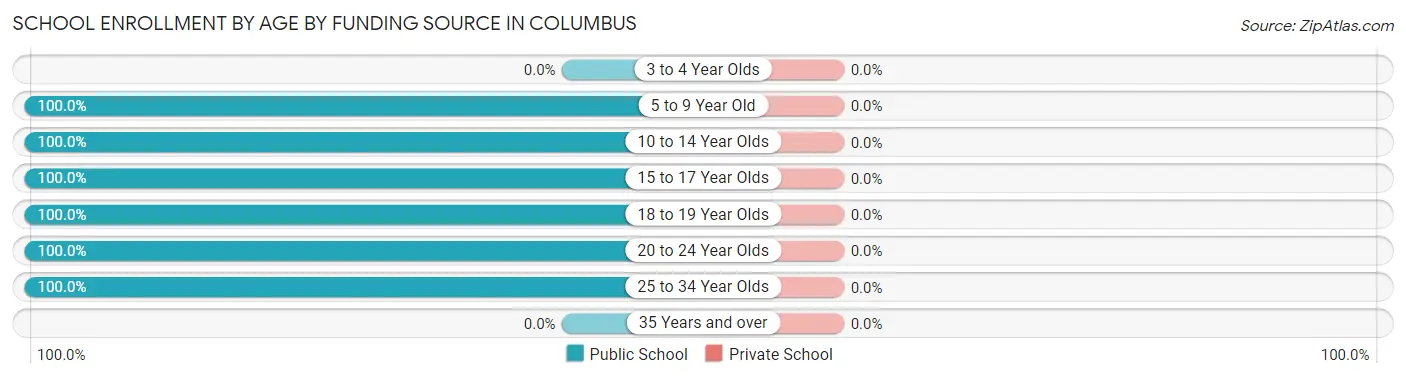
| Age Bracket | Public School | Private School |
| 3 to 4 Year Olds | 0 (0.0%) | 0 (0.0%) |
| 5 to 9 Year Old | 153 (100.0%) | 0 (0.0%) |
| 10 to 14 Year Olds | 81 (100.0%) | 0 (0.0%) |
| 15 to 17 Year Olds | 151 (100.0%) | 0 (0.0%) |
| 18 to 19 Year Olds | 11 (100.0%) | 0 (0.0%) |
| 20 to 24 Year Olds | 14 (100.0%) | 0 (0.0%) |
| 25 to 34 Year Olds | 20 (100.0%) | 0 (0.0%) |
| 35 Years and over | 0 (0.0%) | 0 (0.0%) |
| Total | 430 (100.0%) | 0 (0.0%) |
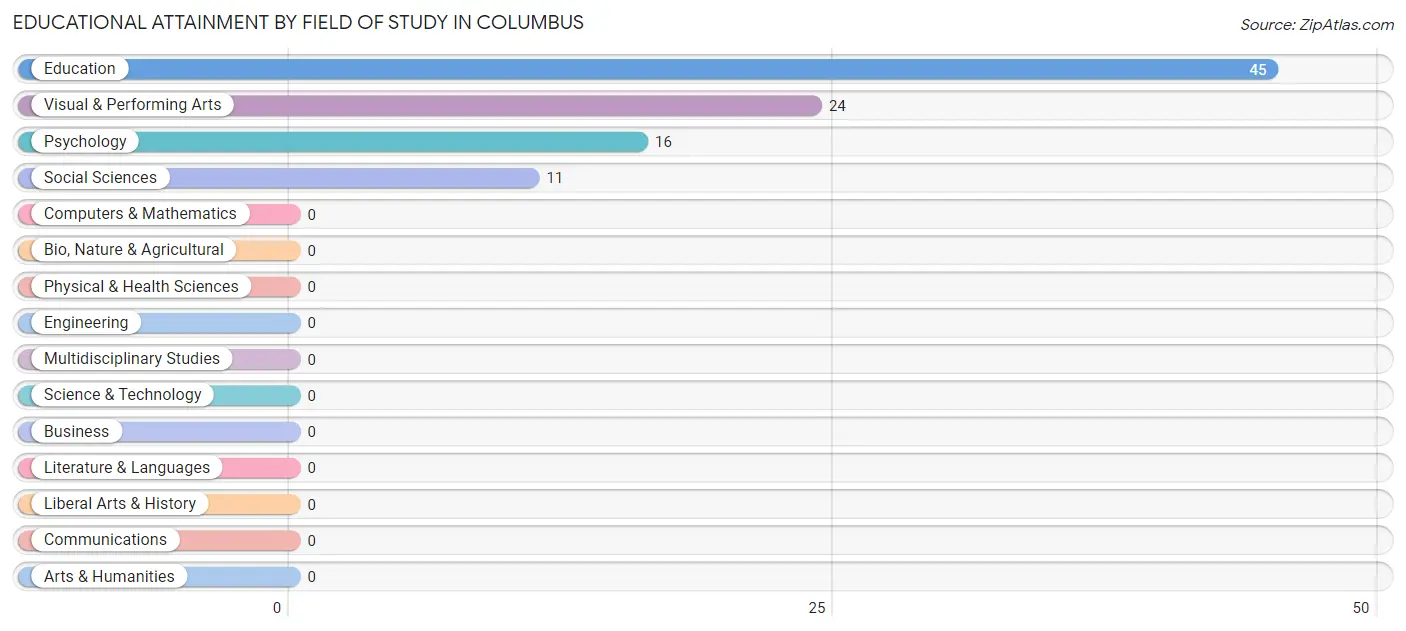
Educational Attainment by Field of Study in Columbus
Education (45 | 46.9%), visual & performing arts (24 | 25.0%), psychology (16 | 16.7%), and social sciences (11 | 11.5%) are the most common fields of study among 96 individuals in Columbus who have obtained a bachelor's degree or higher.
| Field of Study | # Graduates | % Graduates |
| Computers & Mathematics | 0 | 0.0% |
| Bio, Nature & Agricultural | 0 | 0.0% |
| Physical & Health Sciences | 0 | 0.0% |
| Psychology | 16 | 16.7% |
| Social Sciences | 11 | 11.5% |
| Engineering | 0 | 0.0% |
| Multidisciplinary Studies | 0 | 0.0% |
| Science & Technology | 0 | 0.0% |
| Business | 0 | 0.0% |
| Education | 45 | 46.9% |
| Literature & Languages | 0 | 0.0% |
| Liberal Arts & History | 0 | 0.0% |
| Visual & Performing Arts | 24 | 25.0% |
| Communications | 0 | 0.0% |
| Arts & Humanities | 0 | 0.0% |
| Total | 96 | 100.0% |
Transportation & Commute in Columbus
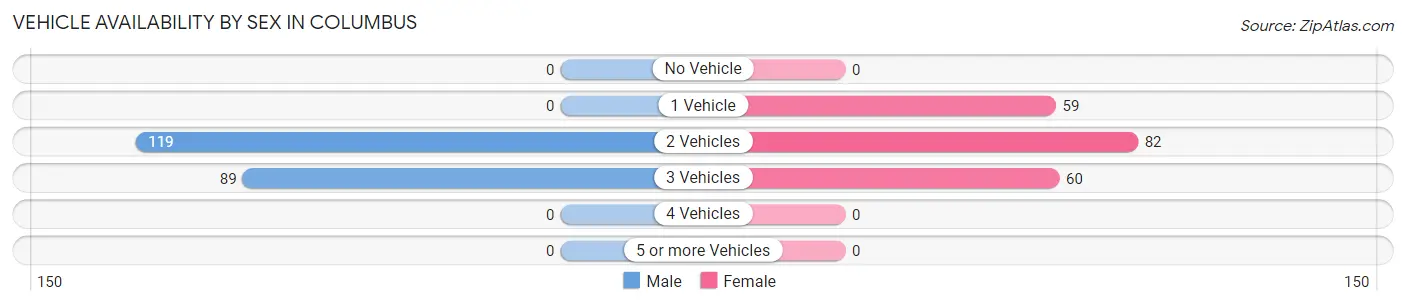
Vehicle Availability by Sex in Columbus
The most prevalent vehicle ownership categories in Columbus are males with 2 vehicles (119, accounting for 57.2%) and females with 2 vehicles (82, making up 59.2%).
| Vehicles Available | Male | Female |
| No Vehicle | 0 (0.0%) | 0 (0.0%) |
| 1 Vehicle | 0 (0.0%) | 59 (29.3%) |
| 2 Vehicles | 119 (57.2%) | 82 (40.8%) |
| 3 Vehicles | 89 (42.8%) | 60 (29.8%) |
| 4 Vehicles | 0 (0.0%) | 0 (0.0%) |
| 5 or more Vehicles | 0 (0.0%) | 0 (0.0%) |
| Total | 208 (100.0%) | 201 (100.0%) |
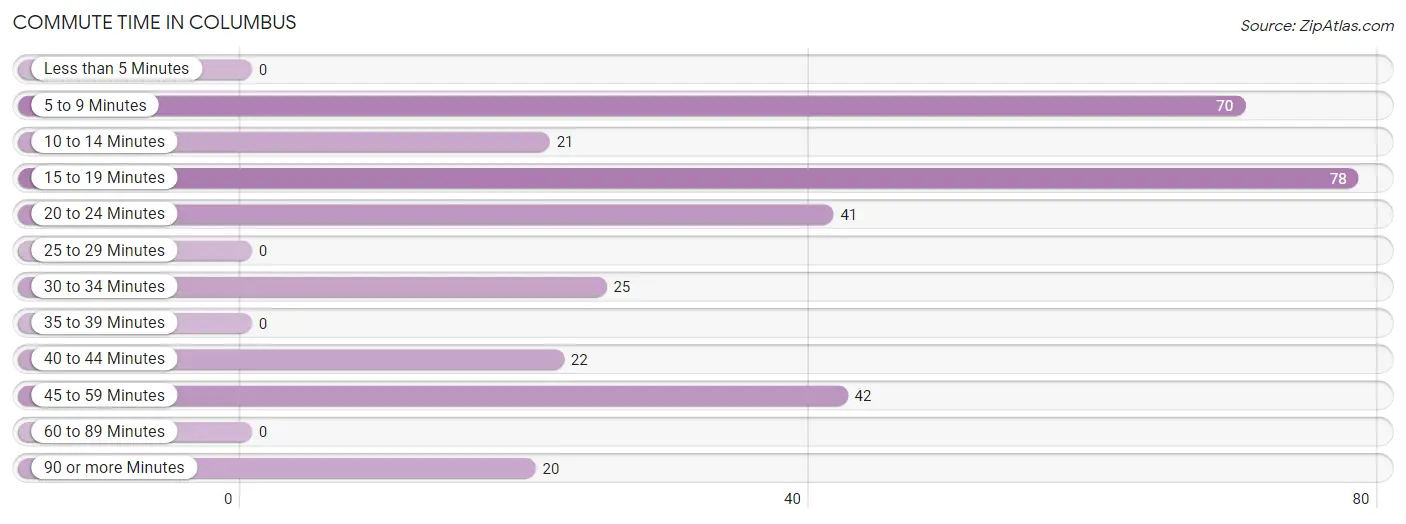
Commute Time in Columbus
The most frequently occuring commute durations in Columbus are 15 to 19 minutes (78 commuters, 24.4%), 5 to 9 minutes (70 commuters, 21.9%), and 45 to 59 minutes (42 commuters, 13.2%).
| Commute Time | # Commuters | % Commuters |
| Less than 5 Minutes | 0 | 0.0% |
| 5 to 9 Minutes | 70 | 21.9% |
| 10 to 14 Minutes | 21 | 6.6% |
| 15 to 19 Minutes | 78 | 24.4% |
| 20 to 24 Minutes | 41 | 12.9% |
| 25 to 29 Minutes | 0 | 0.0% |
| 30 to 34 Minutes | 25 | 7.8% |
| 35 to 39 Minutes | 0 | 0.0% |
| 40 to 44 Minutes | 22 | 6.9% |
| 45 to 59 Minutes | 42 | 13.2% |
| 60 to 89 Minutes | 0 | 0.0% |
| 90 or more Minutes | 20 | 6.3% |
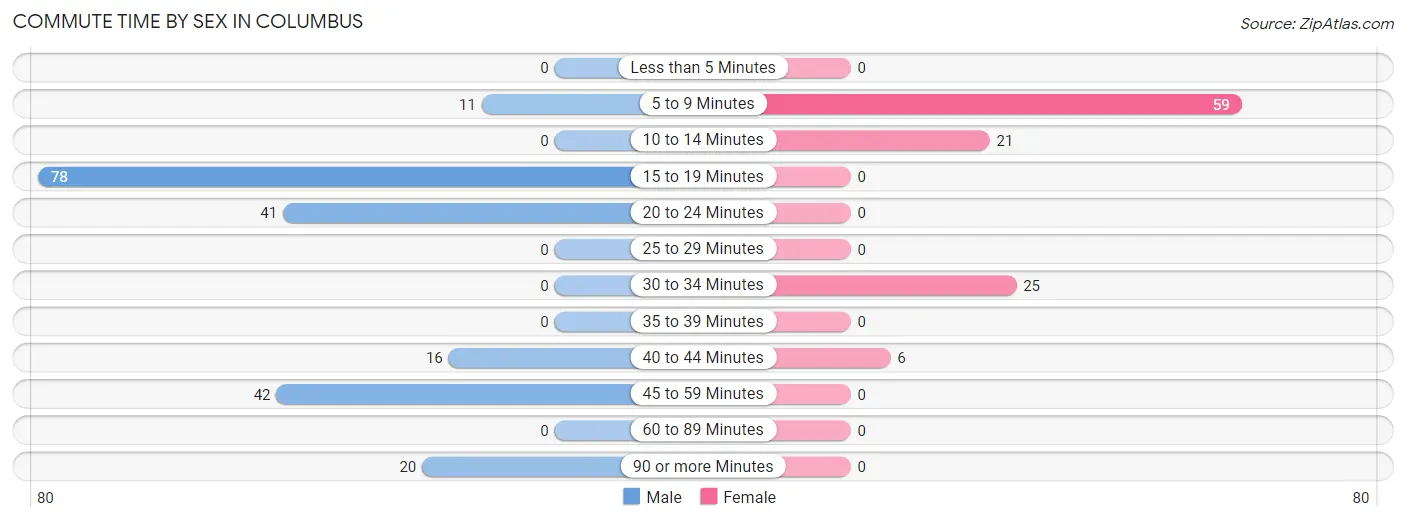
Commute Time by Sex in Columbus
The most common commute times in Columbus are 15 to 19 minutes (78 commuters, 37.5%) for males and 5 to 9 minutes (59 commuters, 53.1%) for females.
| Commute Time | Male | Female |
| Less than 5 Minutes | 0 (0.0%) | 0 (0.0%) |
| 5 to 9 Minutes | 11 (5.3%) | 59 (53.1%) |
| 10 to 14 Minutes | 0 (0.0%) | 21 (18.9%) |
| 15 to 19 Minutes | 78 (37.5%) | 0 (0.0%) |
| 20 to 24 Minutes | 41 (19.7%) | 0 (0.0%) |
| 25 to 29 Minutes | 0 (0.0%) | 0 (0.0%) |
| 30 to 34 Minutes | 0 (0.0%) | 25 (22.5%) |
| 35 to 39 Minutes | 0 (0.0%) | 0 (0.0%) |
| 40 to 44 Minutes | 16 (7.7%) | 6 (5.4%) |
| 45 to 59 Minutes | 42 (20.2%) | 0 (0.0%) |
| 60 to 89 Minutes | 0 (0.0%) | 0 (0.0%) |
| 90 or more Minutes | 20 (9.6%) | 0 (0.0%) |
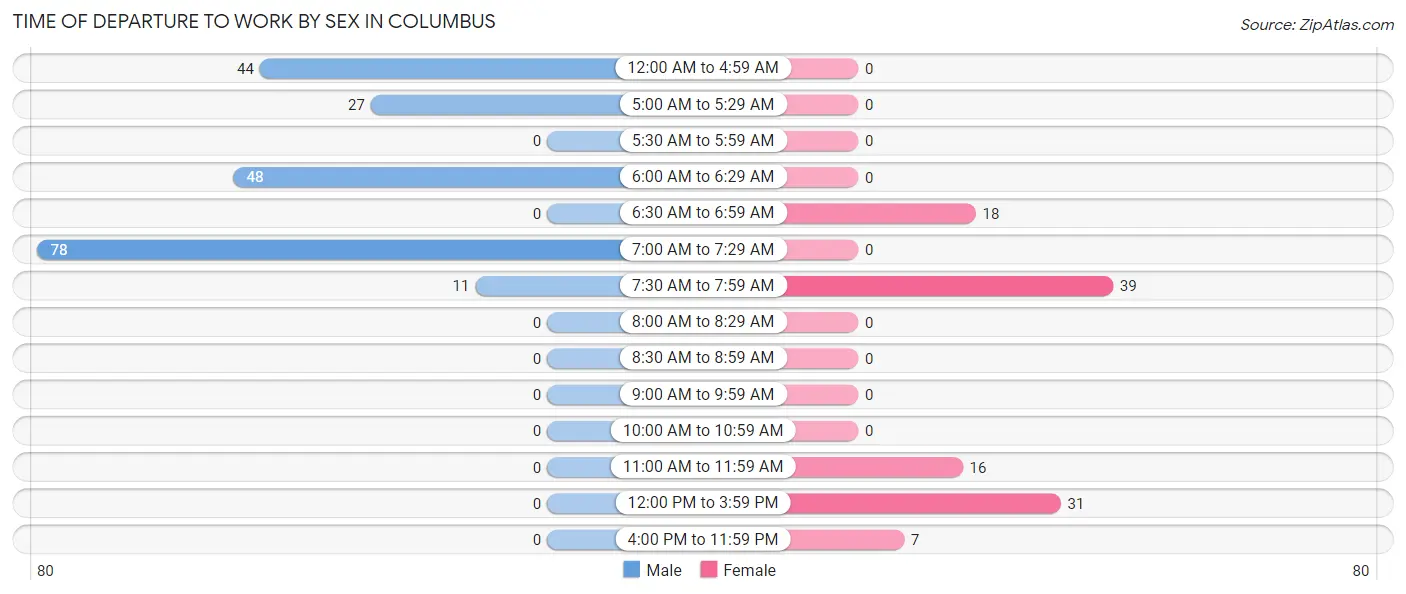
Time of Departure to Work by Sex in Columbus
The most frequent times of departure to work in Columbus are 7:00 AM to 7:29 AM (78, 37.5%) for males and 7:30 AM to 7:59 AM (39, 35.1%) for females.
| Time of Departure | Male | Female |
| 12:00 AM to 4:59 AM | 44 (21.1%) | 0 (0.0%) |
| 5:00 AM to 5:29 AM | 27 (13.0%) | 0 (0.0%) |
| 5:30 AM to 5:59 AM | 0 (0.0%) | 0 (0.0%) |
| 6:00 AM to 6:29 AM | 48 (23.1%) | 0 (0.0%) |
| 6:30 AM to 6:59 AM | 0 (0.0%) | 18 (16.2%) |
| 7:00 AM to 7:29 AM | 78 (37.5%) | 0 (0.0%) |
| 7:30 AM to 7:59 AM | 11 (5.3%) | 39 (35.1%) |
| 8:00 AM to 8:29 AM | 0 (0.0%) | 0 (0.0%) |
| 8:30 AM to 8:59 AM | 0 (0.0%) | 0 (0.0%) |
| 9:00 AM to 9:59 AM | 0 (0.0%) | 0 (0.0%) |
| 10:00 AM to 10:59 AM | 0 (0.0%) | 0 (0.0%) |
| 11:00 AM to 11:59 AM | 0 (0.0%) | 16 (14.4%) |
| 12:00 PM to 3:59 PM | 0 (0.0%) | 31 (27.9%) |
| 4:00 PM to 11:59 PM | 0 (0.0%) | 7 (6.3%) |
| Total | 208 (100.0%) | 111 (100.0%) |
Housing Occupancy in Columbus
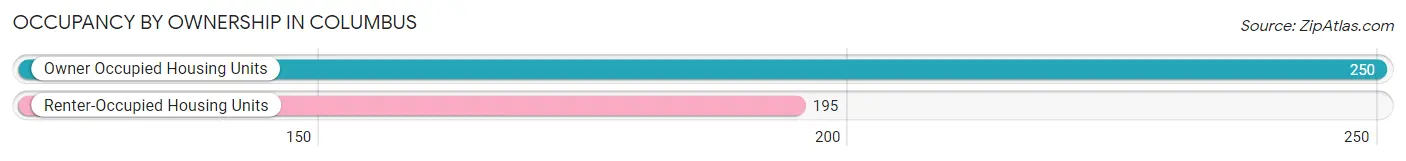
Occupancy by Ownership in Columbus
Of the total 445 dwellings in Columbus, owner-occupied units account for 250 (56.2%), while renter-occupied units make up 195 (43.8%).
| Occupancy | # Housing Units | % Housing Units |
| Owner Occupied Housing Units | 250 | 56.2% |
| Renter-Occupied Housing Units | 195 | 43.8% |
| Total Occupied Housing Units | 445 | 100.0% |
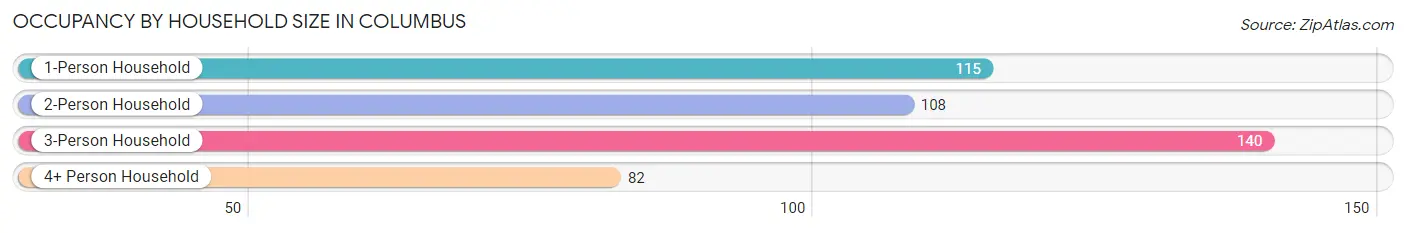
Occupancy by Household Size in Columbus
| Household Size | # Housing Units | % Housing Units |
| 1-Person Household | 115 | 25.8% |
| 2-Person Household | 108 | 24.3% |
| 3-Person Household | 140 | 31.5% |
| 4+ Person Household | 82 | 18.4% |
| Total Housing Units | 445 | 100.0% |
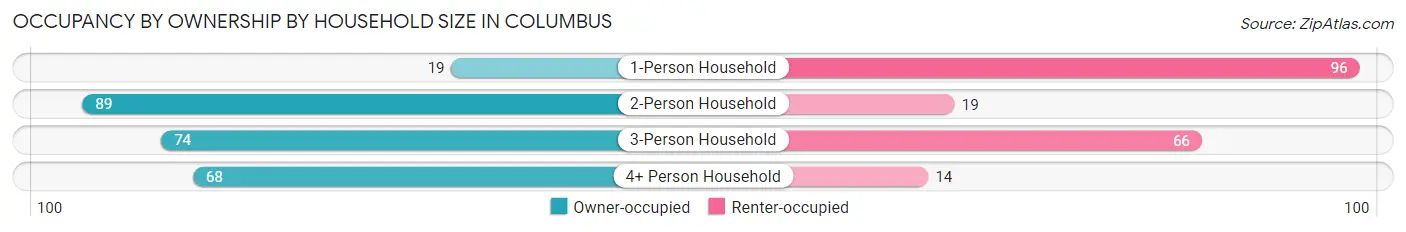
Occupancy by Ownership by Household Size in Columbus
| Household Size | Owner-occupied | Renter-occupied |
| 1-Person Household | 19 (16.5%) | 96 (83.5%) |
| 2-Person Household | 89 (82.4%) | 19 (17.6%) |
| 3-Person Household | 74 (52.9%) | 66 (47.1%) |
| 4+ Person Household | 68 (82.9%) | 14 (17.1%) |
| Total Housing Units | 250 (56.2%) | 195 (43.8%) |
Occupancy by Educational Attainment in Columbus
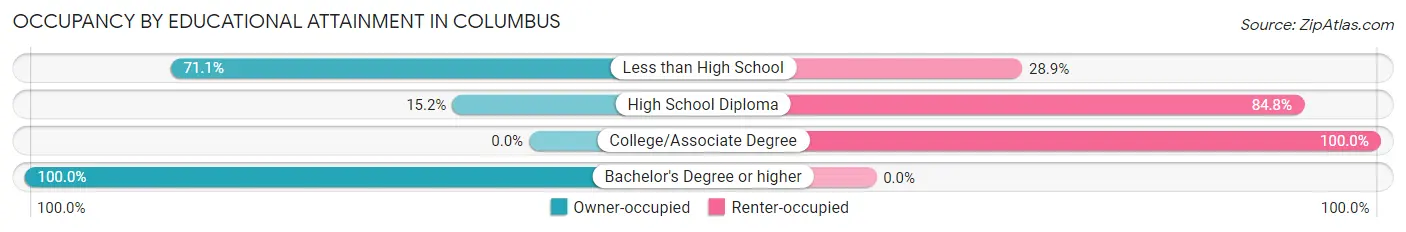
| Household Size | Owner-occupied | Renter-occupied |
| Less than High School | 172 (71.1%) | 70 (28.9%) |
| High School Diploma | 7 (15.2%) | 39 (84.8%) |
| College/Associate Degree | 0 (0.0%) | 86 (100.0%) |
| Bachelor's Degree or higher | 71 (100.0%) | 0 (0.0%) |
Occupancy by Age of Householder in Columbus
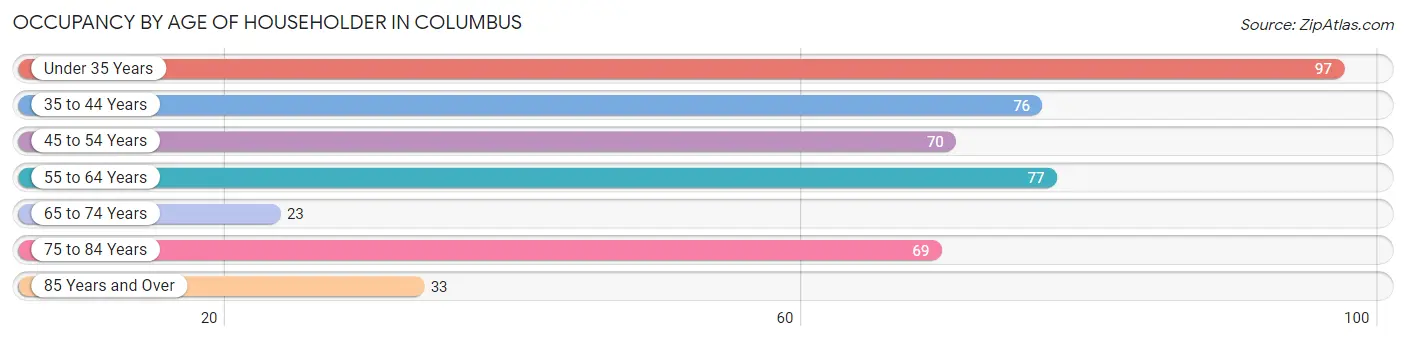
| Age Bracket | # Households | % Households |
| Under 35 Years | 97 | 21.8% |
| 35 to 44 Years | 76 | 17.1% |
| 45 to 54 Years | 70 | 15.7% |
| 55 to 64 Years | 77 | 17.3% |
| 65 to 74 Years | 23 | 5.2% |
| 75 to 84 Years | 69 | 15.5% |
| 85 Years and Over | 33 | 7.4% |
| Total | 445 | 100.0% |
Housing Finances in Columbus
Median Income by Occupancy in Columbus
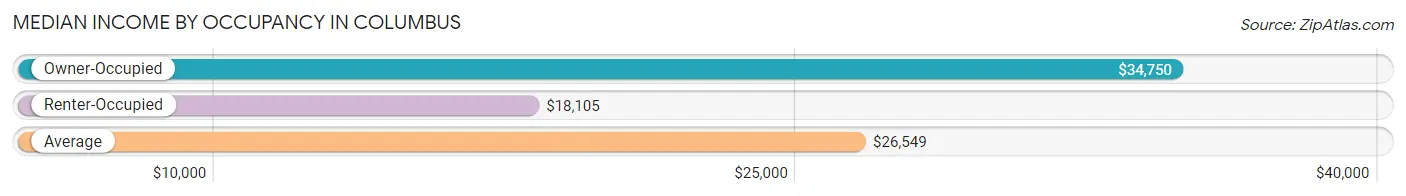
| Occupancy Type | # Households | Median Income |
| Owner-Occupied | 250 (56.2%) | $34,750 |
| Renter-Occupied | 195 (43.8%) | $18,105 |
| Average | 445 (100.0%) | $26,549 |
Occupancy by Householder Income Bracket in Columbus
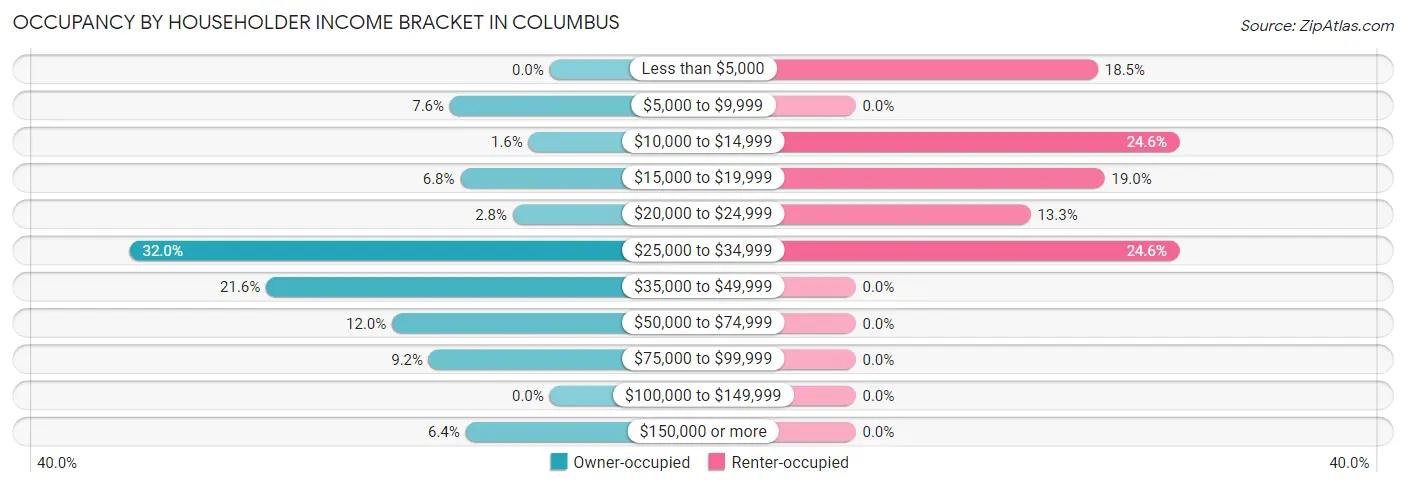
| Income Bracket | Owner-occupied | Renter-occupied |
| Less than $5,000 | 0 (0.0%) | 36 (18.5%) |
| $5,000 to $9,999 | 19 (7.6%) | 0 (0.0%) |
| $10,000 to $14,999 | 4 (1.6%) | 48 (24.6%) |
| $15,000 to $19,999 | 17 (6.8%) | 37 (19.0%) |
| $20,000 to $24,999 | 7 (2.8%) | 26 (13.3%) |
| $25,000 to $34,999 | 80 (32.0%) | 48 (24.6%) |
| $35,000 to $49,999 | 54 (21.6%) | 0 (0.0%) |
| $50,000 to $74,999 | 30 (12.0%) | 0 (0.0%) |
| $75,000 to $99,999 | 23 (9.2%) | 0 (0.0%) |
| $100,000 to $149,999 | 0 (0.0%) | 0 (0.0%) |
| $150,000 or more | 16 (6.4%) | 0 (0.0%) |
| Total | 250 (100.0%) | 195 (100.0%) |
Monthly Housing Cost Tiers in Columbus
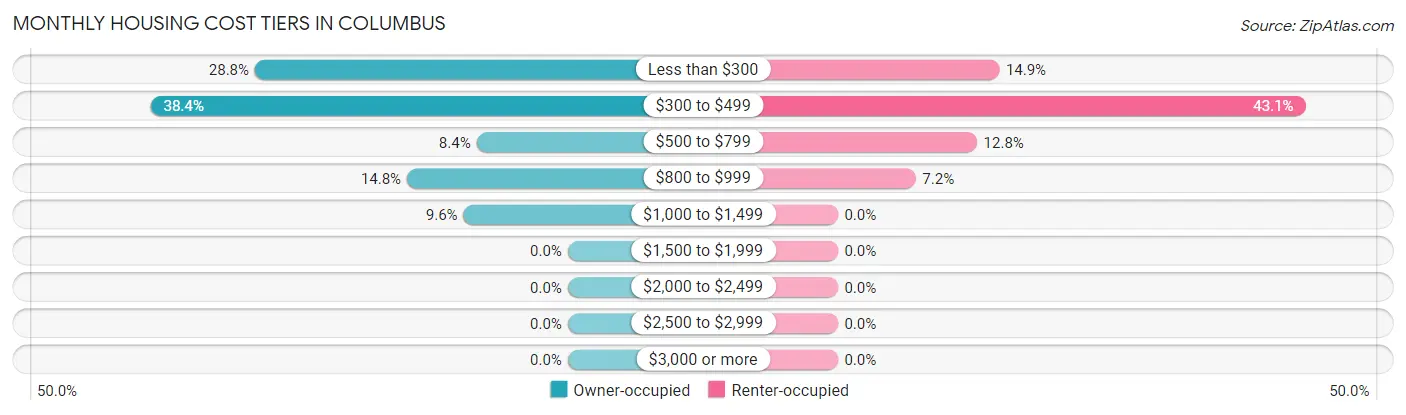
| Monthly Cost | Owner-occupied | Renter-occupied |
| Less than $300 | 72 (28.8%) | 29 (14.9%) |
| $300 to $499 | 96 (38.4%) | 84 (43.1%) |
| $500 to $799 | 21 (8.4%) | 25 (12.8%) |
| $800 to $999 | 37 (14.8%) | 14 (7.2%) |
| $1,000 to $1,499 | 24 (9.6%) | 0 (0.0%) |
| $1,500 to $1,999 | 0 (0.0%) | 0 (0.0%) |
| $2,000 to $2,499 | 0 (0.0%) | 0 (0.0%) |
| $2,500 to $2,999 | 0 (0.0%) | 0 (0.0%) |
| $3,000 or more | 0 (0.0%) | 0 (0.0%) |
| Total | 250 (100.0%) | 195 (100.0%) |
Physical Housing Characteristics in Columbus
Housing Structures in Columbus
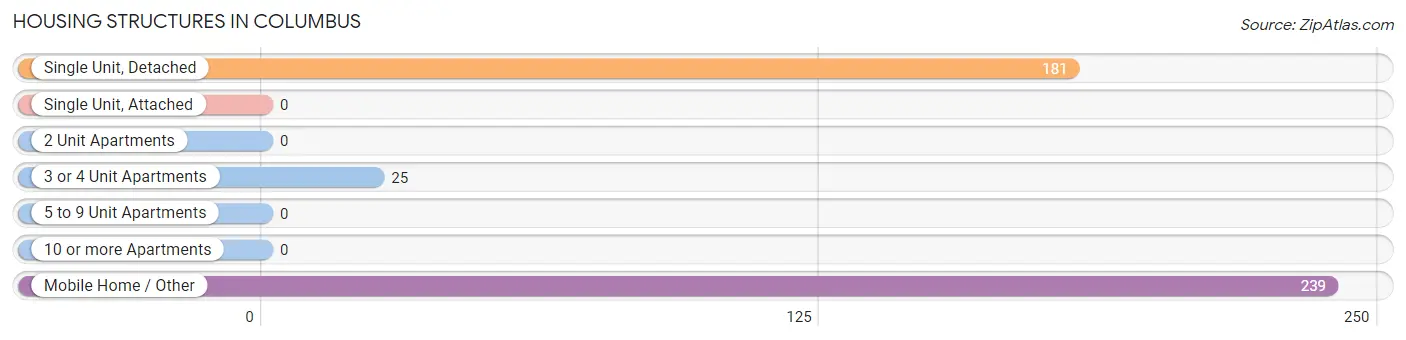
| Structure Type | # Housing Units | % Housing Units |
| Single Unit, Detached | 181 | 40.7% |
| Single Unit, Attached | 0 | 0.0% |
| 2 Unit Apartments | 0 | 0.0% |
| 3 or 4 Unit Apartments | 25 | 5.6% |
| 5 to 9 Unit Apartments | 0 | 0.0% |
| 10 or more Apartments | 0 | 0.0% |
| Mobile Home / Other | 239 | 53.7% |
| Total | 445 | 100.0% |
Housing Structures by Occupancy in Columbus
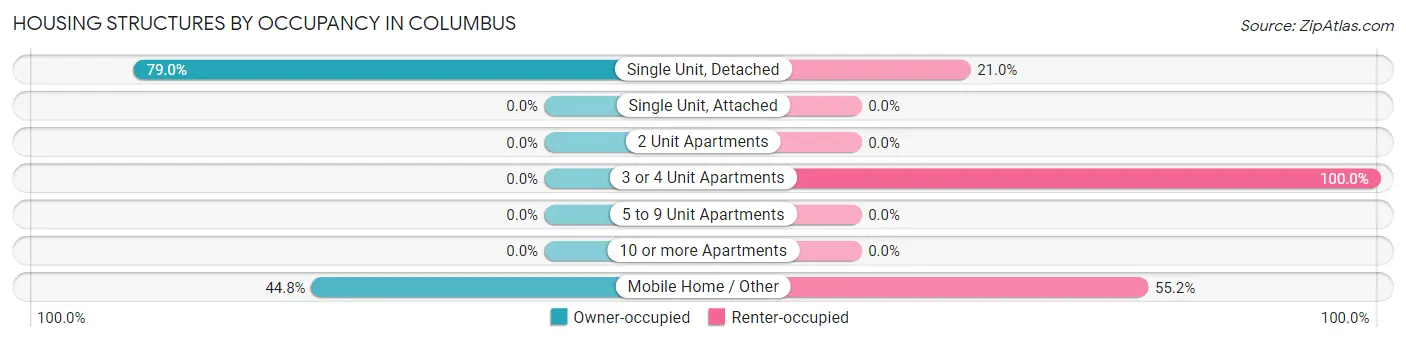
| Structure Type | Owner-occupied | Renter-occupied |
| Single Unit, Detached | 143 (79.0%) | 38 (21.0%) |
| Single Unit, Attached | 0 (0.0%) | 0 (0.0%) |
| 2 Unit Apartments | 0 (0.0%) | 0 (0.0%) |
| 3 or 4 Unit Apartments | 0 (0.0%) | 25 (100.0%) |
| 5 to 9 Unit Apartments | 0 (0.0%) | 0 (0.0%) |
| 10 or more Apartments | 0 (0.0%) | 0 (0.0%) |
| Mobile Home / Other | 107 (44.8%) | 132 (55.2%) |
| Total | 250 (56.2%) | 195 (43.8%) |
Housing Structures by Number of Rooms in Columbus
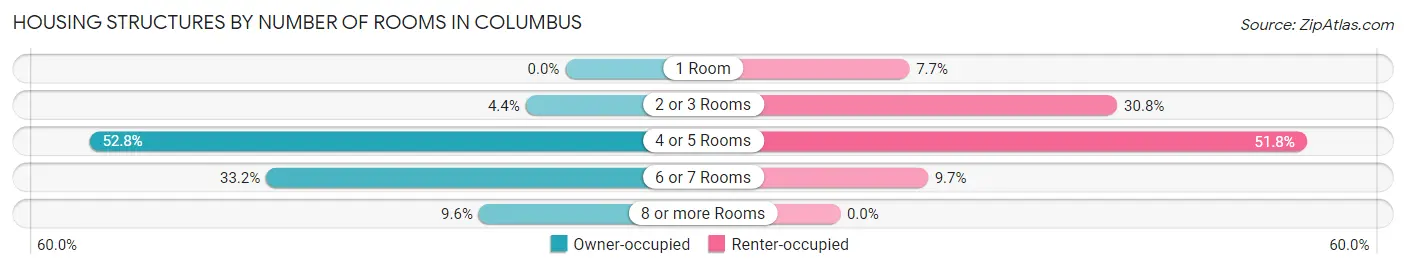
| Number of Rooms | Owner-occupied | Renter-occupied |
| 1 Room | 0 (0.0%) | 15 (7.7%) |
| 2 or 3 Rooms | 11 (4.4%) | 60 (30.8%) |
| 4 or 5 Rooms | 132 (52.8%) | 101 (51.8%) |
| 6 or 7 Rooms | 83 (33.2%) | 19 (9.7%) |
| 8 or more Rooms | 24 (9.6%) | 0 (0.0%) |
| Total | 250 (100.0%) | 195 (100.0%) |
Housing Structure by Heating Type in Columbus
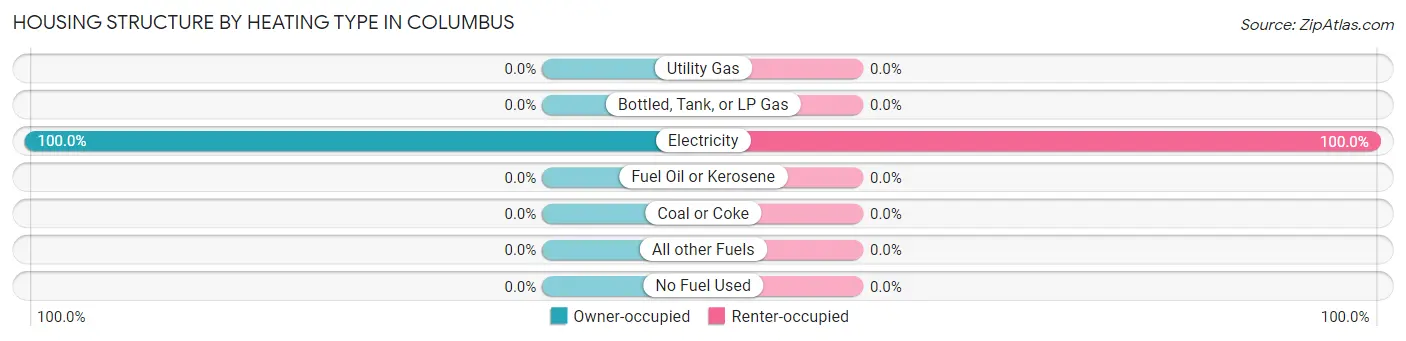
| Heating Type | Owner-occupied | Renter-occupied |
| Utility Gas | 0 (0.0%) | 0 (0.0%) |
| Bottled, Tank, or LP Gas | 0 (0.0%) | 0 (0.0%) |
| Electricity | 250 (100.0%) | 195 (100.0%) |
| Fuel Oil or Kerosene | 0 (0.0%) | 0 (0.0%) |
| Coal or Coke | 0 (0.0%) | 0 (0.0%) |
| All other Fuels | 0 (0.0%) | 0 (0.0%) |
| No Fuel Used | 0 (0.0%) | 0 (0.0%) |
| Total | 250 (100.0%) | 195 (100.0%) |
Household Vehicle Usage in Columbus
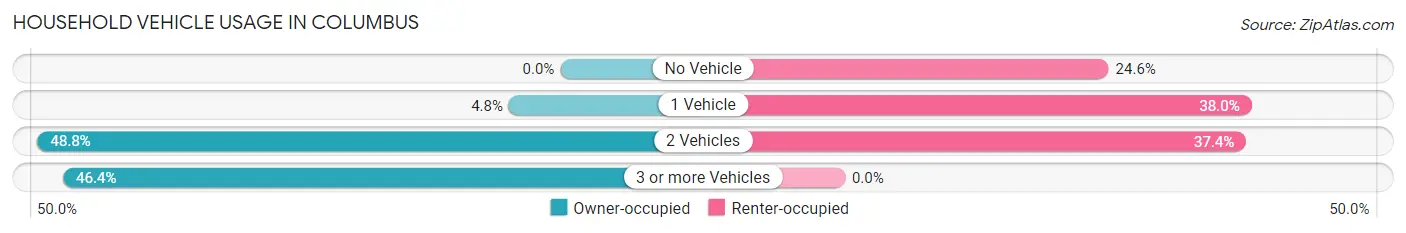
| Vehicles per Household | Owner-occupied | Renter-occupied |
| No Vehicle | 0 (0.0%) | 48 (24.6%) |
| 1 Vehicle | 12 (4.8%) | 74 (38.0%) |
| 2 Vehicles | 122 (48.8%) | 73 (37.4%) |
| 3 or more Vehicles | 116 (46.4%) | 0 (0.0%) |
| Total | 250 (100.0%) | 195 (100.0%) |
Real Estate & Mortgages in Columbus
Real Estate and Mortgage Overview in Columbus
| Characteristic | Without Mortgage | With Mortgage |
| Housing Units | 168 | 82 |
| Median Property Value | $78,700 | $68,300 |
| Median Household Income | $33,125 | $0 |
| Monthly Housing Costs | $359 | $0 |
| Real Estate Taxes | $332 | $0 |
Property Value by Mortgage Status in Columbus
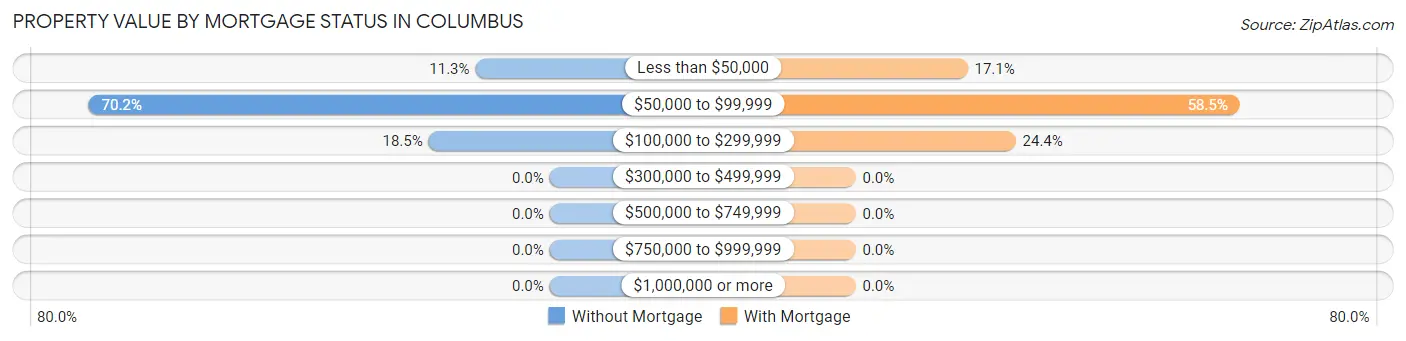
| Property Value | Without Mortgage | With Mortgage |
| Less than $50,000 | 19 (11.3%) | 14 (17.1%) |
| $50,000 to $99,999 | 118 (70.2%) | 48 (58.5%) |
| $100,000 to $299,999 | 31 (18.4%) | 20 (24.4%) |
| $300,000 to $499,999 | 0 (0.0%) | 0 (0.0%) |
| $500,000 to $749,999 | 0 (0.0%) | 0 (0.0%) |
| $750,000 to $999,999 | 0 (0.0%) | 0 (0.0%) |
| $1,000,000 or more | 0 (0.0%) | 0 (0.0%) |
| Total | 168 (100.0%) | 82 (100.0%) |
Household Income by Mortgage Status in Columbus
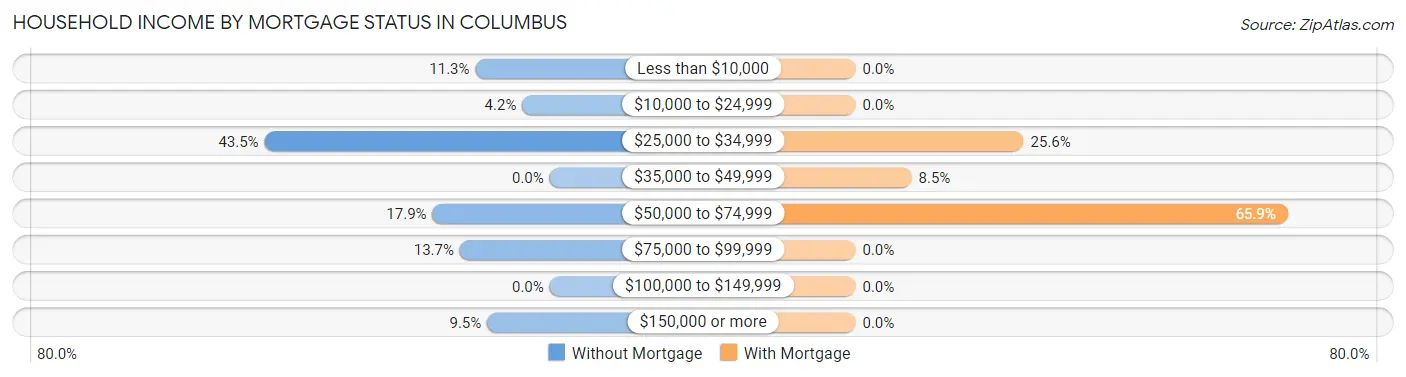
| Household Income | Without Mortgage | With Mortgage |
| Less than $10,000 | 19 (11.3%) | 0 (0.0%) |
| $10,000 to $24,999 | 7 (4.2%) | 0 (0.0%) |
| $25,000 to $34,999 | 73 (43.4%) | 21 (25.6%) |
| $35,000 to $49,999 | 0 (0.0%) | 7 (8.5%) |
| $50,000 to $74,999 | 30 (17.9%) | 54 (65.8%) |
| $75,000 to $99,999 | 23 (13.7%) | 0 (0.0%) |
| $100,000 to $149,999 | 0 (0.0%) | 0 (0.0%) |
| $150,000 or more | 16 (9.5%) | 0 (0.0%) |
| Total | 168 (100.0%) | 82 (100.0%) |
Property Value to Household Income Ratio in Columbus
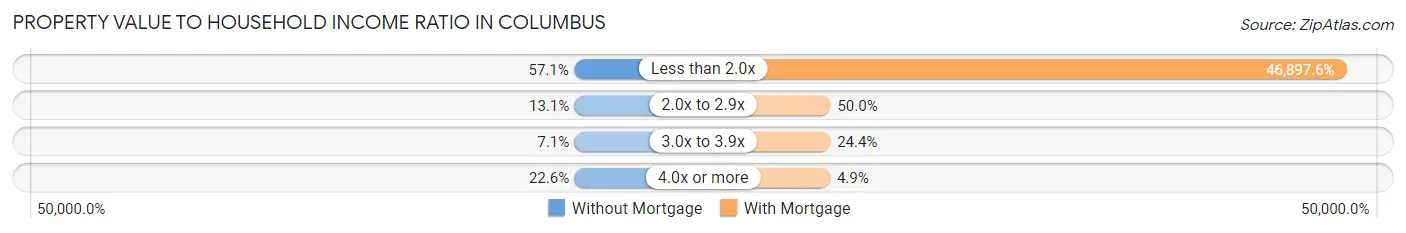
| Value-to-Income Ratio | Without Mortgage | With Mortgage |
| Less than 2.0x | 96 (57.1%) | 38,456 (46,897.6%) |
| 2.0x to 2.9x | 22 (13.1%) | 41 (50.0%) |
| 3.0x to 3.9x | 12 (7.1%) | 20 (24.4%) |
| 4.0x or more | 38 (22.6%) | 4 (4.9%) |
| Total | 168 (100.0%) | 82 (100.0%) |
Real Estate Taxes by Mortgage Status in Columbus
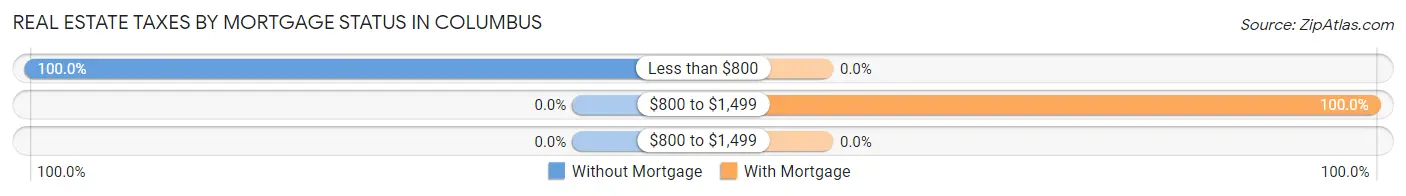
| Property Taxes | Without Mortgage | With Mortgage |
| Less than $800 | 168 (100.0%) | 0 (0.0%) |
| $800 to $1,499 | 0 (0.0%) | 82 (100.0%) |
| $800 to $1,499 | 0 (0.0%) | 0 (0.0%) |
| Total | 168 (100.0%) | 82 (100.0%) |
Health & Disability in Columbus
Health Insurance Coverage by Age in Columbus
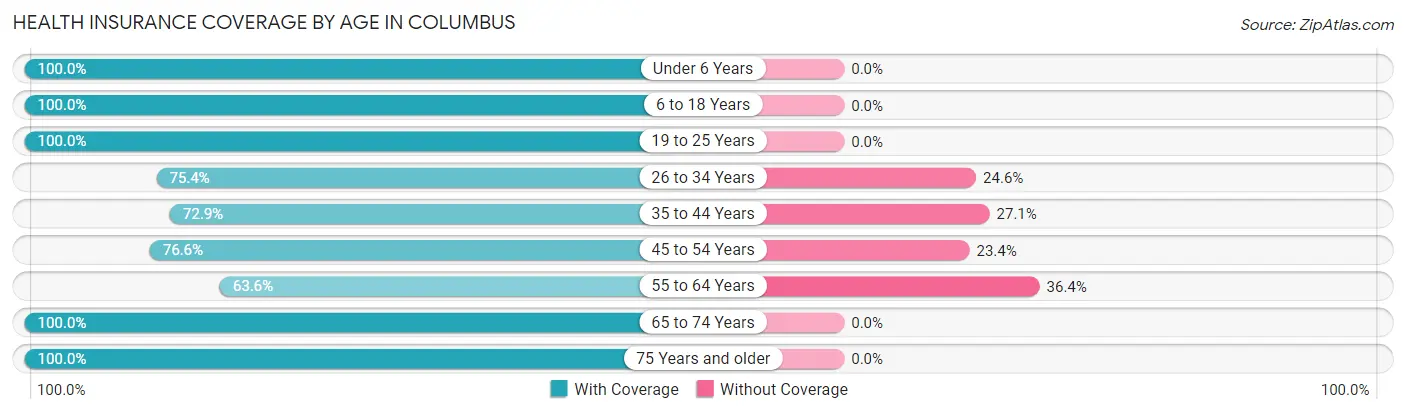
| Age Bracket | With Coverage | Without Coverage |
| Under 6 Years | 42 (100.0%) | 0 (0.0%) |
| 6 to 18 Years | 393 (100.0%) | 0 (0.0%) |
| 19 to 25 Years | 91 (100.0%) | 0 (0.0%) |
| 26 to 34 Years | 138 (75.4%) | 45 (24.6%) |
| 35 to 44 Years | 78 (72.9%) | 29 (27.1%) |
| 45 to 54 Years | 105 (76.6%) | 32 (23.4%) |
| 55 to 64 Years | 96 (63.6%) | 55 (36.4%) |
| 65 to 74 Years | 65 (100.0%) | 0 (0.0%) |
| 75 Years and older | 112 (100.0%) | 0 (0.0%) |
| Total | 1,120 (87.4%) | 161 (12.6%) |
Health Insurance Coverage by Citizenship Status in Columbus
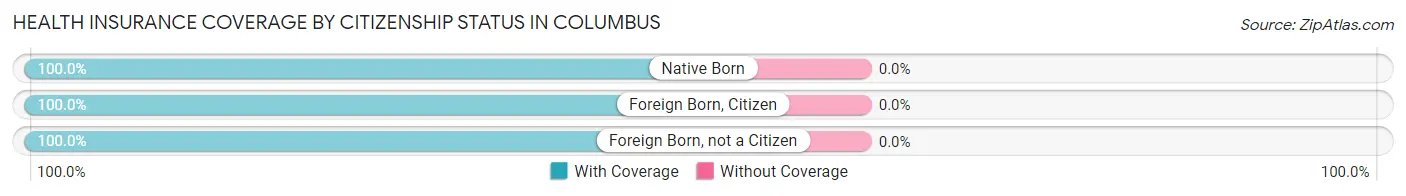
| Citizenship Status | With Coverage | Without Coverage |
| Native Born | 42 (100.0%) | 0 (0.0%) |
| Foreign Born, Citizen | 393 (100.0%) | 0 (0.0%) |
| Foreign Born, not a Citizen | 91 (100.0%) | 0 (0.0%) |
Health Insurance Coverage by Household Income in Columbus
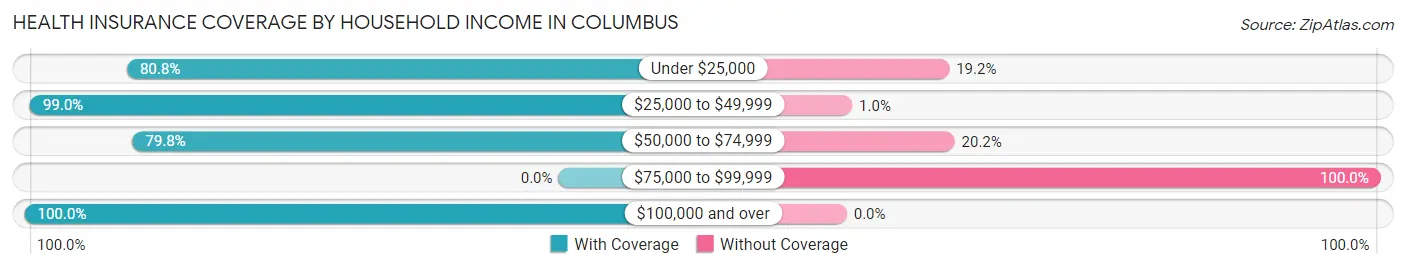
| Household Income | With Coverage | Without Coverage |
| Under $25,000 | 278 (80.8%) | 66 (19.2%) |
| $25,000 to $49,999 | 696 (99.0%) | 7 (1.0%) |
| $50,000 to $74,999 | 79 (79.8%) | 20 (20.2%) |
| $75,000 to $99,999 | 0 (0.0%) | 68 (100.0%) |
| $100,000 and over | 67 (100.0%) | 0 (0.0%) |
Public vs Private Health Insurance Coverage by Age in Columbus
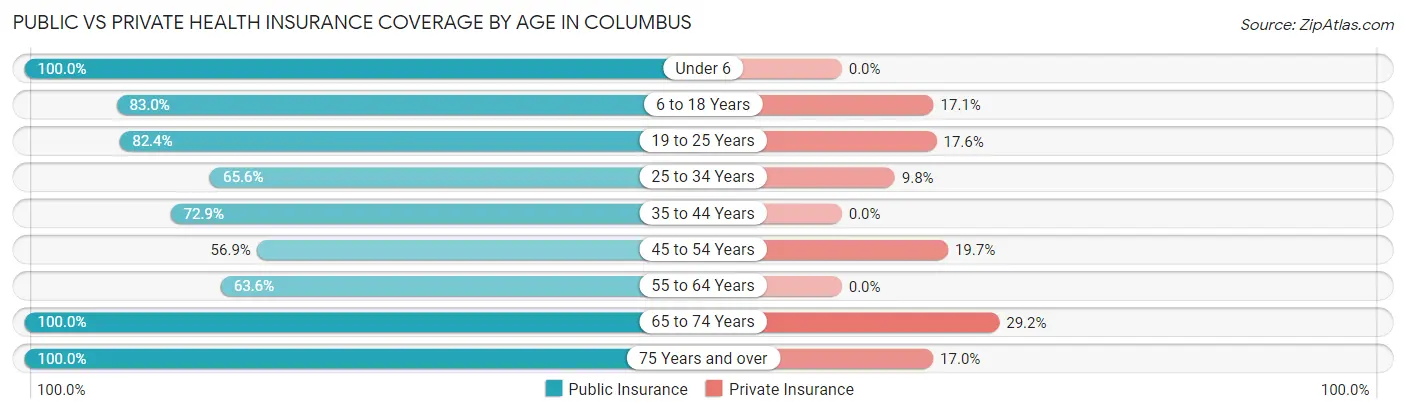
| Age Bracket | Public Insurance | Private Insurance |
| Under 6 | 42 (100.0%) | 0 (0.0%) |
| 6 to 18 Years | 326 (83.0%) | 67 (17.1%) |
| 19 to 25 Years | 75 (82.4%) | 16 (17.6%) |
| 25 to 34 Years | 120 (65.6%) | 18 (9.8%) |
| 35 to 44 Years | 78 (72.9%) | 0 (0.0%) |
| 45 to 54 Years | 78 (56.9%) | 27 (19.7%) |
| 55 to 64 Years | 96 (63.6%) | 0 (0.0%) |
| 65 to 74 Years | 65 (100.0%) | 19 (29.2%) |
| 75 Years and over | 112 (100.0%) | 19 (17.0%) |
| Total | 992 (77.4%) | 166 (13.0%) |
Disability Status by Sex by Age in Columbus
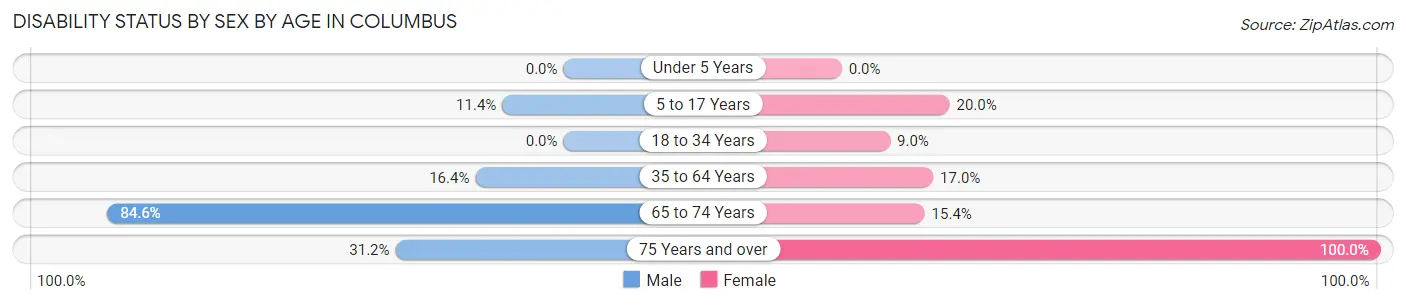
| Age Bracket | Male | Female |
| Under 5 Years | 0 (0.0%) | 0 (0.0%) |
| 5 to 17 Years | 20 (11.4%) | 48 (20.0%) |
| 18 to 34 Years | 0 (0.0%) | 14 (9.0%) |
| 35 to 64 Years | 27 (16.4%) | 39 (17.0%) |
| 65 to 74 Years | 33 (84.6%) | 4 (15.4%) |
| 75 Years and over | 29 (31.2%) | 19 (100.0%) |
Disability Class by Sex by Age in Columbus
Disability Class: Hearing Difficulty
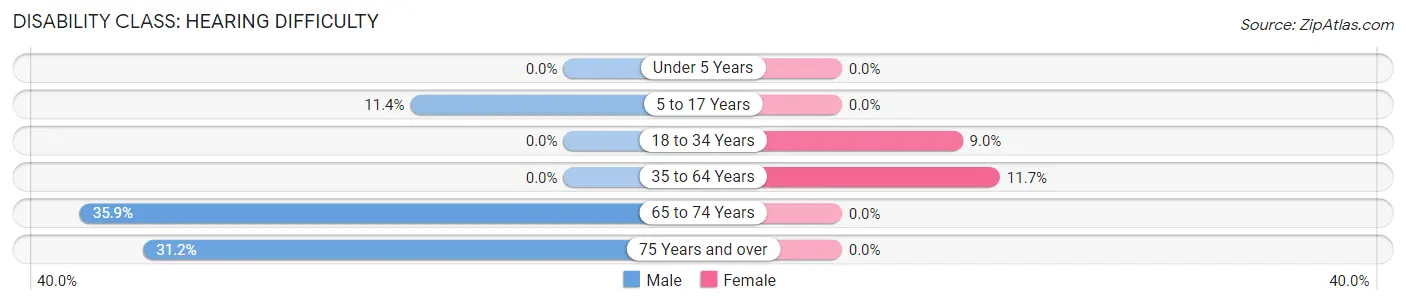
| Age Bracket | Male | Female |
| Under 5 Years | 0 (0.0%) | 0 (0.0%) |
| 5 to 17 Years | 20 (11.4%) | 0 (0.0%) |
| 18 to 34 Years | 0 (0.0%) | 14 (9.0%) |
| 35 to 64 Years | 0 (0.0%) | 27 (11.7%) |
| 65 to 74 Years | 14 (35.9%) | 0 (0.0%) |
| 75 Years and over | 29 (31.2%) | 0 (0.0%) |
Disability Class: Vision Difficulty
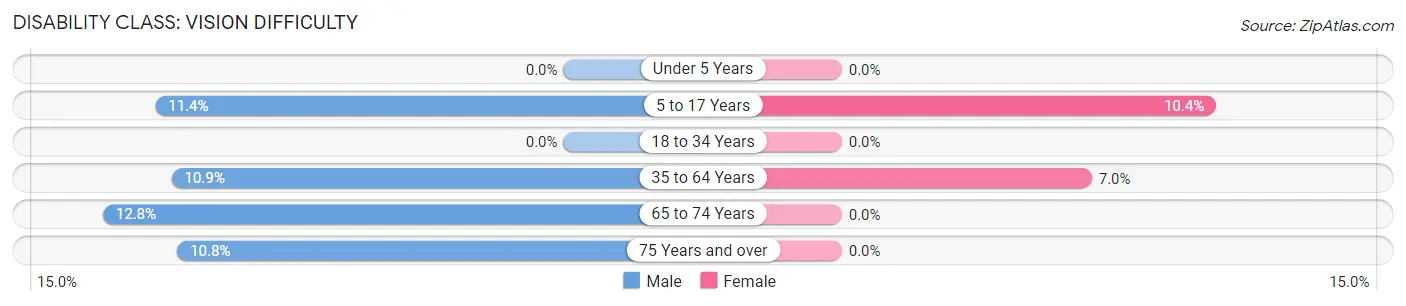
| Age Bracket | Male | Female |
| Under 5 Years | 0 (0.0%) | 0 (0.0%) |
| 5 to 17 Years | 20 (11.4%) | 25 (10.4%) |
| 18 to 34 Years | 0 (0.0%) | 0 (0.0%) |
| 35 to 64 Years | 18 (10.9%) | 16 (7.0%) |
| 65 to 74 Years | 5 (12.8%) | 0 (0.0%) |
| 75 Years and over | 10 (10.7%) | 0 (0.0%) |
Disability Class: Cognitive Difficulty
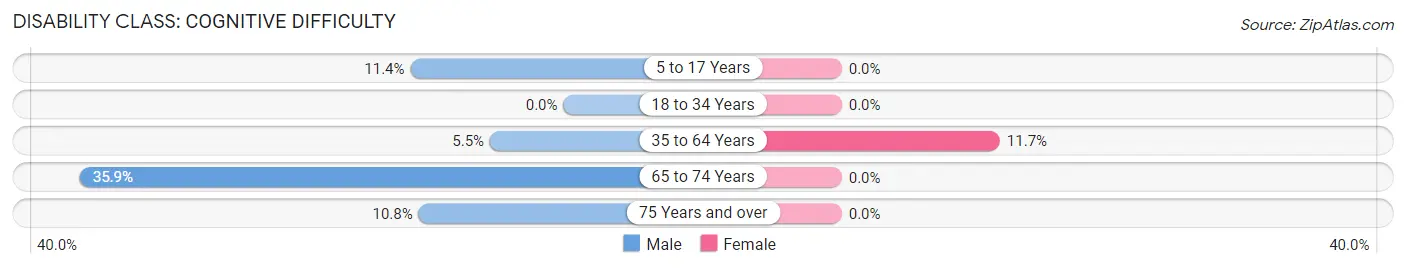
| Age Bracket | Male | Female |
| 5 to 17 Years | 20 (11.4%) | 0 (0.0%) |
| 18 to 34 Years | 0 (0.0%) | 0 (0.0%) |
| 35 to 64 Years | 9 (5.4%) | 27 (11.7%) |
| 65 to 74 Years | 14 (35.9%) | 0 (0.0%) |
| 75 Years and over | 10 (10.7%) | 0 (0.0%) |
Disability Class: Ambulatory Difficulty
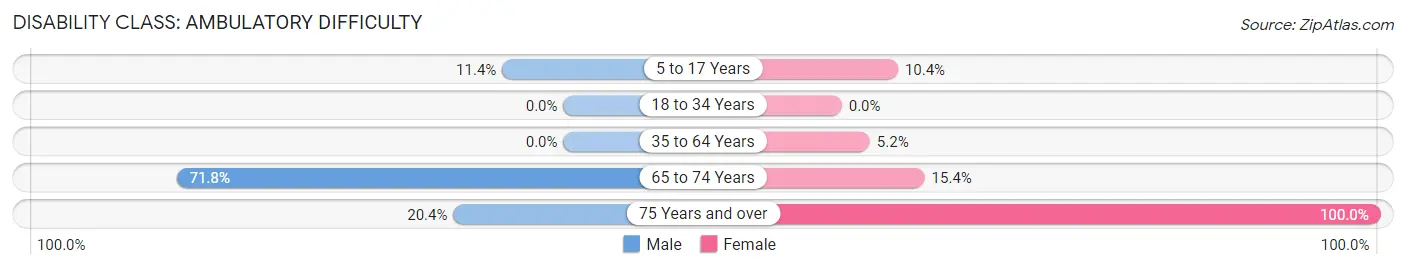
| Age Bracket | Male | Female |
| 5 to 17 Years | 20 (11.4%) | 25 (10.4%) |
| 18 to 34 Years | 0 (0.0%) | 0 (0.0%) |
| 35 to 64 Years | 0 (0.0%) | 12 (5.2%) |
| 65 to 74 Years | 28 (71.8%) | 4 (15.4%) |
| 75 Years and over | 19 (20.4%) | 19 (100.0%) |
Disability Class: Self-Care Difficulty
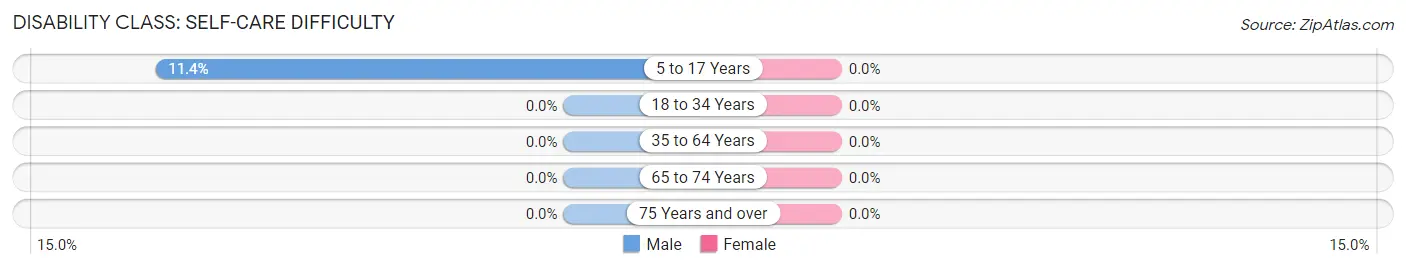
| Age Bracket | Male | Female |
| 5 to 17 Years | 20 (11.4%) | 0 (0.0%) |
| 18 to 34 Years | 0 (0.0%) | 0 (0.0%) |
| 35 to 64 Years | 0 (0.0%) | 0 (0.0%) |
| 65 to 74 Years | 0 (0.0%) | 0 (0.0%) |
| 75 Years and over | 0 (0.0%) | 0 (0.0%) |
Technology Access in Columbus
Computing Device Access in Columbus
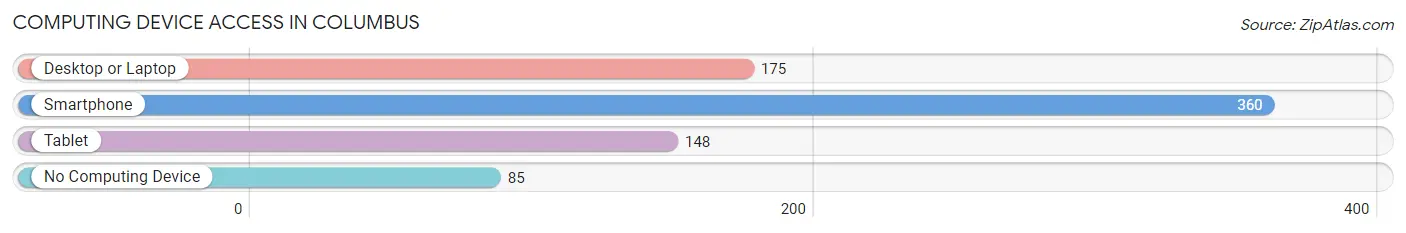
| Device Type | # Households | % Households |
| Desktop or Laptop | 175 | 39.3% |
| Smartphone | 360 | 80.9% |
| Tablet | 148 | 33.3% |
| No Computing Device | 85 | 19.1% |
| Total | 445 | 100.0% |
Internet Access in Columbus
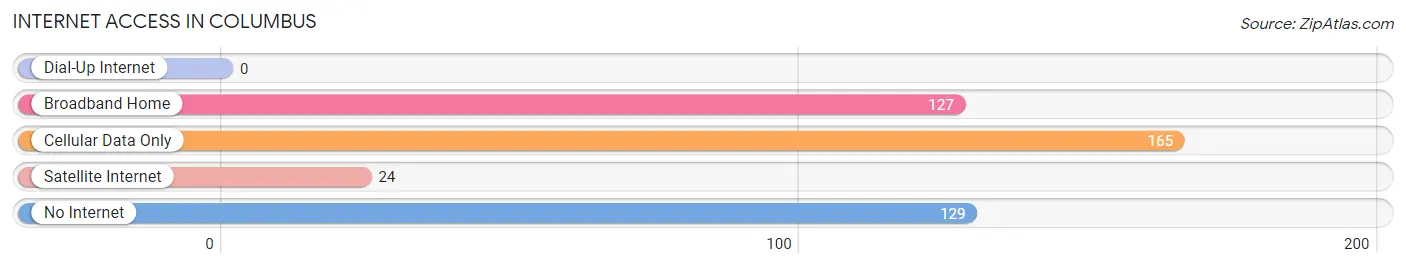
| Internet Type | # Households | % Households |
| Dial-Up Internet | 0 | 0.0% |
| Broadband Home | 127 | 28.5% |
| Cellular Data Only | 165 | 37.1% |
| Satellite Internet | 24 | 5.4% |
| No Internet | 129 | 29.0% |
| Total | 445 | 100.0% |
Columbus Summary
Columbus, New Mexico is a small town located in Luna County, in the southwestern corner of the state. It is situated on the Mexican border, just across the Rio Grande from Palomas, Mexico. The town was founded in 1891 by Colonel Columbus Smith, a former Confederate soldier, and was named after him. It is the only incorporated municipality in Luna County, and has a population of approximately 1,800 people.
History
The area around Columbus was first inhabited by the Mescalero Apache, who were later displaced by the Spanish in the late 1700s. The area was then part of Mexico until the Mexican-American War in 1848, when it became part of the United States. In 1891, Colonel Columbus Smith founded the town of Columbus, and it was incorporated in 1903.
The town was a major stop on the El Paso and Southwestern Railroad, and was a popular destination for tourists and travelers. It was also a major trading center for the region, and was known for its saloons and gambling halls.
In 1916, the town was the site of the Battle of Columbus, a raid by Mexican revolutionary Pancho Villa. The raid resulted in the deaths of 18 American soldiers, and the town was burned to the ground. The town was rebuilt, and the ruins of the old buildings can still be seen today.
Geography
Columbus is located in the Chihuahuan Desert, at an elevation of 3,845 feet. The town is situated on the banks of the Rio Grande, and is surrounded by the Organ Mountains to the east and the Florida Mountains to the west. The climate is arid and semi-arid, with hot summers and mild winters.
Economy
The economy of Columbus is largely based on agriculture and tourism. The town is home to several farms and ranches, and is a popular destination for birdwatchers and other nature enthusiasts. The town also has a small manufacturing sector, and is home to several small businesses.
Demographics
As of the 2010 census, the population of Columbus was 1,765. The racial makeup of the town was 75.3% White, 0.7% African American, 0.7% Native American, 0.2% Asian, 0.1% Pacific Islander, 20.2% from other races, and 2.9% from two or more races. Hispanic or Latino of any race were 81.3% of the population.
The median income for a household in the town was $20,972, and the median income for a family was $25,000. The per capita income for the town was $10,945. About 24.3% of families and 28.2% of the population were below the poverty line, including 37.2% of those under age 18 and 15.2% of those age 65 or over.
Conclusion
Columbus, New Mexico is a small town located in Luna County, on the Mexican border. It was founded in 1891 by Colonel Columbus Smith, and was the site of the Battle of Columbus in 1916. The town has a population of approximately 1,800 people, and the economy is largely based on agriculture and tourism. The racial makeup of the town is predominantly Hispanic or Latino, and the median income for a household is $20,972. Columbus is a popular destination for birdwatchers and other nature enthusiasts, and is home to several small businesses.
Common Questions
What is Per Capita Income in Columbus?
Per Capita income in Columbus is $14,725.
What is the Median Family Income in Columbus?
Median Family Income in Columbus is $30,031.
What is the Median Household income in Columbus?
Median Household Income in Columbus is $26,549.
What is Income or Wage Gap in Columbus?
Income or Wage Gap in Columbus is 57.6%.
Women in Columbus earn 42.4 cents for every dollar earned by a man.
What is Inequality or Gini Index in Columbus?
Inequality or Gini Index in Columbus is 0.43.
What is the Total Population of Columbus?
Total Population of Columbus is 1,281.
What is the Total Male Population of Columbus?
Total Male Population of Columbus is 610.
What is the Total Female Population of Columbus?
Total Female Population of Columbus is 671.
What is the Ratio of Males per 100 Females in Columbus?
There are 90.91 Males per 100 Females in Columbus.
What is the Ratio of Females per 100 Males in Columbus?
There are 110.00 Females per 100 Males in Columbus.
What is the Median Population Age in Columbus?
Median Population Age in Columbus is 31.4 Years.
What is the Average Family Size in Columbus
Average Family Size in Columbus is 3.7 People.
What is the Average Household Size in Columbus
Average Household Size in Columbus is 2.9 People.
How Large is the Labor Force in Columbus?
There are 474 People in the Labor Forcein in Columbus.
What is the Percentage of People in the Labor Force in Columbus?
51.5% of People are in the Labor Force in Columbus.
What is the Unemployment Rate in Columbus?
Unemployment Rate in Columbus is 13.7%.