Dona Ana, NM Map & Demographics
Dona Ana Overview
$15,466
PER CAPITA INCOME
$26,223
AVG HOUSEHOLD INCOME
22.4%
WAGE / INCOME GAP [ % ]
77.6¢/ $1
WAGE / INCOME GAP [ $ ]
$4,797
FAMILY INCOME DEFICIT
0.40
INEQUALITY / GINI INDEX
1,344
TOTAL POPULATION
692
MALE POPULATION
652
FEMALE POPULATION
106.13
MALES / 100 FEMALES
94.22
FEMALES / 100 MALES
42.9
MEDIAN AGE
3.4
AVG FAMILY SIZE
2.9
AVG HOUSEHOLD SIZE
536
LABOR FORCE [ PEOPLE ]
52.2%
PERCENT IN LABOR FORCE
Dona Ana Area Codes
Income in Dona Ana
Income Overview in Dona Ana
| Characteristic | Number | Measure |
| Per Capita Income | 1,344 | $15,466 |
| Median Family Income | 375 | $0 |
| Mean Family Income | 375 | $49,776 |
| Median Household Income | 463 | $26,223 |
| Mean Household Income | 463 | $43,620 |
| Income Deficit | 375 | $4,797 |
| Wage / Income Gap (%) | 1,344 | 22.38% |
| Wage / Income Gap ($) | 1,344 | 77.62¢ per $1 |
| Gini / Inequality Index | 1,344 | 0.40 |
Earnings by Sex in Dona Ana
Average Earnings in Dona Ana are $27,500, $29,583 for men and $22,962 for women, a difference of 22.4%.
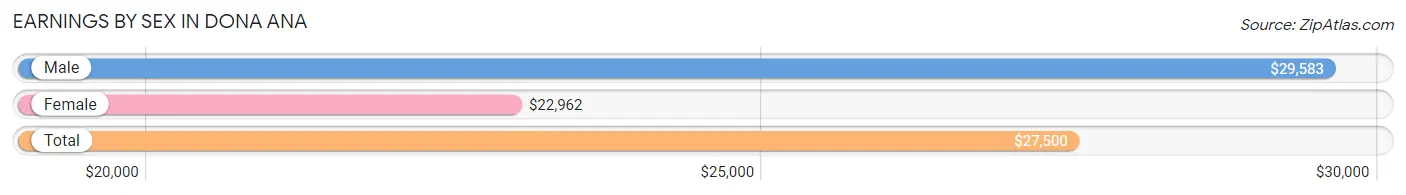
| Sex | Number | Average Earnings |
| Male | 303 (56.5%) | $29,583 |
| Female | 233 (43.5%) | $22,962 |
| Total | 536 (100.0%) | $27,500 |
Earnings by Sex by Income Bracket in Dona Ana
The most common earnings brackets in Dona Ana are $30,000 to $34,999 for men (118 | 38.9%) and $20,000 to $22,499 for women (63 | 27.0%).
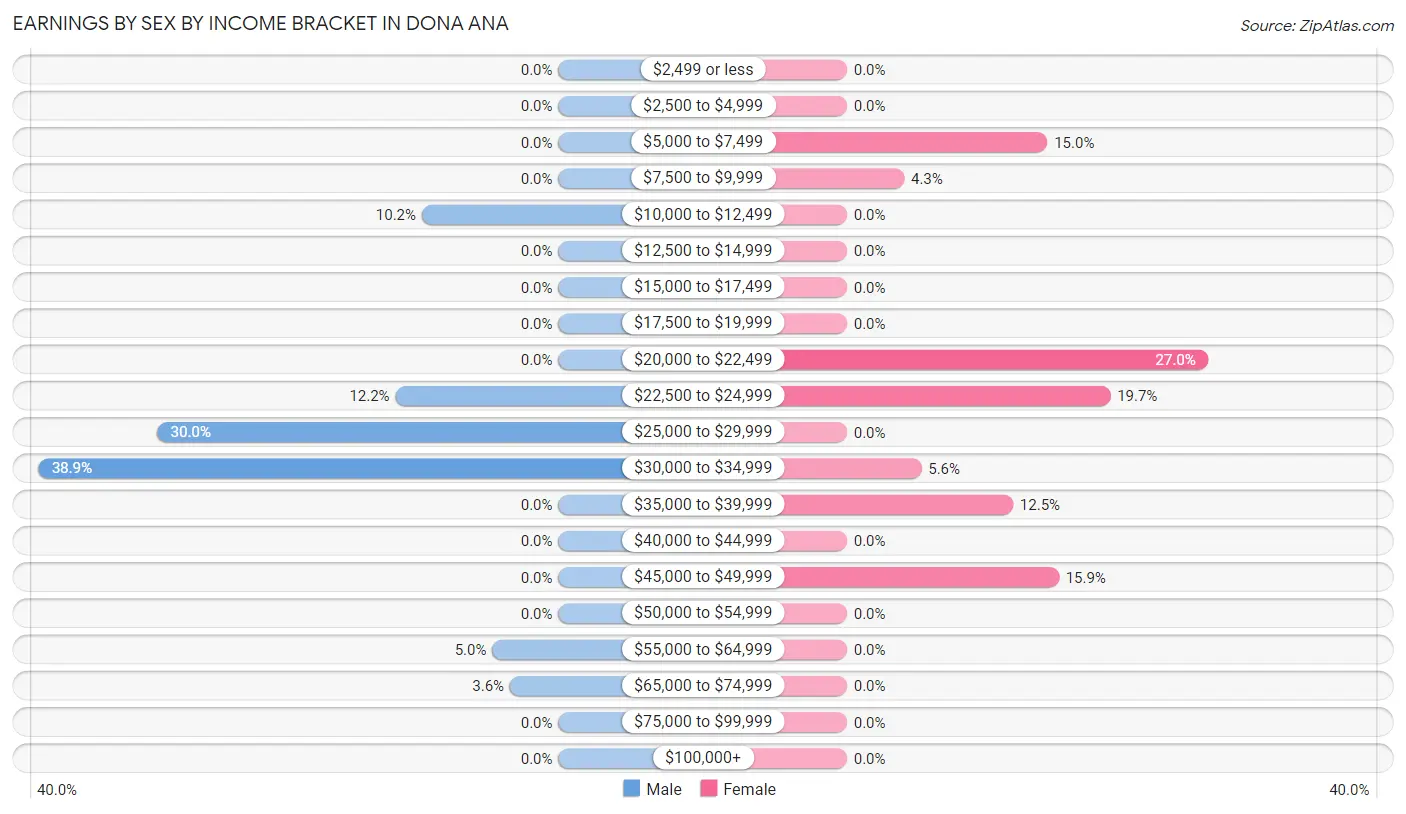
| Income | Male | Female |
| $2,499 or less | 0 (0.0%) | 0 (0.0%) |
| $2,500 to $4,999 | 0 (0.0%) | 0 (0.0%) |
| $5,000 to $7,499 | 0 (0.0%) | 35 (15.0%) |
| $7,500 to $9,999 | 0 (0.0%) | 10 (4.3%) |
| $10,000 to $12,499 | 31 (10.2%) | 0 (0.0%) |
| $12,500 to $14,999 | 0 (0.0%) | 0 (0.0%) |
| $15,000 to $17,499 | 0 (0.0%) | 0 (0.0%) |
| $17,500 to $19,999 | 0 (0.0%) | 0 (0.0%) |
| $20,000 to $22,499 | 0 (0.0%) | 63 (27.0%) |
| $22,500 to $24,999 | 37 (12.2%) | 46 (19.7%) |
| $25,000 to $29,999 | 91 (30.0%) | 0 (0.0%) |
| $30,000 to $34,999 | 118 (38.9%) | 13 (5.6%) |
| $35,000 to $39,999 | 0 (0.0%) | 29 (12.4%) |
| $40,000 to $44,999 | 0 (0.0%) | 0 (0.0%) |
| $45,000 to $49,999 | 0 (0.0%) | 37 (15.9%) |
| $50,000 to $54,999 | 0 (0.0%) | 0 (0.0%) |
| $55,000 to $64,999 | 15 (5.0%) | 0 (0.0%) |
| $65,000 to $74,999 | 11 (3.6%) | 0 (0.0%) |
| $75,000 to $99,999 | 0 (0.0%) | 0 (0.0%) |
| $100,000+ | 0 (0.0%) | 0 (0.0%) |
| Total | 303 (100.0%) | 233 (100.0%) |
Earnings by Sex by Educational Attainment in Dona Ana
Average earnings in Dona Ana are $32,818 for men and $22,962 for women, a difference of 30.0%. Men with an educational attainment of college or associate's degree enjoy the highest average annual earnings of $60,917, while those with less than high school education earn the least with $26,875. Women with an educational attainment of less than high school earn the most with the average annual earnings of $23,804, while those with college or associate's degree education have the smallest earnings of $21,627.
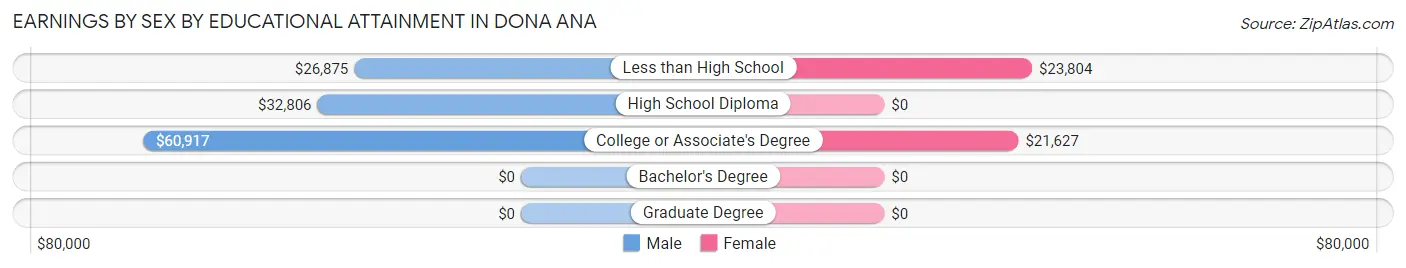
| Educational Attainment | Male Income | Female Income |
| Less than High School | $26,875 | $23,804 |
| High School Diploma | $32,806 | $0 |
| College or Associate's Degree | $60,917 | $21,627 |
| Bachelor's Degree | - | - |
| Graduate Degree | - | - |
| Total | $32,818 | $22,962 |
Family Income in Dona Ana
Family Income Brackets in Dona Ana
According to the Dona Ana family income data, there are 108 families falling into the $15,000 to $24,999 income range, which is the most common income bracket and makes up 28.8% of all families.
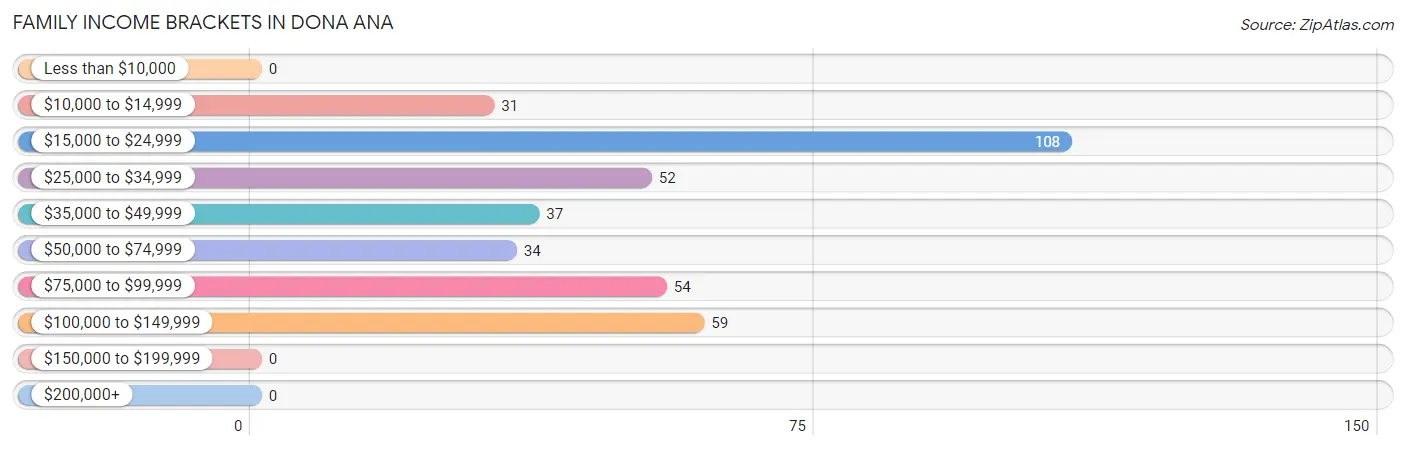
| Income Bracket | # Families | % Families |
| Less than $10,000 | 0 | 0.0% |
| $10,000 to $14,999 | 31 | 8.3% |
| $15,000 to $24,999 | 108 | 28.8% |
| $25,000 to $34,999 | 52 | 13.9% |
| $35,000 to $49,999 | 37 | 9.9% |
| $50,000 to $74,999 | 34 | 9.1% |
| $75,000 to $99,999 | 54 | 14.4% |
| $100,000 to $149,999 | 59 | 15.7% |
| $150,000 to $199,999 | 0 | 0.0% |
| $200,000+ | 0 | 0.0% |
Family Income by Famaliy Size in Dona Ana
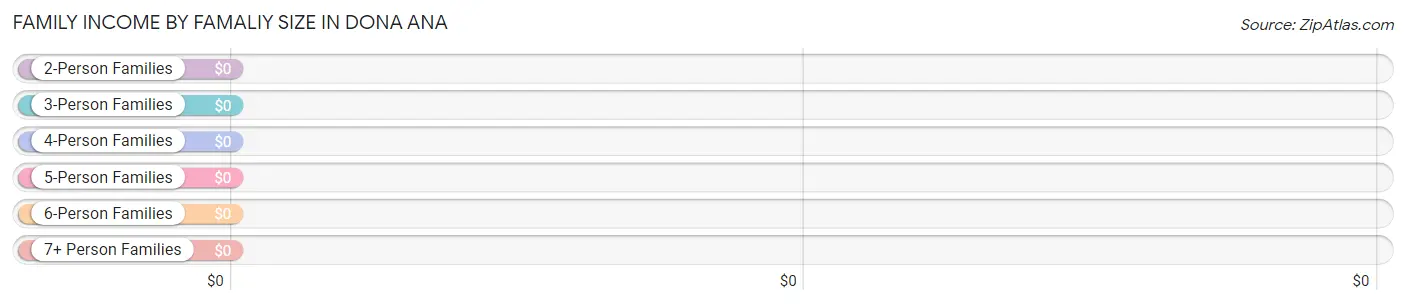
| Income Bracket | # Families | Median Income |
| 2-Person Families | 173 (46.1%) | $0 |
| 3-Person Families | 123 (32.8%) | $0 |
| 4-Person Families | 73 (19.5%) | $0 |
| 5-Person Families | 6 (1.6%) | $0 |
| 6-Person Families | 0 (0.0%) | $0 |
| 7+ Person Families | 0 (0.0%) | $0 |
| Total | 375 (100.0%) | $0 |
Family Income by Number of Earners in Dona Ana
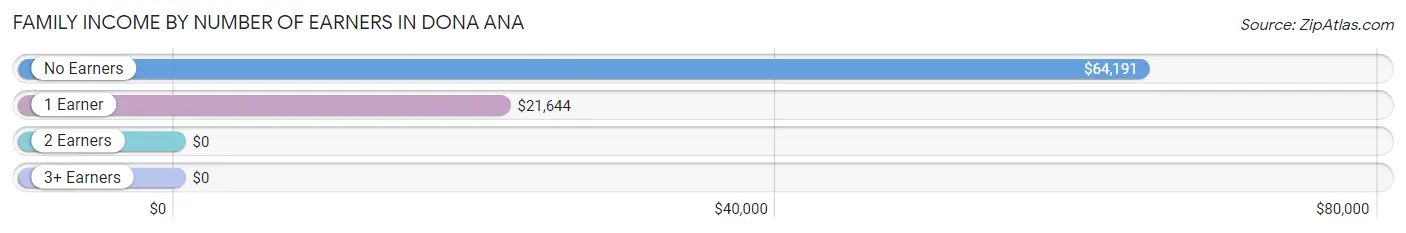
| Number of Earners | # Families | Median Income |
| No Earners | 46 (12.3%) | $64,191 |
| 1 Earner | 228 (60.8%) | $21,644 |
| 2 Earners | 24 (6.4%) | $0 |
| 3+ Earners | 77 (20.5%) | $0 |
| Total | 375 (100.0%) | $0 |
Household Income in Dona Ana
Household Income Brackets in Dona Ana
With 124 households falling in the category, the $15,000 to $24,999 income range is the most frequent in Dona Ana, accounting for 26.8% of all households.
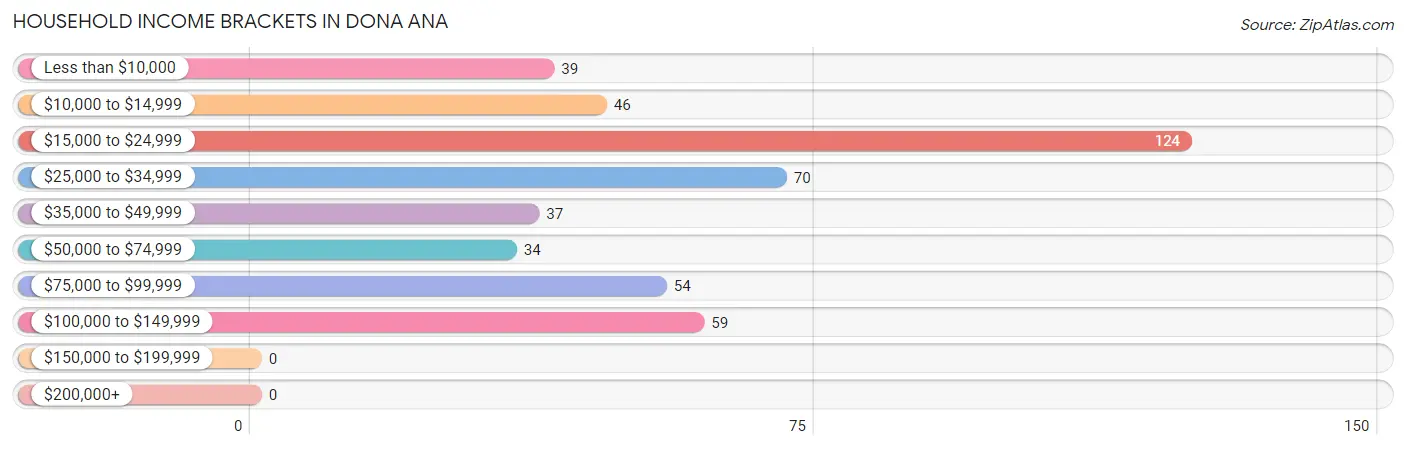
| Income Bracket | # Households | % Households |
| Less than $10,000 | 39 | 8.4% |
| $10,000 to $14,999 | 46 | 9.9% |
| $15,000 to $24,999 | 124 | 26.8% |
| $25,000 to $34,999 | 70 | 15.1% |
| $35,000 to $49,999 | 37 | 8.0% |
| $50,000 to $74,999 | 34 | 7.3% |
| $75,000 to $99,999 | 54 | 11.7% |
| $100,000 to $149,999 | 59 | 12.7% |
| $150,000 to $199,999 | 0 | 0.0% |
| $200,000+ | 0 | 0.0% |
Household Income by Householder Age in Dona Ana
| Income Bracket | # Households | Median Income |
| 15 to 24 Years | 0 (0.0%) | $0 |
| 25 to 44 Years | 171 (36.9%) | $0 |
| 45 to 64 Years | 139 (30.0%) | $0 |
| 65+ Years | 153 (33.1%) | $0 |
| Total | 463 (100.0%) | $26,223 |
Poverty in Dona Ana
Income Below Poverty by Sex and Age in Dona Ana
With 41.5% poverty level for males and 62.6% for females among the residents of Dona Ana, 6 to 11 year old males and 5 year old females are the most vulnerable to poverty, with 50 males (100.0%) and 64 females (100.0%) in their respective age groups living below the poverty level.
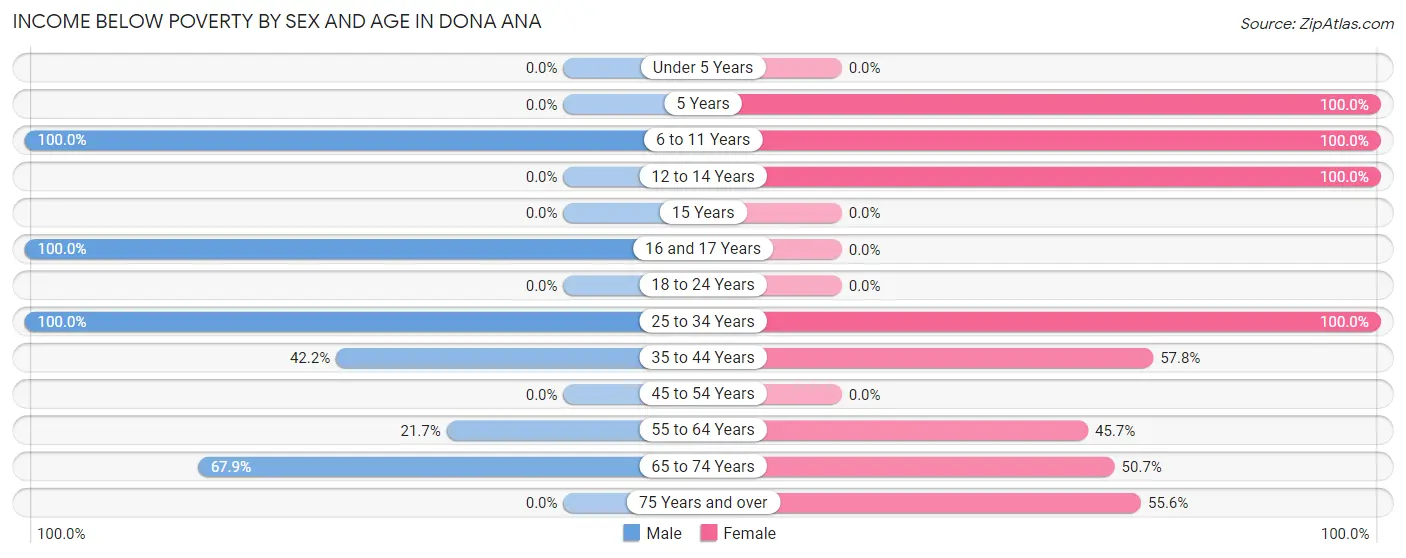
| Age Bracket | Male | Female |
| Under 5 Years | 0 (0.0%) | 0 (0.0%) |
| 5 Years | 0 (0.0%) | 64 (100.0%) |
| 6 to 11 Years | 50 (100.0%) | 86 (100.0%) |
| 12 to 14 Years | 0 (0.0%) | 71 (100.0%) |
| 15 Years | 0 (0.0%) | 0 (0.0%) |
| 16 and 17 Years | 80 (100.0%) | 0 (0.0%) |
| 18 to 24 Years | 0 (0.0%) | 0 (0.0%) |
| 25 to 34 Years | 15 (100.0%) | 6 (100.0%) |
| 35 to 44 Years | 73 (42.2%) | 63 (57.8%) |
| 45 to 54 Years | 0 (0.0%) | 0 (0.0%) |
| 55 to 64 Years | 31 (21.7%) | 64 (45.7%) |
| 65 to 74 Years | 38 (67.9%) | 39 (50.6%) |
| 75 Years and over | 0 (0.0%) | 15 (55.6%) |
| Total | 287 (41.5%) | 408 (62.6%) |
Income Above Poverty by Sex and Age in Dona Ana
According to the poverty statistics in Dona Ana, males aged under 5 years and females aged 18 to 24 years are the age groups that are most secure financially, with 100.0% of males and 100.0% of females in these age groups living above the poverty line.
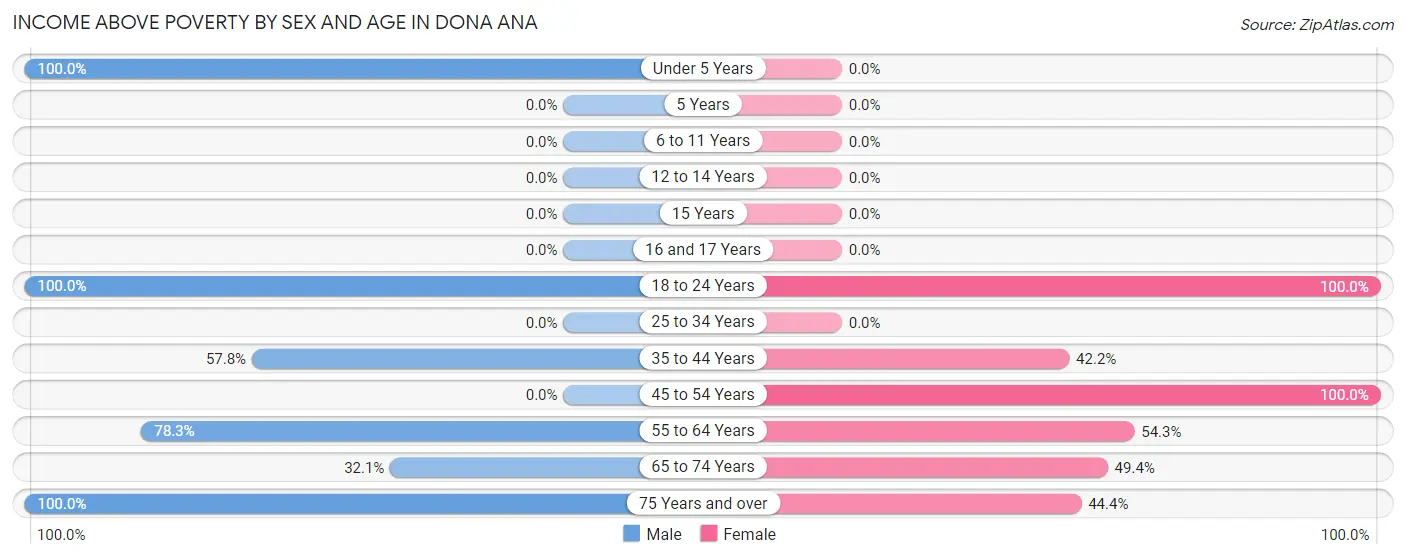
| Age Bracket | Male | Female |
| Under 5 Years | 46 (100.0%) | 0 (0.0%) |
| 5 Years | 0 (0.0%) | 0 (0.0%) |
| 6 to 11 Years | 0 (0.0%) | 0 (0.0%) |
| 12 to 14 Years | 0 (0.0%) | 0 (0.0%) |
| 15 Years | 0 (0.0%) | 0 (0.0%) |
| 16 and 17 Years | 0 (0.0%) | 0 (0.0%) |
| 18 to 24 Years | 45 (100.0%) | 59 (100.0%) |
| 25 to 34 Years | 0 (0.0%) | 0 (0.0%) |
| 35 to 44 Years | 100 (57.8%) | 46 (42.2%) |
| 45 to 54 Years | 0 (0.0%) | 13 (100.0%) |
| 55 to 64 Years | 112 (78.3%) | 76 (54.3%) |
| 65 to 74 Years | 18 (32.1%) | 38 (49.3%) |
| 75 Years and over | 84 (100.0%) | 12 (44.4%) |
| Total | 405 (58.5%) | 244 (37.4%) |
Income Below Poverty Among Married-Couple Families in Dona Ana
The poverty statistics for married-couple families in Dona Ana show that 42.9% or 145 of the total 338 families live below the poverty line. Families with 3 or 4 children have the highest poverty rate of 100.0%, comprising of 6 families. On the other hand, families with no children have the lowest poverty rate of 31.0%, which includes 66 families.
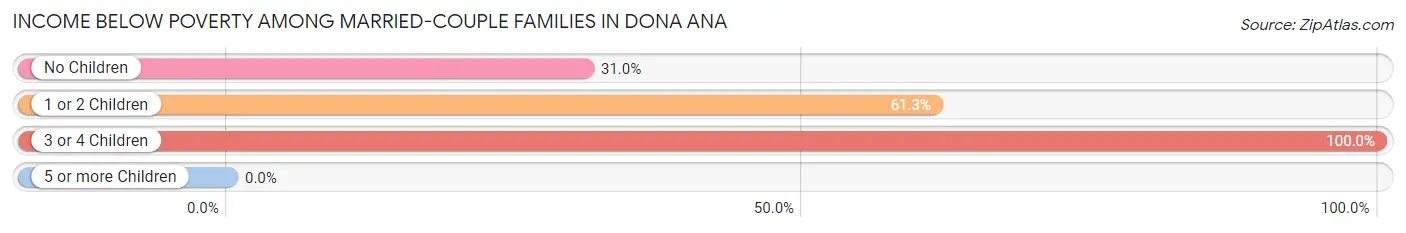
| Children | Above Poverty | Below Poverty |
| No Children | 147 (69.0%) | 66 (31.0%) |
| 1 or 2 Children | 46 (38.7%) | 73 (61.3%) |
| 3 or 4 Children | 0 (0.0%) | 6 (100.0%) |
| 5 or more Children | 0 (0.0%) | 0 (0.0%) |
| Total | 193 (57.1%) | 145 (42.9%) |
Income Below Poverty Among Single-Parent Households in Dona Ana
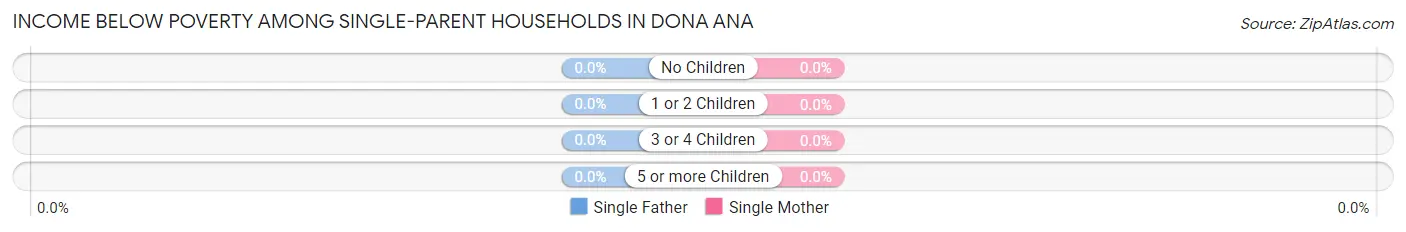
| Children | Single Father | Single Mother |
| No Children | 0 (0.0%) | 0 (0.0%) |
| 1 or 2 Children | 0 (0.0%) | 0 (0.0%) |
| 3 or 4 Children | 0 (0.0%) | 0 (0.0%) |
| 5 or more Children | 0 (0.0%) | 0 (0.0%) |
| Total | 0 (0.0%) | 0 (0.0%) |
Income Below Poverty Among Married-Couple vs Single-Parent Households in Dona Ana
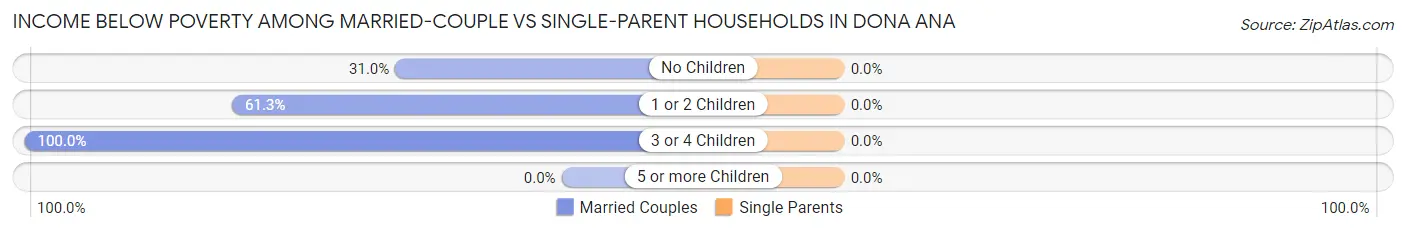
| Children | Married-Couple Families | Single-Parent Households |
| No Children | 66 (31.0%) | 0 (0.0%) |
| 1 or 2 Children | 73 (61.3%) | 0 (0.0%) |
| 3 or 4 Children | 6 (100.0%) | 0 (0.0%) |
| 5 or more Children | 0 (0.0%) | 0 (0.0%) |
| Total | 145 (42.9%) | 0 (0.0%) |
Race in Dona Ana
The most populous races in Dona Ana are Hispanic or Latino (1,287 | 95.8%), White / Caucasian (990 | 73.7%), and Some other Race (290 | 21.6%).
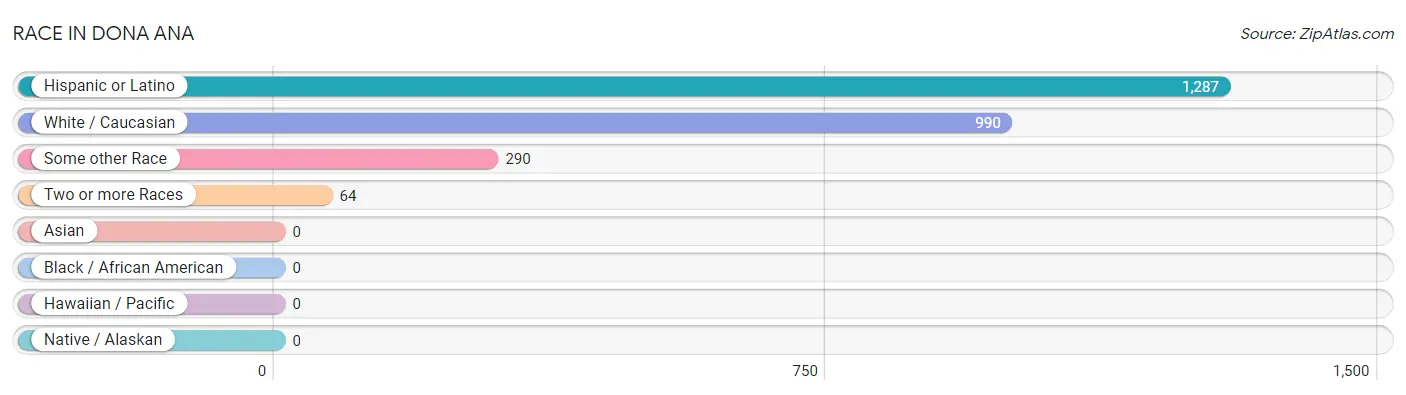
| Race | # Population | % Population |
| Asian | 0 | 0.0% |
| Black / African American | 0 | 0.0% |
| Hawaiian / Pacific | 0 | 0.0% |
| Hispanic or Latino | 1,287 | 95.8% |
| Native / Alaskan | 0 | 0.0% |
| White / Caucasian | 990 | 73.7% |
| Two or more Races | 64 | 4.8% |
| Some other Race | 290 | 21.6% |
| Total | 1,344 | 100.0% |
Ancestry in Dona Ana
The most populous ancestries reported in Dona Ana are Mexican (794 | 59.1%), Central American (206 | 15.3%), Guatemalan (206 | 15.3%), German (34 | 2.5%), and Italian (34 | 2.5%), together accounting for 94.8% of all Dona Ana residents.
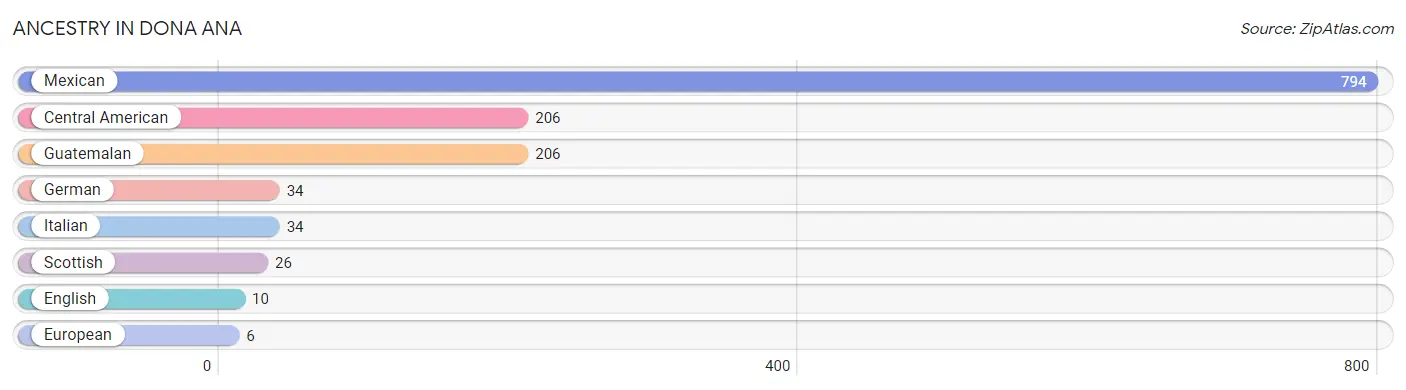
| Ancestry | # Population | % Population |
| Central American | 206 | 15.3% |
| English | 10 | 0.7% |
| European | 6 | 0.4% |
| German | 34 | 2.5% |
| Guatemalan | 206 | 15.3% |
| Italian | 34 | 2.5% |
| Mexican | 794 | 59.1% |
| Scottish | 26 | 1.9% | View All 8 Rows |
Immigrants in Dona Ana
The most numerous immigrant groups reported in Dona Ana came from Central America (366 | 27.2%), Latin America (366 | 27.2%), Mexico (360 | 26.8%), and Guatemala (6 | 0.4%), together accounting for 81.7% of all Dona Ana residents.
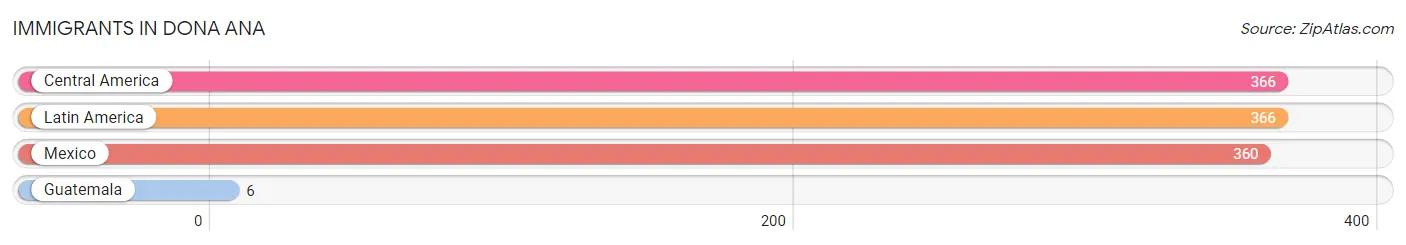
| Immigration Origin | # Population | % Population |
| Central America | 366 | 27.2% |
| Guatemala | 6 | 0.4% |
| Latin America | 366 | 27.2% |
| Mexico | 360 | 26.8% | View All 4 Rows |
Sex and Age in Dona Ana
Sex and Age in Dona Ana
The most populous age groups in Dona Ana are 55 to 59 Years (143 | 20.7%) for men and 5 to 9 Years (150 | 23.0%) for women.
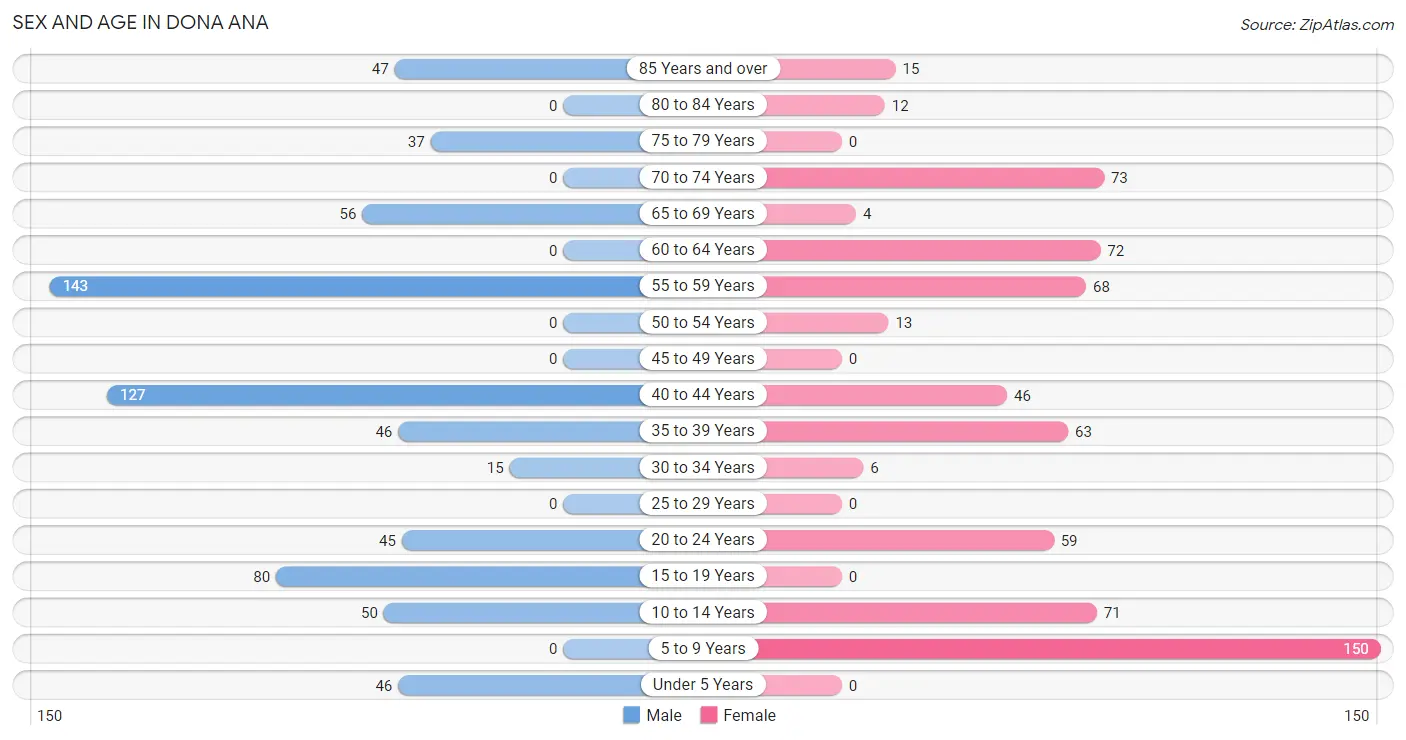
| Age Bracket | Male | Female |
| Under 5 Years | 46 (6.7%) | 0 (0.0%) |
| 5 to 9 Years | 0 (0.0%) | 150 (23.0%) |
| 10 to 14 Years | 50 (7.2%) | 71 (10.9%) |
| 15 to 19 Years | 80 (11.6%) | 0 (0.0%) |
| 20 to 24 Years | 45 (6.5%) | 59 (9.0%) |
| 25 to 29 Years | 0 (0.0%) | 0 (0.0%) |
| 30 to 34 Years | 15 (2.2%) | 6 (0.9%) |
| 35 to 39 Years | 46 (6.7%) | 63 (9.7%) |
| 40 to 44 Years | 127 (18.3%) | 46 (7.1%) |
| 45 to 49 Years | 0 (0.0%) | 0 (0.0%) |
| 50 to 54 Years | 0 (0.0%) | 13 (2.0%) |
| 55 to 59 Years | 143 (20.7%) | 68 (10.4%) |
| 60 to 64 Years | 0 (0.0%) | 72 (11.0%) |
| 65 to 69 Years | 56 (8.1%) | 4 (0.6%) |
| 70 to 74 Years | 0 (0.0%) | 73 (11.2%) |
| 75 to 79 Years | 37 (5.3%) | 0 (0.0%) |
| 80 to 84 Years | 0 (0.0%) | 12 (1.8%) |
| 85 Years and over | 47 (6.8%) | 15 (2.3%) |
| Total | 692 (100.0%) | 652 (100.0%) |
Families and Households in Dona Ana
Median Family Size in Dona Ana
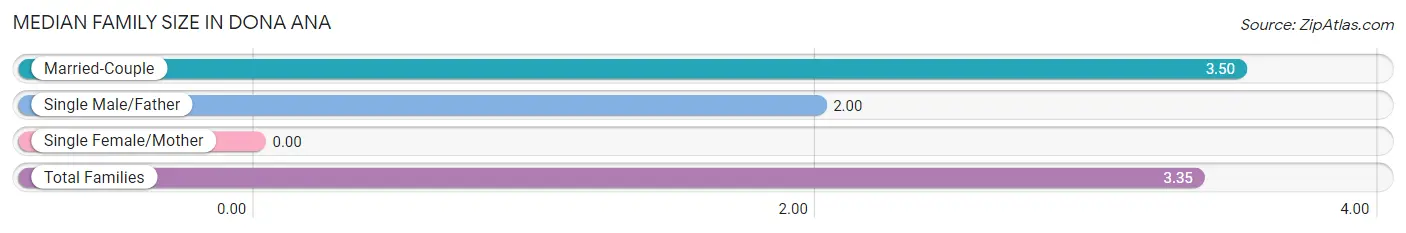
| Family Type | # Families | Family Size |
| Married-Couple | 338 (90.1%) | 3.50 |
| Single Male/Father | 37 (9.9%) | 2.00 |
| Single Female/Mother | 0 (0.0%) | - |
| Total Families | 375 (100.0%) | 3.35 |
Median Household Size in Dona Ana
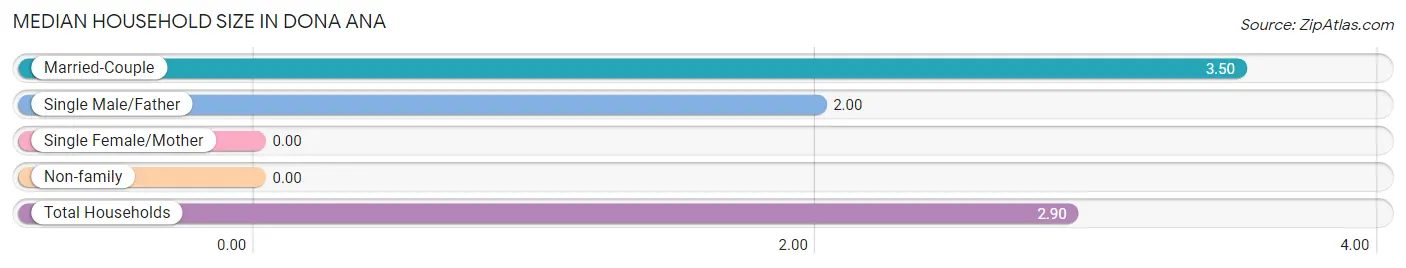
| Household Type | # Households | Household Size |
| Married-Couple | 338 (73.0%) | 3.50 |
| Single Male/Father | 37 (8.0%) | 2.00 |
| Single Female/Mother | 0 (0.0%) | - |
| Non-family | 88 (19.0%) | - |
| Total Households | 463 (100.0%) | 2.90 |
Household Size by Marriage Status in Dona Ana
Out of a total of 463 households in Dona Ana, 375 (81.0%) are family households, while 88 (19.0%) are nonfamily households. The most numerous type of family households are 2-person households, comprising 173, and the most common type of nonfamily households are 1-person households, comprising 88.
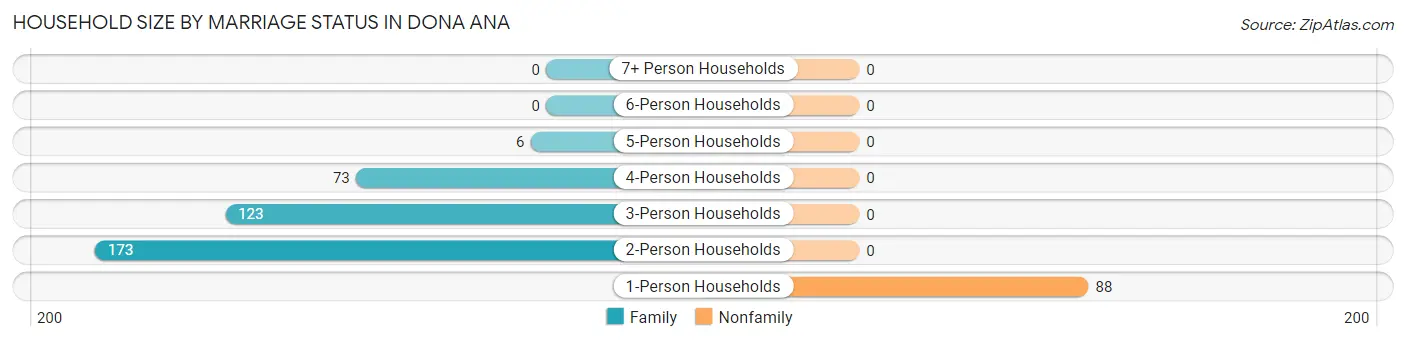
| Household Size | Family Households | Nonfamily Households |
| 1-Person Households | - | 88 (19.0%) |
| 2-Person Households | 173 (37.4%) | 0 (0.0%) |
| 3-Person Households | 123 (26.6%) | 0 (0.0%) |
| 4-Person Households | 73 (15.8%) | 0 (0.0%) |
| 5-Person Households | 6 (1.3%) | 0 (0.0%) |
| 6-Person Households | 0 (0.0%) | 0 (0.0%) |
| 7+ Person Households | 0 (0.0%) | 0 (0.0%) |
| Total | 375 (81.0%) | 88 (19.0%) |
Female Fertility in Dona Ana
Fertility by Age in Dona Ana
| Age Bracket | Women with Births | Births / 1,000 Women |
| 15 to 19 years | 0 (0.0%) | 0.0 |
| 20 to 34 years | 0 (0.0%) | 0.0 |
| 35 to 50 years | 0 (0.0%) | 0.0 |
| Total | 0 (0.0%) | 0.0 |
Fertility by Age by Marriage Status in Dona Ana
| Age Bracket | Married | Unmarried |
| 15 to 19 years | 0 (0.0%) | 0 (0.0%) |
| 20 to 34 years | 0 (0.0%) | 0 (0.0%) |
| 35 to 50 years | 0 (0.0%) | 0 (0.0%) |
| Total | 0 (0.0%) | 0 (0.0%) |
Fertility by Education in Dona Ana

| Educational Attainment | Women with Births | Births / 1,000 Women |
| Less than High School | 0 (0.0%) | 0.0 |
| High School Diploma | 0 (0.0%) | 0.0 |
| College or Associate's Degree | 0 (0.0%) | 0.0 |
| Bachelor's Degree | 0 (0.0%) | 0.0 |
| Graduate Degree | 0 (0.0%) | 0.0 |
| Total | 0 (0.0%) | 0.0 |
Fertility by Education by Marriage Status in Dona Ana
| Educational Attainment | Married | Unmarried |
| Less than High School | 0 (0.0%) | 0 (0.0%) |
| High School Diploma | 0 (0.0%) | 0 (0.0%) |
| College or Associate's Degree | 0 (0.0%) | 0 (0.0%) |
| Bachelor's Degree | 0 (0.0%) | 0 (0.0%) |
| Graduate Degree | 0 (0.0%) | 0 (0.0%) |
| Total | 0 (0.0%) | 0 (0.0%) |
Employment Characteristics in Dona Ana
Employment by Class of Employer in Dona Ana
Among the 515 employed individuals in Dona Ana, private company employees (380 | 73.8%), self-employed (not incorporated) (120 | 23.3%), and state government employees (15 | 2.9%) make up the most common classes of employment.
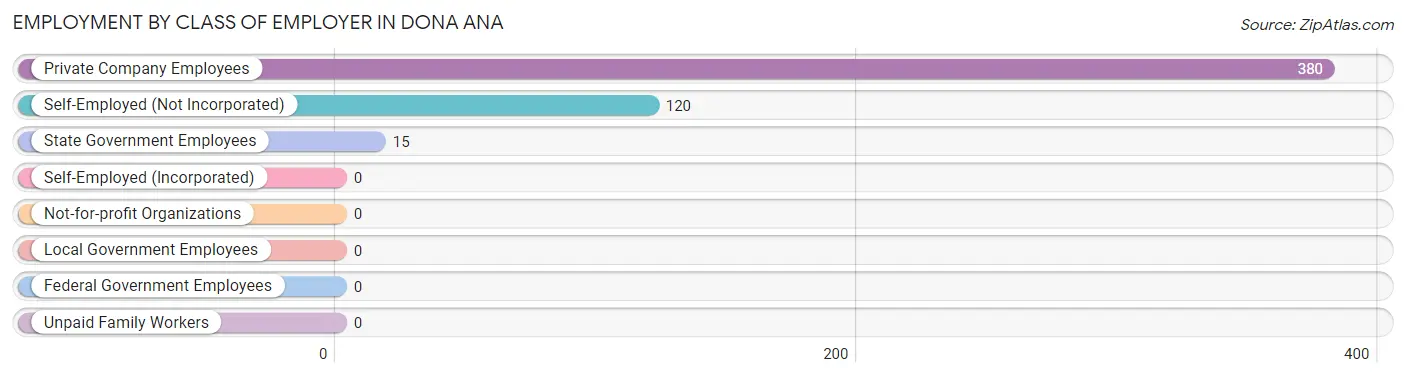
| Employer Class | # Employees | % Employees |
| Private Company Employees | 380 | 73.8% |
| Self-Employed (Incorporated) | 0 | 0.0% |
| Self-Employed (Not Incorporated) | 120 | 23.3% |
| Not-for-profit Organizations | 0 | 0.0% |
| Local Government Employees | 0 | 0.0% |
| State Government Employees | 15 | 2.9% |
| Federal Government Employees | 0 | 0.0% |
| Unpaid Family Workers | 0 | 0.0% |
| Total | 515 | 100.0% |
Employment Status by Age in Dona Ana
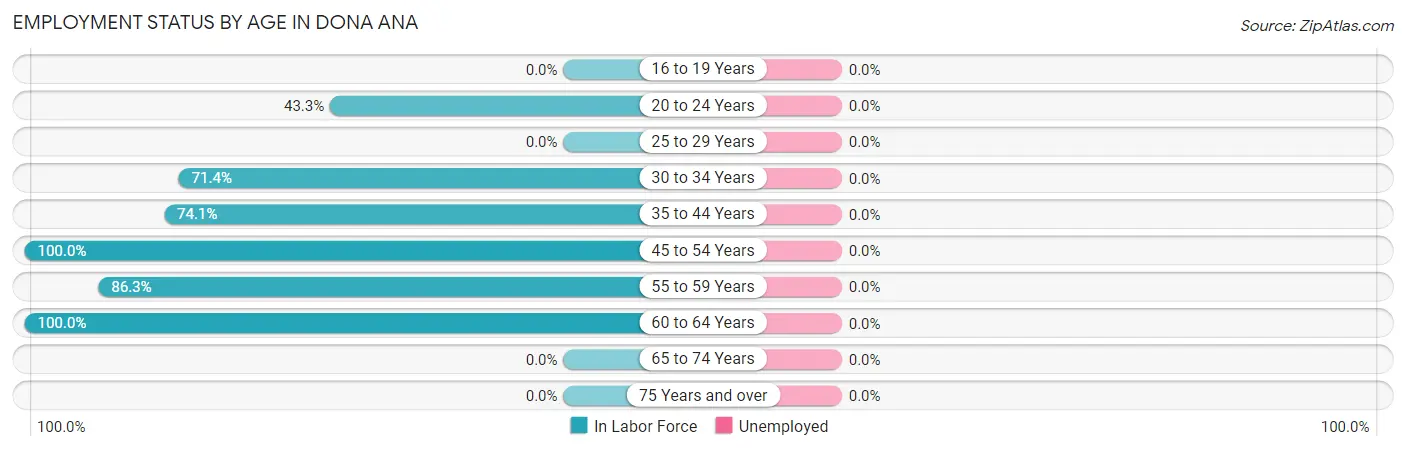
| Age Bracket | In Labor Force | Unemployed |
| 16 to 19 Years | 0 (0.0%) | 0 (0.0%) |
| 20 to 24 Years | 45 (43.3%) | 0 (0.0%) |
| 25 to 29 Years | 0 (0.0%) | 0 (0.0%) |
| 30 to 34 Years | 15 (71.4%) | 0 (0.0%) |
| 35 to 44 Years | 209 (74.1%) | 0 (0.0%) |
| 45 to 54 Years | 13 (100.0%) | 0 (0.0%) |
| 55 to 59 Years | 182 (86.3%) | 0 (0.0%) |
| 60 to 64 Years | 72 (100.0%) | 0 (0.0%) |
| 65 to 74 Years | 0 (0.0%) | 0 (0.0%) |
| 75 Years and over | 0 (0.0%) | 0 (0.0%) |
| Total | 536 (52.2%) | 0 (0.0%) |
Employment Status by Educational Attainment in Dona Ana
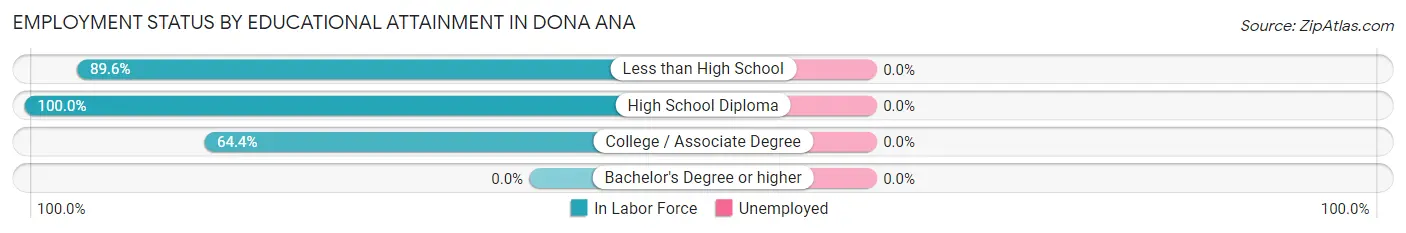
| Educational Attainment | In Labor Force | Unemployed |
| Less than High School | 249 (89.6%) | 0 (0.0%) |
| High School Diploma | 99 (100.0%) | 0 (0.0%) |
| College / Associate Degree | 143 (64.4%) | 0 (0.0%) |
| Bachelor's Degree or higher | 0 (0.0%) | 0 (0.0%) |
| Total | 491 (82.0%) | 0 (0.0%) |
Employment Occupations by Sex in Dona Ana
Management, Business, Science and Arts Occupations
The most common Management, Business, Science and Arts occupations in Dona Ana are Health Diagnosing & Treating (11 | 2.1%), and Health Technologists (11 | 2.1%).
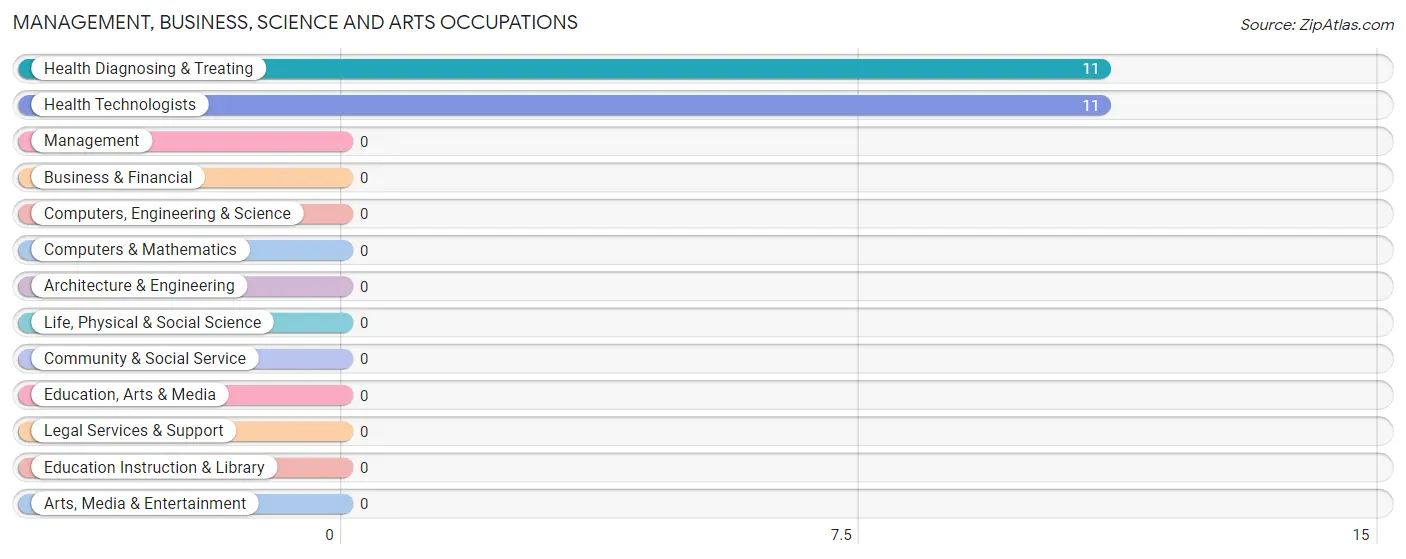
Management, Business, Science and Arts Occupations by Sex
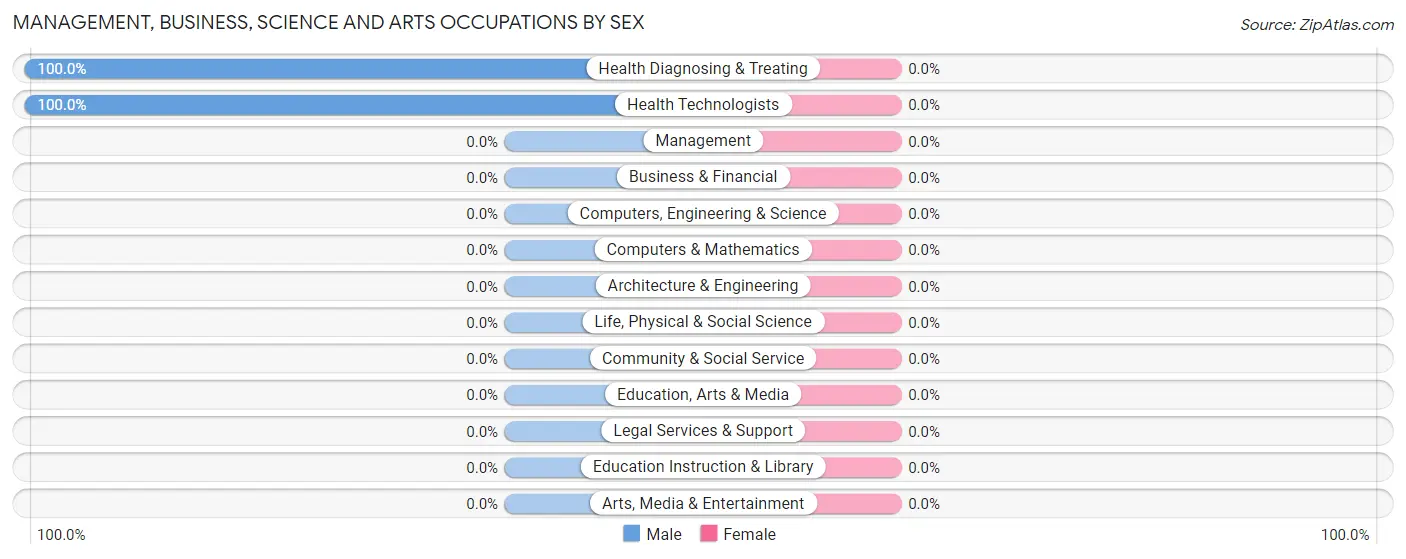
| Occupation | Male | Female |
| Management | 0 (0.0%) | 0 (0.0%) |
| Business & Financial | 0 (0.0%) | 0 (0.0%) |
| Computers, Engineering & Science | 0 (0.0%) | 0 (0.0%) |
| Computers & Mathematics | 0 (0.0%) | 0 (0.0%) |
| Architecture & Engineering | 0 (0.0%) | 0 (0.0%) |
| Life, Physical & Social Science | 0 (0.0%) | 0 (0.0%) |
| Community & Social Service | 0 (0.0%) | 0 (0.0%) |
| Education, Arts & Media | 0 (0.0%) | 0 (0.0%) |
| Legal Services & Support | 0 (0.0%) | 0 (0.0%) |
| Education Instruction & Library | 0 (0.0%) | 0 (0.0%) |
| Arts, Media & Entertainment | 0 (0.0%) | 0 (0.0%) |
| Health Diagnosing & Treating | 11 (100.0%) | 0 (0.0%) |
| Health Technologists | 11 (100.0%) | 0 (0.0%) |
| Total (Category) | 11 (100.0%) | 0 (0.0%) |
| Total (Overall) | 303 (56.5%) | 233 (43.5%) |
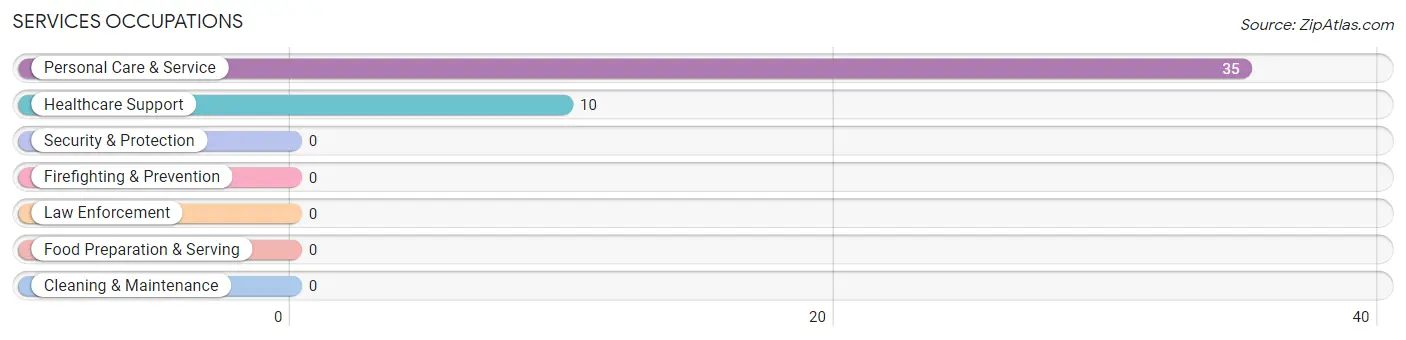
Services Occupations
The most common Services occupations in Dona Ana are Personal Care & Service (35 | 6.5%), and Healthcare Support (10 | 1.9%).
Services Occupations by Sex
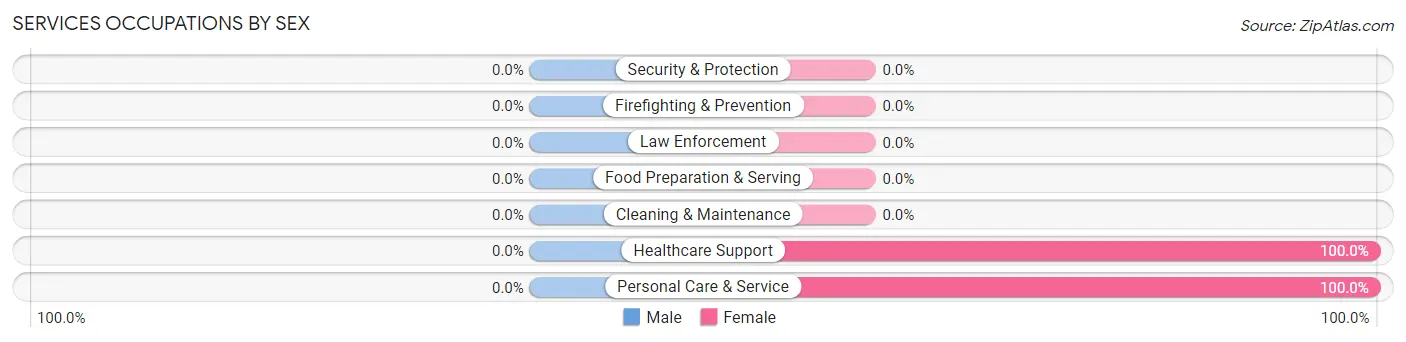
| Occupation | Male | Female |
| Healthcare Support | 0 (0.0%) | 10 (100.0%) |
| Security & Protection | 0 (0.0%) | 0 (0.0%) |
| Firefighting & Prevention | 0 (0.0%) | 0 (0.0%) |
| Law Enforcement | 0 (0.0%) | 0 (0.0%) |
| Food Preparation & Serving | 0 (0.0%) | 0 (0.0%) |
| Cleaning & Maintenance | 0 (0.0%) | 0 (0.0%) |
| Personal Care & Service | 0 (0.0%) | 35 (100.0%) |
| Total (Category) | 0 (0.0%) | 45 (100.0%) |
| Total (Overall) | 303 (56.5%) | 233 (43.5%) |
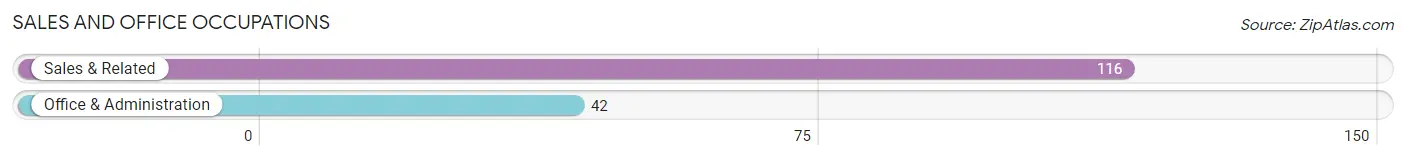
Sales and Office Occupations
The most common Sales and Office occupations in Dona Ana are Sales & Related (116 | 21.6%), and Office & Administration (42 | 7.8%).
Sales and Office Occupations by Sex
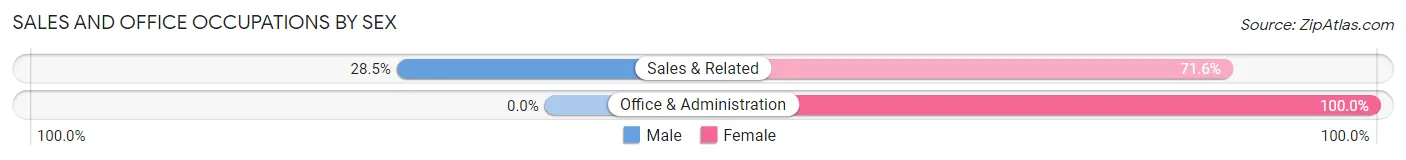
| Occupation | Male | Female |
| Sales & Related | 33 (28.4%) | 83 (71.6%) |
| Office & Administration | 0 (0.0%) | 42 (100.0%) |
| Total (Category) | 33 (20.9%) | 125 (79.1%) |
| Total (Overall) | 303 (56.5%) | 233 (43.5%) |
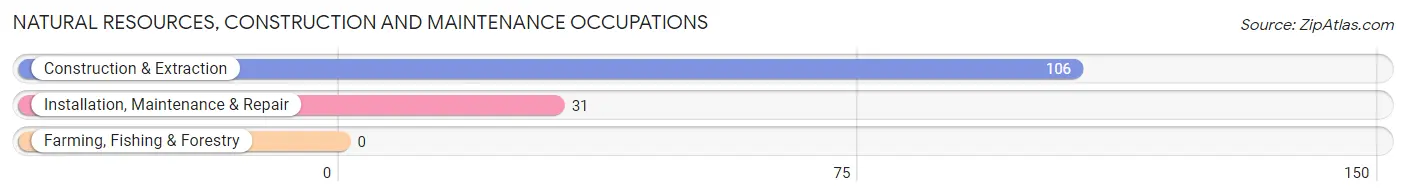
Natural Resources, Construction and Maintenance Occupations
The most common Natural Resources, Construction and Maintenance occupations in Dona Ana are Construction & Extraction (106 | 19.8%), and Installation, Maintenance & Repair (31 | 5.8%).
Natural Resources, Construction and Maintenance Occupations by Sex
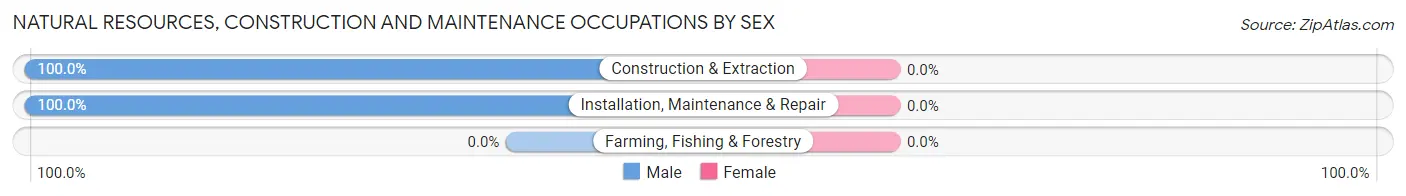
| Occupation | Male | Female |
| Farming, Fishing & Forestry | 0 (0.0%) | 0 (0.0%) |
| Construction & Extraction | 106 (100.0%) | 0 (0.0%) |
| Installation, Maintenance & Repair | 31 (100.0%) | 0 (0.0%) |
| Total (Category) | 137 (100.0%) | 0 (0.0%) |
| Total (Overall) | 303 (56.5%) | 233 (43.5%) |
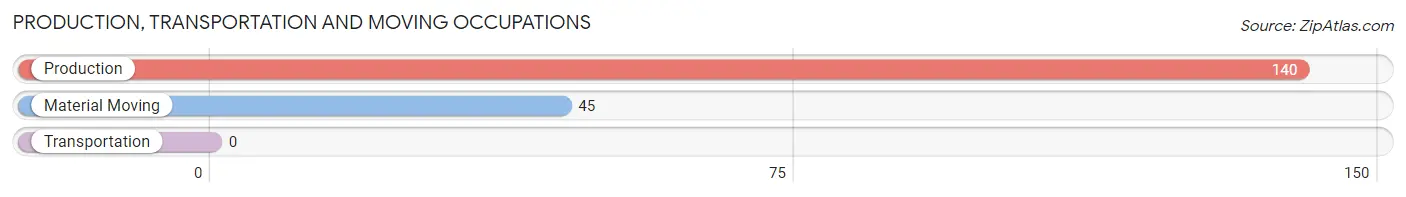
Production, Transportation and Moving Occupations
The most common Production, Transportation and Moving occupations in Dona Ana are Production (140 | 26.1%), and Material Moving (45 | 8.4%).
Production, Transportation and Moving Occupations by Sex
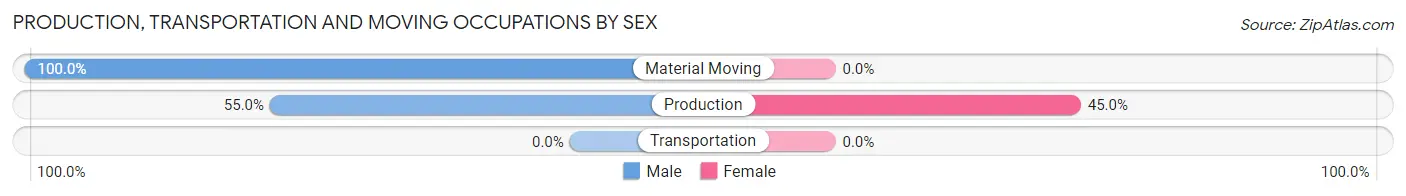
| Occupation | Male | Female |
| Production | 77 (55.0%) | 63 (45.0%) |
| Transportation | 0 (0.0%) | 0 (0.0%) |
| Material Moving | 45 (100.0%) | 0 (0.0%) |
| Total (Category) | 122 (65.9%) | 63 (34.1%) |
| Total (Overall) | 303 (56.5%) | 233 (43.5%) |
Employment Industries by Sex in Dona Ana
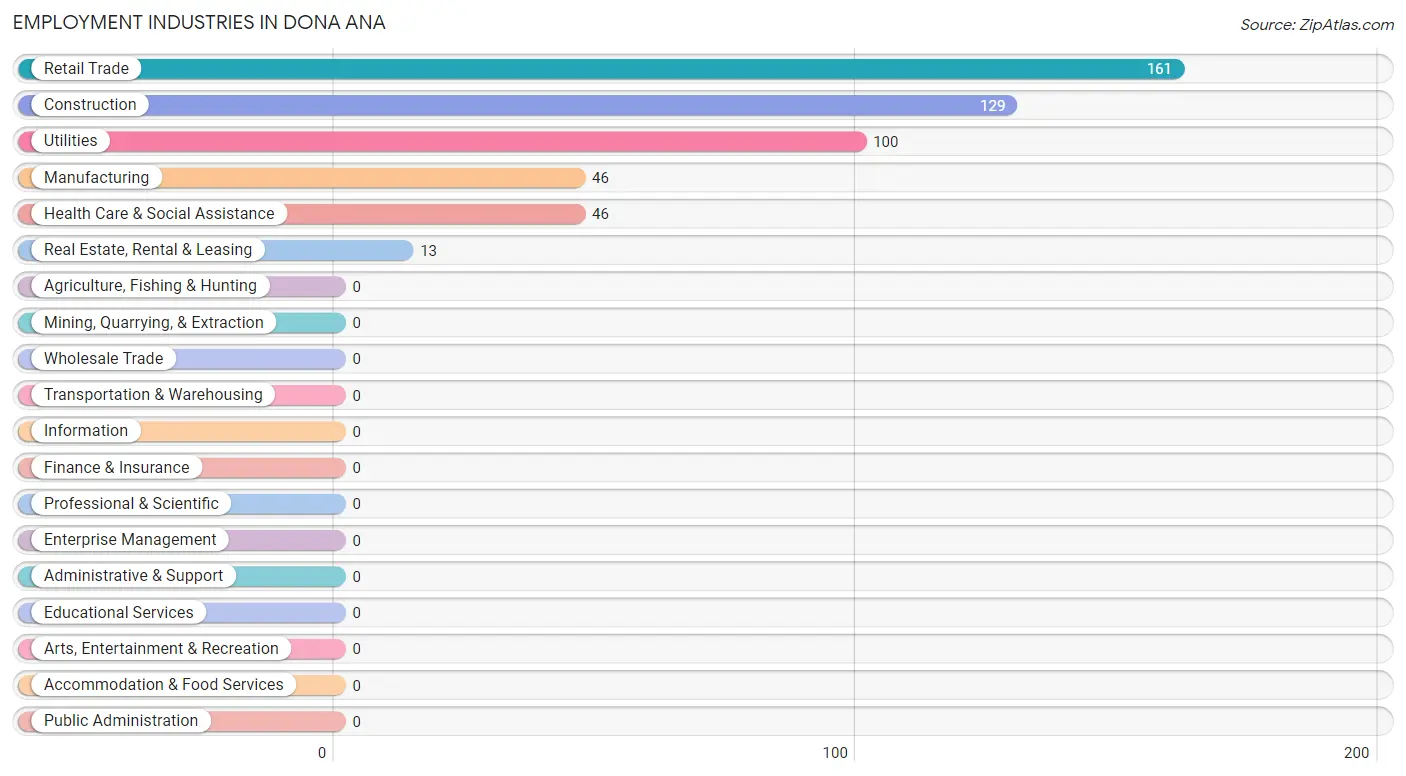
Employment Industries in Dona Ana
The major employment industries in Dona Ana include Retail Trade (161 | 30.0%), Construction (129 | 24.1%), Utilities (100 | 18.7%), Manufacturing (46 | 8.6%), and Health Care & Social Assistance (46 | 8.6%).
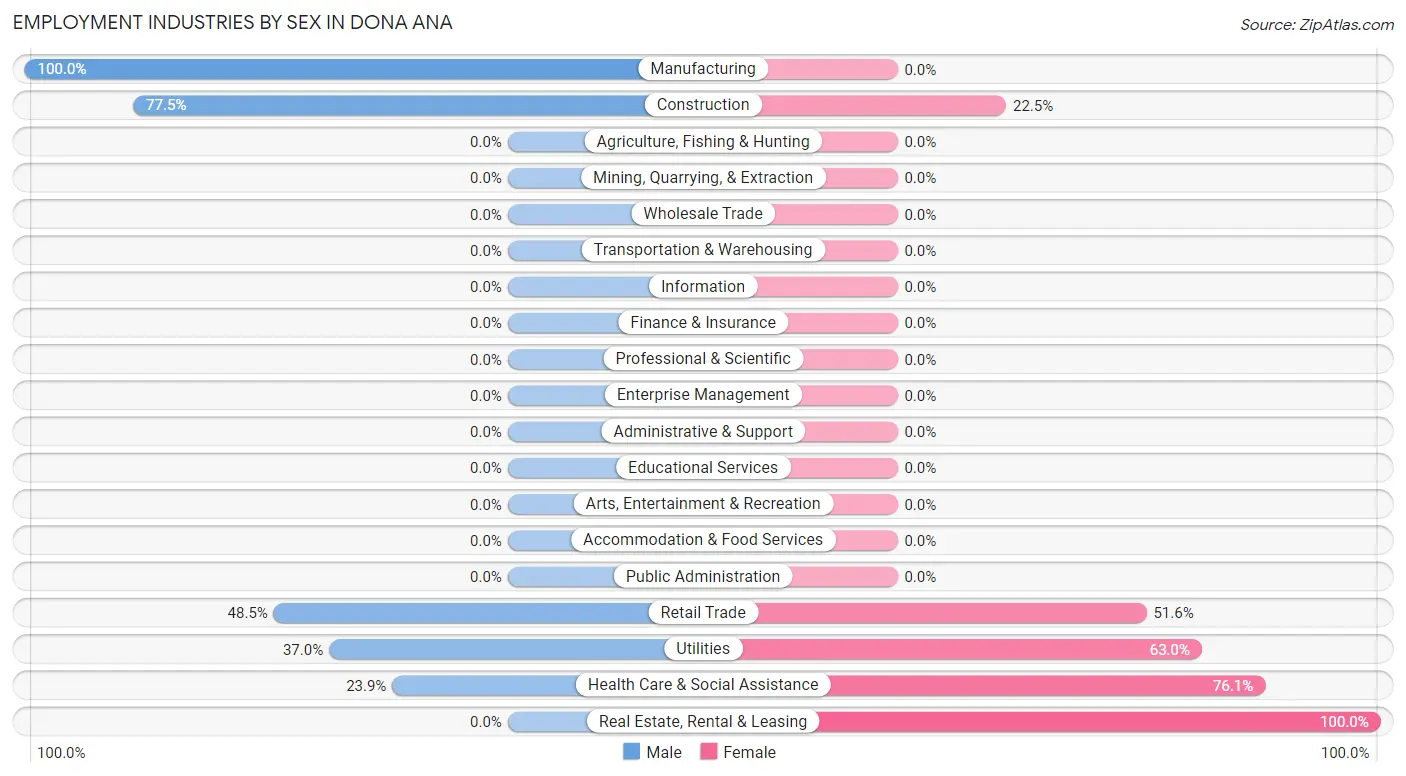
Employment Industries by Sex in Dona Ana
The Dona Ana industries that see more men than women are Manufacturing (100.0%), Construction (77.5%), and Retail Trade (48.4%), whereas the industries that tend to have a higher number of women are Real Estate, Rental & Leasing (100.0%), Health Care & Social Assistance (76.1%), and Utilities (63.0%).
| Industry | Male | Female |
| Agriculture, Fishing & Hunting | 0 (0.0%) | 0 (0.0%) |
| Mining, Quarrying, & Extraction | 0 (0.0%) | 0 (0.0%) |
| Construction | 100 (77.5%) | 29 (22.5%) |
| Manufacturing | 46 (100.0%) | 0 (0.0%) |
| Wholesale Trade | 0 (0.0%) | 0 (0.0%) |
| Retail Trade | 78 (48.4%) | 83 (51.5%) |
| Transportation & Warehousing | 0 (0.0%) | 0 (0.0%) |
| Utilities | 37 (37.0%) | 63 (63.0%) |
| Information | 0 (0.0%) | 0 (0.0%) |
| Finance & Insurance | 0 (0.0%) | 0 (0.0%) |
| Real Estate, Rental & Leasing | 0 (0.0%) | 13 (100.0%) |
| Professional & Scientific | 0 (0.0%) | 0 (0.0%) |
| Enterprise Management | 0 (0.0%) | 0 (0.0%) |
| Administrative & Support | 0 (0.0%) | 0 (0.0%) |
| Educational Services | 0 (0.0%) | 0 (0.0%) |
| Health Care & Social Assistance | 11 (23.9%) | 35 (76.1%) |
| Arts, Entertainment & Recreation | 0 (0.0%) | 0 (0.0%) |
| Accommodation & Food Services | 0 (0.0%) | 0 (0.0%) |
| Public Administration | 0 (0.0%) | 0 (0.0%) |
| Total | 303 (56.5%) | 233 (43.5%) |
Education in Dona Ana
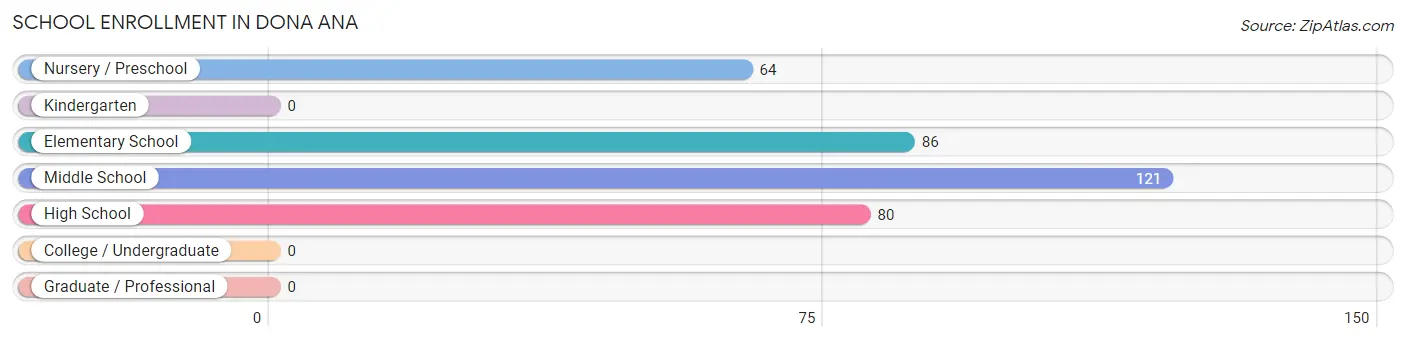
School Enrollment in Dona Ana
The most common levels of schooling among the 351 students in Dona Ana are middle school (121 | 34.5%), elementary school (86 | 24.5%), and high school (80 | 22.8%).
| School Level | # Students | % Students |
| Nursery / Preschool | 64 | 18.2% |
| Kindergarten | 0 | 0.0% |
| Elementary School | 86 | 24.5% |
| Middle School | 121 | 34.5% |
| High School | 80 | 22.8% |
| College / Undergraduate | 0 | 0.0% |
| Graduate / Professional | 0 | 0.0% |
| Total | 351 | 100.0% |
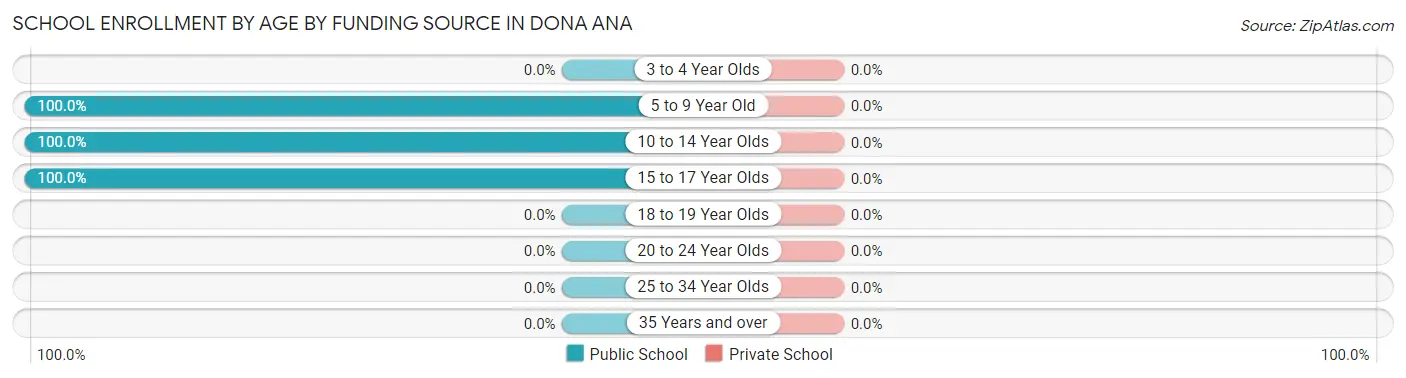
School Enrollment by Age by Funding Source in Dona Ana
| Age Bracket | Public School | Private School |
| 3 to 4 Year Olds | 0 (0.0%) | 0 (0.0%) |
| 5 to 9 Year Old | 150 (100.0%) | 0 (0.0%) |
| 10 to 14 Year Olds | 121 (100.0%) | 0 (0.0%) |
| 15 to 17 Year Olds | 80 (100.0%) | 0 (0.0%) |
| 18 to 19 Year Olds | 0 (0.0%) | 0 (0.0%) |
| 20 to 24 Year Olds | 0 (0.0%) | 0 (0.0%) |
| 25 to 34 Year Olds | 0 (0.0%) | 0 (0.0%) |
| 35 Years and over | 0 (0.0%) | 0 (0.0%) |
| Total | 351 (100.0%) | 0 (0.0%) |
Educational Attainment by Field of Study in Dona Ana
Education (10 | 62.5%), bio, nature & agricultural (4 | 25.0%), and engineering (2 | 12.5%) are the most common fields of study among 16 individuals in Dona Ana who have obtained a bachelor's degree or higher.
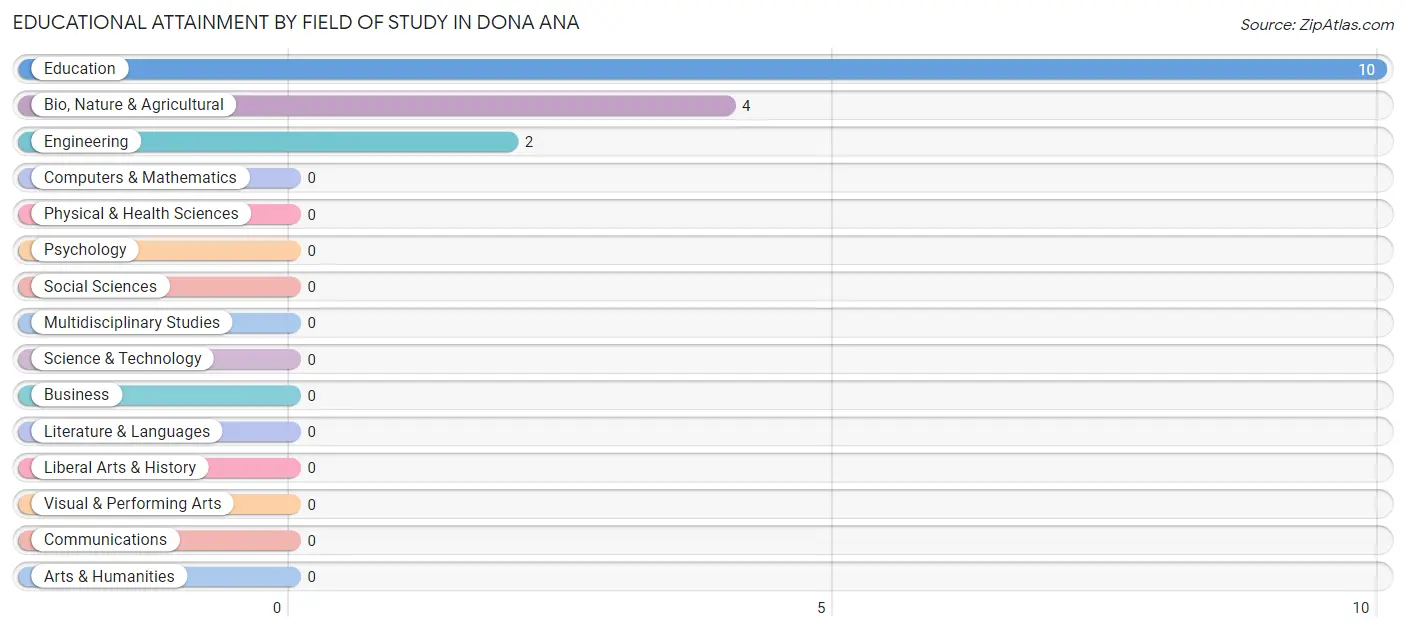
| Field of Study | # Graduates | % Graduates |
| Computers & Mathematics | 0 | 0.0% |
| Bio, Nature & Agricultural | 4 | 25.0% |
| Physical & Health Sciences | 0 | 0.0% |
| Psychology | 0 | 0.0% |
| Social Sciences | 0 | 0.0% |
| Engineering | 2 | 12.5% |
| Multidisciplinary Studies | 0 | 0.0% |
| Science & Technology | 0 | 0.0% |
| Business | 0 | 0.0% |
| Education | 10 | 62.5% |
| Literature & Languages | 0 | 0.0% |
| Liberal Arts & History | 0 | 0.0% |
| Visual & Performing Arts | 0 | 0.0% |
| Communications | 0 | 0.0% |
| Arts & Humanities | 0 | 0.0% |
| Total | 16 | 100.0% |
Transportation & Commute in Dona Ana
Vehicle Availability by Sex in Dona Ana
The most prevalent vehicle ownership categories in Dona Ana are males with 3 vehicles (145, accounting for 49.7%) and females with 3 vehicles (125, making up 65.0%).
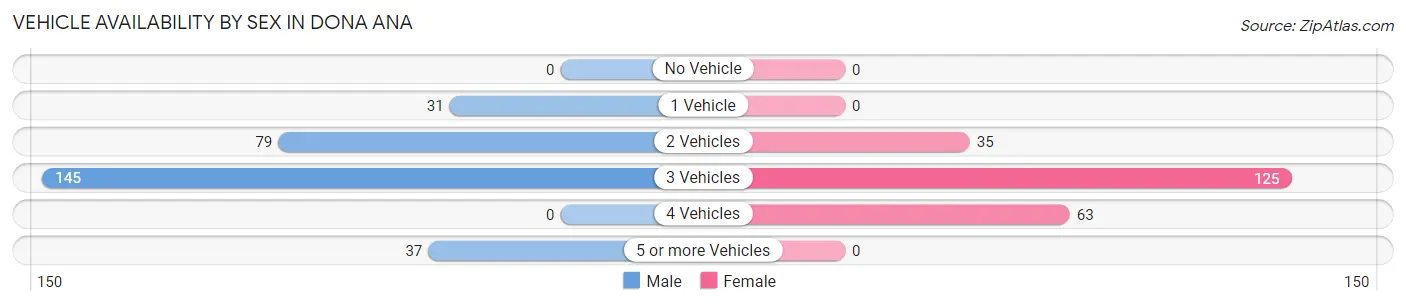
| Vehicles Available | Male | Female |
| No Vehicle | 0 (0.0%) | 0 (0.0%) |
| 1 Vehicle | 31 (10.6%) | 0 (0.0%) |
| 2 Vehicles | 79 (27.1%) | 35 (15.7%) |
| 3 Vehicles | 145 (49.7%) | 125 (56.0%) |
| 4 Vehicles | 0 (0.0%) | 63 (28.2%) |
| 5 or more Vehicles | 37 (12.7%) | 0 (0.0%) |
| Total | 292 (100.0%) | 223 (100.0%) |
Commute Time in Dona Ana
The most frequently occuring commute durations in Dona Ana are 10 to 14 minutes (201 commuters, 44.8%), 5 to 9 minutes (124 commuters, 27.6%), and 25 to 29 minutes (63 commuters, 14.0%).
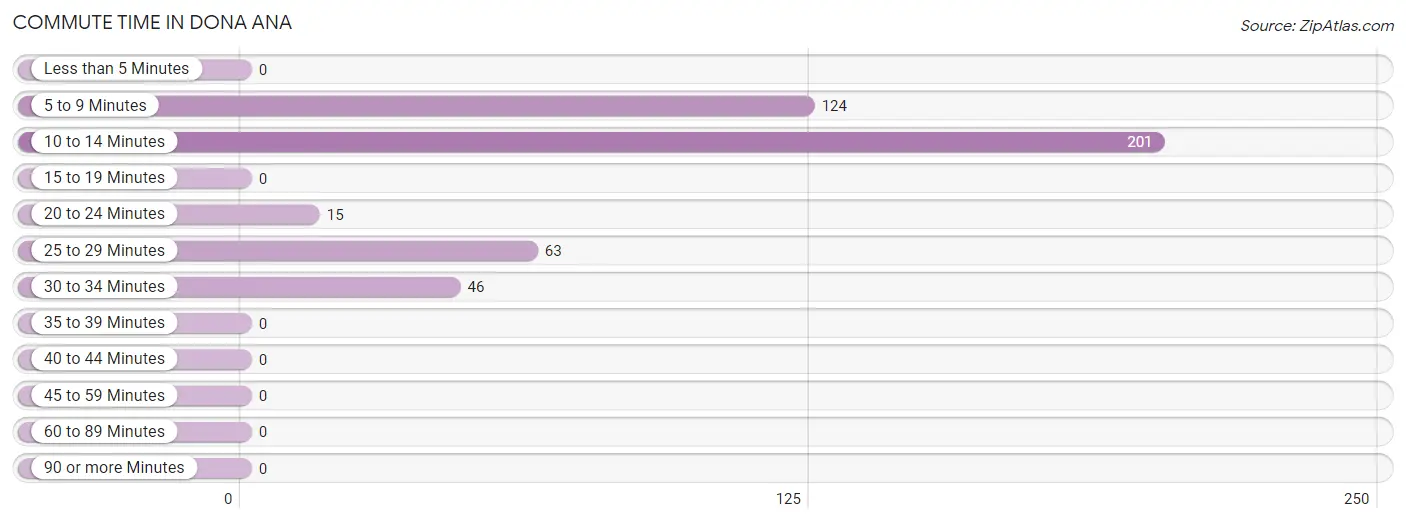
| Commute Time | # Commuters | % Commuters |
| Less than 5 Minutes | 0 | 0.0% |
| 5 to 9 Minutes | 124 | 27.6% |
| 10 to 14 Minutes | 201 | 44.8% |
| 15 to 19 Minutes | 0 | 0.0% |
| 20 to 24 Minutes | 15 | 3.3% |
| 25 to 29 Minutes | 63 | 14.0% |
| 30 to 34 Minutes | 46 | 10.2% |
| 35 to 39 Minutes | 0 | 0.0% |
| 40 to 44 Minutes | 0 | 0.0% |
| 45 to 59 Minutes | 0 | 0.0% |
| 60 to 89 Minutes | 0 | 0.0% |
| 90 or more Minutes | 0 | 0.0% |
Commute Time by Sex in Dona Ana
The most common commute times in Dona Ana are 10 to 14 minutes (151 commuters, 57.9%) for males and 5 to 9 minutes (75 commuters, 39.9%) for females.
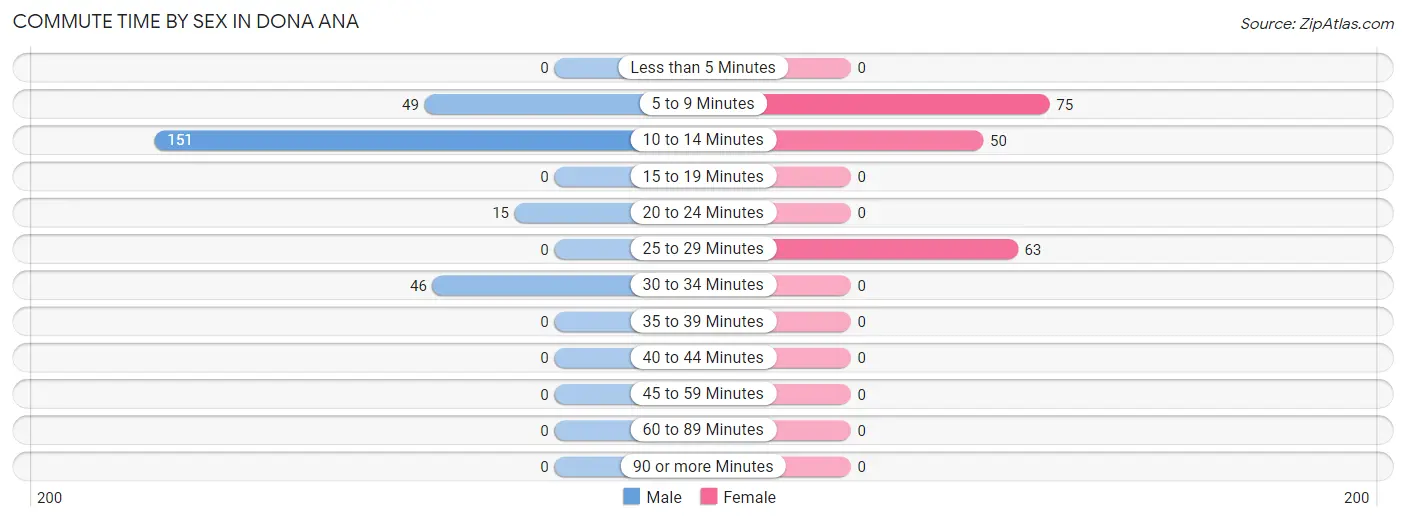
| Commute Time | Male | Female |
| Less than 5 Minutes | 0 (0.0%) | 0 (0.0%) |
| 5 to 9 Minutes | 49 (18.8%) | 75 (39.9%) |
| 10 to 14 Minutes | 151 (57.9%) | 50 (26.6%) |
| 15 to 19 Minutes | 0 (0.0%) | 0 (0.0%) |
| 20 to 24 Minutes | 15 (5.8%) | 0 (0.0%) |
| 25 to 29 Minutes | 0 (0.0%) | 63 (33.5%) |
| 30 to 34 Minutes | 46 (17.6%) | 0 (0.0%) |
| 35 to 39 Minutes | 0 (0.0%) | 0 (0.0%) |
| 40 to 44 Minutes | 0 (0.0%) | 0 (0.0%) |
| 45 to 59 Minutes | 0 (0.0%) | 0 (0.0%) |
| 60 to 89 Minutes | 0 (0.0%) | 0 (0.0%) |
| 90 or more Minutes | 0 (0.0%) | 0 (0.0%) |
Time of Departure to Work by Sex in Dona Ana
The most frequent times of departure to work in Dona Ana are 8:00 AM to 8:29 AM (91, 34.9%) for males and 6:00 AM to 6:29 AM (63, 33.5%) for females.
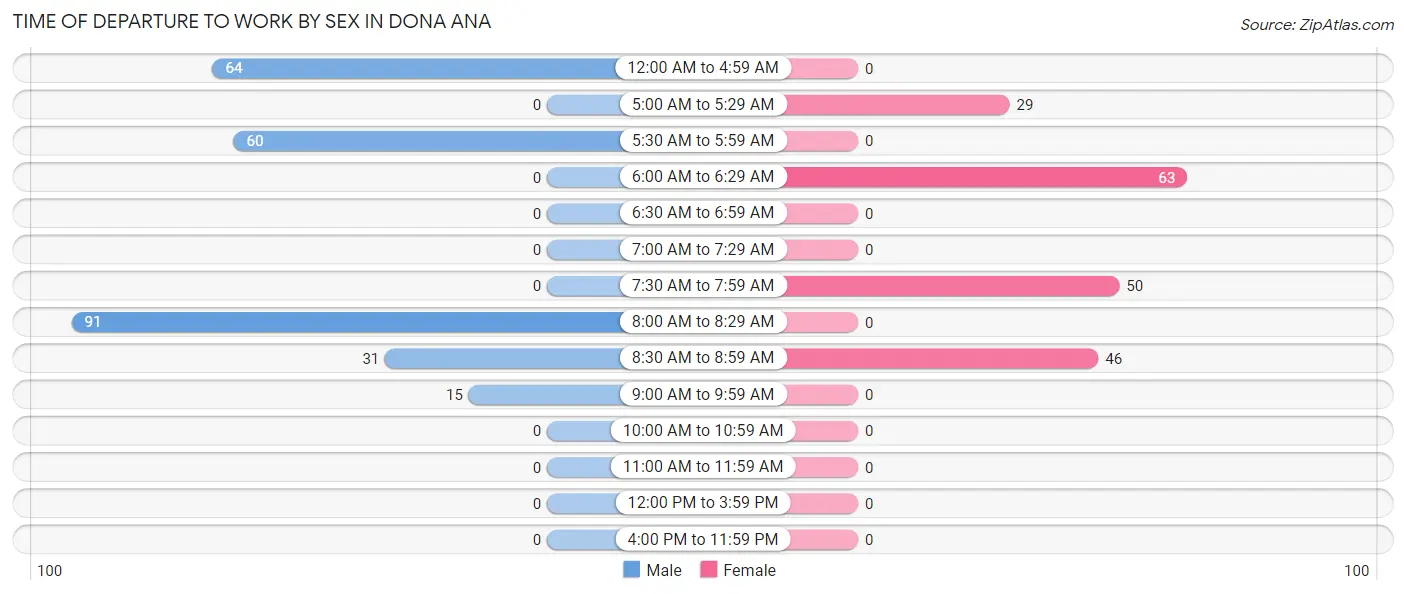
| Time of Departure | Male | Female |
| 12:00 AM to 4:59 AM | 64 (24.5%) | 0 (0.0%) |
| 5:00 AM to 5:29 AM | 0 (0.0%) | 29 (15.4%) |
| 5:30 AM to 5:59 AM | 60 (23.0%) | 0 (0.0%) |
| 6:00 AM to 6:29 AM | 0 (0.0%) | 63 (33.5%) |
| 6:30 AM to 6:59 AM | 0 (0.0%) | 0 (0.0%) |
| 7:00 AM to 7:29 AM | 0 (0.0%) | 0 (0.0%) |
| 7:30 AM to 7:59 AM | 0 (0.0%) | 50 (26.6%) |
| 8:00 AM to 8:29 AM | 91 (34.9%) | 0 (0.0%) |
| 8:30 AM to 8:59 AM | 31 (11.9%) | 46 (24.5%) |
| 9:00 AM to 9:59 AM | 15 (5.8%) | 0 (0.0%) |
| 10:00 AM to 10:59 AM | 0 (0.0%) | 0 (0.0%) |
| 11:00 AM to 11:59 AM | 0 (0.0%) | 0 (0.0%) |
| 12:00 PM to 3:59 PM | 0 (0.0%) | 0 (0.0%) |
| 4:00 PM to 11:59 PM | 0 (0.0%) | 0 (0.0%) |
| Total | 261 (100.0%) | 188 (100.0%) |
Housing Occupancy in Dona Ana
Occupancy by Ownership in Dona Ana
Of the total 463 dwellings in Dona Ana, owner-occupied units account for 380 (82.1%), while renter-occupied units make up 83 (17.9%).
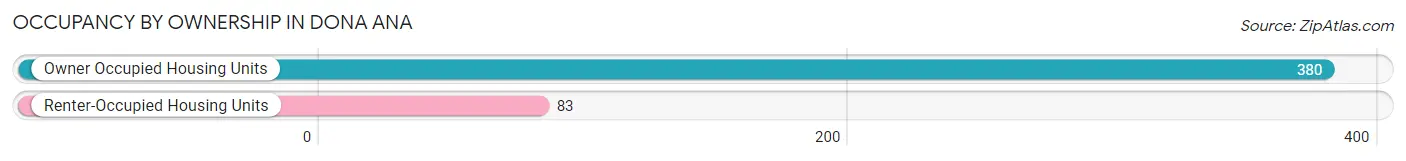
| Occupancy | # Housing Units | % Housing Units |
| Owner Occupied Housing Units | 380 | 82.1% |
| Renter-Occupied Housing Units | 83 | 17.9% |
| Total Occupied Housing Units | 463 | 100.0% |
Occupancy by Household Size in Dona Ana
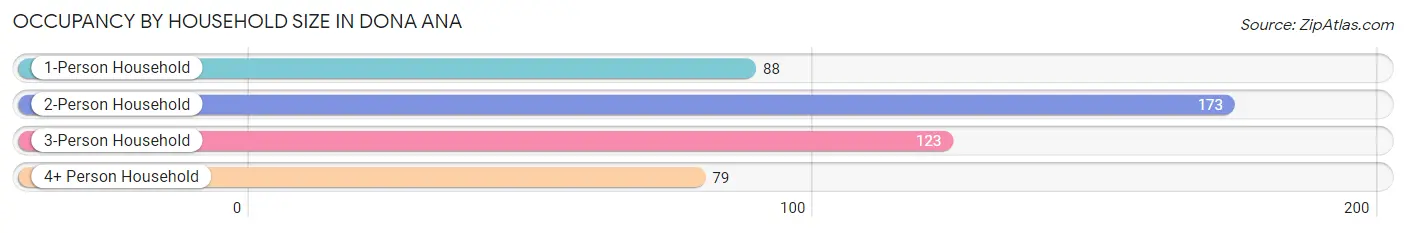
| Household Size | # Housing Units | % Housing Units |
| 1-Person Household | 88 | 19.0% |
| 2-Person Household | 173 | 37.4% |
| 3-Person Household | 123 | 26.6% |
| 4+ Person Household | 79 | 17.1% |
| Total Housing Units | 463 | 100.0% |
Occupancy by Ownership by Household Size in Dona Ana
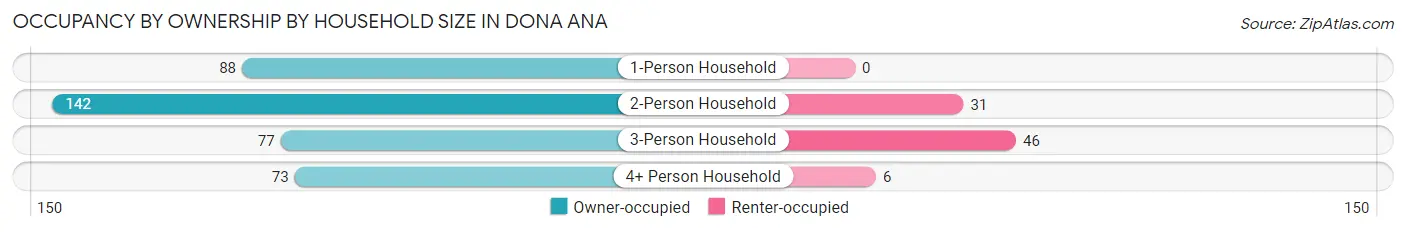
| Household Size | Owner-occupied | Renter-occupied |
| 1-Person Household | 88 (100.0%) | 0 (0.0%) |
| 2-Person Household | 142 (82.1%) | 31 (17.9%) |
| 3-Person Household | 77 (62.6%) | 46 (37.4%) |
| 4+ Person Household | 73 (92.4%) | 6 (7.6%) |
| Total Housing Units | 380 (82.1%) | 83 (17.9%) |
Occupancy by Educational Attainment in Dona Ana
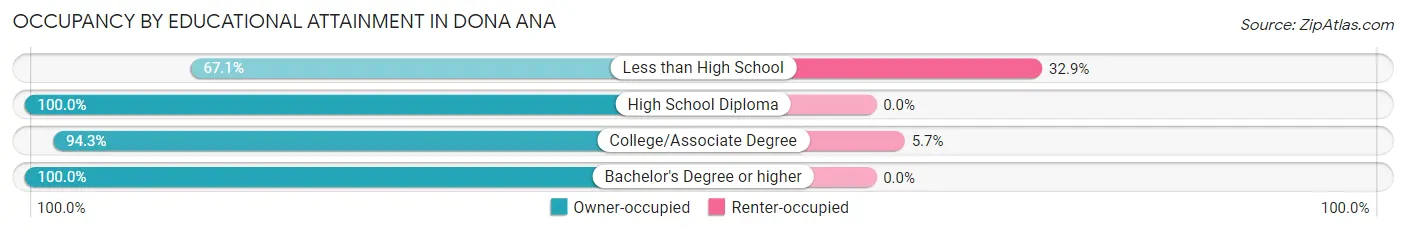
| Household Size | Owner-occupied | Renter-occupied |
| Less than High School | 157 (67.1%) | 77 (32.9%) |
| High School Diploma | 111 (100.0%) | 0 (0.0%) |
| College/Associate Degree | 100 (94.3%) | 6 (5.7%) |
| Bachelor's Degree or higher | 12 (100.0%) | 0 (0.0%) |
Occupancy by Age of Householder in Dona Ana
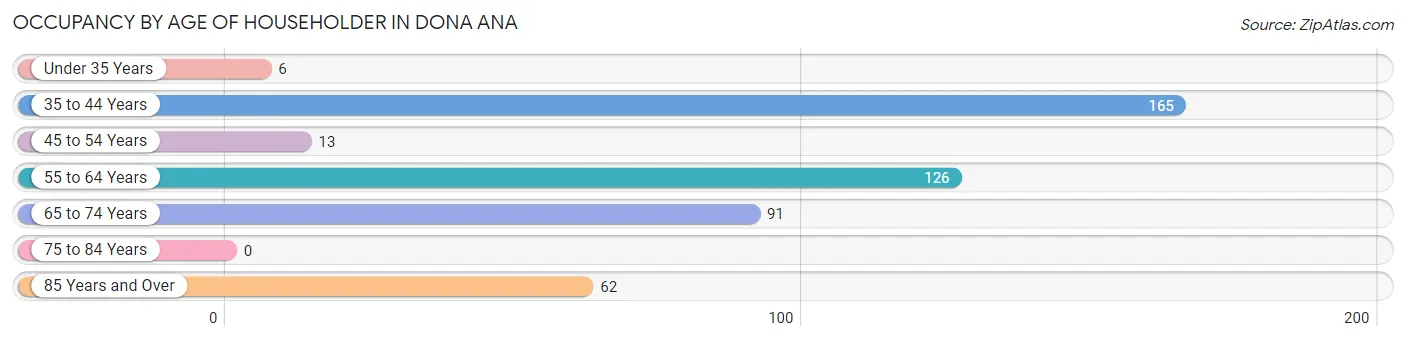
| Age Bracket | # Households | % Households |
| Under 35 Years | 6 | 1.3% |
| 35 to 44 Years | 165 | 35.6% |
| 45 to 54 Years | 13 | 2.8% |
| 55 to 64 Years | 126 | 27.2% |
| 65 to 74 Years | 91 | 19.7% |
| 75 to 84 Years | 0 | 0.0% |
| 85 Years and Over | 62 | 13.4% |
| Total | 463 | 100.0% |
Housing Finances in Dona Ana
Median Income by Occupancy in Dona Ana
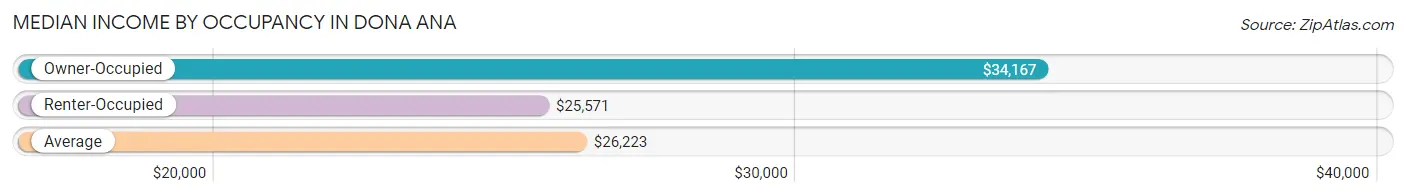
| Occupancy Type | # Households | Median Income |
| Owner-Occupied | 380 (82.1%) | $34,167 |
| Renter-Occupied | 83 (17.9%) | $25,571 |
| Average | 463 (100.0%) | $26,223 |
Occupancy by Householder Income Bracket in Dona Ana
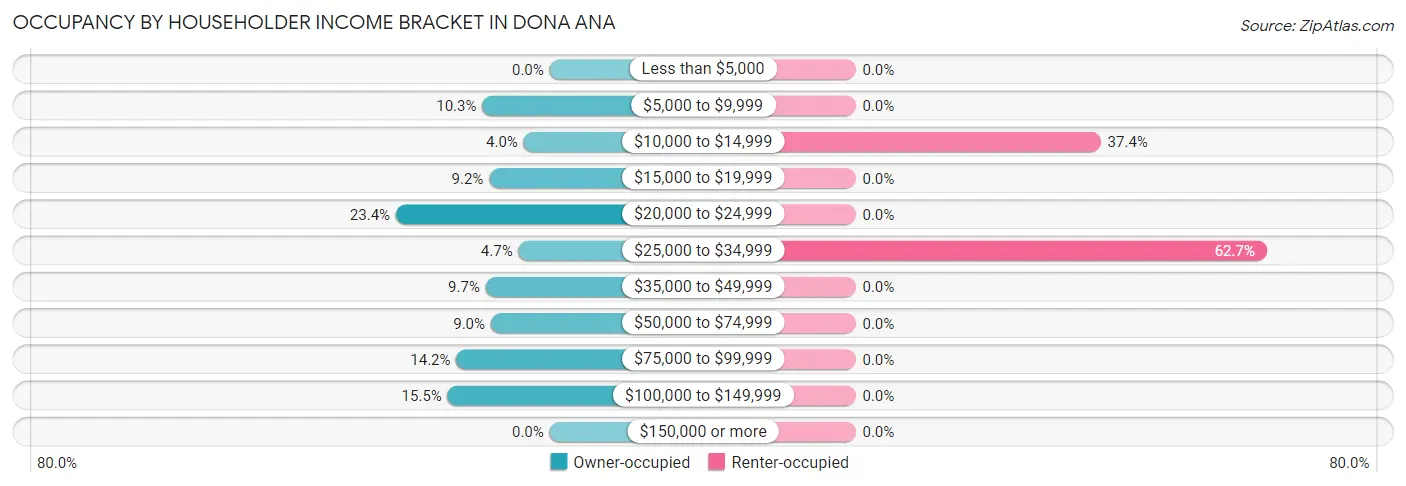
| Income Bracket | Owner-occupied | Renter-occupied |
| Less than $5,000 | 0 (0.0%) | 0 (0.0%) |
| $5,000 to $9,999 | 39 (10.3%) | 0 (0.0%) |
| $10,000 to $14,999 | 15 (4.0%) | 31 (37.3%) |
| $15,000 to $19,999 | 35 (9.2%) | 0 (0.0%) |
| $20,000 to $24,999 | 89 (23.4%) | 0 (0.0%) |
| $25,000 to $34,999 | 18 (4.7%) | 52 (62.6%) |
| $35,000 to $49,999 | 37 (9.7%) | 0 (0.0%) |
| $50,000 to $74,999 | 34 (8.9%) | 0 (0.0%) |
| $75,000 to $99,999 | 54 (14.2%) | 0 (0.0%) |
| $100,000 to $149,999 | 59 (15.5%) | 0 (0.0%) |
| $150,000 or more | 0 (0.0%) | 0 (0.0%) |
| Total | 380 (100.0%) | 83 (100.0%) |
Monthly Housing Cost Tiers in Dona Ana
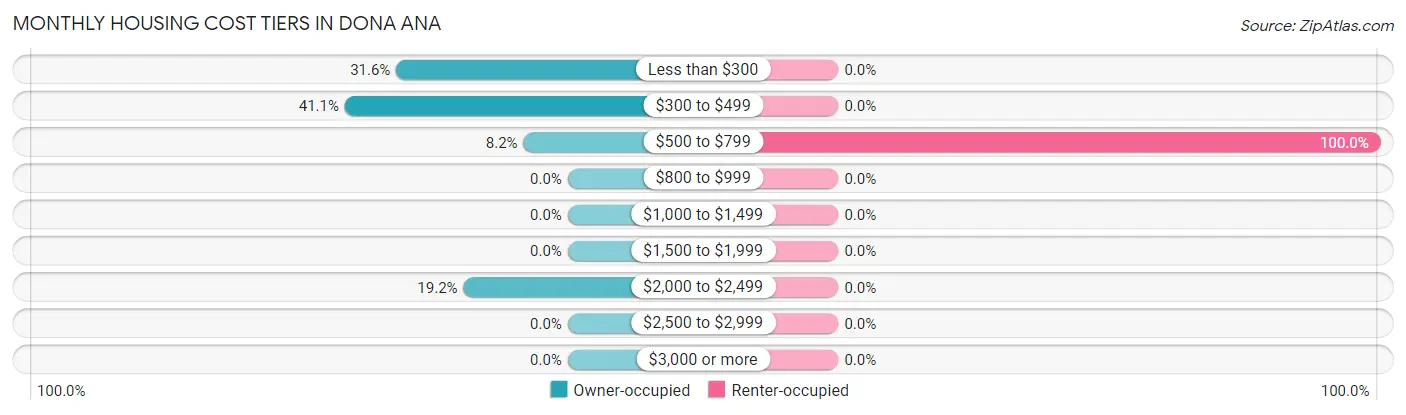
| Monthly Cost | Owner-occupied | Renter-occupied |
| Less than $300 | 120 (31.6%) | 0 (0.0%) |
| $300 to $499 | 156 (41.0%) | 0 (0.0%) |
| $500 to $799 | 31 (8.2%) | 83 (100.0%) |
| $800 to $999 | 0 (0.0%) | 0 (0.0%) |
| $1,000 to $1,499 | 0 (0.0%) | 0 (0.0%) |
| $1,500 to $1,999 | 0 (0.0%) | 0 (0.0%) |
| $2,000 to $2,499 | 73 (19.2%) | 0 (0.0%) |
| $2,500 to $2,999 | 0 (0.0%) | 0 (0.0%) |
| $3,000 or more | 0 (0.0%) | 0 (0.0%) |
| Total | 380 (100.0%) | 83 (100.0%) |
Physical Housing Characteristics in Dona Ana
Housing Structures in Dona Ana
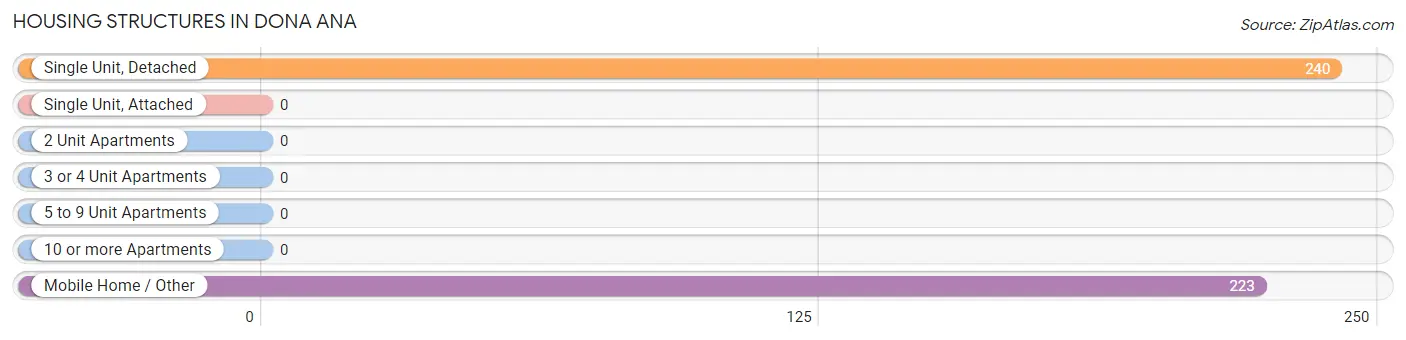
| Structure Type | # Housing Units | % Housing Units |
| Single Unit, Detached | 240 | 51.8% |
| Single Unit, Attached | 0 | 0.0% |
| 2 Unit Apartments | 0 | 0.0% |
| 3 or 4 Unit Apartments | 0 | 0.0% |
| 5 to 9 Unit Apartments | 0 | 0.0% |
| 10 or more Apartments | 0 | 0.0% |
| Mobile Home / Other | 223 | 48.2% |
| Total | 463 | 100.0% |
Housing Structures by Occupancy in Dona Ana
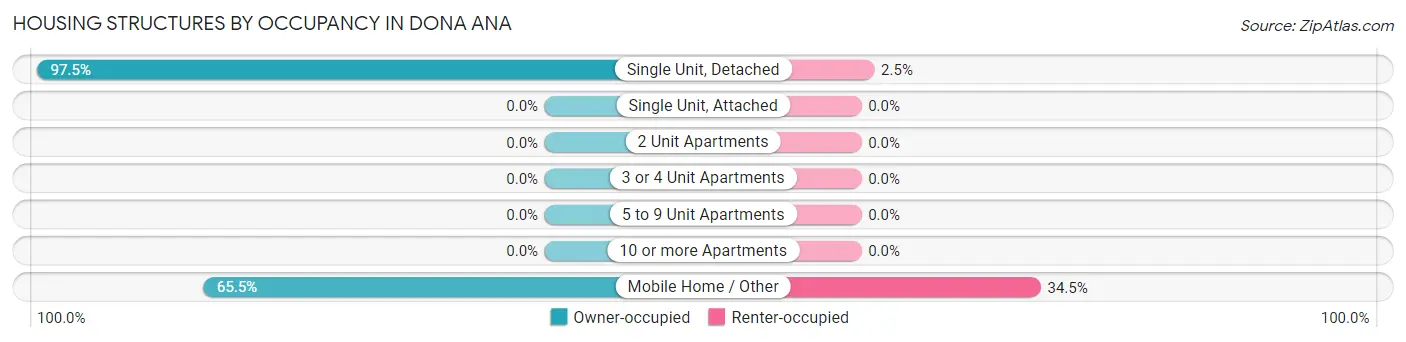
| Structure Type | Owner-occupied | Renter-occupied |
| Single Unit, Detached | 234 (97.5%) | 6 (2.5%) |
| Single Unit, Attached | 0 (0.0%) | 0 (0.0%) |
| 2 Unit Apartments | 0 (0.0%) | 0 (0.0%) |
| 3 or 4 Unit Apartments | 0 (0.0%) | 0 (0.0%) |
| 5 to 9 Unit Apartments | 0 (0.0%) | 0 (0.0%) |
| 10 or more Apartments | 0 (0.0%) | 0 (0.0%) |
| Mobile Home / Other | 146 (65.5%) | 77 (34.5%) |
| Total | 380 (82.1%) | 83 (17.9%) |
Housing Structures by Number of Rooms in Dona Ana
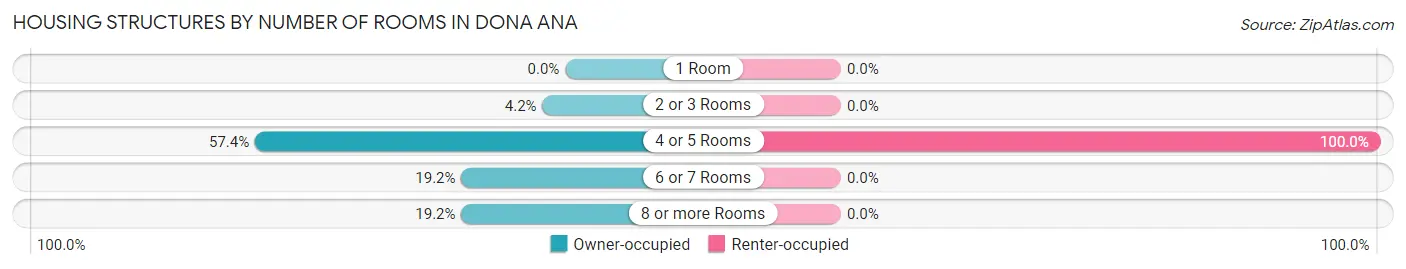
| Number of Rooms | Owner-occupied | Renter-occupied |
| 1 Room | 0 (0.0%) | 0 (0.0%) |
| 2 or 3 Rooms | 16 (4.2%) | 0 (0.0%) |
| 4 or 5 Rooms | 218 (57.4%) | 83 (100.0%) |
| 6 or 7 Rooms | 73 (19.2%) | 0 (0.0%) |
| 8 or more Rooms | 73 (19.2%) | 0 (0.0%) |
| Total | 380 (100.0%) | 83 (100.0%) |
Housing Structure by Heating Type in Dona Ana
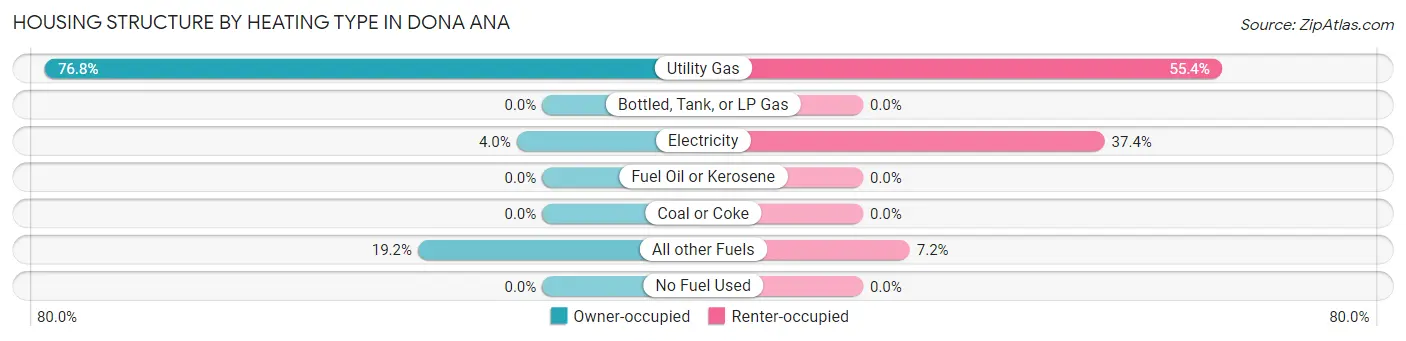
| Heating Type | Owner-occupied | Renter-occupied |
| Utility Gas | 292 (76.8%) | 46 (55.4%) |
| Bottled, Tank, or LP Gas | 0 (0.0%) | 0 (0.0%) |
| Electricity | 15 (4.0%) | 31 (37.3%) |
| Fuel Oil or Kerosene | 0 (0.0%) | 0 (0.0%) |
| Coal or Coke | 0 (0.0%) | 0 (0.0%) |
| All other Fuels | 73 (19.2%) | 6 (7.2%) |
| No Fuel Used | 0 (0.0%) | 0 (0.0%) |
| Total | 380 (100.0%) | 83 (100.0%) |
Household Vehicle Usage in Dona Ana
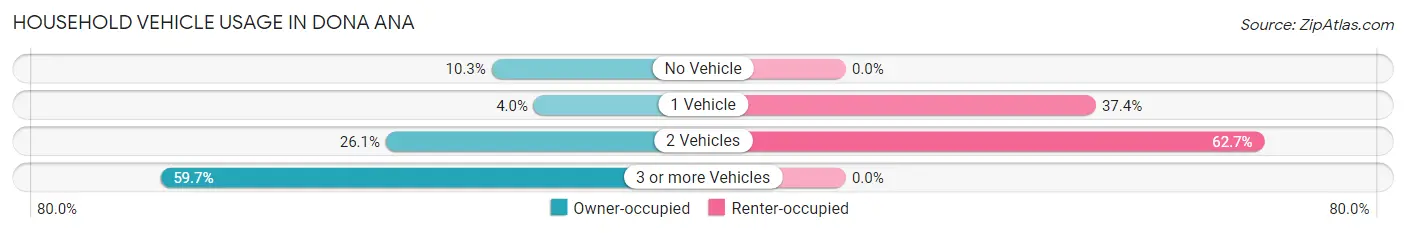
| Vehicles per Household | Owner-occupied | Renter-occupied |
| No Vehicle | 39 (10.3%) | 0 (0.0%) |
| 1 Vehicle | 15 (4.0%) | 31 (37.3%) |
| 2 Vehicles | 99 (26.1%) | 52 (62.6%) |
| 3 or more Vehicles | 227 (59.7%) | 0 (0.0%) |
| Total | 380 (100.0%) | 83 (100.0%) |
Real Estate & Mortgages in Dona Ana
Real Estate and Mortgage Overview in Dona Ana
| Characteristic | Without Mortgage | With Mortgage |
| Housing Units | 278 | 102 |
| Median Property Value | $85,200 | $0 |
| Median Household Income | - | - |
| Monthly Housing Costs | $355 | $0 |
| Real Estate Taxes | $383 | $0 |
Property Value by Mortgage Status in Dona Ana
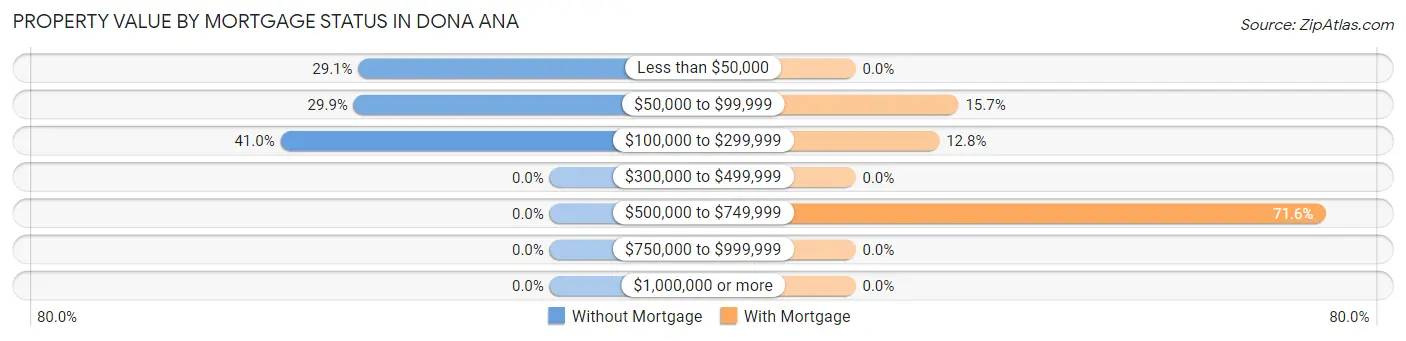
| Property Value | Without Mortgage | With Mortgage |
| Less than $50,000 | 81 (29.1%) | 0 (0.0%) |
| $50,000 to $99,999 | 83 (29.9%) | 16 (15.7%) |
| $100,000 to $299,999 | 114 (41.0%) | 13 (12.8%) |
| $300,000 to $499,999 | 0 (0.0%) | 0 (0.0%) |
| $500,000 to $749,999 | 0 (0.0%) | 73 (71.6%) |
| $750,000 to $999,999 | 0 (0.0%) | 0 (0.0%) |
| $1,000,000 or more | 0 (0.0%) | 0 (0.0%) |
| Total | 278 (100.0%) | 102 (100.0%) |
Household Income by Mortgage Status in Dona Ana
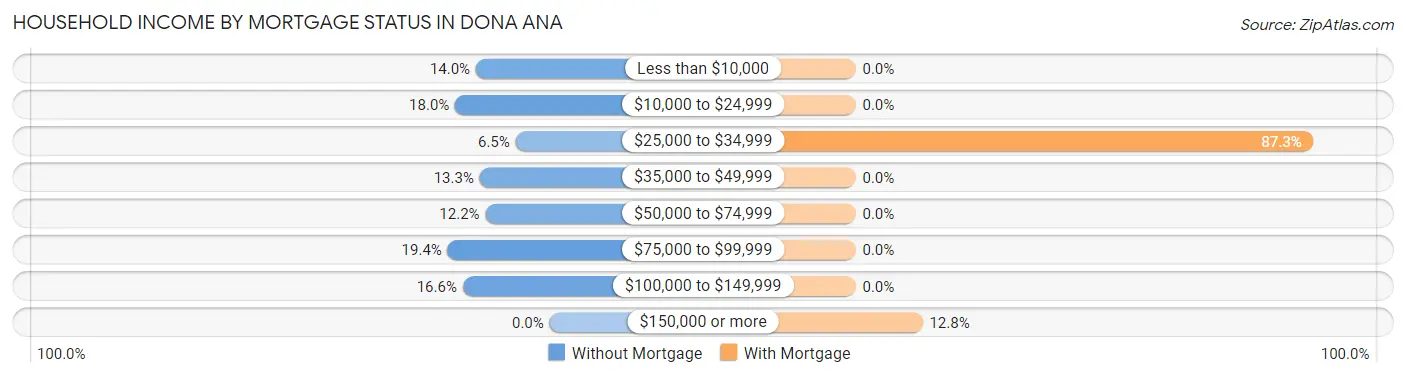
| Household Income | Without Mortgage | With Mortgage |
| Less than $10,000 | 39 (14.0%) | 0 (0.0%) |
| $10,000 to $24,999 | 50 (18.0%) | 0 (0.0%) |
| $25,000 to $34,999 | 18 (6.5%) | 89 (87.3%) |
| $35,000 to $49,999 | 37 (13.3%) | 0 (0.0%) |
| $50,000 to $74,999 | 34 (12.2%) | 0 (0.0%) |
| $75,000 to $99,999 | 54 (19.4%) | 0 (0.0%) |
| $100,000 to $149,999 | 46 (16.6%) | 0 (0.0%) |
| $150,000 or more | 0 (0.0%) | 13 (12.8%) |
| Total | 278 (100.0%) | 102 (100.0%) |
Property Value to Household Income Ratio in Dona Ana
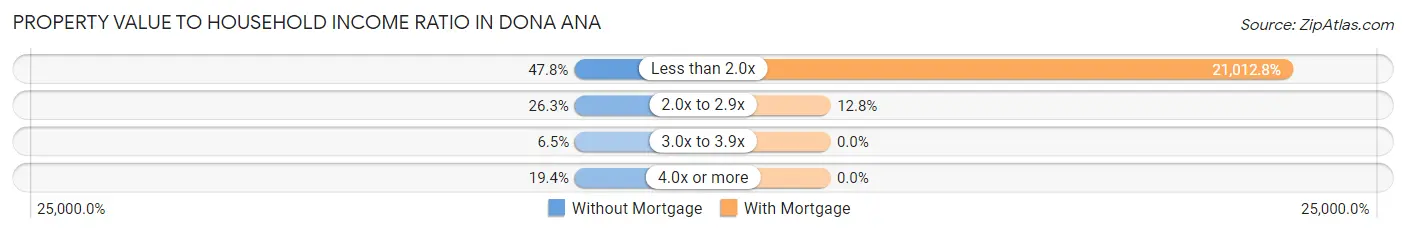
| Value-to-Income Ratio | Without Mortgage | With Mortgage |
| Less than 2.0x | 133 (47.8%) | 21,433 (21,012.7%) |
| 2.0x to 2.9x | 73 (26.3%) | 13 (12.8%) |
| 3.0x to 3.9x | 18 (6.5%) | 0 (0.0%) |
| 4.0x or more | 54 (19.4%) | 0 (0.0%) |
| Total | 278 (100.0%) | 102 (100.0%) |
Real Estate Taxes by Mortgage Status in Dona Ana
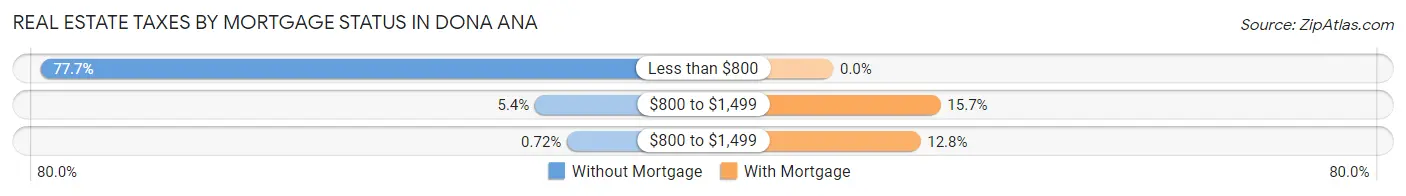
| Property Taxes | Without Mortgage | With Mortgage |
| Less than $800 | 216 (77.7%) | 0 (0.0%) |
| $800 to $1,499 | 15 (5.4%) | 16 (15.7%) |
| $800 to $1,499 | 2 (0.7%) | 13 (12.8%) |
| Total | 278 (100.0%) | 102 (100.0%) |
Health & Disability in Dona Ana
Health Insurance Coverage by Age in Dona Ana
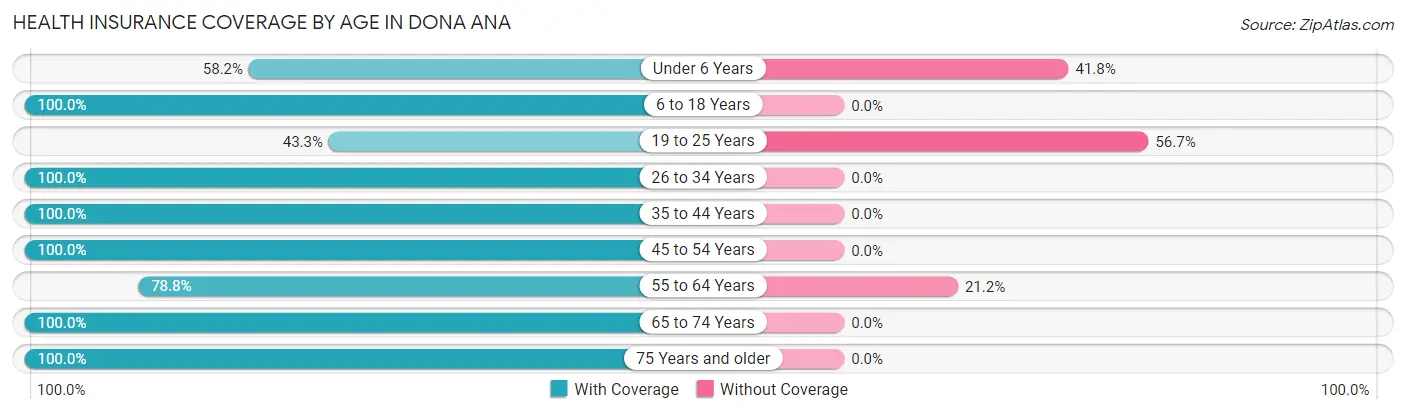
| Age Bracket | With Coverage | Without Coverage |
| Under 6 Years | 64 (58.2%) | 46 (41.8%) |
| 6 to 18 Years | 287 (100.0%) | 0 (0.0%) |
| 19 to 25 Years | 45 (43.3%) | 59 (56.7%) |
| 26 to 34 Years | 21 (100.0%) | 0 (0.0%) |
| 35 to 44 Years | 282 (100.0%) | 0 (0.0%) |
| 45 to 54 Years | 13 (100.0%) | 0 (0.0%) |
| 55 to 64 Years | 223 (78.8%) | 60 (21.2%) |
| 65 to 74 Years | 133 (100.0%) | 0 (0.0%) |
| 75 Years and older | 111 (100.0%) | 0 (0.0%) |
| Total | 1,179 (87.7%) | 165 (12.3%) |
Health Insurance Coverage by Citizenship Status in Dona Ana
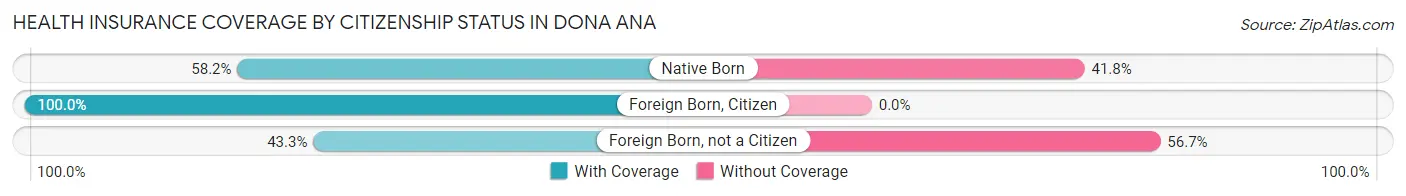
| Citizenship Status | With Coverage | Without Coverage |
| Native Born | 64 (58.2%) | 46 (41.8%) |
| Foreign Born, Citizen | 287 (100.0%) | 0 (0.0%) |
| Foreign Born, not a Citizen | 45 (43.3%) | 59 (56.7%) |
Health Insurance Coverage by Household Income in Dona Ana
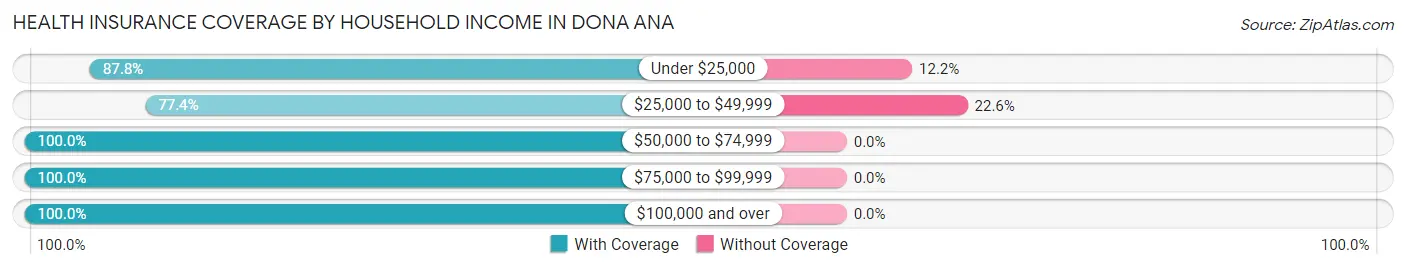
| Household Income | With Coverage | Without Coverage |
| Under $25,000 | 430 (87.8%) | 60 (12.2%) |
| $25,000 to $49,999 | 359 (77.4%) | 105 (22.6%) |
| $50,000 to $74,999 | 71 (100.0%) | 0 (0.0%) |
| $75,000 to $99,999 | 154 (100.0%) | 0 (0.0%) |
| $100,000 and over | 165 (100.0%) | 0 (0.0%) |
Public vs Private Health Insurance Coverage by Age in Dona Ana
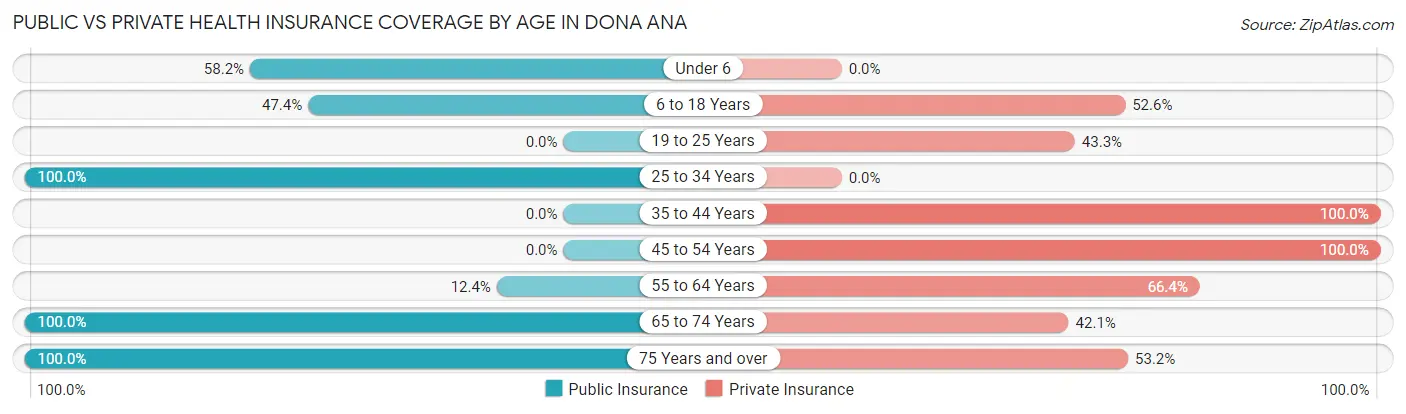
| Age Bracket | Public Insurance | Private Insurance |
| Under 6 | 64 (58.2%) | 0 (0.0%) |
| 6 to 18 Years | 136 (47.4%) | 151 (52.6%) |
| 19 to 25 Years | 0 (0.0%) | 45 (43.3%) |
| 25 to 34 Years | 21 (100.0%) | 0 (0.0%) |
| 35 to 44 Years | 0 (0.0%) | 282 (100.0%) |
| 45 to 54 Years | 0 (0.0%) | 13 (100.0%) |
| 55 to 64 Years | 35 (12.4%) | 188 (66.4%) |
| 65 to 74 Years | 133 (100.0%) | 56 (42.1%) |
| 75 Years and over | 111 (100.0%) | 59 (53.1%) |
| Total | 500 (37.2%) | 794 (59.1%) |
Disability Status by Sex by Age in Dona Ana
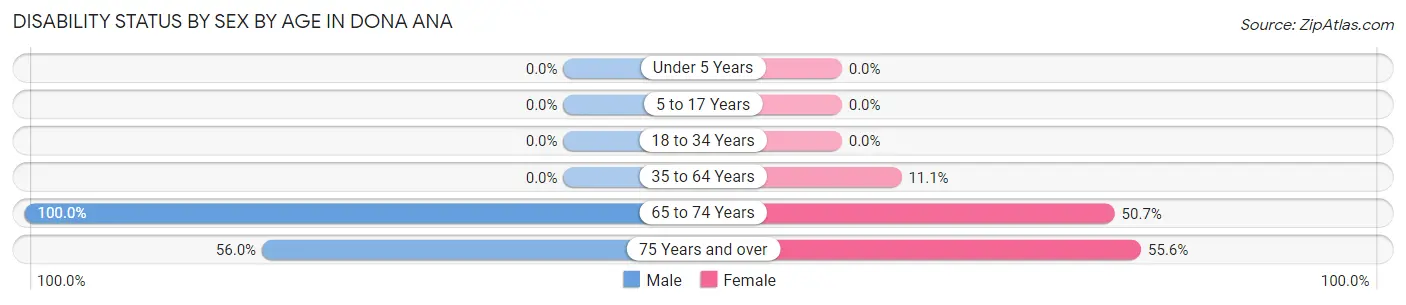
| Age Bracket | Male | Female |
| Under 5 Years | 0 (0.0%) | 0 (0.0%) |
| 5 to 17 Years | 0 (0.0%) | 0 (0.0%) |
| 18 to 34 Years | 0 (0.0%) | 0 (0.0%) |
| 35 to 64 Years | 0 (0.0%) | 29 (11.1%) |
| 65 to 74 Years | 56 (100.0%) | 39 (50.6%) |
| 75 Years and over | 47 (55.9%) | 15 (55.6%) |
Disability Class by Sex by Age in Dona Ana
Disability Class: Hearing Difficulty
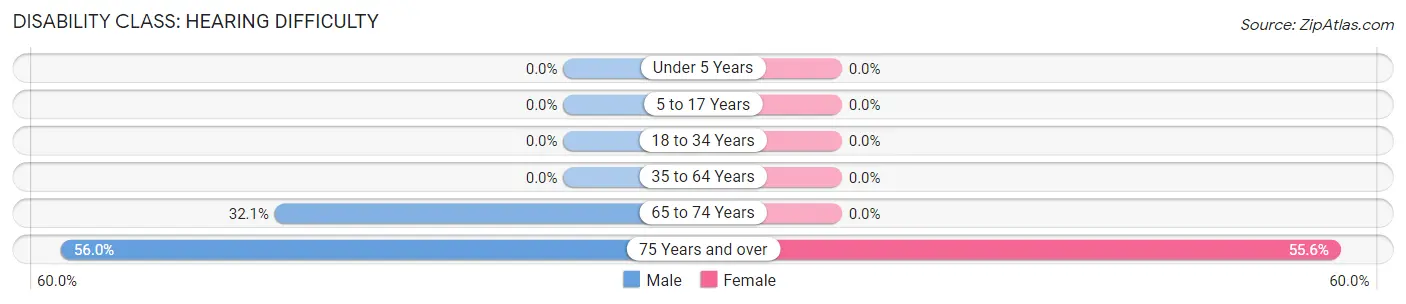
| Age Bracket | Male | Female |
| Under 5 Years | 0 (0.0%) | 0 (0.0%) |
| 5 to 17 Years | 0 (0.0%) | 0 (0.0%) |
| 18 to 34 Years | 0 (0.0%) | 0 (0.0%) |
| 35 to 64 Years | 0 (0.0%) | 0 (0.0%) |
| 65 to 74 Years | 18 (32.1%) | 0 (0.0%) |
| 75 Years and over | 47 (55.9%) | 15 (55.6%) |
Disability Class: Vision Difficulty
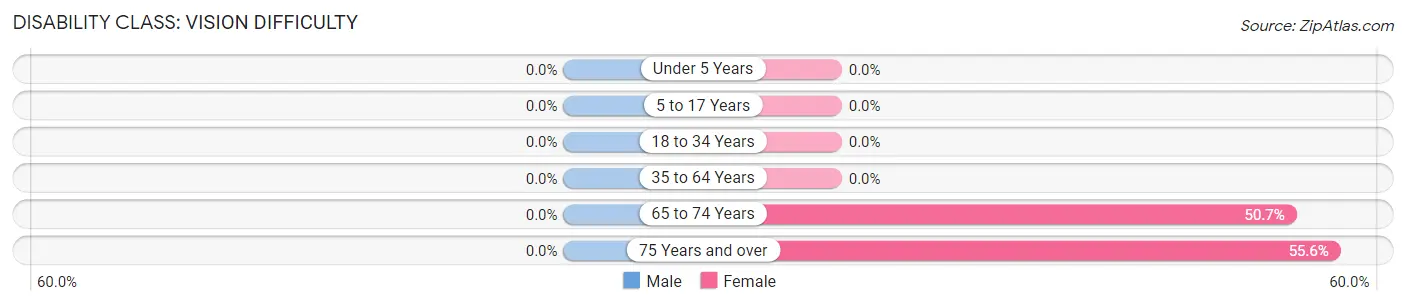
| Age Bracket | Male | Female |
| Under 5 Years | 0 (0.0%) | 0 (0.0%) |
| 5 to 17 Years | 0 (0.0%) | 0 (0.0%) |
| 18 to 34 Years | 0 (0.0%) | 0 (0.0%) |
| 35 to 64 Years | 0 (0.0%) | 0 (0.0%) |
| 65 to 74 Years | 0 (0.0%) | 39 (50.6%) |
| 75 Years and over | 0 (0.0%) | 15 (55.6%) |
Disability Class: Cognitive Difficulty
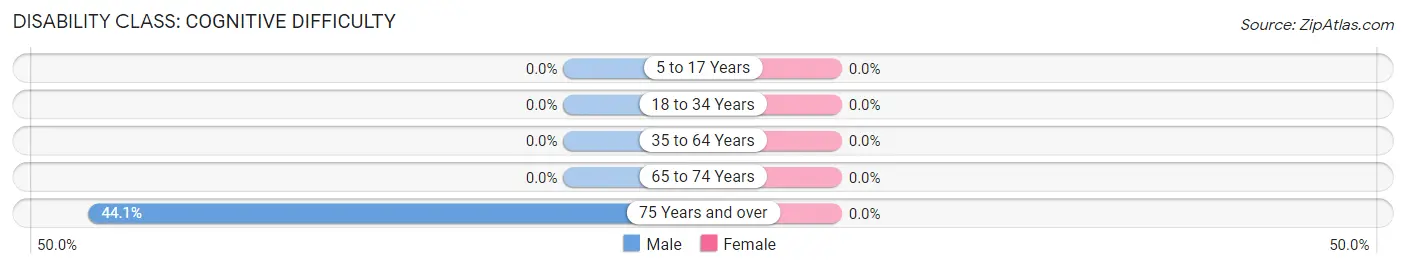
| Age Bracket | Male | Female |
| 5 to 17 Years | 0 (0.0%) | 0 (0.0%) |
| 18 to 34 Years | 0 (0.0%) | 0 (0.0%) |
| 35 to 64 Years | 0 (0.0%) | 0 (0.0%) |
| 65 to 74 Years | 0 (0.0%) | 0 (0.0%) |
| 75 Years and over | 37 (44.1%) | 0 (0.0%) |
Disability Class: Ambulatory Difficulty
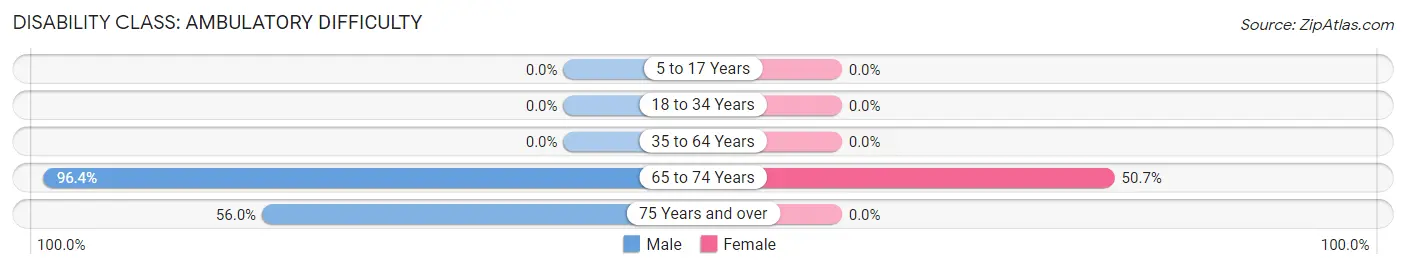
| Age Bracket | Male | Female |
| 5 to 17 Years | 0 (0.0%) | 0 (0.0%) |
| 18 to 34 Years | 0 (0.0%) | 0 (0.0%) |
| 35 to 64 Years | 0 (0.0%) | 0 (0.0%) |
| 65 to 74 Years | 54 (96.4%) | 39 (50.6%) |
| 75 Years and over | 47 (55.9%) | 0 (0.0%) |
Disability Class: Self-Care Difficulty
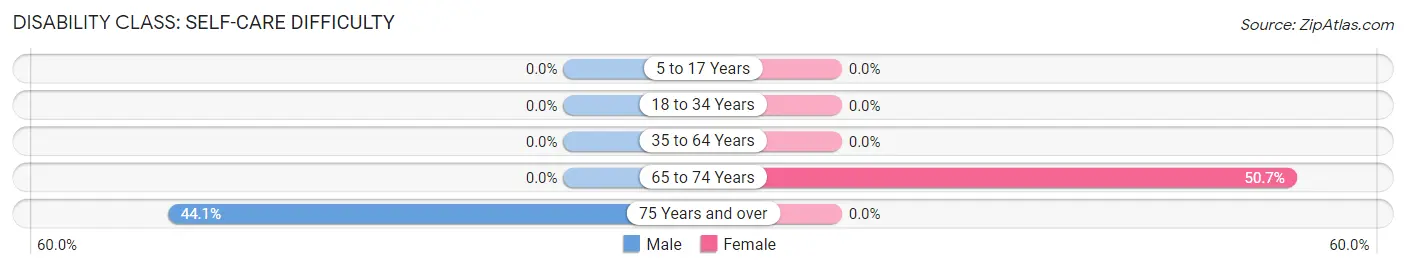
| Age Bracket | Male | Female |
| 5 to 17 Years | 0 (0.0%) | 0 (0.0%) |
| 18 to 34 Years | 0 (0.0%) | 0 (0.0%) |
| 35 to 64 Years | 0 (0.0%) | 0 (0.0%) |
| 65 to 74 Years | 0 (0.0%) | 39 (50.6%) |
| 75 Years and over | 37 (44.1%) | 0 (0.0%) |
Technology Access in Dona Ana
Computing Device Access in Dona Ana
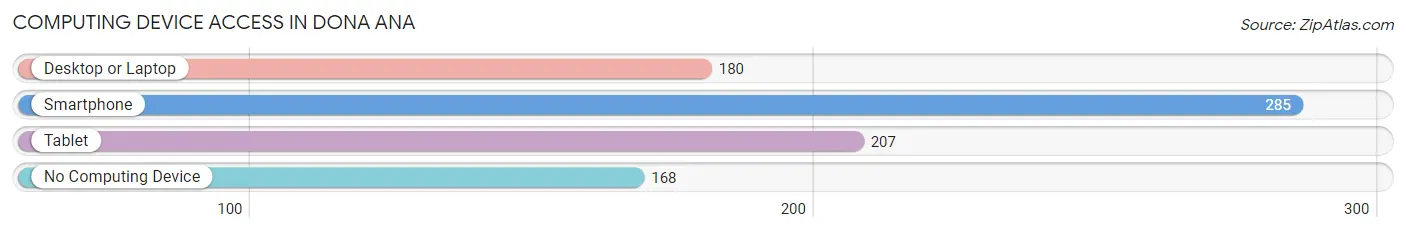
| Device Type | # Households | % Households |
| Desktop or Laptop | 180 | 38.9% |
| Smartphone | 285 | 61.6% |
| Tablet | 207 | 44.7% |
| No Computing Device | 168 | 36.3% |
| Total | 463 | 100.0% |
Internet Access in Dona Ana
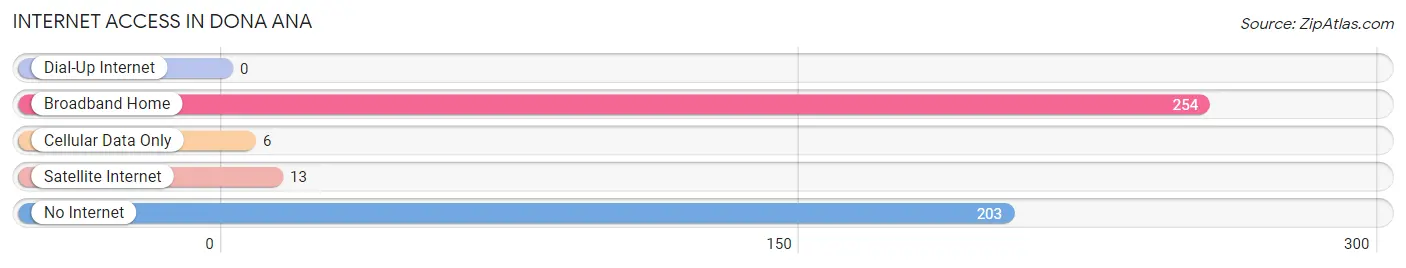
| Internet Type | # Households | % Households |
| Dial-Up Internet | 0 | 0.0% |
| Broadband Home | 254 | 54.9% |
| Cellular Data Only | 6 | 1.3% |
| Satellite Internet | 13 | 2.8% |
| No Internet | 203 | 43.8% |
| Total | 463 | 100.0% |
Dona Ana Summary
Dona Ana is a small unincorporated community located in Doña Ana County, New Mexico. It is situated on the banks of the Rio Grande, just south of Las Cruces. The population of Dona Ana was estimated to be 1,845 in 2019.
History
The area that is now Dona Ana was originally inhabited by the Manso Indians, who were part of the Pueblo culture. The first Europeans to settle in the area were Spanish explorers in the late 16th century. The area was part of the Spanish province of Nuevo Mexico, and was later part of Mexico after Mexico gained independence from Spain in 1821.
In 1848, the Treaty of Guadalupe Hidalgo was signed, which ceded the area to the United States. The area was then part of the New Mexico Territory, and was later part of the state of New Mexico when it was admitted to the Union in 1912.
The town of Dona Ana was founded in 1854 by a group of settlers from El Paso, Texas. The town was named after Doña Ana de la Garza, the wife of a local rancher. The town grew slowly, and by the early 20th century, it had a population of around 500.
Geography
Dona Ana is located in the Mesilla Valley, which is part of the Rio Grande Valley. The town is situated on the banks of the Rio Grande, just south of Las Cruces. The area is mostly flat, with some hills to the east. The climate is semi-arid, with hot summers and mild winters.
Economy
The economy of Dona Ana is largely based on agriculture. The area is known for its production of chile peppers, onions, and other vegetables. The town is also home to several small businesses, including restaurants, shops, and a few manufacturing plants.
Demographics
As of 2019, the population of Dona Ana was estimated to be 1,845. The population is mostly Hispanic, with a small percentage of other ethnicities. The median household income is $30,000, and the median age is 33. The town has a poverty rate of 24%, which is higher than the state average.
Conclusion
Dona Ana is a small unincorporated community located in Doña Ana County, New Mexico. It is situated on the banks of the Rio Grande, just south of Las Cruces. The population of Dona Ana was estimated to be 1,845 in 2019. The economy of Dona Ana is largely based on agriculture, and the population is mostly Hispanic. The town has a poverty rate of 24%, which is higher than the state average.
Common Questions
What is Per Capita Income in Dona Ana?
Per Capita income in Dona Ana is $15,466.
What is the Median Household income in Dona Ana?
Median Household Income in Dona Ana is $26,223.
What is Income or Wage Gap in Dona Ana?
Income or Wage Gap in Dona Ana is 22.4%.
Women in Dona Ana earn 77.6 cents for every dollar earned by a man.
What is Family Income Deficit in Dona Ana?
Family Income Deficit in Dona Ana is $4,797.
Families that are below poverty line in Dona Ana earn $4,797 less on average than the poverty threshold level.
What is Inequality or Gini Index in Dona Ana?
Inequality or Gini Index in Dona Ana is 0.40.
What is the Total Population of Dona Ana?
Total Population of Dona Ana is 1,344.
What is the Total Male Population of Dona Ana?
Total Male Population of Dona Ana is 692.
What is the Total Female Population of Dona Ana?
Total Female Population of Dona Ana is 652.
What is the Ratio of Males per 100 Females in Dona Ana?
There are 106.13 Males per 100 Females in Dona Ana.
What is the Ratio of Females per 100 Males in Dona Ana?
There are 94.22 Females per 100 Males in Dona Ana.
What is the Median Population Age in Dona Ana?
Median Population Age in Dona Ana is 42.9 Years.
What is the Average Family Size in Dona Ana
Average Family Size in Dona Ana is 3.4 People.
What is the Average Household Size in Dona Ana
Average Household Size in Dona Ana is 2.9 People.
How Large is the Labor Force in Dona Ana?
There are 536 People in the Labor Forcein in Dona Ana.
What is the Percentage of People in the Labor Force in Dona Ana?
52.2% of People are in the Labor Force in Dona Ana.