Placitas CDP Dona Ana County, NM Map & Demographics
Placitas CDP Dona Ana County Overview
$6,693
PER CAPITA INCOME
$13,354
AVG HOUSEHOLD INCOME
0.28
INEQUALITY / GINI INDEX
515
TOTAL POPULATION
141
MALE POPULATION
374
FEMALE POPULATION
37.70
MALES / 100 FEMALES
265.25
FEMALES / 100 MALES
19.5
MEDIAN AGE
4.8
AVG FAMILY SIZE
2.4
AVG HOUSEHOLD SIZE
218
LABOR FORCE [ PEOPLE ]
50.3%
PERCENT IN LABOR FORCE
21.1%
UNEMPLOYMENT RATE
Income in Placitas CDP Dona Ana County
Income Overview in Placitas CDP Dona Ana County
| Characteristic | Number | Measure |
| Per Capita Income | 515 | $6,693 |
| Median Family Income | 79 | $0 |
| Mean Family Income | 79 | $0 |
| Median Household Income | 212 | $13,354 |
| Mean Household Income | 212 | $16,092 |
| Income Deficit | 79 | $0 |
| Wage / Income Gap (%) | 515 | 0.00% |
| Wage / Income Gap ($) | 515 | 100.00¢ per $1 |
| Gini / Inequality Index | 515 | 0.28 |
Earnings by Sex in Placitas CDP Dona Ana County
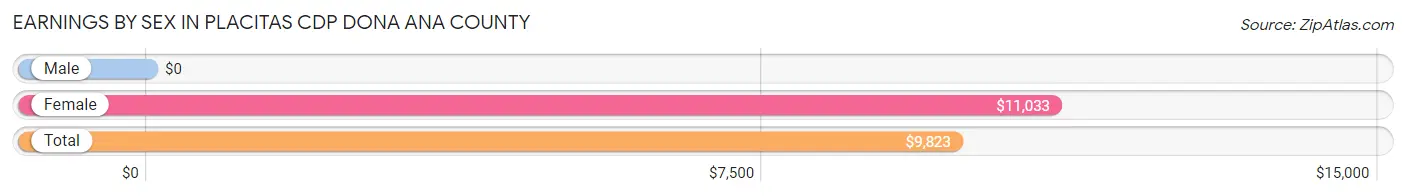
| Sex | Number | Average Earnings |
| Male | 51 (29.5%) | $0 |
| Female | 122 (70.5%) | $11,033 |
| Total | 173 (100.0%) | $9,823 |
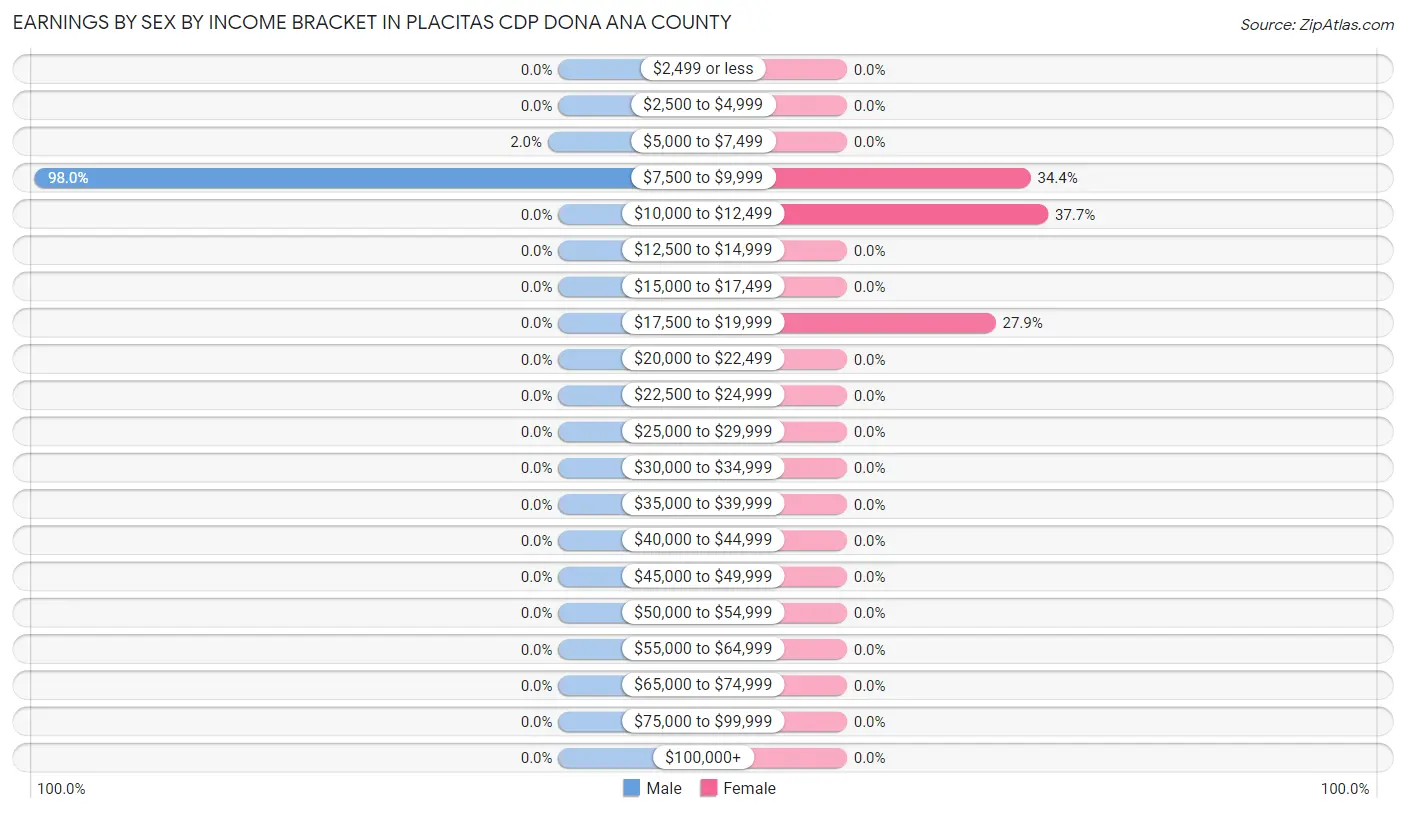
Earnings by Sex by Income Bracket in Placitas CDP Dona Ana County
The most common earnings brackets in Placitas CDP Dona Ana County are $7,500 to $9,999 for men (50 | 98.0%) and $10,000 to $12,499 for women (46 | 37.7%).
| Income | Male | Female |
| $2,499 or less | 0 (0.0%) | 0 (0.0%) |
| $2,500 to $4,999 | 0 (0.0%) | 0 (0.0%) |
| $5,000 to $7,499 | 1 (2.0%) | 0 (0.0%) |
| $7,500 to $9,999 | 50 (98.0%) | 42 (34.4%) |
| $10,000 to $12,499 | 0 (0.0%) | 46 (37.7%) |
| $12,500 to $14,999 | 0 (0.0%) | 0 (0.0%) |
| $15,000 to $17,499 | 0 (0.0%) | 0 (0.0%) |
| $17,500 to $19,999 | 0 (0.0%) | 34 (27.9%) |
| $20,000 to $22,499 | 0 (0.0%) | 0 (0.0%) |
| $22,500 to $24,999 | 0 (0.0%) | 0 (0.0%) |
| $25,000 to $29,999 | 0 (0.0%) | 0 (0.0%) |
| $30,000 to $34,999 | 0 (0.0%) | 0 (0.0%) |
| $35,000 to $39,999 | 0 (0.0%) | 0 (0.0%) |
| $40,000 to $44,999 | 0 (0.0%) | 0 (0.0%) |
| $45,000 to $49,999 | 0 (0.0%) | 0 (0.0%) |
| $50,000 to $54,999 | 0 (0.0%) | 0 (0.0%) |
| $55,000 to $64,999 | 0 (0.0%) | 0 (0.0%) |
| $65,000 to $74,999 | 0 (0.0%) | 0 (0.0%) |
| $75,000 to $99,999 | 0 (0.0%) | 0 (0.0%) |
| $100,000+ | 0 (0.0%) | 0 (0.0%) |
| Total | 51 (100.0%) | 122 (100.0%) |
Earnings by Sex by Educational Attainment in Placitas CDP Dona Ana County
| Educational Attainment | Male Income | Female Income |
| Less than High School | - | - |
| High School Diploma | - | - |
| College or Associate's Degree | - | - |
| Bachelor's Degree | - | - |
| Graduate Degree | - | - |
| Total | - | - |
Family Income in Placitas CDP Dona Ana County
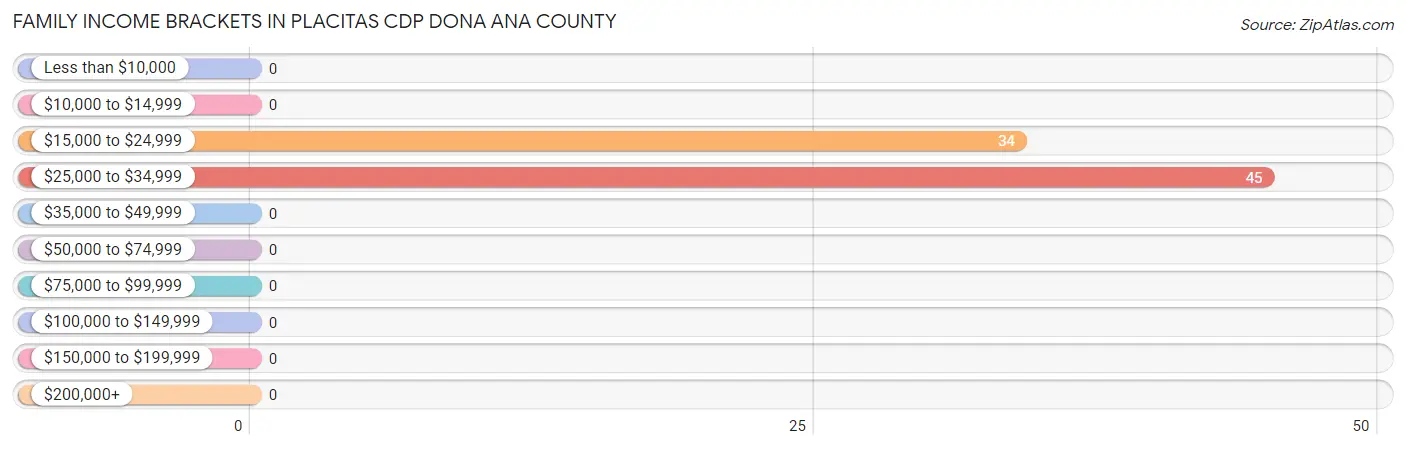
Family Income Brackets in Placitas CDP Dona Ana County
According to the Placitas CDP Dona Ana County family income data, there are 45 families falling into the $25,000 to $34,999 income range, which is the most common income bracket and makes up 57.0% of all families.
| Income Bracket | # Families | % Families |
| Less than $10,000 | 0 | 0.0% |
| $10,000 to $14,999 | 0 | 0.0% |
| $15,000 to $24,999 | 34 | 43.0% |
| $25,000 to $34,999 | 45 | 57.0% |
| $35,000 to $49,999 | 0 | 0.0% |
| $50,000 to $74,999 | 0 | 0.0% |
| $75,000 to $99,999 | 0 | 0.0% |
| $100,000 to $149,999 | 0 | 0.0% |
| $150,000 to $199,999 | 0 | 0.0% |
| $200,000+ | 0 | 0.0% |
Family Income by Famaliy Size in Placitas CDP Dona Ana County
| Income Bracket | # Families | Median Income |
| 2-Person Families | 0 (0.0%) | $0 |
| 3-Person Families | 0 (0.0%) | $0 |
| 4-Person Families | 34 (43.0%) | $0 |
| 5-Person Families | 45 (57.0%) | $0 |
| 6-Person Families | 0 (0.0%) | $0 |
| 7+ Person Families | 0 (0.0%) | $0 |
| Total | 79 (100.0%) | $0 |
Family Income by Number of Earners in Placitas CDP Dona Ana County
| Number of Earners | # Families | Median Income |
| No Earners | 0 (0.0%) | $0 |
| 1 Earner | 34 (43.0%) | $0 |
| 2 Earners | 0 (0.0%) | $0 |
| 3+ Earners | 45 (57.0%) | $0 |
| Total | 79 (100.0%) | $0 |
Household Income in Placitas CDP Dona Ana County
Household Income Brackets in Placitas CDP Dona Ana County
With 100 households falling in the category, the $10,000 to $14,999 income range is the most frequent in Placitas CDP Dona Ana County, accounting for 47.2% of all households.
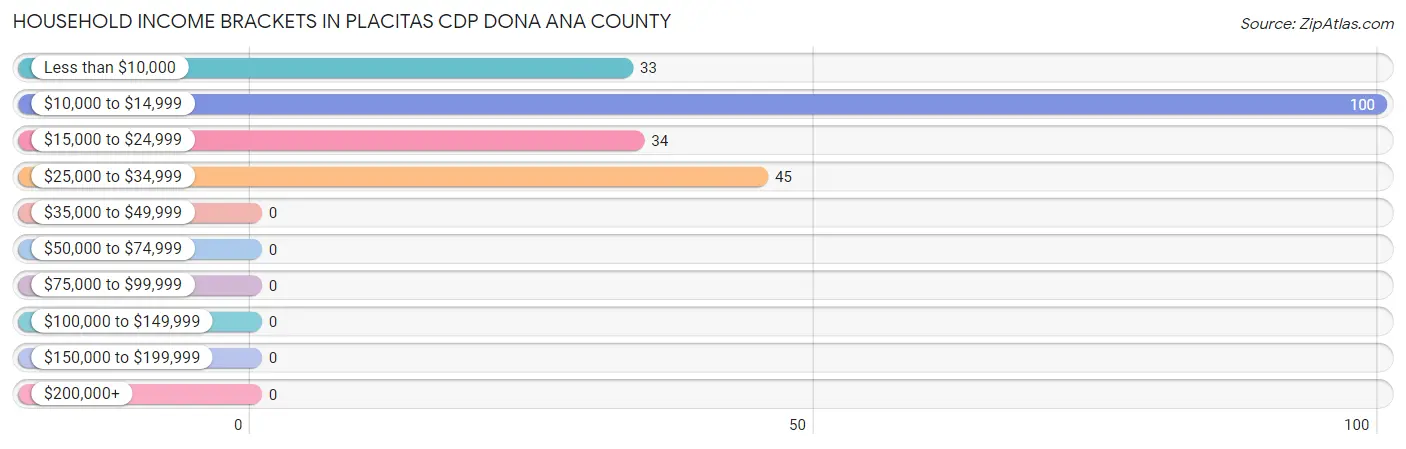
| Income Bracket | # Households | % Households |
| Less than $10,000 | 33 | 15.6% |
| $10,000 to $14,999 | 100 | 47.2% |
| $15,000 to $24,999 | 34 | 16.0% |
| $25,000 to $34,999 | 45 | 21.2% |
| $35,000 to $49,999 | 0 | 0.0% |
| $50,000 to $74,999 | 0 | 0.0% |
| $75,000 to $99,999 | 0 | 0.0% |
| $100,000 to $149,999 | 0 | 0.0% |
| $150,000 to $199,999 | 0 | 0.0% |
| $200,000+ | 0 | 0.0% |
Household Income by Householder Age in Placitas CDP Dona Ana County
The median household income in Placitas CDP Dona Ana County is $13,354, with the highest median household income of $30,278 found in the 45 to 64 years age bracket for the primary householder. A total of 80 households (37.7%) fall into this category.
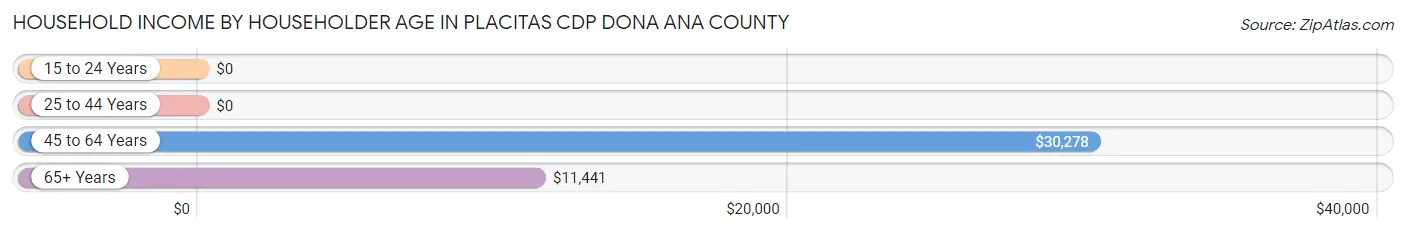
| Income Bracket | # Households | Median Income |
| 15 to 24 Years | 0 (0.0%) | $0 |
| 25 to 44 Years | 0 (0.0%) | $0 |
| 45 to 64 Years | 80 (37.7%) | $30,278 |
| 65+ Years | 132 (62.3%) | $11,441 |
| Total | 212 (100.0%) | $13,354 |
Poverty in Placitas CDP Dona Ana County
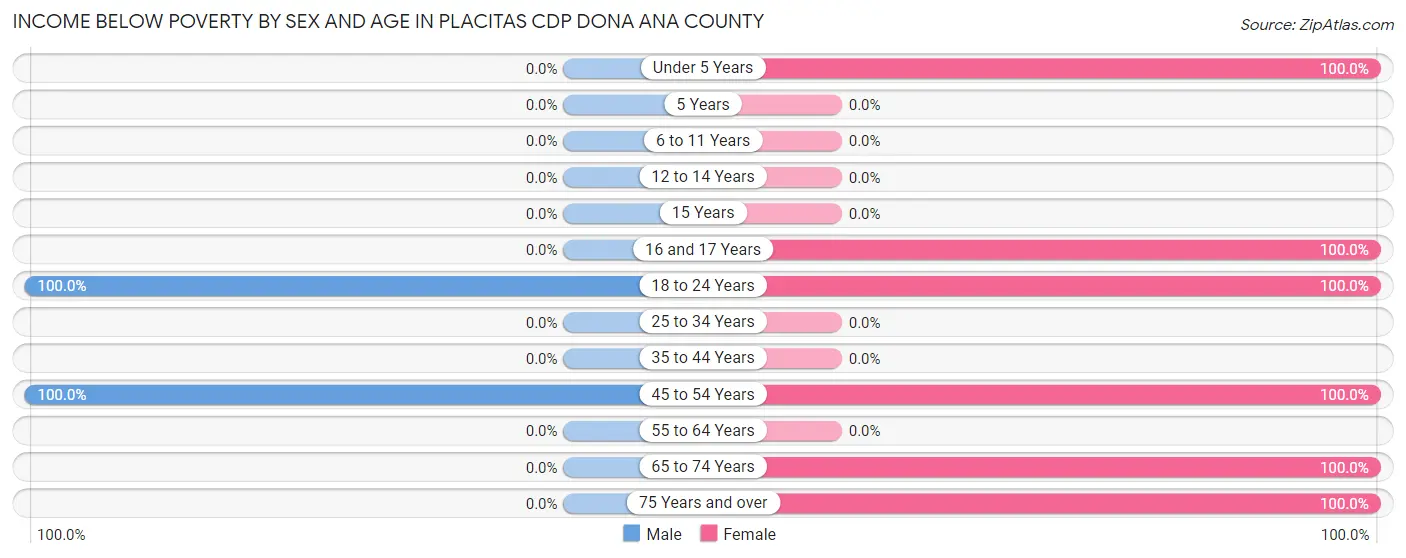
Income Below Poverty by Sex and Age in Placitas CDP Dona Ana County
With 100.0% poverty level for males and 100.0% for females among the residents of Placitas CDP Dona Ana County, 18 to 24 year old males and under 5 year old females are the most vulnerable to poverty, with 95 males (100.0%) and 82 females (100.0%) in their respective age groups living below the poverty level.
| Age Bracket | Male | Female |
| Under 5 Years | 0 (0.0%) | 82 (100.0%) |
| 5 Years | 0 (0.0%) | 0 (0.0%) |
| 6 to 11 Years | 0 (0.0%) | 0 (0.0%) |
| 12 to 14 Years | 0 (0.0%) | 0 (0.0%) |
| 15 Years | 0 (0.0%) | 0 (0.0%) |
| 16 and 17 Years | 0 (0.0%) | 80 (100.0%) |
| 18 to 24 Years | 95 (100.0%) | 46 (100.0%) |
| 25 to 34 Years | 0 (0.0%) | 0 (0.0%) |
| 35 to 44 Years | 0 (0.0%) | 0 (0.0%) |
| 45 to 54 Years | 46 (100.0%) | 34 (100.0%) |
| 55 to 64 Years | 0 (0.0%) | 0 (0.0%) |
| 65 to 74 Years | 0 (0.0%) | 30 (100.0%) |
| 75 Years and over | 0 (0.0%) | 102 (100.0%) |
| Total | 141 (100.0%) | 374 (100.0%) |
Income Above Poverty by Sex and Age in Placitas CDP Dona Ana County
| Age Bracket | Male | Female |
| Under 5 Years | 0 (0.0%) | 0 (0.0%) |
| 5 Years | 0 (0.0%) | 0 (0.0%) |
| 6 to 11 Years | 0 (0.0%) | 0 (0.0%) |
| 12 to 14 Years | 0 (0.0%) | 0 (0.0%) |
| 15 Years | 0 (0.0%) | 0 (0.0%) |
| 16 and 17 Years | 0 (0.0%) | 0 (0.0%) |
| 18 to 24 Years | 0 (0.0%) | 0 (0.0%) |
| 25 to 34 Years | 0 (0.0%) | 0 (0.0%) |
| 35 to 44 Years | 0 (0.0%) | 0 (0.0%) |
| 45 to 54 Years | 0 (0.0%) | 0 (0.0%) |
| 55 to 64 Years | 0 (0.0%) | 0 (0.0%) |
| 65 to 74 Years | 0 (0.0%) | 0 (0.0%) |
| 75 Years and over | 0 (0.0%) | 0 (0.0%) |
| Total | 0 (0.0%) | 0 (0.0%) |
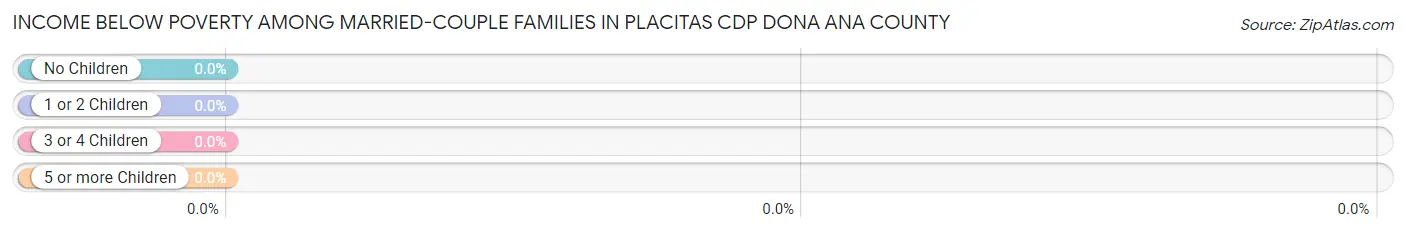
Income Below Poverty Among Married-Couple Families in Placitas CDP Dona Ana County
| Children | Above Poverty | Below Poverty |
| No Children | 0 (0.0%) | 0 (0.0%) |
| 1 or 2 Children | 0 (0.0%) | 0 (0.0%) |
| 3 or 4 Children | 0 (0.0%) | 0 (0.0%) |
| 5 or more Children | 0 (0.0%) | 0 (0.0%) |
| Total | 0 (0.0%) | 0 (0.0%) |
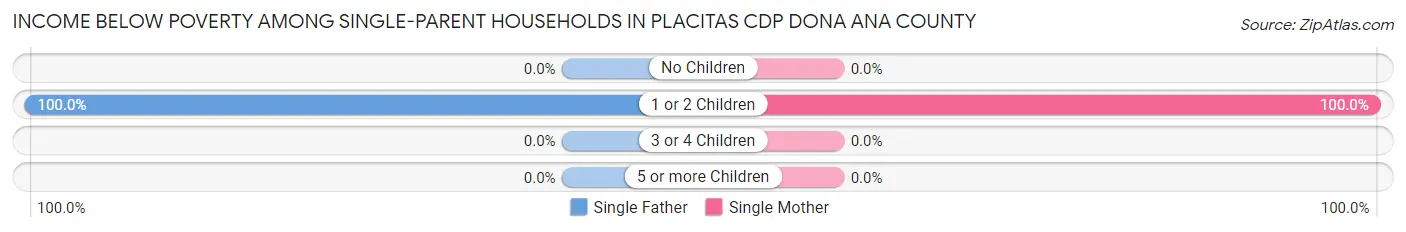
Income Below Poverty Among Single-Parent Households in Placitas CDP Dona Ana County
According to the poverty data in Placitas CDP Dona Ana County, 100.0% or 45 single-father households and 100.0% or 34 single-mother households are living below the poverty line. Among single-father households, those with 1 or 2 children have the highest poverty rate, with 45 households (100.0%) experiencing poverty. Likewise, among single-mother households, those with 1 or 2 children have the highest poverty rate, with 34 households (100.0%) falling below the poverty line.
| Children | Single Father | Single Mother |
| No Children | 0 (0.0%) | 0 (0.0%) |
| 1 or 2 Children | 45 (100.0%) | 34 (100.0%) |
| 3 or 4 Children | 0 (0.0%) | 0 (0.0%) |
| 5 or more Children | 0 (0.0%) | 0 (0.0%) |
| Total | 45 (100.0%) | 34 (100.0%) |
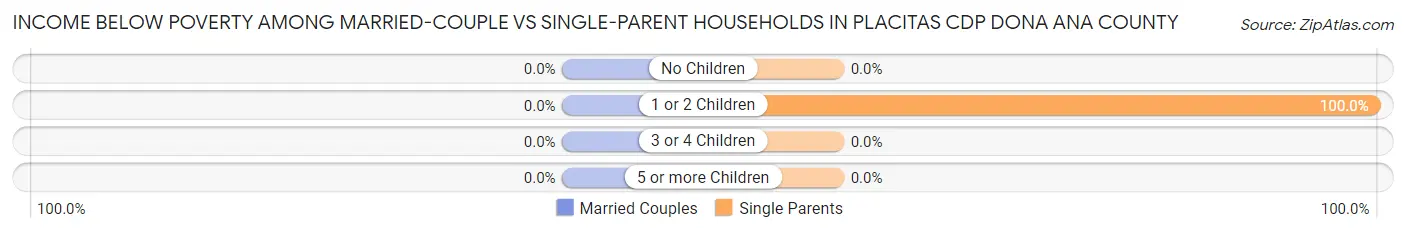
Income Below Poverty Among Married-Couple vs Single-Parent Households in Placitas CDP Dona Ana County
| Children | Married-Couple Families | Single-Parent Households |
| No Children | 0 (0.0%) | 0 (0.0%) |
| 1 or 2 Children | 0 (0.0%) | 79 (100.0%) |
| 3 or 4 Children | 0 (0.0%) | 0 (0.0%) |
| 5 or more Children | 0 (0.0%) | 0 (0.0%) |
| Total | 0 (0.0%) | 79 (100.0%) |
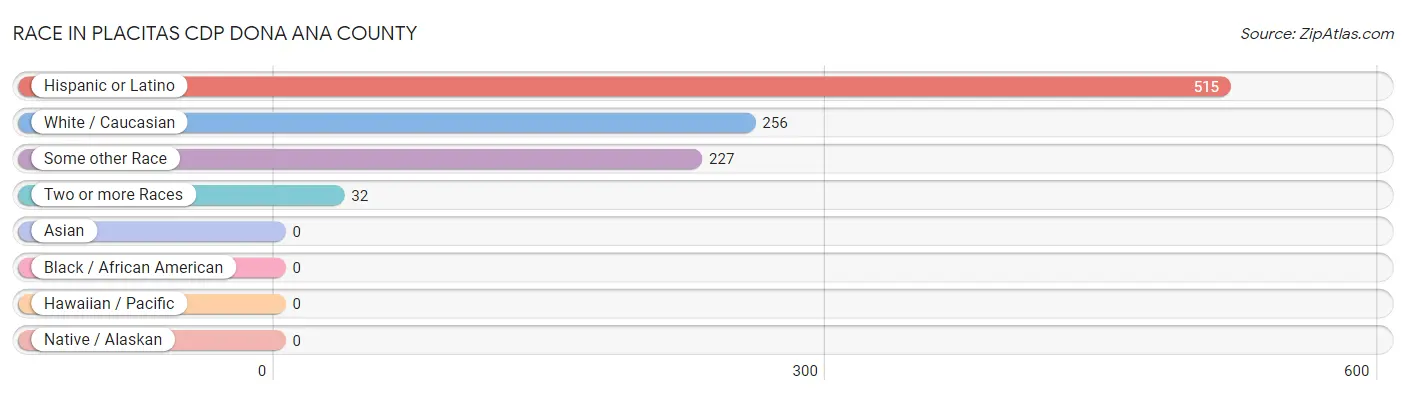
Race in Placitas CDP Dona Ana County
The most populous races in Placitas CDP Dona Ana County are Hispanic or Latino (515 | 100.0%), White / Caucasian (256 | 49.7%), and Some other Race (227 | 44.1%).
| Race | # Population | % Population |
| Asian | 0 | 0.0% |
| Black / African American | 0 | 0.0% |
| Hawaiian / Pacific | 0 | 0.0% |
| Hispanic or Latino | 515 | 100.0% |
| Native / Alaskan | 0 | 0.0% |
| White / Caucasian | 256 | 49.7% |
| Two or more Races | 32 | 6.2% |
| Some other Race | 227 | 44.1% |
| Total | 515 | 100.0% |
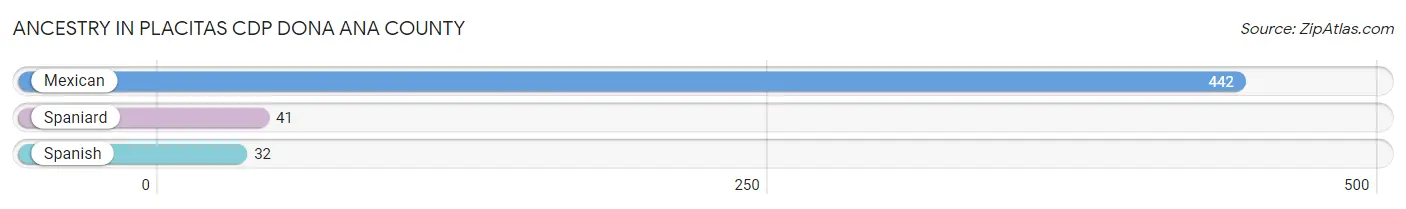
Ancestry in Placitas CDP Dona Ana County
The most populous ancestries reported in Placitas CDP Dona Ana County are Mexican (442 | 85.8%), Spaniard (41 | 8.0%), and Spanish (32 | 6.2%), together accounting for 100.0% of all Placitas CDP Dona Ana County residents.
| Ancestry | # Population | % Population |
| Mexican | 442 | 85.8% |
| Spaniard | 41 | 8.0% |
| Spanish | 32 | 6.2% | View All 3 Rows |
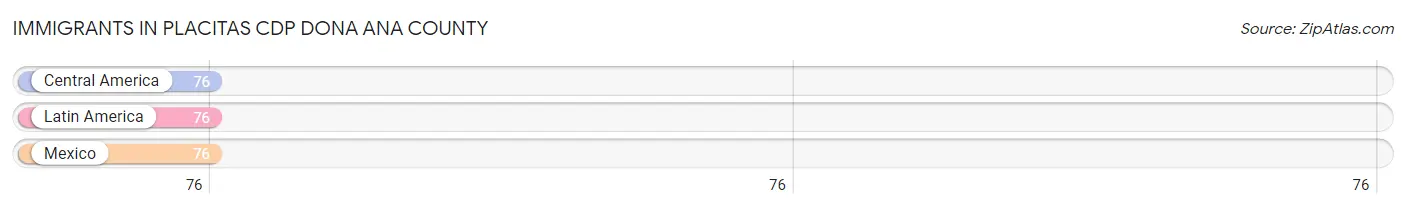
Immigrants in Placitas CDP Dona Ana County
The most numerous immigrant groups reported in Placitas CDP Dona Ana County came from Central America (76 | 14.8%), Latin America (76 | 14.8%), and Mexico (76 | 14.8%), together accounting for 44.3% of all Placitas CDP Dona Ana County residents.
| Immigration Origin | # Population | % Population |
| Central America | 76 | 14.8% |
| Latin America | 76 | 14.8% |
| Mexico | 76 | 14.8% | View All 3 Rows |
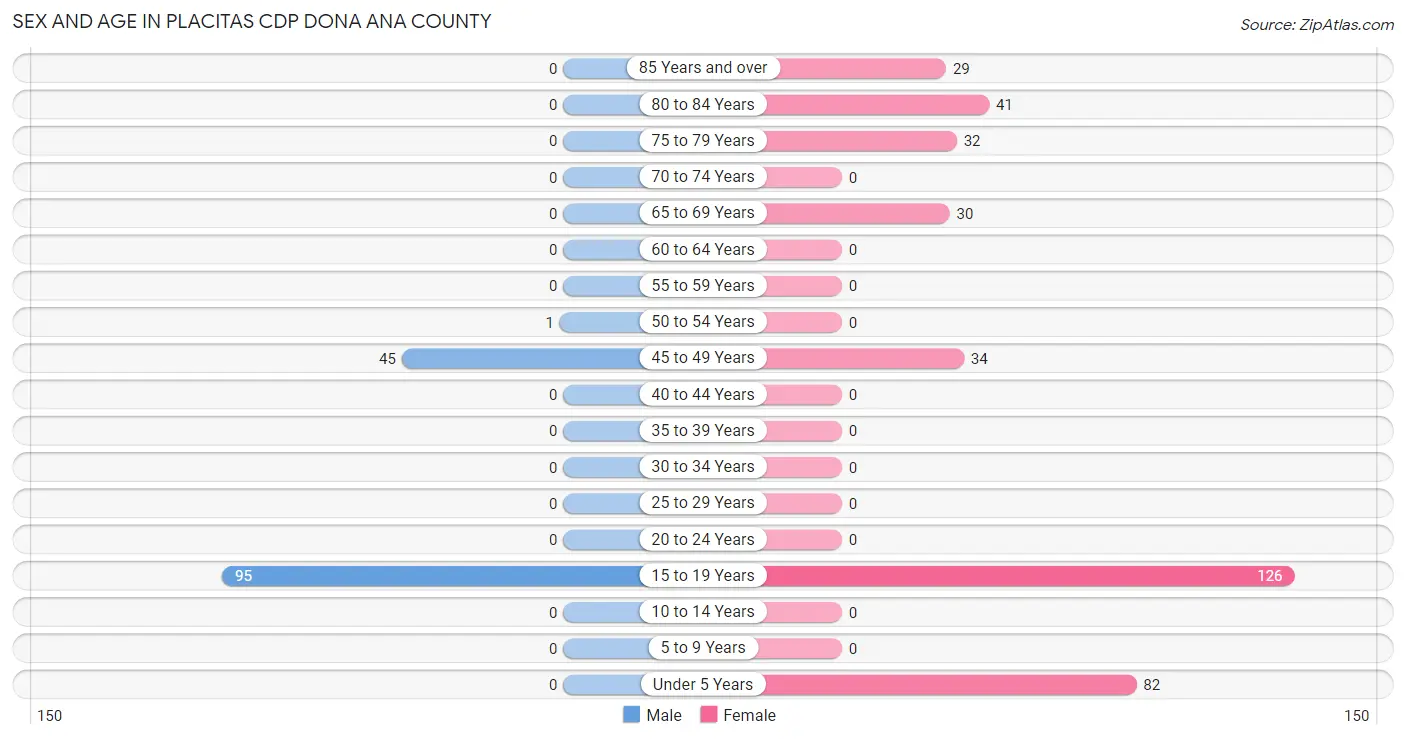
Sex and Age in Placitas CDP Dona Ana County
Sex and Age in Placitas CDP Dona Ana County
The most populous age groups in Placitas CDP Dona Ana County are 15 to 19 Years (95 | 67.4%) for men and 15 to 19 Years (126 | 33.7%) for women.
| Age Bracket | Male | Female |
| Under 5 Years | 0 (0.0%) | 82 (21.9%) |
| 5 to 9 Years | 0 (0.0%) | 0 (0.0%) |
| 10 to 14 Years | 0 (0.0%) | 0 (0.0%) |
| 15 to 19 Years | 95 (67.4%) | 126 (33.7%) |
| 20 to 24 Years | 0 (0.0%) | 0 (0.0%) |
| 25 to 29 Years | 0 (0.0%) | 0 (0.0%) |
| 30 to 34 Years | 0 (0.0%) | 0 (0.0%) |
| 35 to 39 Years | 0 (0.0%) | 0 (0.0%) |
| 40 to 44 Years | 0 (0.0%) | 0 (0.0%) |
| 45 to 49 Years | 45 (31.9%) | 34 (9.1%) |
| 50 to 54 Years | 1 (0.7%) | 0 (0.0%) |
| 55 to 59 Years | 0 (0.0%) | 0 (0.0%) |
| 60 to 64 Years | 0 (0.0%) | 0 (0.0%) |
| 65 to 69 Years | 0 (0.0%) | 30 (8.0%) |
| 70 to 74 Years | 0 (0.0%) | 0 (0.0%) |
| 75 to 79 Years | 0 (0.0%) | 32 (8.6%) |
| 80 to 84 Years | 0 (0.0%) | 41 (11.0%) |
| 85 Years and over | 0 (0.0%) | 29 (7.7%) |
| Total | 141 (100.0%) | 374 (100.0%) |
Families and Households in Placitas CDP Dona Ana County
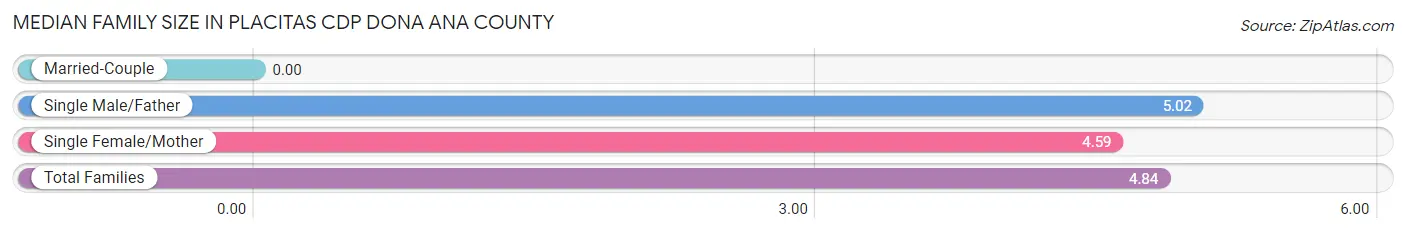
Median Family Size in Placitas CDP Dona Ana County
| Family Type | # Families | Family Size |
| Married-Couple | 0 (0.0%) | - |
| Single Male/Father | 45 (57.0%) | 5.02 |
| Single Female/Mother | 34 (43.0%) | 4.59 |
| Total Families | 79 (100.0%) | 4.84 |
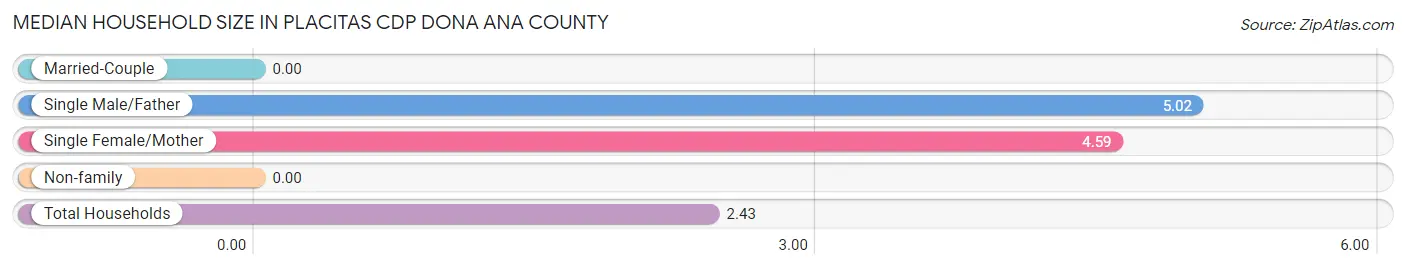
Median Household Size in Placitas CDP Dona Ana County
| Household Type | # Households | Household Size |
| Married-Couple | 0 (0.0%) | - |
| Single Male/Father | 45 (21.2%) | 5.02 |
| Single Female/Mother | 34 (16.0%) | 4.59 |
| Non-family | 133 (62.7%) | - |
| Total Households | 212 (100.0%) | 2.43 |
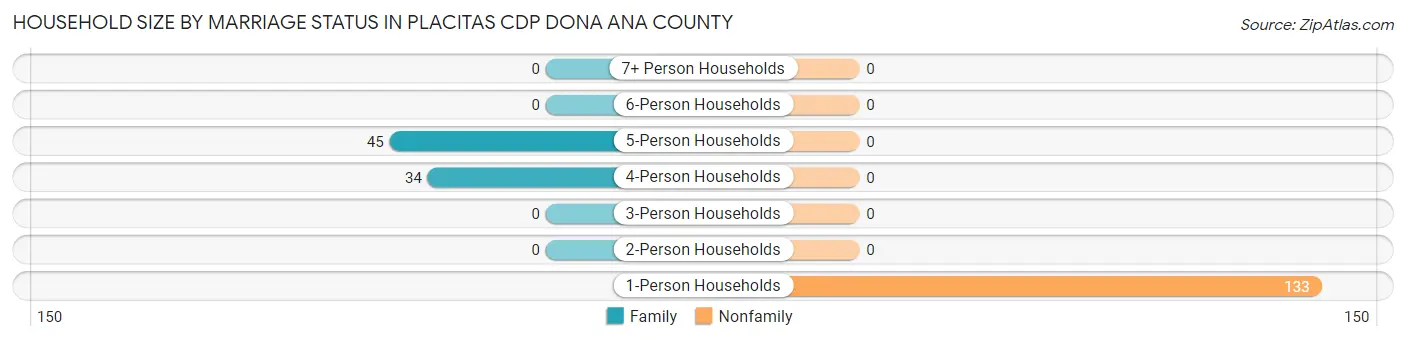
Household Size by Marriage Status in Placitas CDP Dona Ana County
Out of a total of 212 households in Placitas CDP Dona Ana County, 79 (37.3%) are family households, while 133 (62.7%) are nonfamily households. The most numerous type of family households are 5-person households, comprising 45, and the most common type of nonfamily households are 1-person households, comprising 133.
| Household Size | Family Households | Nonfamily Households |
| 1-Person Households | - | 133 (62.7%) |
| 2-Person Households | 0 (0.0%) | 0 (0.0%) |
| 3-Person Households | 0 (0.0%) | 0 (0.0%) |
| 4-Person Households | 34 (16.0%) | 0 (0.0%) |
| 5-Person Households | 45 (21.2%) | 0 (0.0%) |
| 6-Person Households | 0 (0.0%) | 0 (0.0%) |
| 7+ Person Households | 0 (0.0%) | 0 (0.0%) |
| Total | 79 (37.3%) | 133 (62.7%) |
Female Fertility in Placitas CDP Dona Ana County
Fertility by Age in Placitas CDP Dona Ana County
| Age Bracket | Women with Births | Births / 1,000 Women |
| 15 to 19 years | 0 (0.0%) | 0.0 |
| 20 to 34 years | 0 (0.0%) | 0.0 |
| 35 to 50 years | 0 (0.0%) | 0.0 |
| Total | 0 (0.0%) | 0.0 |
Fertility by Age by Marriage Status in Placitas CDP Dona Ana County
| Age Bracket | Married | Unmarried |
| 15 to 19 years | 0 (0.0%) | 0 (0.0%) |
| 20 to 34 years | 0 (0.0%) | 0 (0.0%) |
| 35 to 50 years | 0 (0.0%) | 0 (0.0%) |
| Total | 0 (0.0%) | 0 (0.0%) |
Fertility by Education in Placitas CDP Dona Ana County
| Educational Attainment | Women with Births | Births / 1,000 Women |
| Less than High School | 0 (0.0%) | 0.0 |
| High School Diploma | 0 (0.0%) | 0.0 |
| College or Associate's Degree | 0 (0.0%) | 0.0 |
| Bachelor's Degree | 0 (0.0%) | 0.0 |
| Graduate Degree | 0 (0.0%) | 0.0 |
| Total | 0 (0.0%) | 0.0 |
Fertility by Education by Marriage Status in Placitas CDP Dona Ana County
| Educational Attainment | Married | Unmarried |
| Less than High School | 0 (0.0%) | 0 (0.0%) |
| High School Diploma | 0 (0.0%) | 0 (0.0%) |
| College or Associate's Degree | 0 (0.0%) | 0 (0.0%) |
| Bachelor's Degree | 0 (0.0%) | 0 (0.0%) |
| Graduate Degree | 0 (0.0%) | 0 (0.0%) |
| Total | 0 (0.0%) | 0 (0.0%) |
Employment Characteristics in Placitas CDP Dona Ana County
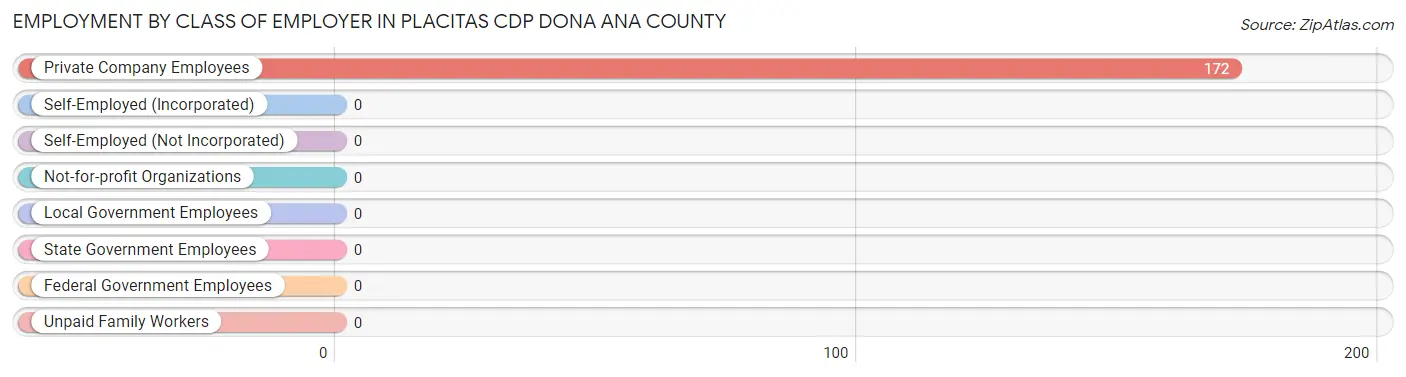
Employment by Class of Employer in Placitas CDP Dona Ana County
Among the 172 employed individuals in Placitas CDP Dona Ana County, , and private company employees (172 | 100.0%) make up the most common classes of employment.
| Employer Class | # Employees | % Employees |
| Private Company Employees | 172 | 100.0% |
| Self-Employed (Incorporated) | 0 | 0.0% |
| Self-Employed (Not Incorporated) | 0 | 0.0% |
| Not-for-profit Organizations | 0 | 0.0% |
| Local Government Employees | 0 | 0.0% |
| State Government Employees | 0 | 0.0% |
| Federal Government Employees | 0 | 0.0% |
| Unpaid Family Workers | 0 | 0.0% |
| Total | 172 | 100.0% |
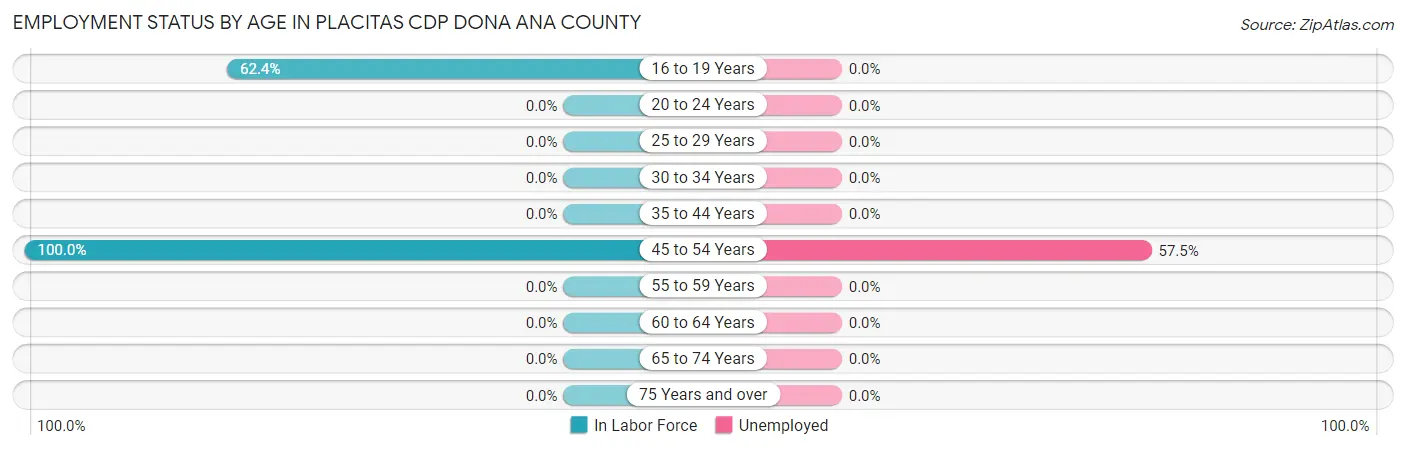
Employment Status by Age in Placitas CDP Dona Ana County
According to the labor force statistics for Placitas CDP Dona Ana County, out of the total population over 16 years of age (433), 50.3% or 218 individuals are in the labor force, with 21.1% or 46 of them unemployed. The age group with the highest labor force participation rate is 45 to 54 years, with 100.0% or 80 individuals in the labor force. Within the labor force, the 45 to 54 years age range has the highest percentage of unemployed individuals, with 57.5% or 46 of them being unemployed.
| Age Bracket | In Labor Force | Unemployed |
| 16 to 19 Years | 138 (62.4%) | 0 (0.0%) |
| 20 to 24 Years | 0 (0.0%) | 0 (0.0%) |
| 25 to 29 Years | 0 (0.0%) | 0 (0.0%) |
| 30 to 34 Years | 0 (0.0%) | 0 (0.0%) |
| 35 to 44 Years | 0 (0.0%) | 0 (0.0%) |
| 45 to 54 Years | 80 (100.0%) | 46 (57.5%) |
| 55 to 59 Years | 0 (0.0%) | 0 (0.0%) |
| 60 to 64 Years | 0 (0.0%) | 0 (0.0%) |
| 65 to 74 Years | 0 (0.0%) | 0 (0.0%) |
| 75 Years and over | 0 (0.0%) | 0 (0.0%) |
| Total | 218 (50.3%) | 46 (21.1%) |
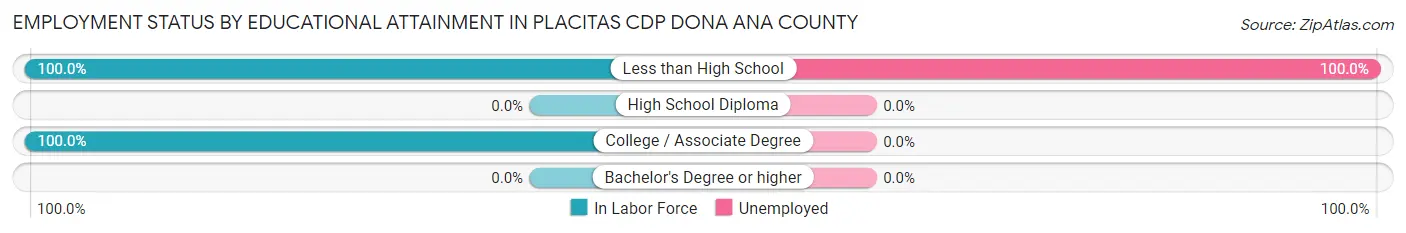
Employment Status by Educational Attainment in Placitas CDP Dona Ana County
According to labor force statistics for Placitas CDP Dona Ana County, 100.0% of individuals (80) out of the total population between 25 and 64 years of age (80) are in the labor force, with 57.5% or 46 of them being unemployed. The group with the highest labor force participation rate are those with the educational attainment of less than high school, with 100.0% or 46 individuals in the labor force. Within the labor force, individuals with less than high school education have the highest percentage of unemployment, with 100.0% or 46 of them being unemployed.
| Educational Attainment | In Labor Force | Unemployed |
| Less than High School | 46 (100.0%) | 46 (100.0%) |
| High School Diploma | 0 (0.0%) | 0 (0.0%) |
| College / Associate Degree | 34 (100.0%) | 0 (0.0%) |
| Bachelor's Degree or higher | 0 (0.0%) | 0 (0.0%) |
| Total | 80 (100.0%) | 46 (57.5%) |
Employment Occupations by Sex in Placitas CDP Dona Ana County
Management, Business, Science and Arts Occupations
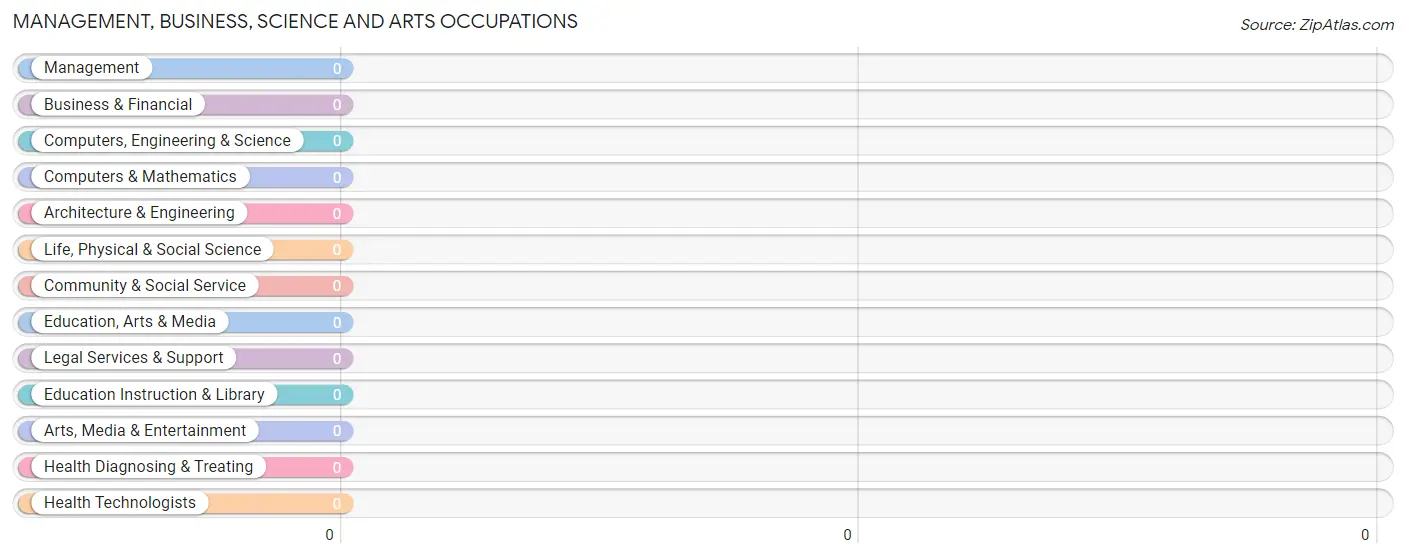
Management, Business, Science and Arts Occupations by Sex
| Occupation | Male | Female |
| Management | 0 (0.0%) | 0 (0.0%) |
| Business & Financial | 0 (0.0%) | 0 (0.0%) |
| Computers, Engineering & Science | 0 (0.0%) | 0 (0.0%) |
| Computers & Mathematics | 0 (0.0%) | 0 (0.0%) |
| Architecture & Engineering | 0 (0.0%) | 0 (0.0%) |
| Life, Physical & Social Science | 0 (0.0%) | 0 (0.0%) |
| Community & Social Service | 0 (0.0%) | 0 (0.0%) |
| Education, Arts & Media | 0 (0.0%) | 0 (0.0%) |
| Legal Services & Support | 0 (0.0%) | 0 (0.0%) |
| Education Instruction & Library | 0 (0.0%) | 0 (0.0%) |
| Arts, Media & Entertainment | 0 (0.0%) | 0 (0.0%) |
| Health Diagnosing & Treating | 0 (0.0%) | 0 (0.0%) |
| Health Technologists | 0 (0.0%) | 0 (0.0%) |
| Total (Category) | 0 (0.0%) | 0 (0.0%) |
| Total (Overall) | 50 (29.1%) | 122 (70.9%) |
Services Occupations
Services Occupations by Sex
| Occupation | Male | Female |
| Healthcare Support | 0 (0.0%) | 0 (0.0%) |
| Security & Protection | 0 (0.0%) | 0 (0.0%) |
| Firefighting & Prevention | 0 (0.0%) | 0 (0.0%) |
| Law Enforcement | 0 (0.0%) | 0 (0.0%) |
| Food Preparation & Serving | 0 (0.0%) | 0 (0.0%) |
| Cleaning & Maintenance | 0 (0.0%) | 0 (0.0%) |
| Personal Care & Service | 0 (0.0%) | 0 (0.0%) |
| Total (Category) | 0 (0.0%) | 0 (0.0%) |
| Total (Overall) | 50 (29.1%) | 122 (70.9%) |
Sales and Office Occupations
Sales and Office Occupations by Sex

| Occupation | Male | Female |
| Sales & Related | 0 (0.0%) | 0 (0.0%) |
| Office & Administration | 0 (0.0%) | 0 (0.0%) |
| Total (Category) | 0 (0.0%) | 0 (0.0%) |
| Total (Overall) | 50 (29.1%) | 122 (70.9%) |
Natural Resources, Construction and Maintenance Occupations
The most common Natural Resources, Construction and Maintenance occupations in Placitas CDP Dona Ana County are , and Farming, Fishing & Forestry (84 | 48.8%).
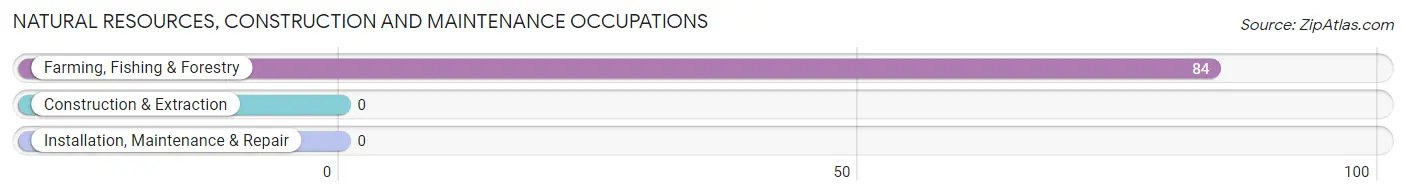
Natural Resources, Construction and Maintenance Occupations by Sex
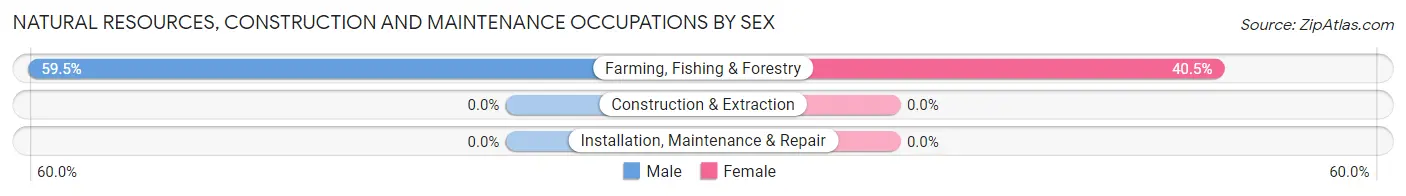
| Occupation | Male | Female |
| Farming, Fishing & Forestry | 50 (59.5%) | 34 (40.5%) |
| Construction & Extraction | 0 (0.0%) | 0 (0.0%) |
| Installation, Maintenance & Repair | 0 (0.0%) | 0 (0.0%) |
| Total (Category) | 50 (59.5%) | 34 (40.5%) |
| Total (Overall) | 50 (29.1%) | 122 (70.9%) |
Production, Transportation and Moving Occupations
The most common Production, Transportation and Moving occupations in Placitas CDP Dona Ana County are , and Material Moving (88 | 51.2%).
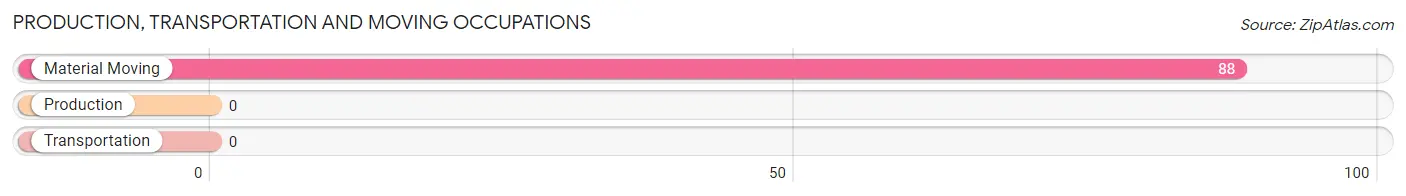
Production, Transportation and Moving Occupations by Sex
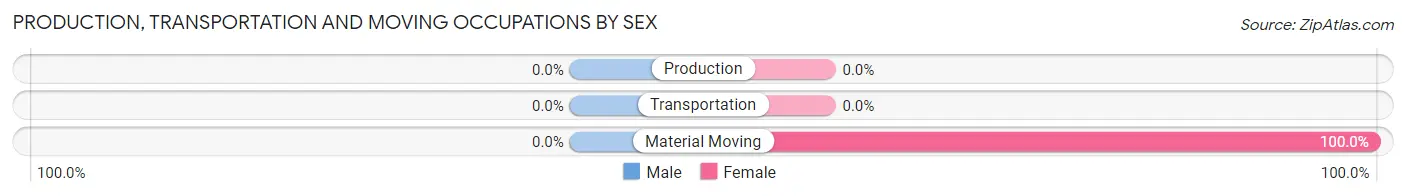
| Occupation | Male | Female |
| Production | 0 (0.0%) | 0 (0.0%) |
| Transportation | 0 (0.0%) | 0 (0.0%) |
| Material Moving | 0 (0.0%) | 88 (100.0%) |
| Total (Category) | 0 (0.0%) | 88 (100.0%) |
| Total (Overall) | 50 (29.1%) | 122 (70.9%) |
Employment Industries by Sex in Placitas CDP Dona Ana County
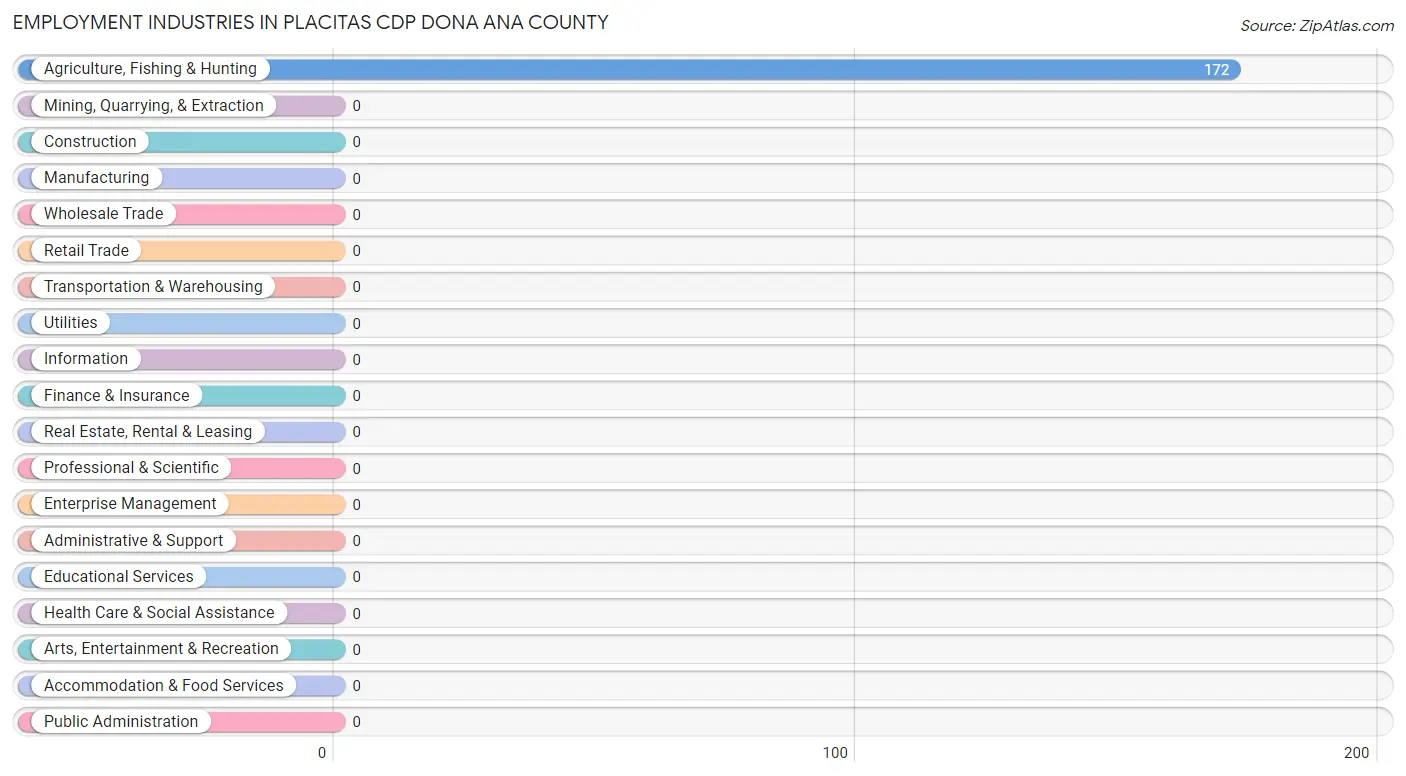
Employment Industries in Placitas CDP Dona Ana County
The major employment industries in Placitas CDP Dona Ana County include , and Agriculture, Fishing & Hunting (172 | 100.0%).
Employment Industries by Sex in Placitas CDP Dona Ana County
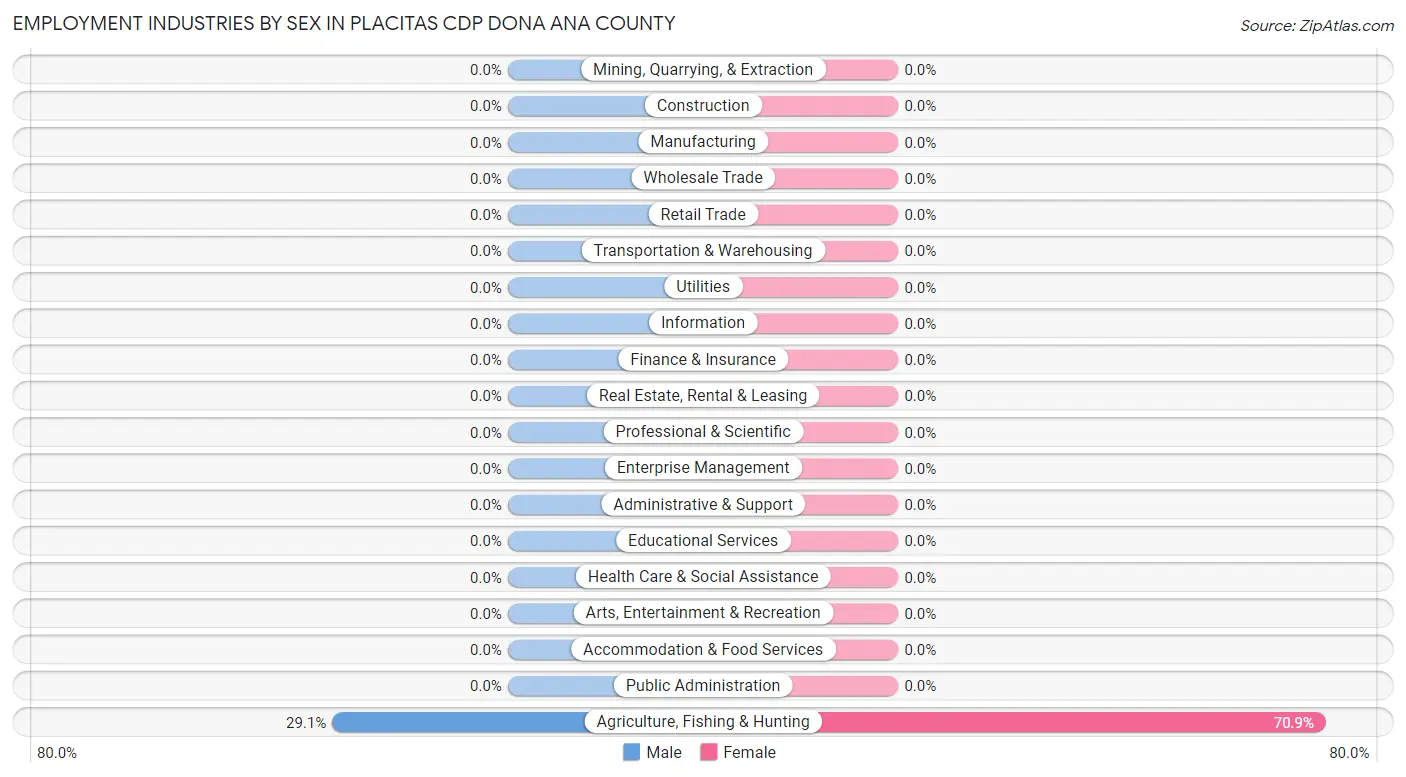
| Industry | Male | Female |
| Agriculture, Fishing & Hunting | 50 (29.1%) | 122 (70.9%) |
| Mining, Quarrying, & Extraction | 0 (0.0%) | 0 (0.0%) |
| Construction | 0 (0.0%) | 0 (0.0%) |
| Manufacturing | 0 (0.0%) | 0 (0.0%) |
| Wholesale Trade | 0 (0.0%) | 0 (0.0%) |
| Retail Trade | 0 (0.0%) | 0 (0.0%) |
| Transportation & Warehousing | 0 (0.0%) | 0 (0.0%) |
| Utilities | 0 (0.0%) | 0 (0.0%) |
| Information | 0 (0.0%) | 0 (0.0%) |
| Finance & Insurance | 0 (0.0%) | 0 (0.0%) |
| Real Estate, Rental & Leasing | 0 (0.0%) | 0 (0.0%) |
| Professional & Scientific | 0 (0.0%) | 0 (0.0%) |
| Enterprise Management | 0 (0.0%) | 0 (0.0%) |
| Administrative & Support | 0 (0.0%) | 0 (0.0%) |
| Educational Services | 0 (0.0%) | 0 (0.0%) |
| Health Care & Social Assistance | 0 (0.0%) | 0 (0.0%) |
| Arts, Entertainment & Recreation | 0 (0.0%) | 0 (0.0%) |
| Accommodation & Food Services | 0 (0.0%) | 0 (0.0%) |
| Public Administration | 0 (0.0%) | 0 (0.0%) |
| Total | 50 (29.1%) | 122 (70.9%) |
Education in Placitas CDP Dona Ana County
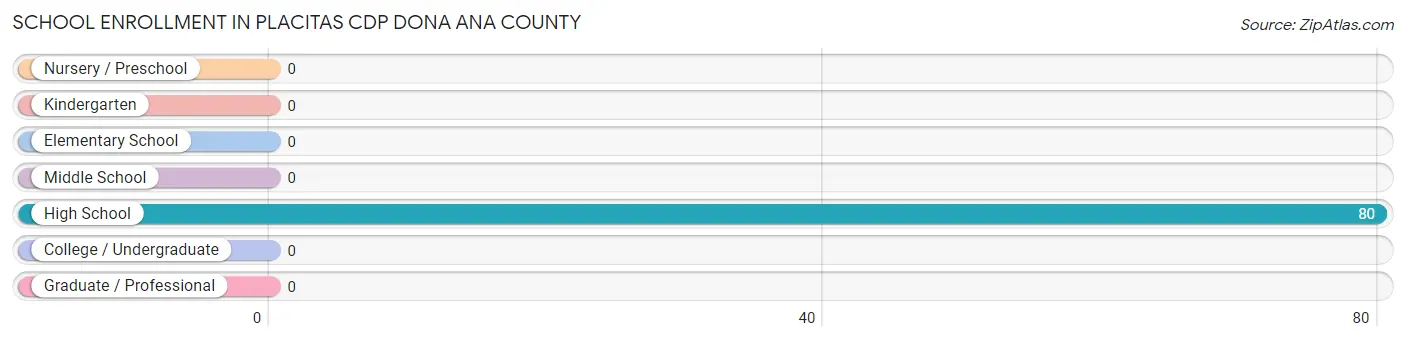
School Enrollment in Placitas CDP Dona Ana County
| School Level | # Students | % Students |
| Nursery / Preschool | 0 | 0.0% |
| Kindergarten | 0 | 0.0% |
| Elementary School | 0 | 0.0% |
| Middle School | 0 | 0.0% |
| High School | 80 | 100.0% |
| College / Undergraduate | 0 | 0.0% |
| Graduate / Professional | 0 | 0.0% |
| Total | 80 | 100.0% |
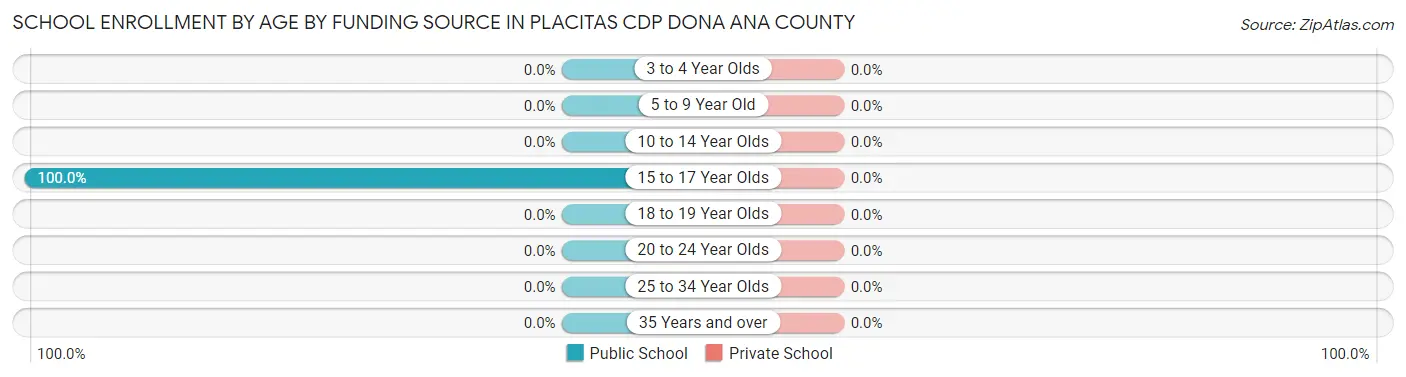
School Enrollment by Age by Funding Source in Placitas CDP Dona Ana County
| Age Bracket | Public School | Private School |
| 3 to 4 Year Olds | 0 (0.0%) | 0 (0.0%) |
| 5 to 9 Year Old | 0 (0.0%) | 0 (0.0%) |
| 10 to 14 Year Olds | 0 (0.0%) | 0 (0.0%) |
| 15 to 17 Year Olds | 80 (100.0%) | 0 (0.0%) |
| 18 to 19 Year Olds | 0 (0.0%) | 0 (0.0%) |
| 20 to 24 Year Olds | 0 (0.0%) | 0 (0.0%) |
| 25 to 34 Year Olds | 0 (0.0%) | 0 (0.0%) |
| 35 Years and over | 0 (0.0%) | 0 (0.0%) |
| Total | 80 (100.0%) | 0 (0.0%) |
Educational Attainment by Field of Study in Placitas CDP Dona Ana County
| Field of Study | # Graduates | % Graduates |
| Computers & Mathematics | 0 | 0.0% |
| Bio, Nature & Agricultural | 0 | 0.0% |
| Physical & Health Sciences | 0 | 0.0% |
| Psychology | 0 | 0.0% |
| Social Sciences | 0 | 0.0% |
| Engineering | 0 | 0.0% |
| Multidisciplinary Studies | 0 | 0.0% |
| Science & Technology | 0 | 0.0% |
| Business | 0 | 0.0% |
| Education | 0 | 0.0% |
| Literature & Languages | 0 | 0.0% |
| Liberal Arts & History | 0 | 0.0% |
| Visual & Performing Arts | 0 | 0.0% |
| Communications | 0 | 0.0% |
| Arts & Humanities | 0 | 0.0% |
| Total | 0 | 0.0% |
Transportation & Commute in Placitas CDP Dona Ana County
Vehicle Availability by Sex in Placitas CDP Dona Ana County
The most prevalent vehicle ownership categories in Placitas CDP Dona Ana County are males with 2 vehicles (50, accounting for 100.0%) and females with 2 vehicles (122, making up 41.0%).
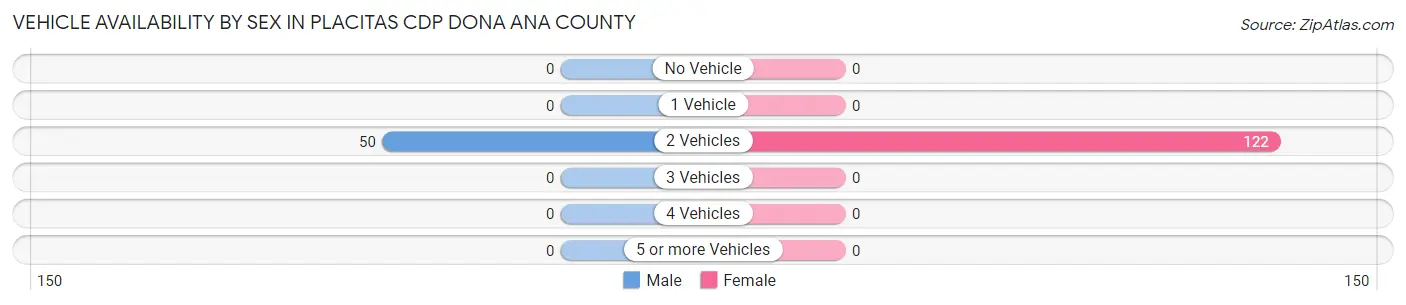
| Vehicles Available | Male | Female |
| No Vehicle | 0 (0.0%) | 0 (0.0%) |
| 1 Vehicle | 0 (0.0%) | 0 (0.0%) |
| 2 Vehicles | 50 (100.0%) | 122 (100.0%) |
| 3 Vehicles | 0 (0.0%) | 0 (0.0%) |
| 4 Vehicles | 0 (0.0%) | 0 (0.0%) |
| 5 or more Vehicles | 0 (0.0%) | 0 (0.0%) |
| Total | 50 (100.0%) | 122 (100.0%) |
Commute Time in Placitas CDP Dona Ana County
The most frequently occuring commute durations in Placitas CDP Dona Ana County are 5 to 9 minutes (88 commuters, 51.2%), 25 to 29 minutes (84 commuters, 48.8%), and less than 5 minutes (0 commuters, 0.0%).
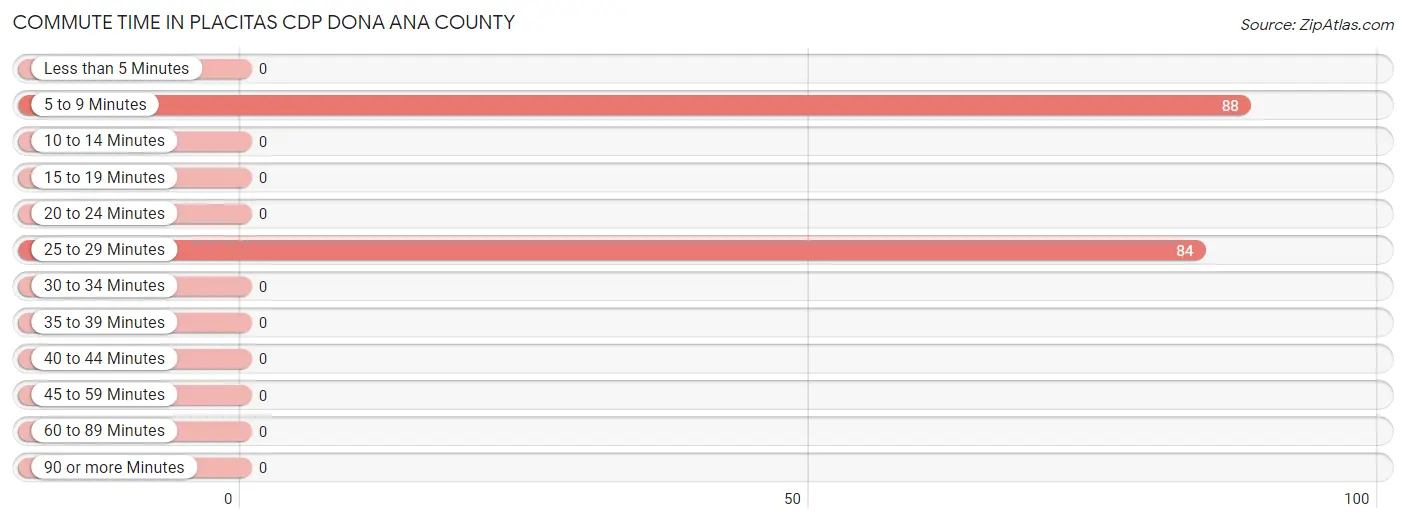
| Commute Time | # Commuters | % Commuters |
| Less than 5 Minutes | 0 | 0.0% |
| 5 to 9 Minutes | 88 | 51.2% |
| 10 to 14 Minutes | 0 | 0.0% |
| 15 to 19 Minutes | 0 | 0.0% |
| 20 to 24 Minutes | 0 | 0.0% |
| 25 to 29 Minutes | 84 | 48.8% |
| 30 to 34 Minutes | 0 | 0.0% |
| 35 to 39 Minutes | 0 | 0.0% |
| 40 to 44 Minutes | 0 | 0.0% |
| 45 to 59 Minutes | 0 | 0.0% |
| 60 to 89 Minutes | 0 | 0.0% |
| 90 or more Minutes | 0 | 0.0% |
Commute Time by Sex in Placitas CDP Dona Ana County
The most common commute times in Placitas CDP Dona Ana County are 25 to 29 minutes (50 commuters, 100.0%) for males and 5 to 9 minutes (88 commuters, 72.1%) for females.
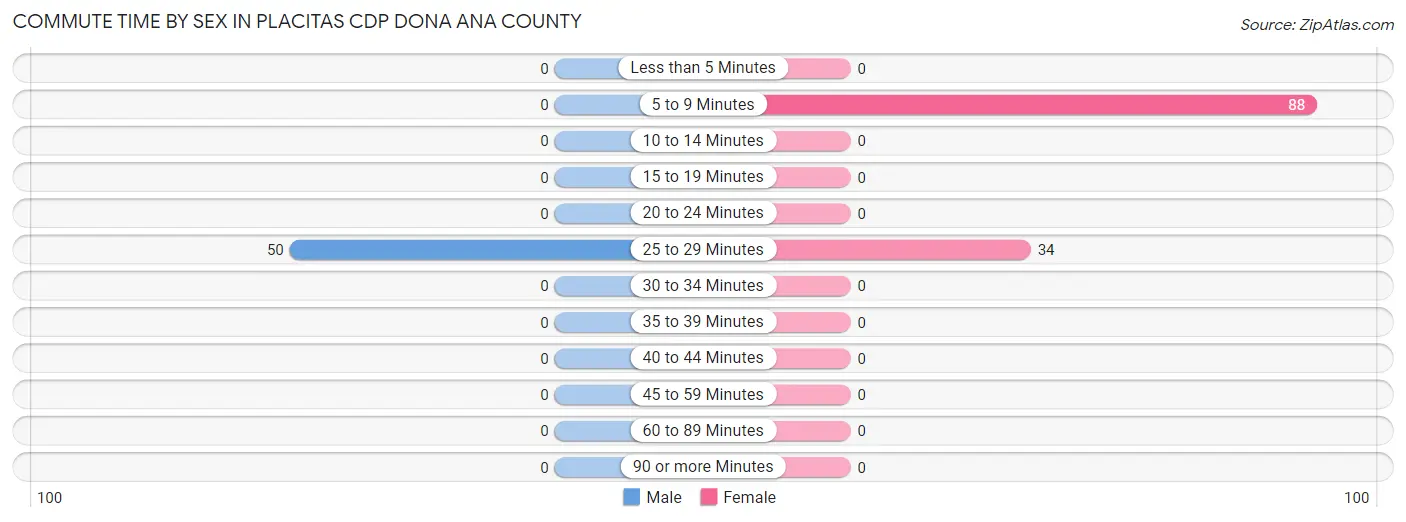
| Commute Time | Male | Female |
| Less than 5 Minutes | 0 (0.0%) | 0 (0.0%) |
| 5 to 9 Minutes | 0 (0.0%) | 88 (72.1%) |
| 10 to 14 Minutes | 0 (0.0%) | 0 (0.0%) |
| 15 to 19 Minutes | 0 (0.0%) | 0 (0.0%) |
| 20 to 24 Minutes | 0 (0.0%) | 0 (0.0%) |
| 25 to 29 Minutes | 50 (100.0%) | 34 (27.9%) |
| 30 to 34 Minutes | 0 (0.0%) | 0 (0.0%) |
| 35 to 39 Minutes | 0 (0.0%) | 0 (0.0%) |
| 40 to 44 Minutes | 0 (0.0%) | 0 (0.0%) |
| 45 to 59 Minutes | 0 (0.0%) | 0 (0.0%) |
| 60 to 89 Minutes | 0 (0.0%) | 0 (0.0%) |
| 90 or more Minutes | 0 (0.0%) | 0 (0.0%) |
Time of Departure to Work by Sex in Placitas CDP Dona Ana County
The most frequent times of departure to work in Placitas CDP Dona Ana County are 7:00 AM to 7:29 AM (50, 100.0%) for males and 7:00 AM to 7:29 AM (88, 72.1%) for females.
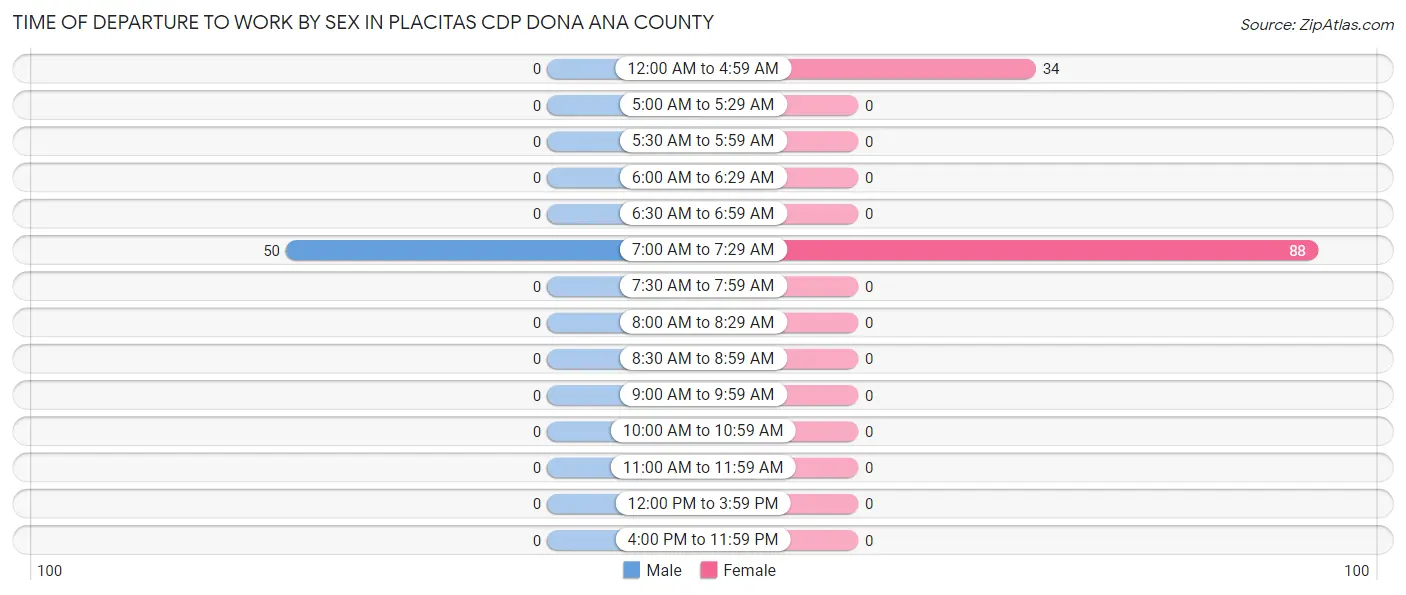
| Time of Departure | Male | Female |
| 12:00 AM to 4:59 AM | 0 (0.0%) | 34 (27.9%) |
| 5:00 AM to 5:29 AM | 0 (0.0%) | 0 (0.0%) |
| 5:30 AM to 5:59 AM | 0 (0.0%) | 0 (0.0%) |
| 6:00 AM to 6:29 AM | 0 (0.0%) | 0 (0.0%) |
| 6:30 AM to 6:59 AM | 0 (0.0%) | 0 (0.0%) |
| 7:00 AM to 7:29 AM | 50 (100.0%) | 88 (72.1%) |
| 7:30 AM to 7:59 AM | 0 (0.0%) | 0 (0.0%) |
| 8:00 AM to 8:29 AM | 0 (0.0%) | 0 (0.0%) |
| 8:30 AM to 8:59 AM | 0 (0.0%) | 0 (0.0%) |
| 9:00 AM to 9:59 AM | 0 (0.0%) | 0 (0.0%) |
| 10:00 AM to 10:59 AM | 0 (0.0%) | 0 (0.0%) |
| 11:00 AM to 11:59 AM | 0 (0.0%) | 0 (0.0%) |
| 12:00 PM to 3:59 PM | 0 (0.0%) | 0 (0.0%) |
| 4:00 PM to 11:59 PM | 0 (0.0%) | 0 (0.0%) |
| Total | 50 (100.0%) | 122 (100.0%) |
Housing Occupancy in Placitas CDP Dona Ana County
Occupancy by Ownership in Placitas CDP Dona Ana County
Of the total 212 dwellings in Placitas CDP Dona Ana County, owner-occupied units account for 70 (33.0%), while renter-occupied units make up 142 (67.0%).
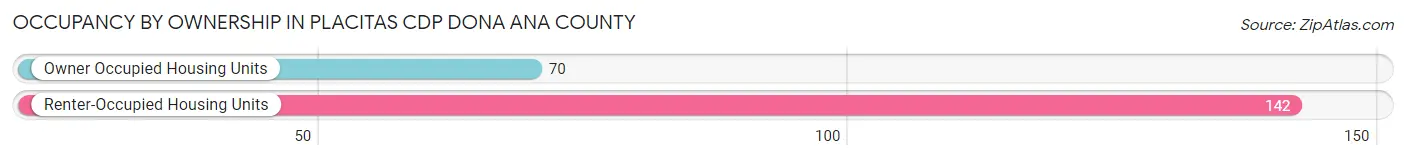
| Occupancy | # Housing Units | % Housing Units |
| Owner Occupied Housing Units | 70 | 33.0% |
| Renter-Occupied Housing Units | 142 | 67.0% |
| Total Occupied Housing Units | 212 | 100.0% |
Occupancy by Household Size in Placitas CDP Dona Ana County
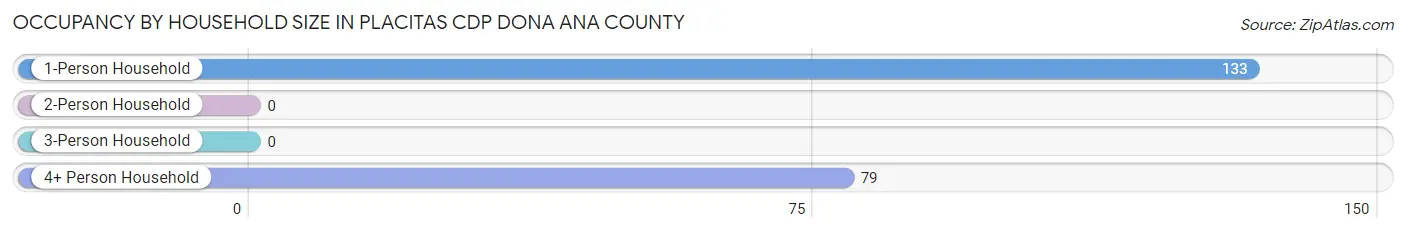
| Household Size | # Housing Units | % Housing Units |
| 1-Person Household | 133 | 62.7% |
| 2-Person Household | 0 | 0.0% |
| 3-Person Household | 0 | 0.0% |
| 4+ Person Household | 79 | 37.3% |
| Total Housing Units | 212 | 100.0% |
Occupancy by Ownership by Household Size in Placitas CDP Dona Ana County
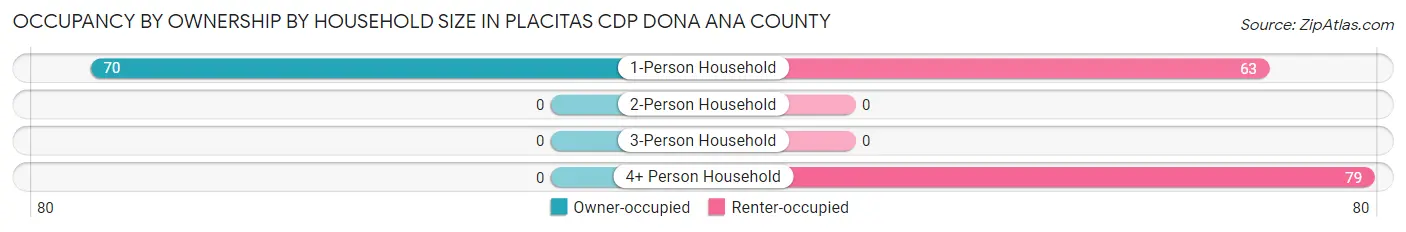
| Household Size | Owner-occupied | Renter-occupied |
| 1-Person Household | 70 (52.6%) | 63 (47.4%) |
| 2-Person Household | 0 (0.0%) | 0 (0.0%) |
| 3-Person Household | 0 (0.0%) | 0 (0.0%) |
| 4+ Person Household | 0 (0.0%) | 79 (100.0%) |
| Total Housing Units | 70 (33.0%) | 142 (67.0%) |
Occupancy by Educational Attainment in Placitas CDP Dona Ana County
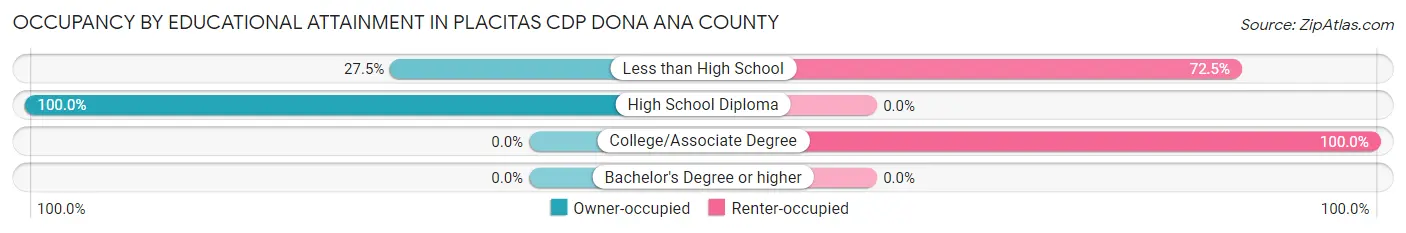
| Household Size | Owner-occupied | Renter-occupied |
| Less than High School | 41 (27.5%) | 108 (72.5%) |
| High School Diploma | 29 (100.0%) | 0 (0.0%) |
| College/Associate Degree | 0 (0.0%) | 34 (100.0%) |
| Bachelor's Degree or higher | 0 (0.0%) | 0 (0.0%) |
Occupancy by Age of Householder in Placitas CDP Dona Ana County
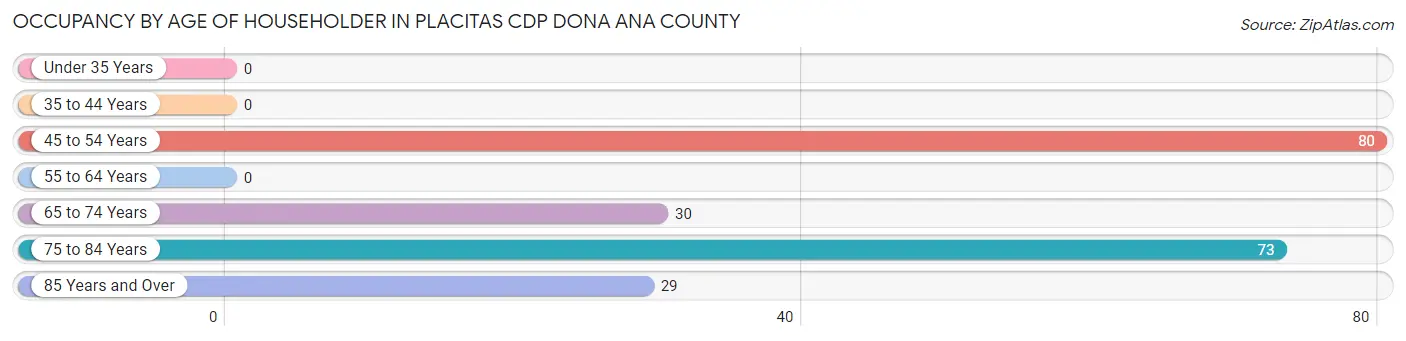
| Age Bracket | # Households | % Households |
| Under 35 Years | 0 | 0.0% |
| 35 to 44 Years | 0 | 0.0% |
| 45 to 54 Years | 80 | 37.7% |
| 55 to 64 Years | 0 | 0.0% |
| 65 to 74 Years | 30 | 14.1% |
| 75 to 84 Years | 73 | 34.4% |
| 85 Years and Over | 29 | 13.7% |
| Total | 212 | 100.0% |
Housing Finances in Placitas CDP Dona Ana County
Median Income by Occupancy in Placitas CDP Dona Ana County
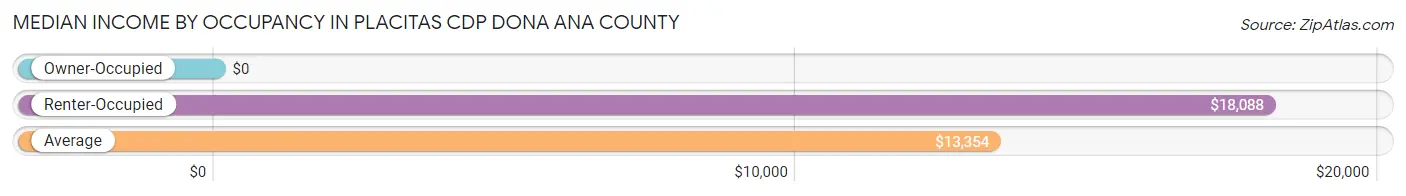
| Occupancy Type | # Households | Median Income |
| Owner-Occupied | 70 (33.0%) | $0 |
| Renter-Occupied | 142 (67.0%) | $18,088 |
| Average | 212 (100.0%) | $13,354 |
Occupancy by Householder Income Bracket in Placitas CDP Dona Ana County
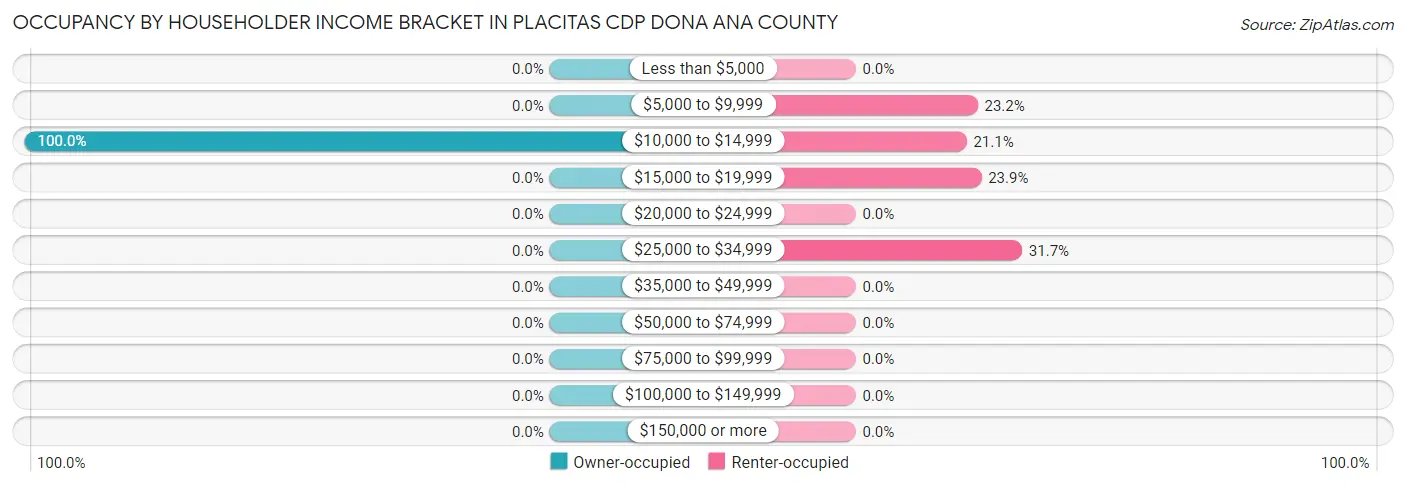
| Income Bracket | Owner-occupied | Renter-occupied |
| Less than $5,000 | 0 (0.0%) | 0 (0.0%) |
| $5,000 to $9,999 | 0 (0.0%) | 33 (23.2%) |
| $10,000 to $14,999 | 70 (100.0%) | 30 (21.1%) |
| $15,000 to $19,999 | 0 (0.0%) | 34 (23.9%) |
| $20,000 to $24,999 | 0 (0.0%) | 0 (0.0%) |
| $25,000 to $34,999 | 0 (0.0%) | 45 (31.7%) |
| $35,000 to $49,999 | 0 (0.0%) | 0 (0.0%) |
| $50,000 to $74,999 | 0 (0.0%) | 0 (0.0%) |
| $75,000 to $99,999 | 0 (0.0%) | 0 (0.0%) |
| $100,000 to $149,999 | 0 (0.0%) | 0 (0.0%) |
| $150,000 or more | 0 (0.0%) | 0 (0.0%) |
| Total | 70 (100.0%) | 142 (100.0%) |
Monthly Housing Cost Tiers in Placitas CDP Dona Ana County
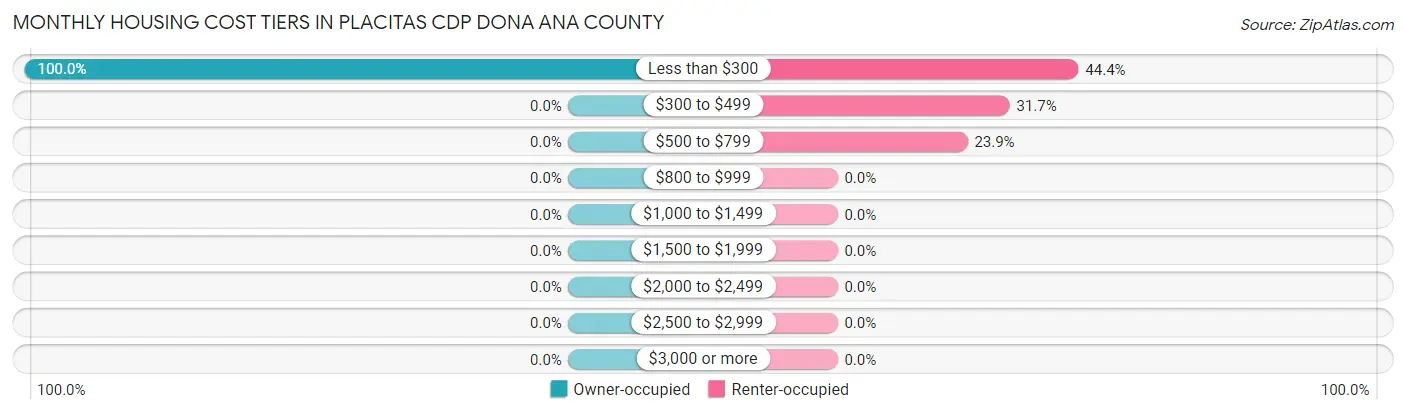
| Monthly Cost | Owner-occupied | Renter-occupied |
| Less than $300 | 70 (100.0%) | 63 (44.4%) |
| $300 to $499 | 0 (0.0%) | 45 (31.7%) |
| $500 to $799 | 0 (0.0%) | 34 (23.9%) |
| $800 to $999 | 0 (0.0%) | 0 (0.0%) |
| $1,000 to $1,499 | 0 (0.0%) | 0 (0.0%) |
| $1,500 to $1,999 | 0 (0.0%) | 0 (0.0%) |
| $2,000 to $2,499 | 0 (0.0%) | 0 (0.0%) |
| $2,500 to $2,999 | 0 (0.0%) | 0 (0.0%) |
| $3,000 or more | 0 (0.0%) | 0 (0.0%) |
| Total | 70 (100.0%) | 142 (100.0%) |
Physical Housing Characteristics in Placitas CDP Dona Ana County
Housing Structures in Placitas CDP Dona Ana County
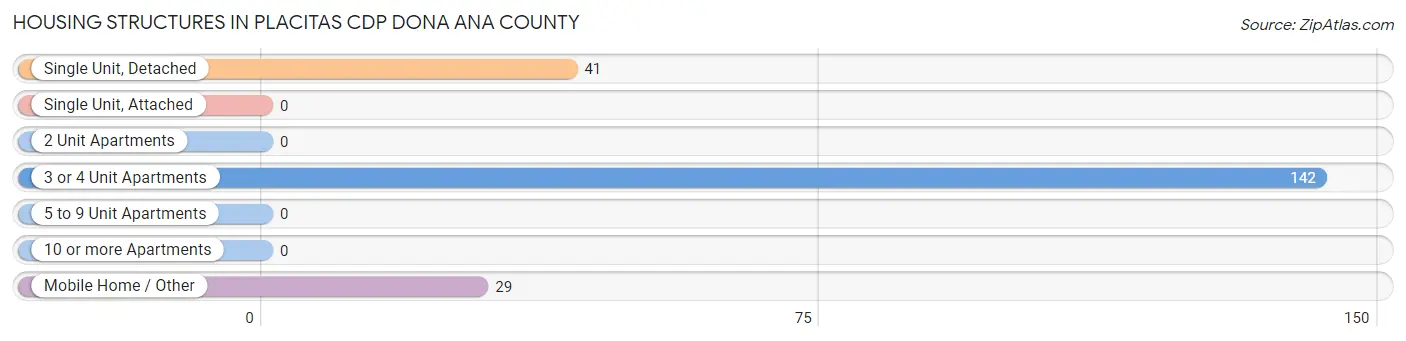
| Structure Type | # Housing Units | % Housing Units |
| Single Unit, Detached | 41 | 19.3% |
| Single Unit, Attached | 0 | 0.0% |
| 2 Unit Apartments | 0 | 0.0% |
| 3 or 4 Unit Apartments | 142 | 67.0% |
| 5 to 9 Unit Apartments | 0 | 0.0% |
| 10 or more Apartments | 0 | 0.0% |
| Mobile Home / Other | 29 | 13.7% |
| Total | 212 | 100.0% |
Housing Structures by Occupancy in Placitas CDP Dona Ana County
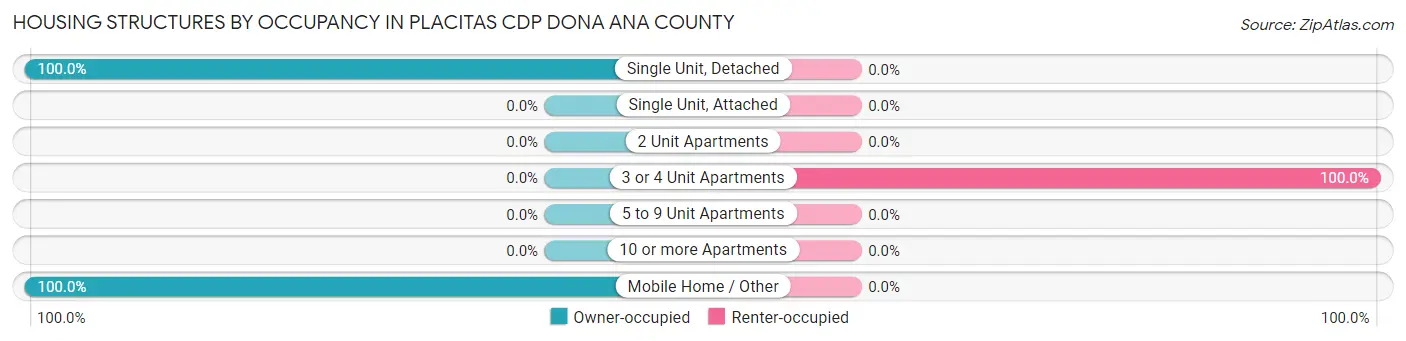
| Structure Type | Owner-occupied | Renter-occupied |
| Single Unit, Detached | 41 (100.0%) | 0 (0.0%) |
| Single Unit, Attached | 0 (0.0%) | 0 (0.0%) |
| 2 Unit Apartments | 0 (0.0%) | 0 (0.0%) |
| 3 or 4 Unit Apartments | 0 (0.0%) | 142 (100.0%) |
| 5 to 9 Unit Apartments | 0 (0.0%) | 0 (0.0%) |
| 10 or more Apartments | 0 (0.0%) | 0 (0.0%) |
| Mobile Home / Other | 29 (100.0%) | 0 (0.0%) |
| Total | 70 (33.0%) | 142 (67.0%) |
Housing Structures by Number of Rooms in Placitas CDP Dona Ana County
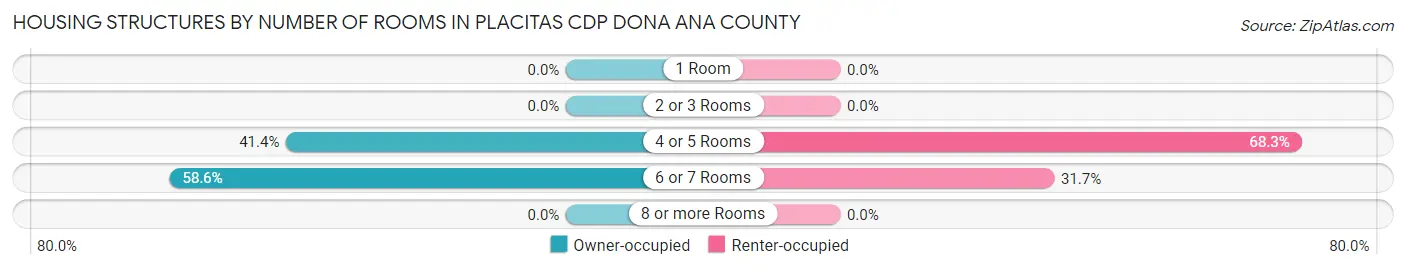
| Number of Rooms | Owner-occupied | Renter-occupied |
| 1 Room | 0 (0.0%) | 0 (0.0%) |
| 2 or 3 Rooms | 0 (0.0%) | 0 (0.0%) |
| 4 or 5 Rooms | 29 (41.4%) | 97 (68.3%) |
| 6 or 7 Rooms | 41 (58.6%) | 45 (31.7%) |
| 8 or more Rooms | 0 (0.0%) | 0 (0.0%) |
| Total | 70 (100.0%) | 142 (100.0%) |
Housing Structure by Heating Type in Placitas CDP Dona Ana County
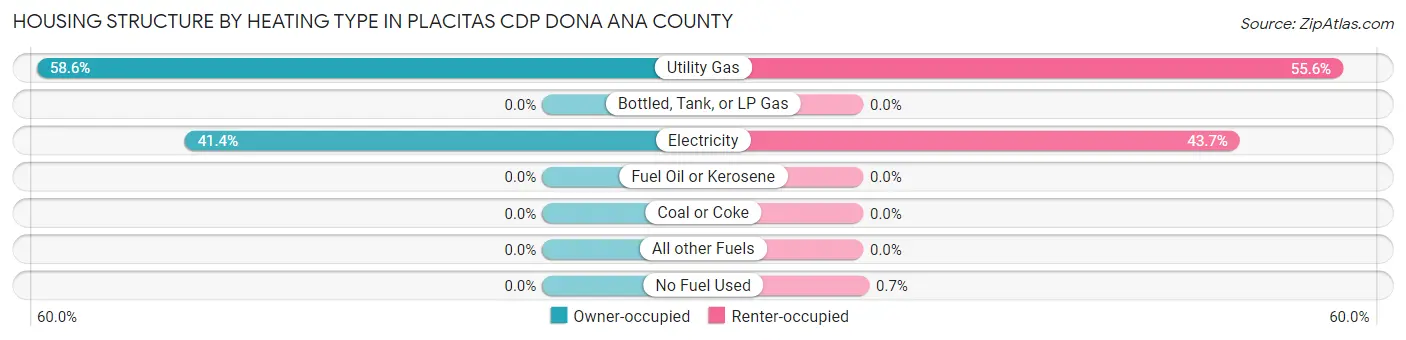
| Heating Type | Owner-occupied | Renter-occupied |
| Utility Gas | 41 (58.6%) | 79 (55.6%) |
| Bottled, Tank, or LP Gas | 0 (0.0%) | 0 (0.0%) |
| Electricity | 29 (41.4%) | 62 (43.7%) |
| Fuel Oil or Kerosene | 0 (0.0%) | 0 (0.0%) |
| Coal or Coke | 0 (0.0%) | 0 (0.0%) |
| All other Fuels | 0 (0.0%) | 0 (0.0%) |
| No Fuel Used | 0 (0.0%) | 1 (0.7%) |
| Total | 70 (100.0%) | 142 (100.0%) |
Household Vehicle Usage in Placitas CDP Dona Ana County
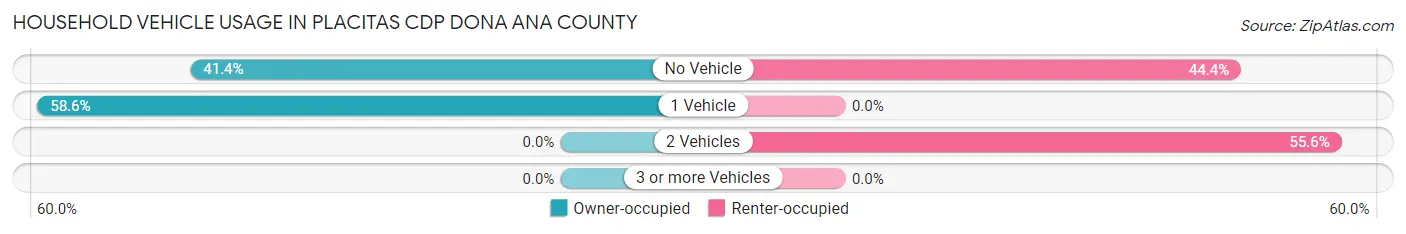
| Vehicles per Household | Owner-occupied | Renter-occupied |
| No Vehicle | 29 (41.4%) | 63 (44.4%) |
| 1 Vehicle | 41 (58.6%) | 0 (0.0%) |
| 2 Vehicles | 0 (0.0%) | 79 (55.6%) |
| 3 or more Vehicles | 0 (0.0%) | 0 (0.0%) |
| Total | 70 (100.0%) | 142 (100.0%) |
Real Estate & Mortgages in Placitas CDP Dona Ana County
Real Estate and Mortgage Overview in Placitas CDP Dona Ana County
| Characteristic | Without Mortgage | With Mortgage |
| Housing Units | 70 | 0 |
| Median Property Value | - | - |
| Median Household Income | - | - |
| Monthly Housing Costs | - | - |
| Real Estate Taxes | - | - |
Property Value by Mortgage Status in Placitas CDP Dona Ana County
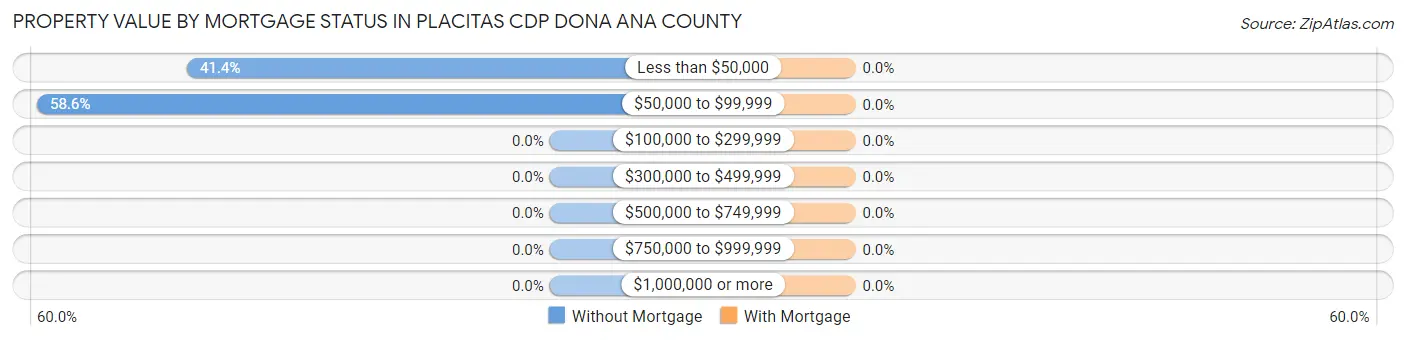
| Property Value | Without Mortgage | With Mortgage |
| Less than $50,000 | 29 (41.4%) | 0 (0.0%) |
| $50,000 to $99,999 | 41 (58.6%) | 0 (0.0%) |
| $100,000 to $299,999 | 0 (0.0%) | 0 (0.0%) |
| $300,000 to $499,999 | 0 (0.0%) | 0 (0.0%) |
| $500,000 to $749,999 | 0 (0.0%) | 0 (0.0%) |
| $750,000 to $999,999 | 0 (0.0%) | 0 (0.0%) |
| $1,000,000 or more | 0 (0.0%) | 0 (0.0%) |
| Total | 70 (100.0%) | 0 (0.0%) |
Household Income by Mortgage Status in Placitas CDP Dona Ana County
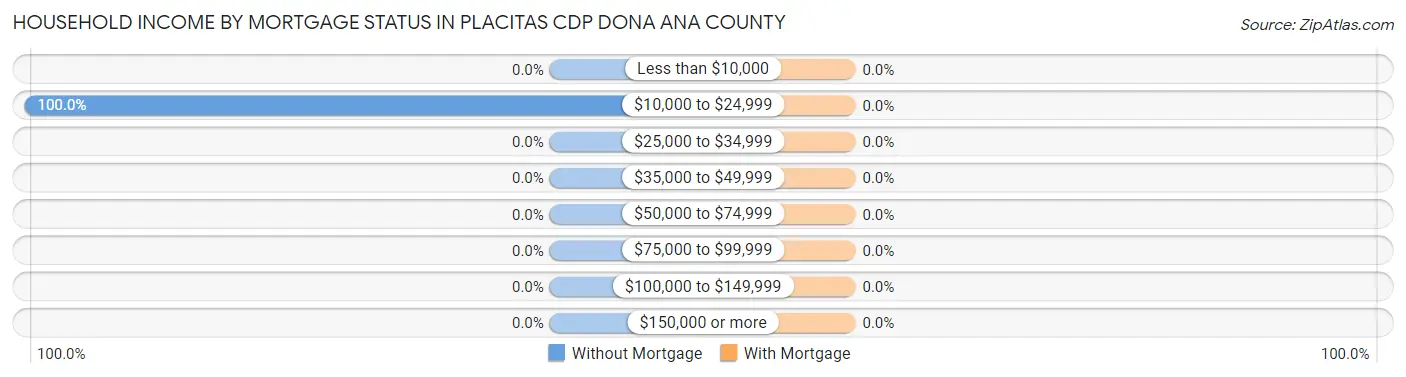
| Household Income | Without Mortgage | With Mortgage |
| Less than $10,000 | 0 (0.0%) | 0 (0.0%) |
| $10,000 to $24,999 | 70 (100.0%) | 0 (0.0%) |
| $25,000 to $34,999 | 0 (0.0%) | 0 (0.0%) |
| $35,000 to $49,999 | 0 (0.0%) | 0 (0.0%) |
| $50,000 to $74,999 | 0 (0.0%) | 0 (0.0%) |
| $75,000 to $99,999 | 0 (0.0%) | 0 (0.0%) |
| $100,000 to $149,999 | 0 (0.0%) | 0 (0.0%) |
| $150,000 or more | 0 (0.0%) | 0 (0.0%) |
| Total | 70 (100.0%) | 0 (0.0%) |
Property Value to Household Income Ratio in Placitas CDP Dona Ana County
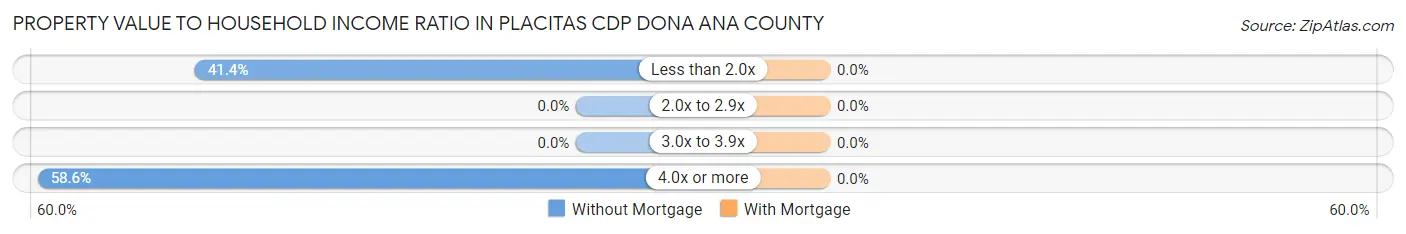
| Value-to-Income Ratio | Without Mortgage | With Mortgage |
| Less than 2.0x | 29 (41.4%) | 0 (0.0%) |
| 2.0x to 2.9x | 0 (0.0%) | 0 (0.0%) |
| 3.0x to 3.9x | 0 (0.0%) | 0 (0.0%) |
| 4.0x or more | 41 (58.6%) | 0 (0.0%) |
| Total | 70 (100.0%) | 0 (0.0%) |
Real Estate Taxes by Mortgage Status in Placitas CDP Dona Ana County
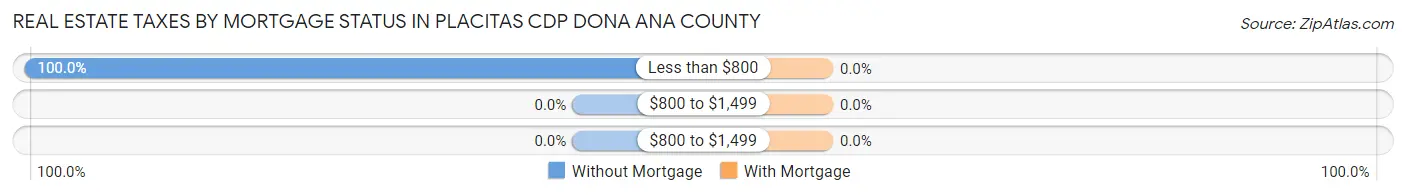
| Property Taxes | Without Mortgage | With Mortgage |
| Less than $800 | 70 (100.0%) | 0 (0.0%) |
| $800 to $1,499 | 0 (0.0%) | 0 (0.0%) |
| $800 to $1,499 | 0 (0.0%) | 0 (0.0%) |
| Total | 70 (100.0%) | 0 (0.0%) |
Health & Disability in Placitas CDP Dona Ana County
Health Insurance Coverage by Age in Placitas CDP Dona Ana County
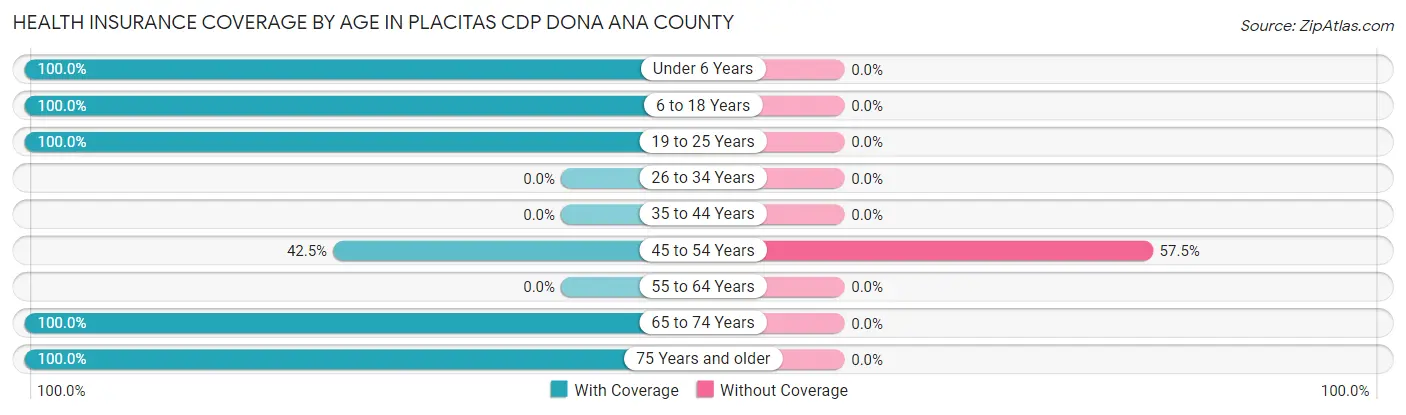
| Age Bracket | With Coverage | Without Coverage |
| Under 6 Years | 82 (100.0%) | 0 (0.0%) |
| 6 to 18 Years | 130 (100.0%) | 0 (0.0%) |
| 19 to 25 Years | 91 (100.0%) | 0 (0.0%) |
| 26 to 34 Years | 0 (0.0%) | 0 (0.0%) |
| 35 to 44 Years | 0 (0.0%) | 0 (0.0%) |
| 45 to 54 Years | 34 (42.5%) | 46 (57.5%) |
| 55 to 64 Years | 0 (0.0%) | 0 (0.0%) |
| 65 to 74 Years | 30 (100.0%) | 0 (0.0%) |
| 75 Years and older | 102 (100.0%) | 0 (0.0%) |
| Total | 469 (91.1%) | 46 (8.9%) |
Health Insurance Coverage by Citizenship Status in Placitas CDP Dona Ana County

| Citizenship Status | With Coverage | Without Coverage |
| Native Born | 82 (100.0%) | 0 (0.0%) |
| Foreign Born, Citizen | 130 (100.0%) | 0 (0.0%) |
| Foreign Born, not a Citizen | 91 (100.0%) | 0 (0.0%) |
Health Insurance Coverage by Household Income in Placitas CDP Dona Ana County
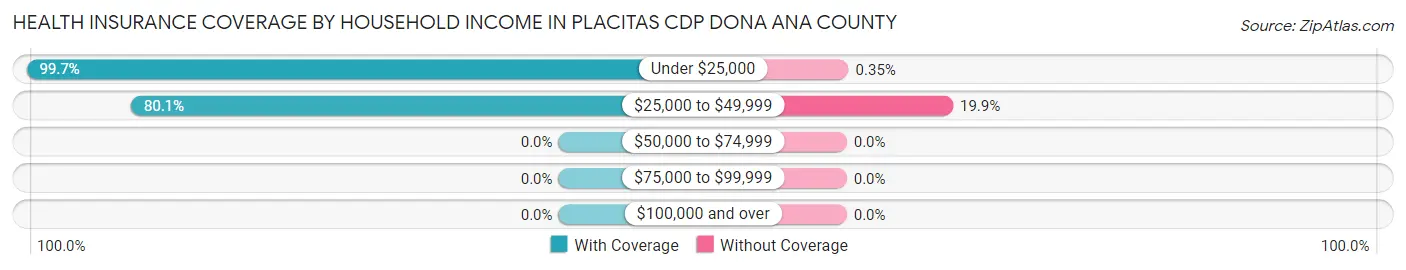
| Household Income | With Coverage | Without Coverage |
| Under $25,000 | 288 (99.7%) | 1 (0.4%) |
| $25,000 to $49,999 | 181 (80.1%) | 45 (19.9%) |
| $50,000 to $74,999 | 0 (0.0%) | 0 (0.0%) |
| $75,000 to $99,999 | 0 (0.0%) | 0 (0.0%) |
| $100,000 and over | 0 (0.0%) | 0 (0.0%) |
Public vs Private Health Insurance Coverage by Age in Placitas CDP Dona Ana County
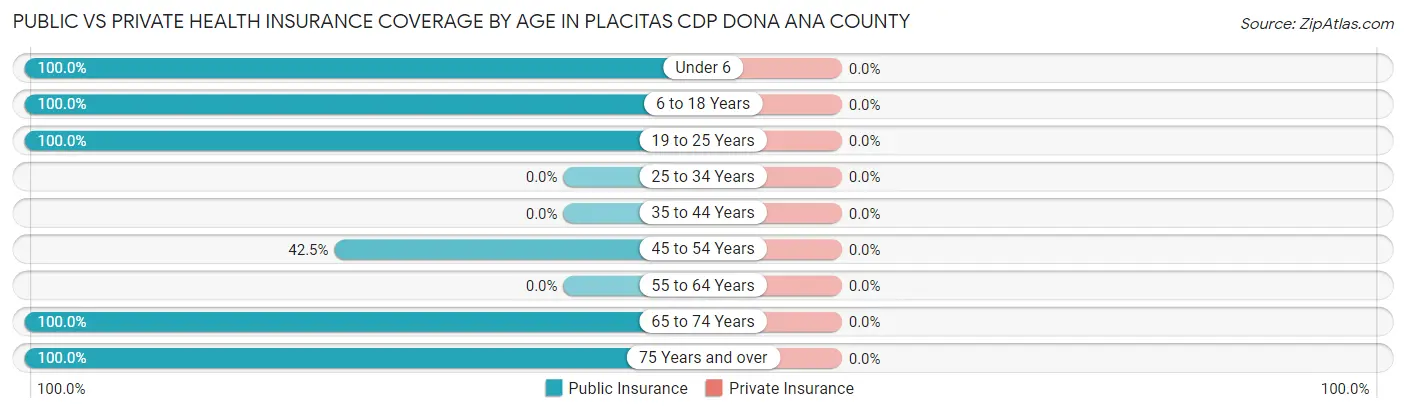
| Age Bracket | Public Insurance | Private Insurance |
| Under 6 | 82 (100.0%) | 0 (0.0%) |
| 6 to 18 Years | 130 (100.0%) | 0 (0.0%) |
| 19 to 25 Years | 91 (100.0%) | 0 (0.0%) |
| 25 to 34 Years | 0 (0.0%) | 0 (0.0%) |
| 35 to 44 Years | 0 (0.0%) | 0 (0.0%) |
| 45 to 54 Years | 34 (42.5%) | 0 (0.0%) |
| 55 to 64 Years | 0 (0.0%) | 0 (0.0%) |
| 65 to 74 Years | 30 (100.0%) | 0 (0.0%) |
| 75 Years and over | 102 (100.0%) | 0 (0.0%) |
| Total | 469 (91.1%) | 0 (0.0%) |
Disability Status by Sex by Age in Placitas CDP Dona Ana County
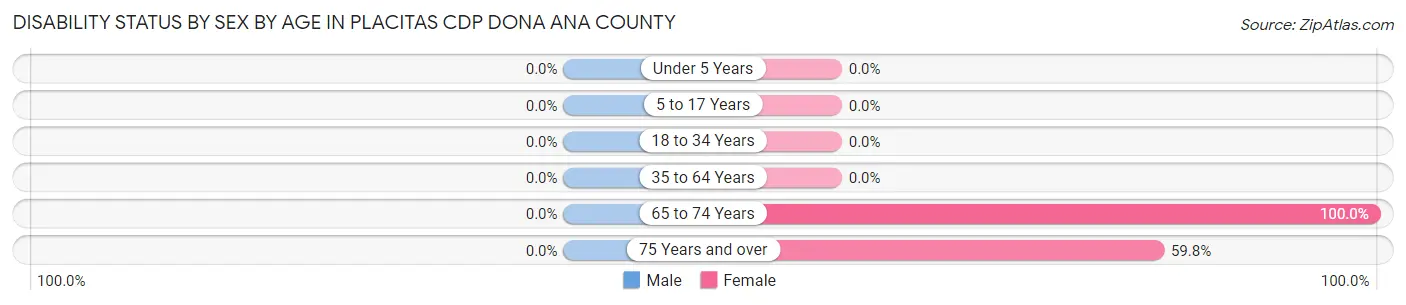
| Age Bracket | Male | Female |
| Under 5 Years | 0 (0.0%) | 0 (0.0%) |
| 5 to 17 Years | 0 (0.0%) | 0 (0.0%) |
| 18 to 34 Years | 0 (0.0%) | 0 (0.0%) |
| 35 to 64 Years | 0 (0.0%) | 0 (0.0%) |
| 65 to 74 Years | 0 (0.0%) | 30 (100.0%) |
| 75 Years and over | 0 (0.0%) | 61 (59.8%) |
Disability Class by Sex by Age in Placitas CDP Dona Ana County
Disability Class: Hearing Difficulty
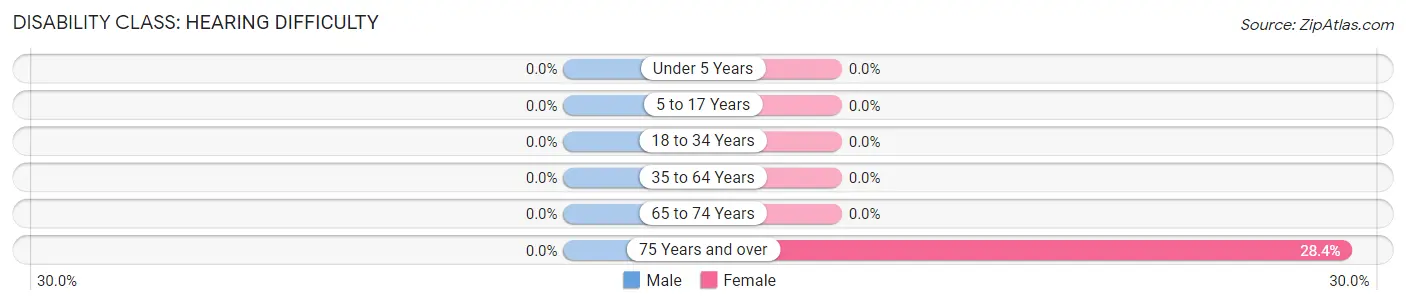
| Age Bracket | Male | Female |
| Under 5 Years | 0 (0.0%) | 0 (0.0%) |
| 5 to 17 Years | 0 (0.0%) | 0 (0.0%) |
| 18 to 34 Years | 0 (0.0%) | 0 (0.0%) |
| 35 to 64 Years | 0 (0.0%) | 0 (0.0%) |
| 65 to 74 Years | 0 (0.0%) | 0 (0.0%) |
| 75 Years and over | 0 (0.0%) | 29 (28.4%) |
Disability Class: Vision Difficulty
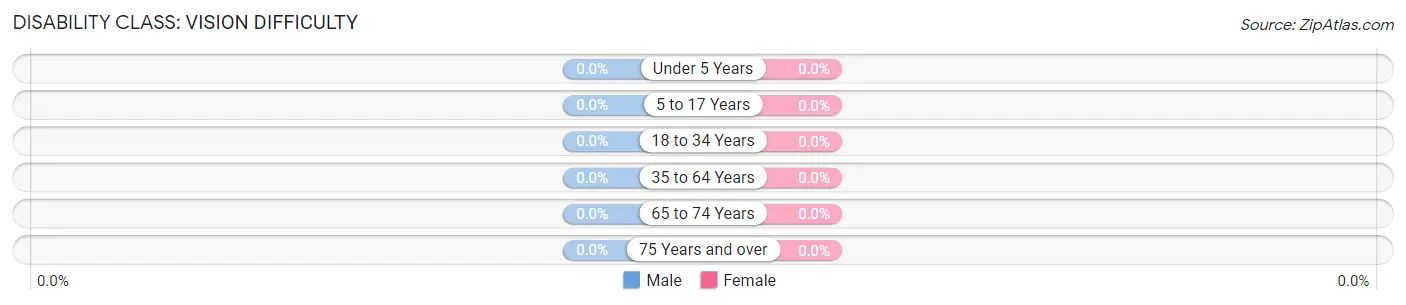
| Age Bracket | Male | Female |
| Under 5 Years | 0 (0.0%) | 0 (0.0%) |
| 5 to 17 Years | 0 (0.0%) | 0 (0.0%) |
| 18 to 34 Years | 0 (0.0%) | 0 (0.0%) |
| 35 to 64 Years | 0 (0.0%) | 0 (0.0%) |
| 65 to 74 Years | 0 (0.0%) | 0 (0.0%) |
| 75 Years and over | 0 (0.0%) | 0 (0.0%) |
Disability Class: Cognitive Difficulty
| Age Bracket | Male | Female |
| 5 to 17 Years | 0 (0.0%) | 0 (0.0%) |
| 18 to 34 Years | 0 (0.0%) | 0 (0.0%) |
| 35 to 64 Years | 0 (0.0%) | 0 (0.0%) |
| 65 to 74 Years | 0 (0.0%) | 0 (0.0%) |
| 75 Years and over | 0 (0.0%) | 0 (0.0%) |
Disability Class: Ambulatory Difficulty
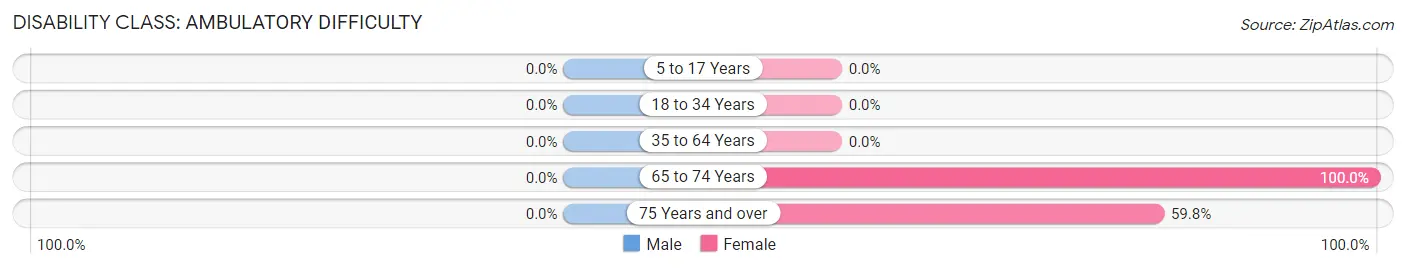
| Age Bracket | Male | Female |
| 5 to 17 Years | 0 (0.0%) | 0 (0.0%) |
| 18 to 34 Years | 0 (0.0%) | 0 (0.0%) |
| 35 to 64 Years | 0 (0.0%) | 0 (0.0%) |
| 65 to 74 Years | 0 (0.0%) | 30 (100.0%) |
| 75 Years and over | 0 (0.0%) | 61 (59.8%) |
Disability Class: Self-Care Difficulty
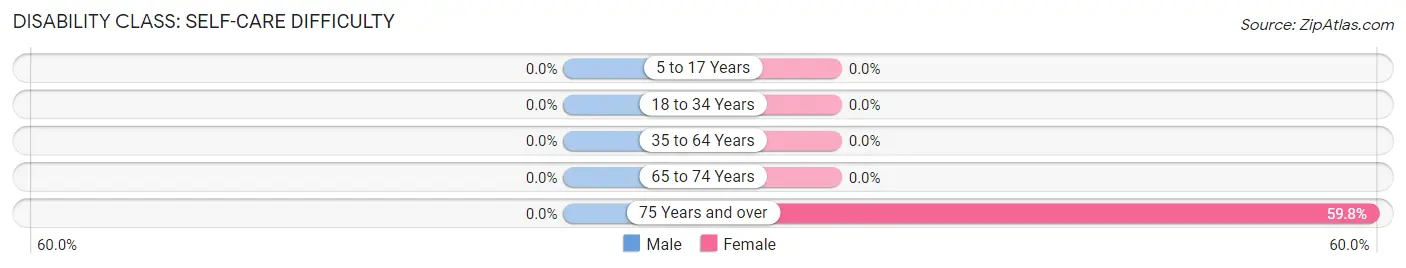
| Age Bracket | Male | Female |
| 5 to 17 Years | 0 (0.0%) | 0 (0.0%) |
| 18 to 34 Years | 0 (0.0%) | 0 (0.0%) |
| 35 to 64 Years | 0 (0.0%) | 0 (0.0%) |
| 65 to 74 Years | 0 (0.0%) | 0 (0.0%) |
| 75 Years and over | 0 (0.0%) | 61 (59.8%) |
Technology Access in Placitas CDP Dona Ana County
Computing Device Access in Placitas CDP Dona Ana County
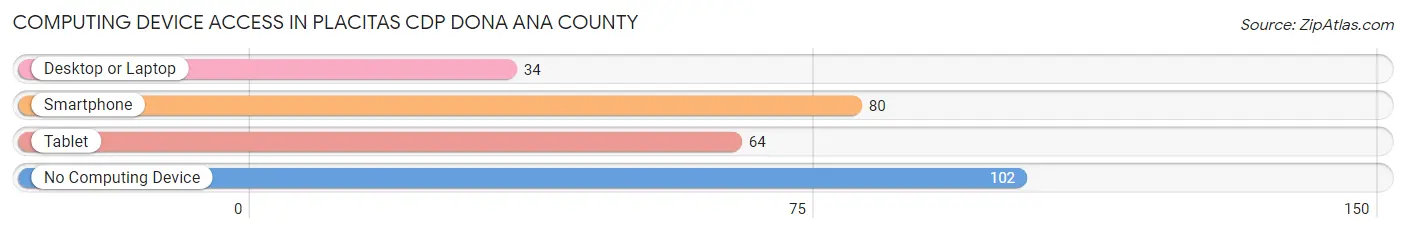
| Device Type | # Households | % Households |
| Desktop or Laptop | 34 | 16.0% |
| Smartphone | 80 | 37.7% |
| Tablet | 64 | 30.2% |
| No Computing Device | 102 | 48.1% |
| Total | 212 | 100.0% |
Internet Access in Placitas CDP Dona Ana County
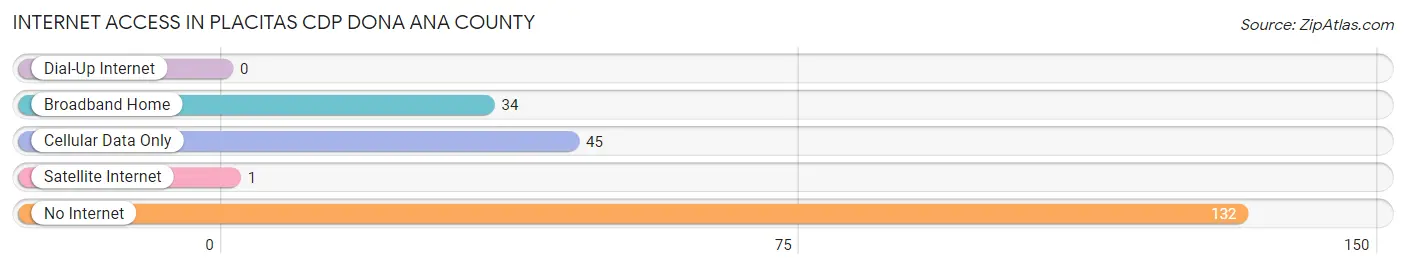
| Internet Type | # Households | % Households |
| Dial-Up Internet | 0 | 0.0% |
| Broadband Home | 34 | 16.0% |
| Cellular Data Only | 45 | 21.2% |
| Satellite Internet | 1 | 0.5% |
| No Internet | 132 | 62.3% |
| Total | 212 | 100.0% |
Placitas CDP Dona Ana County Summary
Placitas Cdp is a census-designated place (CDP) located in Dona Ana County, New Mexico. It is situated in the northern part of the county, about 20 miles north of Las Cruces. The population of Placitas Cdp was 2,719 at the 2010 census.
Geography
Placitas Cdp is located at 35°20'17" North, 106°30'17" West (35.338, -106.505). It has an elevation of 4,945 feet above sea level. The CDP covers an area of 8.3 square miles, all of which is land.
Climate
Placitas Cdp has a semi-arid climate, with hot summers and mild winters. The average annual temperature is 64°F, with an average high of 90°F in July and an average low of 37°F in January. The average annual precipitation is 11.3 inches, with most of it falling in the summer months.
Demographics
As of the 2010 census, there were 2,719 people, 1,093 households, and 817 families residing in Placitas Cdp. The population density was 327.3 people per square mile. The racial makeup of the CDP was 81.2% White, 0.7% African American, 1.2% Native American, 0.3% Asian, 0.1% Pacific Islander, 14.2% from other races, and 2.4% from two or more races. Hispanic or Latino of any race were 44.2% of the population.
There were 1,093 households, out of which 28.2% had children under the age of 18 living with them, 58.2% were married couples living together, 10.2% had a female householder with no husband present, and 26.2% were non-families. 21.2% of all households were made up of individuals, and 8.2% had someone living alone who was 65 years of age or older. The average household size was 2.48 and the average family size was 2.86.
The median age in Placitas Cdp was 46.2 years. 22.2% of residents were under the age of 18; 6.2% were between the ages of 18 and 24; 20.2% were from 25 to 44; 33.2% were from 45 to 64; and 18.2% were 65 years of age or older. The gender makeup of the CDP was 48.2% male and 51.8% female.
Economy
The economy of Placitas Cdp is largely based on agriculture and tourism. The area is known for its wineries, vineyards, and orchards, as well as its scenic views of the Sandia Mountains. The CDP is also home to several small businesses, including restaurants, shops, and galleries.
The median household income in Placitas Cdp was $50,938 in 2018, and the median family income was $58,938. The per capita income was $27,938. About 8.2% of families and 11.2% of the population were below the poverty line, including 16.2% of those under age 18 and 5.2% of those age 65 or over.
Conclusion
Placitas Cdp is a census-designated place located in Dona Ana County, New Mexico. It has a semi-arid climate, with hot summers and mild winters. The population of Placitas Cdp was 2,719 at the 2010 census. The economy of Placitas Cdp is largely based on agriculture and tourism. The median household income in Placitas Cdp was $50,938 in 2018.
Common Questions
What is Per Capita Income in Placitas CDP Dona Ana County?
Per Capita income in Placitas CDP Dona Ana County is $6,693.
What is the Median Household income in Placitas CDP Dona Ana County?
Median Household Income in Placitas CDP Dona Ana County is $13,354.
What is Inequality or Gini Index in Placitas CDP Dona Ana County?
Inequality or Gini Index in Placitas CDP Dona Ana County is 0.28.
What is the Total Population of Placitas CDP Dona Ana County?
Total Population of Placitas CDP Dona Ana County is 515.
What is the Total Male Population of Placitas CDP Dona Ana County?
Total Male Population of Placitas CDP Dona Ana County is 141.
What is the Total Female Population of Placitas CDP Dona Ana County?
Total Female Population of Placitas CDP Dona Ana County is 374.
What is the Ratio of Males per 100 Females in Placitas CDP Dona Ana County?
There are 37.70 Males per 100 Females in Placitas CDP Dona Ana County.
What is the Ratio of Females per 100 Males in Placitas CDP Dona Ana County?
There are 265.25 Females per 100 Males in Placitas CDP Dona Ana County.
What is the Median Population Age in Placitas CDP Dona Ana County?
Median Population Age in Placitas CDP Dona Ana County is 19.5 Years.
What is the Average Family Size in Placitas CDP Dona Ana County
Average Family Size in Placitas CDP Dona Ana County is 4.8 People.
What is the Average Household Size in Placitas CDP Dona Ana County
Average Household Size in Placitas CDP Dona Ana County is 2.4 People.
How Large is the Labor Force in Placitas CDP Dona Ana County?
There are 218 People in the Labor Forcein in Placitas CDP Dona Ana County.
What is the Percentage of People in the Labor Force in Placitas CDP Dona Ana County?
50.3% of People are in the Labor Force in Placitas CDP Dona Ana County.
What is the Unemployment Rate in Placitas CDP Dona Ana County?
Unemployment Rate in Placitas CDP Dona Ana County is 21.1%.