Aquadale, NC Map & Demographics
Aquadale Map
Aquadale Overview
$45,317
PER CAPITA INCOME
$123,594
AVG FAMILY INCOME
$108,036
AVG HOUSEHOLD INCOME
30.0%
WAGE / INCOME GAP [ % ]
70.0¢/ $1
WAGE / INCOME GAP [ $ ]
0.24
INEQUALITY / GINI INDEX
409
TOTAL POPULATION
171
MALE POPULATION
238
FEMALE POPULATION
71.85
MALES / 100 FEMALES
139.18
FEMALES / 100 MALES
49.5
MEDIAN AGE
3.1
AVG FAMILY SIZE
2.6
AVG HOUSEHOLD SIZE
305
LABOR FORCE [ PEOPLE ]
78.4%
PERCENT IN LABOR FORCE
Income in Aquadale
Income Overview in Aquadale
Per Capita Income in Aquadale is $45,317, while median incomes of families and households are $123,594 and $108,036 respectively.
| Characteristic | Number | Measure |
| Per Capita Income | 409 | $45,317 |
| Median Family Income | 112 | $123,594 |
| Mean Family Income | 112 | $124,911 |
| Median Household Income | 159 | $108,036 |
| Mean Household Income | 159 | $110,744 |
| Income Deficit | 112 | $0 |
| Wage / Income Gap (%) | 409 | 29.98% |
| Wage / Income Gap ($) | 409 | 70.02¢ per $1 |
| Gini / Inequality Index | 409 | 0.24 |
Earnings by Sex in Aquadale
Average Earnings in Aquadale are $50,141, $66,048 for men and $46,250 for women, a difference of 30.0%.
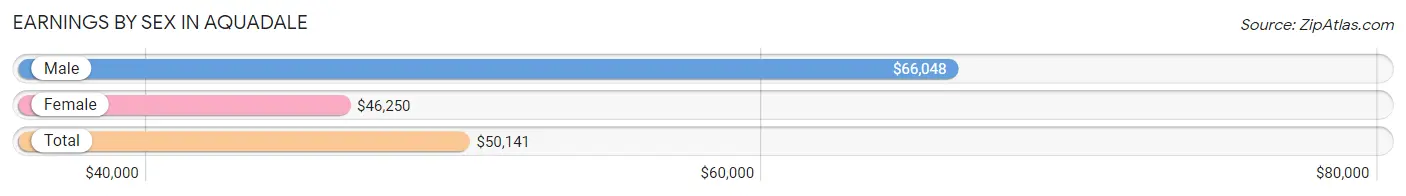
| Sex | Number | Average Earnings |
| Male | 162 (53.1%) | $66,048 |
| Female | 143 (46.9%) | $46,250 |
| Total | 305 (100.0%) | $50,141 |
Earnings by Sex by Income Bracket in Aquadale
The most common earnings brackets in Aquadale are $100,000+ for men (47 | 29.0%) and $45,000 to $49,999 for women (67 | 46.9%).
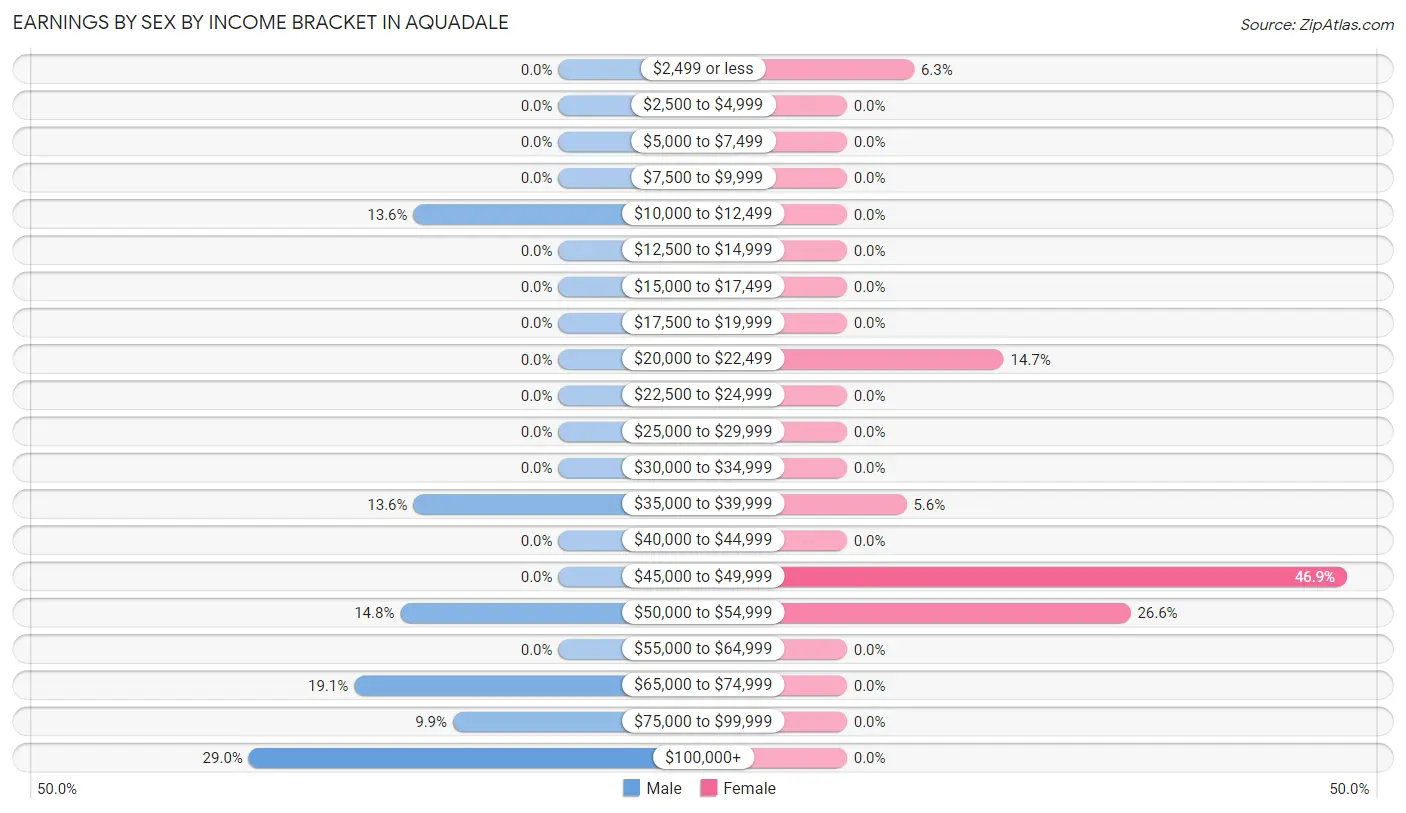
| Income | Male | Female |
| $2,499 or less | 0 (0.0%) | 9 (6.3%) |
| $2,500 to $4,999 | 0 (0.0%) | 0 (0.0%) |
| $5,000 to $7,499 | 0 (0.0%) | 0 (0.0%) |
| $7,500 to $9,999 | 0 (0.0%) | 0 (0.0%) |
| $10,000 to $12,499 | 22 (13.6%) | 0 (0.0%) |
| $12,500 to $14,999 | 0 (0.0%) | 0 (0.0%) |
| $15,000 to $17,499 | 0 (0.0%) | 0 (0.0%) |
| $17,500 to $19,999 | 0 (0.0%) | 0 (0.0%) |
| $20,000 to $22,499 | 0 (0.0%) | 21 (14.7%) |
| $22,500 to $24,999 | 0 (0.0%) | 0 (0.0%) |
| $25,000 to $29,999 | 0 (0.0%) | 0 (0.0%) |
| $30,000 to $34,999 | 0 (0.0%) | 0 (0.0%) |
| $35,000 to $39,999 | 22 (13.6%) | 8 (5.6%) |
| $40,000 to $44,999 | 0 (0.0%) | 0 (0.0%) |
| $45,000 to $49,999 | 0 (0.0%) | 67 (46.9%) |
| $50,000 to $54,999 | 24 (14.8%) | 38 (26.6%) |
| $55,000 to $64,999 | 0 (0.0%) | 0 (0.0%) |
| $65,000 to $74,999 | 31 (19.1%) | 0 (0.0%) |
| $75,000 to $99,999 | 16 (9.9%) | 0 (0.0%) |
| $100,000+ | 47 (29.0%) | 0 (0.0%) |
| Total | 162 (100.0%) | 143 (100.0%) |
Earnings by Sex by Educational Attainment in Aquadale
Average earnings in Aquadale are $75,781 for men and $46,250 for women, a difference of 39.0%. Men with an educational attainment of high school diploma enjoy the highest average annual earnings of $117,739, while those with high school diploma education earn the least with $117,739. Women with an educational attainment of college or associate's degree earn the most with the average annual earnings of $45,541, while those with college or associate's degree education have the smallest earnings of $45,541.
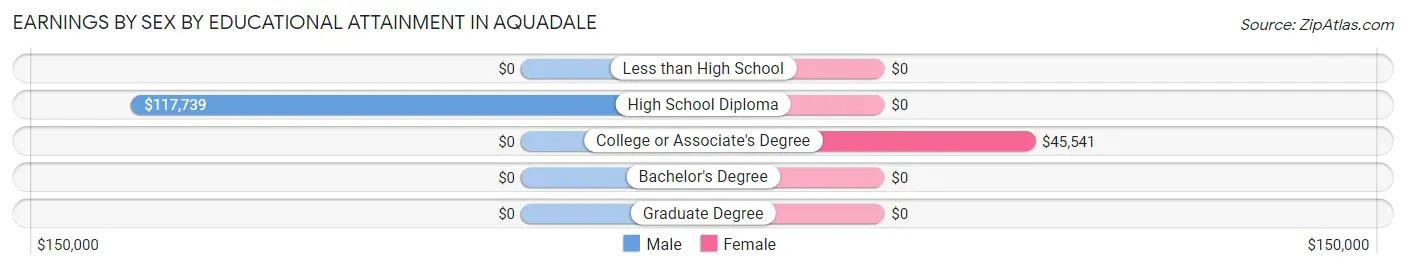
| Educational Attainment | Male Income | Female Income |
| Less than High School | - | - |
| High School Diploma | $117,739 | $0 |
| College or Associate's Degree | - | - |
| Bachelor's Degree | - | - |
| Graduate Degree | - | - |
| Total | $75,781 | $46,250 |
Family Income in Aquadale
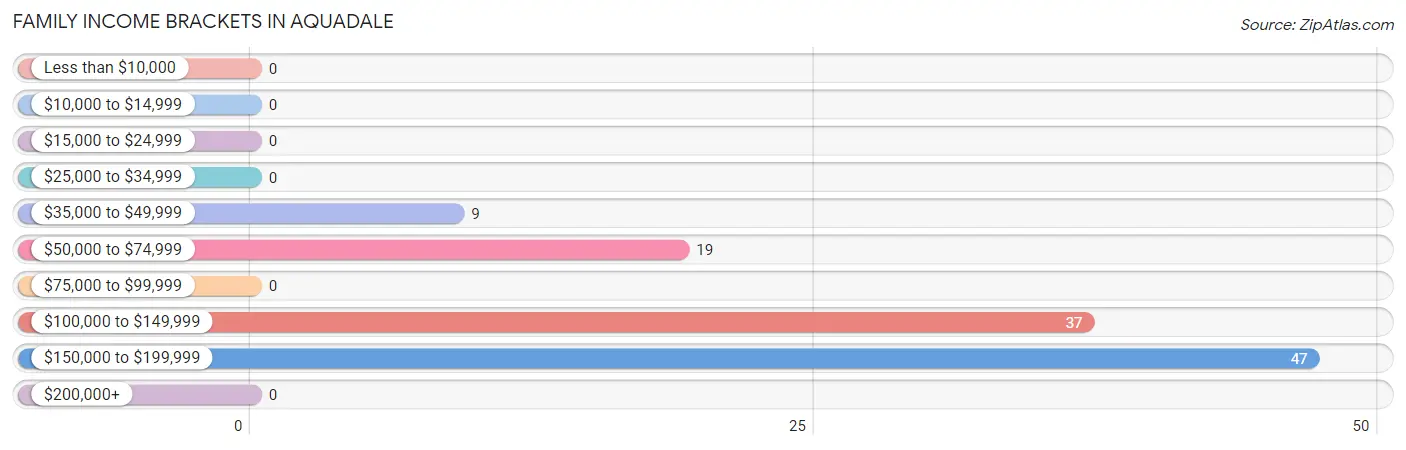
Family Income Brackets in Aquadale
According to the Aquadale family income data, there are 47 families falling into the $150,000 to $199,999 income range, which is the most common income bracket and makes up 42.0% of all families.
| Income Bracket | # Families | % Families |
| Less than $10,000 | 0 | 0.0% |
| $10,000 to $14,999 | 0 | 0.0% |
| $15,000 to $24,999 | 0 | 0.0% |
| $25,000 to $34,999 | 0 | 0.0% |
| $35,000 to $49,999 | 9 | 8.0% |
| $50,000 to $74,999 | 19 | 17.0% |
| $75,000 to $99,999 | 0 | 0.0% |
| $100,000 to $149,999 | 37 | 33.0% |
| $150,000 to $199,999 | 47 | 42.0% |
| $200,000+ | 0 | 0.0% |
Family Income by Famaliy Size in Aquadale
| Income Bracket | # Families | Median Income |
| 2-Person Families | 75 (67.0%) | $0 |
| 3-Person Families | 0 (0.0%) | $0 |
| 4-Person Families | 21 (18.8%) | $0 |
| 5-Person Families | 16 (14.3%) | $0 |
| 6-Person Families | 0 (0.0%) | $0 |
| 7+ Person Families | 0 (0.0%) | $0 |
| Total | 112 (100.0%) | $123,594 |
Family Income by Number of Earners in Aquadale
| Number of Earners | # Families | Median Income |
| No Earners | 0 (0.0%) | $0 |
| 1 Earner | 28 (25.0%) | $0 |
| 2 Earners | 68 (60.7%) | $0 |
| 3+ Earners | 16 (14.3%) | $0 |
| Total | 112 (100.0%) | $123,594 |
Household Income in Aquadale
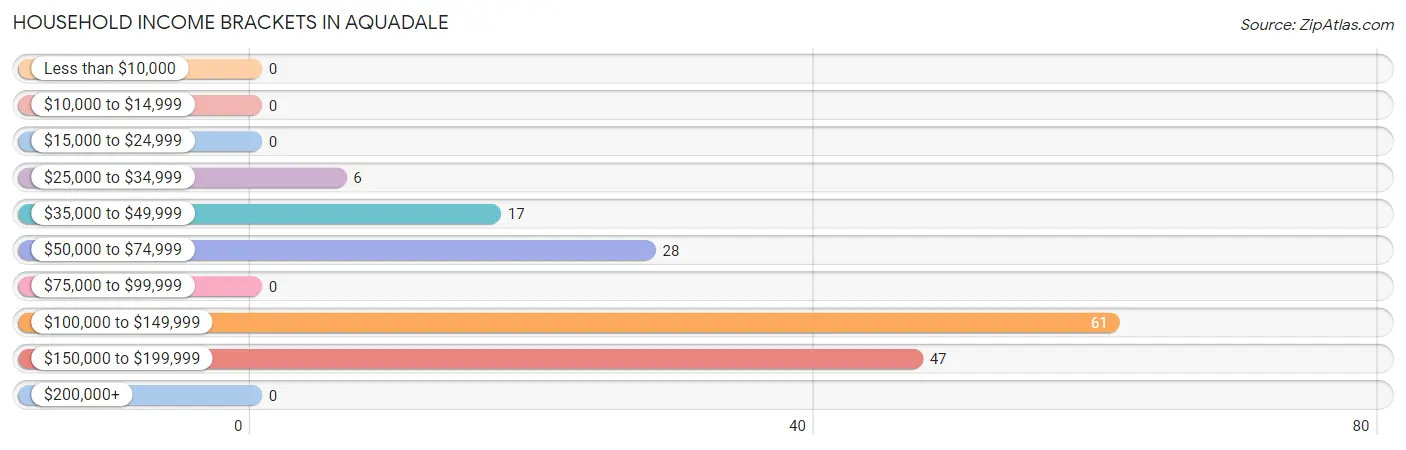
Household Income Brackets in Aquadale
With 61 households falling in the category, the $100,000 to $149,999 income range is the most frequent in Aquadale, accounting for 38.4% of all households.
| Income Bracket | # Households | % Households |
| Less than $10,000 | 0 | 0.0% |
| $10,000 to $14,999 | 0 | 0.0% |
| $15,000 to $24,999 | 0 | 0.0% |
| $25,000 to $34,999 | 6 | 3.8% |
| $35,000 to $49,999 | 17 | 10.7% |
| $50,000 to $74,999 | 28 | 17.6% |
| $75,000 to $99,999 | 0 | 0.0% |
| $100,000 to $149,999 | 61 | 38.4% |
| $150,000 to $199,999 | 47 | 29.6% |
| $200,000+ | 0 | 0.0% |
Household Income by Householder Age in Aquadale
The median household income in Aquadale is $108,036, with the highest median household income of $172,606 found in the 45 to 64 years age bracket for the primary householder. A total of 90 households (56.6%) fall into this category. Meanwhile, the 15 to 24 years age bracket for the primary householder has the lowest median household income of $0, with 24 households (15.1%) in this group.
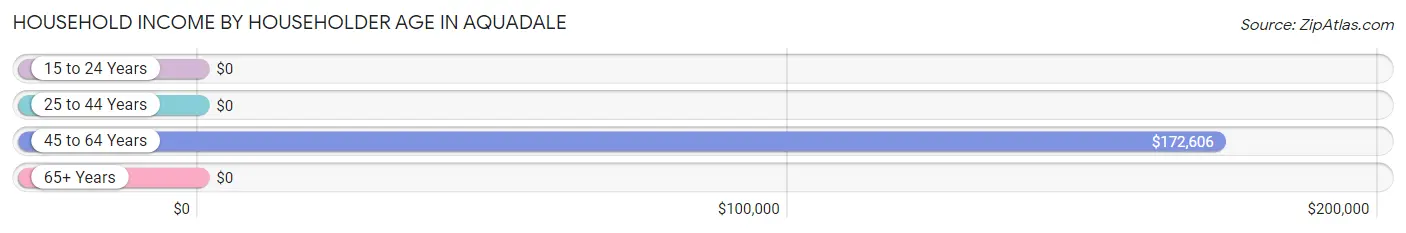
| Income Bracket | # Households | Median Income |
| 15 to 24 Years | 24 (15.1%) | $0 |
| 25 to 44 Years | 30 (18.9%) | $0 |
| 45 to 64 Years | 90 (56.6%) | $172,606 |
| 65+ Years | 15 (9.4%) | $0 |
| Total | 159 (100.0%) | $108,036 |
Poverty in Aquadale
Income Below Poverty by Sex and Age in Aquadale
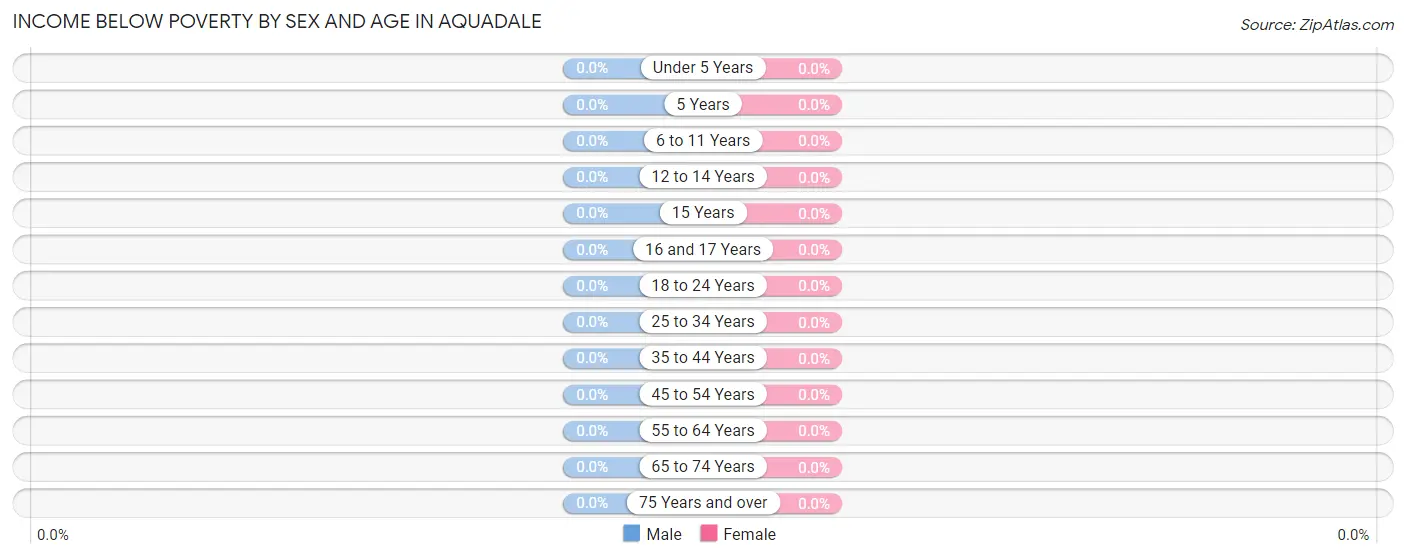
| Age Bracket | Male | Female |
| Under 5 Years | 0 (0.0%) | 0 (0.0%) |
| 5 Years | 0 (0.0%) | 0 (0.0%) |
| 6 to 11 Years | 0 (0.0%) | 0 (0.0%) |
| 12 to 14 Years | 0 (0.0%) | 0 (0.0%) |
| 15 Years | 0 (0.0%) | 0 (0.0%) |
| 16 and 17 Years | 0 (0.0%) | 0 (0.0%) |
| 18 to 24 Years | 0 (0.0%) | 0 (0.0%) |
| 25 to 34 Years | 0 (0.0%) | 0 (0.0%) |
| 35 to 44 Years | 0 (0.0%) | 0 (0.0%) |
| 45 to 54 Years | 0 (0.0%) | 0 (0.0%) |
| 55 to 64 Years | 0 (0.0%) | 0 (0.0%) |
| 65 to 74 Years | 0 (0.0%) | 0 (0.0%) |
| 75 Years and over | 0 (0.0%) | 0 (0.0%) |
| Total | 0 (0.0%) | 0 (0.0%) |
Income Above Poverty by Sex and Age in Aquadale
According to the poverty statistics in Aquadale, males aged 18 to 24 years and females aged 5 years are the age groups that are most secure financially, with 100.0% of males and 100.0% of females in these age groups living above the poverty line.
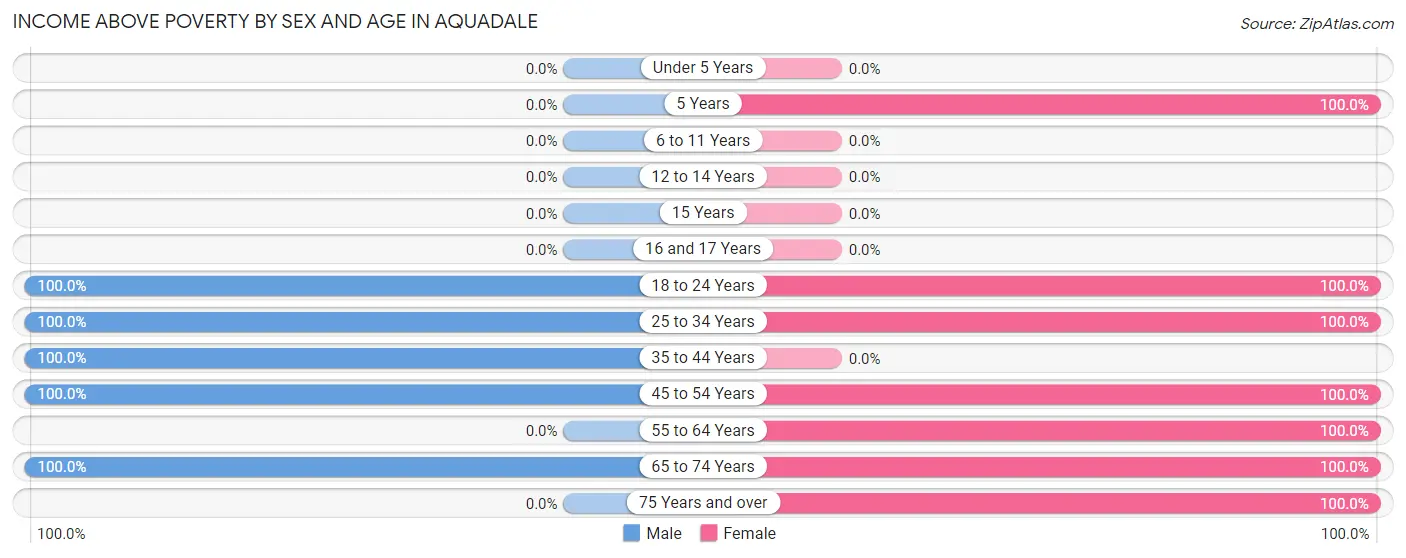
| Age Bracket | Male | Female |
| Under 5 Years | 0 (0.0%) | 0 (0.0%) |
| 5 Years | 0 (0.0%) | 20 (100.0%) |
| 6 to 11 Years | 0 (0.0%) | 0 (0.0%) |
| 12 to 14 Years | 0 (0.0%) | 0 (0.0%) |
| 15 Years | 0 (0.0%) | 0 (0.0%) |
| 16 and 17 Years | 0 (0.0%) | 0 (0.0%) |
| 18 to 24 Years | 46 (100.0%) | 15 (100.0%) |
| 25 to 34 Years | 44 (100.0%) | 40 (100.0%) |
| 35 to 44 Years | 9 (100.0%) | 0 (0.0%) |
| 45 to 54 Years | 63 (100.0%) | 93 (100.0%) |
| 55 to 64 Years | 0 (0.0%) | 19 (100.0%) |
| 65 to 74 Years | 9 (100.0%) | 15 (100.0%) |
| 75 Years and over | 0 (0.0%) | 36 (100.0%) |
| Total | 171 (100.0%) | 238 (100.0%) |
Income Below Poverty Among Married-Couple Families in Aquadale
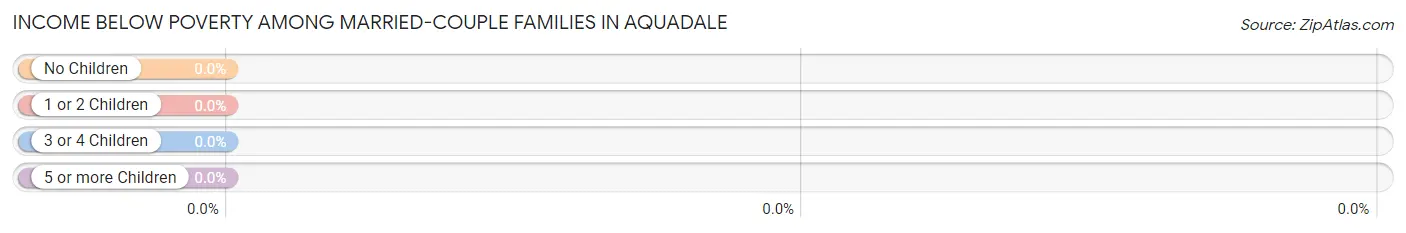
| Children | Above Poverty | Below Poverty |
| No Children | 72 (100.0%) | 0 (0.0%) |
| 1 or 2 Children | 21 (100.0%) | 0 (0.0%) |
| 3 or 4 Children | 0 (0.0%) | 0 (0.0%) |
| 5 or more Children | 0 (0.0%) | 0 (0.0%) |
| Total | 93 (100.0%) | 0 (0.0%) |
Income Below Poverty Among Single-Parent Households in Aquadale
| Children | Single Father | Single Mother |
| No Children | 0 (0.0%) | 0 (0.0%) |
| 1 or 2 Children | 0 (0.0%) | 0 (0.0%) |
| 3 or 4 Children | 0 (0.0%) | 0 (0.0%) |
| 5 or more Children | 0 (0.0%) | 0 (0.0%) |
| Total | 0 (0.0%) | 0 (0.0%) |
Income Below Poverty Among Married-Couple vs Single-Parent Households in Aquadale
| Children | Married-Couple Families | Single-Parent Households |
| No Children | 0 (0.0%) | 0 (0.0%) |
| 1 or 2 Children | 0 (0.0%) | 0 (0.0%) |
| 3 or 4 Children | 0 (0.0%) | 0 (0.0%) |
| 5 or more Children | 0 (0.0%) | 0 (0.0%) |
| Total | 0 (0.0%) | 0 (0.0%) |
Race in Aquadale
The most populous races in Aquadale are , and White / Caucasian (409 | 100.0%).
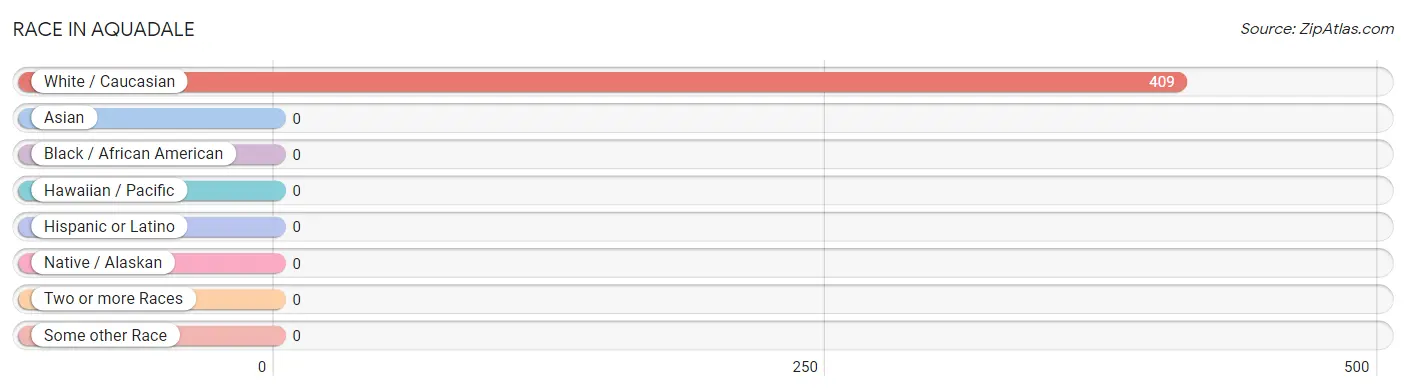
| Race | # Population | % Population |
| Asian | 0 | 0.0% |
| Black / African American | 0 | 0.0% |
| Hawaiian / Pacific | 0 | 0.0% |
| Hispanic or Latino | 0 | 0.0% |
| Native / Alaskan | 0 | 0.0% |
| White / Caucasian | 409 | 100.0% |
| Two or more Races | 0 | 0.0% |
| Some other Race | 0 | 0.0% |
| Total | 409 | 100.0% |
Ancestry in Aquadale
The most populous ancestries reported in Aquadale are German (47 | 11.5%), Italian (41 | 10.0%), Polish (36 | 8.8%), English (24 | 5.9%), and European (20 | 4.9%), together accounting for 41.1% of all Aquadale residents.
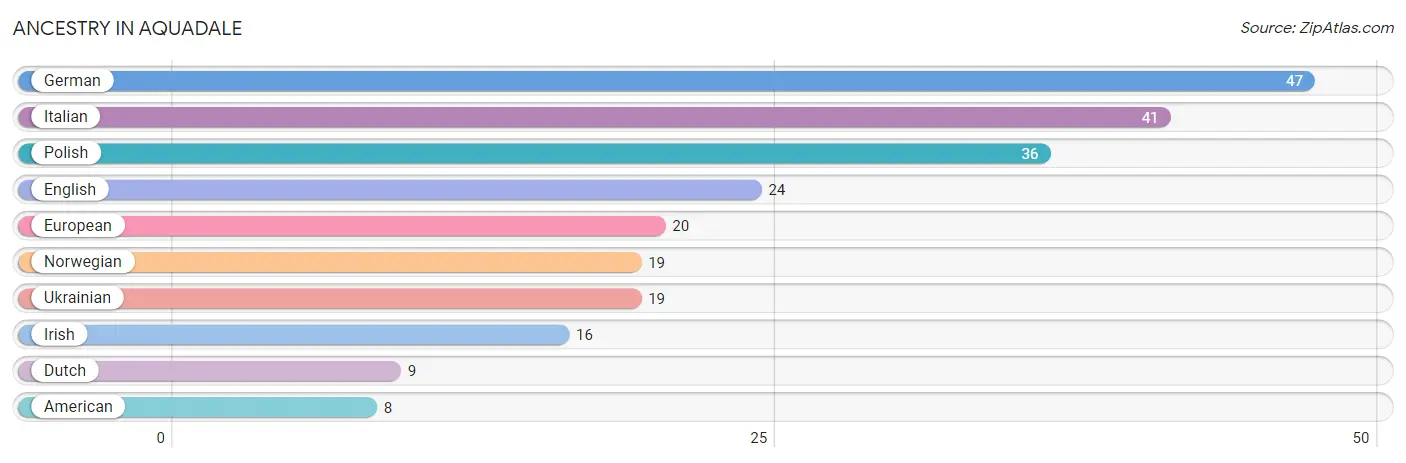
| Ancestry | # Population | % Population |
| American | 8 | 2.0% |
| Dutch | 9 | 2.2% |
| English | 24 | 5.9% |
| European | 20 | 4.9% |
| German | 47 | 11.5% |
| Irish | 16 | 3.9% |
| Italian | 41 | 10.0% |
| Norwegian | 19 | 4.6% |
| Polish | 36 | 8.8% |
| Ukrainian | 19 | 4.6% | View All 10 Rows |
Immigrants in Aquadale
The most numerous immigrant groups reported in Aquadale came from Brazil (19 | 4.6%), Latin America (19 | 4.6%), South America (19 | 4.6%), Eastern Europe (17 | 4.2%), and Europe (17 | 4.2%), together accounting for 22.3% of all Aquadale residents.
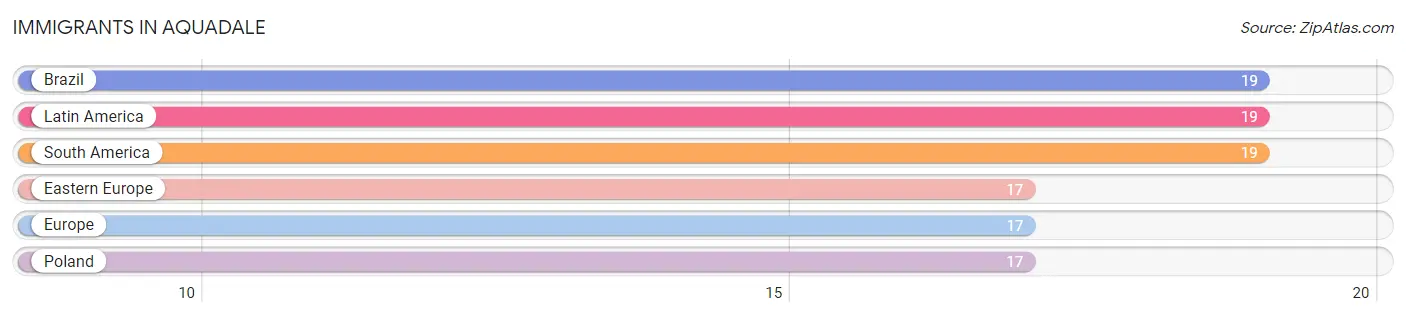
| Immigration Origin | # Population | % Population |
| Brazil | 19 | 4.6% |
| Eastern Europe | 17 | 4.2% |
| Europe | 17 | 4.2% |
| Latin America | 19 | 4.6% |
| Poland | 17 | 4.2% |
| South America | 19 | 4.6% | View All 6 Rows |
Sex and Age in Aquadale
Sex and Age in Aquadale
The most populous age groups in Aquadale are 50 to 54 Years (63 | 36.8%) for men and 45 to 49 Years (67 | 28.1%) for women.
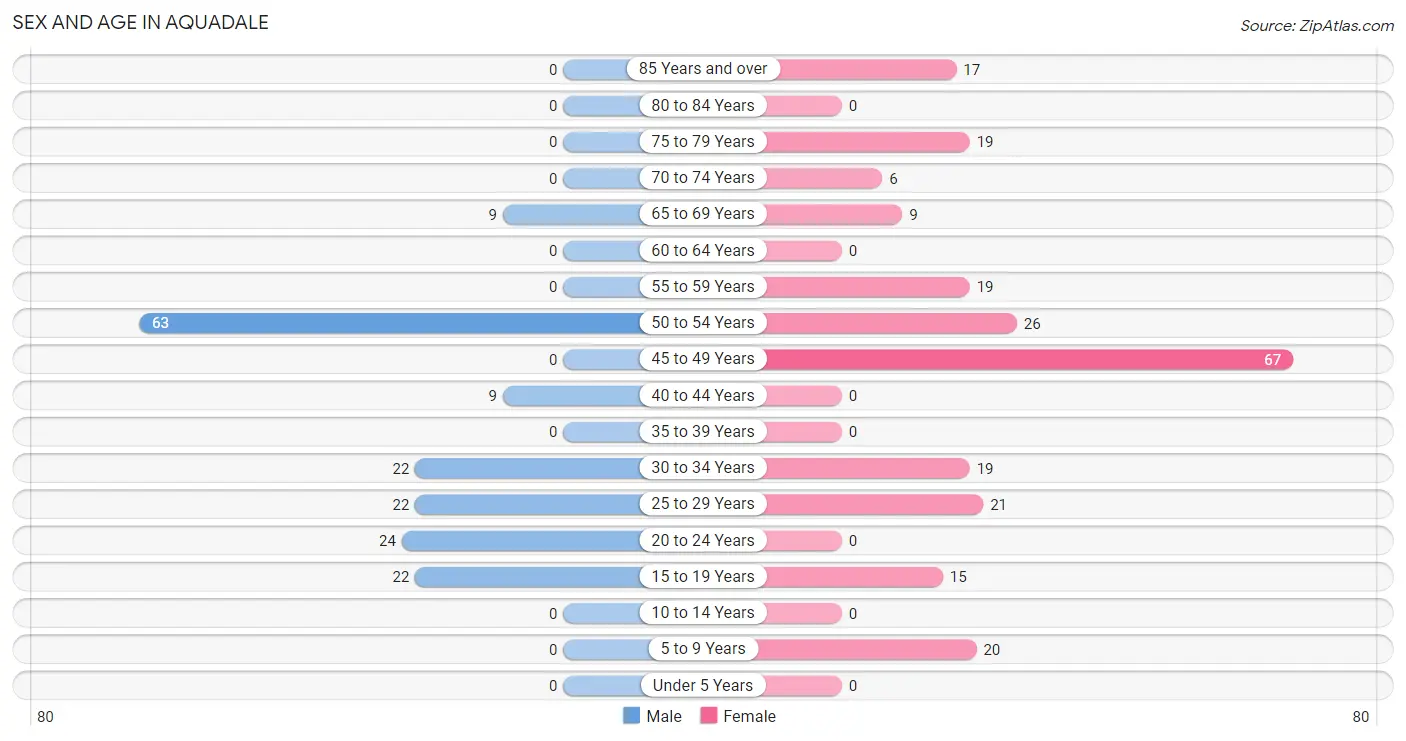
| Age Bracket | Male | Female |
| Under 5 Years | 0 (0.0%) | 0 (0.0%) |
| 5 to 9 Years | 0 (0.0%) | 20 (8.4%) |
| 10 to 14 Years | 0 (0.0%) | 0 (0.0%) |
| 15 to 19 Years | 22 (12.9%) | 15 (6.3%) |
| 20 to 24 Years | 24 (14.0%) | 0 (0.0%) |
| 25 to 29 Years | 22 (12.9%) | 21 (8.8%) |
| 30 to 34 Years | 22 (12.9%) | 19 (8.0%) |
| 35 to 39 Years | 0 (0.0%) | 0 (0.0%) |
| 40 to 44 Years | 9 (5.3%) | 0 (0.0%) |
| 45 to 49 Years | 0 (0.0%) | 67 (28.1%) |
| 50 to 54 Years | 63 (36.8%) | 26 (10.9%) |
| 55 to 59 Years | 0 (0.0%) | 19 (8.0%) |
| 60 to 64 Years | 0 (0.0%) | 0 (0.0%) |
| 65 to 69 Years | 9 (5.3%) | 9 (3.8%) |
| 70 to 74 Years | 0 (0.0%) | 6 (2.5%) |
| 75 to 79 Years | 0 (0.0%) | 19 (8.0%) |
| 80 to 84 Years | 0 (0.0%) | 0 (0.0%) |
| 85 Years and over | 0 (0.0%) | 17 (7.1%) |
| Total | 171 (100.0%) | 238 (100.0%) |
Families and Households in Aquadale
Median Family Size in Aquadale
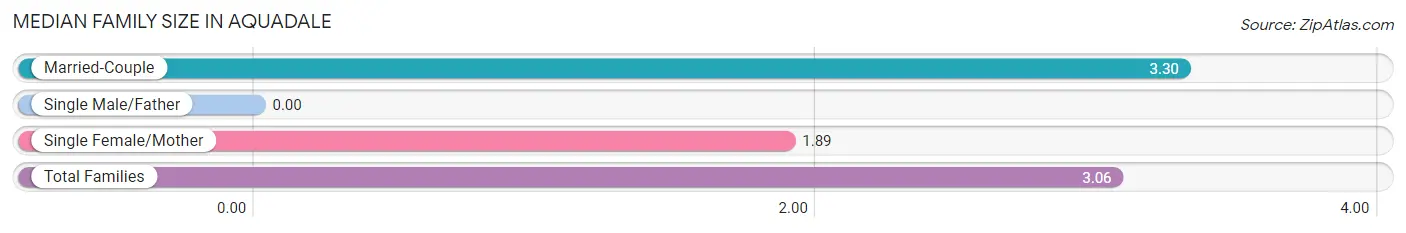
| Family Type | # Families | Family Size |
| Married-Couple | 93 (83.0%) | 3.30 |
| Single Male/Father | 0 (0.0%) | - |
| Single Female/Mother | 19 (17.0%) | 1.89 |
| Total Families | 112 (100.0%) | 3.06 |
Median Household Size in Aquadale
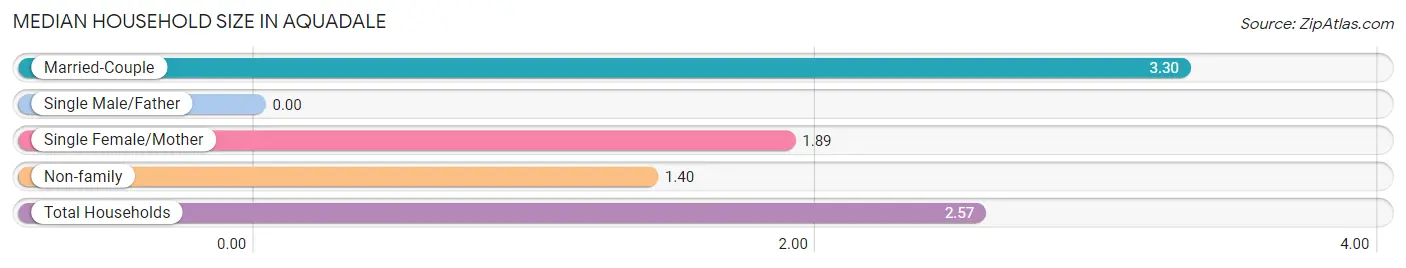
| Household Type | # Households | Household Size |
| Married-Couple | 93 (58.5%) | 3.30 |
| Single Male/Father | 0 (0.0%) | - |
| Single Female/Mother | 19 (11.9%) | 1.89 |
| Non-family | 47 (29.6%) | 1.40 |
| Total Households | 159 (100.0%) | 2.57 |
Household Size by Marriage Status in Aquadale
Out of a total of 159 households in Aquadale, 112 (70.4%) are family households, while 47 (29.6%) are nonfamily households. The most numerous type of family households are 2-person households, comprising 75, and the most common type of nonfamily households are 2-person households, comprising 24.
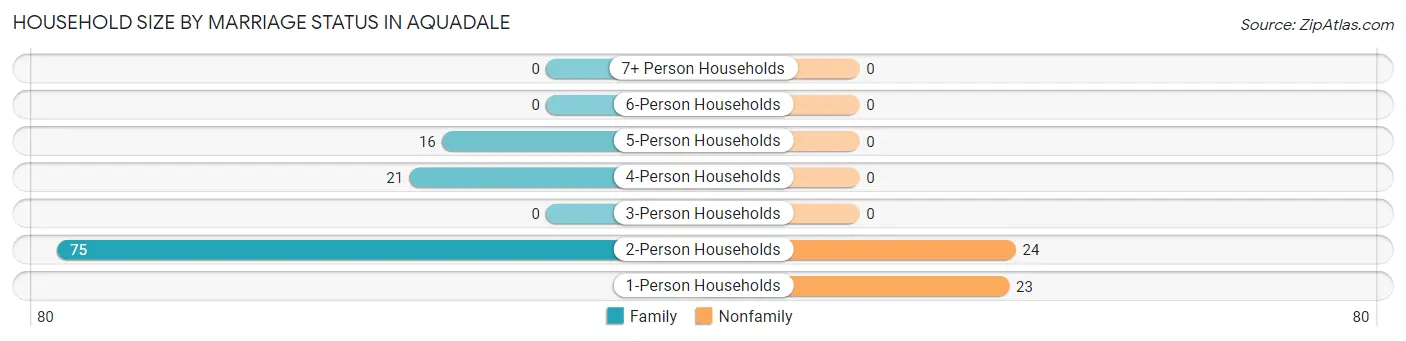
| Household Size | Family Households | Nonfamily Households |
| 1-Person Households | - | 23 (14.5%) |
| 2-Person Households | 75 (47.2%) | 24 (15.1%) |
| 3-Person Households | 0 (0.0%) | 0 (0.0%) |
| 4-Person Households | 21 (13.2%) | 0 (0.0%) |
| 5-Person Households | 16 (10.1%) | 0 (0.0%) |
| 6-Person Households | 0 (0.0%) | 0 (0.0%) |
| 7+ Person Households | 0 (0.0%) | 0 (0.0%) |
| Total | 112 (70.4%) | 47 (29.6%) |
Female Fertility in Aquadale
Fertility by Age in Aquadale
| Age Bracket | Women with Births | Births / 1,000 Women |
| 15 to 19 years | 0 (0.0%) | 0.0 |
| 20 to 34 years | 0 (0.0%) | 0.0 |
| 35 to 50 years | 0 (0.0%) | 0.0 |
| Total | 0 (0.0%) | 0.0 |
Fertility by Age by Marriage Status in Aquadale
| Age Bracket | Married | Unmarried |
| 15 to 19 years | 0 (0.0%) | 0 (0.0%) |
| 20 to 34 years | 0 (0.0%) | 0 (0.0%) |
| 35 to 50 years | 0 (0.0%) | 0 (0.0%) |
| Total | 0 (0.0%) | 0 (0.0%) |
Fertility by Education in Aquadale
| Educational Attainment | Women with Births | Births / 1,000 Women |
| Less than High School | 0 (0.0%) | 0.0 |
| High School Diploma | 0 (0.0%) | 0.0 |
| College or Associate's Degree | 0 (0.0%) | 0.0 |
| Bachelor's Degree | 0 (0.0%) | 0.0 |
| Graduate Degree | 0 (0.0%) | 0.0 |
| Total | 0 (0.0%) | 0.0 |
Fertility by Education by Marriage Status in Aquadale
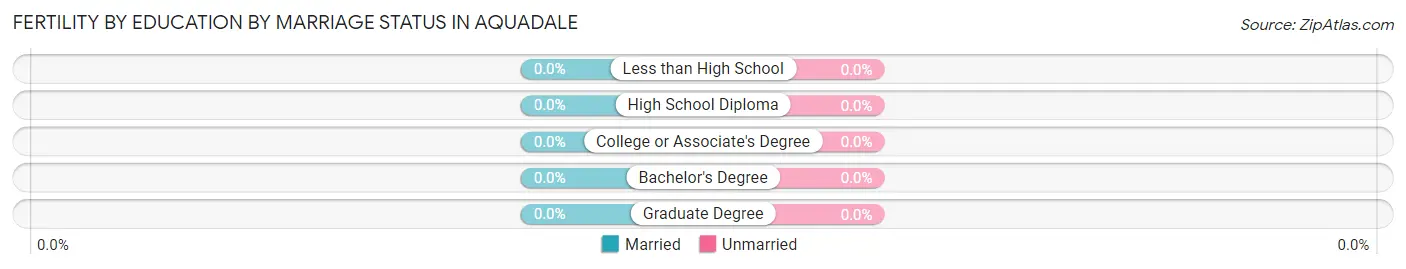
| Educational Attainment | Married | Unmarried |
| Less than High School | 0 (0.0%) | 0 (0.0%) |
| High School Diploma | 0 (0.0%) | 0 (0.0%) |
| College or Associate's Degree | 0 (0.0%) | 0 (0.0%) |
| Bachelor's Degree | 0 (0.0%) | 0 (0.0%) |
| Graduate Degree | 0 (0.0%) | 0 (0.0%) |
| Total | 0 (0.0%) | 0 (0.0%) |
Employment Characteristics in Aquadale
Employment by Class of Employer in Aquadale
Among the 305 employed individuals in Aquadale, private company employees (187 | 61.3%), self-employed (incorporated) (47 | 15.4%), and state government employees (41 | 13.4%) make up the most common classes of employment.
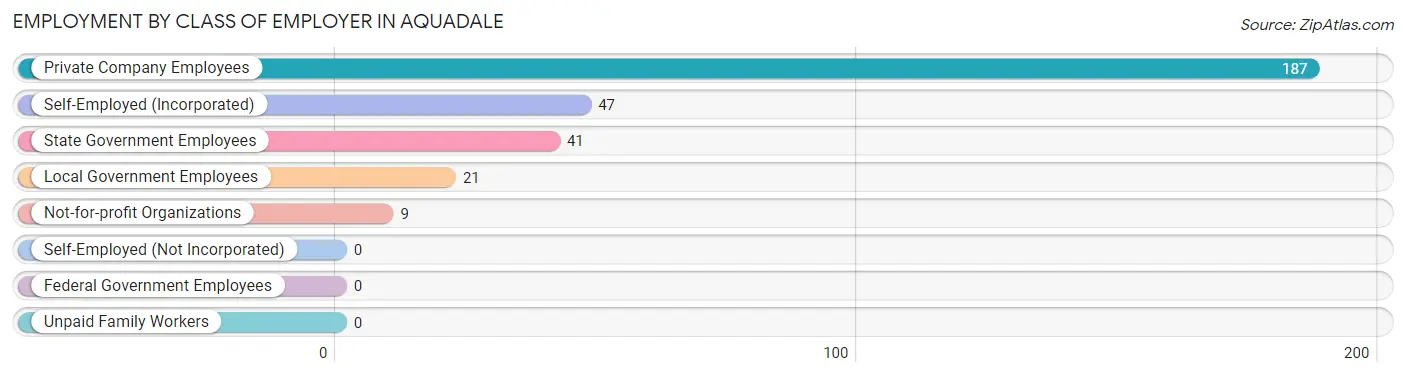
| Employer Class | # Employees | % Employees |
| Private Company Employees | 187 | 61.3% |
| Self-Employed (Incorporated) | 47 | 15.4% |
| Self-Employed (Not Incorporated) | 0 | 0.0% |
| Not-for-profit Organizations | 9 | 2.9% |
| Local Government Employees | 21 | 6.9% |
| State Government Employees | 41 | 13.4% |
| Federal Government Employees | 0 | 0.0% |
| Unpaid Family Workers | 0 | 0.0% |
| Total | 305 | 100.0% |
Employment Status by Age in Aquadale
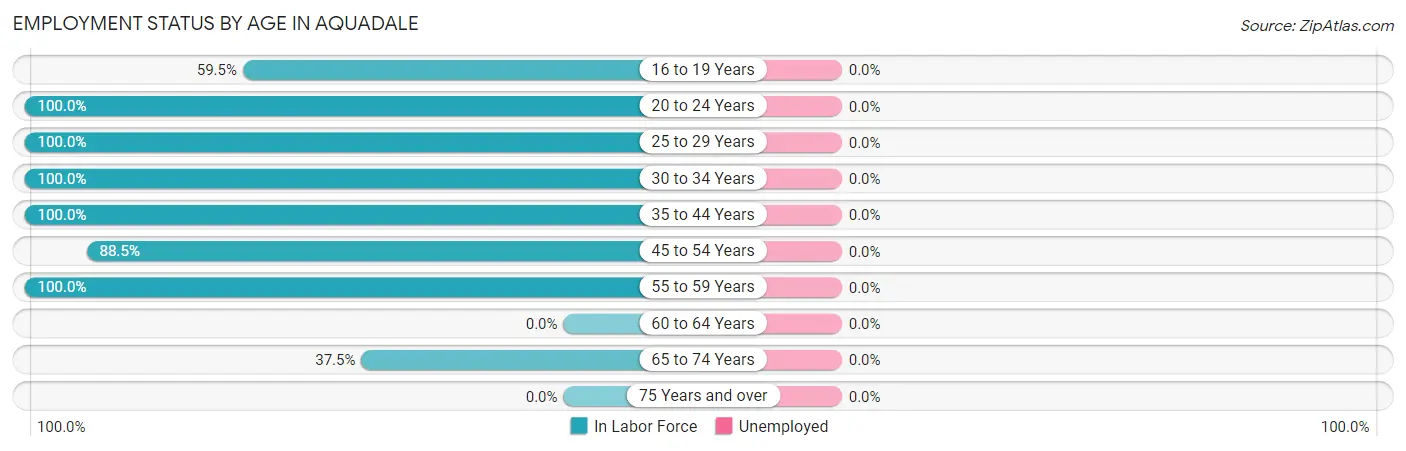
| Age Bracket | In Labor Force | Unemployed |
| 16 to 19 Years | 22 (59.5%) | 0 (0.0%) |
| 20 to 24 Years | 24 (100.0%) | 0 (0.0%) |
| 25 to 29 Years | 43 (100.0%) | 0 (0.0%) |
| 30 to 34 Years | 41 (100.0%) | 0 (0.0%) |
| 35 to 44 Years | 9 (100.0%) | 0 (0.0%) |
| 45 to 54 Years | 138 (88.5%) | 0 (0.0%) |
| 55 to 59 Years | 19 (100.0%) | 0 (0.0%) |
| 60 to 64 Years | 0 (0.0%) | 0 (0.0%) |
| 65 to 74 Years | 9 (37.5%) | 0 (0.0%) |
| 75 Years and over | 0 (0.0%) | 0 (0.0%) |
| Total | 305 (78.4%) | 0 (0.0%) |
Employment Status by Educational Attainment in Aquadale
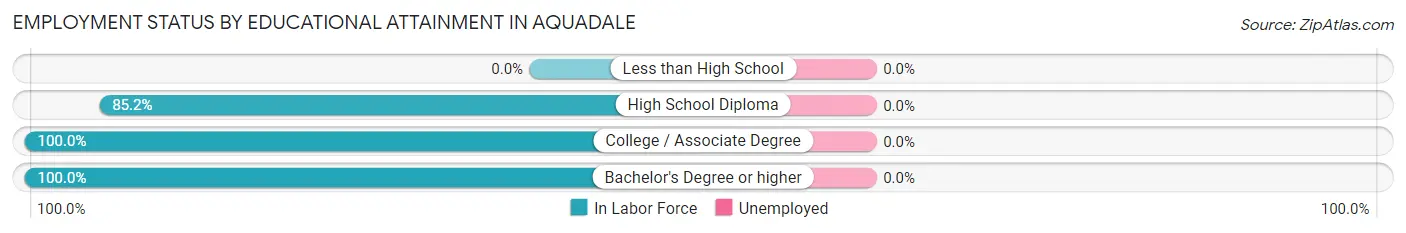
| Educational Attainment | In Labor Force | Unemployed |
| Less than High School | 0 (0.0%) | 0 (0.0%) |
| High School Diploma | 104 (85.2%) | 0 (0.0%) |
| College / Associate Degree | 118 (100.0%) | 0 (0.0%) |
| Bachelor's Degree or higher | 28 (100.0%) | 0 (0.0%) |
| Total | 250 (93.3%) | 0 (0.0%) |
Employment Occupations by Sex in Aquadale
Management, Business, Science and Arts Occupations
The most common Management, Business, Science and Arts occupations in Aquadale are Management (47 | 15.4%), Health Diagnosing & Treating (28 | 9.2%), and Health Technologists (19 | 6.2%).
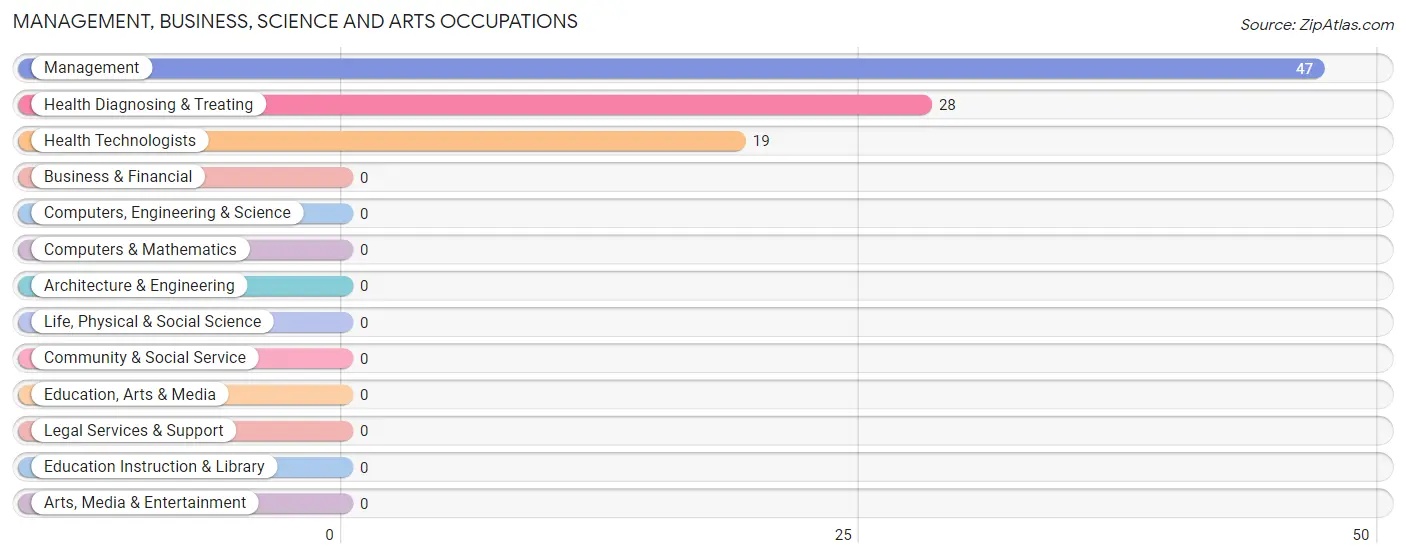
Management, Business, Science and Arts Occupations by Sex
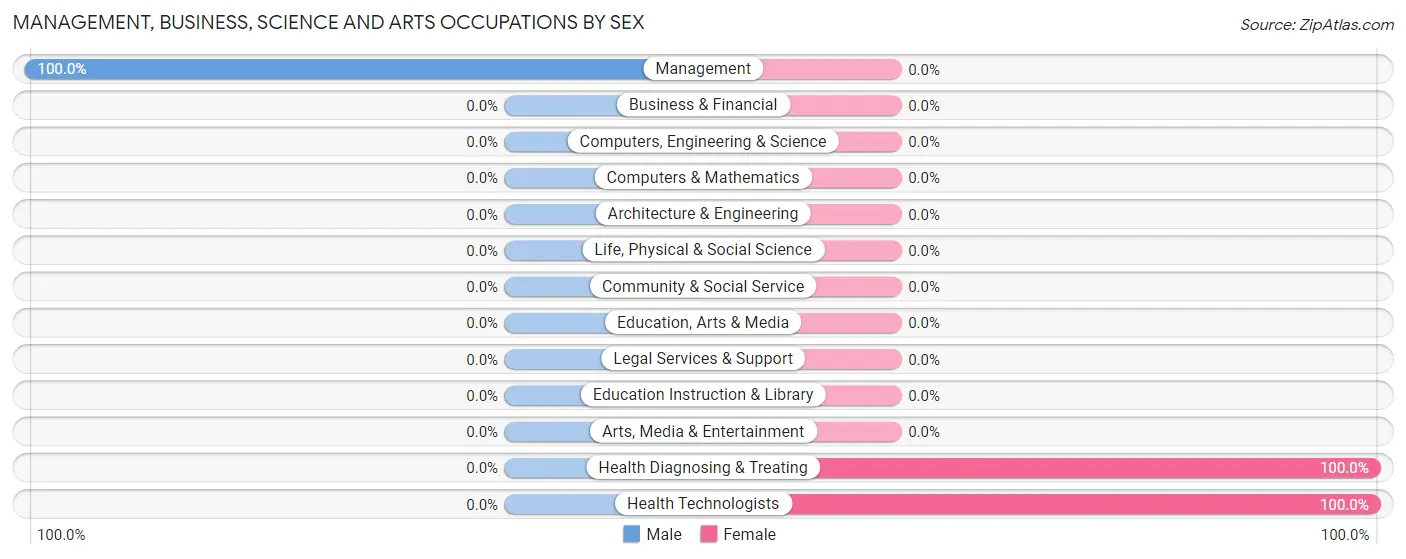
| Occupation | Male | Female |
| Management | 47 (100.0%) | 0 (0.0%) |
| Business & Financial | 0 (0.0%) | 0 (0.0%) |
| Computers, Engineering & Science | 0 (0.0%) | 0 (0.0%) |
| Computers & Mathematics | 0 (0.0%) | 0 (0.0%) |
| Architecture & Engineering | 0 (0.0%) | 0 (0.0%) |
| Life, Physical & Social Science | 0 (0.0%) | 0 (0.0%) |
| Community & Social Service | 0 (0.0%) | 0 (0.0%) |
| Education, Arts & Media | 0 (0.0%) | 0 (0.0%) |
| Legal Services & Support | 0 (0.0%) | 0 (0.0%) |
| Education Instruction & Library | 0 (0.0%) | 0 (0.0%) |
| Arts, Media & Entertainment | 0 (0.0%) | 0 (0.0%) |
| Health Diagnosing & Treating | 0 (0.0%) | 28 (100.0%) |
| Health Technologists | 0 (0.0%) | 19 (100.0%) |
| Total (Category) | 47 (62.7%) | 28 (37.3%) |
| Total (Overall) | 162 (53.1%) | 143 (46.9%) |
Services Occupations
The most common Services occupations in Aquadale are Security & Protection (22 | 7.2%), Law Enforcement (22 | 7.2%), Cleaning & Maintenance (16 | 5.2%), and Healthcare Support (8 | 2.6%).
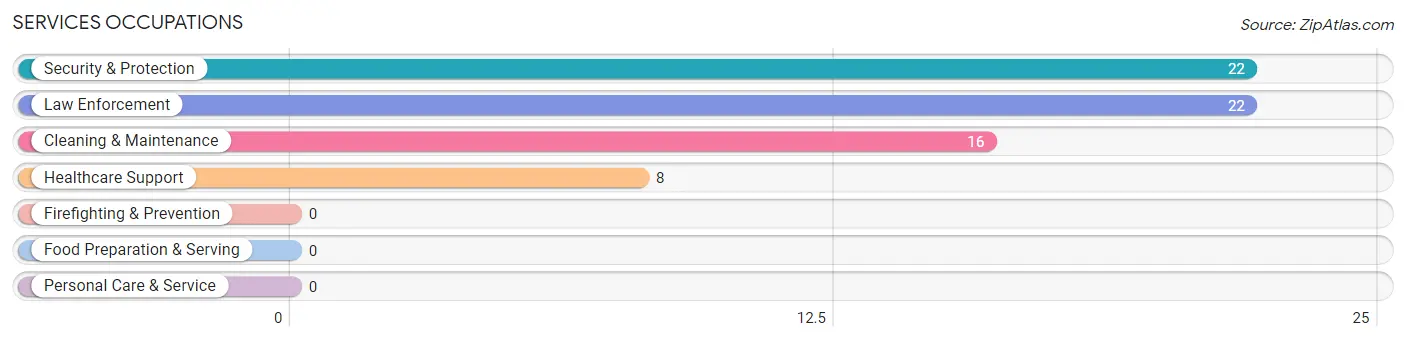
Services Occupations by Sex
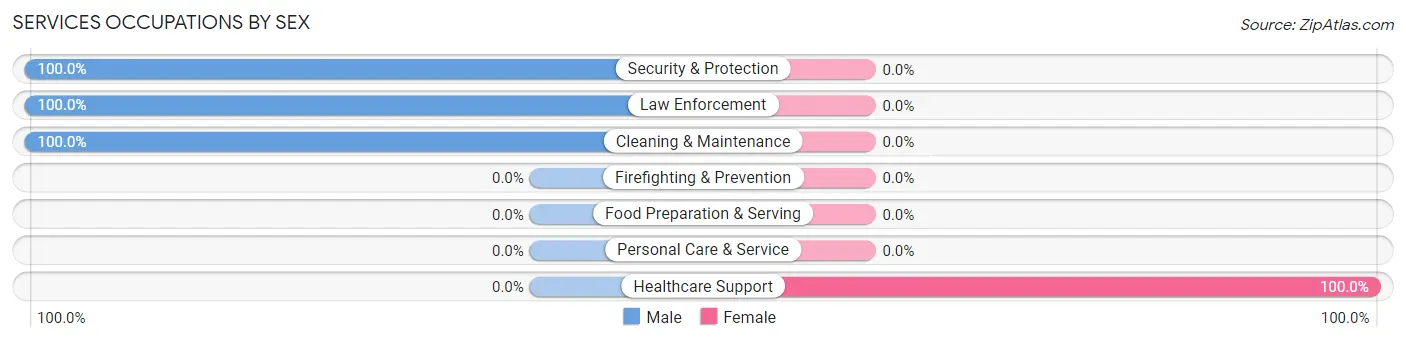
| Occupation | Male | Female |
| Healthcare Support | 0 (0.0%) | 8 (100.0%) |
| Security & Protection | 22 (100.0%) | 0 (0.0%) |
| Firefighting & Prevention | 0 (0.0%) | 0 (0.0%) |
| Law Enforcement | 22 (100.0%) | 0 (0.0%) |
| Food Preparation & Serving | 0 (0.0%) | 0 (0.0%) |
| Cleaning & Maintenance | 16 (100.0%) | 0 (0.0%) |
| Personal Care & Service | 0 (0.0%) | 0 (0.0%) |
| Total (Category) | 38 (82.6%) | 8 (17.4%) |
| Total (Overall) | 162 (53.1%) | 143 (46.9%) |
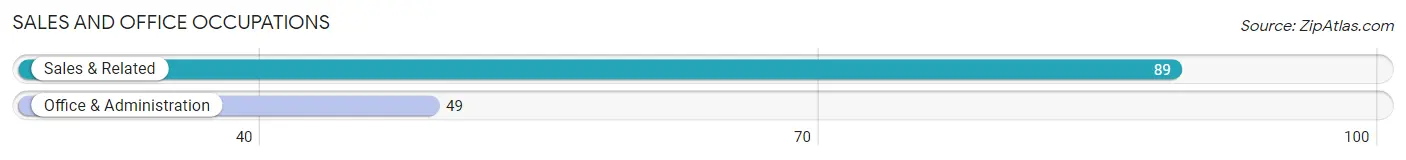
Sales and Office Occupations
The most common Sales and Office occupations in Aquadale are Sales & Related (89 | 29.2%), and Office & Administration (49 | 16.1%).
Sales and Office Occupations by Sex
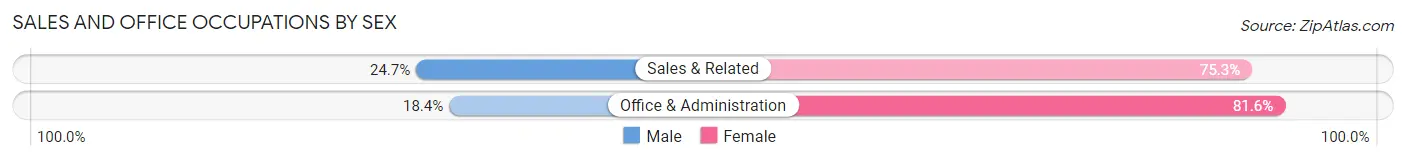
| Occupation | Male | Female |
| Sales & Related | 22 (24.7%) | 67 (75.3%) |
| Office & Administration | 9 (18.4%) | 40 (81.6%) |
| Total (Category) | 31 (22.5%) | 107 (77.5%) |
| Total (Overall) | 162 (53.1%) | 143 (46.9%) |
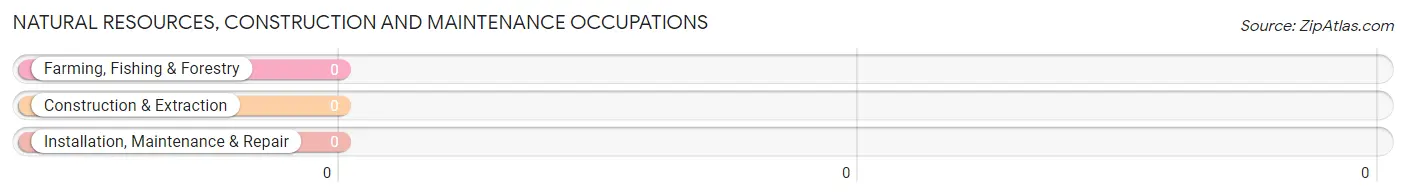
Natural Resources, Construction and Maintenance Occupations
Natural Resources, Construction and Maintenance Occupations by Sex
| Occupation | Male | Female |
| Farming, Fishing & Forestry | 0 (0.0%) | 0 (0.0%) |
| Construction & Extraction | 0 (0.0%) | 0 (0.0%) |
| Installation, Maintenance & Repair | 0 (0.0%) | 0 (0.0%) |
| Total (Category) | 0 (0.0%) | 0 (0.0%) |
| Total (Overall) | 162 (53.1%) | 143 (46.9%) |
Production, Transportation and Moving Occupations
The most common Production, Transportation and Moving occupations in Aquadale are Transportation (24 | 7.9%), and Production (22 | 7.2%).
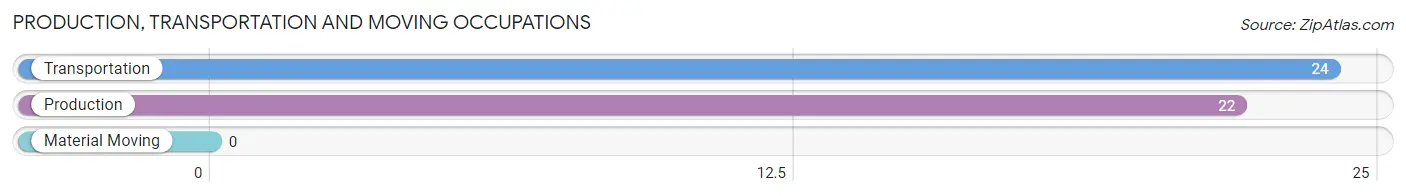
Production, Transportation and Moving Occupations by Sex
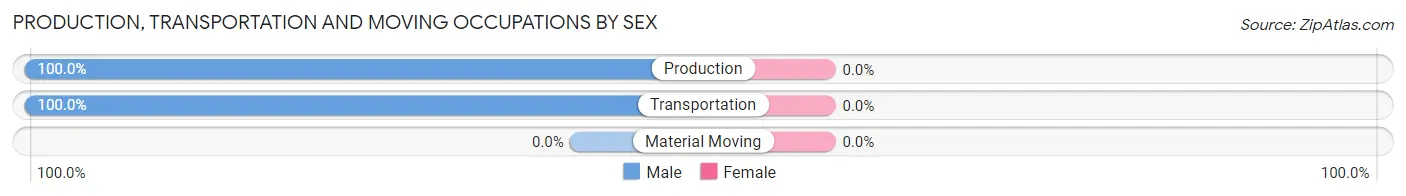
| Occupation | Male | Female |
| Production | 22 (100.0%) | 0 (0.0%) |
| Transportation | 24 (100.0%) | 0 (0.0%) |
| Material Moving | 0 (0.0%) | 0 (0.0%) |
| Total (Category) | 46 (100.0%) | 0 (0.0%) |
| Total (Overall) | 162 (53.1%) | 143 (46.9%) |
Employment Industries by Sex in Aquadale
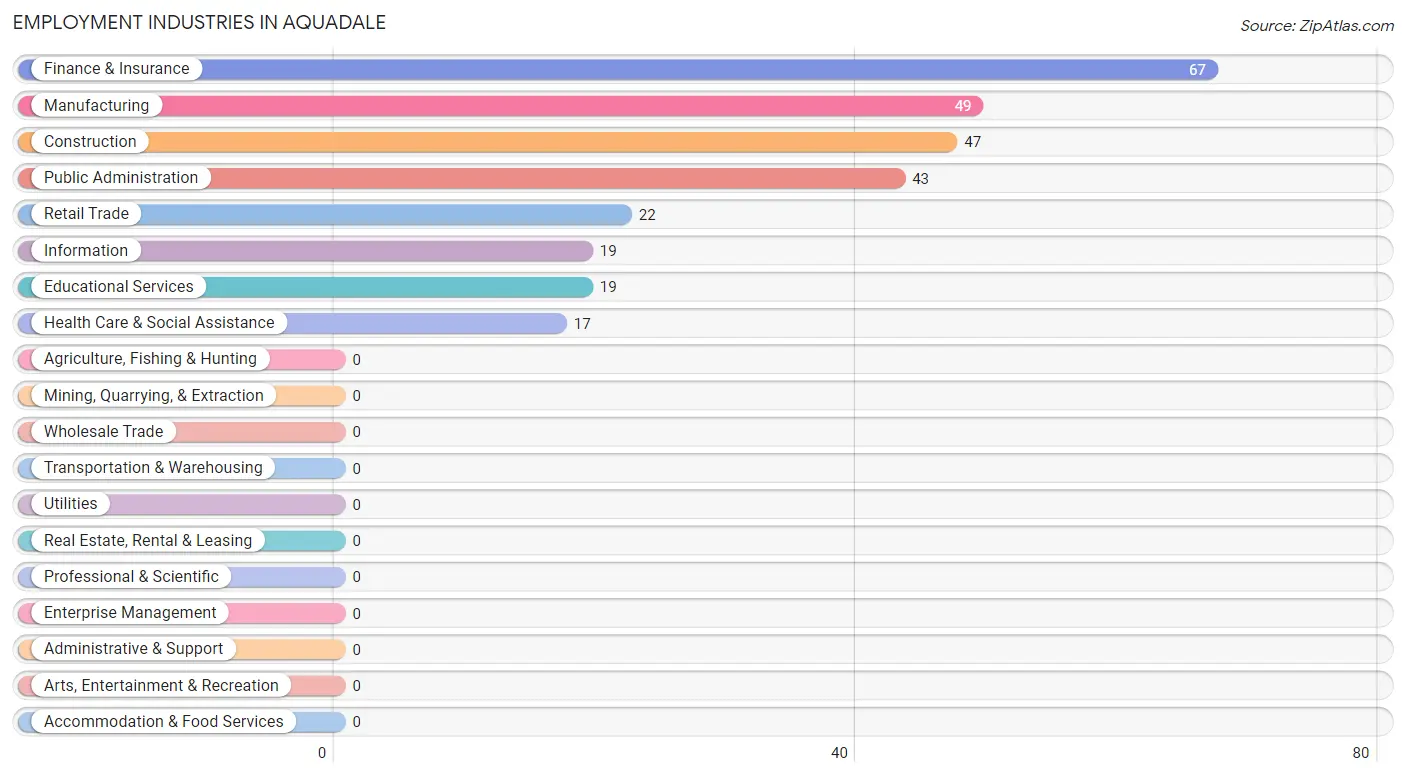
Employment Industries in Aquadale
The major employment industries in Aquadale include Finance & Insurance (67 | 22.0%), Manufacturing (49 | 16.1%), Construction (47 | 15.4%), Public Administration (43 | 14.1%), and Retail Trade (22 | 7.2%).
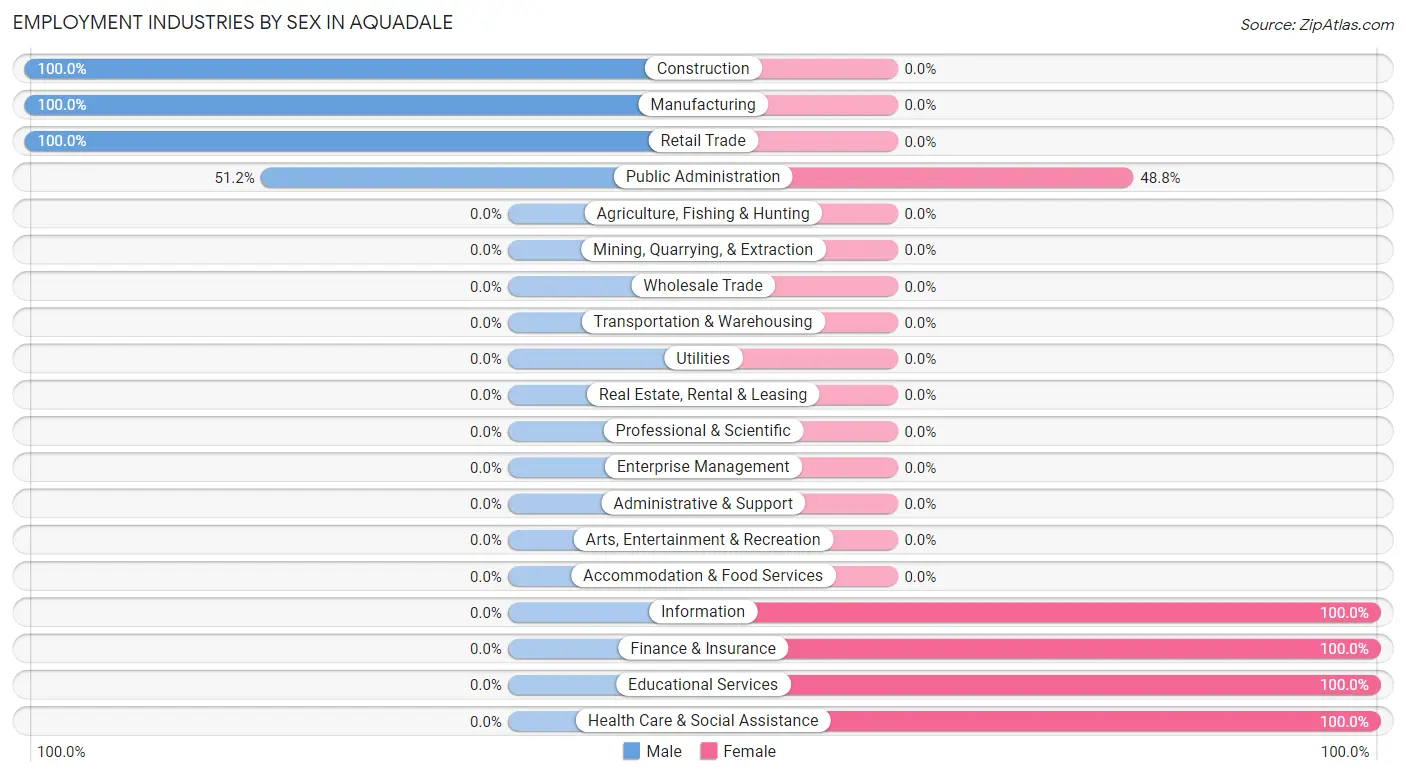
Employment Industries by Sex in Aquadale
The Aquadale industries that see more men than women are Construction (100.0%), Manufacturing (100.0%), and Retail Trade (100.0%), whereas the industries that tend to have a higher number of women are Information (100.0%), Finance & Insurance (100.0%), and Educational Services (100.0%).
| Industry | Male | Female |
| Agriculture, Fishing & Hunting | 0 (0.0%) | 0 (0.0%) |
| Mining, Quarrying, & Extraction | 0 (0.0%) | 0 (0.0%) |
| Construction | 47 (100.0%) | 0 (0.0%) |
| Manufacturing | 49 (100.0%) | 0 (0.0%) |
| Wholesale Trade | 0 (0.0%) | 0 (0.0%) |
| Retail Trade | 22 (100.0%) | 0 (0.0%) |
| Transportation & Warehousing | 0 (0.0%) | 0 (0.0%) |
| Utilities | 0 (0.0%) | 0 (0.0%) |
| Information | 0 (0.0%) | 19 (100.0%) |
| Finance & Insurance | 0 (0.0%) | 67 (100.0%) |
| Real Estate, Rental & Leasing | 0 (0.0%) | 0 (0.0%) |
| Professional & Scientific | 0 (0.0%) | 0 (0.0%) |
| Enterprise Management | 0 (0.0%) | 0 (0.0%) |
| Administrative & Support | 0 (0.0%) | 0 (0.0%) |
| Educational Services | 0 (0.0%) | 19 (100.0%) |
| Health Care & Social Assistance | 0 (0.0%) | 17 (100.0%) |
| Arts, Entertainment & Recreation | 0 (0.0%) | 0 (0.0%) |
| Accommodation & Food Services | 0 (0.0%) | 0 (0.0%) |
| Public Administration | 22 (51.2%) | 21 (48.8%) |
| Total | 162 (53.1%) | 143 (46.9%) |
Education in Aquadale
School Enrollment in Aquadale
The most common levels of schooling among the 42 students in Aquadale are college / undergraduate (22 | 52.4%), and kindergarten (20 | 47.6%).
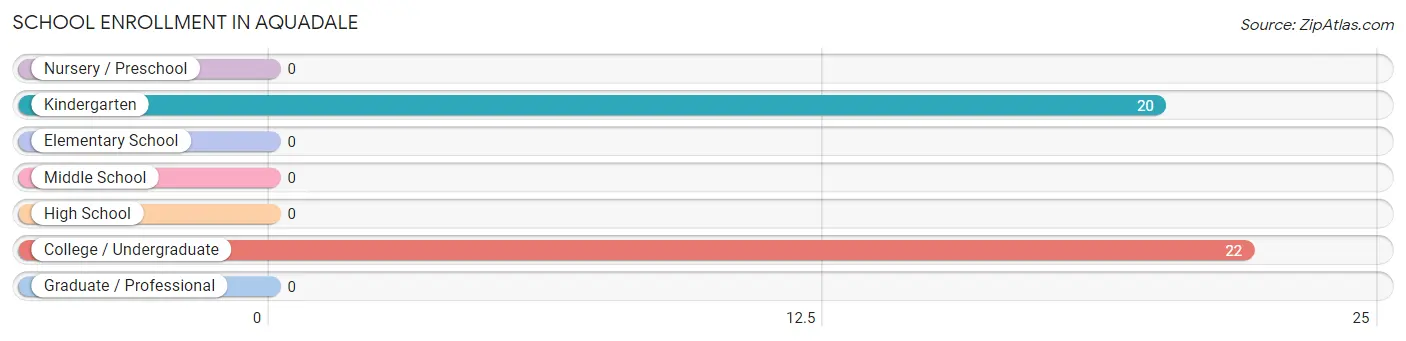
| School Level | # Students | % Students |
| Nursery / Preschool | 0 | 0.0% |
| Kindergarten | 20 | 47.6% |
| Elementary School | 0 | 0.0% |
| Middle School | 0 | 0.0% |
| High School | 0 | 0.0% |
| College / Undergraduate | 22 | 52.4% |
| Graduate / Professional | 0 | 0.0% |
| Total | 42 | 100.0% |
School Enrollment by Age by Funding Source in Aquadale
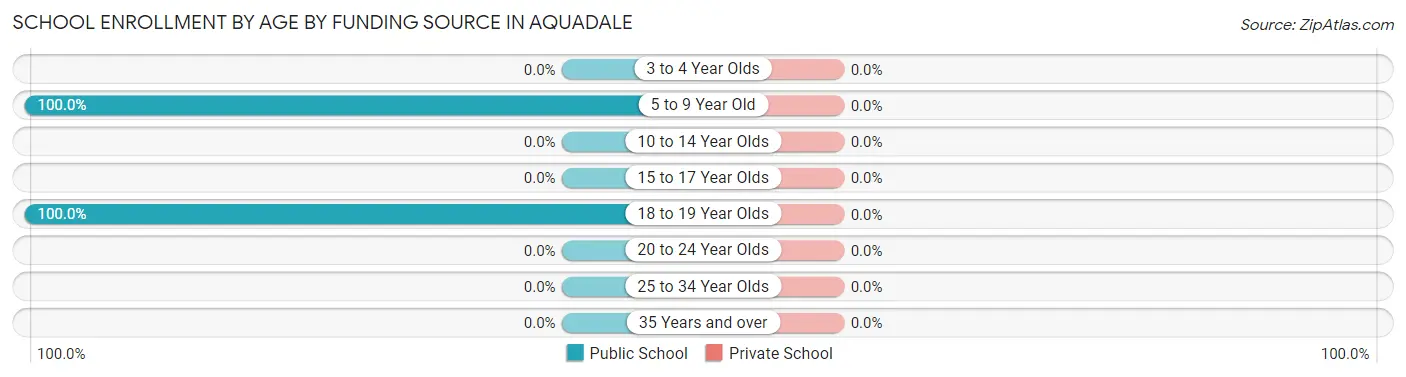
| Age Bracket | Public School | Private School |
| 3 to 4 Year Olds | 0 (0.0%) | 0 (0.0%) |
| 5 to 9 Year Old | 20 (100.0%) | 0 (0.0%) |
| 10 to 14 Year Olds | 0 (0.0%) | 0 (0.0%) |
| 15 to 17 Year Olds | 0 (0.0%) | 0 (0.0%) |
| 18 to 19 Year Olds | 22 (100.0%) | 0 (0.0%) |
| 20 to 24 Year Olds | 0 (0.0%) | 0 (0.0%) |
| 25 to 34 Year Olds | 0 (0.0%) | 0 (0.0%) |
| 35 Years and over | 0 (0.0%) | 0 (0.0%) |
| Total | 42 (100.0%) | 0 (0.0%) |
Educational Attainment by Field of Study in Aquadale
Education (19 | 67.9%), and business (9 | 32.1%) are the most common fields of study among 28 individuals in Aquadale who have obtained a bachelor's degree or higher.
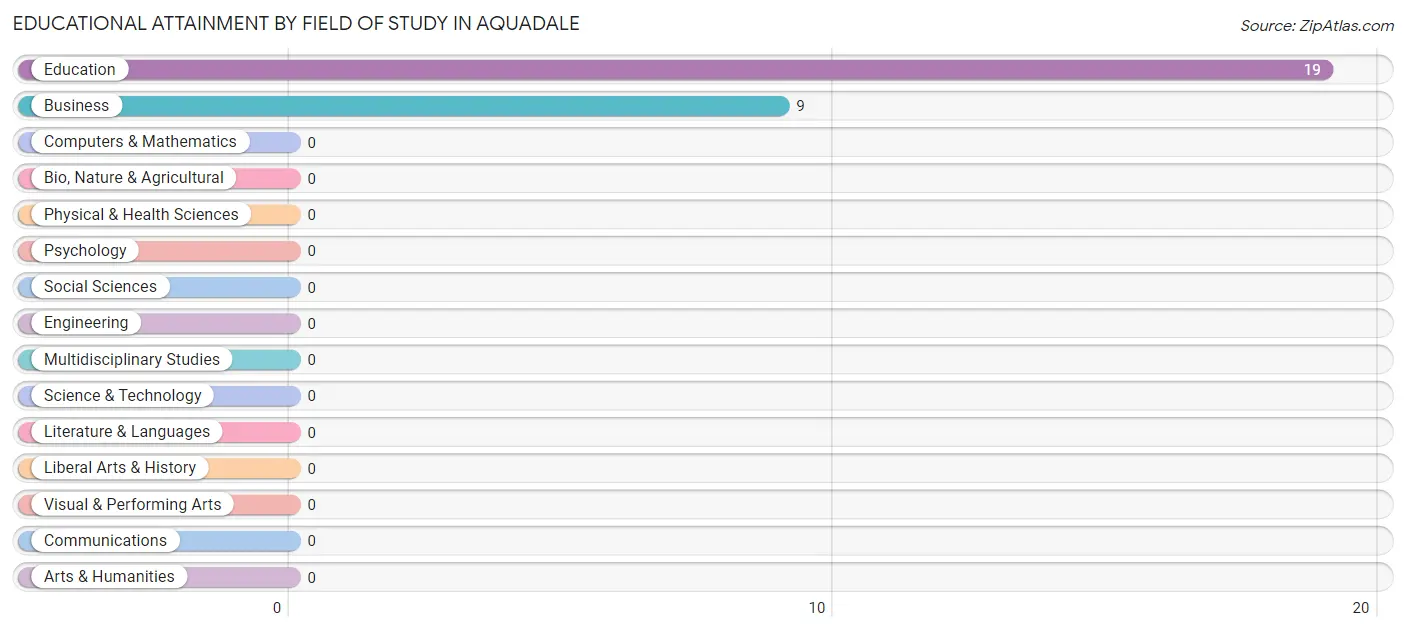
| Field of Study | # Graduates | % Graduates |
| Computers & Mathematics | 0 | 0.0% |
| Bio, Nature & Agricultural | 0 | 0.0% |
| Physical & Health Sciences | 0 | 0.0% |
| Psychology | 0 | 0.0% |
| Social Sciences | 0 | 0.0% |
| Engineering | 0 | 0.0% |
| Multidisciplinary Studies | 0 | 0.0% |
| Science & Technology | 0 | 0.0% |
| Business | 9 | 32.1% |
| Education | 19 | 67.9% |
| Literature & Languages | 0 | 0.0% |
| Liberal Arts & History | 0 | 0.0% |
| Visual & Performing Arts | 0 | 0.0% |
| Communications | 0 | 0.0% |
| Arts & Humanities | 0 | 0.0% |
| Total | 28 | 100.0% |
Transportation & Commute in Aquadale
Vehicle Availability by Sex in Aquadale
The most prevalent vehicle ownership categories in Aquadale are males with 2 vehicles (71, accounting for 43.8%) and females with 2 vehicles (86, making up 49.6%).
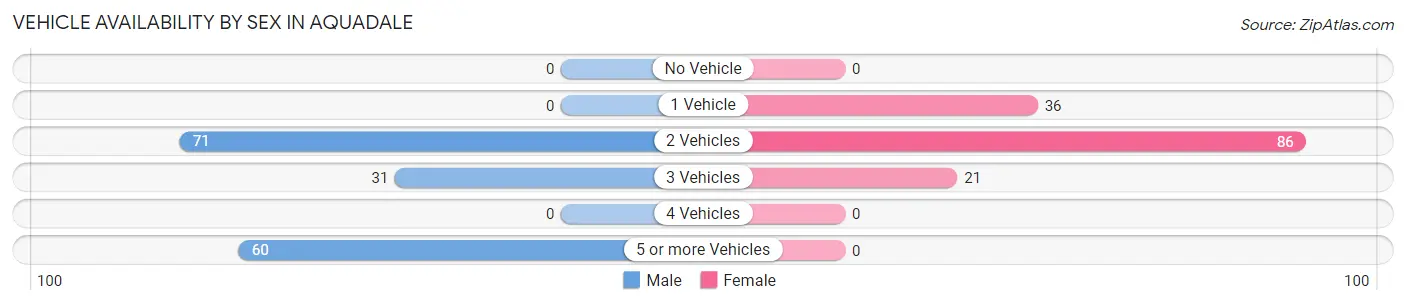
| Vehicles Available | Male | Female |
| No Vehicle | 0 (0.0%) | 0 (0.0%) |
| 1 Vehicle | 0 (0.0%) | 36 (25.2%) |
| 2 Vehicles | 71 (43.8%) | 86 (60.1%) |
| 3 Vehicles | 31 (19.1%) | 21 (14.7%) |
| 4 Vehicles | 0 (0.0%) | 0 (0.0%) |
| 5 or more Vehicles | 60 (37.0%) | 0 (0.0%) |
| Total | 162 (100.0%) | 143 (100.0%) |
Commute Time in Aquadale
The most frequently occuring commute durations in Aquadale are 15 to 19 minutes (67 commuters, 26.0%), 20 to 24 minutes (48 commuters, 18.6%), and 10 to 14 minutes (24 commuters, 9.3%).
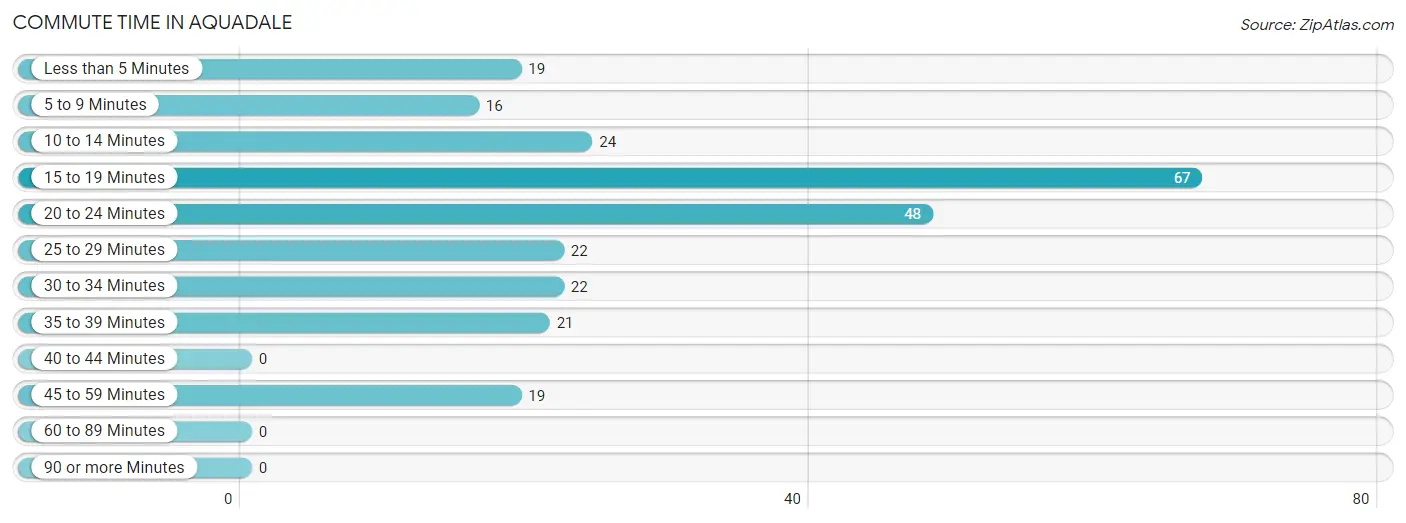
| Commute Time | # Commuters | % Commuters |
| Less than 5 Minutes | 19 | 7.4% |
| 5 to 9 Minutes | 16 | 6.2% |
| 10 to 14 Minutes | 24 | 9.3% |
| 15 to 19 Minutes | 67 | 26.0% |
| 20 to 24 Minutes | 48 | 18.6% |
| 25 to 29 Minutes | 22 | 8.5% |
| 30 to 34 Minutes | 22 | 8.5% |
| 35 to 39 Minutes | 21 | 8.1% |
| 40 to 44 Minutes | 0 | 0.0% |
| 45 to 59 Minutes | 19 | 7.4% |
| 60 to 89 Minutes | 0 | 0.0% |
| 90 or more Minutes | 0 | 0.0% |
Commute Time by Sex in Aquadale
The most common commute times in Aquadale are 20 to 24 minutes (31 commuters, 27.0%) for males and 15 to 19 minutes (67 commuters, 46.9%) for females.
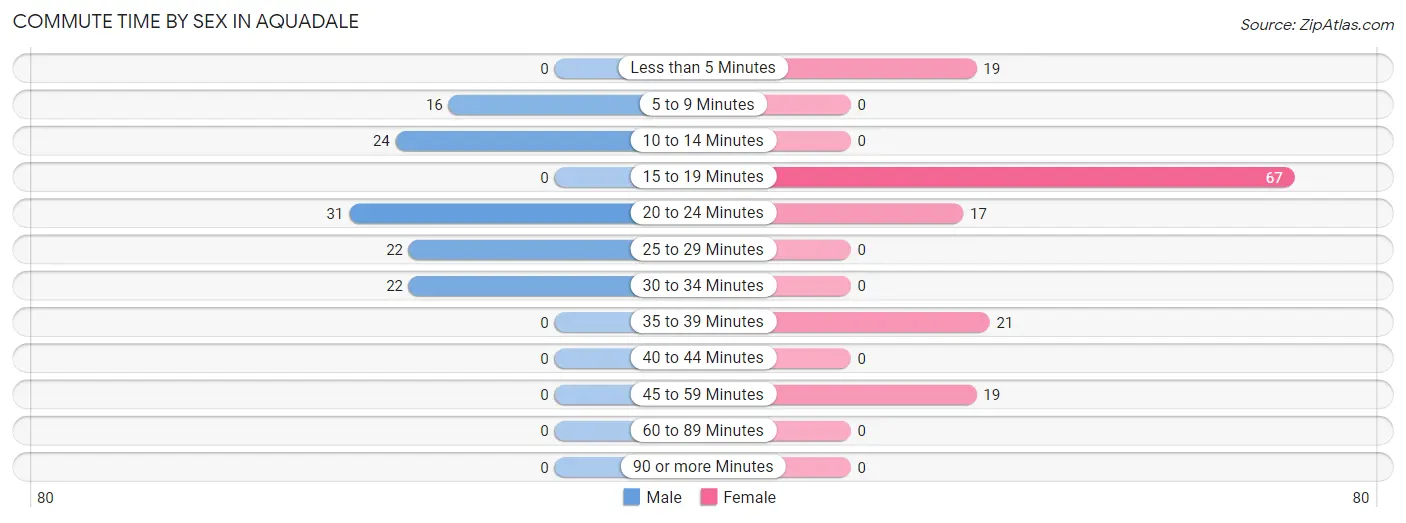
| Commute Time | Male | Female |
| Less than 5 Minutes | 0 (0.0%) | 19 (13.3%) |
| 5 to 9 Minutes | 16 (13.9%) | 0 (0.0%) |
| 10 to 14 Minutes | 24 (20.9%) | 0 (0.0%) |
| 15 to 19 Minutes | 0 (0.0%) | 67 (46.9%) |
| 20 to 24 Minutes | 31 (27.0%) | 17 (11.9%) |
| 25 to 29 Minutes | 22 (19.1%) | 0 (0.0%) |
| 30 to 34 Minutes | 22 (19.1%) | 0 (0.0%) |
| 35 to 39 Minutes | 0 (0.0%) | 21 (14.7%) |
| 40 to 44 Minutes | 0 (0.0%) | 0 (0.0%) |
| 45 to 59 Minutes | 0 (0.0%) | 19 (13.3%) |
| 60 to 89 Minutes | 0 (0.0%) | 0 (0.0%) |
| 90 or more Minutes | 0 (0.0%) | 0 (0.0%) |
Time of Departure to Work by Sex in Aquadale
The most frequent times of departure to work in Aquadale are 4:00 PM to 11:59 PM (38, 33.0%) for males and 8:00 AM to 8:29 AM (67, 46.9%) for females.
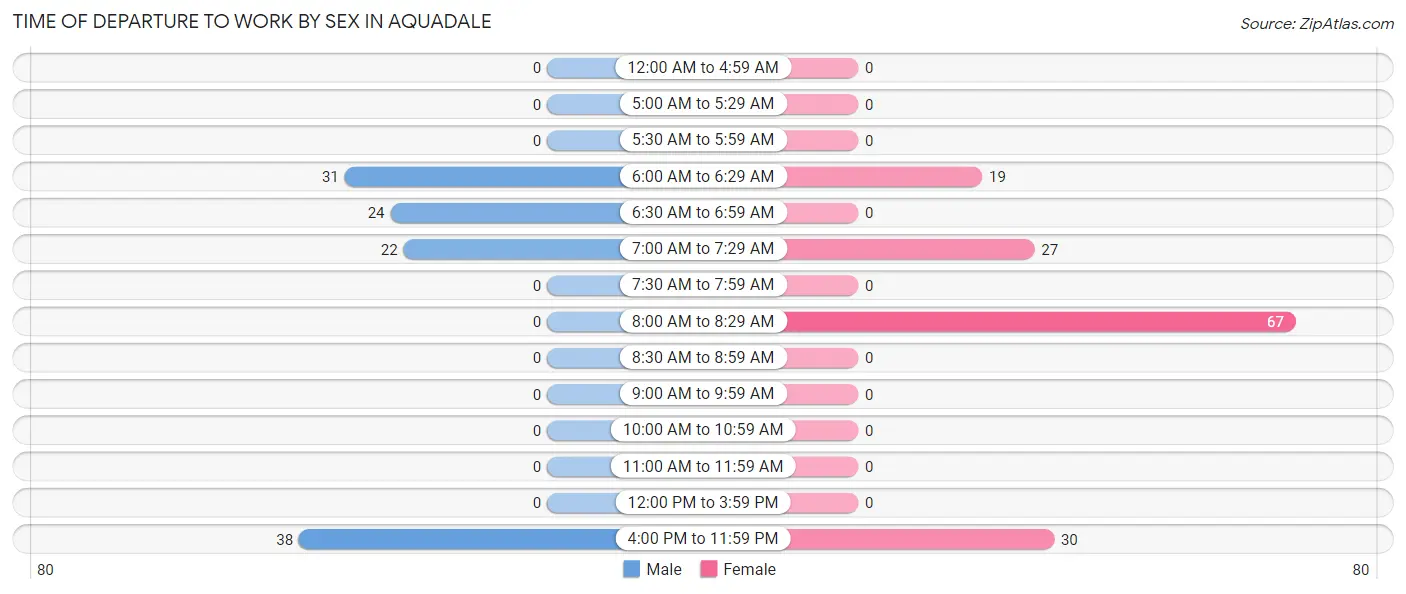
| Time of Departure | Male | Female |
| 12:00 AM to 4:59 AM | 0 (0.0%) | 0 (0.0%) |
| 5:00 AM to 5:29 AM | 0 (0.0%) | 0 (0.0%) |
| 5:30 AM to 5:59 AM | 0 (0.0%) | 0 (0.0%) |
| 6:00 AM to 6:29 AM | 31 (27.0%) | 19 (13.3%) |
| 6:30 AM to 6:59 AM | 24 (20.9%) | 0 (0.0%) |
| 7:00 AM to 7:29 AM | 22 (19.1%) | 27 (18.9%) |
| 7:30 AM to 7:59 AM | 0 (0.0%) | 0 (0.0%) |
| 8:00 AM to 8:29 AM | 0 (0.0%) | 67 (46.9%) |
| 8:30 AM to 8:59 AM | 0 (0.0%) | 0 (0.0%) |
| 9:00 AM to 9:59 AM | 0 (0.0%) | 0 (0.0%) |
| 10:00 AM to 10:59 AM | 0 (0.0%) | 0 (0.0%) |
| 11:00 AM to 11:59 AM | 0 (0.0%) | 0 (0.0%) |
| 12:00 PM to 3:59 PM | 0 (0.0%) | 0 (0.0%) |
| 4:00 PM to 11:59 PM | 38 (33.0%) | 30 (21.0%) |
| Total | 115 (100.0%) | 143 (100.0%) |
Housing Occupancy in Aquadale
Occupancy by Ownership in Aquadale
Of the total 159 dwellings in Aquadale, owner-occupied units account for 135 (84.9%), while renter-occupied units make up 24 (15.1%).
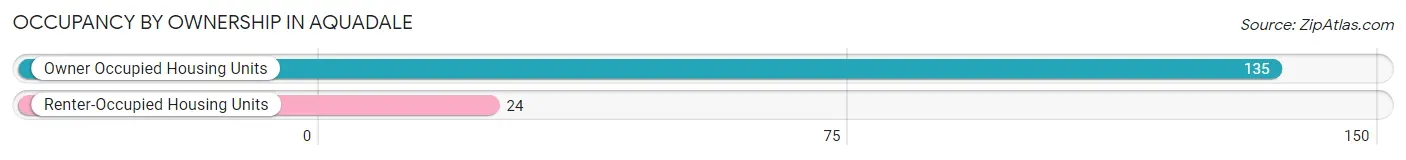
| Occupancy | # Housing Units | % Housing Units |
| Owner Occupied Housing Units | 135 | 84.9% |
| Renter-Occupied Housing Units | 24 | 15.1% |
| Total Occupied Housing Units | 159 | 100.0% |
Occupancy by Household Size in Aquadale
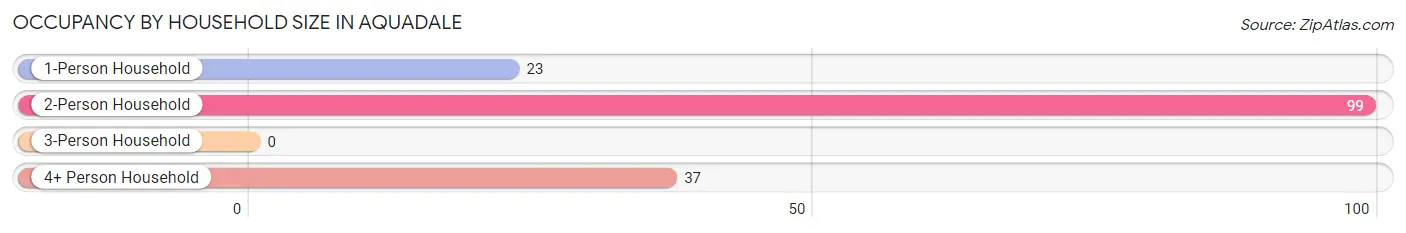
| Household Size | # Housing Units | % Housing Units |
| 1-Person Household | 23 | 14.5% |
| 2-Person Household | 99 | 62.3% |
| 3-Person Household | 0 | 0.0% |
| 4+ Person Household | 37 | 23.3% |
| Total Housing Units | 159 | 100.0% |
Occupancy by Ownership by Household Size in Aquadale
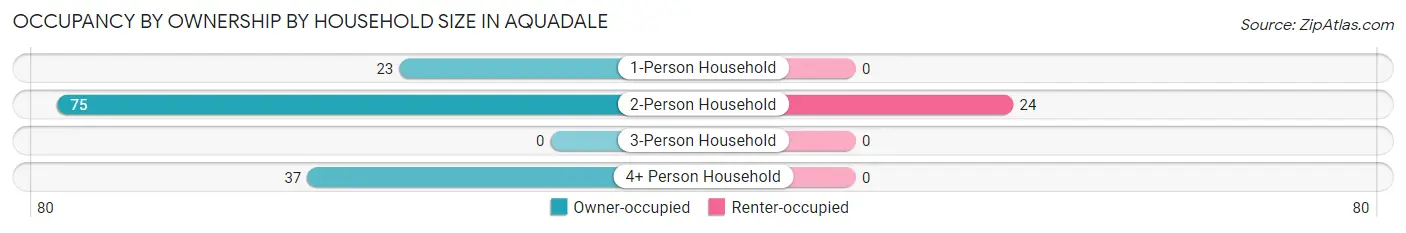
| Household Size | Owner-occupied | Renter-occupied |
| 1-Person Household | 23 (100.0%) | 0 (0.0%) |
| 2-Person Household | 75 (75.8%) | 24 (24.2%) |
| 3-Person Household | 0 (0.0%) | 0 (0.0%) |
| 4+ Person Household | 37 (100.0%) | 0 (0.0%) |
| Total Housing Units | 135 (84.9%) | 24 (15.1%) |
Occupancy by Educational Attainment in Aquadale
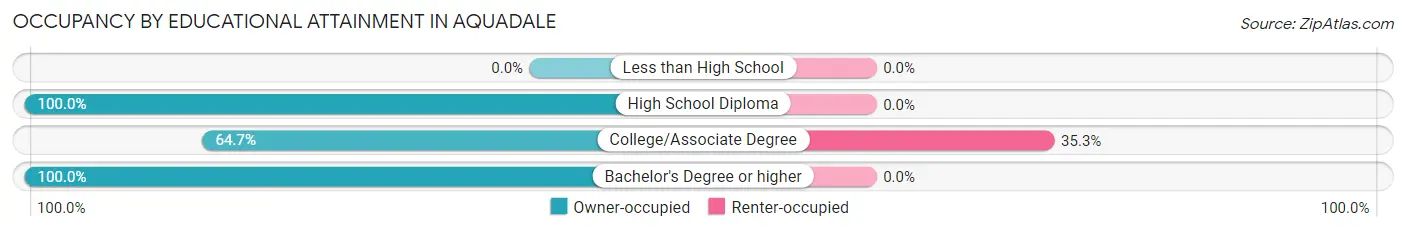
| Household Size | Owner-occupied | Renter-occupied |
| Less than High School | 0 (0.0%) | 0 (0.0%) |
| High School Diploma | 82 (100.0%) | 0 (0.0%) |
| College/Associate Degree | 44 (64.7%) | 24 (35.3%) |
| Bachelor's Degree or higher | 9 (100.0%) | 0 (0.0%) |
Occupancy by Age of Householder in Aquadale
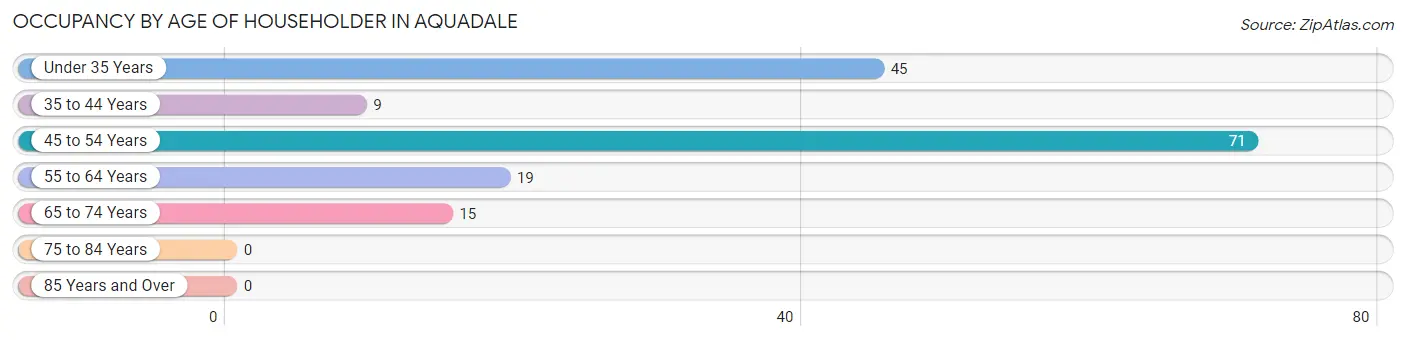
| Age Bracket | # Households | % Households |
| Under 35 Years | 45 | 28.3% |
| 35 to 44 Years | 9 | 5.7% |
| 45 to 54 Years | 71 | 44.7% |
| 55 to 64 Years | 19 | 11.9% |
| 65 to 74 Years | 15 | 9.4% |
| 75 to 84 Years | 0 | 0.0% |
| 85 Years and Over | 0 | 0.0% |
| Total | 159 | 100.0% |
Housing Finances in Aquadale
Median Income by Occupancy in Aquadale
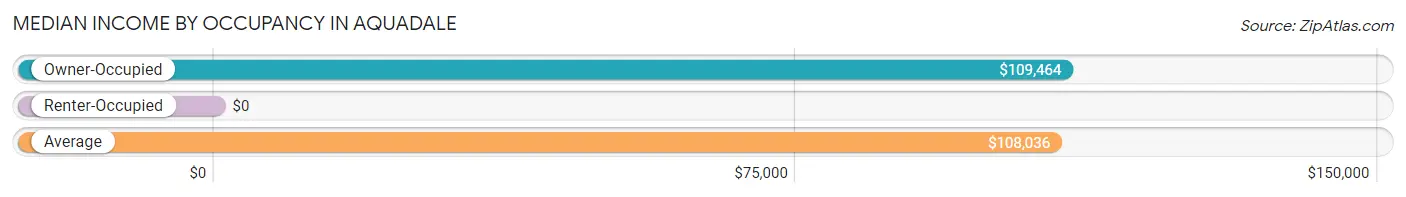
| Occupancy Type | # Households | Median Income |
| Owner-Occupied | 135 (84.9%) | $109,464 |
| Renter-Occupied | 24 (15.1%) | $0 |
| Average | 159 (100.0%) | $108,036 |
Occupancy by Householder Income Bracket in Aquadale
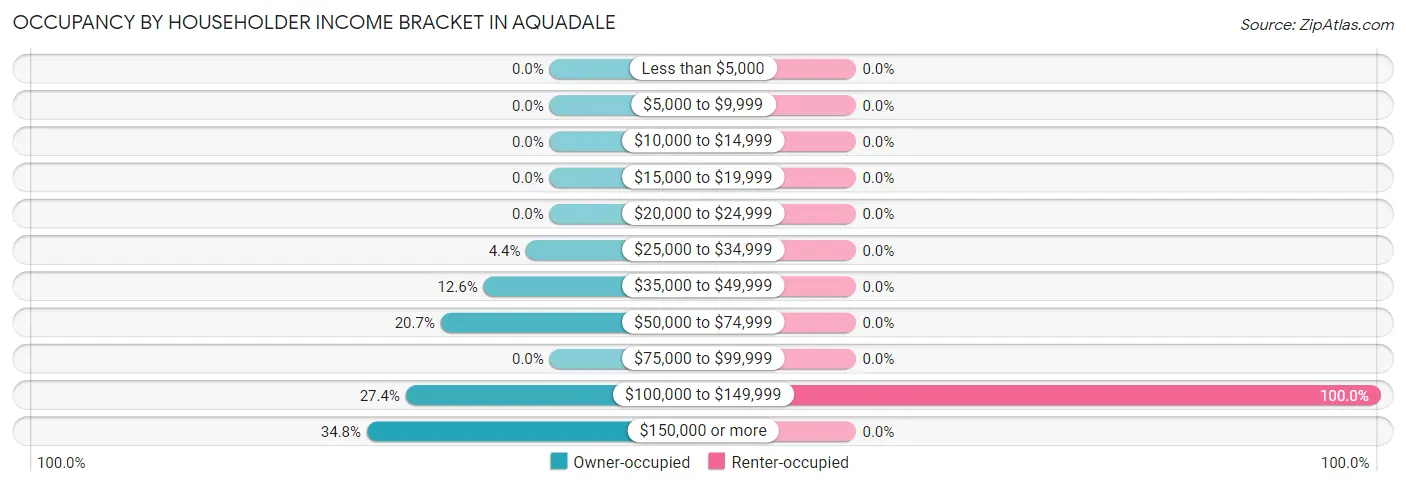
| Income Bracket | Owner-occupied | Renter-occupied |
| Less than $5,000 | 0 (0.0%) | 0 (0.0%) |
| $5,000 to $9,999 | 0 (0.0%) | 0 (0.0%) |
| $10,000 to $14,999 | 0 (0.0%) | 0 (0.0%) |
| $15,000 to $19,999 | 0 (0.0%) | 0 (0.0%) |
| $20,000 to $24,999 | 0 (0.0%) | 0 (0.0%) |
| $25,000 to $34,999 | 6 (4.4%) | 0 (0.0%) |
| $35,000 to $49,999 | 17 (12.6%) | 0 (0.0%) |
| $50,000 to $74,999 | 28 (20.7%) | 0 (0.0%) |
| $75,000 to $99,999 | 0 (0.0%) | 0 (0.0%) |
| $100,000 to $149,999 | 37 (27.4%) | 24 (100.0%) |
| $150,000 or more | 47 (34.8%) | 0 (0.0%) |
| Total | 135 (100.0%) | 24 (100.0%) |
Monthly Housing Cost Tiers in Aquadale
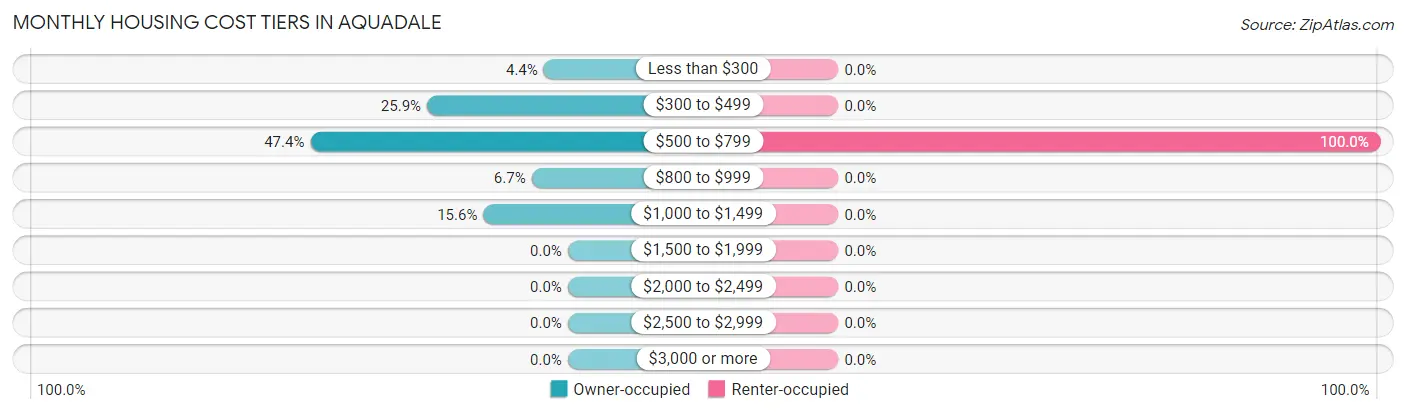
| Monthly Cost | Owner-occupied | Renter-occupied |
| Less than $300 | 6 (4.4%) | 0 (0.0%) |
| $300 to $499 | 35 (25.9%) | 0 (0.0%) |
| $500 to $799 | 64 (47.4%) | 24 (100.0%) |
| $800 to $999 | 9 (6.7%) | 0 (0.0%) |
| $1,000 to $1,499 | 21 (15.6%) | 0 (0.0%) |
| $1,500 to $1,999 | 0 (0.0%) | 0 (0.0%) |
| $2,000 to $2,499 | 0 (0.0%) | 0 (0.0%) |
| $2,500 to $2,999 | 0 (0.0%) | 0 (0.0%) |
| $3,000 or more | 0 (0.0%) | 0 (0.0%) |
| Total | 135 (100.0%) | 24 (100.0%) |
Physical Housing Characteristics in Aquadale
Housing Structures in Aquadale
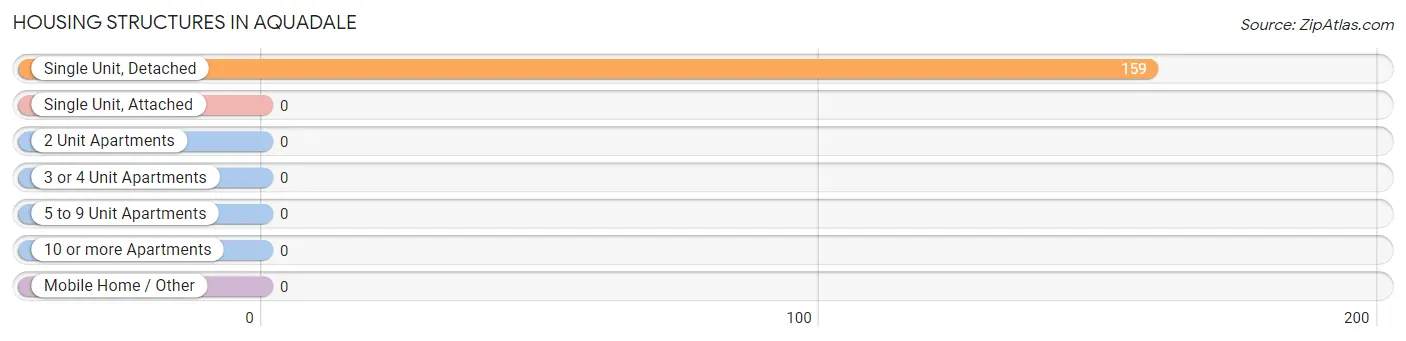
| Structure Type | # Housing Units | % Housing Units |
| Single Unit, Detached | 159 | 100.0% |
| Single Unit, Attached | 0 | 0.0% |
| 2 Unit Apartments | 0 | 0.0% |
| 3 or 4 Unit Apartments | 0 | 0.0% |
| 5 to 9 Unit Apartments | 0 | 0.0% |
| 10 or more Apartments | 0 | 0.0% |
| Mobile Home / Other | 0 | 0.0% |
| Total | 159 | 100.0% |
Housing Structures by Occupancy in Aquadale
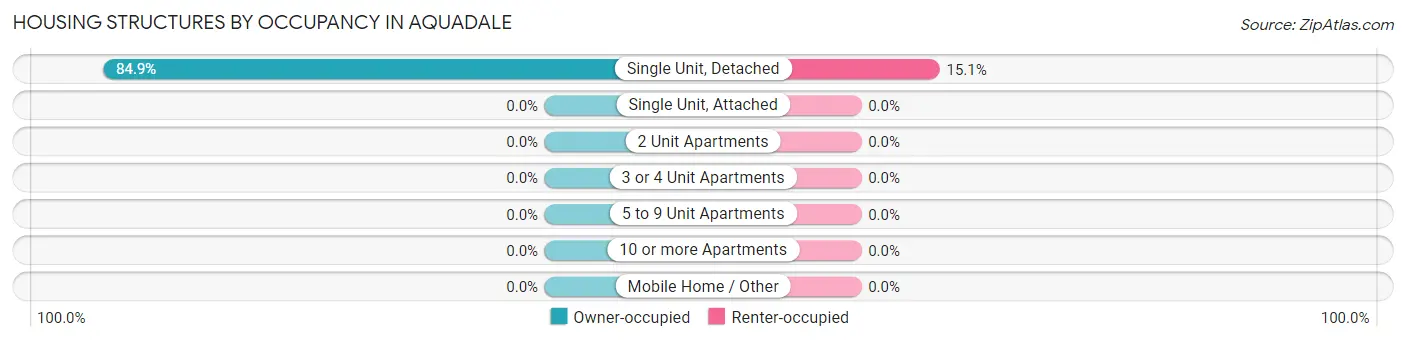
| Structure Type | Owner-occupied | Renter-occupied |
| Single Unit, Detached | 135 (84.9%) | 24 (15.1%) |
| Single Unit, Attached | 0 (0.0%) | 0 (0.0%) |
| 2 Unit Apartments | 0 (0.0%) | 0 (0.0%) |
| 3 or 4 Unit Apartments | 0 (0.0%) | 0 (0.0%) |
| 5 to 9 Unit Apartments | 0 (0.0%) | 0 (0.0%) |
| 10 or more Apartments | 0 (0.0%) | 0 (0.0%) |
| Mobile Home / Other | 0 (0.0%) | 0 (0.0%) |
| Total | 135 (84.9%) | 24 (15.1%) |
Housing Structures by Number of Rooms in Aquadale
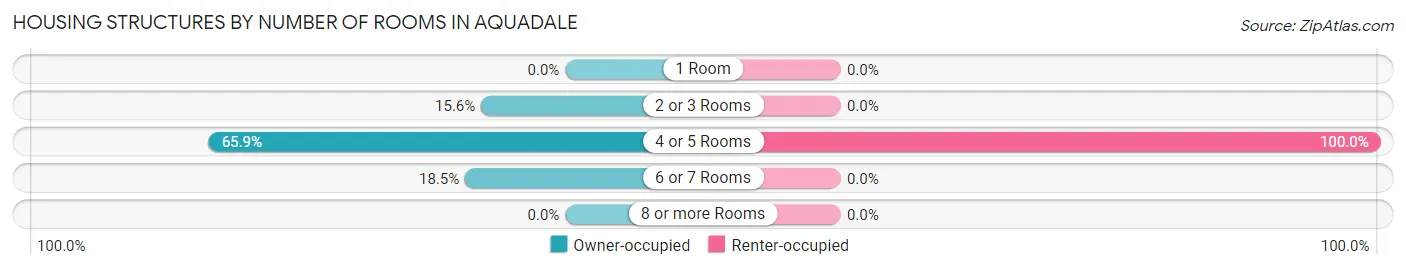
| Number of Rooms | Owner-occupied | Renter-occupied |
| 1 Room | 0 (0.0%) | 0 (0.0%) |
| 2 or 3 Rooms | 21 (15.6%) | 0 (0.0%) |
| 4 or 5 Rooms | 89 (65.9%) | 24 (100.0%) |
| 6 or 7 Rooms | 25 (18.5%) | 0 (0.0%) |
| 8 or more Rooms | 0 (0.0%) | 0 (0.0%) |
| Total | 135 (100.0%) | 24 (100.0%) |
Housing Structure by Heating Type in Aquadale
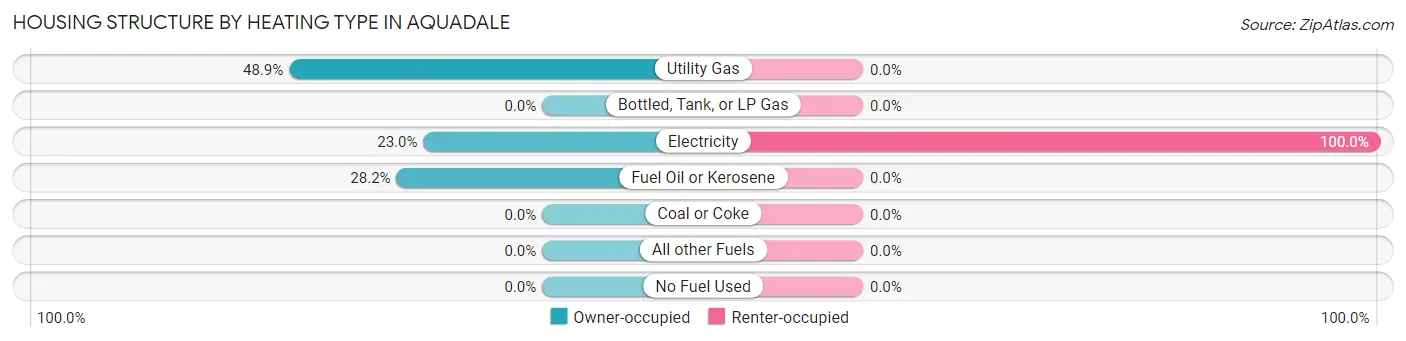
| Heating Type | Owner-occupied | Renter-occupied |
| Utility Gas | 66 (48.9%) | 0 (0.0%) |
| Bottled, Tank, or LP Gas | 0 (0.0%) | 0 (0.0%) |
| Electricity | 31 (23.0%) | 24 (100.0%) |
| Fuel Oil or Kerosene | 38 (28.1%) | 0 (0.0%) |
| Coal or Coke | 0 (0.0%) | 0 (0.0%) |
| All other Fuels | 0 (0.0%) | 0 (0.0%) |
| No Fuel Used | 0 (0.0%) | 0 (0.0%) |
| Total | 135 (100.0%) | 24 (100.0%) |
Household Vehicle Usage in Aquadale
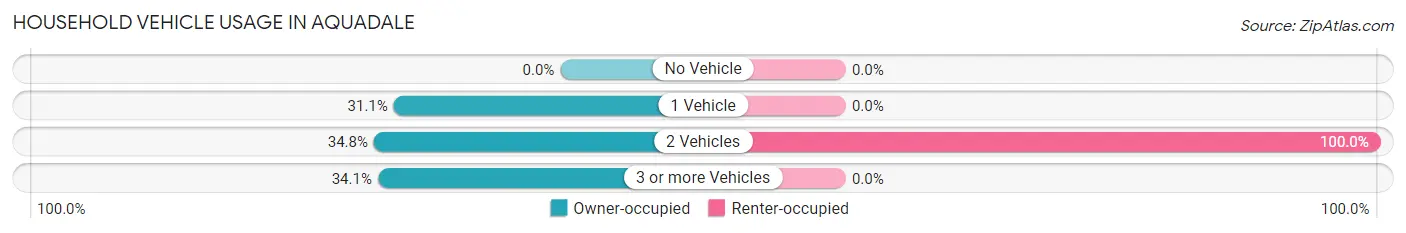
| Vehicles per Household | Owner-occupied | Renter-occupied |
| No Vehicle | 0 (0.0%) | 0 (0.0%) |
| 1 Vehicle | 42 (31.1%) | 0 (0.0%) |
| 2 Vehicles | 47 (34.8%) | 24 (100.0%) |
| 3 or more Vehicles | 46 (34.1%) | 0 (0.0%) |
| Total | 135 (100.0%) | 24 (100.0%) |
Real Estate & Mortgages in Aquadale
Real Estate and Mortgage Overview in Aquadale
| Characteristic | Without Mortgage | With Mortgage |
| Housing Units | 49 | 86 |
| Median Property Value | - | - |
| Median Household Income | - | - |
| Monthly Housing Costs | $413 | $0 |
| Real Estate Taxes | - | - |
Property Value by Mortgage Status in Aquadale
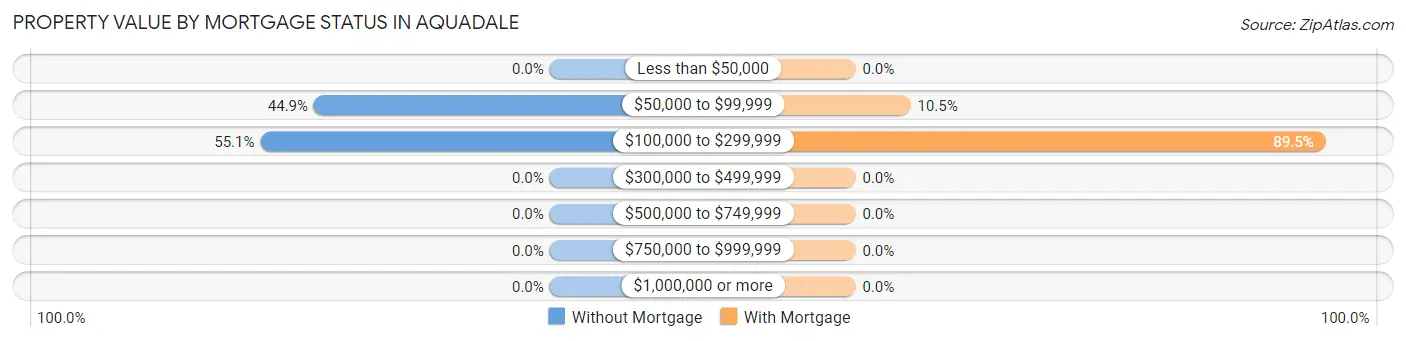
| Property Value | Without Mortgage | With Mortgage |
| Less than $50,000 | 0 (0.0%) | 0 (0.0%) |
| $50,000 to $99,999 | 22 (44.9%) | 9 (10.5%) |
| $100,000 to $299,999 | 27 (55.1%) | 77 (89.5%) |
| $300,000 to $499,999 | 0 (0.0%) | 0 (0.0%) |
| $500,000 to $749,999 | 0 (0.0%) | 0 (0.0%) |
| $750,000 to $999,999 | 0 (0.0%) | 0 (0.0%) |
| $1,000,000 or more | 0 (0.0%) | 0 (0.0%) |
| Total | 49 (100.0%) | 86 (100.0%) |
Household Income by Mortgage Status in Aquadale
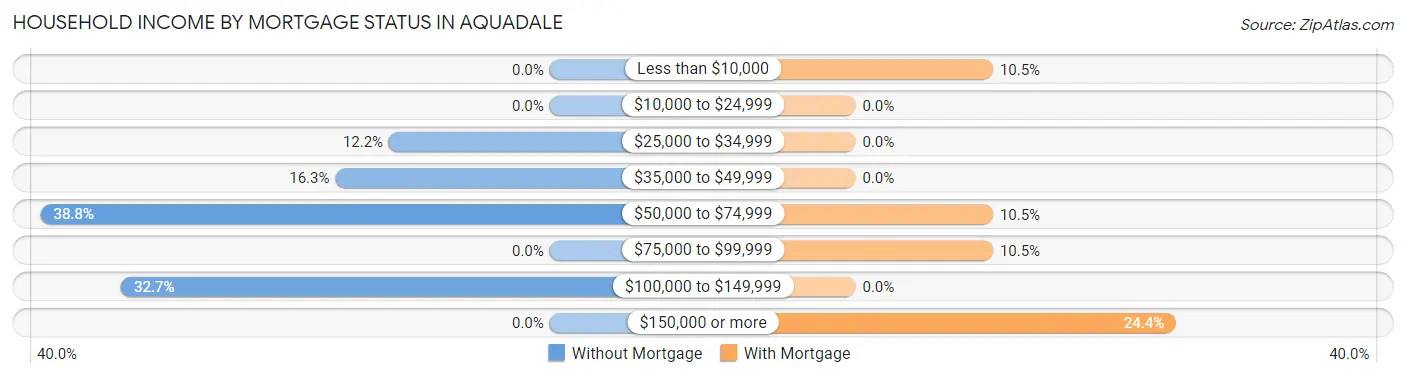
| Household Income | Without Mortgage | With Mortgage |
| Less than $10,000 | 0 (0.0%) | 9 (10.5%) |
| $10,000 to $24,999 | 0 (0.0%) | 0 (0.0%) |
| $25,000 to $34,999 | 6 (12.2%) | 0 (0.0%) |
| $35,000 to $49,999 | 8 (16.3%) | 0 (0.0%) |
| $50,000 to $74,999 | 19 (38.8%) | 9 (10.5%) |
| $75,000 to $99,999 | 0 (0.0%) | 9 (10.5%) |
| $100,000 to $149,999 | 16 (32.7%) | 0 (0.0%) |
| $150,000 or more | 0 (0.0%) | 21 (24.4%) |
| Total | 49 (100.0%) | 86 (100.0%) |
Property Value to Household Income Ratio in Aquadale
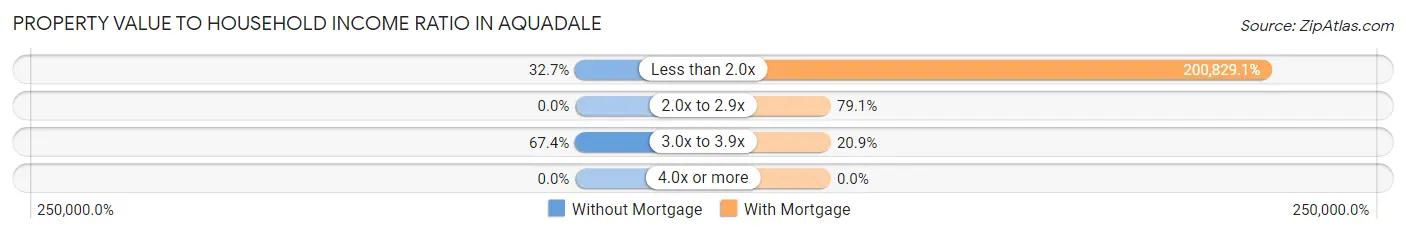
| Value-to-Income Ratio | Without Mortgage | With Mortgage |
| Less than 2.0x | 16 (32.7%) | 172,713 (200,829.1%) |
| 2.0x to 2.9x | 0 (0.0%) | 68 (79.1%) |
| 3.0x to 3.9x | 33 (67.3%) | 18 (20.9%) |
| 4.0x or more | 0 (0.0%) | 0 (0.0%) |
| Total | 49 (100.0%) | 86 (100.0%) |
Real Estate Taxes by Mortgage Status in Aquadale
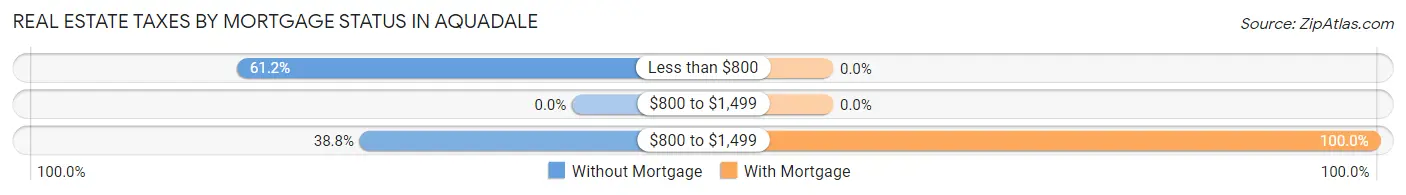
| Property Taxes | Without Mortgage | With Mortgage |
| Less than $800 | 30 (61.2%) | 0 (0.0%) |
| $800 to $1,499 | 0 (0.0%) | 0 (0.0%) |
| $800 to $1,499 | 19 (38.8%) | 86 (100.0%) |
| Total | 49 (100.0%) | 86 (100.0%) |
Health & Disability in Aquadale
Health Insurance Coverage by Age in Aquadale
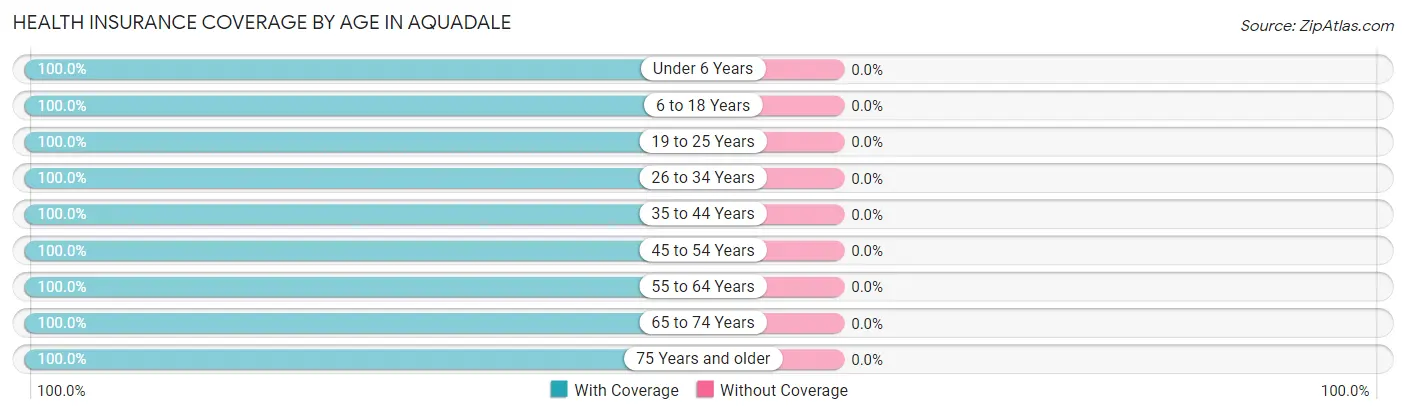
| Age Bracket | With Coverage | Without Coverage |
| Under 6 Years | 20 (100.0%) | 0 (0.0%) |
| 6 to 18 Years | 15 (100.0%) | 0 (0.0%) |
| 19 to 25 Years | 46 (100.0%) | 0 (0.0%) |
| 26 to 34 Years | 84 (100.0%) | 0 (0.0%) |
| 35 to 44 Years | 9 (100.0%) | 0 (0.0%) |
| 45 to 54 Years | 156 (100.0%) | 0 (0.0%) |
| 55 to 64 Years | 19 (100.0%) | 0 (0.0%) |
| 65 to 74 Years | 24 (100.0%) | 0 (0.0%) |
| 75 Years and older | 36 (100.0%) | 0 (0.0%) |
| Total | 409 (100.0%) | 0 (0.0%) |
Health Insurance Coverage by Citizenship Status in Aquadale
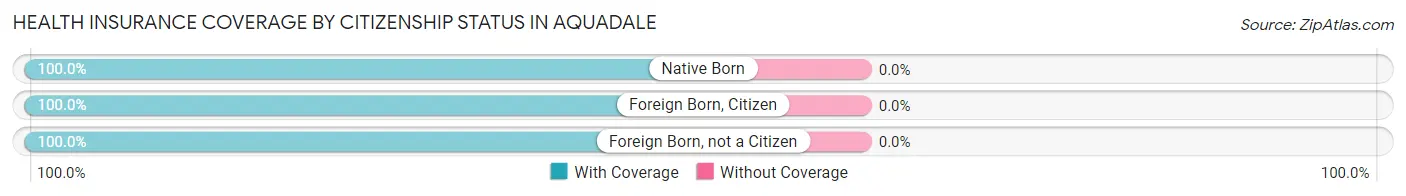
| Citizenship Status | With Coverage | Without Coverage |
| Native Born | 20 (100.0%) | 0 (0.0%) |
| Foreign Born, Citizen | 15 (100.0%) | 0 (0.0%) |
| Foreign Born, not a Citizen | 46 (100.0%) | 0 (0.0%) |
Health Insurance Coverage by Household Income in Aquadale
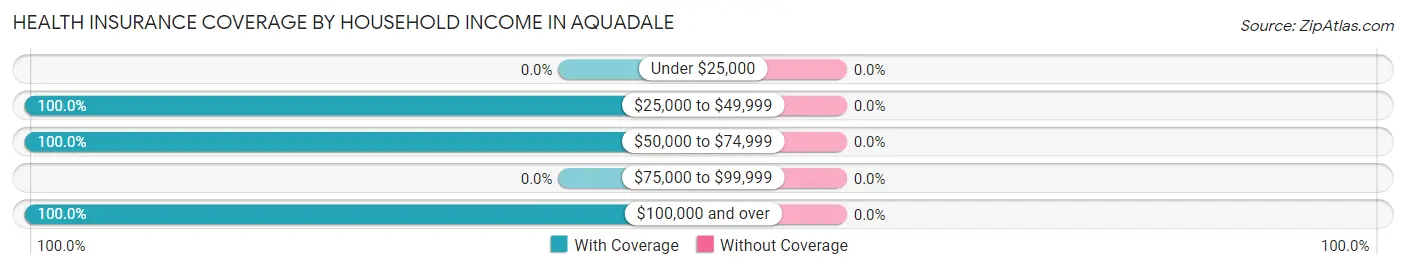
| Household Income | With Coverage | Without Coverage |
| Under $25,000 | 0 (0.0%) | 0 (0.0%) |
| $25,000 to $49,999 | 32 (100.0%) | 0 (0.0%) |
| $50,000 to $74,999 | 45 (100.0%) | 0 (0.0%) |
| $75,000 to $99,999 | 0 (0.0%) | 0 (0.0%) |
| $100,000 and over | 332 (100.0%) | 0 (0.0%) |
Public vs Private Health Insurance Coverage by Age in Aquadale
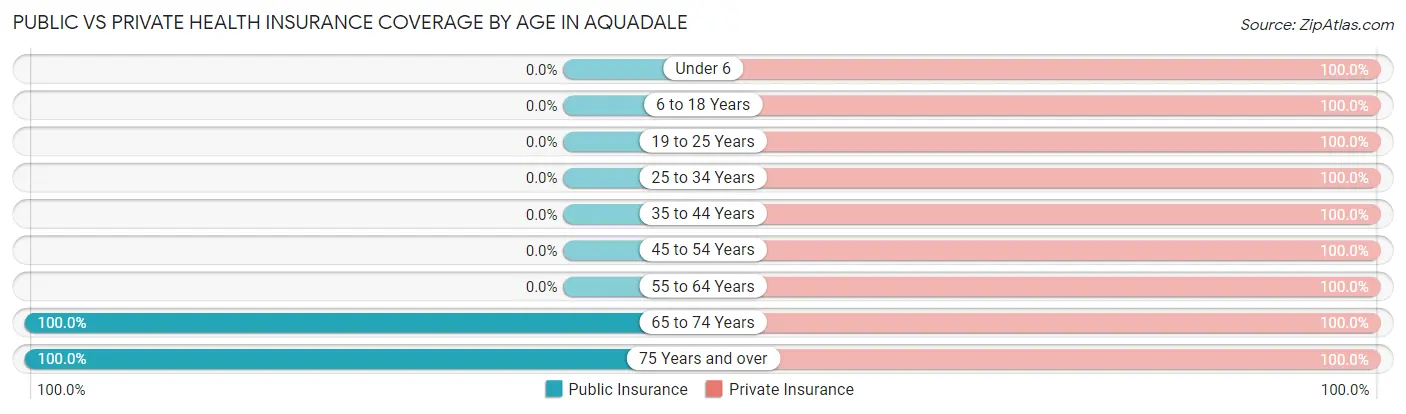
| Age Bracket | Public Insurance | Private Insurance |
| Under 6 | 0 (0.0%) | 20 (100.0%) |
| 6 to 18 Years | 0 (0.0%) | 15 (100.0%) |
| 19 to 25 Years | 0 (0.0%) | 46 (100.0%) |
| 25 to 34 Years | 0 (0.0%) | 84 (100.0%) |
| 35 to 44 Years | 0 (0.0%) | 9 (100.0%) |
| 45 to 54 Years | 0 (0.0%) | 156 (100.0%) |
| 55 to 64 Years | 0 (0.0%) | 19 (100.0%) |
| 65 to 74 Years | 24 (100.0%) | 24 (100.0%) |
| 75 Years and over | 36 (100.0%) | 36 (100.0%) |
| Total | 60 (14.7%) | 409 (100.0%) |
Disability Status by Sex by Age in Aquadale
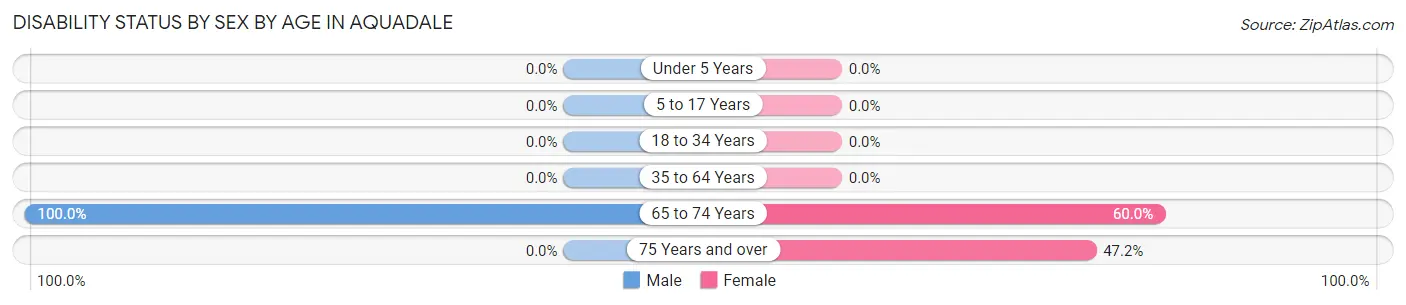
| Age Bracket | Male | Female |
| Under 5 Years | 0 (0.0%) | 0 (0.0%) |
| 5 to 17 Years | 0 (0.0%) | 0 (0.0%) |
| 18 to 34 Years | 0 (0.0%) | 0 (0.0%) |
| 35 to 64 Years | 0 (0.0%) | 0 (0.0%) |
| 65 to 74 Years | 9 (100.0%) | 9 (60.0%) |
| 75 Years and over | 0 (0.0%) | 17 (47.2%) |
Disability Class by Sex by Age in Aquadale
Disability Class: Hearing Difficulty
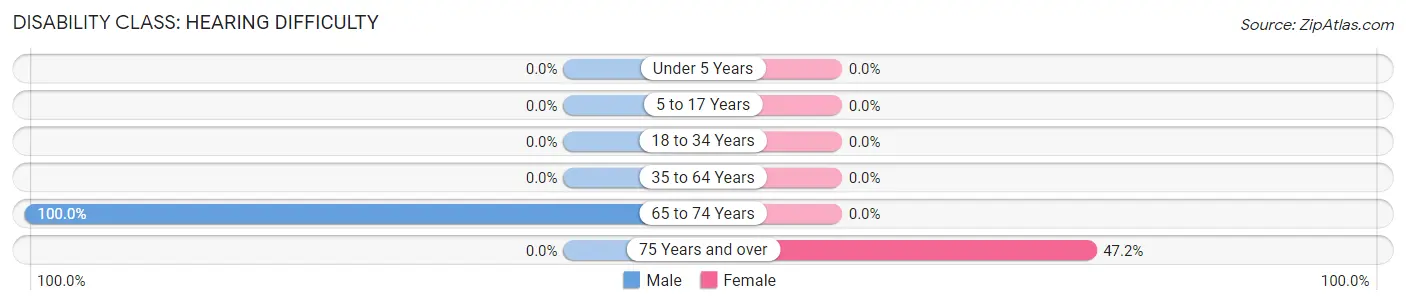
| Age Bracket | Male | Female |
| Under 5 Years | 0 (0.0%) | 0 (0.0%) |
| 5 to 17 Years | 0 (0.0%) | 0 (0.0%) |
| 18 to 34 Years | 0 (0.0%) | 0 (0.0%) |
| 35 to 64 Years | 0 (0.0%) | 0 (0.0%) |
| 65 to 74 Years | 9 (100.0%) | 0 (0.0%) |
| 75 Years and over | 0 (0.0%) | 17 (47.2%) |
Disability Class: Vision Difficulty
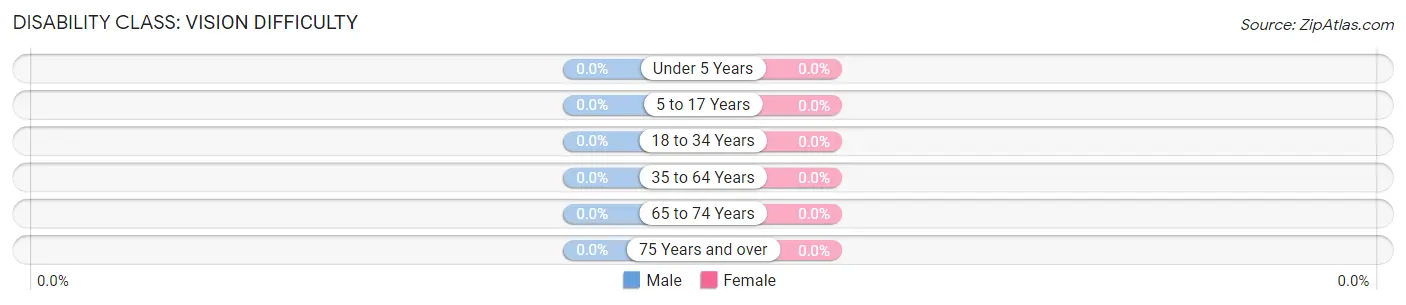
| Age Bracket | Male | Female |
| Under 5 Years | 0 (0.0%) | 0 (0.0%) |
| 5 to 17 Years | 0 (0.0%) | 0 (0.0%) |
| 18 to 34 Years | 0 (0.0%) | 0 (0.0%) |
| 35 to 64 Years | 0 (0.0%) | 0 (0.0%) |
| 65 to 74 Years | 0 (0.0%) | 0 (0.0%) |
| 75 Years and over | 0 (0.0%) | 0 (0.0%) |
Disability Class: Cognitive Difficulty
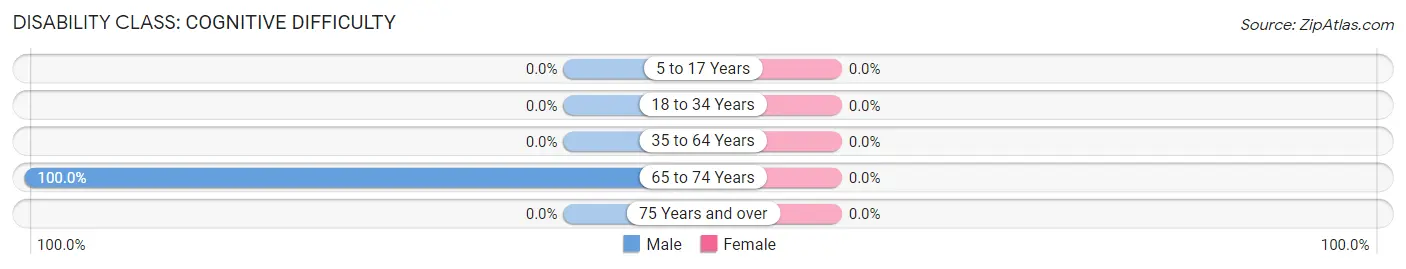
| Age Bracket | Male | Female |
| 5 to 17 Years | 0 (0.0%) | 0 (0.0%) |
| 18 to 34 Years | 0 (0.0%) | 0 (0.0%) |
| 35 to 64 Years | 0 (0.0%) | 0 (0.0%) |
| 65 to 74 Years | 9 (100.0%) | 0 (0.0%) |
| 75 Years and over | 0 (0.0%) | 0 (0.0%) |
Disability Class: Ambulatory Difficulty
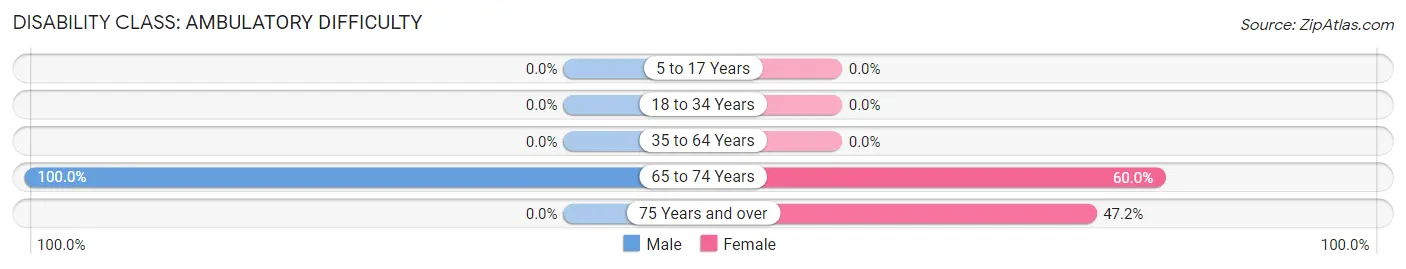
| Age Bracket | Male | Female |
| 5 to 17 Years | 0 (0.0%) | 0 (0.0%) |
| 18 to 34 Years | 0 (0.0%) | 0 (0.0%) |
| 35 to 64 Years | 0 (0.0%) | 0 (0.0%) |
| 65 to 74 Years | 9 (100.0%) | 9 (60.0%) |
| 75 Years and over | 0 (0.0%) | 17 (47.2%) |
Disability Class: Self-Care Difficulty
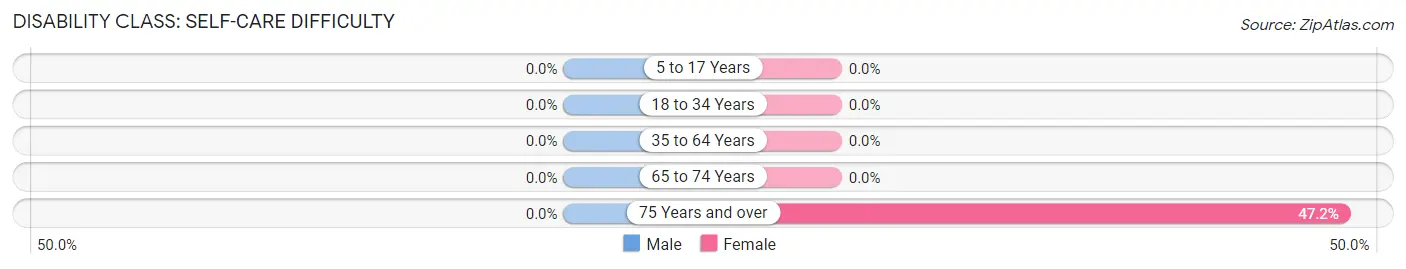
| Age Bracket | Male | Female |
| 5 to 17 Years | 0 (0.0%) | 0 (0.0%) |
| 18 to 34 Years | 0 (0.0%) | 0 (0.0%) |
| 35 to 64 Years | 0 (0.0%) | 0 (0.0%) |
| 65 to 74 Years | 0 (0.0%) | 0 (0.0%) |
| 75 Years and over | 0 (0.0%) | 17 (47.2%) |
Technology Access in Aquadale
Computing Device Access in Aquadale
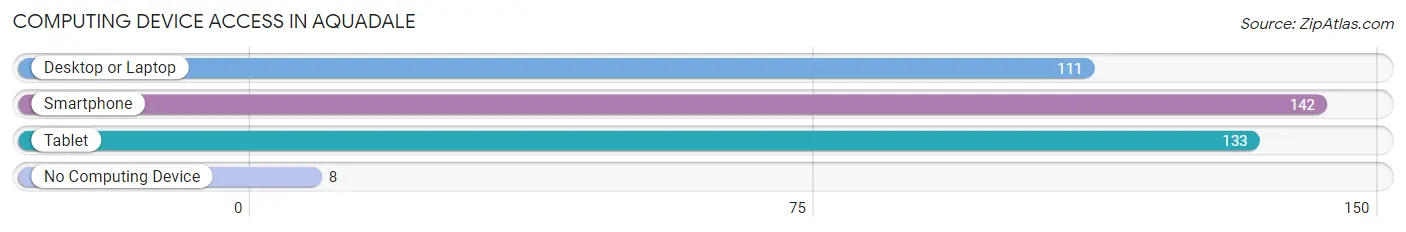
| Device Type | # Households | % Households |
| Desktop or Laptop | 111 | 69.8% |
| Smartphone | 142 | 89.3% |
| Tablet | 133 | 83.7% |
| No Computing Device | 8 | 5.0% |
| Total | 159 | 100.0% |
Internet Access in Aquadale
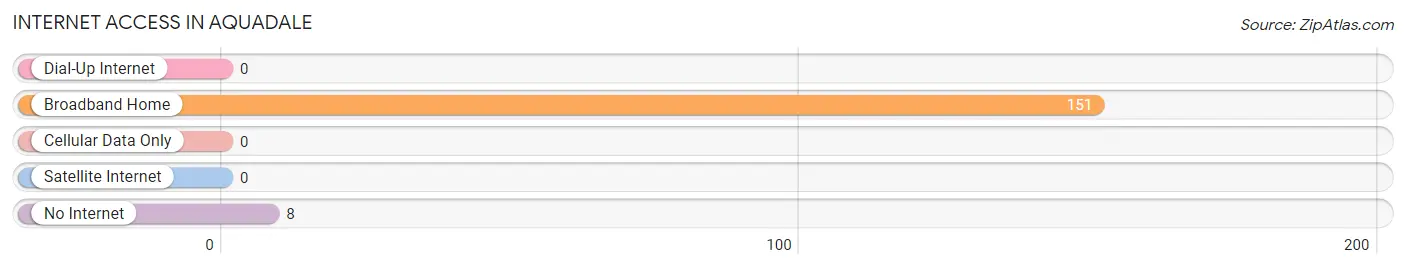
| Internet Type | # Households | % Households |
| Dial-Up Internet | 0 | 0.0% |
| Broadband Home | 151 | 95.0% |
| Cellular Data Only | 0 | 0.0% |
| Satellite Internet | 0 | 0.0% |
| No Internet | 8 | 5.0% |
| Total | 159 | 100.0% |
Aquadale Summary
Aquadale is a small unincorporated community located in Stanly County, North Carolina. It is situated in the foothills of the Uwharrie Mountains, approximately 20 miles northeast of Charlotte. The community is named after the nearby Aquadale Creek, which flows through the area.
History
The area that is now Aquadale was first settled in the late 1700s by German and Scots-Irish immigrants. The first post office in the area was established in 1845, and the community was officially incorporated in 1887. The town was named after the nearby Aquadale Creek, which was named after the Latin word for “water”.
In the late 1800s, Aquadale was a thriving agricultural community, with cotton, corn, and tobacco being the main crops. The town also had a sawmill, gristmill, and a few small stores. In the early 1900s, the town began to decline as the railroad bypassed the area and the population began to move away.
Geography
Aquadale is located in the foothills of the Uwharrie Mountains, approximately 20 miles northeast of Charlotte. The town is situated on the banks of Aquadale Creek, which flows through the area. The terrain is mostly rolling hills, with some flat areas. The climate is mild, with hot summers and cool winters.
Economy
Aquadale’s economy is largely based on agriculture. The main crops are cotton, corn, and tobacco. There are also several small businesses in the area, including a sawmill, gristmill, and a few stores.
Demographics
As of the 2010 census, the population of Aquadale was 1,092. The racial makeup of the town was 94.3% White, 3.2% African American, 0.3% Native American, 0.2% Asian, and 1.9% from other races. The median household income was $37,917, and the median family income was $45,938. The per capita income was $18,945.
Conclusion
Aquadale is a small unincorporated community located in Stanly County, North Carolina. It is situated in the foothills of the Uwharrie Mountains, approximately 20 miles northeast of Charlotte. The town was first settled in the late 1700s and was officially incorporated in 1887. The economy is largely based on agriculture, with cotton, corn, and tobacco being the main crops. As of the 2010 census, the population of Aquadale was 1,092. The median household income was $37,917, and the median family income was $45,938.
Common Questions
What is Per Capita Income in Aquadale?
Per Capita income in Aquadale is $45,317.
What is the Median Family Income in Aquadale?
Median Family Income in Aquadale is $123,594.
What is the Median Household income in Aquadale?
Median Household Income in Aquadale is $108,036.
What is Income or Wage Gap in Aquadale?
Income or Wage Gap in Aquadale is 30.0%.
Women in Aquadale earn 70.0 cents for every dollar earned by a man.
What is Inequality or Gini Index in Aquadale?
Inequality or Gini Index in Aquadale is 0.24.
What is the Total Population of Aquadale?
Total Population of Aquadale is 409.
What is the Total Male Population of Aquadale?
Total Male Population of Aquadale is 171.
What is the Total Female Population of Aquadale?
Total Female Population of Aquadale is 238.
What is the Ratio of Males per 100 Females in Aquadale?
There are 71.85 Males per 100 Females in Aquadale.
What is the Ratio of Females per 100 Males in Aquadale?
There are 139.18 Females per 100 Males in Aquadale.
What is the Median Population Age in Aquadale?
Median Population Age in Aquadale is 49.5 Years.
What is the Average Family Size in Aquadale
Average Family Size in Aquadale is 3.1 People.
What is the Average Household Size in Aquadale
Average Household Size in Aquadale is 2.6 People.
How Large is the Labor Force in Aquadale?
There are 305 People in the Labor Forcein in Aquadale.
What is the Percentage of People in the Labor Force in Aquadale?
78.4% of People are in the Labor Force in Aquadale.