Myrtle Grove, NC Map & Demographics
Myrtle Grove Map
Myrtle Grove Overview
$46,823
PER CAPITA INCOME
$117,789
AVG FAMILY INCOME
$108,363
AVG HOUSEHOLD INCOME
24.4%
WAGE / INCOME GAP [ % ]
75.6¢/ $1
WAGE / INCOME GAP [ $ ]
0.42
INEQUALITY / GINI INDEX
12,093
TOTAL POPULATION
5,891
MALE POPULATION
6,202
FEMALE POPULATION
94.99
MALES / 100 FEMALES
105.28
FEMALES / 100 MALES
41.9
MEDIAN AGE
3.0
AVG FAMILY SIZE
2.6
AVG HOUSEHOLD SIZE
5,677
LABOR FORCE [ PEOPLE ]
60.7%
PERCENT IN LABOR FORCE
4.3%
UNEMPLOYMENT RATE
Income in Myrtle Grove
Income Overview in Myrtle Grove
Per Capita Income in Myrtle Grove is $46,823, while median incomes of families and households are $117,789 and $108,363 respectively.
| Characteristic | Number | Measure |
| Per Capita Income | 12,093 | $46,823 |
| Median Family Income | 3,412 | $117,789 |
| Mean Family Income | 3,412 | $140,061 |
| Median Household Income | 4,523 | $108,363 |
| Mean Household Income | 4,523 | $123,488 |
| Income Deficit | 3,412 | $0 |
| Wage / Income Gap (%) | 12,093 | 24.38% |
| Wage / Income Gap ($) | 12,093 | 75.62¢ per $1 |
| Gini / Inequality Index | 12,093 | 0.42 |
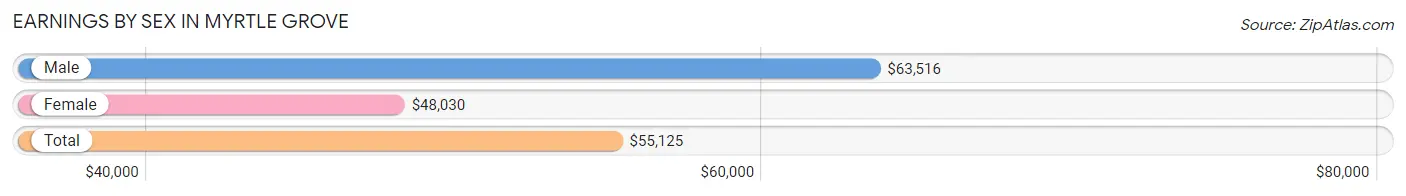
Earnings by Sex in Myrtle Grove
Average Earnings in Myrtle Grove are $55,125, $63,516 for men and $48,030 for women, a difference of 24.4%.
| Sex | Number | Average Earnings |
| Male | 3,170 (52.9%) | $63,516 |
| Female | 2,820 (47.1%) | $48,030 |
| Total | 5,990 (100.0%) | $55,125 |
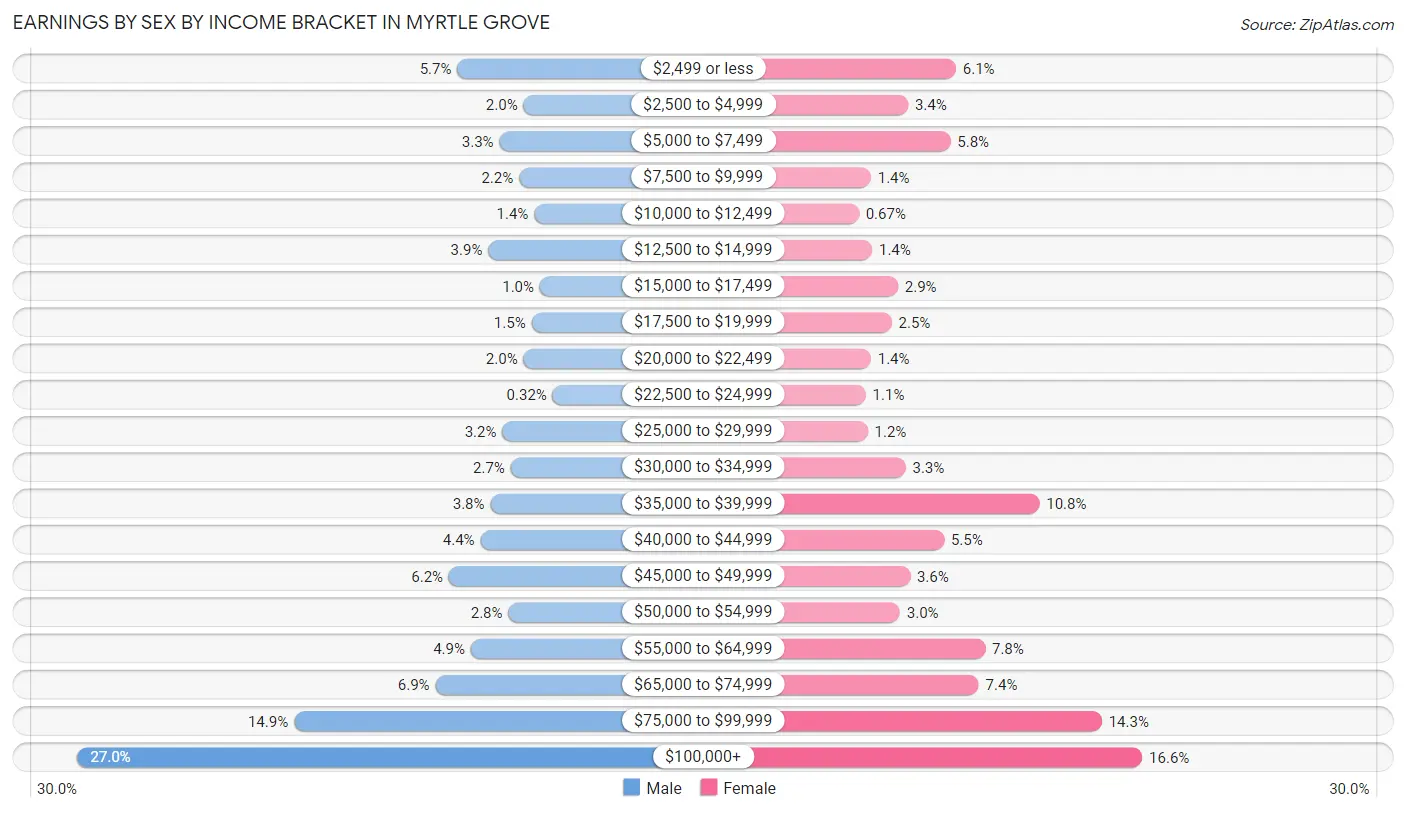
Earnings by Sex by Income Bracket in Myrtle Grove
The most common earnings brackets in Myrtle Grove are $100,000+ for men (857 | 27.0%) and $100,000+ for women (468 | 16.6%).
| Income | Male | Female |
| $2,499 or less | 180 (5.7%) | 173 (6.1%) |
| $2,500 to $4,999 | 62 (2.0%) | 97 (3.4%) |
| $5,000 to $7,499 | 105 (3.3%) | 164 (5.8%) |
| $7,500 to $9,999 | 70 (2.2%) | 38 (1.3%) |
| $10,000 to $12,499 | 43 (1.4%) | 19 (0.7%) |
| $12,500 to $14,999 | 125 (3.9%) | 40 (1.4%) |
| $15,000 to $17,499 | 33 (1.0%) | 81 (2.9%) |
| $17,500 to $19,999 | 48 (1.5%) | 71 (2.5%) |
| $20,000 to $22,499 | 62 (2.0%) | 38 (1.3%) |
| $22,500 to $24,999 | 10 (0.3%) | 30 (1.1%) |
| $25,000 to $29,999 | 100 (3.2%) | 33 (1.2%) |
| $30,000 to $34,999 | 85 (2.7%) | 93 (3.3%) |
| $35,000 to $39,999 | 121 (3.8%) | 305 (10.8%) |
| $40,000 to $44,999 | 139 (4.4%) | 154 (5.5%) |
| $45,000 to $49,999 | 195 (6.1%) | 100 (3.5%) |
| $50,000 to $54,999 | 89 (2.8%) | 84 (3.0%) |
| $55,000 to $64,999 | 156 (4.9%) | 219 (7.8%) |
| $65,000 to $74,999 | 219 (6.9%) | 209 (7.4%) |
| $75,000 to $99,999 | 471 (14.9%) | 404 (14.3%) |
| $100,000+ | 857 (27.0%) | 468 (16.6%) |
| Total | 3,170 (100.0%) | 2,820 (100.0%) |
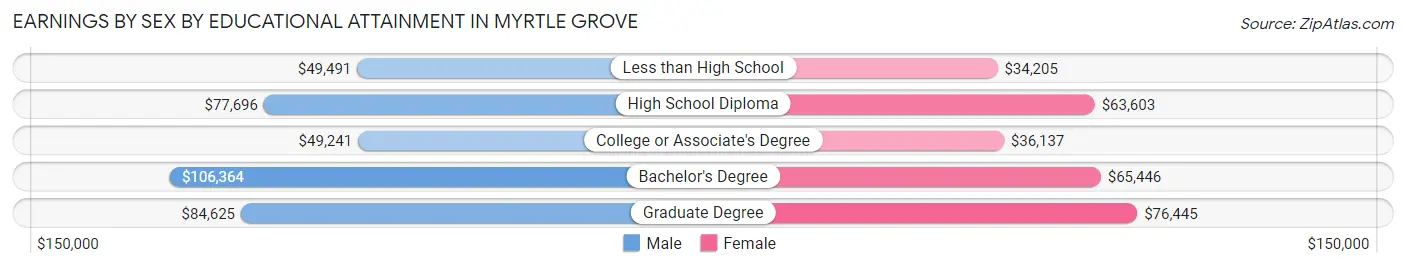
Earnings by Sex by Educational Attainment in Myrtle Grove
Average earnings in Myrtle Grove are $71,916 for men and $54,063 for women, a difference of 24.8%. Men with an educational attainment of bachelor's degree enjoy the highest average annual earnings of $106,364, while those with college or associate's degree education earn the least with $49,241. Women with an educational attainment of graduate degree earn the most with the average annual earnings of $76,445, while those with less than high school education have the smallest earnings of $34,205.
| Educational Attainment | Male Income | Female Income |
| Less than High School | $49,491 | $34,205 |
| High School Diploma | $77,696 | $63,603 |
| College or Associate's Degree | $49,241 | $36,137 |
| Bachelor's Degree | $106,364 | $65,446 |
| Graduate Degree | $84,625 | $76,445 |
| Total | $71,916 | $54,063 |
Family Income in Myrtle Grove
Family Income Brackets in Myrtle Grove
According to the Myrtle Grove family income data, there are 1,109 families falling into the $100,000 to $149,999 income range, which is the most common income bracket and makes up 32.5% of all families.
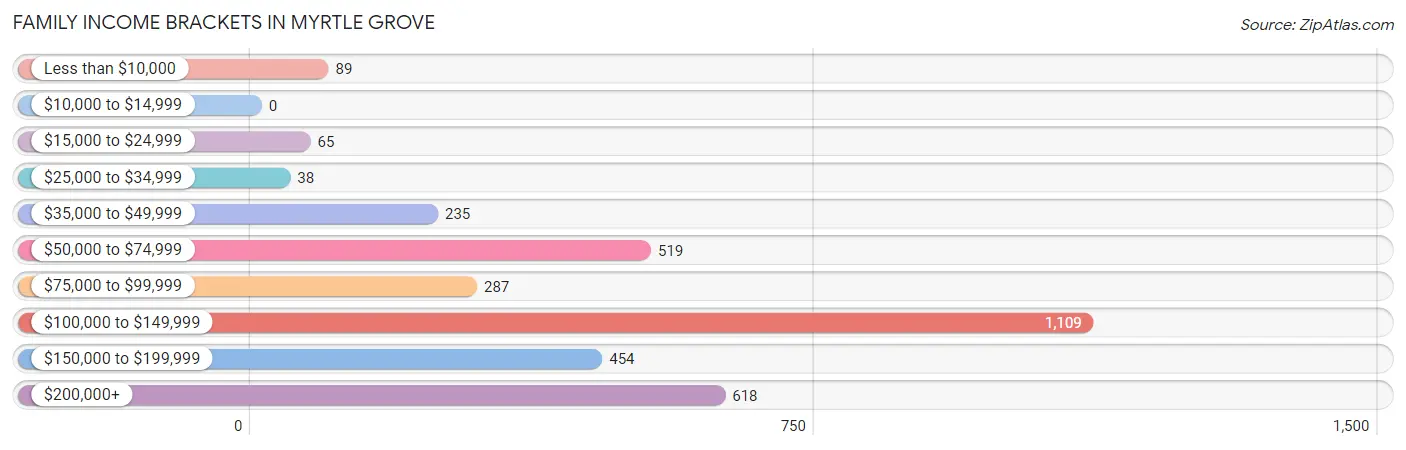
| Income Bracket | # Families | % Families |
| Less than $10,000 | 89 | 2.6% |
| $10,000 to $14,999 | 0 | 0.0% |
| $15,000 to $24,999 | 65 | 1.9% |
| $25,000 to $34,999 | 38 | 1.1% |
| $35,000 to $49,999 | 235 | 6.9% |
| $50,000 to $74,999 | 519 | 15.2% |
| $75,000 to $99,999 | 287 | 8.4% |
| $100,000 to $149,999 | 1,109 | 32.5% |
| $150,000 to $199,999 | 454 | 13.3% |
| $200,000+ | 618 | 18.1% |
Family Income by Famaliy Size in Myrtle Grove
4-person families (663 | 19.4%) account for the highest median family income in Myrtle Grove with $157,292 per family, while 2-person families (1,554 | 45.6%) have the highest median income of $50,676 per family member.
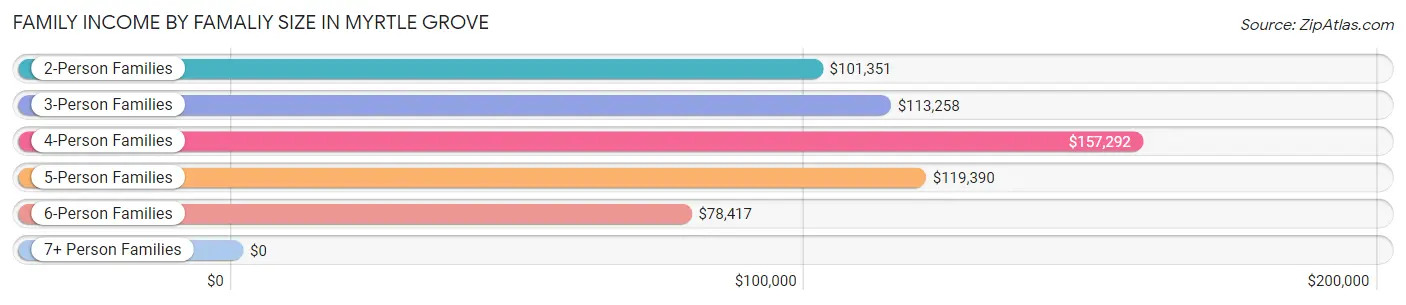
| Income Bracket | # Families | Median Income |
| 2-Person Families | 1,554 (45.6%) | $101,351 |
| 3-Person Families | 838 (24.6%) | $113,258 |
| 4-Person Families | 663 (19.4%) | $157,292 |
| 5-Person Families | 291 (8.5%) | $119,390 |
| 6-Person Families | 57 (1.7%) | $78,417 |
| 7+ Person Families | 9 (0.3%) | $0 |
| Total | 3,412 (100.0%) | $117,789 |
Family Income by Number of Earners in Myrtle Grove
The median family income in Myrtle Grove is $117,789, with families comprising 3+ earners (323) having the highest median family income of $155,982, while families with no earners (697) have the lowest median family income of $64,871, accounting for 9.5% and 20.4% of families, respectively.
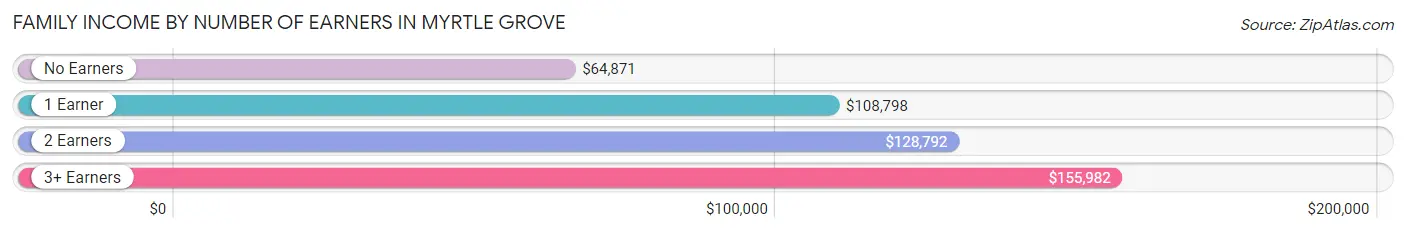
| Number of Earners | # Families | Median Income |
| No Earners | 697 (20.4%) | $64,871 |
| 1 Earner | 893 (26.2%) | $108,798 |
| 2 Earners | 1,499 (43.9%) | $128,792 |
| 3+ Earners | 323 (9.5%) | $155,982 |
| Total | 3,412 (100.0%) | $117,789 |
Household Income in Myrtle Grove
Household Income Brackets in Myrtle Grove
With 1,280 households falling in the category, the $100,000 to $149,999 income range is the most frequent in Myrtle Grove, accounting for 28.3% of all households. In contrast, only 86 households (1.9%) fall into the $25,000 to $34,999 income bracket, making it the least populous group.
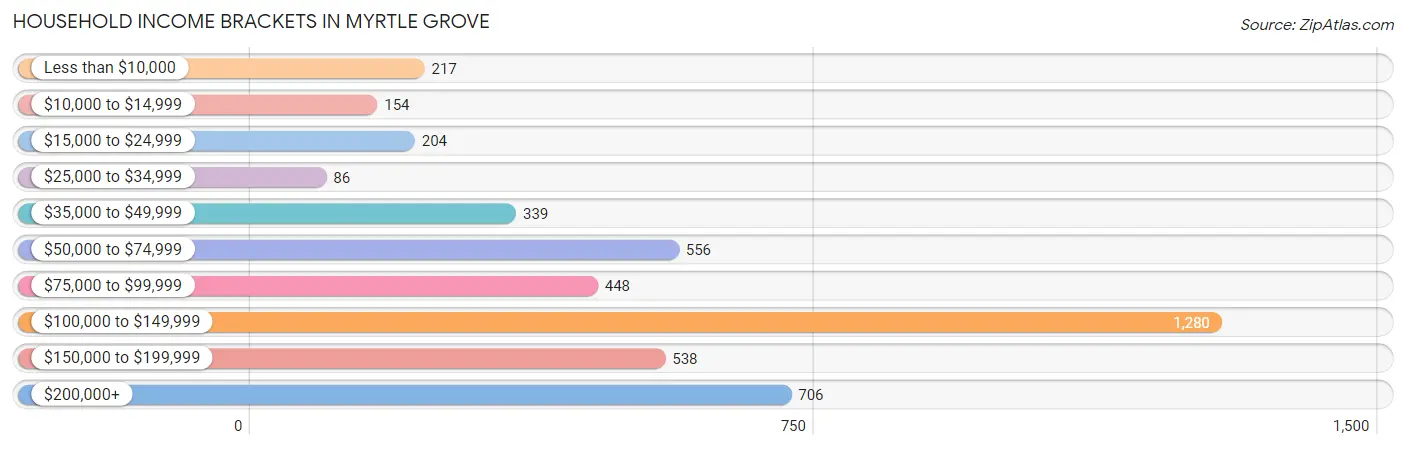
| Income Bracket | # Households | % Households |
| Less than $10,000 | 217 | 4.8% |
| $10,000 to $14,999 | 154 | 3.4% |
| $15,000 to $24,999 | 204 | 4.5% |
| $25,000 to $34,999 | 86 | 1.9% |
| $35,000 to $49,999 | 339 | 7.5% |
| $50,000 to $74,999 | 556 | 12.3% |
| $75,000 to $99,999 | 448 | 9.9% |
| $100,000 to $149,999 | 1,280 | 28.3% |
| $150,000 to $199,999 | 538 | 11.9% |
| $200,000+ | 706 | 15.6% |
Household Income by Householder Age in Myrtle Grove
The median household income in Myrtle Grove is $108,363, with the highest median household income of $123,906 found in the 25 to 44 years age bracket for the primary householder. A total of 1,422 households (31.4%) fall into this category. Meanwhile, the 15 to 24 years age bracket for the primary householder has the lowest median household income of $0, with 63 households (1.4%) in this group.
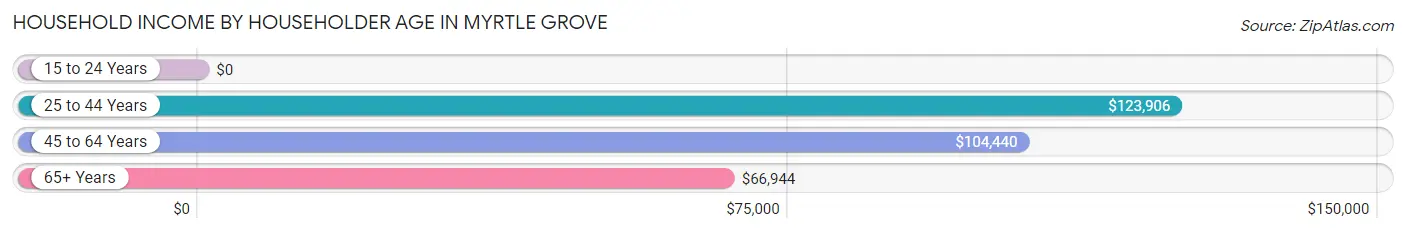
| Income Bracket | # Households | Median Income |
| 15 to 24 Years | 63 (1.4%) | $0 |
| 25 to 44 Years | 1,422 (31.4%) | $123,906 |
| 45 to 64 Years | 1,792 (39.6%) | $104,440 |
| 65+ Years | 1,246 (27.6%) | $66,944 |
| Total | 4,523 (100.0%) | $108,363 |
Poverty in Myrtle Grove
Income Below Poverty by Sex and Age in Myrtle Grove
With 5.9% poverty level for males and 5.8% for females among the residents of Myrtle Grove, 16 and 17 year old males and 18 to 24 year old females are the most vulnerable to poverty, with 43 males (43.9%) and 79 females (41.8%) in their respective age groups living below the poverty level.
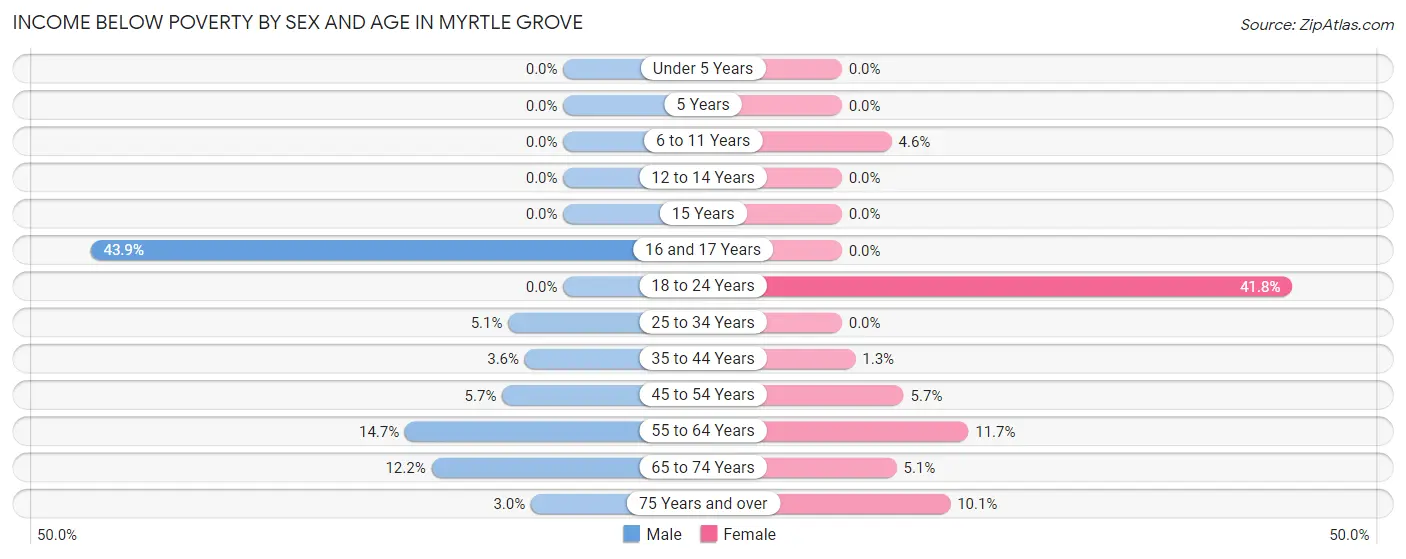
| Age Bracket | Male | Female |
| Under 5 Years | 0 (0.0%) | 0 (0.0%) |
| 5 Years | 0 (0.0%) | 0 (0.0%) |
| 6 to 11 Years | 0 (0.0%) | 24 (4.6%) |
| 12 to 14 Years | 0 (0.0%) | 0 (0.0%) |
| 15 Years | 0 (0.0%) | 0 (0.0%) |
| 16 and 17 Years | 43 (43.9%) | 0 (0.0%) |
| 18 to 24 Years | 0 (0.0%) | 79 (41.8%) |
| 25 to 34 Years | 27 (5.1%) | 0 (0.0%) |
| 35 to 44 Years | 33 (3.6%) | 15 (1.3%) |
| 45 to 54 Years | 47 (5.7%) | 51 (5.7%) |
| 55 to 64 Years | 98 (14.7%) | 119 (11.7%) |
| 65 to 74 Years | 88 (12.2%) | 30 (5.1%) |
| 75 Years and over | 9 (3.0%) | 35 (10.1%) |
| Total | 345 (5.9%) | 353 (5.8%) |
Income Above Poverty by Sex and Age in Myrtle Grove
According to the poverty statistics in Myrtle Grove, males aged under 5 years and females aged under 5 years are the age groups that are most secure financially, with 100.0% of males and 100.0% of females in these age groups living above the poverty line.
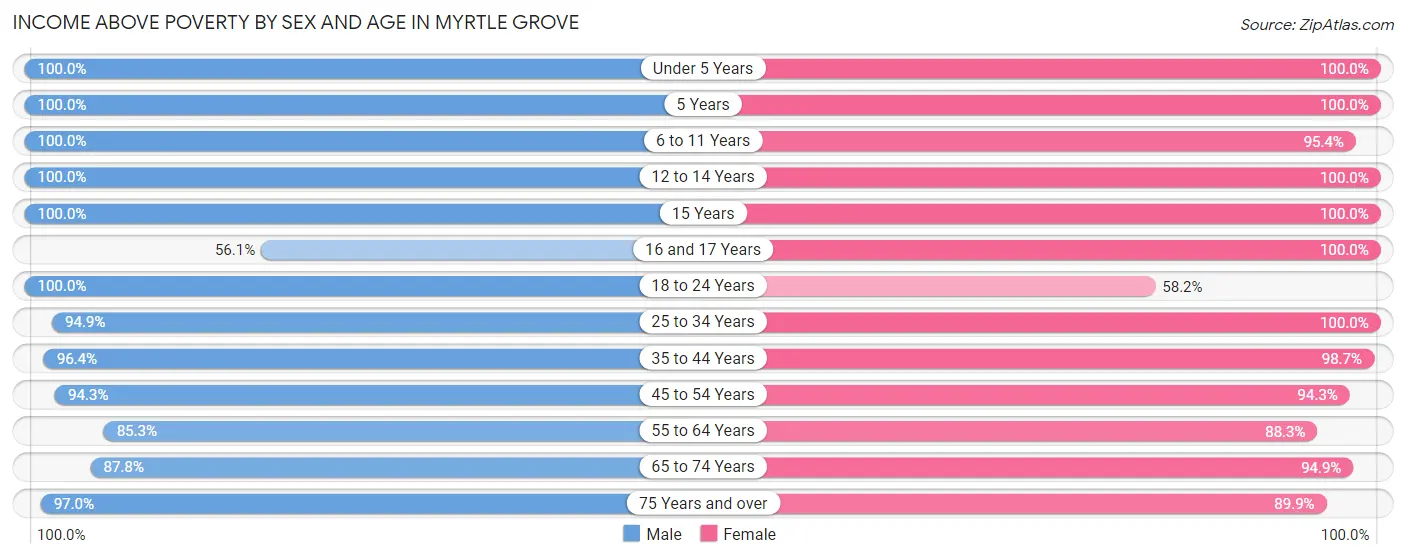
| Age Bracket | Male | Female |
| Under 5 Years | 325 (100.0%) | 341 (100.0%) |
| 5 Years | 15 (100.0%) | 145 (100.0%) |
| 6 to 11 Years | 469 (100.0%) | 495 (95.4%) |
| 12 to 14 Years | 376 (100.0%) | 153 (100.0%) |
| 15 Years | 156 (100.0%) | 185 (100.0%) |
| 16 and 17 Years | 55 (56.1%) | 136 (100.0%) |
| 18 to 24 Years | 433 (100.0%) | 110 (58.2%) |
| 25 to 34 Years | 501 (94.9%) | 373 (100.0%) |
| 35 to 44 Years | 892 (96.4%) | 1,174 (98.7%) |
| 45 to 54 Years | 782 (94.3%) | 838 (94.3%) |
| 55 to 64 Years | 569 (85.3%) | 895 (88.3%) |
| 65 to 74 Years | 631 (87.8%) | 561 (94.9%) |
| 75 Years and over | 291 (97.0%) | 313 (89.9%) |
| Total | 5,495 (94.1%) | 5,719 (94.2%) |
Income Below Poverty Among Married-Couple Families in Myrtle Grove
The poverty statistics for married-couple families in Myrtle Grove show that 2.8% or 85 of the total 2,992 families live below the poverty line. Families with no children have the highest poverty rate of 5.2%, comprising of 85 families. On the other hand, families with 1 or 2 children have the lowest poverty rate of 0.0%, which includes 0 families.
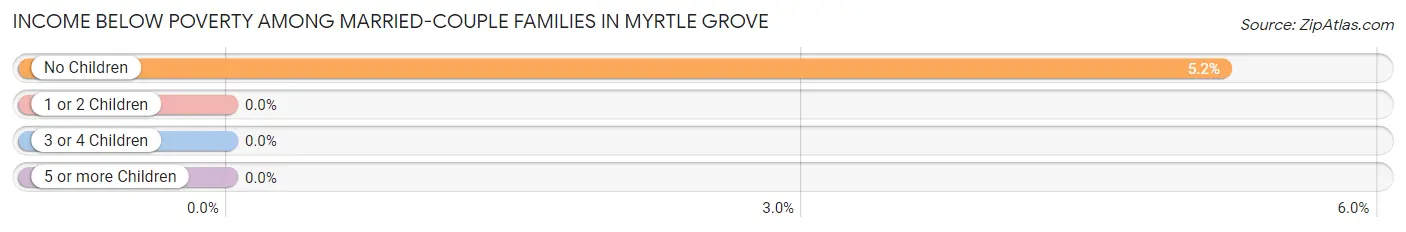
| Children | Above Poverty | Below Poverty |
| No Children | 1,554 (94.8%) | 85 (5.2%) |
| 1 or 2 Children | 1,023 (100.0%) | 0 (0.0%) |
| 3 or 4 Children | 330 (100.0%) | 0 (0.0%) |
| 5 or more Children | 0 (0.0%) | 0 (0.0%) |
| Total | 2,907 (97.2%) | 85 (2.8%) |
Income Below Poverty Among Single-Parent Households in Myrtle Grove
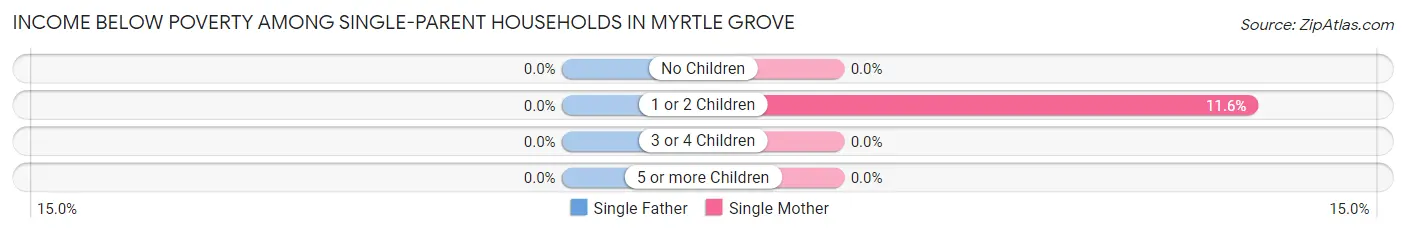
| Children | Single Father | Single Mother |
| No Children | 0 (0.0%) | 0 (0.0%) |
| 1 or 2 Children | 0 (0.0%) | 22 (11.6%) |
| 3 or 4 Children | 0 (0.0%) | 0 (0.0%) |
| 5 or more Children | 0 (0.0%) | 0 (0.0%) |
| Total | 0 (0.0%) | 22 (7.9%) |
Income Below Poverty Among Married-Couple vs Single-Parent Households in Myrtle Grove
The poverty data for Myrtle Grove shows that 85 of the married-couple family households (2.8%) and 22 of the single-parent households (5.2%) are living below the poverty level. Within the married-couple family households, those with no children have the highest poverty rate, with 85 households (5.2%) falling below the poverty line. Among the single-parent households, those with 1 or 2 children have the highest poverty rate, with 22 household (7.7%) living below poverty.
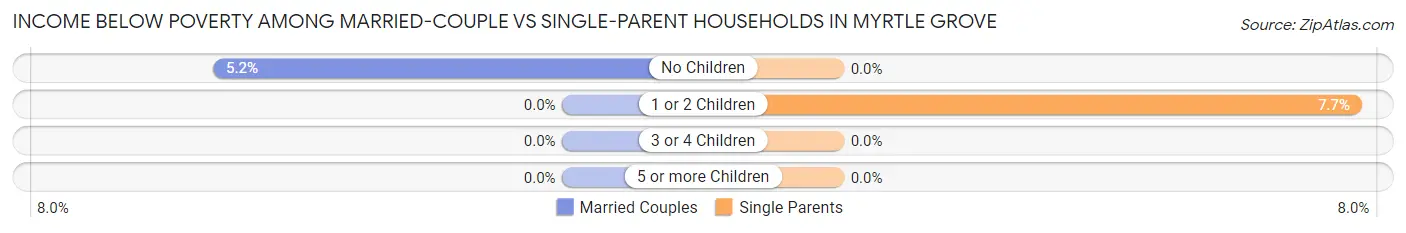
| Children | Married-Couple Families | Single-Parent Households |
| No Children | 85 (5.2%) | 0 (0.0%) |
| 1 or 2 Children | 0 (0.0%) | 22 (7.7%) |
| 3 or 4 Children | 0 (0.0%) | 0 (0.0%) |
| 5 or more Children | 0 (0.0%) | 0 (0.0%) |
| Total | 85 (2.8%) | 22 (5.2%) |
Race in Myrtle Grove
The most populous races in Myrtle Grove are White / Caucasian (11,143 | 92.1%), Two or more Races (488 | 4.0%), and Black / African American (381 | 3.2%).
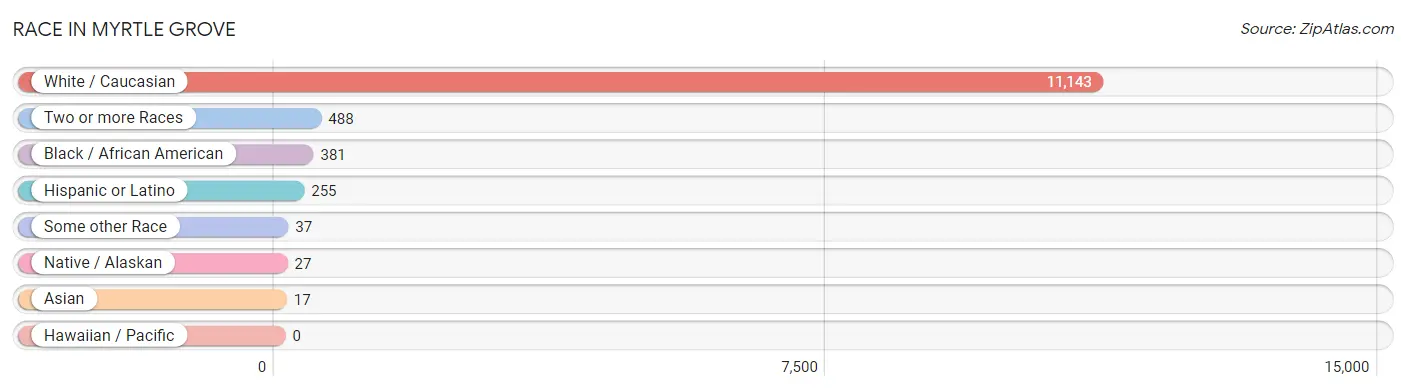
| Race | # Population | % Population |
| Asian | 17 | 0.1% |
| Black / African American | 381 | 3.2% |
| Hawaiian / Pacific | 0 | 0.0% |
| Hispanic or Latino | 255 | 2.1% |
| Native / Alaskan | 27 | 0.2% |
| White / Caucasian | 11,143 | 92.1% |
| Two or more Races | 488 | 4.0% |
| Some other Race | 37 | 0.3% |
| Total | 12,093 | 100.0% |
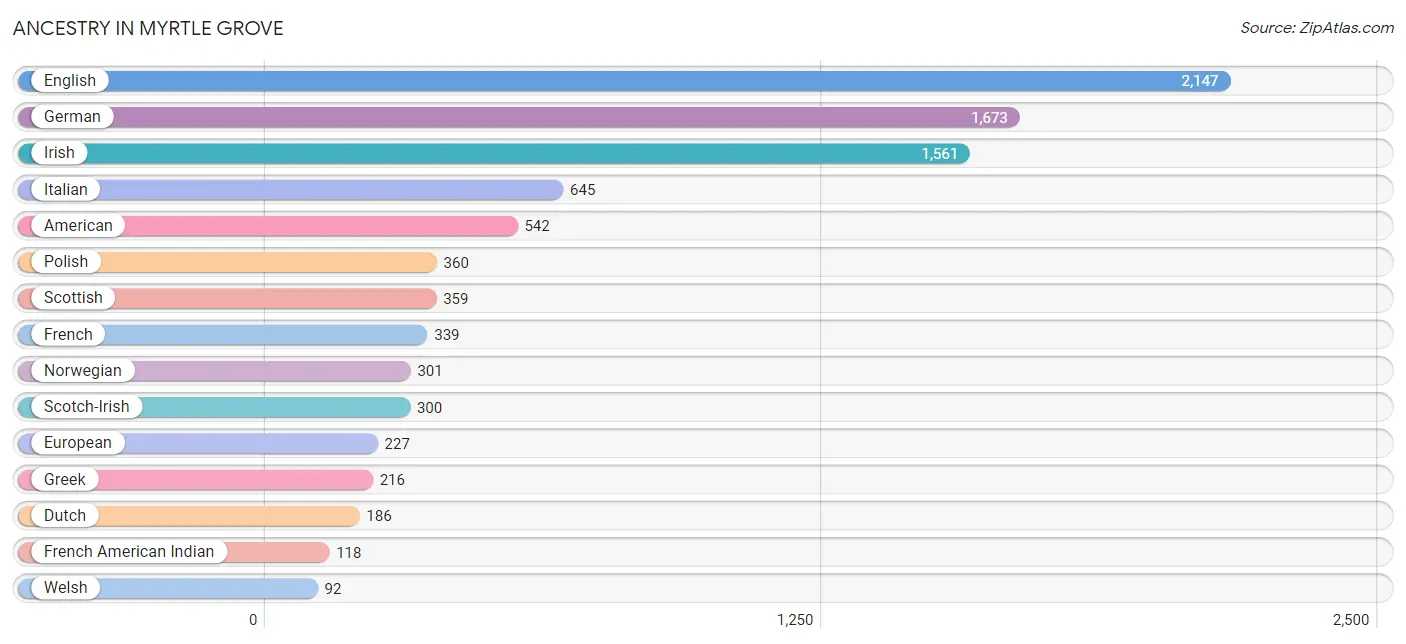
Ancestry in Myrtle Grove
The most populous ancestries reported in Myrtle Grove are English (2,147 | 17.7%), German (1,673 | 13.8%), Irish (1,561 | 12.9%), Italian (645 | 5.3%), and American (542 | 4.5%), together accounting for 54.3% of all Myrtle Grove residents.
| Ancestry | # Population | % Population |
| African | 45 | 0.4% |
| American | 542 | 4.5% |
| Arab | 57 | 0.5% |
| Australian | 14 | 0.1% |
| Austrian | 10 | 0.1% |
| Basque | 4 | 0.0% |
| Belgian | 25 | 0.2% |
| Bhutanese | 33 | 0.3% |
| British | 62 | 0.5% |
| Canadian | 6 | 0.1% |
| Chilean | 52 | 0.4% |
| Choctaw | 3 | 0.0% |
| Croatian | 41 | 0.3% |
| Cuban | 25 | 0.2% |
| Czech | 26 | 0.2% |
| Dominican | 27 | 0.2% |
| Dutch | 186 | 1.5% |
| Eastern European | 9 | 0.1% |
| Egyptian | 17 | 0.1% |
| English | 2,147 | 17.7% |
| European | 227 | 1.9% |
| French | 339 | 2.8% |
| French American Indian | 118 | 1.0% |
| French Canadian | 20 | 0.2% |
| German | 1,673 | 13.8% |
| Greek | 216 | 1.8% |
| Hungarian | 73 | 0.6% |
| Irish | 1,561 | 12.9% |
| Italian | 645 | 5.3% |
| Korean | 28 | 0.2% |
| Latvian | 13 | 0.1% |
| Lebanese | 25 | 0.2% |
| Lumbee | 27 | 0.2% |
| Maltese | 14 | 0.1% |
| Mexican | 41 | 0.3% |
| Northern European | 26 | 0.2% |
| Norwegian | 301 | 2.5% |
| Polish | 360 | 3.0% |
| Portuguese | 6 | 0.1% |
| Puerto Rican | 82 | 0.7% |
| Russian | 26 | 0.2% |
| Scandinavian | 24 | 0.2% |
| Scotch-Irish | 300 | 2.5% |
| Scottish | 359 | 3.0% |
| South American | 52 | 0.4% |
| Spaniard | 28 | 0.2% |
| Sri Lankan | 8 | 0.1% |
| Subsaharan African | 45 | 0.4% |
| Swedish | 63 | 0.5% |
| Swiss | 82 | 0.7% |
| Syrian | 15 | 0.1% |
| Turkish | 68 | 0.6% |
| Ukrainian | 37 | 0.3% |
| Welsh | 92 | 0.8% |
| Yugoslavian | 15 | 0.1% | View All 55 Rows |
Immigrants in Myrtle Grove
The most numerous immigrant groups reported in Myrtle Grove came from Europe (158 | 1.3%), Latin America (76 | 0.6%), Northern Europe (68 | 0.6%), Chile (52 | 0.4%), and South America (52 | 0.4%), together accounting for 3.4% of all Myrtle Grove residents.
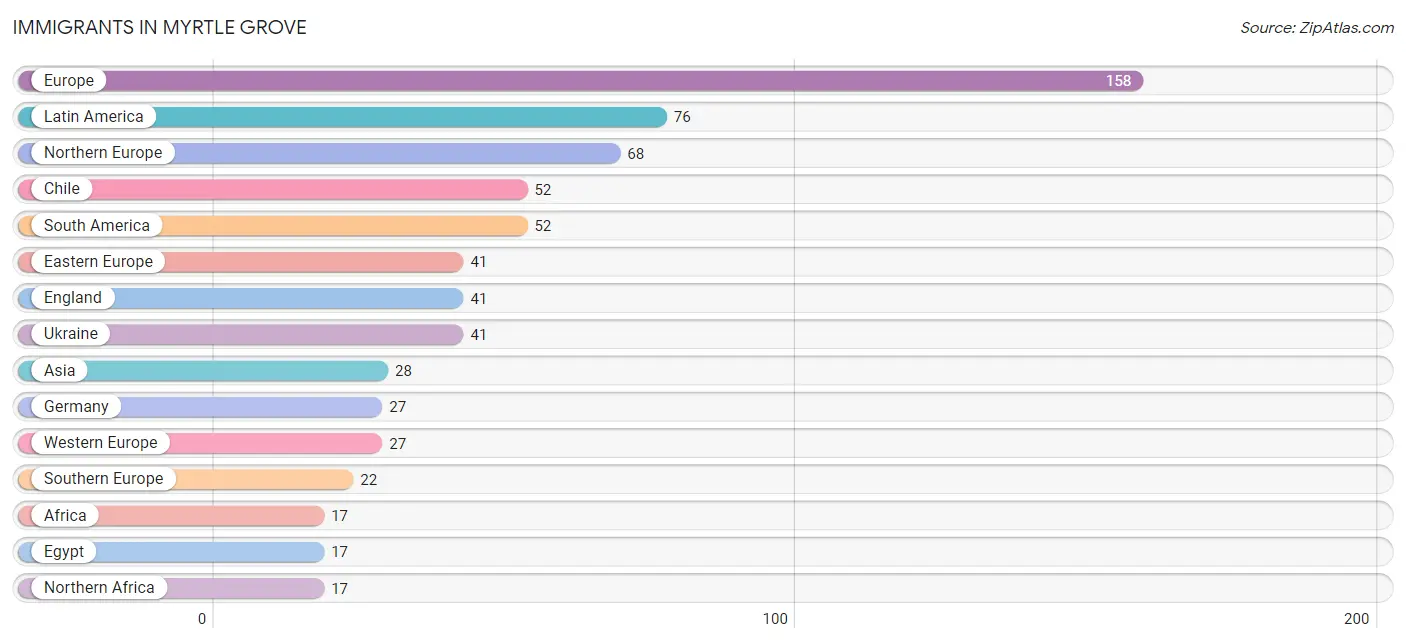
| Immigration Origin | # Population | % Population |
| Africa | 17 | 0.1% |
| Asia | 28 | 0.2% |
| Caribbean | 12 | 0.1% |
| Central America | 12 | 0.1% |
| Chile | 52 | 0.4% |
| Cuba | 12 | 0.1% |
| Eastern Europe | 41 | 0.3% |
| Egypt | 17 | 0.1% |
| England | 41 | 0.3% |
| Europe | 158 | 1.3% |
| Germany | 27 | 0.2% |
| Greece | 8 | 0.1% |
| Latin America | 76 | 0.6% |
| Mexico | 12 | 0.1% |
| Northern Africa | 17 | 0.1% |
| Northern Europe | 68 | 0.6% |
| Philippines | 9 | 0.1% |
| South America | 52 | 0.4% |
| South Central Asia | 11 | 0.1% |
| South Eastern Asia | 17 | 0.1% |
| Southern Europe | 22 | 0.2% |
| Ukraine | 41 | 0.3% |
| Vietnam | 8 | 0.1% |
| Western Europe | 27 | 0.2% | View All 24 Rows |
Sex and Age in Myrtle Grove
Sex and Age in Myrtle Grove
The most populous age groups in Myrtle Grove are 10 to 14 Years (513 | 8.7%) for men and 60 to 64 Years (684 | 11.0%) for women.
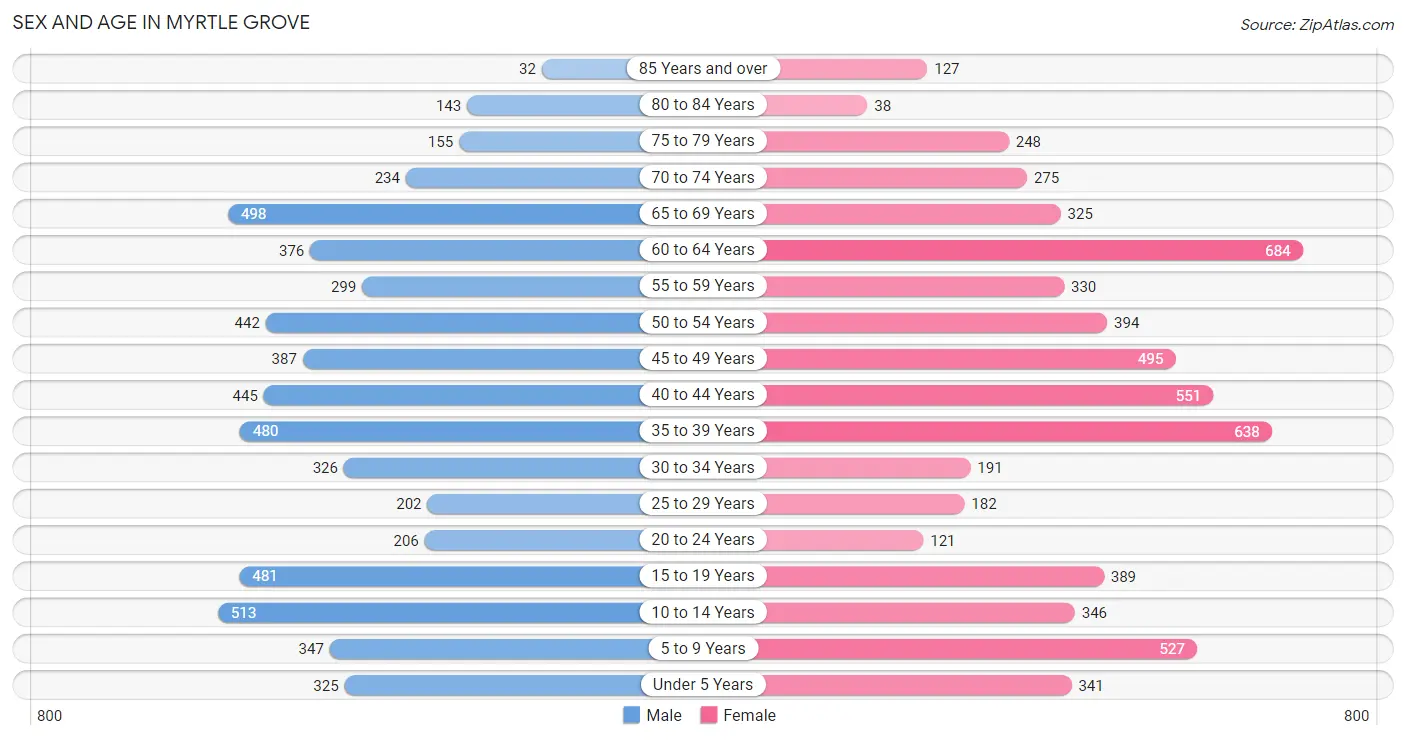
| Age Bracket | Male | Female |
| Under 5 Years | 325 (5.5%) | 341 (5.5%) |
| 5 to 9 Years | 347 (5.9%) | 527 (8.5%) |
| 10 to 14 Years | 513 (8.7%) | 346 (5.6%) |
| 15 to 19 Years | 481 (8.2%) | 389 (6.3%) |
| 20 to 24 Years | 206 (3.5%) | 121 (1.9%) |
| 25 to 29 Years | 202 (3.4%) | 182 (2.9%) |
| 30 to 34 Years | 326 (5.5%) | 191 (3.1%) |
| 35 to 39 Years | 480 (8.2%) | 638 (10.3%) |
| 40 to 44 Years | 445 (7.5%) | 551 (8.9%) |
| 45 to 49 Years | 387 (6.6%) | 495 (8.0%) |
| 50 to 54 Years | 442 (7.5%) | 394 (6.4%) |
| 55 to 59 Years | 299 (5.1%) | 330 (5.3%) |
| 60 to 64 Years | 376 (6.4%) | 684 (11.0%) |
| 65 to 69 Years | 498 (8.5%) | 325 (5.2%) |
| 70 to 74 Years | 234 (4.0%) | 275 (4.4%) |
| 75 to 79 Years | 155 (2.6%) | 248 (4.0%) |
| 80 to 84 Years | 143 (2.4%) | 38 (0.6%) |
| 85 Years and over | 32 (0.5%) | 127 (2.1%) |
| Total | 5,891 (100.0%) | 6,202 (100.0%) |
Families and Households in Myrtle Grove
Median Family Size in Myrtle Grove
The median family size in Myrtle Grove is 3.03 persons per family, with married-couple families (2,992 | 87.7%) accounting for the largest median family size of 3.08 persons per family. On the other hand, single male/father families (142 | 4.2%) represent the smallest median family size with 2.51 persons per family.
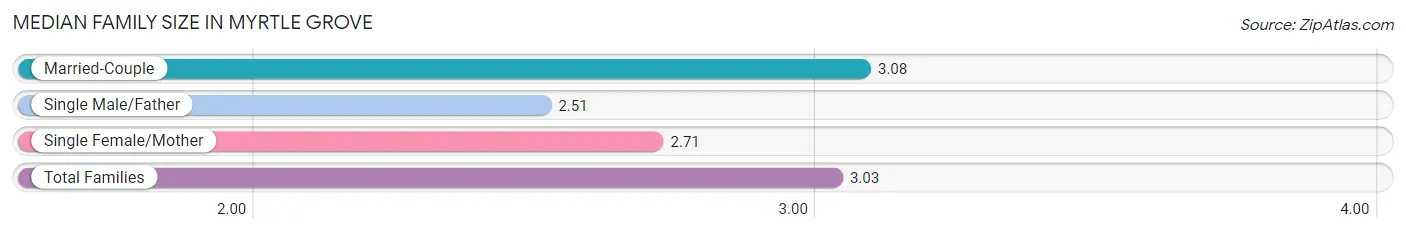
| Family Type | # Families | Family Size |
| Married-Couple | 2,992 (87.7%) | 3.08 |
| Single Male/Father | 142 (4.2%) | 2.51 |
| Single Female/Mother | 278 (8.2%) | 2.71 |
| Total Families | 3,412 (100.0%) | 3.03 |
Median Household Size in Myrtle Grove
The median household size in Myrtle Grove is 2.64 persons per household, with single male/father households (142 | 3.1%) accounting for the largest median household size of 4.06 persons per household. non-family households (1,111 | 24.6%) represent the smallest median household size with 1.21 persons per household.
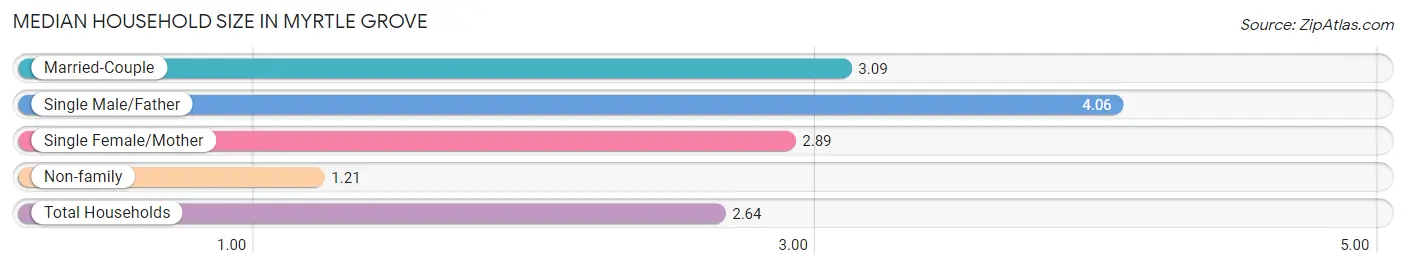
| Household Type | # Households | Household Size |
| Married-Couple | 2,992 (66.1%) | 3.09 |
| Single Male/Father | 142 (3.1%) | 4.06 |
| Single Female/Mother | 278 (6.1%) | 2.89 |
| Non-family | 1,111 (24.6%) | 1.21 |
| Total Households | 4,523 (100.0%) | 2.64 |
Household Size by Marriage Status in Myrtle Grove
Out of a total of 4,523 households in Myrtle Grove, 3,412 (75.4%) are family households, while 1,111 (24.6%) are nonfamily households. The most numerous type of family households are 2-person households, comprising 1,426, and the most common type of nonfamily households are 1-person households, comprising 910.
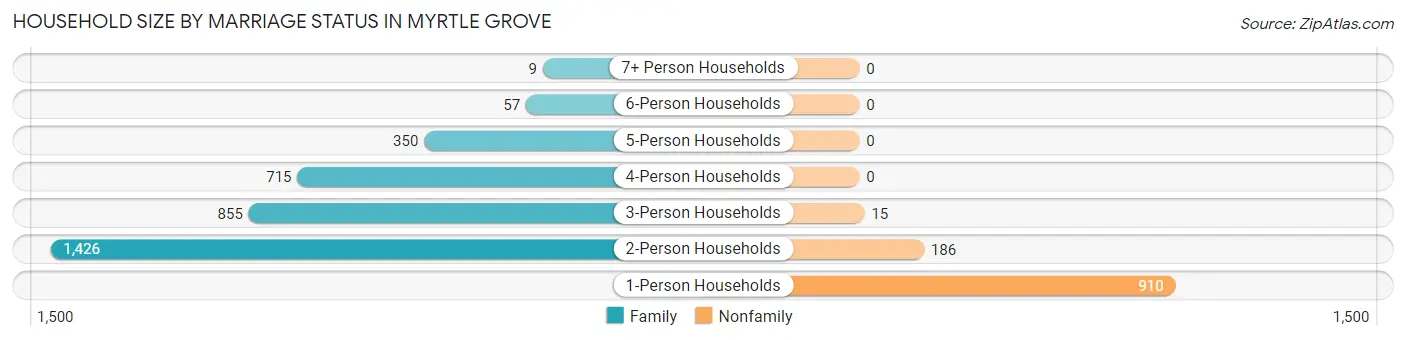
| Household Size | Family Households | Nonfamily Households |
| 1-Person Households | - | 910 (20.1%) |
| 2-Person Households | 1,426 (31.5%) | 186 (4.1%) |
| 3-Person Households | 855 (18.9%) | 15 (0.3%) |
| 4-Person Households | 715 (15.8%) | 0 (0.0%) |
| 5-Person Households | 350 (7.7%) | 0 (0.0%) |
| 6-Person Households | 57 (1.3%) | 0 (0.0%) |
| 7+ Person Households | 9 (0.2%) | 0 (0.0%) |
| Total | 3,412 (75.4%) | 1,111 (24.6%) |
Female Fertility in Myrtle Grove
Fertility by Age in Myrtle Grove
Average fertility rate in Myrtle Grove is 31.0 births per 1,000 women. Women in the age bracket of 20 to 34 years have the highest fertility rate with 45.0 births per 1,000 women. Women in the age bracket of 35 to 50 years acount for 73.8% of all women with births.

| Age Bracket | Women with Births | Births / 1,000 Women |
| 15 to 19 years | 0 (0.0%) | 0.0 |
| 20 to 34 years | 22 (26.2%) | 45.0 |
| 35 to 50 years | 62 (73.8%) | 35.0 |
| Total | 84 (100.0%) | 31.0 |
Fertility by Age by Marriage Status in Myrtle Grove
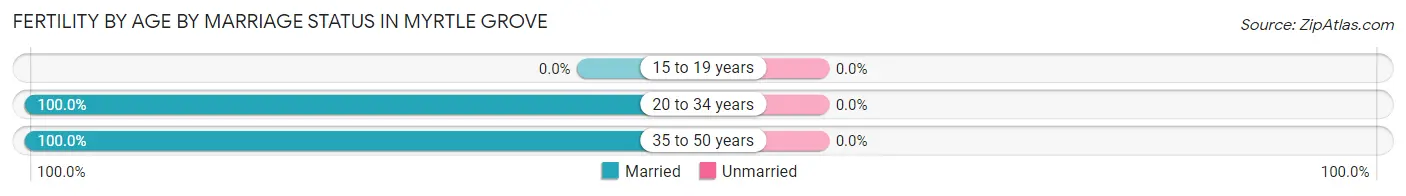
| Age Bracket | Married | Unmarried |
| 15 to 19 years | 0 (0.0%) | 0 (0.0%) |
| 20 to 34 years | 22 (100.0%) | 0 (0.0%) |
| 35 to 50 years | 62 (100.0%) | 0 (0.0%) |
| Total | 84 (100.0%) | 0 (0.0%) |
Fertility by Education in Myrtle Grove
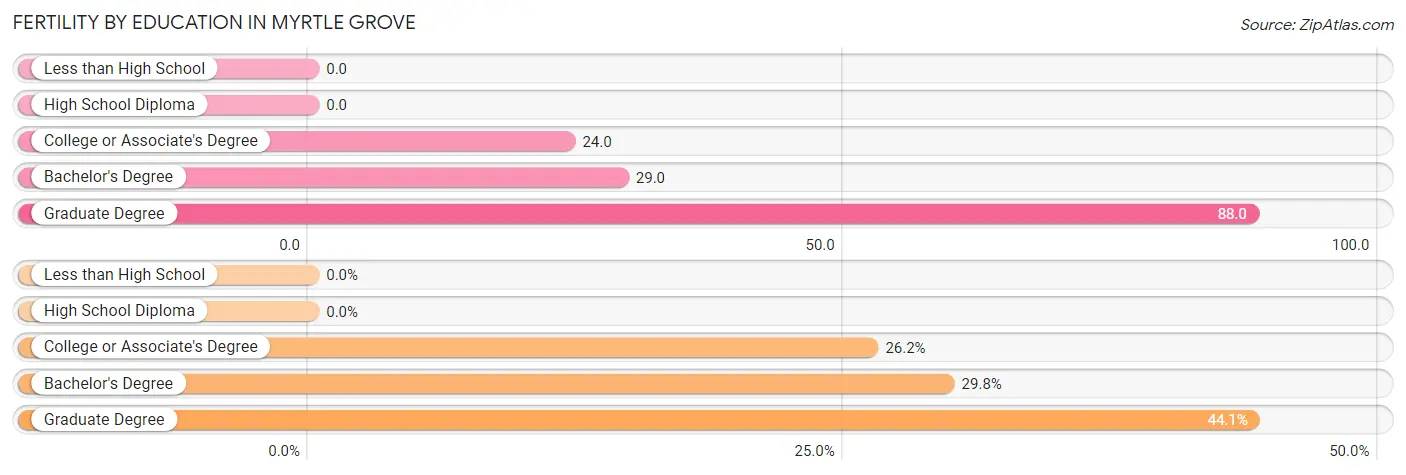
| Educational Attainment | Women with Births | Births / 1,000 Women |
| Less than High School | 0 (0.0%) | 0.0 |
| High School Diploma | 0 (0.0%) | 0.0 |
| College or Associate's Degree | 22 (26.2%) | 24.0 |
| Bachelor's Degree | 25 (29.8%) | 29.0 |
| Graduate Degree | 37 (44.1%) | 88.0 |
| Total | 84 (100.0%) | 31.0 |
Fertility by Education by Marriage Status in Myrtle Grove
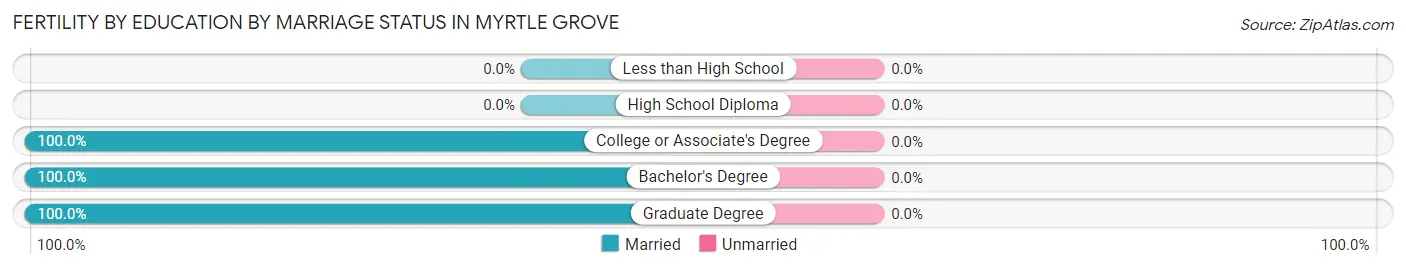
| Educational Attainment | Married | Unmarried |
| Less than High School | 0 (0.0%) | 0 (0.0%) |
| High School Diploma | 0 (0.0%) | 0 (0.0%) |
| College or Associate's Degree | 22 (100.0%) | 0 (0.0%) |
| Bachelor's Degree | 25 (100.0%) | 0 (0.0%) |
| Graduate Degree | 37 (100.0%) | 0 (0.0%) |
| Total | 84 (100.0%) | 0 (0.0%) |
Employment Characteristics in Myrtle Grove
Employment by Class of Employer in Myrtle Grove
Among the 5,169 employed individuals in Myrtle Grove, private company employees (3,401 | 65.8%), not-for-profit organizations (446 | 8.6%), and self-employed (incorporated) (338 | 6.5%) make up the most common classes of employment.
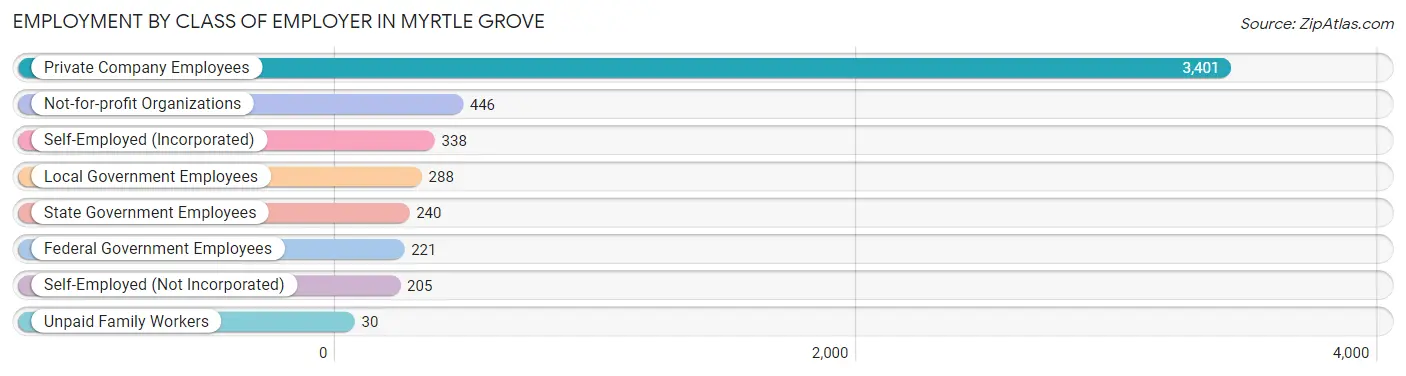
| Employer Class | # Employees | % Employees |
| Private Company Employees | 3,401 | 65.8% |
| Self-Employed (Incorporated) | 338 | 6.5% |
| Self-Employed (Not Incorporated) | 205 | 4.0% |
| Not-for-profit Organizations | 446 | 8.6% |
| Local Government Employees | 288 | 5.6% |
| State Government Employees | 240 | 4.6% |
| Federal Government Employees | 221 | 4.3% |
| Unpaid Family Workers | 30 | 0.6% |
| Total | 5,169 | 100.0% |
Employment Status by Age in Myrtle Grove
According to the labor force statistics for Myrtle Grove, out of the total population over 16 years of age (9,353), 60.7% or 5,677 individuals are in the labor force, with 4.3% or 244 of them unemployed. The age group with the highest labor force participation rate is 30 to 34 years, with 96.1% or 497 individuals in the labor force. Within the labor force, the 20 to 24 years age range has the highest percentage of unemployed individuals, with 23.8% or 54 of them being unemployed.
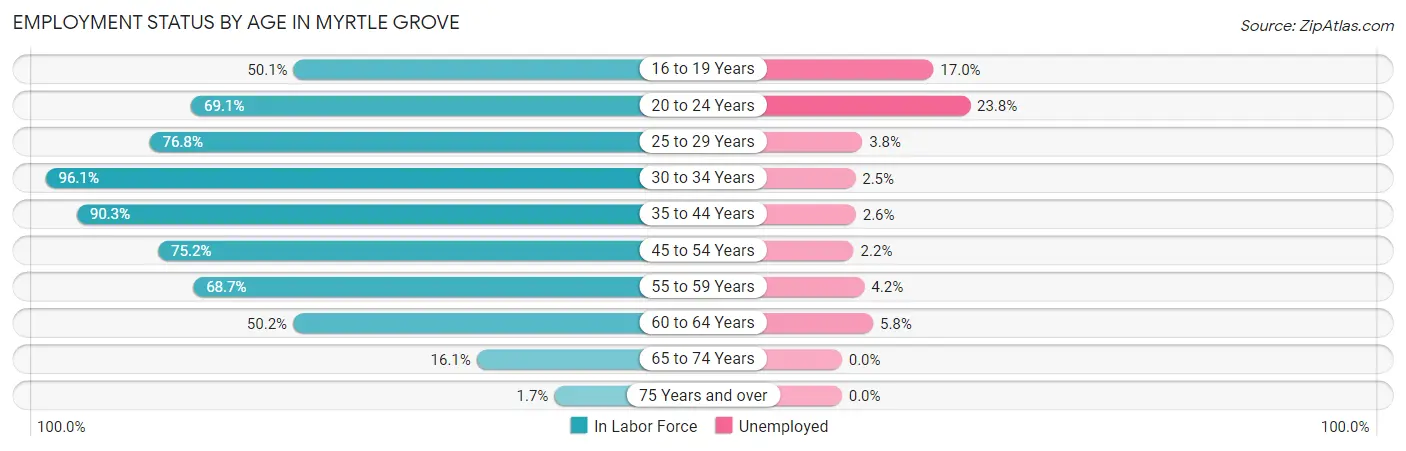
| Age Bracket | In Labor Force | Unemployed |
| 16 to 19 Years | 265 (50.1%) | 45 (17.0%) |
| 20 to 24 Years | 226 (69.1%) | 54 (23.8%) |
| 25 to 29 Years | 295 (76.8%) | 11 (3.8%) |
| 30 to 34 Years | 497 (96.1%) | 12 (2.5%) |
| 35 to 44 Years | 1,909 (90.3%) | 50 (2.6%) |
| 45 to 54 Years | 1,292 (75.2%) | 28 (2.2%) |
| 55 to 59 Years | 432 (68.7%) | 18 (4.2%) |
| 60 to 64 Years | 532 (50.2%) | 31 (5.8%) |
| 65 to 74 Years | 214 (16.1%) | 0 (0.0%) |
| 75 Years and over | 13 (1.7%) | 0 (0.0%) |
| Total | 5,677 (60.7%) | 244 (4.3%) |
Employment Status by Educational Attainment in Myrtle Grove
According to labor force statistics for Myrtle Grove, 77.2% of individuals (4,958) out of the total population between 25 and 64 years of age (6,422) are in the labor force, with 3.0% or 149 of them being unemployed. The group with the highest labor force participation rate are those with the educational attainment of bachelor's degree or higher, with 80.3% or 2,638 individuals in the labor force. Within the labor force, individuals with less than high school education have the highest percentage of unemployment, with 16.0% or 36 of them being unemployed.
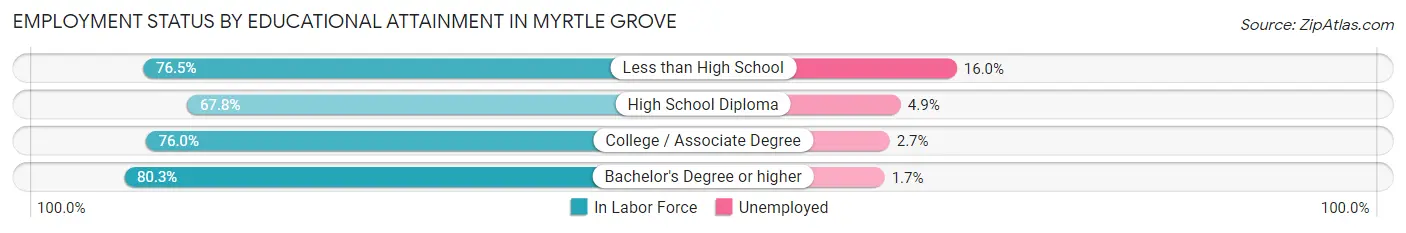
| Educational Attainment | In Labor Force | Unemployed |
| Less than High School | 225 (76.5%) | 47 (16.0%) |
| High School Diploma | 566 (67.8%) | 41 (4.9%) |
| College / Associate Degree | 1,526 (76.0%) | 54 (2.7%) |
| Bachelor's Degree or higher | 2,638 (80.3%) | 56 (1.7%) |
| Total | 4,958 (77.2%) | 193 (3.0%) |
Employment Occupations by Sex in Myrtle Grove
Management, Business, Science and Arts Occupations
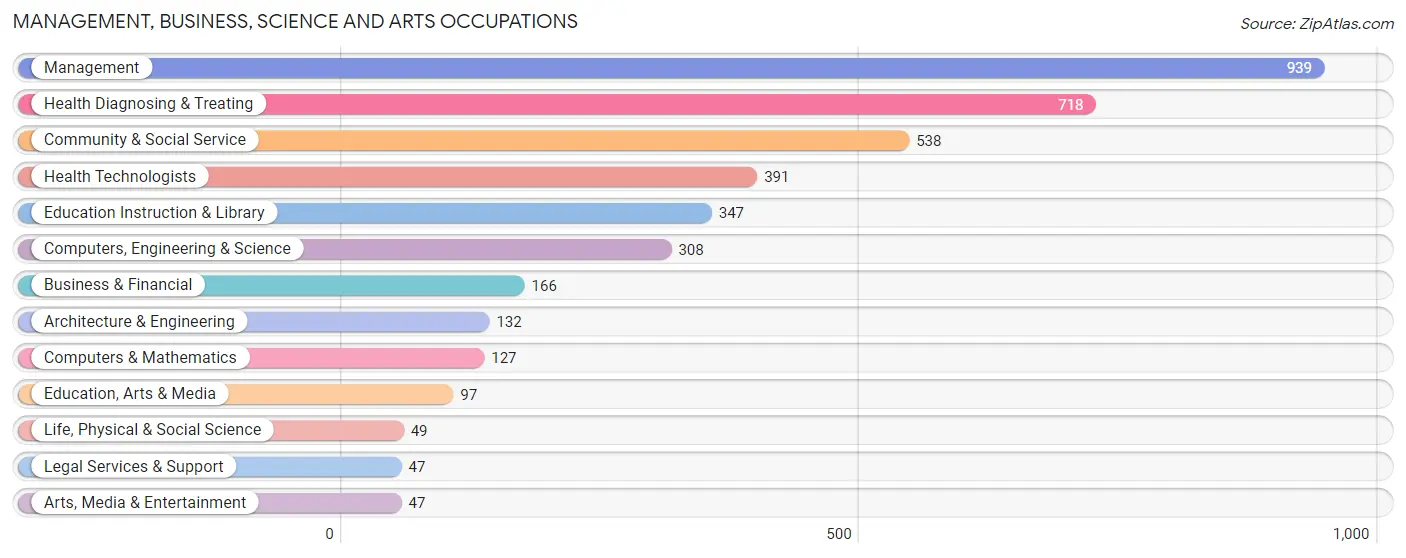
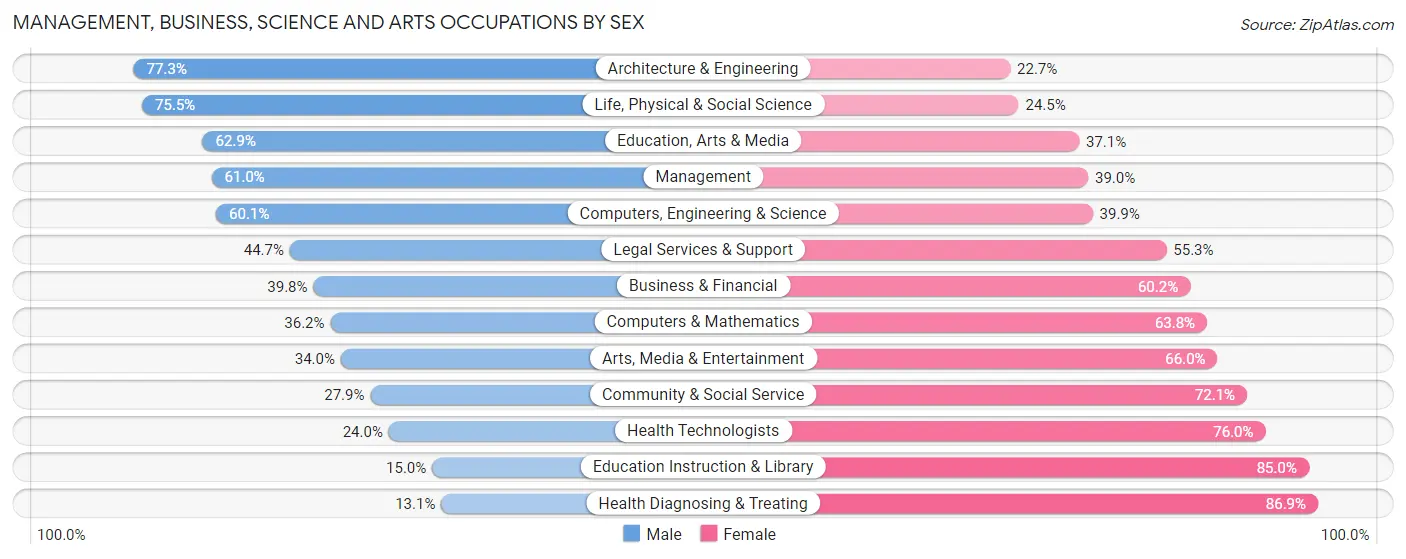
The most common Management, Business, Science and Arts occupations in Myrtle Grove are Management (939 | 17.6%), Health Diagnosing & Treating (718 | 13.5%), Community & Social Service (538 | 10.1%), Health Technologists (391 | 7.3%), and Education Instruction & Library (347 | 6.5%).
Management, Business, Science and Arts Occupations by Sex
Within the Management, Business, Science and Arts occupations in Myrtle Grove, the most male-oriented occupations are Architecture & Engineering (77.3%), Life, Physical & Social Science (75.5%), and Education, Arts & Media (62.9%), while the most female-oriented occupations are Health Diagnosing & Treating (86.9%), Education Instruction & Library (85.0%), and Health Technologists (76.0%).
| Occupation | Male | Female |
| Management | 573 (61.0%) | 366 (39.0%) |
| Business & Financial | 66 (39.8%) | 100 (60.2%) |
| Computers, Engineering & Science | 185 (60.1%) | 123 (39.9%) |
| Computers & Mathematics | 46 (36.2%) | 81 (63.8%) |
| Architecture & Engineering | 102 (77.3%) | 30 (22.7%) |
| Life, Physical & Social Science | 37 (75.5%) | 12 (24.5%) |
| Community & Social Service | 150 (27.9%) | 388 (72.1%) |
| Education, Arts & Media | 61 (62.9%) | 36 (37.1%) |
| Legal Services & Support | 21 (44.7%) | 26 (55.3%) |
| Education Instruction & Library | 52 (15.0%) | 295 (85.0%) |
| Arts, Media & Entertainment | 16 (34.0%) | 31 (66.0%) |
| Health Diagnosing & Treating | 94 (13.1%) | 624 (86.9%) |
| Health Technologists | 94 (24.0%) | 297 (76.0%) |
| Total (Category) | 1,068 (40.0%) | 1,601 (60.0%) |
| Total (Overall) | 2,803 (52.5%) | 2,531 (47.4%) |
Services Occupations
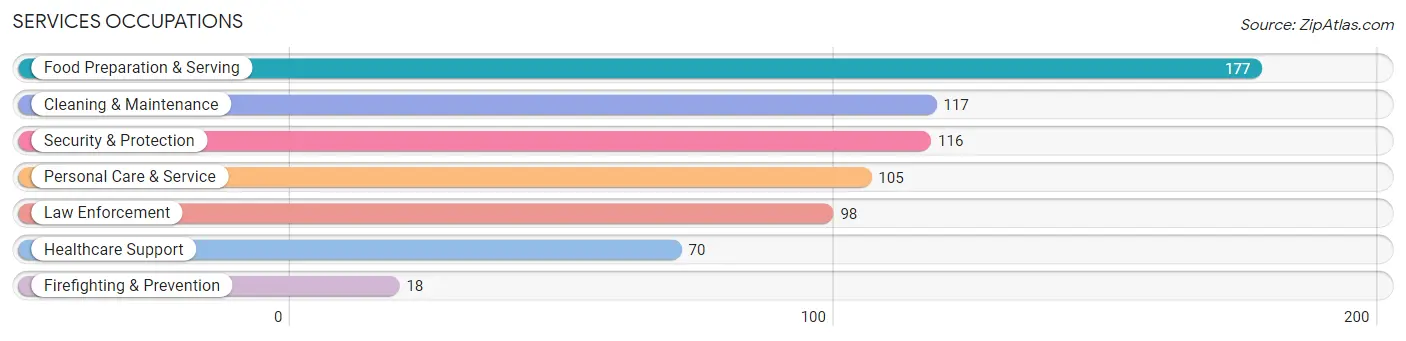
The most common Services occupations in Myrtle Grove are Food Preparation & Serving (177 | 3.3%), Cleaning & Maintenance (117 | 2.2%), Security & Protection (116 | 2.2%), Personal Care & Service (105 | 2.0%), and Law Enforcement (98 | 1.8%).
Services Occupations by Sex
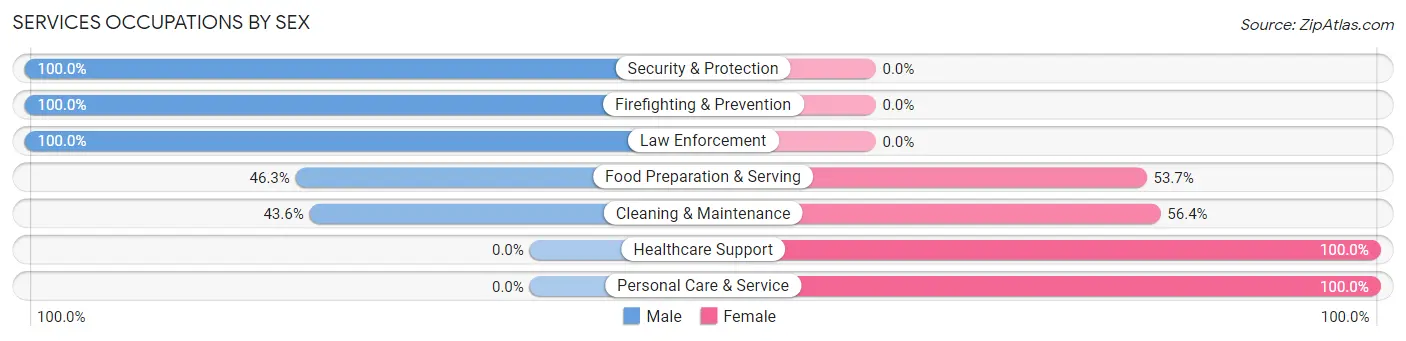
Within the Services occupations in Myrtle Grove, the most male-oriented occupations are Security & Protection (100.0%), Firefighting & Prevention (100.0%), and Law Enforcement (100.0%), while the most female-oriented occupations are Healthcare Support (100.0%), Personal Care & Service (100.0%), and Cleaning & Maintenance (56.4%).
| Occupation | Male | Female |
| Healthcare Support | 0 (0.0%) | 70 (100.0%) |
| Security & Protection | 116 (100.0%) | 0 (0.0%) |
| Firefighting & Prevention | 18 (100.0%) | 0 (0.0%) |
| Law Enforcement | 98 (100.0%) | 0 (0.0%) |
| Food Preparation & Serving | 82 (46.3%) | 95 (53.7%) |
| Cleaning & Maintenance | 51 (43.6%) | 66 (56.4%) |
| Personal Care & Service | 0 (0.0%) | 105 (100.0%) |
| Total (Category) | 249 (42.6%) | 336 (57.4%) |
| Total (Overall) | 2,803 (52.5%) | 2,531 (47.4%) |
Sales and Office Occupations
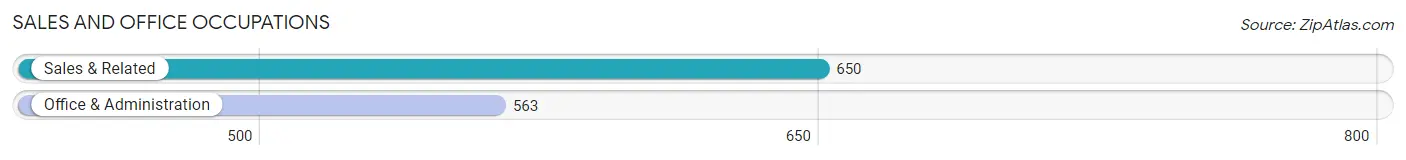
The most common Sales and Office occupations in Myrtle Grove are Sales & Related (650 | 12.2%), and Office & Administration (563 | 10.5%).
Sales and Office Occupations by Sex
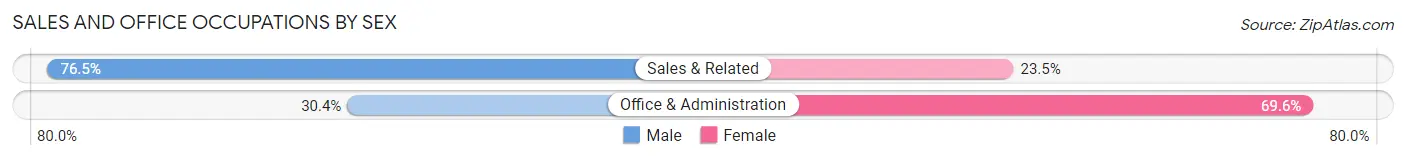
| Occupation | Male | Female |
| Sales & Related | 497 (76.5%) | 153 (23.5%) |
| Office & Administration | 171 (30.4%) | 392 (69.6%) |
| Total (Category) | 668 (55.1%) | 545 (44.9%) |
| Total (Overall) | 2,803 (52.5%) | 2,531 (47.4%) |
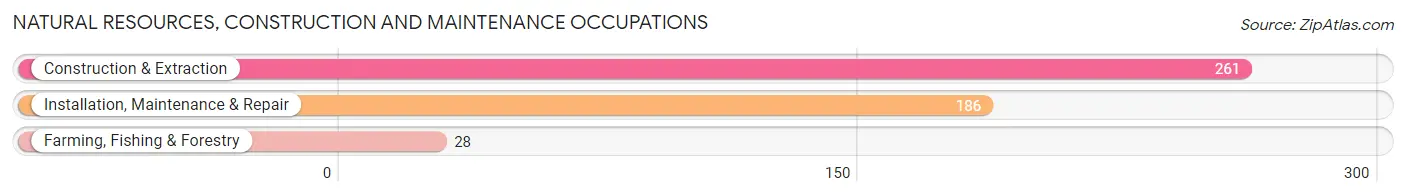
Natural Resources, Construction and Maintenance Occupations
The most common Natural Resources, Construction and Maintenance occupations in Myrtle Grove are Construction & Extraction (261 | 4.9%), Installation, Maintenance & Repair (186 | 3.5%), and Farming, Fishing & Forestry (28 | 0.5%).
Natural Resources, Construction and Maintenance Occupations by Sex
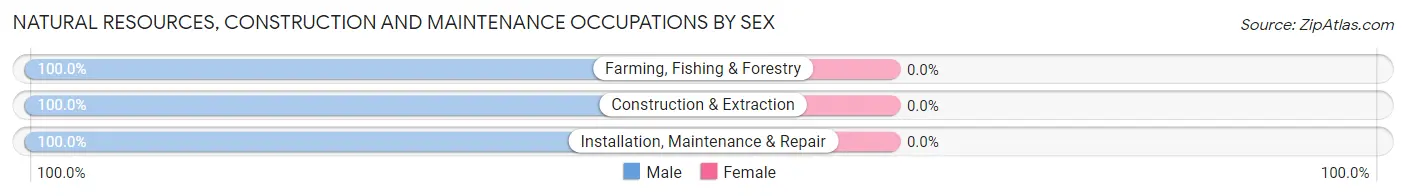
| Occupation | Male | Female |
| Farming, Fishing & Forestry | 28 (100.0%) | 0 (0.0%) |
| Construction & Extraction | 261 (100.0%) | 0 (0.0%) |
| Installation, Maintenance & Repair | 186 (100.0%) | 0 (0.0%) |
| Total (Category) | 475 (100.0%) | 0 (0.0%) |
| Total (Overall) | 2,803 (52.5%) | 2,531 (47.4%) |
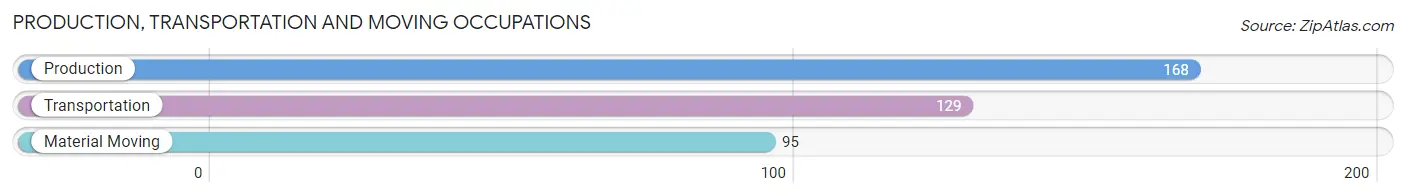
Production, Transportation and Moving Occupations
The most common Production, Transportation and Moving occupations in Myrtle Grove are Production (168 | 3.2%), Transportation (129 | 2.4%), and Material Moving (95 | 1.8%).
Production, Transportation and Moving Occupations by Sex
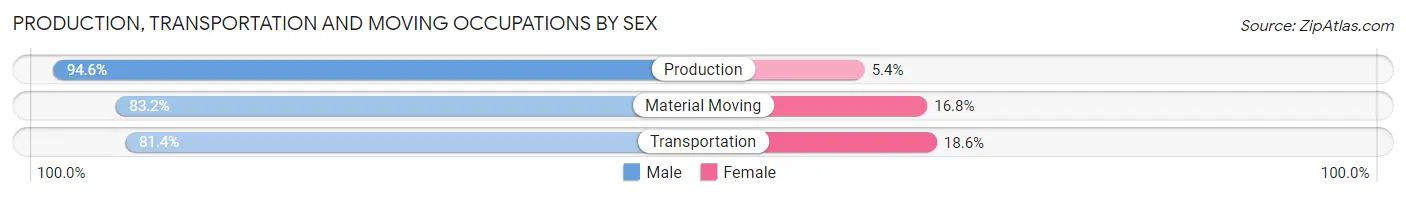
| Occupation | Male | Female |
| Production | 159 (94.6%) | 9 (5.4%) |
| Transportation | 105 (81.4%) | 24 (18.6%) |
| Material Moving | 79 (83.2%) | 16 (16.8%) |
| Total (Category) | 343 (87.5%) | 49 (12.5%) |
| Total (Overall) | 2,803 (52.5%) | 2,531 (47.4%) |
Employment Industries by Sex in Myrtle Grove
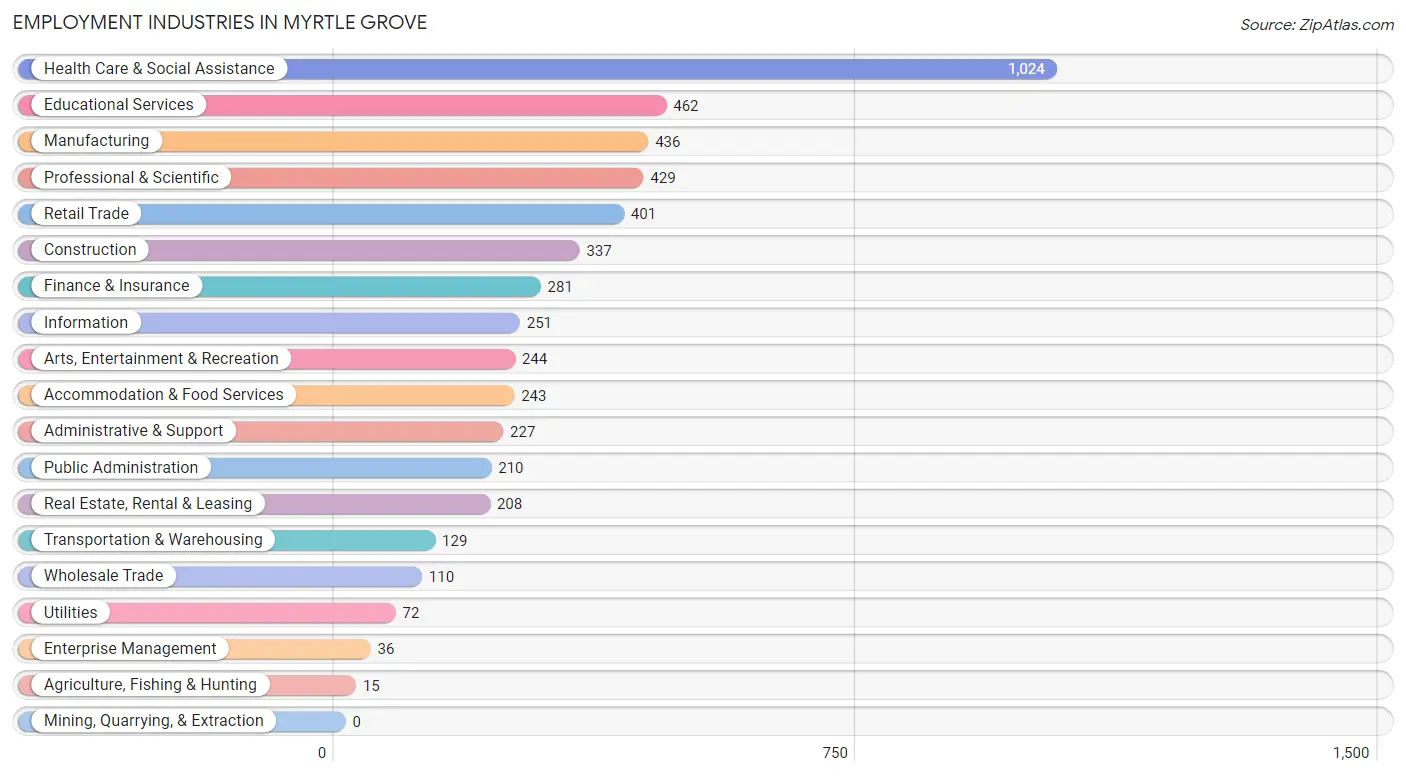
Employment Industries in Myrtle Grove
The major employment industries in Myrtle Grove include Health Care & Social Assistance (1,024 | 19.2%), Educational Services (462 | 8.7%), Manufacturing (436 | 8.2%), Professional & Scientific (429 | 8.0%), and Retail Trade (401 | 7.5%).
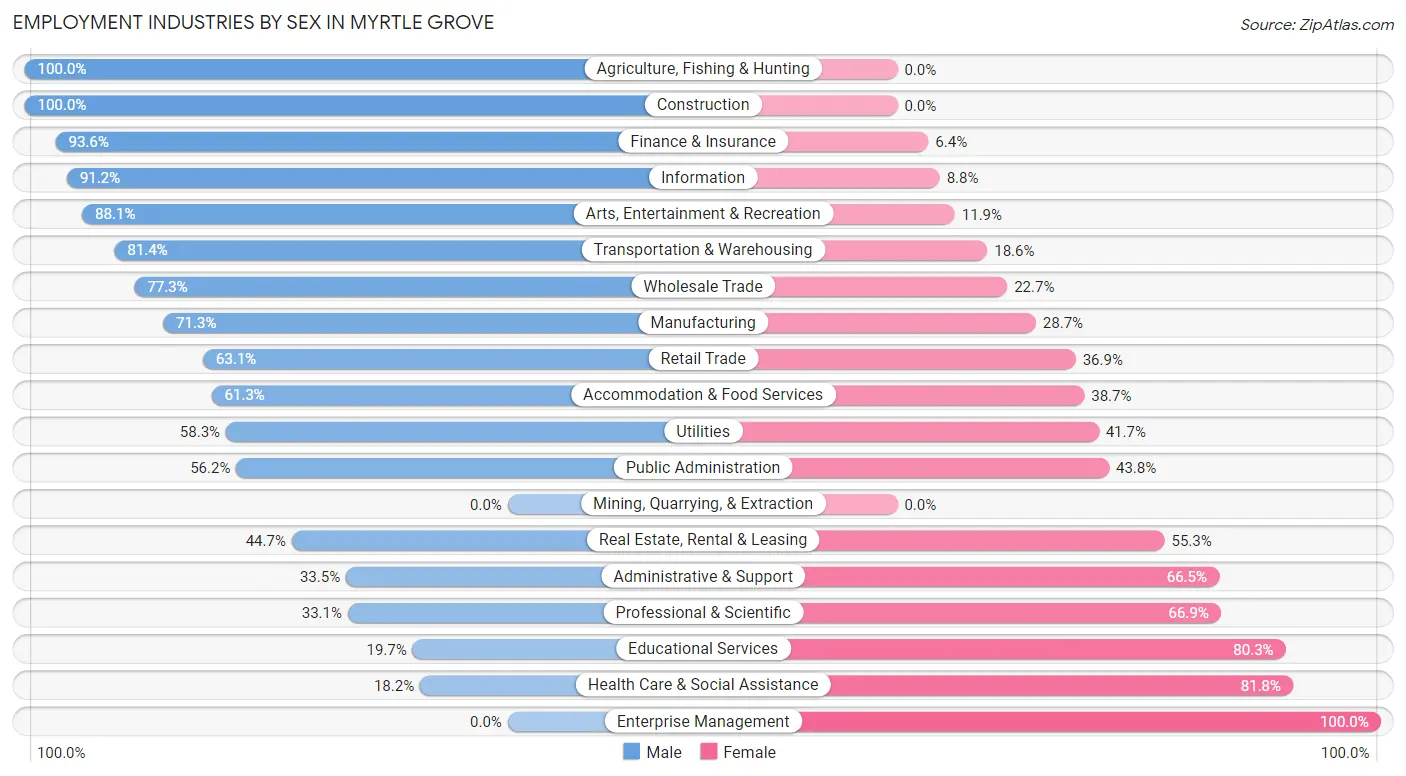
Employment Industries by Sex in Myrtle Grove
The Myrtle Grove industries that see more men than women are Agriculture, Fishing & Hunting (100.0%), Construction (100.0%), and Finance & Insurance (93.6%), whereas the industries that tend to have a higher number of women are Enterprise Management (100.0%), Health Care & Social Assistance (81.8%), and Educational Services (80.3%).
| Industry | Male | Female |
| Agriculture, Fishing & Hunting | 15 (100.0%) | 0 (0.0%) |
| Mining, Quarrying, & Extraction | 0 (0.0%) | 0 (0.0%) |
| Construction | 337 (100.0%) | 0 (0.0%) |
| Manufacturing | 311 (71.3%) | 125 (28.7%) |
| Wholesale Trade | 85 (77.3%) | 25 (22.7%) |
| Retail Trade | 253 (63.1%) | 148 (36.9%) |
| Transportation & Warehousing | 105 (81.4%) | 24 (18.6%) |
| Utilities | 42 (58.3%) | 30 (41.7%) |
| Information | 229 (91.2%) | 22 (8.8%) |
| Finance & Insurance | 263 (93.6%) | 18 (6.4%) |
| Real Estate, Rental & Leasing | 93 (44.7%) | 115 (55.3%) |
| Professional & Scientific | 142 (33.1%) | 287 (66.9%) |
| Enterprise Management | 0 (0.0%) | 36 (100.0%) |
| Administrative & Support | 76 (33.5%) | 151 (66.5%) |
| Educational Services | 91 (19.7%) | 371 (80.3%) |
| Health Care & Social Assistance | 186 (18.2%) | 838 (81.8%) |
| Arts, Entertainment & Recreation | 215 (88.1%) | 29 (11.9%) |
| Accommodation & Food Services | 149 (61.3%) | 94 (38.7%) |
| Public Administration | 118 (56.2%) | 92 (43.8%) |
| Total | 2,803 (52.5%) | 2,531 (47.4%) |
Education in Myrtle Grove
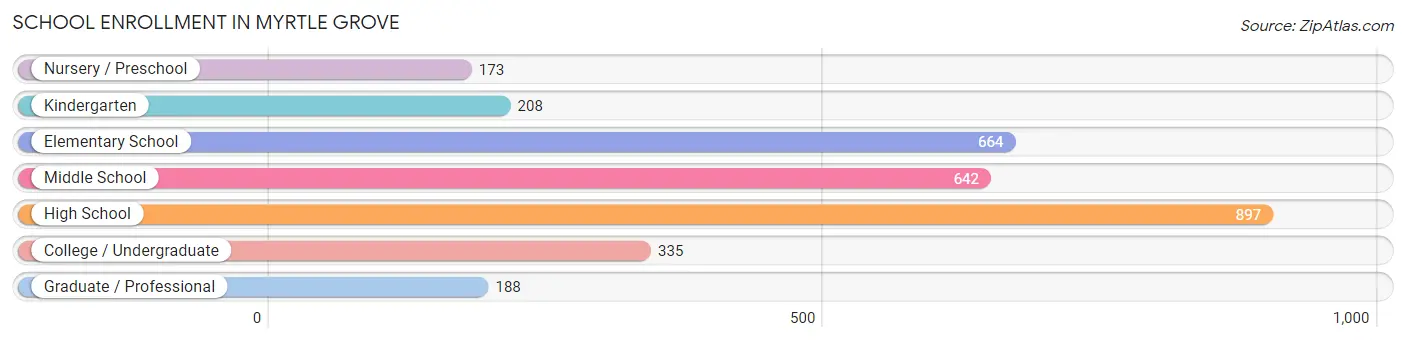
School Enrollment in Myrtle Grove
The most common levels of schooling among the 3,107 students in Myrtle Grove are high school (897 | 28.9%), elementary school (664 | 21.4%), and middle school (642 | 20.7%).
| School Level | # Students | % Students |
| Nursery / Preschool | 173 | 5.6% |
| Kindergarten | 208 | 6.7% |
| Elementary School | 664 | 21.4% |
| Middle School | 642 | 20.7% |
| High School | 897 | 28.9% |
| College / Undergraduate | 335 | 10.8% |
| Graduate / Professional | 188 | 6.0% |
| Total | 3,107 | 100.0% |
School Enrollment by Age by Funding Source in Myrtle Grove
Out of a total of 3,107 students who are enrolled in schools in Myrtle Grove, 690 (22.2%) attend a private institution, while the remaining 2,417 (77.8%) are enrolled in public schools. The age group of 3 to 4 year olds has the highest likelihood of being enrolled in private schools, with 86 (78.2% in the age bracket) enrolled. Conversely, the age group of 18 to 19 year olds has the lowest likelihood of being enrolled in a private school, with 276 (100.0% in the age bracket) attending a public institution.
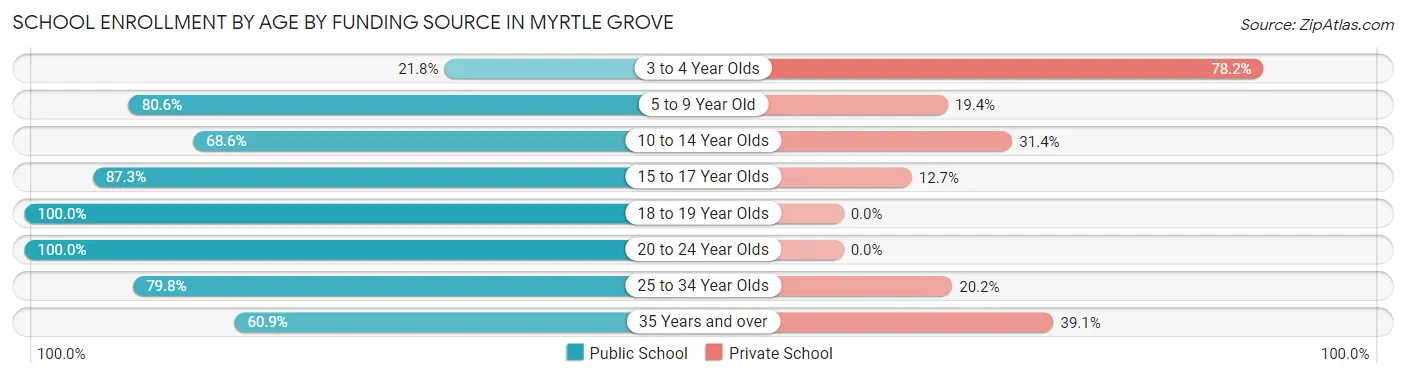
| Age Bracket | Public School | Private School |
| 3 to 4 Year Olds | 24 (21.8%) | 86 (78.2%) |
| 5 to 9 Year Old | 697 (80.6%) | 168 (19.4%) |
| 10 to 14 Year Olds | 589 (68.6%) | 270 (31.4%) |
| 15 to 17 Year Olds | 502 (87.3%) | 73 (12.7%) |
| 18 to 19 Year Olds | 276 (100.0%) | 0 (0.0%) |
| 20 to 24 Year Olds | 141 (100.0%) | 0 (0.0%) |
| 25 to 34 Year Olds | 67 (79.8%) | 17 (20.2%) |
| 35 Years and over | 120 (60.9%) | 77 (39.1%) |
| Total | 2,417 (77.8%) | 690 (22.2%) |
Educational Attainment by Field of Study in Myrtle Grove
Business (988 | 22.4%), education (516 | 11.7%), bio, nature & agricultural (479 | 10.9%), science & technology (420 | 9.5%), and social sciences (384 | 8.7%) are the most common fields of study among 4,411 individuals in Myrtle Grove who have obtained a bachelor's degree or higher.
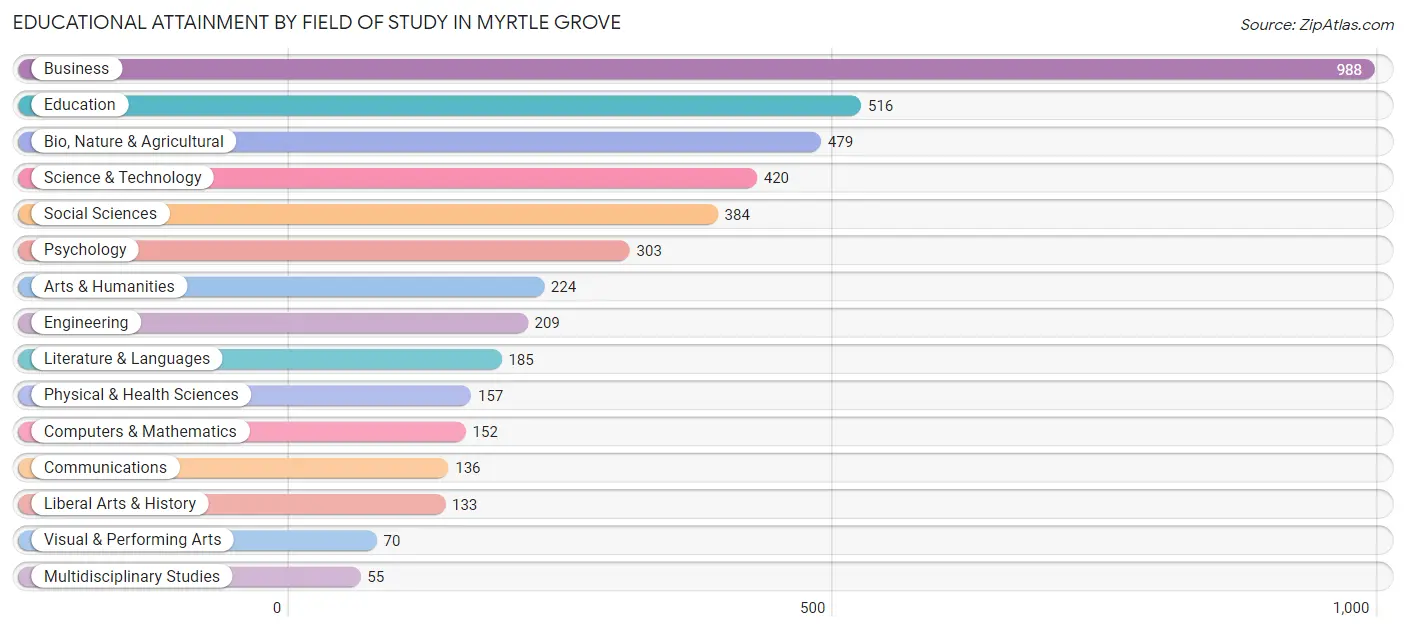
| Field of Study | # Graduates | % Graduates |
| Computers & Mathematics | 152 | 3.5% |
| Bio, Nature & Agricultural | 479 | 10.9% |
| Physical & Health Sciences | 157 | 3.6% |
| Psychology | 303 | 6.9% |
| Social Sciences | 384 | 8.7% |
| Engineering | 209 | 4.7% |
| Multidisciplinary Studies | 55 | 1.3% |
| Science & Technology | 420 | 9.5% |
| Business | 988 | 22.4% |
| Education | 516 | 11.7% |
| Literature & Languages | 185 | 4.2% |
| Liberal Arts & History | 133 | 3.0% |
| Visual & Performing Arts | 70 | 1.6% |
| Communications | 136 | 3.1% |
| Arts & Humanities | 224 | 5.1% |
| Total | 4,411 | 100.0% |
Transportation & Commute in Myrtle Grove
Vehicle Availability by Sex in Myrtle Grove
The most prevalent vehicle ownership categories in Myrtle Grove are males with 2 vehicles (1,182, accounting for 43.8%) and females with 2 vehicles (1,151, making up 47.9%).
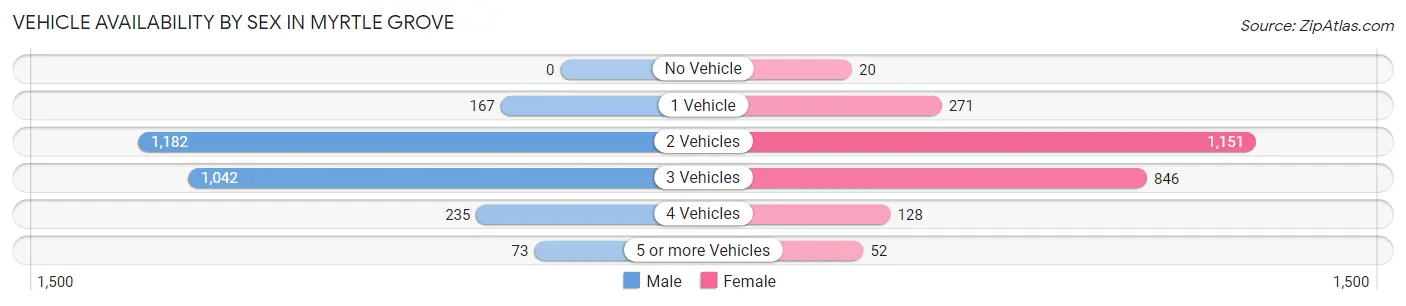
| Vehicles Available | Male | Female |
| No Vehicle | 0 (0.0%) | 20 (0.8%) |
| 1 Vehicle | 167 (6.2%) | 271 (11.0%) |
| 2 Vehicles | 1,182 (43.8%) | 1,151 (46.6%) |
| 3 Vehicles | 1,042 (38.6%) | 846 (34.3%) |
| 4 Vehicles | 235 (8.7%) | 128 (5.2%) |
| 5 or more Vehicles | 73 (2.7%) | 52 (2.1%) |
| Total | 2,699 (100.0%) | 2,468 (100.0%) |
Commute Time in Myrtle Grove
The most frequently occuring commute durations in Myrtle Grove are 15 to 19 minutes (1,052 commuters, 24.6%), 20 to 24 minutes (727 commuters, 17.0%), and 30 to 34 minutes (579 commuters, 13.6%).
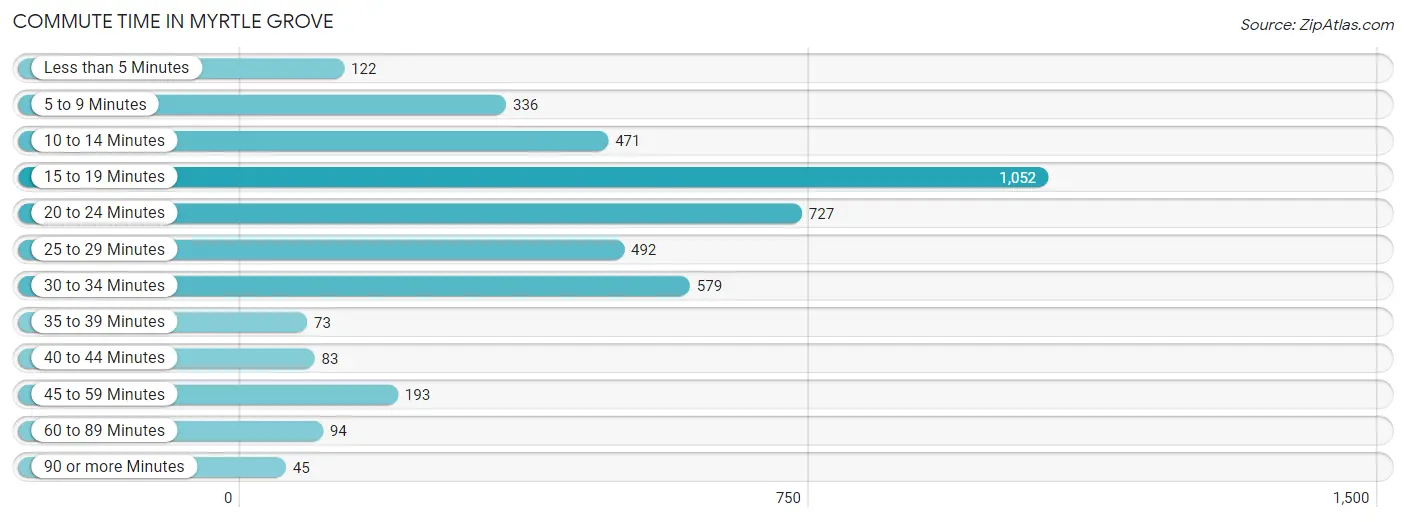
| Commute Time | # Commuters | % Commuters |
| Less than 5 Minutes | 122 | 2.9% |
| 5 to 9 Minutes | 336 | 7.9% |
| 10 to 14 Minutes | 471 | 11.0% |
| 15 to 19 Minutes | 1,052 | 24.6% |
| 20 to 24 Minutes | 727 | 17.0% |
| 25 to 29 Minutes | 492 | 11.5% |
| 30 to 34 Minutes | 579 | 13.6% |
| 35 to 39 Minutes | 73 | 1.7% |
| 40 to 44 Minutes | 83 | 1.9% |
| 45 to 59 Minutes | 193 | 4.5% |
| 60 to 89 Minutes | 94 | 2.2% |
| 90 or more Minutes | 45 | 1.1% |
Commute Time by Sex in Myrtle Grove
The most common commute times in Myrtle Grove are 15 to 19 minutes (591 commuters, 25.9%) for males and 15 to 19 minutes (461 commuters, 23.2%) for females.
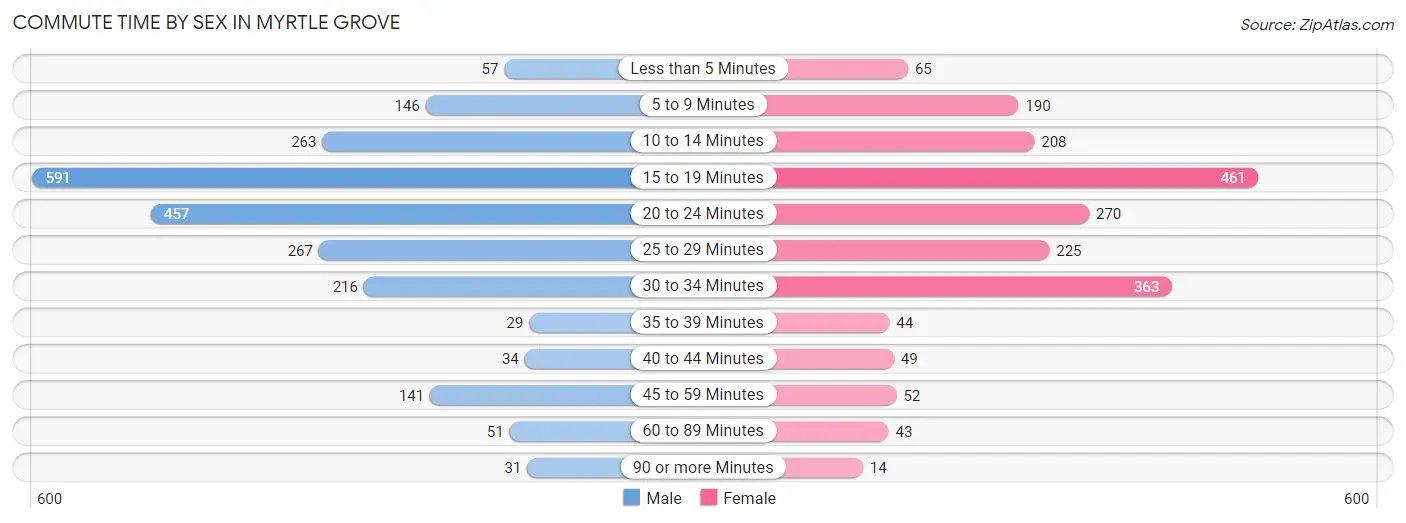
| Commute Time | Male | Female |
| Less than 5 Minutes | 57 (2.5%) | 65 (3.3%) |
| 5 to 9 Minutes | 146 (6.4%) | 190 (9.6%) |
| 10 to 14 Minutes | 263 (11.5%) | 208 (10.5%) |
| 15 to 19 Minutes | 591 (25.9%) | 461 (23.2%) |
| 20 to 24 Minutes | 457 (20.0%) | 270 (13.6%) |
| 25 to 29 Minutes | 267 (11.7%) | 225 (11.3%) |
| 30 to 34 Minutes | 216 (9.5%) | 363 (18.3%) |
| 35 to 39 Minutes | 29 (1.3%) | 44 (2.2%) |
| 40 to 44 Minutes | 34 (1.5%) | 49 (2.5%) |
| 45 to 59 Minutes | 141 (6.2%) | 52 (2.6%) |
| 60 to 89 Minutes | 51 (2.2%) | 43 (2.2%) |
| 90 or more Minutes | 31 (1.4%) | 14 (0.7%) |
Time of Departure to Work by Sex in Myrtle Grove
The most frequent times of departure to work in Myrtle Grove are 7:30 AM to 7:59 AM (386, 16.9%) for males and 7:00 AM to 7:29 AM (608, 30.6%) for females.
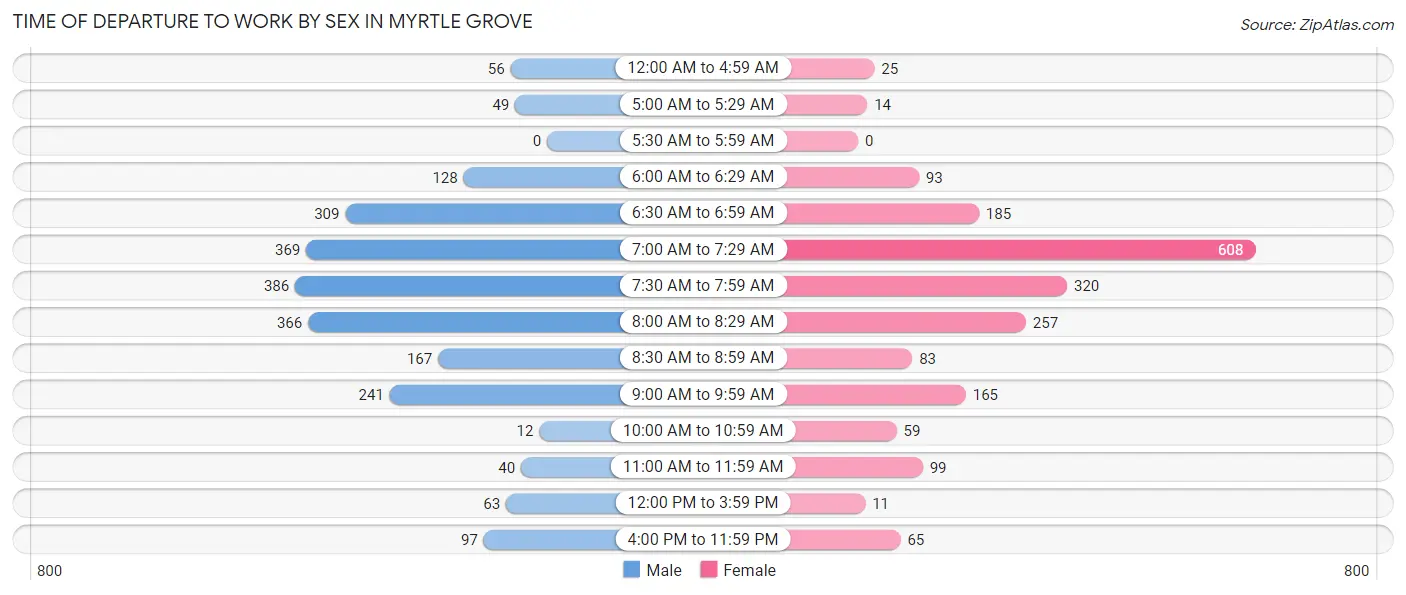
| Time of Departure | Male | Female |
| 12:00 AM to 4:59 AM | 56 (2.5%) | 25 (1.3%) |
| 5:00 AM to 5:29 AM | 49 (2.1%) | 14 (0.7%) |
| 5:30 AM to 5:59 AM | 0 (0.0%) | 0 (0.0%) |
| 6:00 AM to 6:29 AM | 128 (5.6%) | 93 (4.7%) |
| 6:30 AM to 6:59 AM | 309 (13.5%) | 185 (9.3%) |
| 7:00 AM to 7:29 AM | 369 (16.2%) | 608 (30.6%) |
| 7:30 AM to 7:59 AM | 386 (16.9%) | 320 (16.1%) |
| 8:00 AM to 8:29 AM | 366 (16.0%) | 257 (13.0%) |
| 8:30 AM to 8:59 AM | 167 (7.3%) | 83 (4.2%) |
| 9:00 AM to 9:59 AM | 241 (10.6%) | 165 (8.3%) |
| 10:00 AM to 10:59 AM | 12 (0.5%) | 59 (3.0%) |
| 11:00 AM to 11:59 AM | 40 (1.8%) | 99 (5.0%) |
| 12:00 PM to 3:59 PM | 63 (2.8%) | 11 (0.5%) |
| 4:00 PM to 11:59 PM | 97 (4.3%) | 65 (3.3%) |
| Total | 2,283 (100.0%) | 1,984 (100.0%) |
Housing Occupancy in Myrtle Grove
Occupancy by Ownership in Myrtle Grove
Of the total 4,523 dwellings in Myrtle Grove, owner-occupied units account for 3,841 (84.9%), while renter-occupied units make up 682 (15.1%).
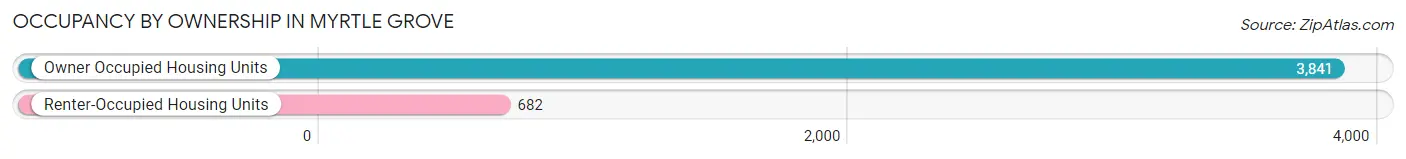
| Occupancy | # Housing Units | % Housing Units |
| Owner Occupied Housing Units | 3,841 | 84.9% |
| Renter-Occupied Housing Units | 682 | 15.1% |
| Total Occupied Housing Units | 4,523 | 100.0% |
Occupancy by Household Size in Myrtle Grove
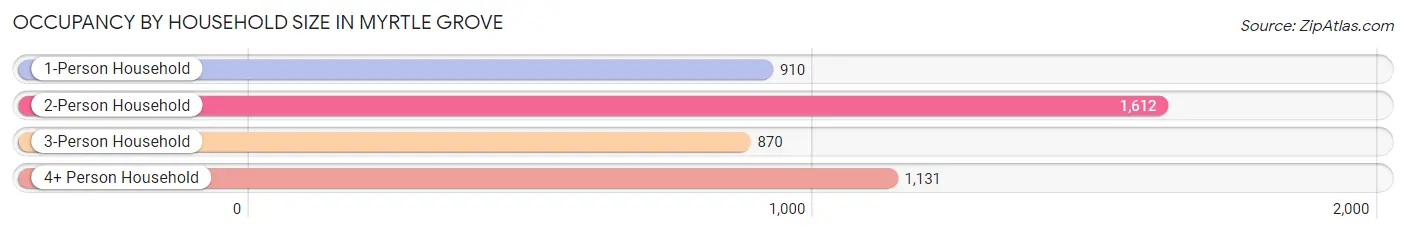
| Household Size | # Housing Units | % Housing Units |
| 1-Person Household | 910 | 20.1% |
| 2-Person Household | 1,612 | 35.6% |
| 3-Person Household | 870 | 19.2% |
| 4+ Person Household | 1,131 | 25.0% |
| Total Housing Units | 4,523 | 100.0% |
Occupancy by Ownership by Household Size in Myrtle Grove
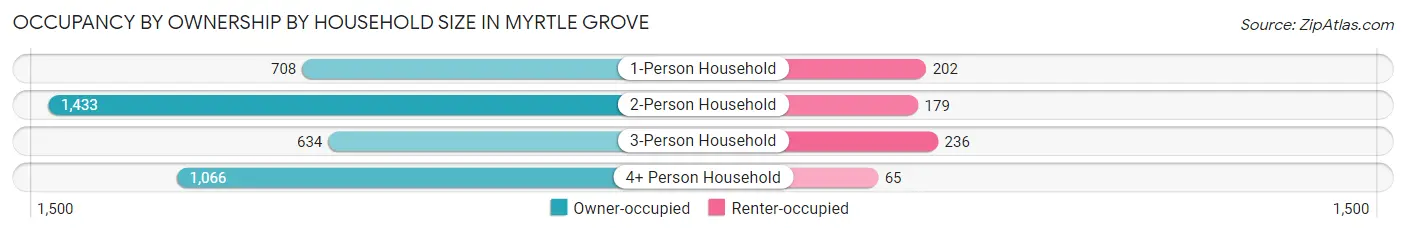
| Household Size | Owner-occupied | Renter-occupied |
| 1-Person Household | 708 (77.8%) | 202 (22.2%) |
| 2-Person Household | 1,433 (88.9%) | 179 (11.1%) |
| 3-Person Household | 634 (72.9%) | 236 (27.1%) |
| 4+ Person Household | 1,066 (94.3%) | 65 (5.8%) |
| Total Housing Units | 3,841 (84.9%) | 682 (15.1%) |
Occupancy by Educational Attainment in Myrtle Grove
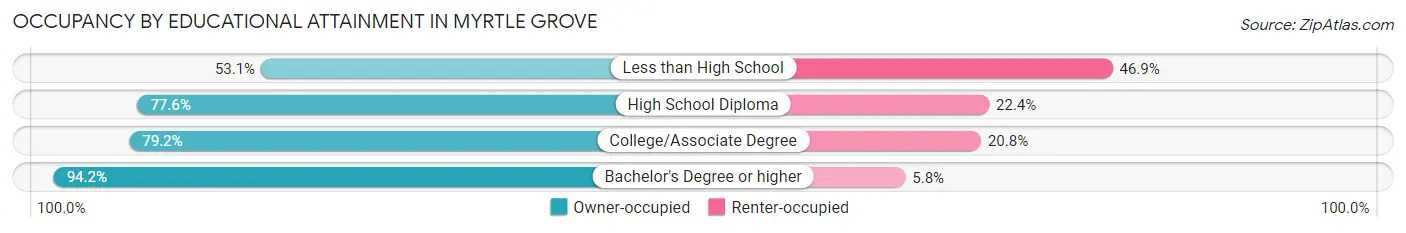
| Household Size | Owner-occupied | Renter-occupied |
| Less than High School | 169 (53.1%) | 149 (46.9%) |
| High School Diploma | 454 (77.6%) | 131 (22.4%) |
| College/Associate Degree | 1,018 (79.2%) | 267 (20.8%) |
| Bachelor's Degree or higher | 2,200 (94.2%) | 135 (5.8%) |
Occupancy by Age of Householder in Myrtle Grove
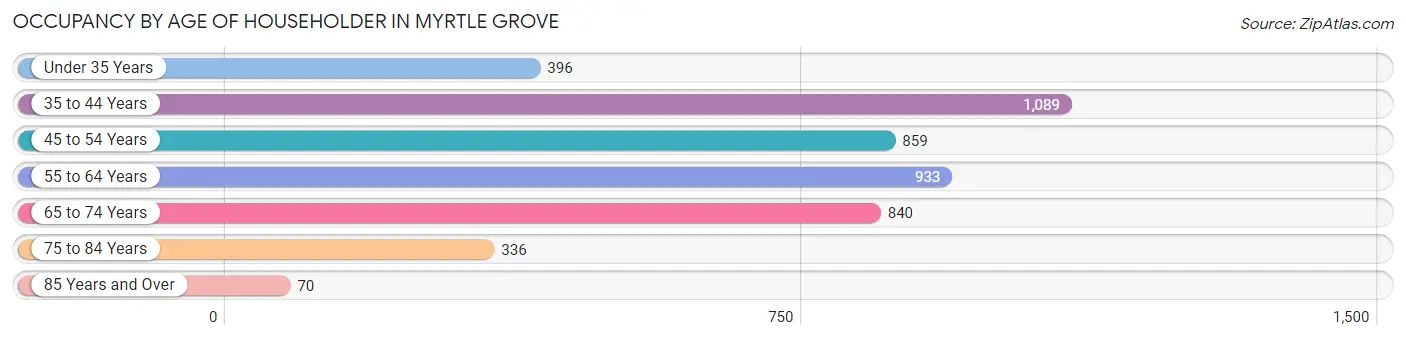
| Age Bracket | # Households | % Households |
| Under 35 Years | 396 | 8.8% |
| 35 to 44 Years | 1,089 | 24.1% |
| 45 to 54 Years | 859 | 19.0% |
| 55 to 64 Years | 933 | 20.6% |
| 65 to 74 Years | 840 | 18.6% |
| 75 to 84 Years | 336 | 7.4% |
| 85 Years and Over | 70 | 1.5% |
| Total | 4,523 | 100.0% |
Housing Finances in Myrtle Grove
Median Income by Occupancy in Myrtle Grove
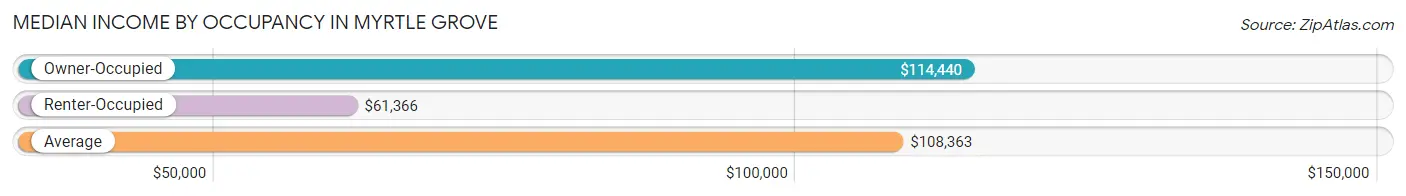
| Occupancy Type | # Households | Median Income |
| Owner-Occupied | 3,841 (84.9%) | $114,440 |
| Renter-Occupied | 682 (15.1%) | $61,366 |
| Average | 4,523 (100.0%) | $108,363 |
Occupancy by Householder Income Bracket in Myrtle Grove
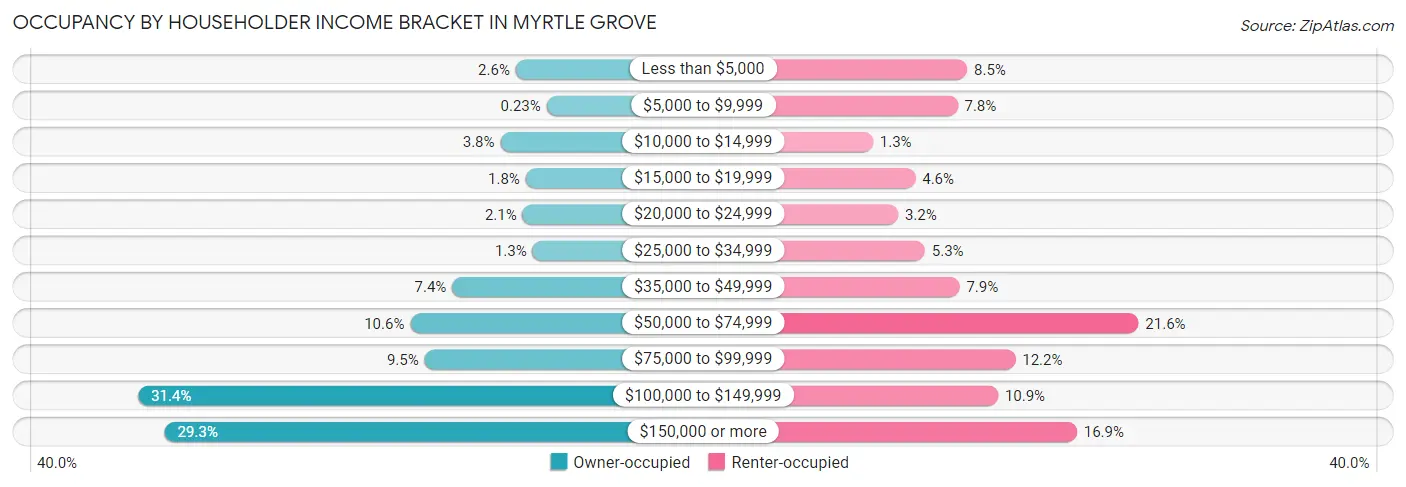
| Income Bracket | Owner-occupied | Renter-occupied |
| Less than $5,000 | 99 (2.6%) | 58 (8.5%) |
| $5,000 to $9,999 | 9 (0.2%) | 53 (7.8%) |
| $10,000 to $14,999 | 144 (3.7%) | 9 (1.3%) |
| $15,000 to $19,999 | 70 (1.8%) | 31 (4.5%) |
| $20,000 to $24,999 | 79 (2.1%) | 22 (3.2%) |
| $25,000 to $34,999 | 50 (1.3%) | 36 (5.3%) |
| $35,000 to $49,999 | 285 (7.4%) | 54 (7.9%) |
| $50,000 to $74,999 | 408 (10.6%) | 147 (21.5%) |
| $75,000 to $99,999 | 366 (9.5%) | 83 (12.2%) |
| $100,000 to $149,999 | 1,204 (31.4%) | 74 (10.8%) |
| $150,000 or more | 1,127 (29.3%) | 115 (16.9%) |
| Total | 3,841 (100.0%) | 682 (100.0%) |
Monthly Housing Cost Tiers in Myrtle Grove
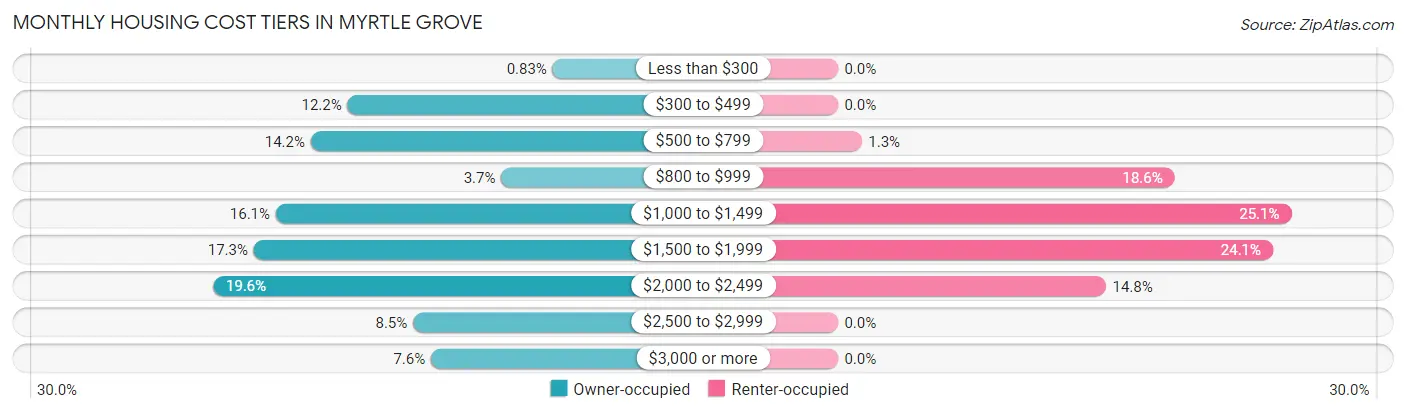
| Monthly Cost | Owner-occupied | Renter-occupied |
| Less than $300 | 32 (0.8%) | 0 (0.0%) |
| $300 to $499 | 467 (12.2%) | 0 (0.0%) |
| $500 to $799 | 545 (14.2%) | 9 (1.3%) |
| $800 to $999 | 141 (3.7%) | 127 (18.6%) |
| $1,000 to $1,499 | 619 (16.1%) | 171 (25.1%) |
| $1,500 to $1,999 | 666 (17.3%) | 164 (24.0%) |
| $2,000 to $2,499 | 753 (19.6%) | 101 (14.8%) |
| $2,500 to $2,999 | 328 (8.5%) | 0 (0.0%) |
| $3,000 or more | 290 (7.5%) | 0 (0.0%) |
| Total | 3,841 (100.0%) | 682 (100.0%) |
Physical Housing Characteristics in Myrtle Grove
Housing Structures in Myrtle Grove
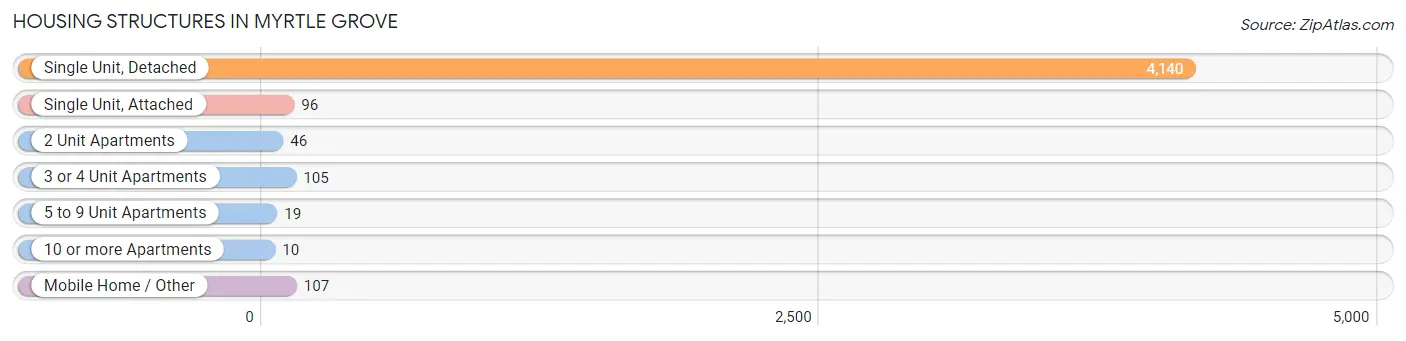
| Structure Type | # Housing Units | % Housing Units |
| Single Unit, Detached | 4,140 | 91.5% |
| Single Unit, Attached | 96 | 2.1% |
| 2 Unit Apartments | 46 | 1.0% |
| 3 or 4 Unit Apartments | 105 | 2.3% |
| 5 to 9 Unit Apartments | 19 | 0.4% |
| 10 or more Apartments | 10 | 0.2% |
| Mobile Home / Other | 107 | 2.4% |
| Total | 4,523 | 100.0% |
Housing Structures by Occupancy in Myrtle Grove
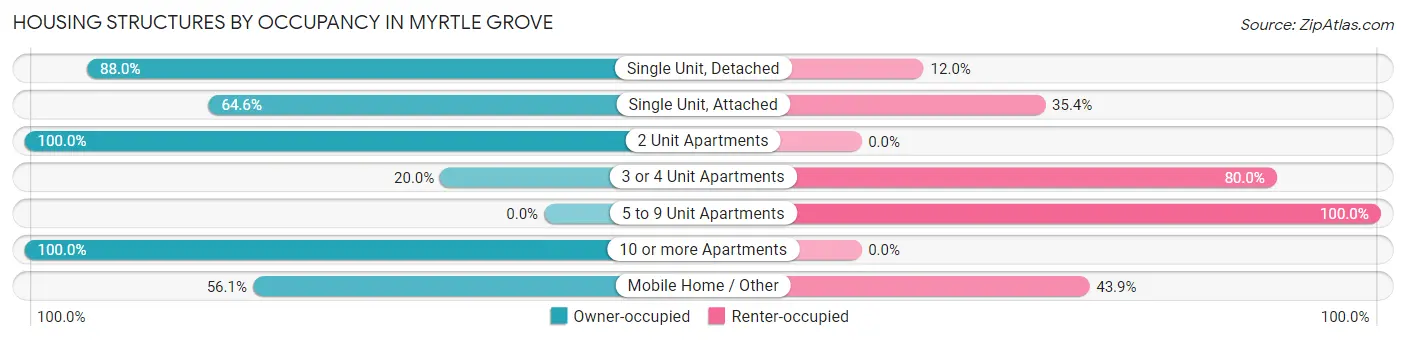
| Structure Type | Owner-occupied | Renter-occupied |
| Single Unit, Detached | 3,642 (88.0%) | 498 (12.0%) |
| Single Unit, Attached | 62 (64.6%) | 34 (35.4%) |
| 2 Unit Apartments | 46 (100.0%) | 0 (0.0%) |
| 3 or 4 Unit Apartments | 21 (20.0%) | 84 (80.0%) |
| 5 to 9 Unit Apartments | 0 (0.0%) | 19 (100.0%) |
| 10 or more Apartments | 10 (100.0%) | 0 (0.0%) |
| Mobile Home / Other | 60 (56.1%) | 47 (43.9%) |
| Total | 3,841 (84.9%) | 682 (15.1%) |
Housing Structures by Number of Rooms in Myrtle Grove
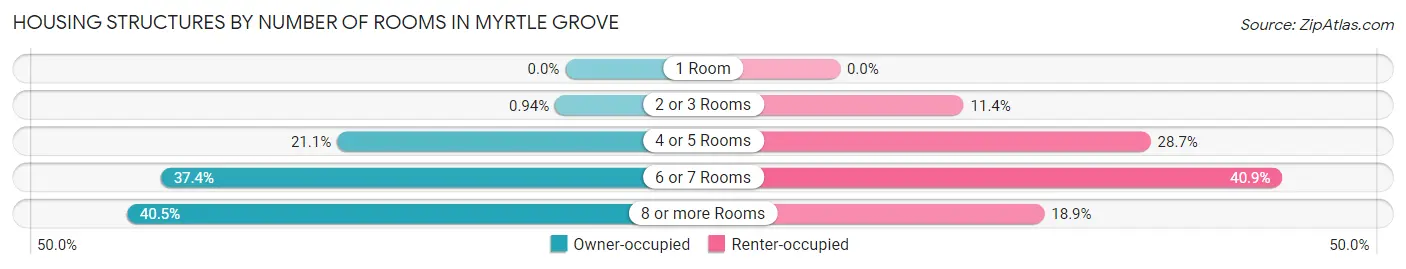
| Number of Rooms | Owner-occupied | Renter-occupied |
| 1 Room | 0 (0.0%) | 0 (0.0%) |
| 2 or 3 Rooms | 36 (0.9%) | 78 (11.4%) |
| 4 or 5 Rooms | 811 (21.1%) | 196 (28.7%) |
| 6 or 7 Rooms | 1,437 (37.4%) | 279 (40.9%) |
| 8 or more Rooms | 1,557 (40.5%) | 129 (18.9%) |
| Total | 3,841 (100.0%) | 682 (100.0%) |
Housing Structure by Heating Type in Myrtle Grove
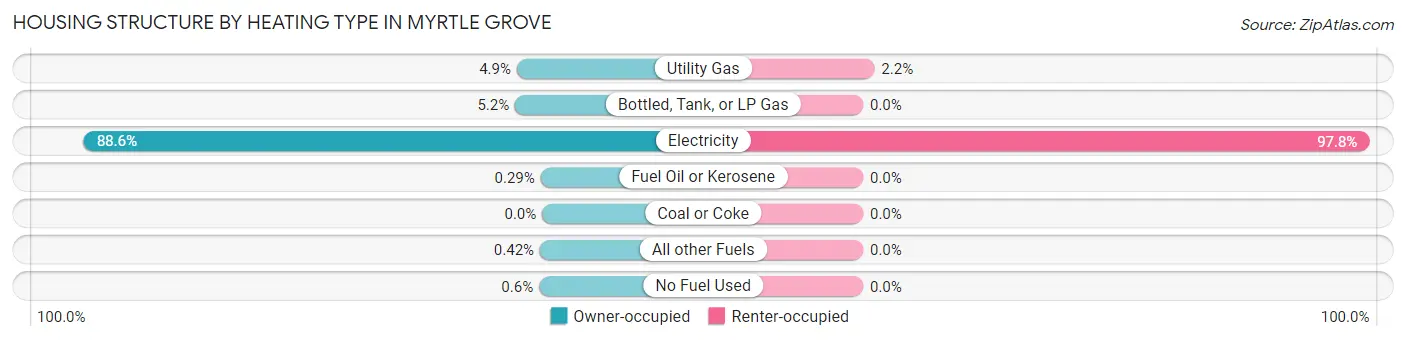
| Heating Type | Owner-occupied | Renter-occupied |
| Utility Gas | 188 (4.9%) | 15 (2.2%) |
| Bottled, Tank, or LP Gas | 201 (5.2%) | 0 (0.0%) |
| Electricity | 3,402 (88.6%) | 667 (97.8%) |
| Fuel Oil or Kerosene | 11 (0.3%) | 0 (0.0%) |
| Coal or Coke | 0 (0.0%) | 0 (0.0%) |
| All other Fuels | 16 (0.4%) | 0 (0.0%) |
| No Fuel Used | 23 (0.6%) | 0 (0.0%) |
| Total | 3,841 (100.0%) | 682 (100.0%) |
Household Vehicle Usage in Myrtle Grove
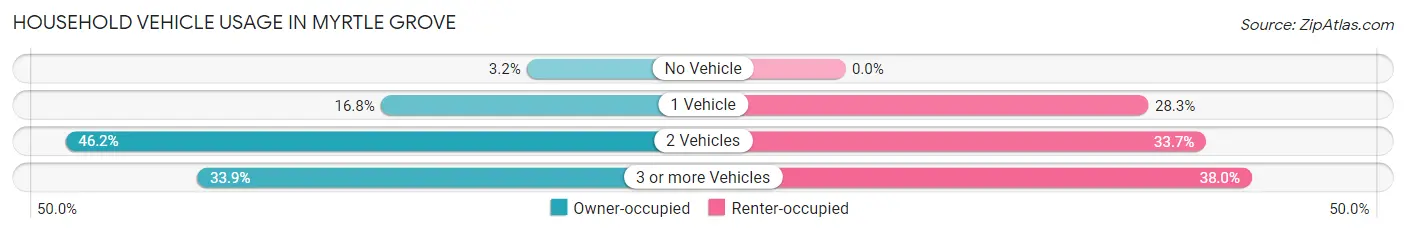
| Vehicles per Household | Owner-occupied | Renter-occupied |
| No Vehicle | 121 (3.2%) | 0 (0.0%) |
| 1 Vehicle | 644 (16.8%) | 193 (28.3%) |
| 2 Vehicles | 1,774 (46.2%) | 230 (33.7%) |
| 3 or more Vehicles | 1,302 (33.9%) | 259 (38.0%) |
| Total | 3,841 (100.0%) | 682 (100.0%) |
Real Estate & Mortgages in Myrtle Grove
Real Estate and Mortgage Overview in Myrtle Grove
| Characteristic | Without Mortgage | With Mortgage |
| Housing Units | 1,128 | 2,713 |
| Median Property Value | $318,900 | $383,300 |
| Median Household Income | $61,250 | $987 |
| Monthly Housing Costs | $543 | $290 |
| Real Estate Taxes | $1,667 | $32 |
Property Value by Mortgage Status in Myrtle Grove
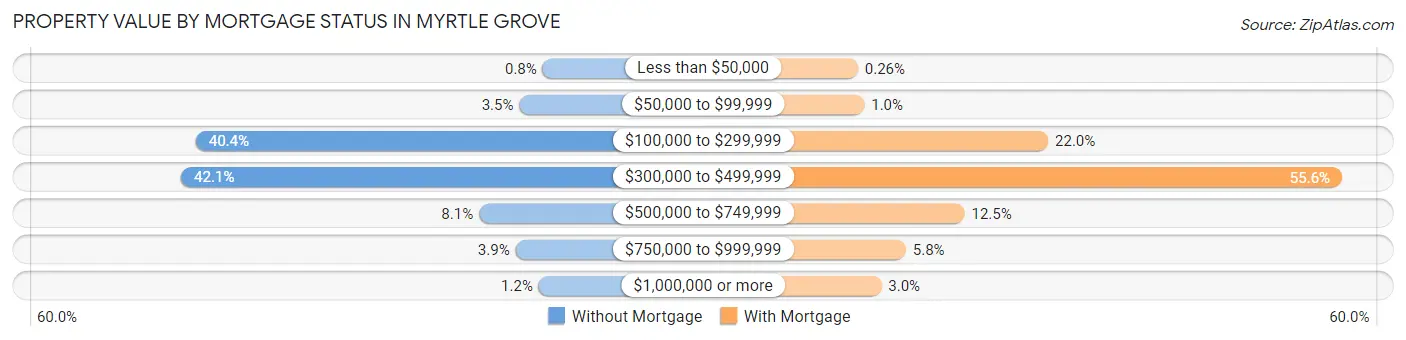
| Property Value | Without Mortgage | With Mortgage |
| Less than $50,000 | 9 (0.8%) | 7 (0.3%) |
| $50,000 to $99,999 | 39 (3.5%) | 27 (1.0%) |
| $100,000 to $299,999 | 456 (40.4%) | 597 (22.0%) |
| $300,000 to $499,999 | 475 (42.1%) | 1,508 (55.6%) |
| $500,000 to $749,999 | 91 (8.1%) | 338 (12.5%) |
| $750,000 to $999,999 | 44 (3.9%) | 156 (5.8%) |
| $1,000,000 or more | 14 (1.2%) | 80 (2.9%) |
| Total | 1,128 (100.0%) | 2,713 (100.0%) |
Household Income by Mortgage Status in Myrtle Grove
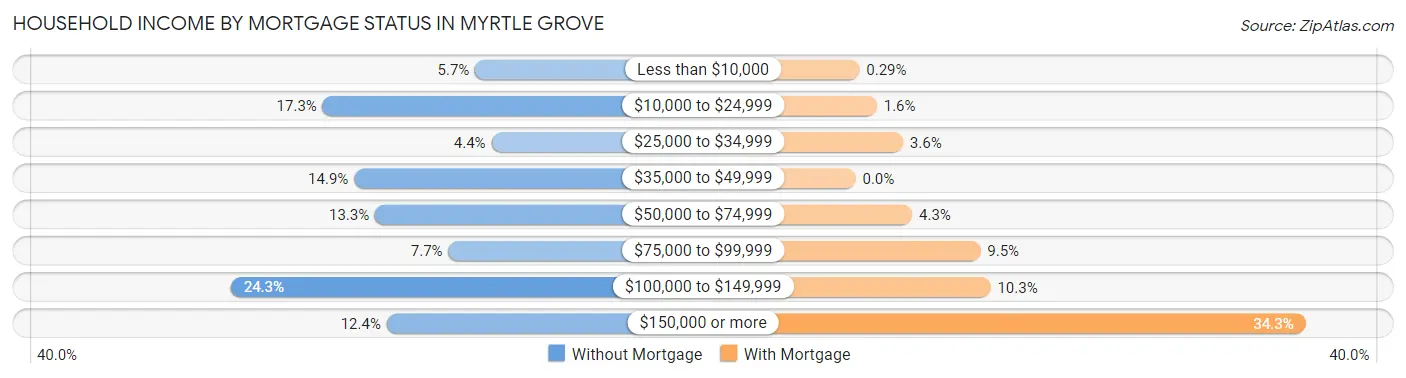
| Household Income | Without Mortgage | With Mortgage |
| Less than $10,000 | 64 (5.7%) | 8 (0.3%) |
| $10,000 to $24,999 | 195 (17.3%) | 44 (1.6%) |
| $25,000 to $34,999 | 50 (4.4%) | 98 (3.6%) |
| $35,000 to $49,999 | 168 (14.9%) | 0 (0.0%) |
| $50,000 to $74,999 | 150 (13.3%) | 117 (4.3%) |
| $75,000 to $99,999 | 87 (7.7%) | 258 (9.5%) |
| $100,000 to $149,999 | 274 (24.3%) | 279 (10.3%) |
| $150,000 or more | 140 (12.4%) | 930 (34.3%) |
| Total | 1,128 (100.0%) | 2,713 (100.0%) |
Property Value to Household Income Ratio in Myrtle Grove
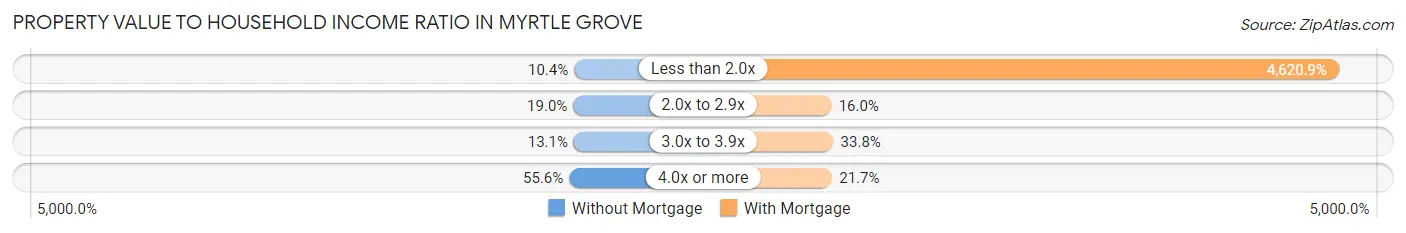
| Value-to-Income Ratio | Without Mortgage | With Mortgage |
| Less than 2.0x | 117 (10.4%) | 125,365 (4,620.9%) |
| 2.0x to 2.9x | 214 (19.0%) | 435 (16.0%) |
| 3.0x to 3.9x | 148 (13.1%) | 916 (33.8%) |
| 4.0x or more | 627 (55.6%) | 588 (21.7%) |
| Total | 1,128 (100.0%) | 2,713 (100.0%) |
Real Estate Taxes by Mortgage Status in Myrtle Grove
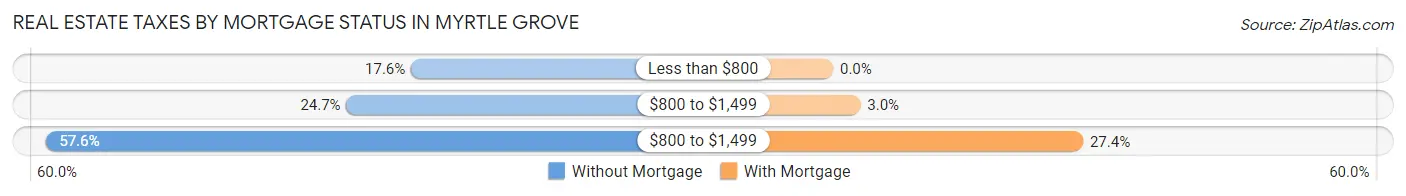
| Property Taxes | Without Mortgage | With Mortgage |
| Less than $800 | 199 (17.6%) | 0 (0.0%) |
| $800 to $1,499 | 279 (24.7%) | 81 (3.0%) |
| $800 to $1,499 | 650 (57.6%) | 743 (27.4%) |
| Total | 1,128 (100.0%) | 2,713 (100.0%) |
Health & Disability in Myrtle Grove
Health Insurance Coverage by Age in Myrtle Grove
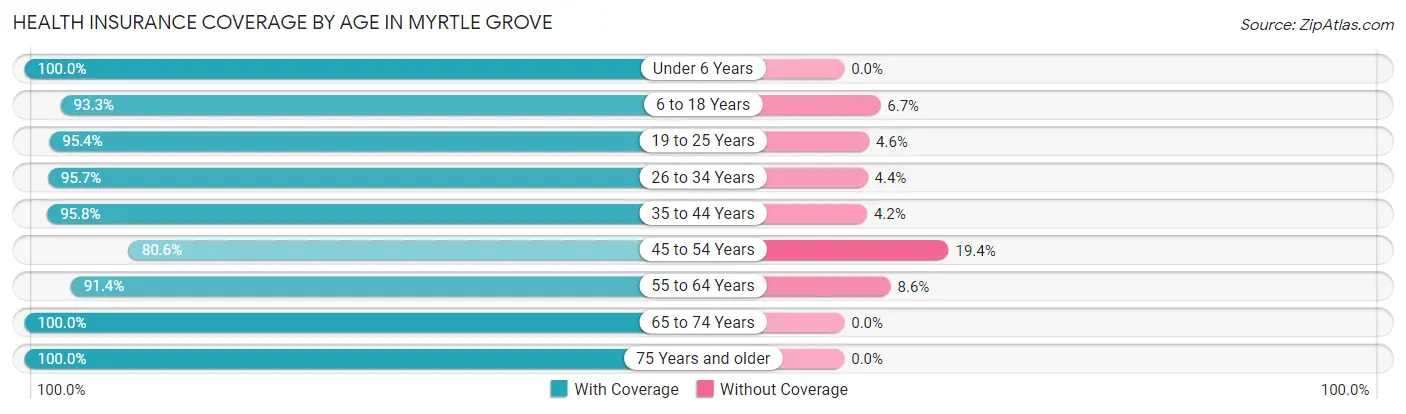
| Age Bracket | With Coverage | Without Coverage |
| Under 6 Years | 826 (100.0%) | 0 (0.0%) |
| 6 to 18 Years | 2,230 (93.3%) | 161 (6.7%) |
| 19 to 25 Years | 434 (95.4%) | 21 (4.6%) |
| 26 to 34 Years | 703 (95.7%) | 32 (4.3%) |
| 35 to 44 Years | 2,014 (95.8%) | 89 (4.2%) |
| 45 to 54 Years | 1,384 (80.6%) | 334 (19.4%) |
| 55 to 64 Years | 1,536 (91.4%) | 145 (8.6%) |
| 65 to 74 Years | 1,310 (100.0%) | 0 (0.0%) |
| 75 Years and older | 648 (100.0%) | 0 (0.0%) |
| Total | 11,085 (93.4%) | 782 (6.6%) |
Health Insurance Coverage by Citizenship Status in Myrtle Grove
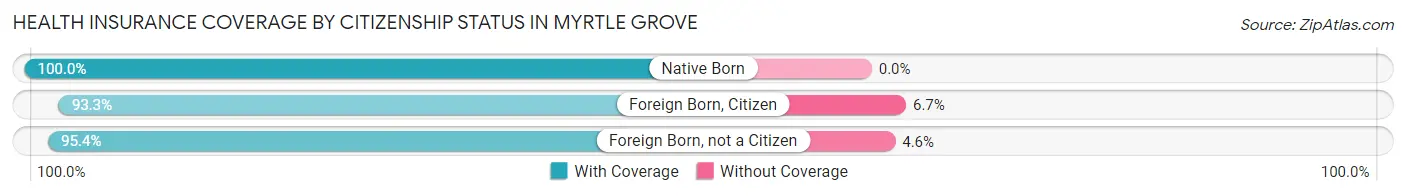
| Citizenship Status | With Coverage | Without Coverage |
| Native Born | 826 (100.0%) | 0 (0.0%) |
| Foreign Born, Citizen | 2,230 (93.3%) | 161 (6.7%) |
| Foreign Born, not a Citizen | 434 (95.4%) | 21 (4.6%) |
Health Insurance Coverage by Household Income in Myrtle Grove
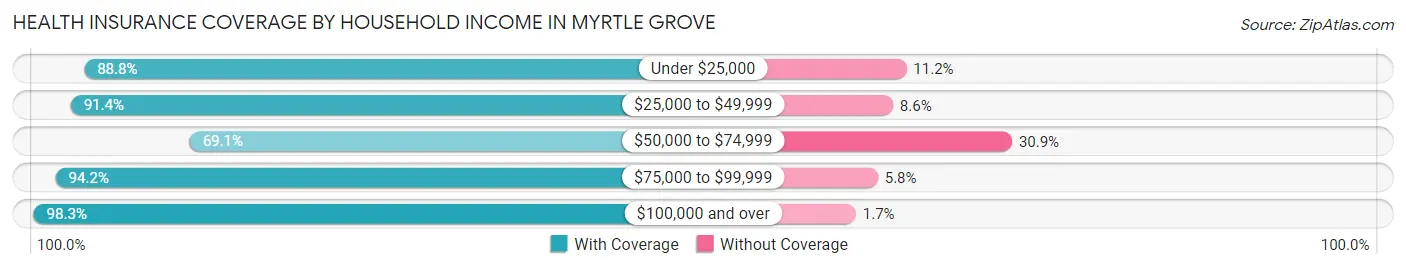
| Household Income | With Coverage | Without Coverage |
| Under $25,000 | 700 (88.8%) | 88 (11.2%) |
| $25,000 to $49,999 | 825 (91.4%) | 78 (8.6%) |
| $50,000 to $74,999 | 942 (69.1%) | 422 (30.9%) |
| $75,000 to $99,999 | 1,022 (94.2%) | 63 (5.8%) |
| $100,000 and over | 7,588 (98.3%) | 131 (1.7%) |
Public vs Private Health Insurance Coverage by Age in Myrtle Grove
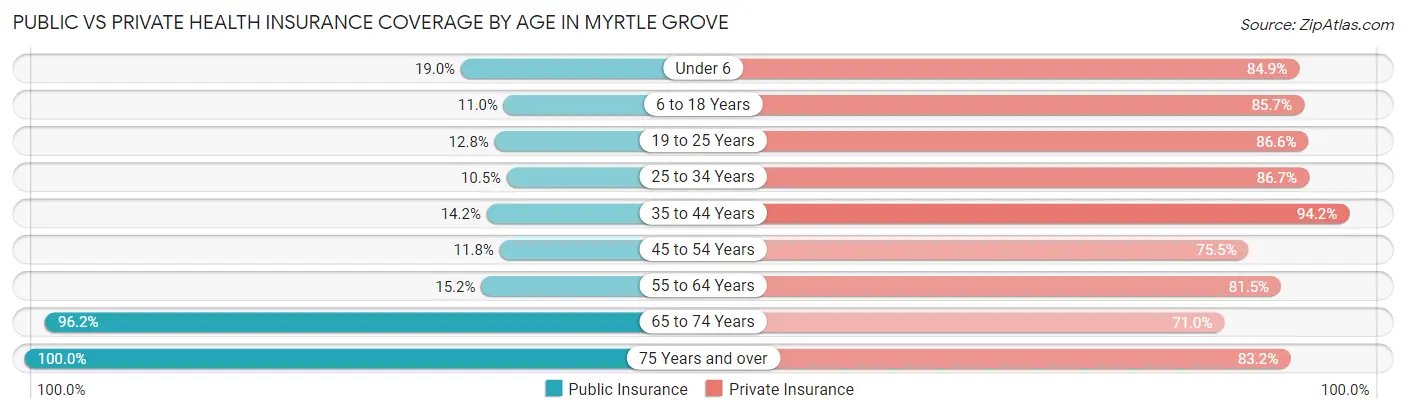
| Age Bracket | Public Insurance | Private Insurance |
| Under 6 | 157 (19.0%) | 701 (84.9%) |
| 6 to 18 Years | 264 (11.0%) | 2,050 (85.7%) |
| 19 to 25 Years | 58 (12.8%) | 394 (86.6%) |
| 25 to 34 Years | 77 (10.5%) | 637 (86.7%) |
| 35 to 44 Years | 299 (14.2%) | 1,980 (94.2%) |
| 45 to 54 Years | 203 (11.8%) | 1,297 (75.5%) |
| 55 to 64 Years | 256 (15.2%) | 1,370 (81.5%) |
| 65 to 74 Years | 1,260 (96.2%) | 930 (71.0%) |
| 75 Years and over | 648 (100.0%) | 539 (83.2%) |
| Total | 3,222 (27.2%) | 9,898 (83.4%) |
Disability Status by Sex by Age in Myrtle Grove
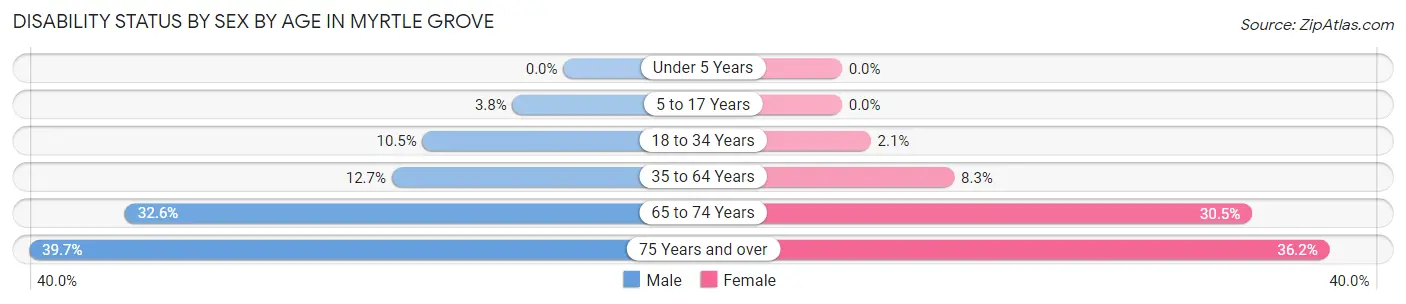
| Age Bracket | Male | Female |
| Under 5 Years | 0 (0.0%) | 0 (0.0%) |
| 5 to 17 Years | 42 (3.8%) | 0 (0.0%) |
| 18 to 34 Years | 91 (10.4%) | 12 (2.1%) |
| 35 to 64 Years | 307 (12.7%) | 258 (8.3%) |
| 65 to 74 Years | 234 (32.6%) | 180 (30.5%) |
| 75 Years and over | 119 (39.7%) | 126 (36.2%) |
Disability Class by Sex by Age in Myrtle Grove
Disability Class: Hearing Difficulty
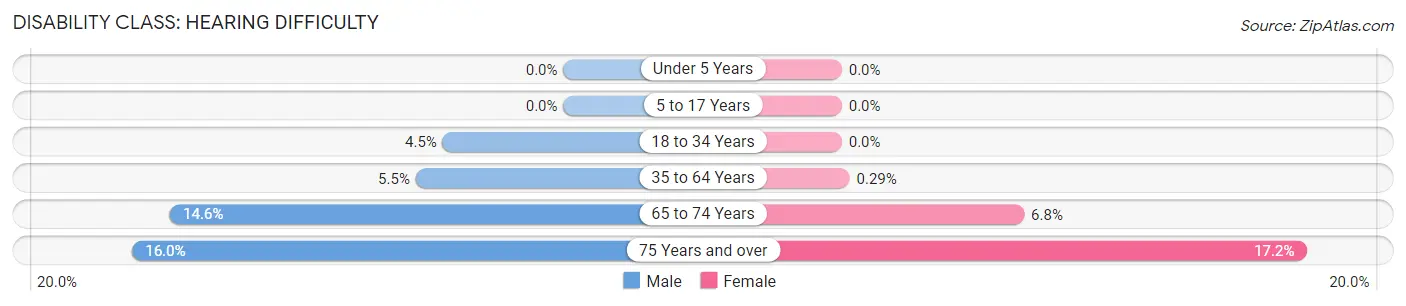
| Age Bracket | Male | Female |
| Under 5 Years | 0 (0.0%) | 0 (0.0%) |
| 5 to 17 Years | 0 (0.0%) | 0 (0.0%) |
| 18 to 34 Years | 39 (4.5%) | 0 (0.0%) |
| 35 to 64 Years | 132 (5.5%) | 9 (0.3%) |
| 65 to 74 Years | 105 (14.6%) | 40 (6.8%) |
| 75 Years and over | 48 (16.0%) | 60 (17.2%) |
Disability Class: Vision Difficulty
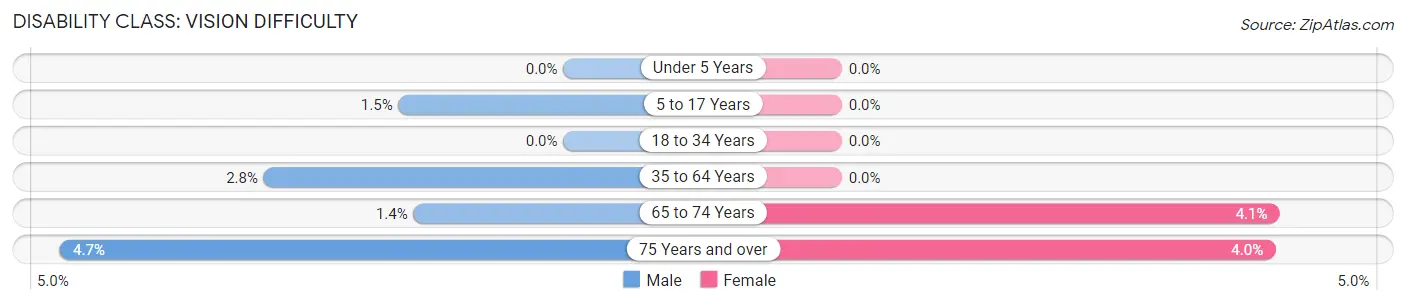
| Age Bracket | Male | Female |
| Under 5 Years | 0 (0.0%) | 0 (0.0%) |
| 5 to 17 Years | 17 (1.5%) | 0 (0.0%) |
| 18 to 34 Years | 0 (0.0%) | 0 (0.0%) |
| 35 to 64 Years | 67 (2.8%) | 0 (0.0%) |
| 65 to 74 Years | 10 (1.4%) | 24 (4.1%) |
| 75 Years and over | 14 (4.7%) | 14 (4.0%) |
Disability Class: Cognitive Difficulty
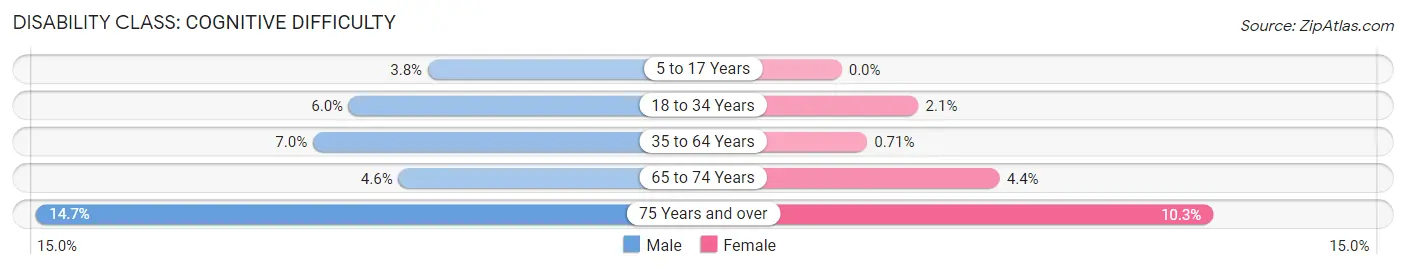
| Age Bracket | Male | Female |
| 5 to 17 Years | 42 (3.8%) | 0 (0.0%) |
| 18 to 34 Years | 52 (6.0%) | 12 (2.1%) |
| 35 to 64 Years | 168 (7.0%) | 22 (0.7%) |
| 65 to 74 Years | 33 (4.6%) | 26 (4.4%) |
| 75 Years and over | 44 (14.7%) | 36 (10.3%) |
Disability Class: Ambulatory Difficulty
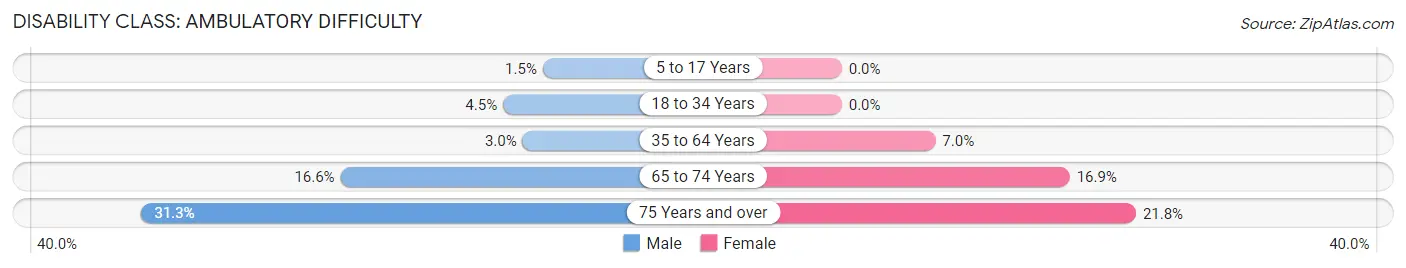
| Age Bracket | Male | Female |
| 5 to 17 Years | 17 (1.5%) | 0 (0.0%) |
| 18 to 34 Years | 39 (4.5%) | 0 (0.0%) |
| 35 to 64 Years | 73 (3.0%) | 215 (7.0%) |
| 65 to 74 Years | 119 (16.6%) | 100 (16.9%) |
| 75 Years and over | 94 (31.3%) | 76 (21.8%) |
Disability Class: Self-Care Difficulty

| Age Bracket | Male | Female |
| 5 to 17 Years | 35 (3.1%) | 0 (0.0%) |
| 18 to 34 Years | 1 (0.1%) | 0 (0.0%) |
| 35 to 64 Years | 50 (2.1%) | 0 (0.0%) |
| 65 to 74 Years | 120 (16.7%) | 91 (15.4%) |
| 75 Years and over | 20 (6.7%) | 1 (0.3%) |
Technology Access in Myrtle Grove
Computing Device Access in Myrtle Grove
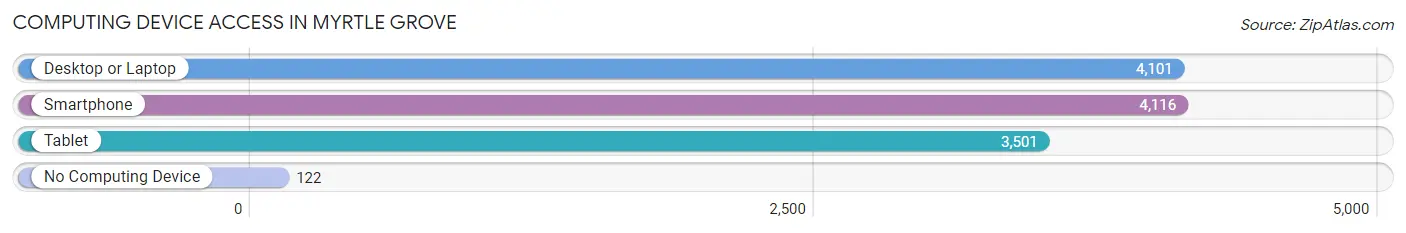
| Device Type | # Households | % Households |
| Desktop or Laptop | 4,101 | 90.7% |
| Smartphone | 4,116 | 91.0% |
| Tablet | 3,501 | 77.4% |
| No Computing Device | 122 | 2.7% |
| Total | 4,523 | 100.0% |
Internet Access in Myrtle Grove
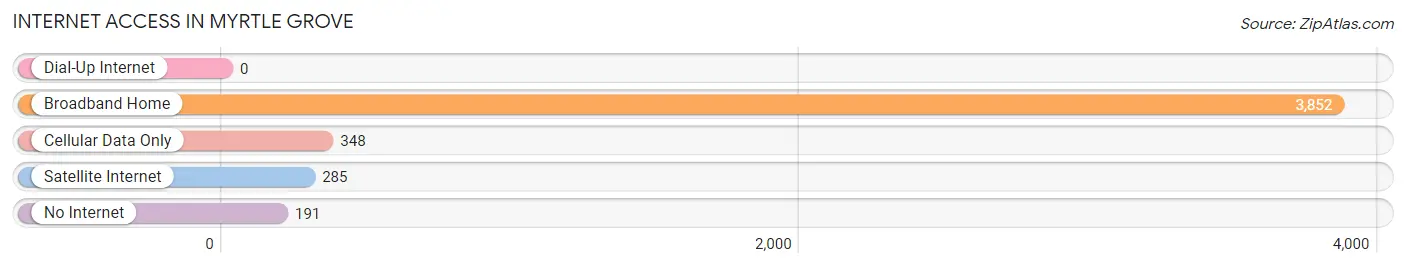
| Internet Type | # Households | % Households |
| Dial-Up Internet | 0 | 0.0% |
| Broadband Home | 3,852 | 85.2% |
| Cellular Data Only | 348 | 7.7% |
| Satellite Internet | 285 | 6.3% |
| No Internet | 191 | 4.2% |
| Total | 4,523 | 100.0% |
Myrtle Grove Summary
Myrtle Grove is a small unincorporated community located in New Hanover County, North Carolina. It is situated on the banks of the Cape Fear River, just south of Wilmington. The community is part of the Wilmington Metropolitan Statistical Area and is home to approximately 2,000 people.
History
Myrtle Grove was first settled in the late 1700s by a group of settlers from Scotland. The community was named after the abundance of myrtle trees that grew in the area. The settlers built a small church and a few homes, and the community slowly grew. In the early 1800s, the community was home to a number of small farms and businesses.
In the late 1800s, the community began to grow rapidly as the railroad was built through the area. This allowed for the transportation of goods and people, and the community began to thrive. The railroad also brought new businesses to the area, including a sawmill, a gristmill, and a cotton gin.
In the early 1900s, the community was home to a number of small businesses, including a general store, a post office, and a blacksmith shop. The community also had a school, a church, and a number of other businesses.
Geography
Myrtle Grove is located in New Hanover County, North Carolina. It is situated on the banks of the Cape Fear River, just south of Wilmington. The community is part of the Wilmington Metropolitan Statistical Area and is home to approximately 2,000 people.
The community is located in a rural area and is surrounded by forests and farmland. The climate in the area is mild, with temperatures ranging from the mid-50s in the winter to the mid-80s in the summer.
Economy
Myrtle Grove is a small, rural community with a limited economy. The primary industries in the area are agriculture and tourism. The community is home to a number of small farms, which produce a variety of crops, including corn, soybeans, and cotton.
The community is also home to a number of small businesses, including a general store, a post office, and a blacksmith shop. The community also has a number of restaurants and other small businesses.
Demographics
As of the 2010 census, the population of Myrtle Grove was 2,000. The racial makeup of the community was 94.2% White, 2.2% African American, 0.7% Native American, 0.7% Asian, 0.2% Pacific Islander, and 1.9% from other races. The median household income in the community was $37,500.
Conclusion
Myrtle Grove is a small, rural community located in New Hanover County, North Carolina. It is situated on the banks of the Cape Fear River, just south of Wilmington. The community is part of the Wilmington Metropolitan Statistical Area and is home to approximately 2,000 people. The primary industries in the area are agriculture and tourism. The community is home to a number of small farms, which produce a variety of crops, including corn, soybeans, and cotton. The racial makeup of the community is 94.2% White, 2.2% African American, 0.7% Native American, 0.7% Asian, 0.2% Pacific Islander, and 1.9% from other races. The median household income in the community was $37,500.
Common Questions
What is Per Capita Income in Myrtle Grove?
Per Capita income in Myrtle Grove is $46,823.
What is the Median Family Income in Myrtle Grove?
Median Family Income in Myrtle Grove is $117,789.
What is the Median Household income in Myrtle Grove?
Median Household Income in Myrtle Grove is $108,363.
What is Income or Wage Gap in Myrtle Grove?
Income or Wage Gap in Myrtle Grove is 24.4%.
Women in Myrtle Grove earn 75.6 cents for every dollar earned by a man.
What is Inequality or Gini Index in Myrtle Grove?
Inequality or Gini Index in Myrtle Grove is 0.42.
What is the Total Population of Myrtle Grove?
Total Population of Myrtle Grove is 12,093.
What is the Total Male Population of Myrtle Grove?
Total Male Population of Myrtle Grove is 5,891.
What is the Total Female Population of Myrtle Grove?
Total Female Population of Myrtle Grove is 6,202.
What is the Ratio of Males per 100 Females in Myrtle Grove?
There are 94.99 Males per 100 Females in Myrtle Grove.
What is the Ratio of Females per 100 Males in Myrtle Grove?
There are 105.28 Females per 100 Males in Myrtle Grove.
What is the Median Population Age in Myrtle Grove?
Median Population Age in Myrtle Grove is 41.9 Years.
What is the Average Family Size in Myrtle Grove
Average Family Size in Myrtle Grove is 3.0 People.
What is the Average Household Size in Myrtle Grove
Average Household Size in Myrtle Grove is 2.6 People.
How Large is the Labor Force in Myrtle Grove?
There are 5,677 People in the Labor Forcein in Myrtle Grove.
What is the Percentage of People in the Labor Force in Myrtle Grove?
60.7% of People are in the Labor Force in Myrtle Grove.
What is the Unemployment Rate in Myrtle Grove?
Unemployment Rate in Myrtle Grove is 4.3%.