Lake Santeetlah, NC Map & Demographics
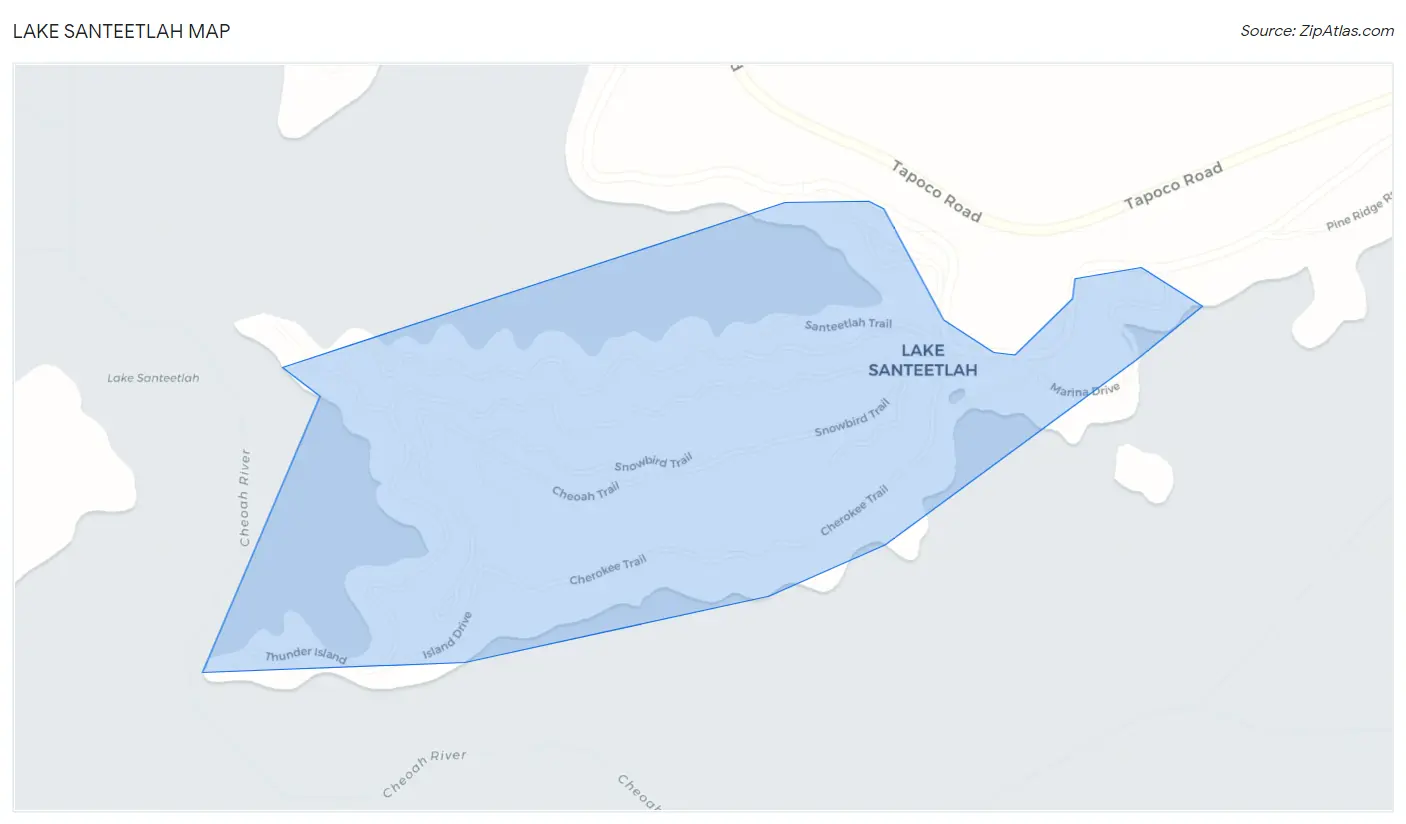
Lake Santeetlah Map
Lake Santeetlah Overview
$31,126
PER CAPITA INCOME
$113,625
AVG FAMILY INCOME
$112,750
AVG HOUSEHOLD INCOME
0.31
INEQUALITY / GINI INDEX
121
TOTAL POPULATION
47
MALE POPULATION
74
FEMALE POPULATION
63.51
MALES / 100 FEMALES
157.45
FEMALES / 100 MALES
49.5
MEDIAN AGE
3.9
AVG FAMILY SIZE
3.4
AVG HOUSEHOLD SIZE
25
LABOR FORCE [ PEOPLE ]
23.6%
PERCENT IN LABOR FORCE
Lake Santeetlah Area Codes
Income in Lake Santeetlah
Income Overview in Lake Santeetlah
Per Capita Income in Lake Santeetlah is $31,126, while median incomes of families and households are $113,625 and $112,750 respectively.
| Characteristic | Number | Measure |
| Per Capita Income | 121 | $31,126 |
| Median Family Income | 29 | $113,625 |
| Mean Family Income | 29 | $126,848 |
| Median Household Income | 36 | $112,750 |
| Mean Household Income | 36 | $108,792 |
| Income Deficit | 29 | $0 |
| Wage / Income Gap (%) | 121 | 0.00% |
| Wage / Income Gap ($) | 121 | 100.00¢ per $1 |
| Gini / Inequality Index | 121 | 0.31 |
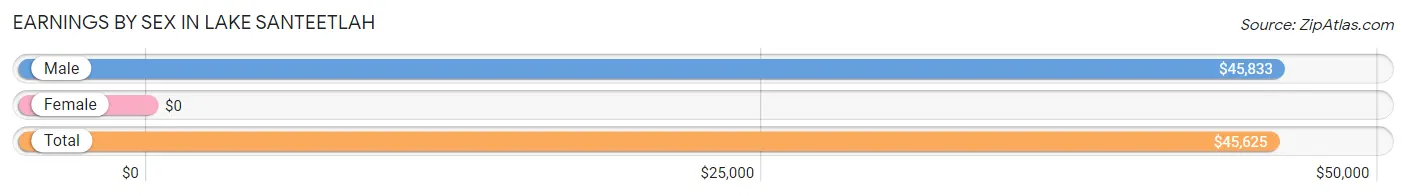
Earnings by Sex in Lake Santeetlah
| Sex | Number | Average Earnings |
| Male | 16 (51.6%) | $45,833 |
| Female | 15 (48.4%) | $0 |
| Total | 31 (100.0%) | $45,625 |
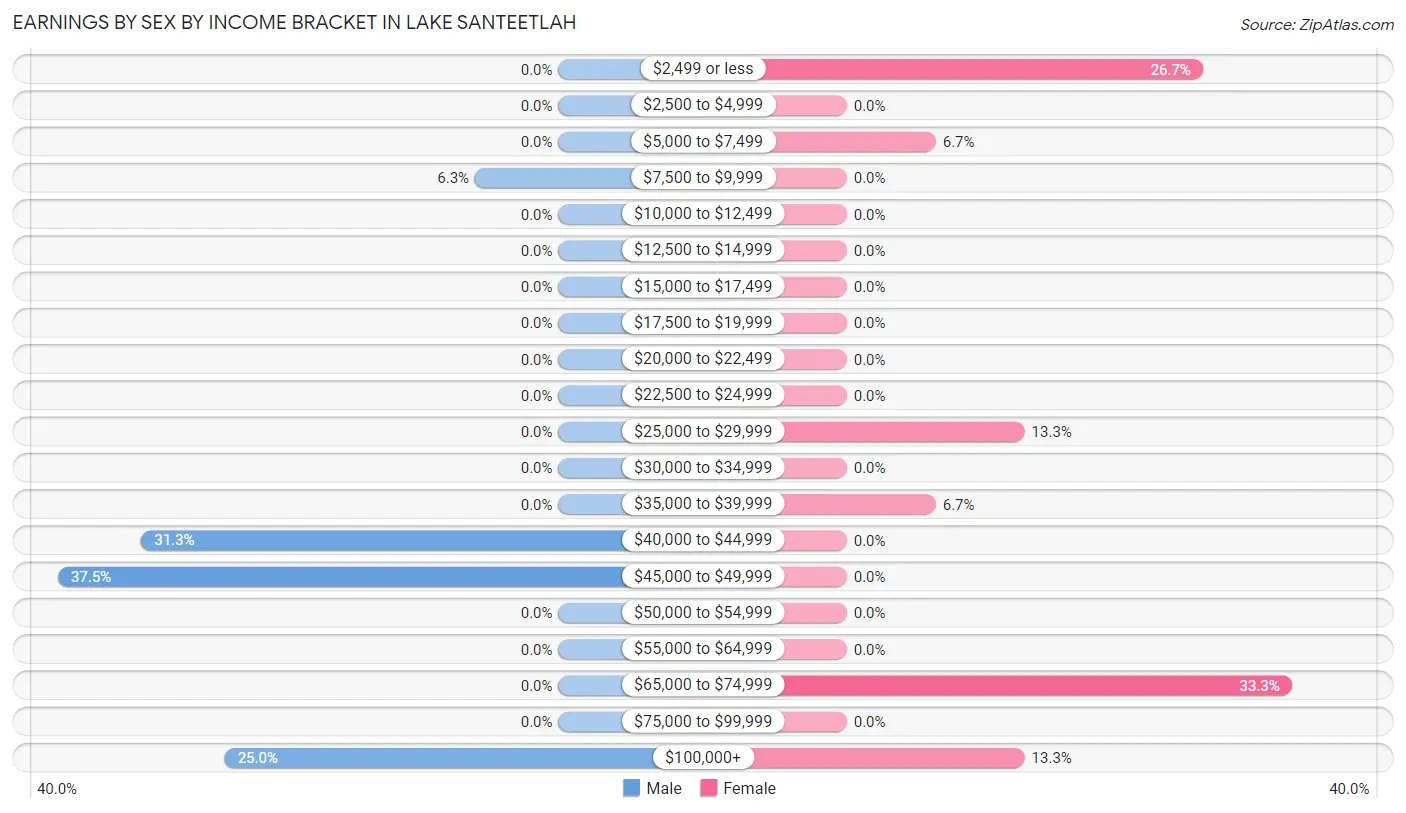
Earnings by Sex by Income Bracket in Lake Santeetlah
The most common earnings brackets in Lake Santeetlah are $45,000 to $49,999 for men (6 | 37.5%) and $65,000 to $74,999 for women (5 | 33.3%).
| Income | Male | Female |
| $2,499 or less | 0 (0.0%) | 4 (26.7%) |
| $2,500 to $4,999 | 0 (0.0%) | 0 (0.0%) |
| $5,000 to $7,499 | 0 (0.0%) | 1 (6.7%) |
| $7,500 to $9,999 | 1 (6.2%) | 0 (0.0%) |
| $10,000 to $12,499 | 0 (0.0%) | 0 (0.0%) |
| $12,500 to $14,999 | 0 (0.0%) | 0 (0.0%) |
| $15,000 to $17,499 | 0 (0.0%) | 0 (0.0%) |
| $17,500 to $19,999 | 0 (0.0%) | 0 (0.0%) |
| $20,000 to $22,499 | 0 (0.0%) | 0 (0.0%) |
| $22,500 to $24,999 | 0 (0.0%) | 0 (0.0%) |
| $25,000 to $29,999 | 0 (0.0%) | 2 (13.3%) |
| $30,000 to $34,999 | 0 (0.0%) | 0 (0.0%) |
| $35,000 to $39,999 | 0 (0.0%) | 1 (6.7%) |
| $40,000 to $44,999 | 5 (31.2%) | 0 (0.0%) |
| $45,000 to $49,999 | 6 (37.5%) | 0 (0.0%) |
| $50,000 to $54,999 | 0 (0.0%) | 0 (0.0%) |
| $55,000 to $64,999 | 0 (0.0%) | 0 (0.0%) |
| $65,000 to $74,999 | 0 (0.0%) | 5 (33.3%) |
| $75,000 to $99,999 | 0 (0.0%) | 0 (0.0%) |
| $100,000+ | 4 (25.0%) | 2 (13.3%) |
| Total | 16 (100.0%) | 15 (100.0%) |
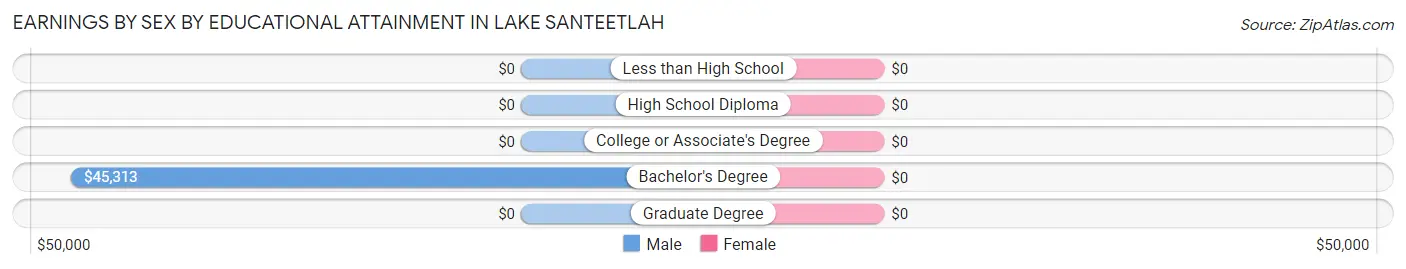
Earnings by Sex by Educational Attainment in Lake Santeetlah
| Educational Attainment | Male Income | Female Income |
| Less than High School | - | - |
| High School Diploma | - | - |
| College or Associate's Degree | - | - |
| Bachelor's Degree | $45,313 | $0 |
| Graduate Degree | - | - |
| Total | $45,833 | $68,250 |
Family Income in Lake Santeetlah
Family Income Brackets in Lake Santeetlah
According to the Lake Santeetlah family income data, there are 19 families falling into the $100,000 to $149,999 income range, which is the most common income bracket and makes up 65.5% of all families.
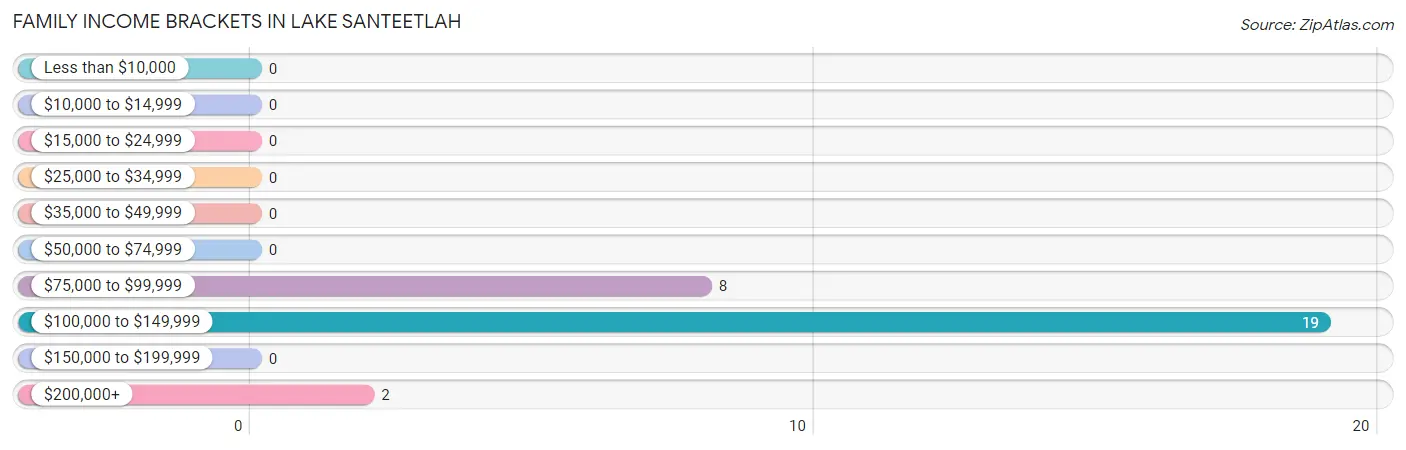
| Income Bracket | # Families | % Families |
| Less than $10,000 | 0 | 0.0% |
| $10,000 to $14,999 | 0 | 0.0% |
| $15,000 to $24,999 | 0 | 0.0% |
| $25,000 to $34,999 | 0 | 0.0% |
| $35,000 to $49,999 | 0 | 0.0% |
| $50,000 to $74,999 | 0 | 0.0% |
| $75,000 to $99,999 | 8 | 27.6% |
| $100,000 to $149,999 | 19 | 65.5% |
| $150,000 to $199,999 | 0 | 0.0% |
| $200,000+ | 2 | 6.9% |
Family Income by Famaliy Size in Lake Santeetlah
2-person families (20 | 69.0%) account for the highest median family income in Lake Santeetlah with $114,500 per family, while 2-person families (20 | 69.0%) have the highest median income of $57,250 per family member.
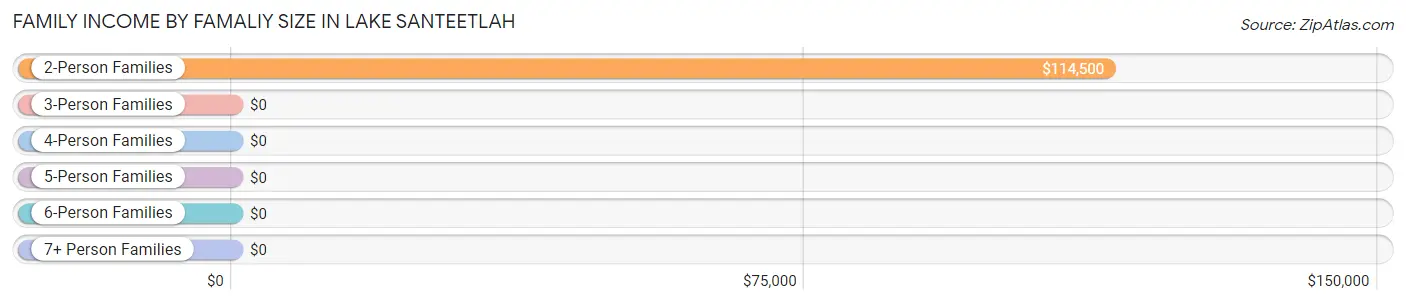
| Income Bracket | # Families | Median Income |
| 2-Person Families | 20 (69.0%) | $114,500 |
| 3-Person Families | 0 (0.0%) | $0 |
| 4-Person Families | 5 (17.2%) | $0 |
| 5-Person Families | 0 (0.0%) | $0 |
| 6-Person Families | 0 (0.0%) | $0 |
| 7+ Person Families | 4 (13.8%) | $0 |
| Total | 29 (100.0%) | $113,625 |
Family Income by Number of Earners in Lake Santeetlah
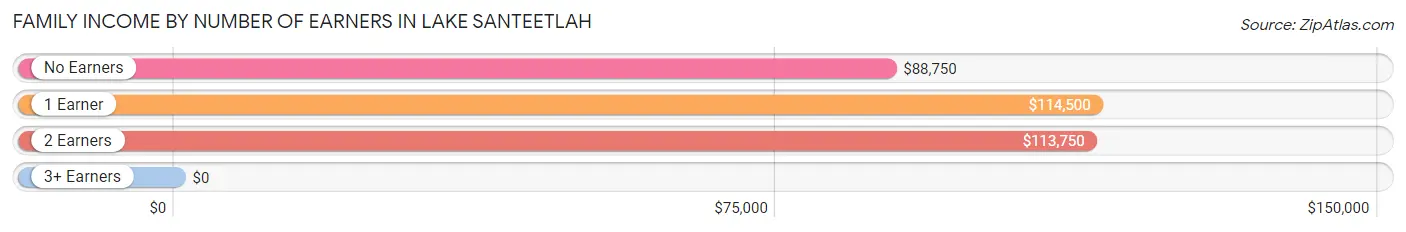
| Number of Earners | # Families | Median Income |
| No Earners | 8 (27.6%) | $88,750 |
| 1 Earner | 8 (27.6%) | $114,500 |
| 2 Earners | 13 (44.8%) | $113,750 |
| 3+ Earners | 0 (0.0%) | $0 |
| Total | 29 (100.0%) | $113,625 |
Household Income in Lake Santeetlah
Household Income Brackets in Lake Santeetlah
With 19 households falling in the category, the $100,000 to $149,999 income range is the most frequent in Lake Santeetlah, accounting for 52.8% of all households.
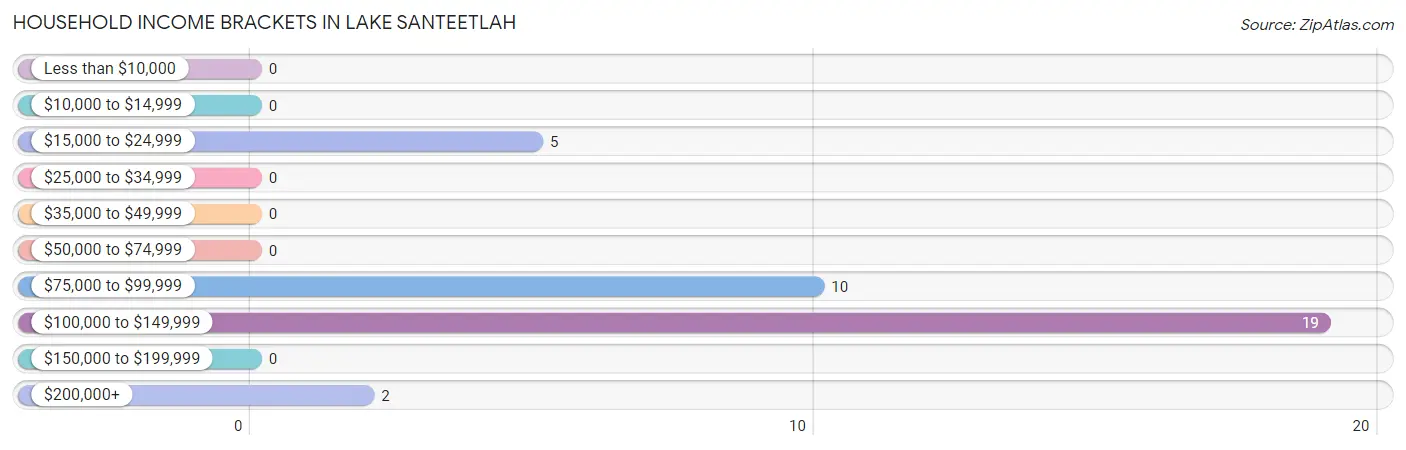
| Income Bracket | # Households | % Households |
| Less than $10,000 | 0 | 0.0% |
| $10,000 to $14,999 | 0 | 0.0% |
| $15,000 to $24,999 | 5 | 13.9% |
| $25,000 to $34,999 | 0 | 0.0% |
| $35,000 to $49,999 | 0 | 0.0% |
| $50,000 to $74,999 | 0 | 0.0% |
| $75,000 to $99,999 | 10 | 27.8% |
| $100,000 to $149,999 | 19 | 52.8% |
| $150,000 to $199,999 | 0 | 0.0% |
| $200,000+ | 2 | 5.6% |
Household Income by Householder Age in Lake Santeetlah
The median household income in Lake Santeetlah is $112,750, with the highest median household income of $101,250 found in the 45 to 64 years age bracket for the primary householder. A total of 10 households (27.8%) fall into this category.
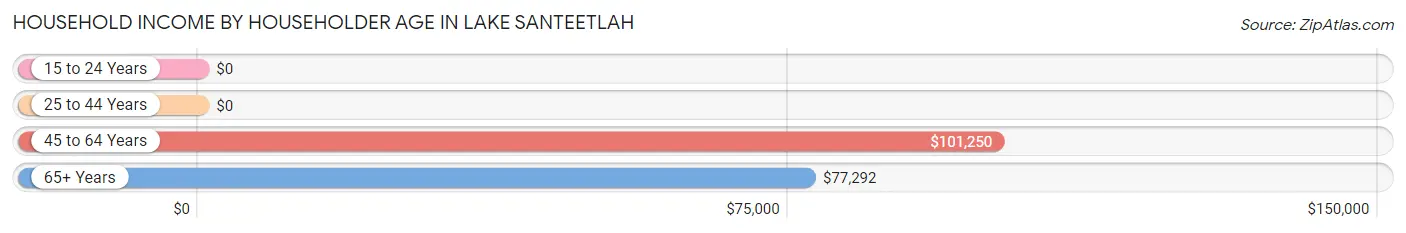
| Income Bracket | # Households | Median Income |
| 15 to 24 Years | 0 (0.0%) | $0 |
| 25 to 44 Years | 5 (13.9%) | $0 |
| 45 to 64 Years | 10 (27.8%) | $101,250 |
| 65+ Years | 21 (58.3%) | $77,292 |
| Total | 36 (100.0%) | $112,750 |
Poverty in Lake Santeetlah
Income Below Poverty by Sex and Age in Lake Santeetlah
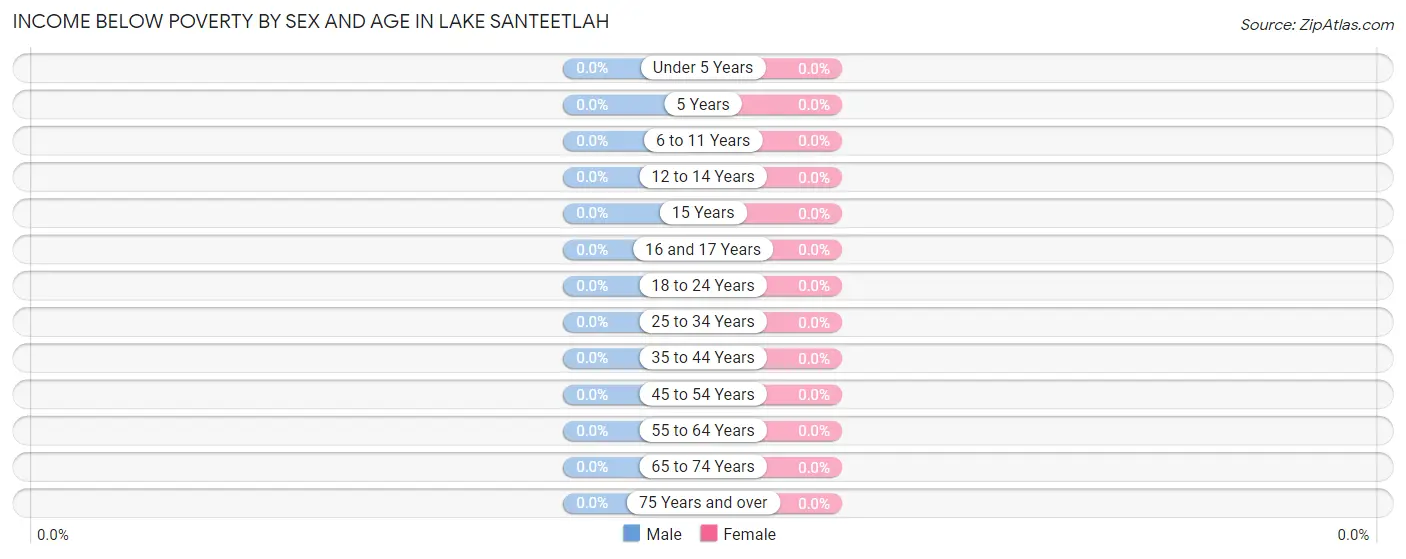
| Age Bracket | Male | Female |
| Under 5 Years | 0 (0.0%) | 0 (0.0%) |
| 5 Years | 0 (0.0%) | 0 (0.0%) |
| 6 to 11 Years | 0 (0.0%) | 0 (0.0%) |
| 12 to 14 Years | 0 (0.0%) | 0 (0.0%) |
| 15 Years | 0 (0.0%) | 0 (0.0%) |
| 16 and 17 Years | 0 (0.0%) | 0 (0.0%) |
| 18 to 24 Years | 0 (0.0%) | 0 (0.0%) |
| 25 to 34 Years | 0 (0.0%) | 0 (0.0%) |
| 35 to 44 Years | 0 (0.0%) | 0 (0.0%) |
| 45 to 54 Years | 0 (0.0%) | 0 (0.0%) |
| 55 to 64 Years | 0 (0.0%) | 0 (0.0%) |
| 65 to 74 Years | 0 (0.0%) | 0 (0.0%) |
| 75 Years and over | 0 (0.0%) | 0 (0.0%) |
| Total | 0 (0.0%) | 0 (0.0%) |
Income Above Poverty by Sex and Age in Lake Santeetlah
According to the poverty statistics in Lake Santeetlah, males aged 18 to 24 years and females aged under 5 years are the age groups that are most secure financially, with 100.0% of males and 100.0% of females in these age groups living above the poverty line.
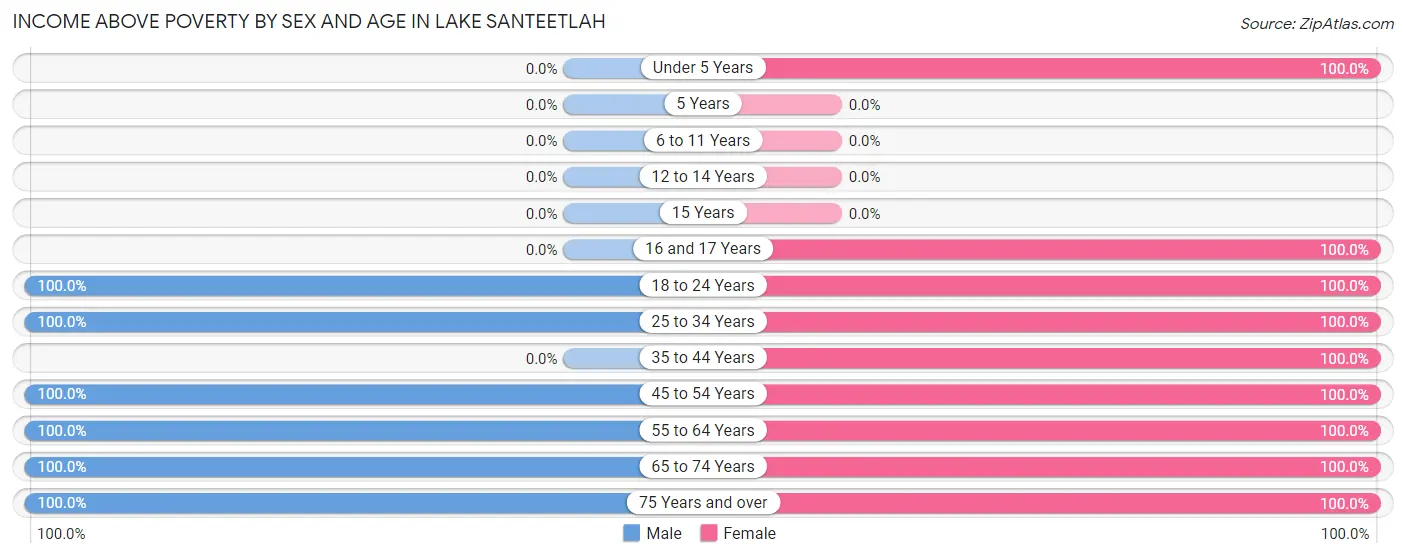
| Age Bracket | Male | Female |
| Under 5 Years | 0 (0.0%) | 15 (100.0%) |
| 5 Years | 0 (0.0%) | 0 (0.0%) |
| 6 to 11 Years | 0 (0.0%) | 0 (0.0%) |
| 12 to 14 Years | 0 (0.0%) | 0 (0.0%) |
| 15 Years | 0 (0.0%) | 0 (0.0%) |
| 16 and 17 Years | 0 (0.0%) | 8 (100.0%) |
| 18 to 24 Years | 16 (100.0%) | 4 (100.0%) |
| 25 to 34 Years | 5 (100.0%) | 5 (100.0%) |
| 35 to 44 Years | 0 (0.0%) | 1 (100.0%) |
| 45 to 54 Years | 4 (100.0%) | 14 (100.0%) |
| 55 to 64 Years | 6 (100.0%) | 2 (100.0%) |
| 65 to 74 Years | 8 (100.0%) | 24 (100.0%) |
| 75 Years and over | 8 (100.0%) | 1 (100.0%) |
| Total | 47 (100.0%) | 74 (100.0%) |
Income Below Poverty Among Married-Couple Families in Lake Santeetlah
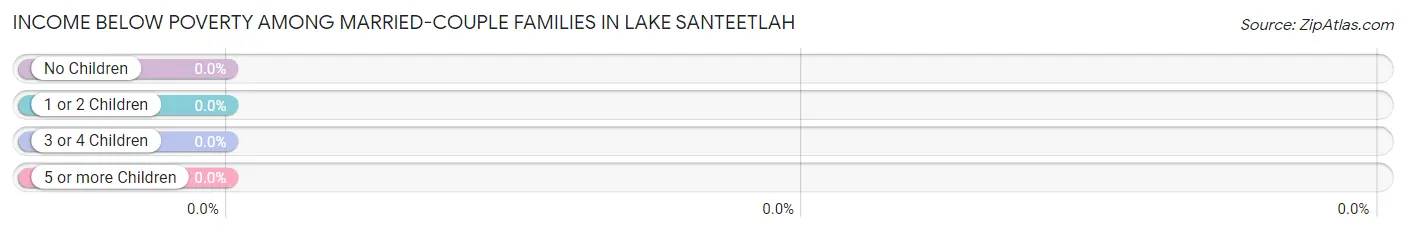
| Children | Above Poverty | Below Poverty |
| No Children | 20 (100.0%) | 0 (0.0%) |
| 1 or 2 Children | 9 (100.0%) | 0 (0.0%) |
| 3 or 4 Children | 0 (0.0%) | 0 (0.0%) |
| 5 or more Children | 0 (0.0%) | 0 (0.0%) |
| Total | 29 (100.0%) | 0 (0.0%) |
Income Below Poverty Among Single-Parent Households in Lake Santeetlah
| Children | Single Father | Single Mother |
| No Children | 0 (0.0%) | 0 (0.0%) |
| 1 or 2 Children | 0 (0.0%) | 0 (0.0%) |
| 3 or 4 Children | 0 (0.0%) | 0 (0.0%) |
| 5 or more Children | 0 (0.0%) | 0 (0.0%) |
| Total | 0 (0.0%) | 0 (0.0%) |
Income Below Poverty Among Married-Couple vs Single-Parent Households in Lake Santeetlah
| Children | Married-Couple Families | Single-Parent Households |
| No Children | 0 (0.0%) | 0 (0.0%) |
| 1 or 2 Children | 0 (0.0%) | 0 (0.0%) |
| 3 or 4 Children | 0 (0.0%) | 0 (0.0%) |
| 5 or more Children | 0 (0.0%) | 0 (0.0%) |
| Total | 0 (0.0%) | 0 (0.0%) |
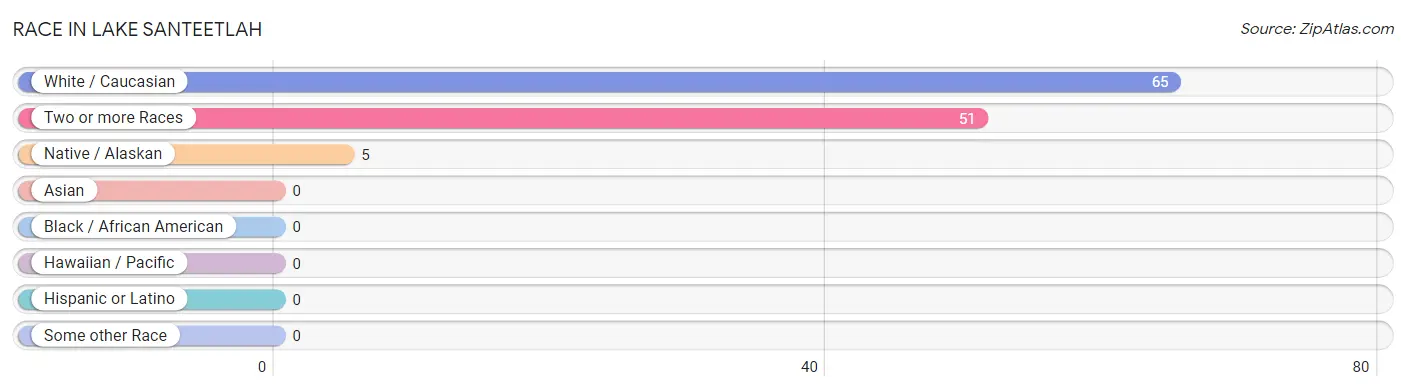
Race in Lake Santeetlah
The most populous races in Lake Santeetlah are White / Caucasian (65 | 53.7%), Two or more Races (51 | 42.1%), and Native / Alaskan (5 | 4.1%).
| Race | # Population | % Population |
| Asian | 0 | 0.0% |
| Black / African American | 0 | 0.0% |
| Hawaiian / Pacific | 0 | 0.0% |
| Hispanic or Latino | 0 | 0.0% |
| Native / Alaskan | 5 | 4.1% |
| White / Caucasian | 65 | 53.7% |
| Two or more Races | 51 | 42.1% |
| Some other Race | 0 | 0.0% |
| Total | 121 | 100.0% |
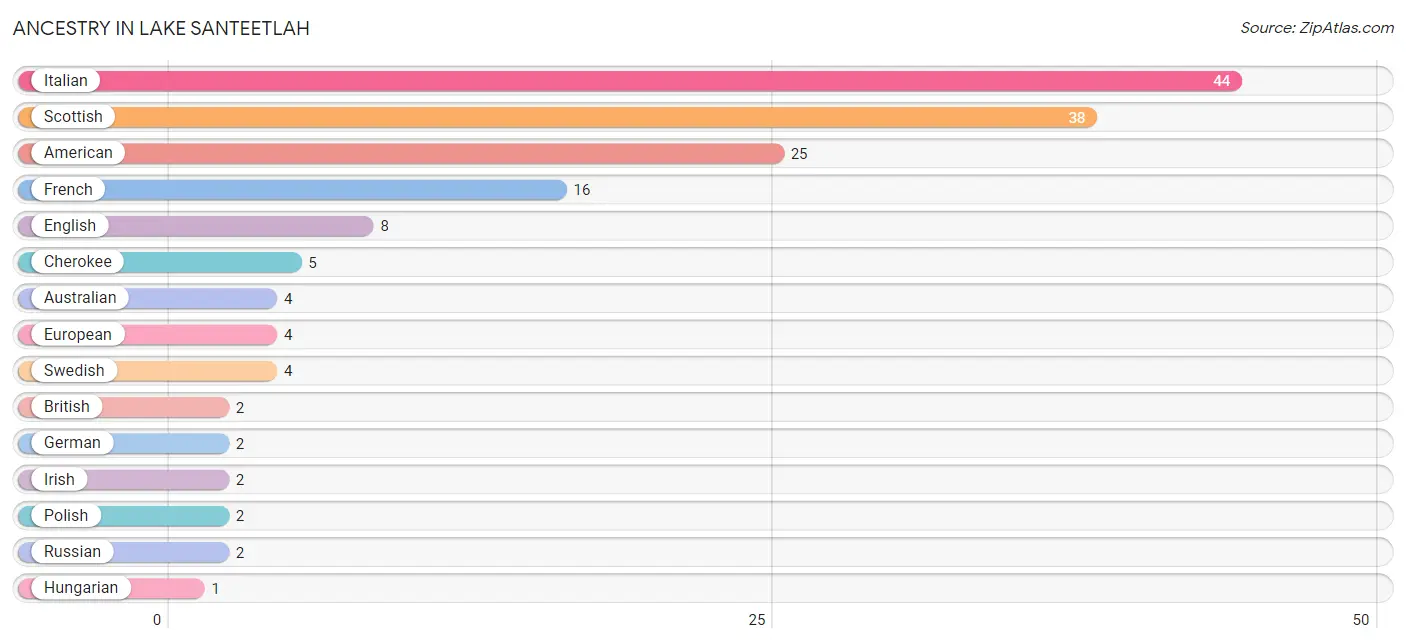
Ancestry in Lake Santeetlah
The most populous ancestries reported in Lake Santeetlah are Italian (44 | 36.4%), Scottish (38 | 31.4%), American (25 | 20.7%), French (16 | 13.2%), and English (8 | 6.6%), together accounting for 108.3% of all Lake Santeetlah residents.
| Ancestry | # Population | % Population |
| American | 25 | 20.7% |
| Australian | 4 | 3.3% |
| British | 2 | 1.7% |
| Cherokee | 5 | 4.1% |
| English | 8 | 6.6% |
| European | 4 | 3.3% |
| French | 16 | 13.2% |
| German | 2 | 1.7% |
| Hungarian | 1 | 0.8% |
| Irish | 2 | 1.7% |
| Italian | 44 | 36.4% |
| Pennsylvania German | 1 | 0.8% |
| Polish | 2 | 1.7% |
| Russian | 2 | 1.7% |
| Scottish | 38 | 31.4% |
| Swedish | 4 | 3.3% |
| Swiss | 1 | 0.8% |
| Ukrainian | 1 | 0.8% | View All 18 Rows |
Immigrants in Lake Santeetlah

| Immigration Origin | # Population | % Population | View All 0 Rows |
Sex and Age in Lake Santeetlah
Sex and Age in Lake Santeetlah
The most populous age groups in Lake Santeetlah are 20 to 24 Years (16 | 34.0%) for men and Under 5 Years (15 | 20.3%) for women.
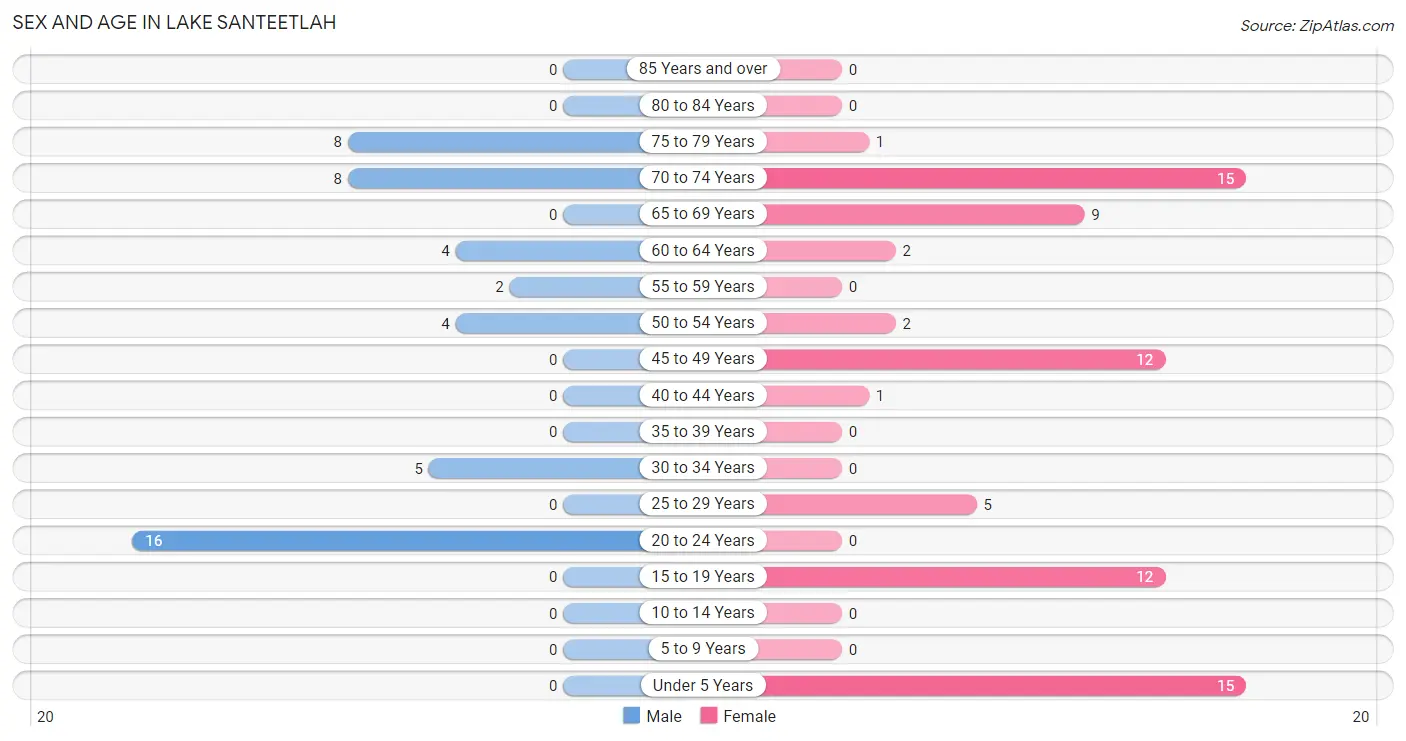
| Age Bracket | Male | Female |
| Under 5 Years | 0 (0.0%) | 15 (20.3%) |
| 5 to 9 Years | 0 (0.0%) | 0 (0.0%) |
| 10 to 14 Years | 0 (0.0%) | 0 (0.0%) |
| 15 to 19 Years | 0 (0.0%) | 12 (16.2%) |
| 20 to 24 Years | 16 (34.0%) | 0 (0.0%) |
| 25 to 29 Years | 0 (0.0%) | 5 (6.8%) |
| 30 to 34 Years | 5 (10.6%) | 0 (0.0%) |
| 35 to 39 Years | 0 (0.0%) | 0 (0.0%) |
| 40 to 44 Years | 0 (0.0%) | 1 (1.3%) |
| 45 to 49 Years | 0 (0.0%) | 12 (16.2%) |
| 50 to 54 Years | 4 (8.5%) | 2 (2.7%) |
| 55 to 59 Years | 2 (4.3%) | 0 (0.0%) |
| 60 to 64 Years | 4 (8.5%) | 2 (2.7%) |
| 65 to 69 Years | 0 (0.0%) | 9 (12.2%) |
| 70 to 74 Years | 8 (17.0%) | 15 (20.3%) |
| 75 to 79 Years | 8 (17.0%) | 1 (1.3%) |
| 80 to 84 Years | 0 (0.0%) | 0 (0.0%) |
| 85 Years and over | 0 (0.0%) | 0 (0.0%) |
| Total | 47 (100.0%) | 74 (100.0%) |
Families and Households in Lake Santeetlah
Median Family Size in Lake Santeetlah
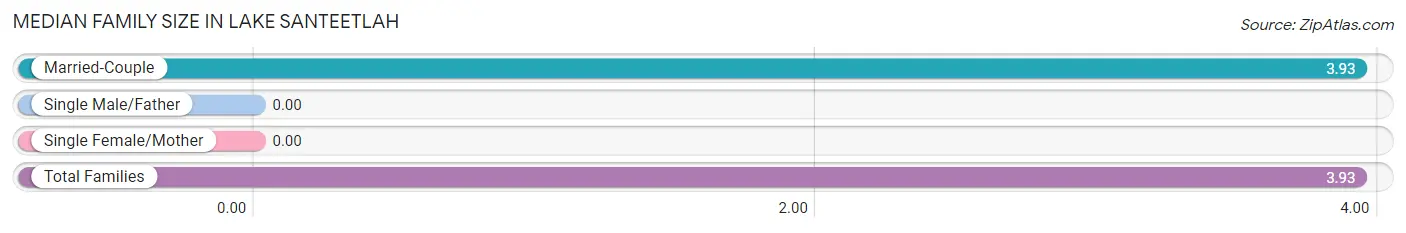
| Family Type | # Families | Family Size |
| Married-Couple | 29 (100.0%) | 3.93 |
| Single Male/Father | 0 (0.0%) | - |
| Single Female/Mother | 0 (0.0%) | - |
| Total Families | 29 (100.0%) | 3.93 |
Median Household Size in Lake Santeetlah
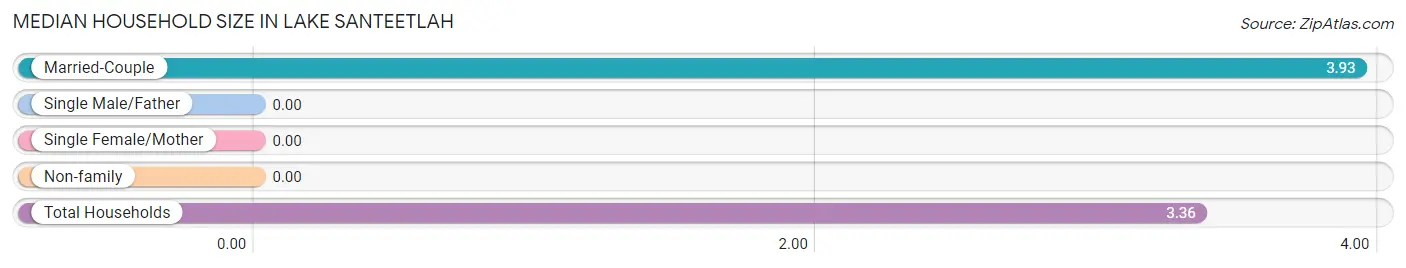
| Household Type | # Households | Household Size |
| Married-Couple | 29 (80.6%) | 3.93 |
| Single Male/Father | 0 (0.0%) | - |
| Single Female/Mother | 0 (0.0%) | - |
| Non-family | 7 (19.4%) | - |
| Total Households | 36 (100.0%) | 3.36 |
Household Size by Marriage Status in Lake Santeetlah
Out of a total of 36 households in Lake Santeetlah, 29 (80.6%) are family households, while 7 (19.4%) are nonfamily households. The most numerous type of family households are 2-person households, comprising 20, and the most common type of nonfamily households are 1-person households, comprising 7.
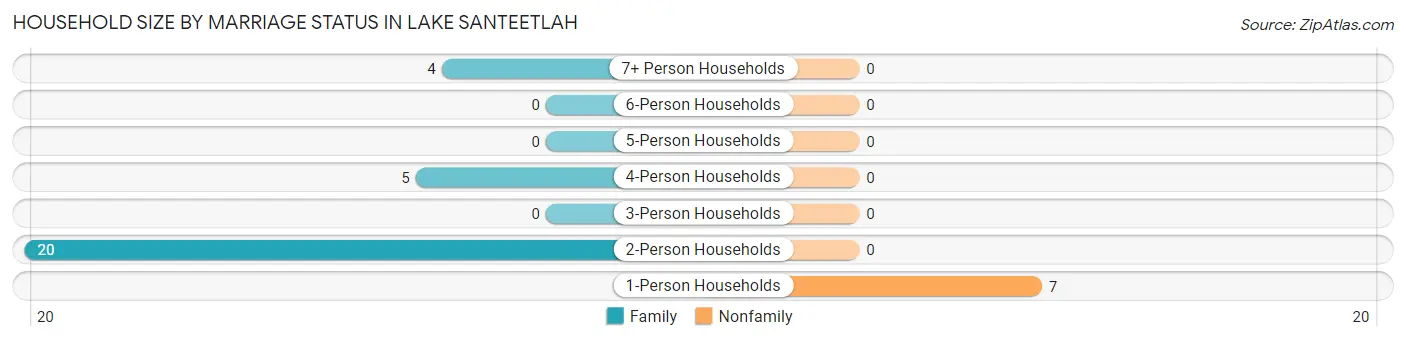
| Household Size | Family Households | Nonfamily Households |
| 1-Person Households | - | 7 (19.4%) |
| 2-Person Households | 20 (55.6%) | 0 (0.0%) |
| 3-Person Households | 0 (0.0%) | 0 (0.0%) |
| 4-Person Households | 5 (13.9%) | 0 (0.0%) |
| 5-Person Households | 0 (0.0%) | 0 (0.0%) |
| 6-Person Households | 0 (0.0%) | 0 (0.0%) |
| 7+ Person Households | 4 (11.1%) | 0 (0.0%) |
| Total | 29 (80.6%) | 7 (19.4%) |
Female Fertility in Lake Santeetlah
Fertility by Age in Lake Santeetlah
Average fertility rate in Lake Santeetlah is 156.0 births per 1,000 women. Women in the age bracket of 20 to 34 years have the highest fertility rate with 1,000.0 births per 1,000 women. Women in the age bracket of 20 to 34 years acount for 100.0% of all women with births.
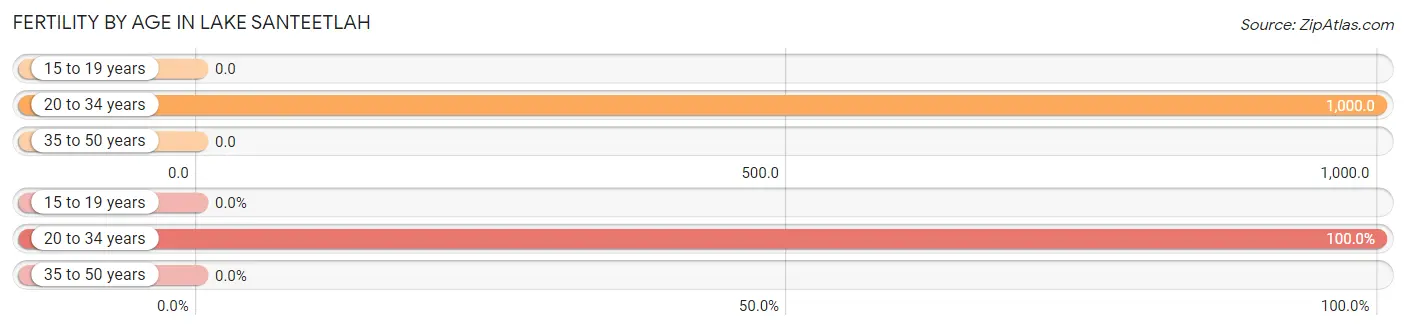
| Age Bracket | Women with Births | Births / 1,000 Women |
| 15 to 19 years | 0 (0.0%) | 0.0 |
| 20 to 34 years | 5 (100.0%) | 1,000.0 |
| 35 to 50 years | 0 (0.0%) | 0.0 |
| Total | 5 (100.0%) | 156.0 |
Fertility by Age by Marriage Status in Lake Santeetlah
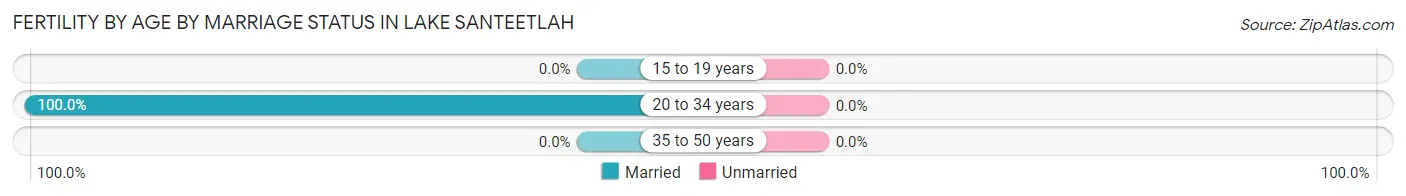
| Age Bracket | Married | Unmarried |
| 15 to 19 years | 0 (0.0%) | 0 (0.0%) |
| 20 to 34 years | 5 (100.0%) | 0 (0.0%) |
| 35 to 50 years | 0 (0.0%) | 0 (0.0%) |
| Total | 5 (100.0%) | 0 (0.0%) |
Fertility by Education in Lake Santeetlah
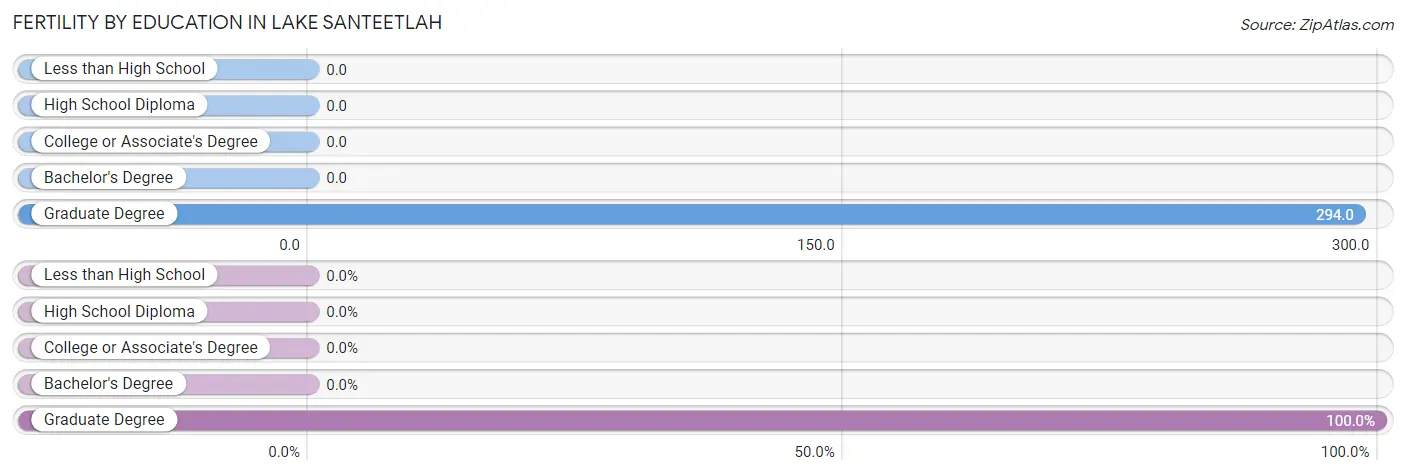
| Educational Attainment | Women with Births | Births / 1,000 Women |
| Less than High School | 0 (0.0%) | 0.0 |
| High School Diploma | 0 (0.0%) | 0.0 |
| College or Associate's Degree | 0 (0.0%) | 0.0 |
| Bachelor's Degree | 0 (0.0%) | 0.0 |
| Graduate Degree | 5 (100.0%) | 294.0 |
| Total | 5 (100.0%) | 156.0 |
Fertility by Education by Marriage Status in Lake Santeetlah
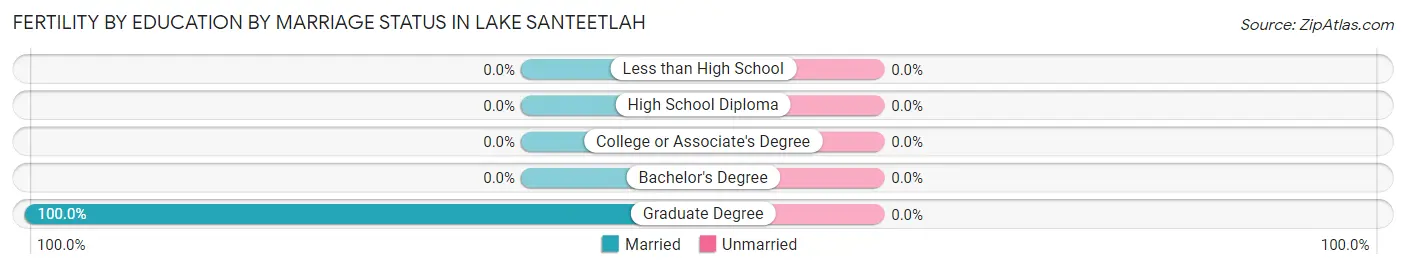
| Educational Attainment | Married | Unmarried |
| Less than High School | 0 (0.0%) | 0 (0.0%) |
| High School Diploma | 0 (0.0%) | 0 (0.0%) |
| College or Associate's Degree | 0 (0.0%) | 0 (0.0%) |
| Bachelor's Degree | 0 (0.0%) | 0 (0.0%) |
| Graduate Degree | 5 (100.0%) | 0 (0.0%) |
| Total | 5 (100.0%) | 0 (0.0%) |
Employment Characteristics in Lake Santeetlah
Employment by Class of Employer in Lake Santeetlah
Among the 25 employed individuals in Lake Santeetlah, private company employees (14 | 56.0%), not-for-profit organizations (7 | 28.0%), and self-employed (not incorporated) (3 | 12.0%) make up the most common classes of employment.
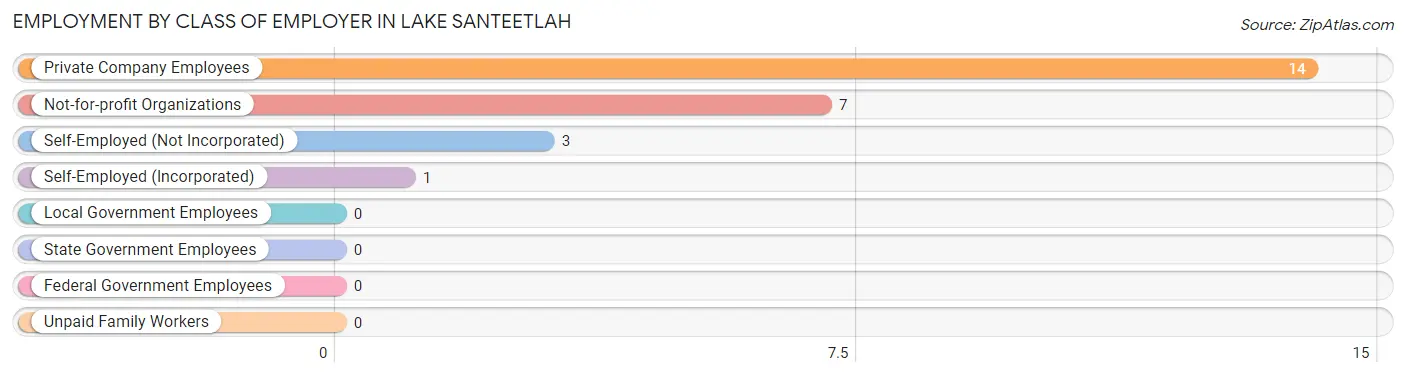
| Employer Class | # Employees | % Employees |
| Private Company Employees | 14 | 56.0% |
| Self-Employed (Incorporated) | 1 | 4.0% |
| Self-Employed (Not Incorporated) | 3 | 12.0% |
| Not-for-profit Organizations | 7 | 28.0% |
| Local Government Employees | 0 | 0.0% |
| State Government Employees | 0 | 0.0% |
| Federal Government Employees | 0 | 0.0% |
| Unpaid Family Workers | 0 | 0.0% |
| Total | 25 | 100.0% |
Employment Status by Age in Lake Santeetlah
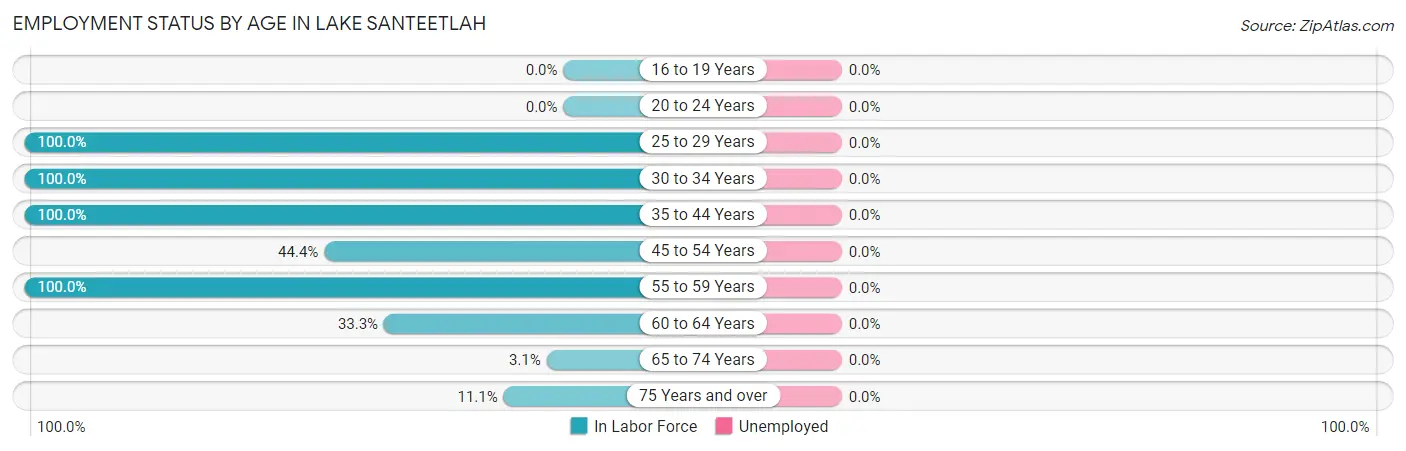
| Age Bracket | In Labor Force | Unemployed |
| 16 to 19 Years | 0 (0.0%) | 0 (0.0%) |
| 20 to 24 Years | 0 (0.0%) | 0 (0.0%) |
| 25 to 29 Years | 5 (100.0%) | 0 (0.0%) |
| 30 to 34 Years | 5 (100.0%) | 0 (0.0%) |
| 35 to 44 Years | 1 (100.0%) | 0 (0.0%) |
| 45 to 54 Years | 8 (44.4%) | 0 (0.0%) |
| 55 to 59 Years | 2 (100.0%) | 0 (0.0%) |
| 60 to 64 Years | 2 (33.3%) | 0 (0.0%) |
| 65 to 74 Years | 1 (3.1%) | 0 (0.0%) |
| 75 Years and over | 1 (11.1%) | 0 (0.0%) |
| Total | 25 (23.6%) | 0 (0.0%) |
Employment Status by Educational Attainment in Lake Santeetlah
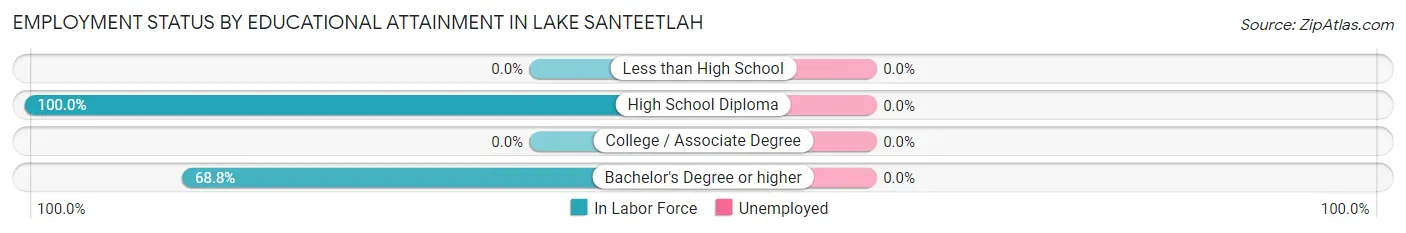
| Educational Attainment | In Labor Force | Unemployed |
| Less than High School | 0 (0.0%) | 0 (0.0%) |
| High School Diploma | 1 (100.0%) | 0 (0.0%) |
| College / Associate Degree | 0 (0.0%) | 0 (0.0%) |
| Bachelor's Degree or higher | 22 (68.8%) | 0 (0.0%) |
| Total | 23 (62.2%) | 0 (0.0%) |
Employment Occupations by Sex in Lake Santeetlah
Management, Business, Science and Arts Occupations
The most common Management, Business, Science and Arts occupations in Lake Santeetlah are Health Diagnosing & Treating (9 | 36.0%), Health Technologists (9 | 36.0%), Business & Financial (6 | 24.0%), Management (2 | 8.0%), and Community & Social Service (1 | 4.0%).
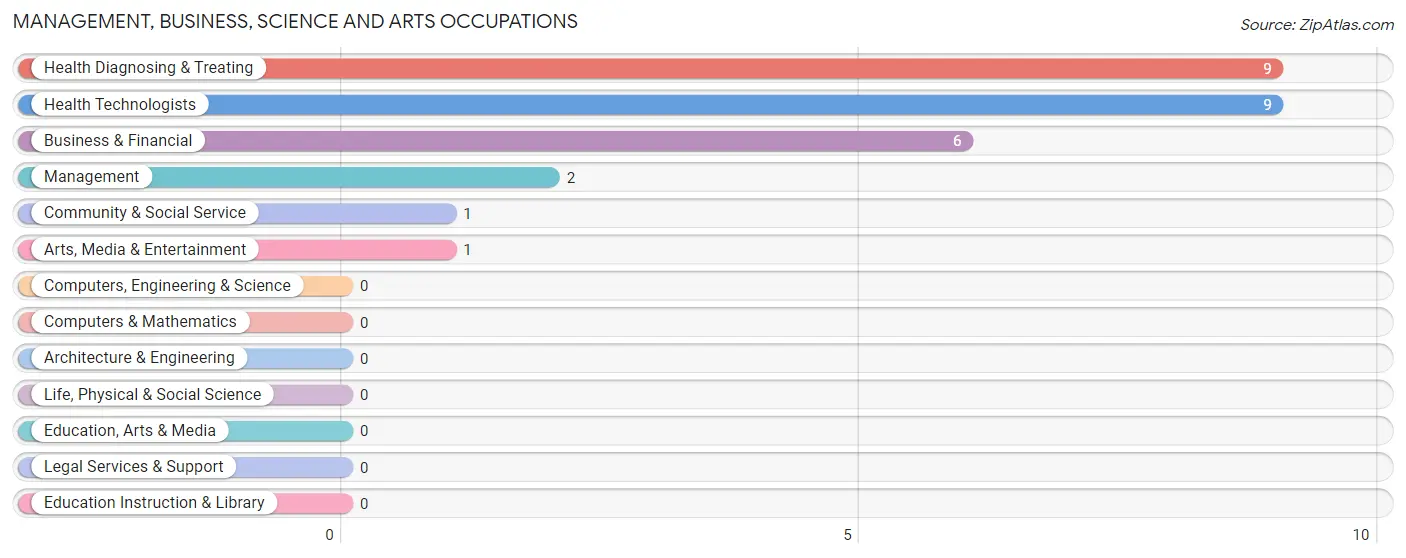
Management, Business, Science and Arts Occupations by Sex
Within the Management, Business, Science and Arts occupations in Lake Santeetlah, the most male-oriented occupations are Management (100.0%), Community & Social Service (100.0%), and Arts, Media & Entertainment (100.0%), while the most female-oriented occupations are Health Diagnosing & Treating (77.8%), Health Technologists (77.8%), and Business & Financial (33.3%).
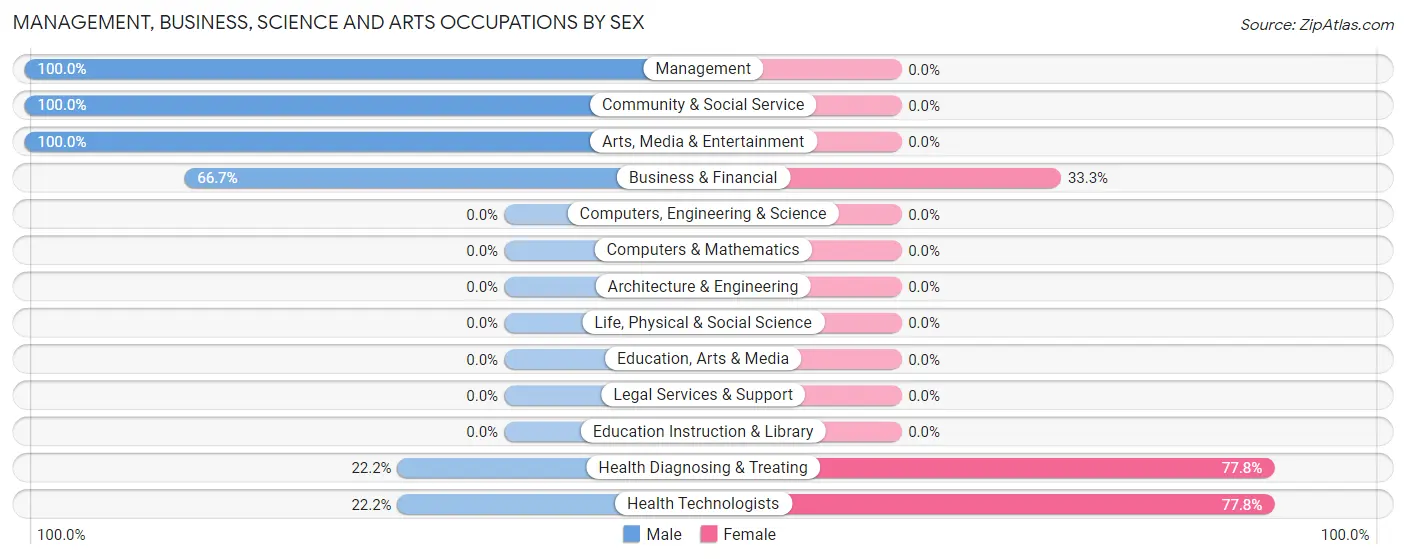
| Occupation | Male | Female |
| Management | 2 (100.0%) | 0 (0.0%) |
| Business & Financial | 4 (66.7%) | 2 (33.3%) |
| Computers, Engineering & Science | 0 (0.0%) | 0 (0.0%) |
| Computers & Mathematics | 0 (0.0%) | 0 (0.0%) |
| Architecture & Engineering | 0 (0.0%) | 0 (0.0%) |
| Life, Physical & Social Science | 0 (0.0%) | 0 (0.0%) |
| Community & Social Service | 1 (100.0%) | 0 (0.0%) |
| Education, Arts & Media | 0 (0.0%) | 0 (0.0%) |
| Legal Services & Support | 0 (0.0%) | 0 (0.0%) |
| Education Instruction & Library | 0 (0.0%) | 0 (0.0%) |
| Arts, Media & Entertainment | 1 (100.0%) | 0 (0.0%) |
| Health Diagnosing & Treating | 2 (22.2%) | 7 (77.8%) |
| Health Technologists | 2 (22.2%) | 7 (77.8%) |
| Total (Category) | 9 (50.0%) | 9 (50.0%) |
| Total (Overall) | 14 (56.0%) | 11 (44.0%) |
Services Occupations
Services Occupations by Sex
| Occupation | Male | Female |
| Healthcare Support | 0 (0.0%) | 0 (0.0%) |
| Security & Protection | 0 (0.0%) | 0 (0.0%) |
| Firefighting & Prevention | 0 (0.0%) | 0 (0.0%) |
| Law Enforcement | 0 (0.0%) | 0 (0.0%) |
| Food Preparation & Serving | 0 (0.0%) | 0 (0.0%) |
| Cleaning & Maintenance | 0 (0.0%) | 0 (0.0%) |
| Personal Care & Service | 0 (0.0%) | 0 (0.0%) |
| Total (Category) | 0 (0.0%) | 0 (0.0%) |
| Total (Overall) | 14 (56.0%) | 11 (44.0%) |
Sales and Office Occupations
The most common Sales and Office occupations in Lake Santeetlah are , and Office & Administration (2 | 8.0%).

Sales and Office Occupations by Sex
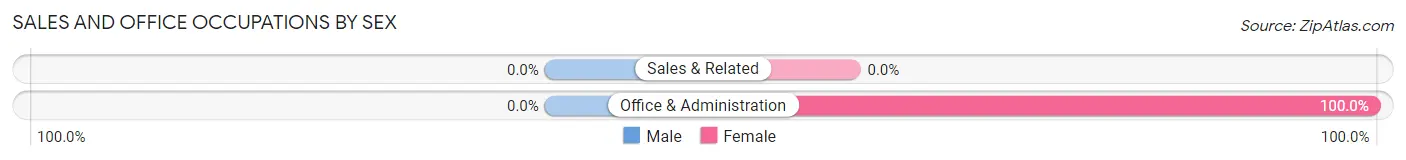
| Occupation | Male | Female |
| Sales & Related | 0 (0.0%) | 0 (0.0%) |
| Office & Administration | 0 (0.0%) | 2 (100.0%) |
| Total (Category) | 0 (0.0%) | 2 (100.0%) |
| Total (Overall) | 14 (56.0%) | 11 (44.0%) |
Natural Resources, Construction and Maintenance Occupations
The most common Natural Resources, Construction and Maintenance occupations in Lake Santeetlah are , and Construction & Extraction (5 | 20.0%).
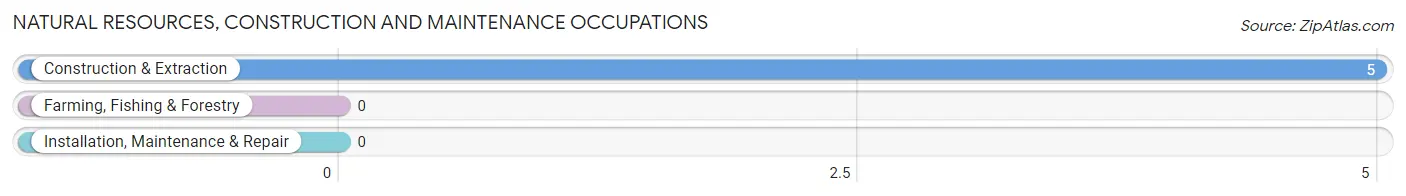
Natural Resources, Construction and Maintenance Occupations by Sex
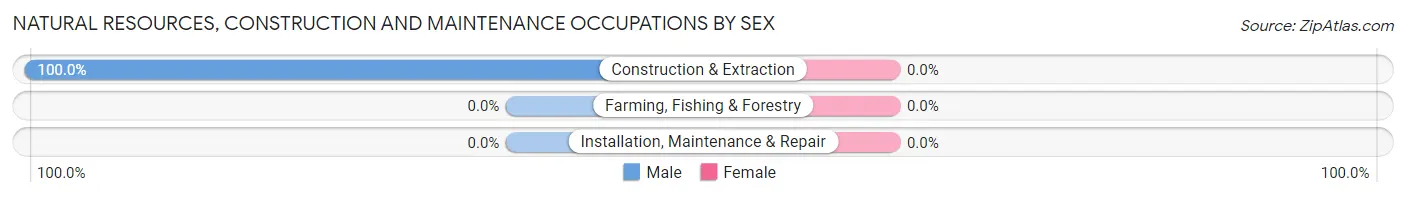
| Occupation | Male | Female |
| Farming, Fishing & Forestry | 0 (0.0%) | 0 (0.0%) |
| Construction & Extraction | 5 (100.0%) | 0 (0.0%) |
| Installation, Maintenance & Repair | 0 (0.0%) | 0 (0.0%) |
| Total (Category) | 5 (100.0%) | 0 (0.0%) |
| Total (Overall) | 14 (56.0%) | 11 (44.0%) |
Production, Transportation and Moving Occupations
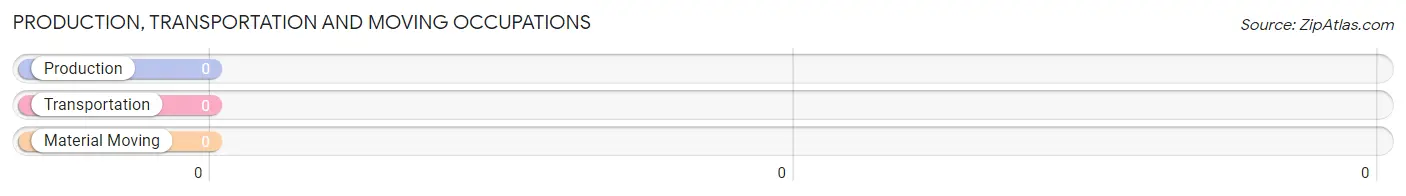
Production, Transportation and Moving Occupations by Sex
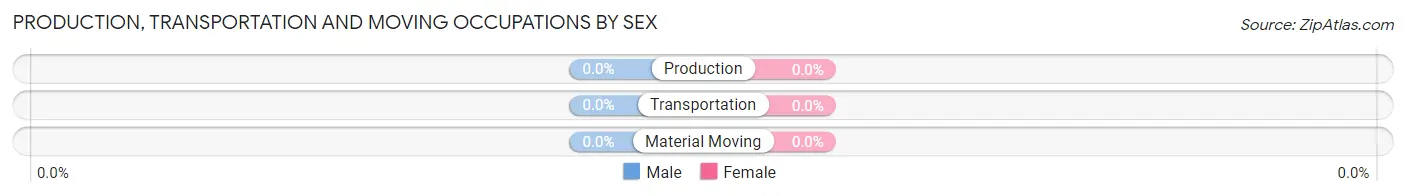
| Occupation | Male | Female |
| Production | 0 (0.0%) | 0 (0.0%) |
| Transportation | 0 (0.0%) | 0 (0.0%) |
| Material Moving | 0 (0.0%) | 0 (0.0%) |
| Total (Category) | 0 (0.0%) | 0 (0.0%) |
| Total (Overall) | 14 (56.0%) | 11 (44.0%) |
Employment Industries by Sex in Lake Santeetlah
Employment Industries in Lake Santeetlah
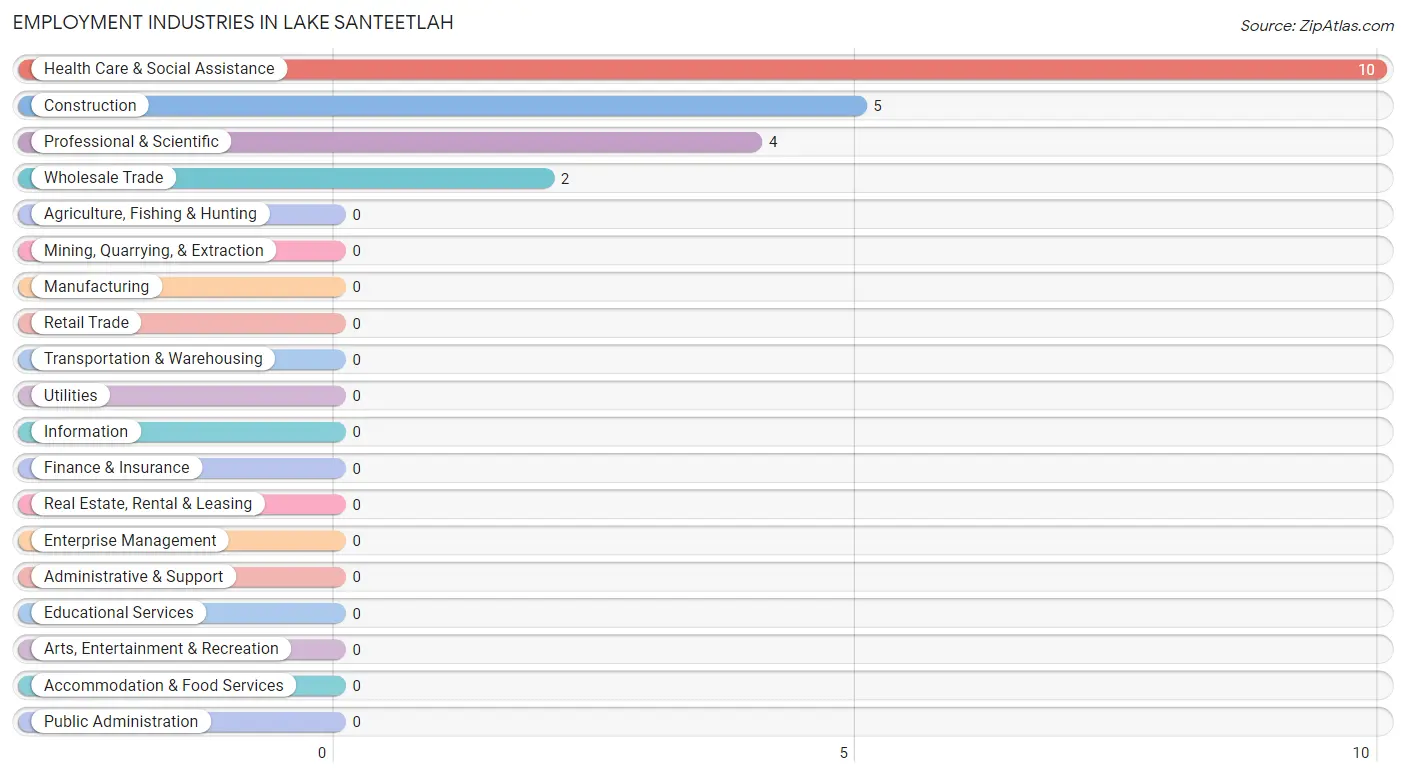
The major employment industries in Lake Santeetlah include Health Care & Social Assistance (10 | 40.0%), Construction (5 | 20.0%), Professional & Scientific (4 | 16.0%), and Wholesale Trade (2 | 8.0%).
Employment Industries by Sex in Lake Santeetlah
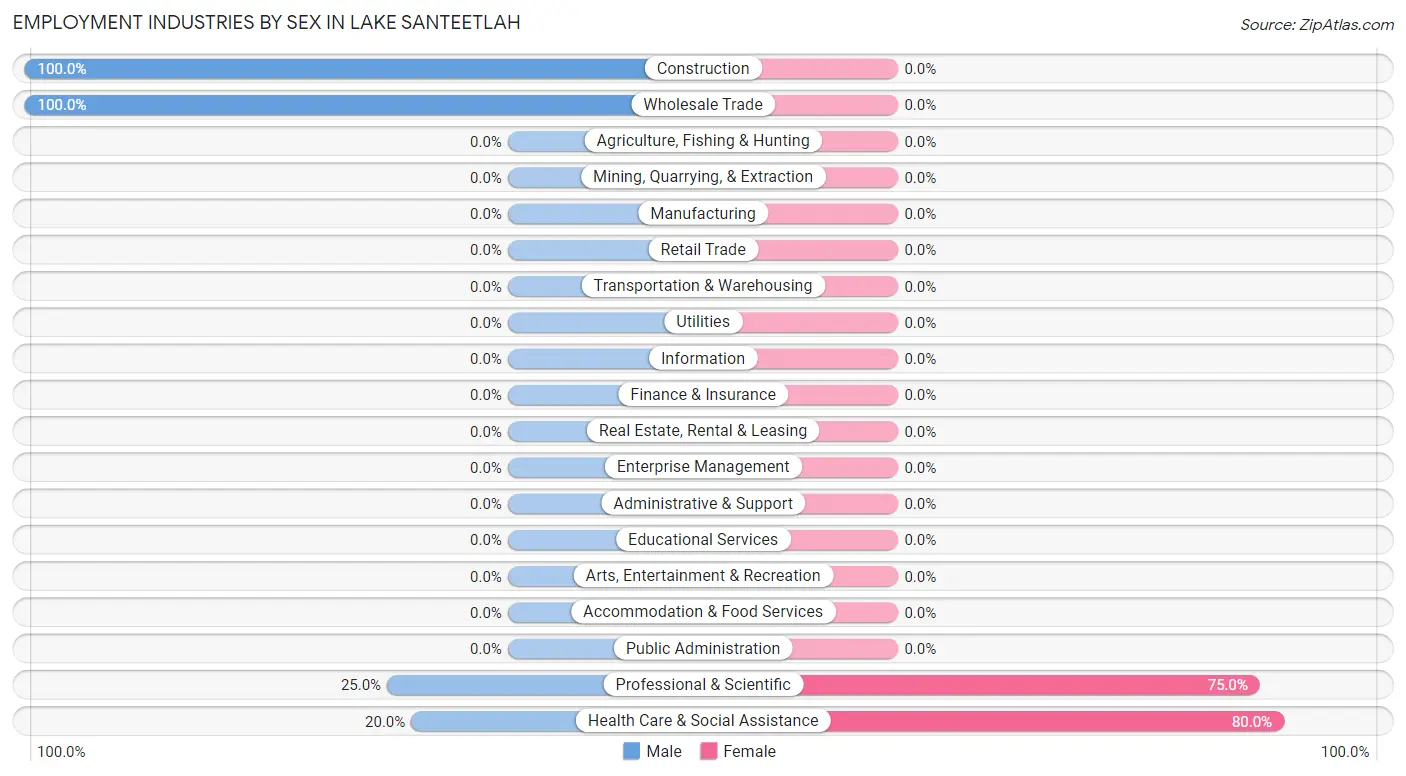
The Lake Santeetlah industries that see more men than women are Construction (100.0%), Wholesale Trade (100.0%), and Professional & Scientific (25.0%), whereas the industries that tend to have a higher number of women are Health Care & Social Assistance (80.0%), and Professional & Scientific (75.0%).
| Industry | Male | Female |
| Agriculture, Fishing & Hunting | 0 (0.0%) | 0 (0.0%) |
| Mining, Quarrying, & Extraction | 0 (0.0%) | 0 (0.0%) |
| Construction | 5 (100.0%) | 0 (0.0%) |
| Manufacturing | 0 (0.0%) | 0 (0.0%) |
| Wholesale Trade | 2 (100.0%) | 0 (0.0%) |
| Retail Trade | 0 (0.0%) | 0 (0.0%) |
| Transportation & Warehousing | 0 (0.0%) | 0 (0.0%) |
| Utilities | 0 (0.0%) | 0 (0.0%) |
| Information | 0 (0.0%) | 0 (0.0%) |
| Finance & Insurance | 0 (0.0%) | 0 (0.0%) |
| Real Estate, Rental & Leasing | 0 (0.0%) | 0 (0.0%) |
| Professional & Scientific | 1 (25.0%) | 3 (75.0%) |
| Enterprise Management | 0 (0.0%) | 0 (0.0%) |
| Administrative & Support | 0 (0.0%) | 0 (0.0%) |
| Educational Services | 0 (0.0%) | 0 (0.0%) |
| Health Care & Social Assistance | 2 (20.0%) | 8 (80.0%) |
| Arts, Entertainment & Recreation | 0 (0.0%) | 0 (0.0%) |
| Accommodation & Food Services | 0 (0.0%) | 0 (0.0%) |
| Public Administration | 0 (0.0%) | 0 (0.0%) |
| Total | 14 (56.0%) | 11 (44.0%) |
Education in Lake Santeetlah
School Enrollment in Lake Santeetlah
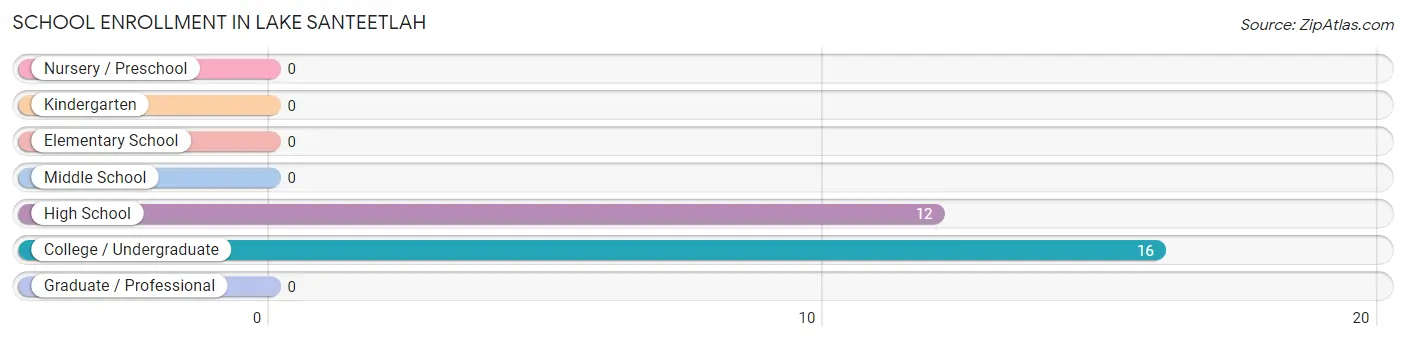
The most common levels of schooling among the 28 students in Lake Santeetlah are college / undergraduate (16 | 57.1%), and high school (12 | 42.9%).
| School Level | # Students | % Students |
| Nursery / Preschool | 0 | 0.0% |
| Kindergarten | 0 | 0.0% |
| Elementary School | 0 | 0.0% |
| Middle School | 0 | 0.0% |
| High School | 12 | 42.9% |
| College / Undergraduate | 16 | 57.1% |
| Graduate / Professional | 0 | 0.0% |
| Total | 28 | 100.0% |
School Enrollment by Age by Funding Source in Lake Santeetlah
| Age Bracket | Public School | Private School |
| 3 to 4 Year Olds | 0 (0.0%) | 0 (0.0%) |
| 5 to 9 Year Old | 0 (0.0%) | 0 (0.0%) |
| 10 to 14 Year Olds | 0 (0.0%) | 0 (0.0%) |
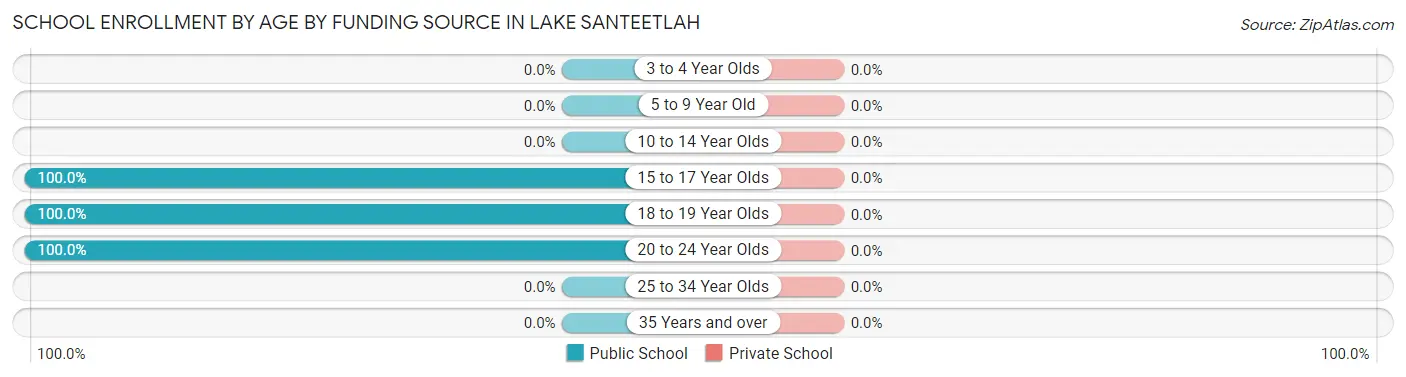
| 15 to 17 Year Olds | 8 (100.0%) | 0 (0.0%) |
| 18 to 19 Year Olds | 4 (100.0%) | 0 (0.0%) |
| 20 to 24 Year Olds | 16 (100.0%) | 0 (0.0%) |
| 25 to 34 Year Olds | 0 (0.0%) | 0 (0.0%) |
| 35 Years and over | 0 (0.0%) | 0 (0.0%) |
| Total | 28 (100.0%) | 0 (0.0%) |
Educational Attainment by Field of Study in Lake Santeetlah
Education (12 | 24.5%), science & technology (9 | 18.4%), bio, nature & agricultural (6 | 12.2%), social sciences (6 | 12.2%), and liberal arts & history (4 | 8.2%) are the most common fields of study among 49 individuals in Lake Santeetlah who have obtained a bachelor's degree or higher.
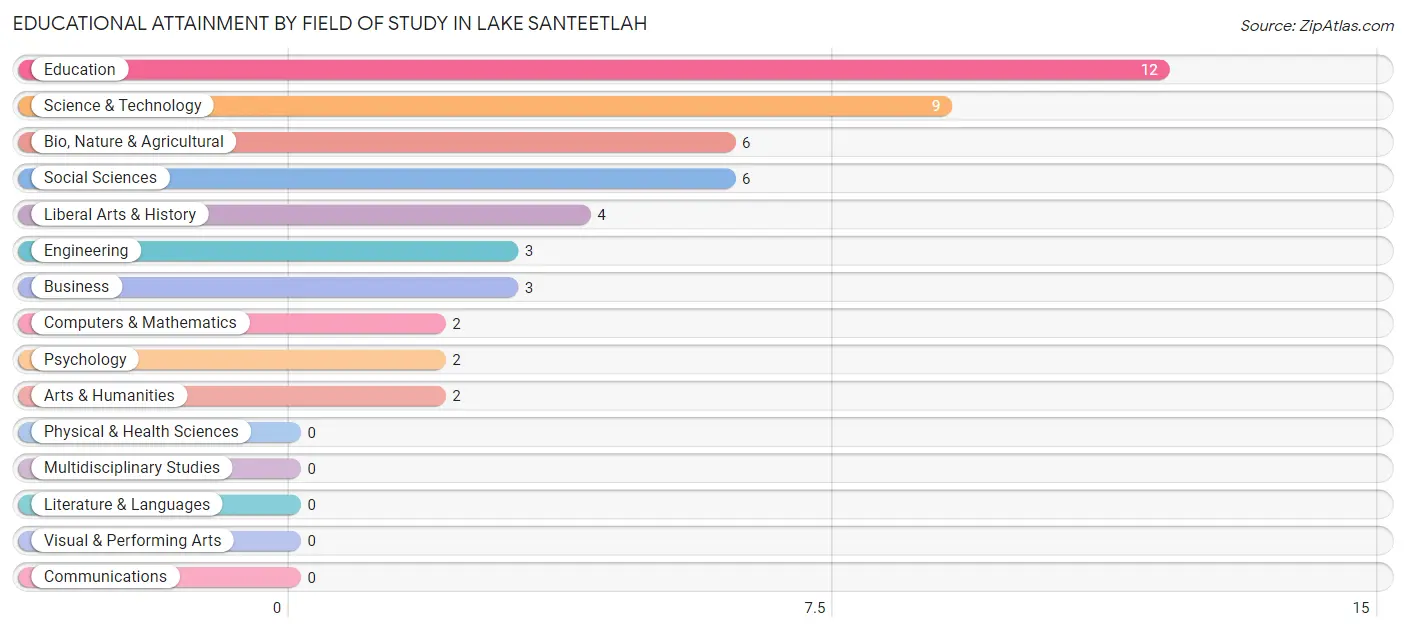
| Field of Study | # Graduates | % Graduates |
| Computers & Mathematics | 2 | 4.1% |
| Bio, Nature & Agricultural | 6 | 12.2% |
| Physical & Health Sciences | 0 | 0.0% |
| Psychology | 2 | 4.1% |
| Social Sciences | 6 | 12.2% |
| Engineering | 3 | 6.1% |
| Multidisciplinary Studies | 0 | 0.0% |
| Science & Technology | 9 | 18.4% |
| Business | 3 | 6.1% |
| Education | 12 | 24.5% |
| Literature & Languages | 0 | 0.0% |
| Liberal Arts & History | 4 | 8.2% |
| Visual & Performing Arts | 0 | 0.0% |
| Communications | 0 | 0.0% |
| Arts & Humanities | 2 | 4.1% |
| Total | 49 | 100.0% |
Transportation & Commute in Lake Santeetlah
Vehicle Availability by Sex in Lake Santeetlah
The most prevalent vehicle ownership categories in Lake Santeetlah are males with 2 vehicles (7, accounting for 50.0%) and females with 2 vehicles (9, making up 63.6%).
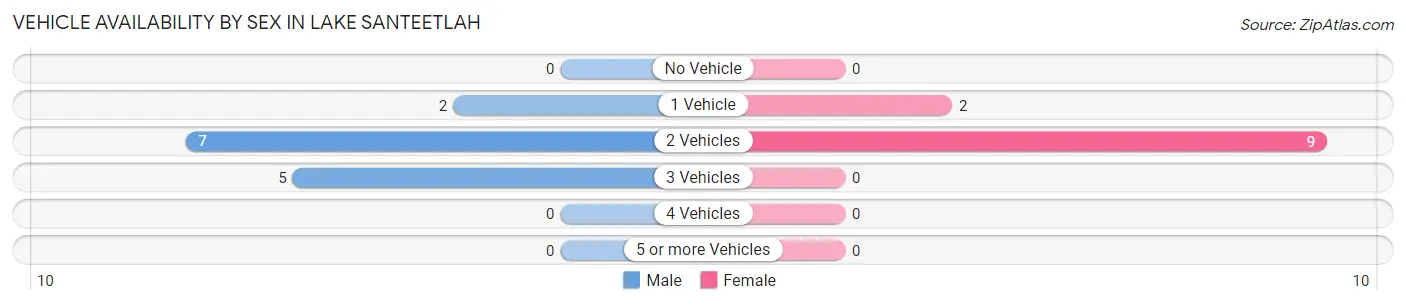
| Vehicles Available | Male | Female |
| No Vehicle | 0 (0.0%) | 0 (0.0%) |
| 1 Vehicle | 2 (14.3%) | 2 (18.2%) |
| 2 Vehicles | 7 (50.0%) | 9 (81.8%) |
| 3 Vehicles | 5 (35.7%) | 0 (0.0%) |
| 4 Vehicles | 0 (0.0%) | 0 (0.0%) |
| 5 or more Vehicles | 0 (0.0%) | 0 (0.0%) |
| Total | 14 (100.0%) | 11 (100.0%) |
Commute Time in Lake Santeetlah
The most frequently occuring commute durations in Lake Santeetlah are 60 to 89 minutes (7 commuters, 50.0%), 15 to 19 minutes (5 commuters, 35.7%), and 30 to 34 minutes (2 commuters, 14.3%).
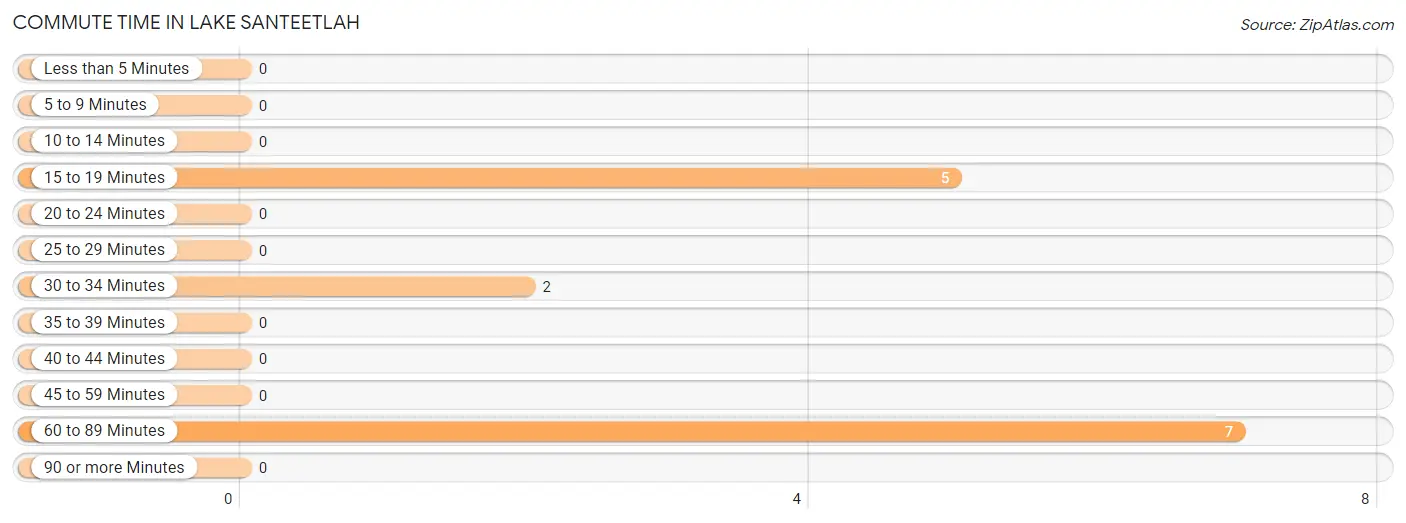
| Commute Time | # Commuters | % Commuters |
| Less than 5 Minutes | 0 | 0.0% |
| 5 to 9 Minutes | 0 | 0.0% |
| 10 to 14 Minutes | 0 | 0.0% |
| 15 to 19 Minutes | 5 | 35.7% |
| 20 to 24 Minutes | 0 | 0.0% |
| 25 to 29 Minutes | 0 | 0.0% |
| 30 to 34 Minutes | 2 | 14.3% |
| 35 to 39 Minutes | 0 | 0.0% |
| 40 to 44 Minutes | 0 | 0.0% |
| 45 to 59 Minutes | 0 | 0.0% |
| 60 to 89 Minutes | 7 | 50.0% |
| 90 or more Minutes | 0 | 0.0% |
Commute Time by Sex in Lake Santeetlah
The most common commute times in Lake Santeetlah are 15 to 19 minutes (5 commuters, 55.6%) for males and 60 to 89 minutes (5 commuters, 100.0%) for females.
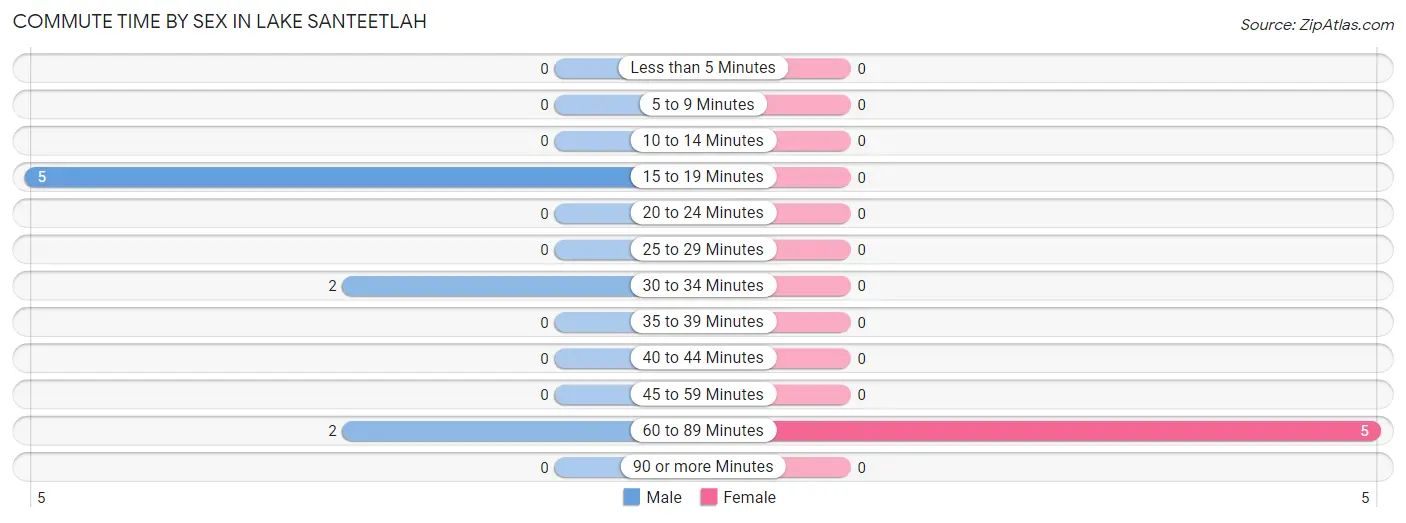
| Commute Time | Male | Female |
| Less than 5 Minutes | 0 (0.0%) | 0 (0.0%) |
| 5 to 9 Minutes | 0 (0.0%) | 0 (0.0%) |
| 10 to 14 Minutes | 0 (0.0%) | 0 (0.0%) |
| 15 to 19 Minutes | 5 (55.6%) | 0 (0.0%) |
| 20 to 24 Minutes | 0 (0.0%) | 0 (0.0%) |
| 25 to 29 Minutes | 0 (0.0%) | 0 (0.0%) |
| 30 to 34 Minutes | 2 (22.2%) | 0 (0.0%) |
| 35 to 39 Minutes | 0 (0.0%) | 0 (0.0%) |
| 40 to 44 Minutes | 0 (0.0%) | 0 (0.0%) |
| 45 to 59 Minutes | 0 (0.0%) | 0 (0.0%) |
| 60 to 89 Minutes | 2 (22.2%) | 5 (100.0%) |
| 90 or more Minutes | 0 (0.0%) | 0 (0.0%) |
Time of Departure to Work by Sex in Lake Santeetlah
The most frequent times of departure to work in Lake Santeetlah are 6:30 AM to 6:59 AM (5, 55.6%) for males and 6:30 AM to 6:59 AM (5, 100.0%) for females.
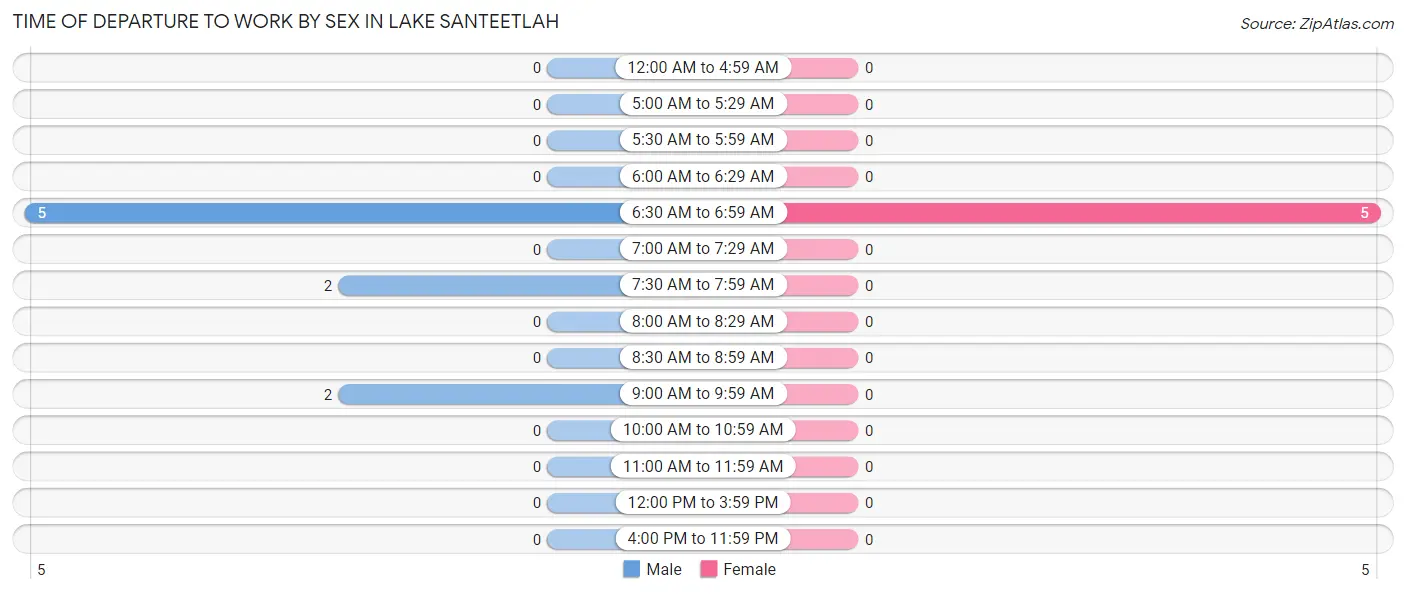
| Time of Departure | Male | Female |
| 12:00 AM to 4:59 AM | 0 (0.0%) | 0 (0.0%) |
| 5:00 AM to 5:29 AM | 0 (0.0%) | 0 (0.0%) |
| 5:30 AM to 5:59 AM | 0 (0.0%) | 0 (0.0%) |
| 6:00 AM to 6:29 AM | 0 (0.0%) | 0 (0.0%) |
| 6:30 AM to 6:59 AM | 5 (55.6%) | 5 (100.0%) |
| 7:00 AM to 7:29 AM | 0 (0.0%) | 0 (0.0%) |
| 7:30 AM to 7:59 AM | 2 (22.2%) | 0 (0.0%) |
| 8:00 AM to 8:29 AM | 0 (0.0%) | 0 (0.0%) |
| 8:30 AM to 8:59 AM | 0 (0.0%) | 0 (0.0%) |
| 9:00 AM to 9:59 AM | 2 (22.2%) | 0 (0.0%) |
| 10:00 AM to 10:59 AM | 0 (0.0%) | 0 (0.0%) |
| 11:00 AM to 11:59 AM | 0 (0.0%) | 0 (0.0%) |
| 12:00 PM to 3:59 PM | 0 (0.0%) | 0 (0.0%) |
| 4:00 PM to 11:59 PM | 0 (0.0%) | 0 (0.0%) |
| Total | 9 (100.0%) | 5 (100.0%) |
Housing Occupancy in Lake Santeetlah
Occupancy by Ownership in Lake Santeetlah
Of the total 36 dwellings in Lake Santeetlah, owner-occupied units account for 31 (86.1%), while renter-occupied units make up 5 (13.9%).
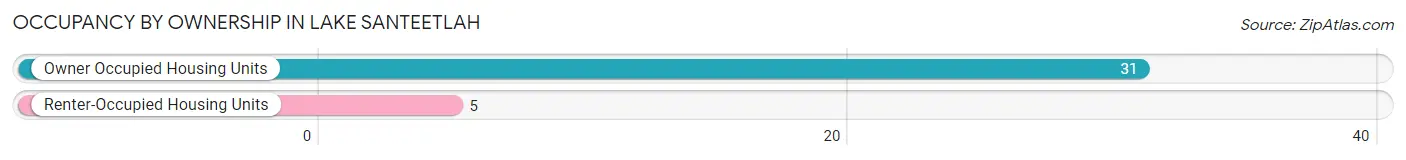
| Occupancy | # Housing Units | % Housing Units |
| Owner Occupied Housing Units | 31 | 86.1% |
| Renter-Occupied Housing Units | 5 | 13.9% |
| Total Occupied Housing Units | 36 | 100.0% |
Occupancy by Household Size in Lake Santeetlah
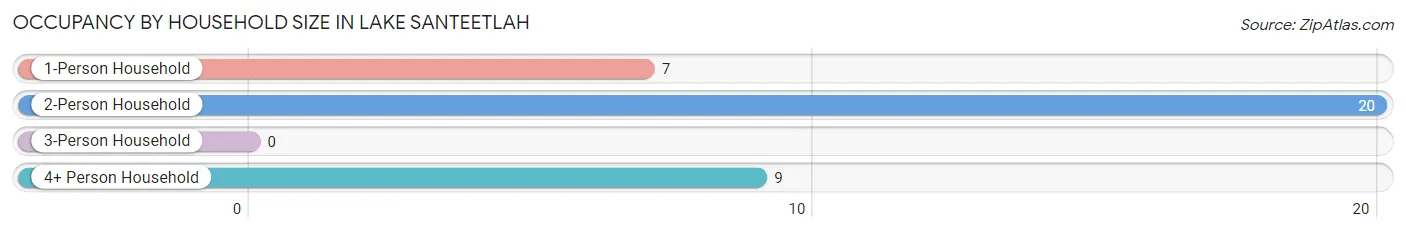
| Household Size | # Housing Units | % Housing Units |
| 1-Person Household | 7 | 19.4% |
| 2-Person Household | 20 | 55.6% |
| 3-Person Household | 0 | 0.0% |
| 4+ Person Household | 9 | 25.0% |
| Total Housing Units | 36 | 100.0% |
Occupancy by Ownership by Household Size in Lake Santeetlah
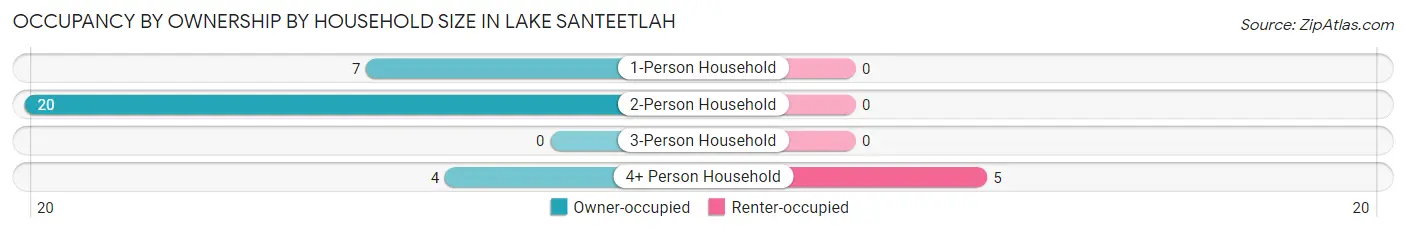
| Household Size | Owner-occupied | Renter-occupied |
| 1-Person Household | 7 (100.0%) | 0 (0.0%) |
| 2-Person Household | 20 (100.0%) | 0 (0.0%) |
| 3-Person Household | 0 (0.0%) | 0 (0.0%) |
| 4+ Person Household | 4 (44.4%) | 5 (55.6%) |
| Total Housing Units | 31 (86.1%) | 5 (13.9%) |
Occupancy by Educational Attainment in Lake Santeetlah
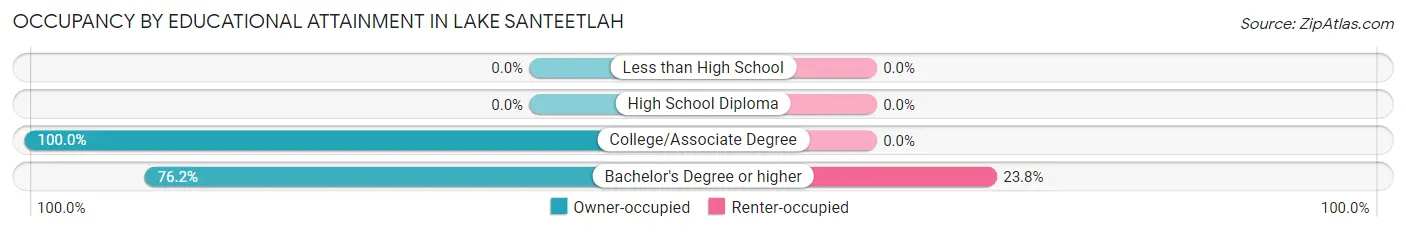
| Household Size | Owner-occupied | Renter-occupied |
| Less than High School | 0 (0.0%) | 0 (0.0%) |
| High School Diploma | 0 (0.0%) | 0 (0.0%) |
| College/Associate Degree | 15 (100.0%) | 0 (0.0%) |
| Bachelor's Degree or higher | 16 (76.2%) | 5 (23.8%) |
Occupancy by Age of Householder in Lake Santeetlah
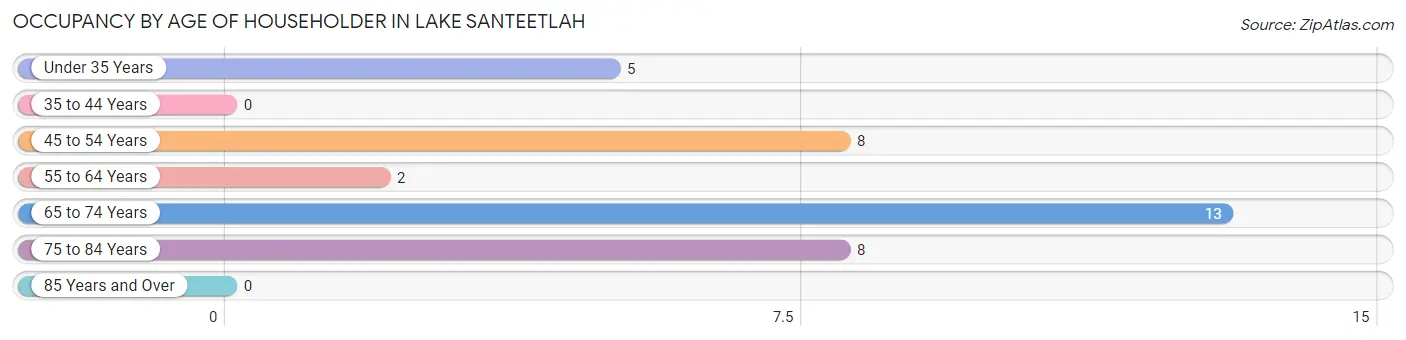
| Age Bracket | # Households | % Households |
| Under 35 Years | 5 | 13.9% |
| 35 to 44 Years | 0 | 0.0% |
| 45 to 54 Years | 8 | 22.2% |
| 55 to 64 Years | 2 | 5.6% |
| 65 to 74 Years | 13 | 36.1% |
| 75 to 84 Years | 8 | 22.2% |
| 85 Years and Over | 0 | 0.0% |
| Total | 36 | 100.0% |
Housing Finances in Lake Santeetlah
Median Income by Occupancy in Lake Santeetlah
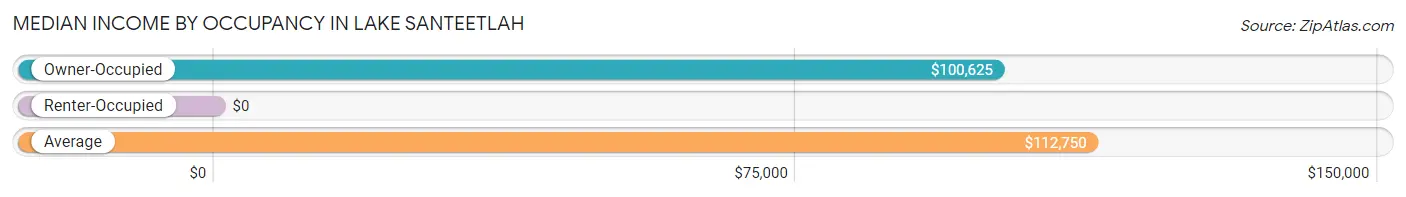
| Occupancy Type | # Households | Median Income |
| Owner-Occupied | 31 (86.1%) | $100,625 |
| Renter-Occupied | 5 (13.9%) | $0 |
| Average | 36 (100.0%) | $112,750 |
Occupancy by Householder Income Bracket in Lake Santeetlah
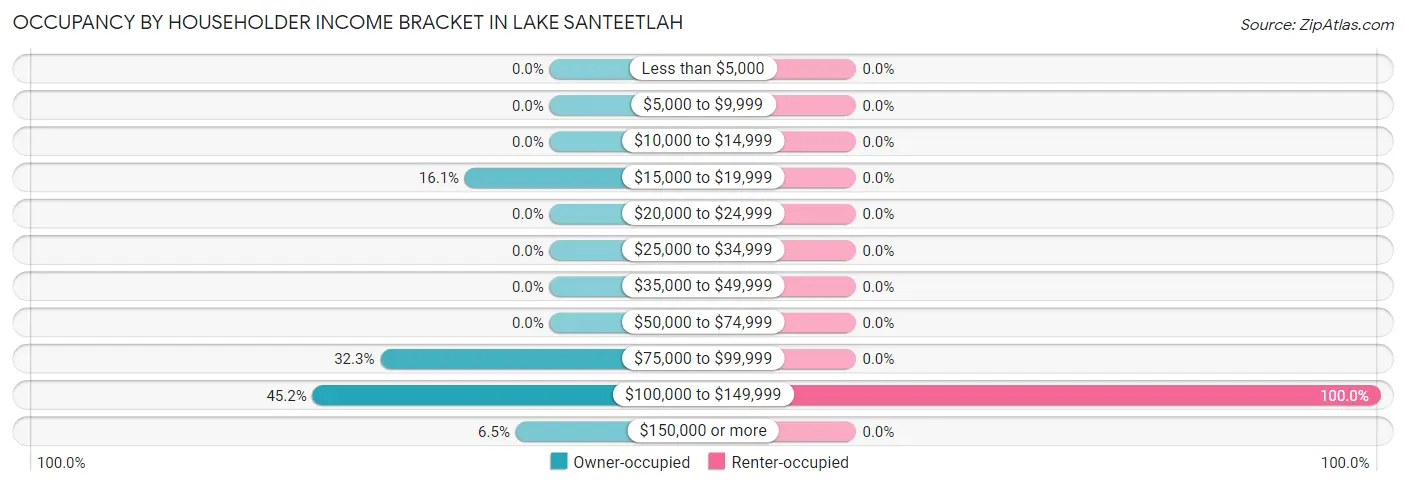
| Income Bracket | Owner-occupied | Renter-occupied |
| Less than $5,000 | 0 (0.0%) | 0 (0.0%) |
| $5,000 to $9,999 | 0 (0.0%) | 0 (0.0%) |
| $10,000 to $14,999 | 0 (0.0%) | 0 (0.0%) |
| $15,000 to $19,999 | 5 (16.1%) | 0 (0.0%) |
| $20,000 to $24,999 | 0 (0.0%) | 0 (0.0%) |
| $25,000 to $34,999 | 0 (0.0%) | 0 (0.0%) |
| $35,000 to $49,999 | 0 (0.0%) | 0 (0.0%) |
| $50,000 to $74,999 | 0 (0.0%) | 0 (0.0%) |
| $75,000 to $99,999 | 10 (32.3%) | 0 (0.0%) |
| $100,000 to $149,999 | 14 (45.2%) | 5 (100.0%) |
| $150,000 or more | 2 (6.5%) | 0 (0.0%) |
| Total | 31 (100.0%) | 5 (100.0%) |
Monthly Housing Cost Tiers in Lake Santeetlah
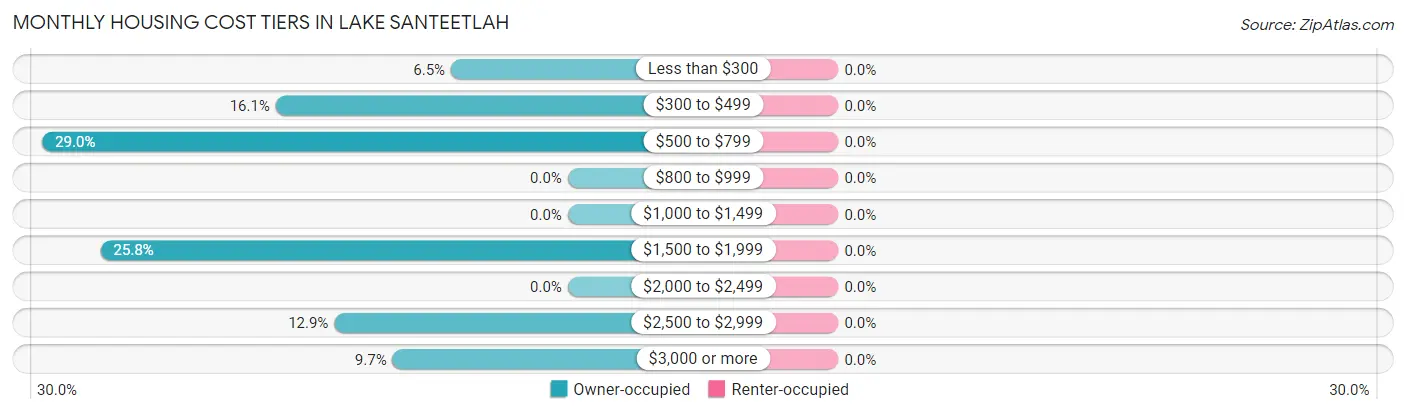
| Monthly Cost | Owner-occupied | Renter-occupied |
| Less than $300 | 2 (6.5%) | 0 (0.0%) |
| $300 to $499 | 5 (16.1%) | 0 (0.0%) |
| $500 to $799 | 9 (29.0%) | 0 (0.0%) |
| $800 to $999 | 0 (0.0%) | 0 (0.0%) |
| $1,000 to $1,499 | 0 (0.0%) | 0 (0.0%) |
| $1,500 to $1,999 | 8 (25.8%) | 0 (0.0%) |
| $2,000 to $2,499 | 0 (0.0%) | 0 (0.0%) |
| $2,500 to $2,999 | 4 (12.9%) | 0 (0.0%) |
| $3,000 or more | 3 (9.7%) | 0 (0.0%) |
| Total | 31 (100.0%) | 5 (100.0%) |
Physical Housing Characteristics in Lake Santeetlah
Housing Structures in Lake Santeetlah
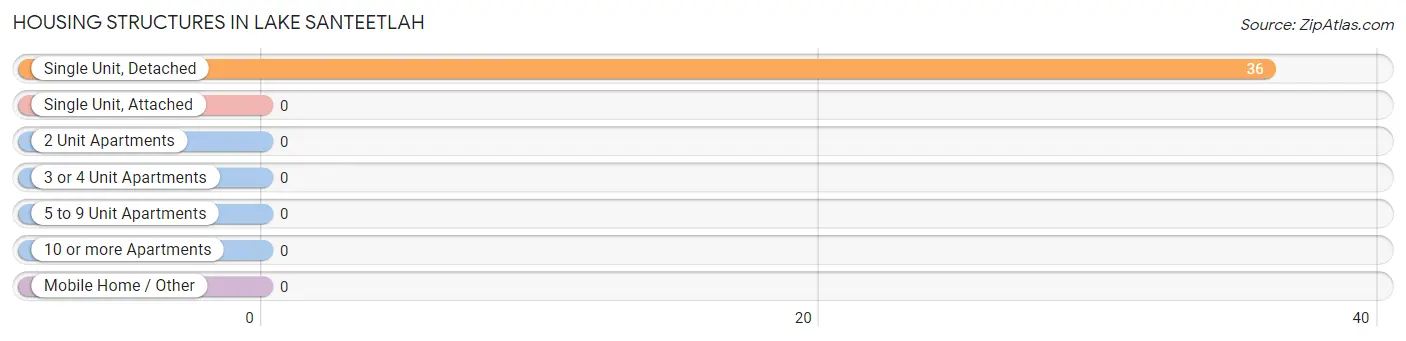
| Structure Type | # Housing Units | % Housing Units |
| Single Unit, Detached | 36 | 100.0% |
| Single Unit, Attached | 0 | 0.0% |
| 2 Unit Apartments | 0 | 0.0% |
| 3 or 4 Unit Apartments | 0 | 0.0% |
| 5 to 9 Unit Apartments | 0 | 0.0% |
| 10 or more Apartments | 0 | 0.0% |
| Mobile Home / Other | 0 | 0.0% |
| Total | 36 | 100.0% |
Housing Structures by Occupancy in Lake Santeetlah
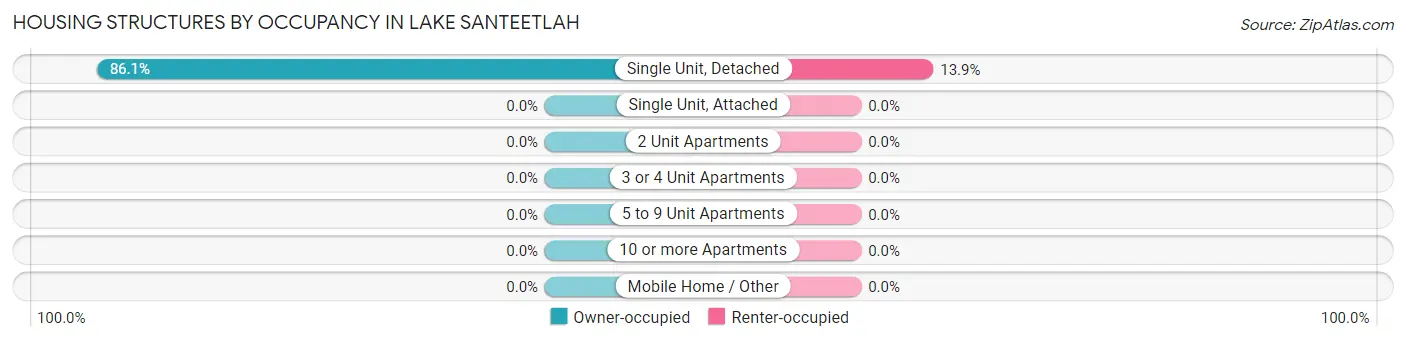
| Structure Type | Owner-occupied | Renter-occupied |
| Single Unit, Detached | 31 (86.1%) | 5 (13.9%) |
| Single Unit, Attached | 0 (0.0%) | 0 (0.0%) |
| 2 Unit Apartments | 0 (0.0%) | 0 (0.0%) |
| 3 or 4 Unit Apartments | 0 (0.0%) | 0 (0.0%) |
| 5 to 9 Unit Apartments | 0 (0.0%) | 0 (0.0%) |
| 10 or more Apartments | 0 (0.0%) | 0 (0.0%) |
| Mobile Home / Other | 0 (0.0%) | 0 (0.0%) |
| Total | 31 (86.1%) | 5 (13.9%) |
Housing Structures by Number of Rooms in Lake Santeetlah
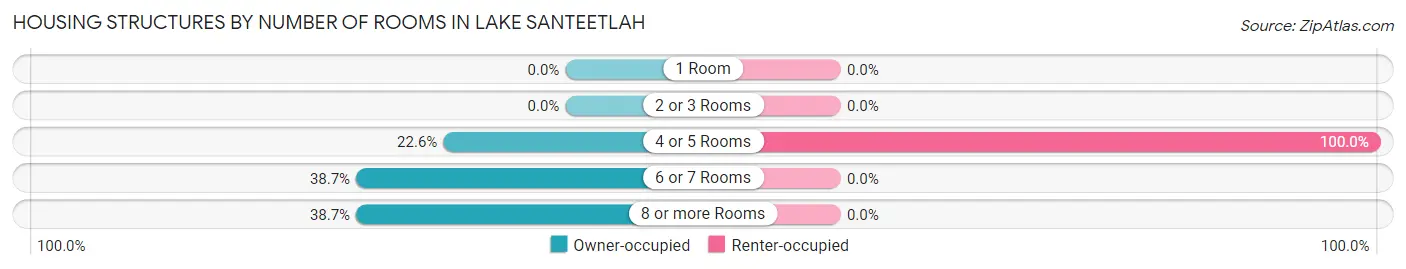
| Number of Rooms | Owner-occupied | Renter-occupied |
| 1 Room | 0 (0.0%) | 0 (0.0%) |
| 2 or 3 Rooms | 0 (0.0%) | 0 (0.0%) |
| 4 or 5 Rooms | 7 (22.6%) | 5 (100.0%) |
| 6 or 7 Rooms | 12 (38.7%) | 0 (0.0%) |
| 8 or more Rooms | 12 (38.7%) | 0 (0.0%) |
| Total | 31 (100.0%) | 5 (100.0%) |
Housing Structure by Heating Type in Lake Santeetlah
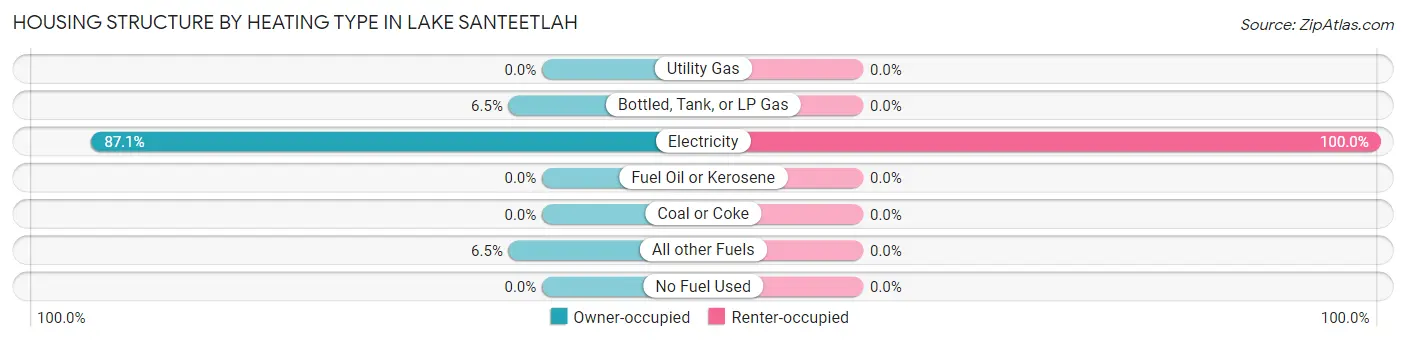
| Heating Type | Owner-occupied | Renter-occupied |
| Utility Gas | 0 (0.0%) | 0 (0.0%) |
| Bottled, Tank, or LP Gas | 2 (6.5%) | 0 (0.0%) |
| Electricity | 27 (87.1%) | 5 (100.0%) |
| Fuel Oil or Kerosene | 0 (0.0%) | 0 (0.0%) |
| Coal or Coke | 0 (0.0%) | 0 (0.0%) |
| All other Fuels | 2 (6.5%) | 0 (0.0%) |
| No Fuel Used | 0 (0.0%) | 0 (0.0%) |
| Total | 31 (100.0%) | 5 (100.0%) |
Household Vehicle Usage in Lake Santeetlah
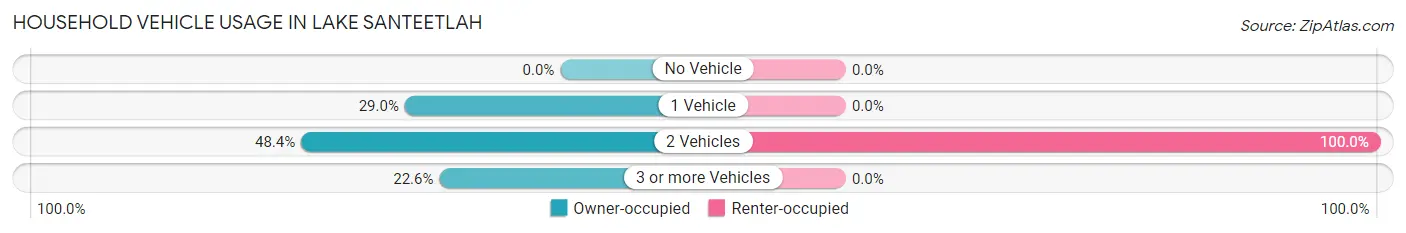
| Vehicles per Household | Owner-occupied | Renter-occupied |
| No Vehicle | 0 (0.0%) | 0 (0.0%) |
| 1 Vehicle | 9 (29.0%) | 0 (0.0%) |
| 2 Vehicles | 15 (48.4%) | 5 (100.0%) |
| 3 or more Vehicles | 7 (22.6%) | 0 (0.0%) |
| Total | 31 (100.0%) | 5 (100.0%) |
Real Estate & Mortgages in Lake Santeetlah
Real Estate and Mortgage Overview in Lake Santeetlah
| Characteristic | Without Mortgage | With Mortgage |
| Housing Units | 16 | 15 |
| Median Property Value | $420,000 | $425,000 |
| Median Household Income | - | - |
| Monthly Housing Costs | $550 | $3 |
| Real Estate Taxes | $2,429 | $0 |
Property Value by Mortgage Status in Lake Santeetlah
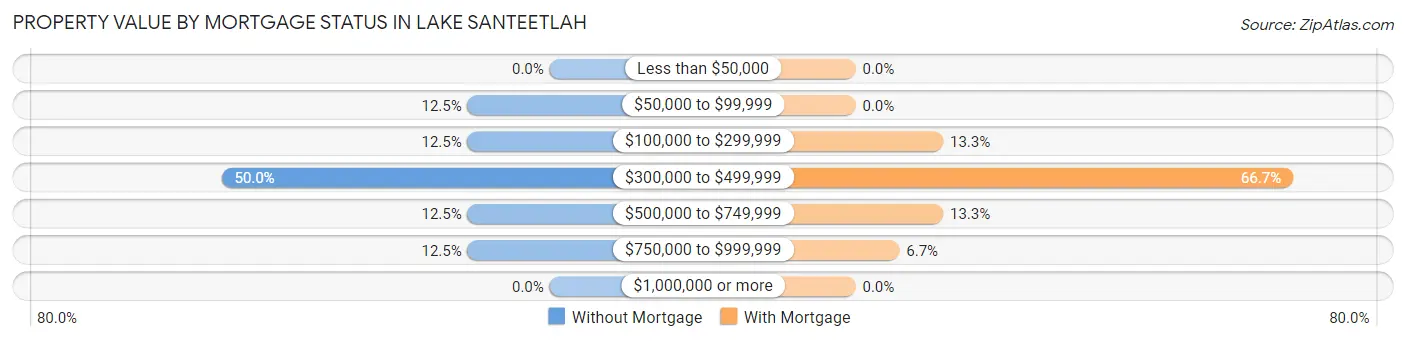
| Property Value | Without Mortgage | With Mortgage |
| Less than $50,000 | 0 (0.0%) | 0 (0.0%) |
| $50,000 to $99,999 | 2 (12.5%) | 0 (0.0%) |
| $100,000 to $299,999 | 2 (12.5%) | 2 (13.3%) |
| $300,000 to $499,999 | 8 (50.0%) | 10 (66.7%) |
| $500,000 to $749,999 | 2 (12.5%) | 2 (13.3%) |
| $750,000 to $999,999 | 2 (12.5%) | 1 (6.7%) |
| $1,000,000 or more | 0 (0.0%) | 0 (0.0%) |
| Total | 16 (100.0%) | 15 (100.0%) |
Household Income by Mortgage Status in Lake Santeetlah
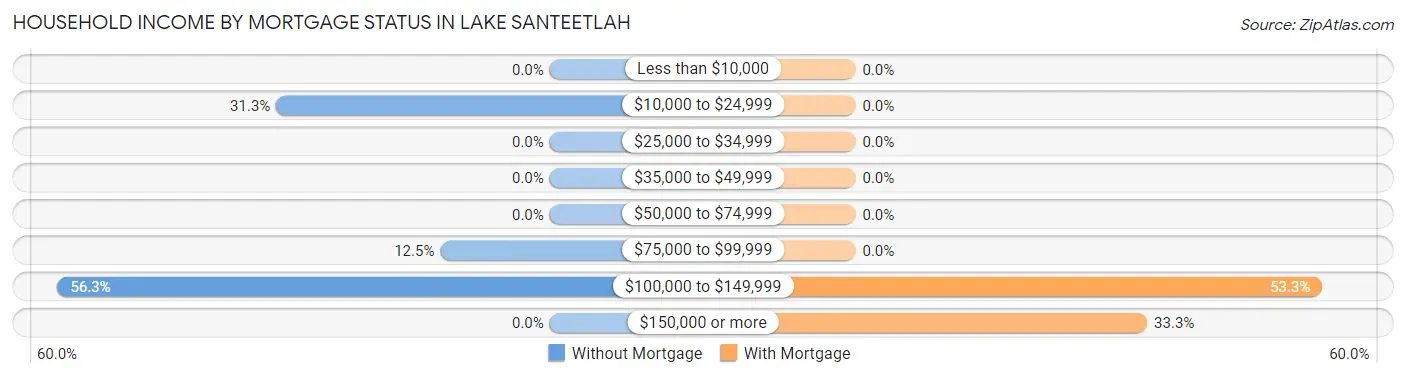
| Household Income | Without Mortgage | With Mortgage |
| Less than $10,000 | 0 (0.0%) | 0 (0.0%) |
| $10,000 to $24,999 | 5 (31.2%) | 0 (0.0%) |
| $25,000 to $34,999 | 0 (0.0%) | 0 (0.0%) |
| $35,000 to $49,999 | 0 (0.0%) | 0 (0.0%) |
| $50,000 to $74,999 | 0 (0.0%) | 0 (0.0%) |
| $75,000 to $99,999 | 2 (12.5%) | 0 (0.0%) |
| $100,000 to $149,999 | 9 (56.2%) | 8 (53.3%) |
| $150,000 or more | 0 (0.0%) | 5 (33.3%) |
| Total | 16 (100.0%) | 15 (100.0%) |
Property Value to Household Income Ratio in Lake Santeetlah
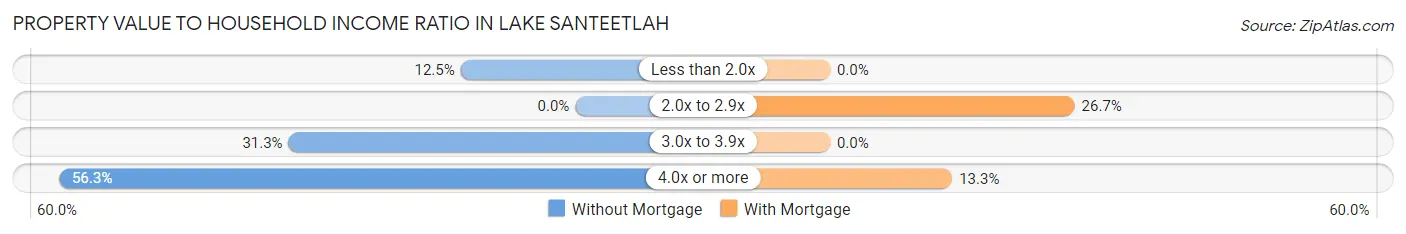
| Value-to-Income Ratio | Without Mortgage | With Mortgage |
| Less than 2.0x | 2 (12.5%) | 0 (0.0%) |
| 2.0x to 2.9x | 0 (0.0%) | 4 (26.7%) |
| 3.0x to 3.9x | 5 (31.2%) | 0 (0.0%) |
| 4.0x or more | 9 (56.2%) | 2 (13.3%) |
| Total | 16 (100.0%) | 15 (100.0%) |
Real Estate Taxes by Mortgage Status in Lake Santeetlah
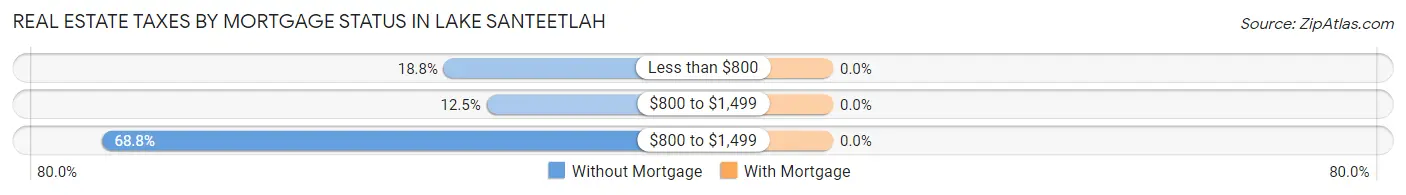
| Property Taxes | Without Mortgage | With Mortgage |
| Less than $800 | 3 (18.8%) | 0 (0.0%) |
| $800 to $1,499 | 2 (12.5%) | 0 (0.0%) |
| $800 to $1,499 | 11 (68.8%) | 0 (0.0%) |
| Total | 16 (100.0%) | 15 (100.0%) |
Health & Disability in Lake Santeetlah
Health Insurance Coverage by Age in Lake Santeetlah
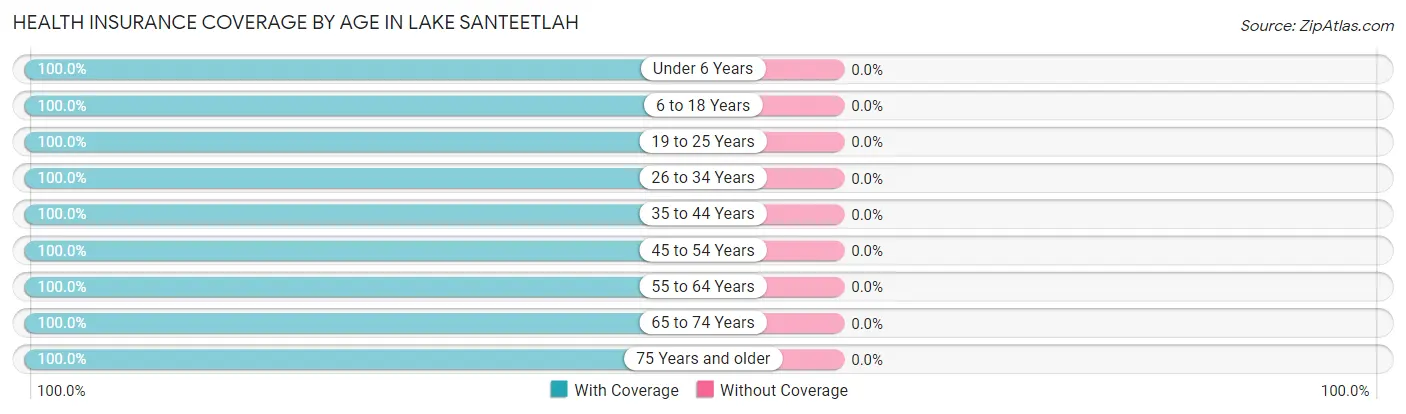
| Age Bracket | With Coverage | Without Coverage |
| Under 6 Years | 15 (100.0%) | 0 (0.0%) |
| 6 to 18 Years | 12 (100.0%) | 0 (0.0%) |
| 19 to 25 Years | 16 (100.0%) | 0 (0.0%) |
| 26 to 34 Years | 10 (100.0%) | 0 (0.0%) |
| 35 to 44 Years | 1 (100.0%) | 0 (0.0%) |
| 45 to 54 Years | 18 (100.0%) | 0 (0.0%) |
| 55 to 64 Years | 8 (100.0%) | 0 (0.0%) |
| 65 to 74 Years | 32 (100.0%) | 0 (0.0%) |
| 75 Years and older | 9 (100.0%) | 0 (0.0%) |
| Total | 121 (100.0%) | 0 (0.0%) |
Health Insurance Coverage by Citizenship Status in Lake Santeetlah
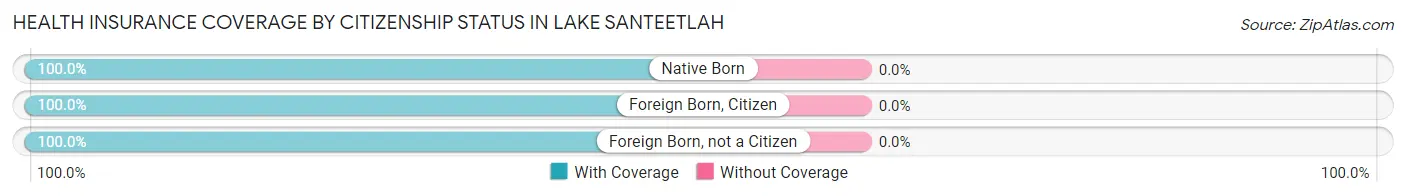
| Citizenship Status | With Coverage | Without Coverage |
| Native Born | 15 (100.0%) | 0 (0.0%) |
| Foreign Born, Citizen | 12 (100.0%) | 0 (0.0%) |
| Foreign Born, not a Citizen | 16 (100.0%) | 0 (0.0%) |
Health Insurance Coverage by Household Income in Lake Santeetlah
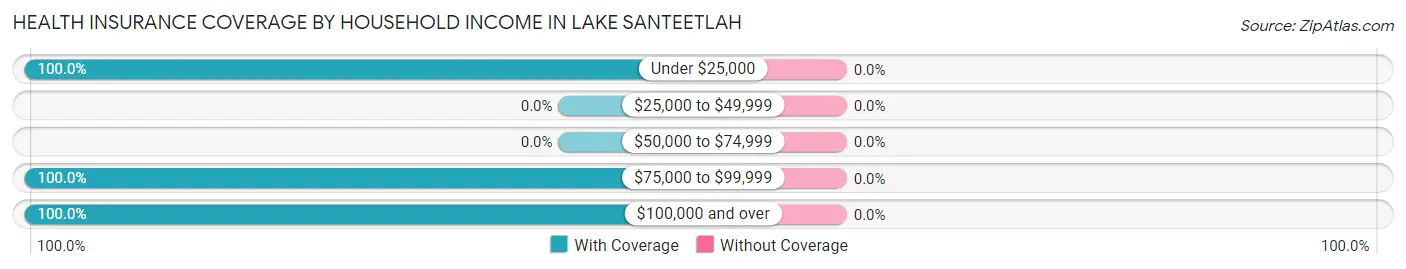
| Household Income | With Coverage | Without Coverage |
| Under $25,000 | 5 (100.0%) | 0 (0.0%) |
| $25,000 to $49,999 | 0 (0.0%) | 0 (0.0%) |
| $50,000 to $74,999 | 0 (0.0%) | 0 (0.0%) |
| $75,000 to $99,999 | 65 (100.0%) | 0 (0.0%) |
| $100,000 and over | 51 (100.0%) | 0 (0.0%) |
Public vs Private Health Insurance Coverage by Age in Lake Santeetlah
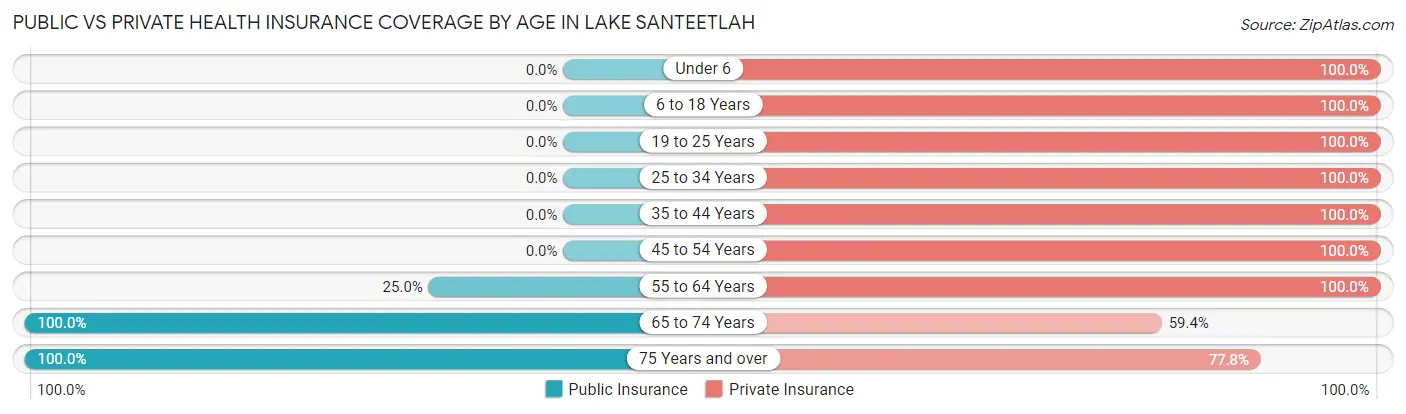
| Age Bracket | Public Insurance | Private Insurance |
| Under 6 | 0 (0.0%) | 15 (100.0%) |
| 6 to 18 Years | 0 (0.0%) | 12 (100.0%) |
| 19 to 25 Years | 0 (0.0%) | 16 (100.0%) |
| 25 to 34 Years | 0 (0.0%) | 10 (100.0%) |
| 35 to 44 Years | 0 (0.0%) | 1 (100.0%) |
| 45 to 54 Years | 0 (0.0%) | 18 (100.0%) |
| 55 to 64 Years | 2 (25.0%) | 8 (100.0%) |
| 65 to 74 Years | 32 (100.0%) | 19 (59.4%) |
| 75 Years and over | 9 (100.0%) | 7 (77.8%) |
| Total | 43 (35.5%) | 106 (87.6%) |
Disability Status by Sex by Age in Lake Santeetlah
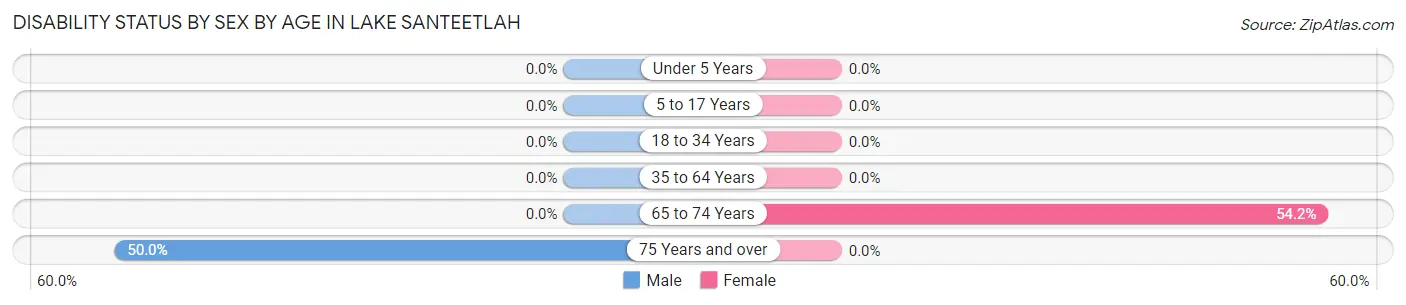
| Age Bracket | Male | Female |
| Under 5 Years | 0 (0.0%) | 0 (0.0%) |
| 5 to 17 Years | 0 (0.0%) | 0 (0.0%) |
| 18 to 34 Years | 0 (0.0%) | 0 (0.0%) |
| 35 to 64 Years | 0 (0.0%) | 0 (0.0%) |
| 65 to 74 Years | 0 (0.0%) | 13 (54.2%) |
| 75 Years and over | 4 (50.0%) | 0 (0.0%) |
Disability Class by Sex by Age in Lake Santeetlah
Disability Class: Hearing Difficulty
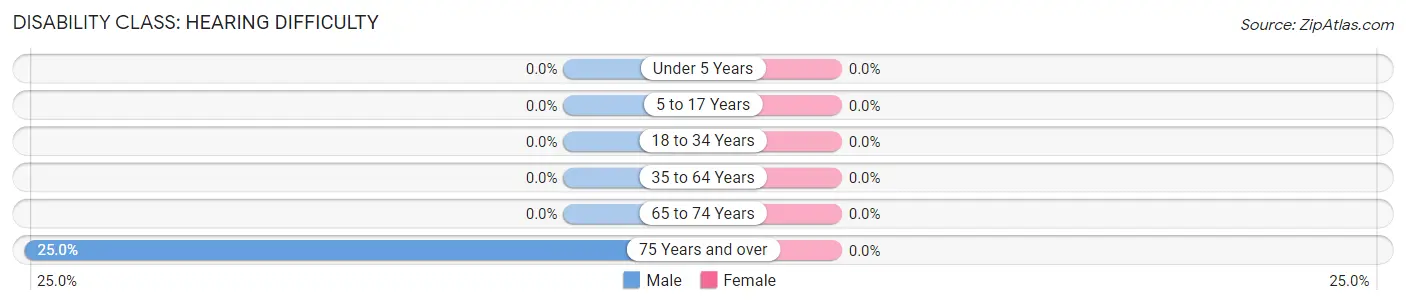
| Age Bracket | Male | Female |
| Under 5 Years | 0 (0.0%) | 0 (0.0%) |
| 5 to 17 Years | 0 (0.0%) | 0 (0.0%) |
| 18 to 34 Years | 0 (0.0%) | 0 (0.0%) |
| 35 to 64 Years | 0 (0.0%) | 0 (0.0%) |
| 65 to 74 Years | 0 (0.0%) | 0 (0.0%) |
| 75 Years and over | 2 (25.0%) | 0 (0.0%) |
Disability Class: Vision Difficulty
| Age Bracket | Male | Female |
| Under 5 Years | 0 (0.0%) | 0 (0.0%) |
| 5 to 17 Years | 0 (0.0%) | 0 (0.0%) |
| 18 to 34 Years | 0 (0.0%) | 0 (0.0%) |
| 35 to 64 Years | 0 (0.0%) | 0 (0.0%) |
| 65 to 74 Years | 0 (0.0%) | 0 (0.0%) |
| 75 Years and over | 0 (0.0%) | 0 (0.0%) |
Disability Class: Cognitive Difficulty
| Age Bracket | Male | Female |
| 5 to 17 Years | 0 (0.0%) | 0 (0.0%) |
| 18 to 34 Years | 0 (0.0%) | 0 (0.0%) |
| 35 to 64 Years | 0 (0.0%) | 0 (0.0%) |
| 65 to 74 Years | 0 (0.0%) | 0 (0.0%) |
| 75 Years and over | 0 (0.0%) | 0 (0.0%) |
Disability Class: Ambulatory Difficulty
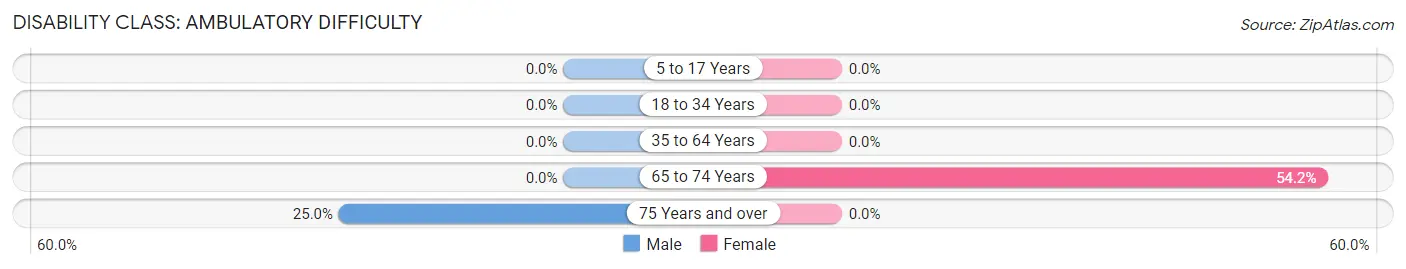
| Age Bracket | Male | Female |
| 5 to 17 Years | 0 (0.0%) | 0 (0.0%) |
| 18 to 34 Years | 0 (0.0%) | 0 (0.0%) |
| 35 to 64 Years | 0 (0.0%) | 0 (0.0%) |
| 65 to 74 Years | 0 (0.0%) | 13 (54.2%) |
| 75 Years and over | 2 (25.0%) | 0 (0.0%) |
Disability Class: Self-Care Difficulty
| Age Bracket | Male | Female |
| 5 to 17 Years | 0 (0.0%) | 0 (0.0%) |
| 18 to 34 Years | 0 (0.0%) | 0 (0.0%) |
| 35 to 64 Years | 0 (0.0%) | 0 (0.0%) |
| 65 to 74 Years | 0 (0.0%) | 0 (0.0%) |
| 75 Years and over | 0 (0.0%) | 0 (0.0%) |
Technology Access in Lake Santeetlah
Computing Device Access in Lake Santeetlah
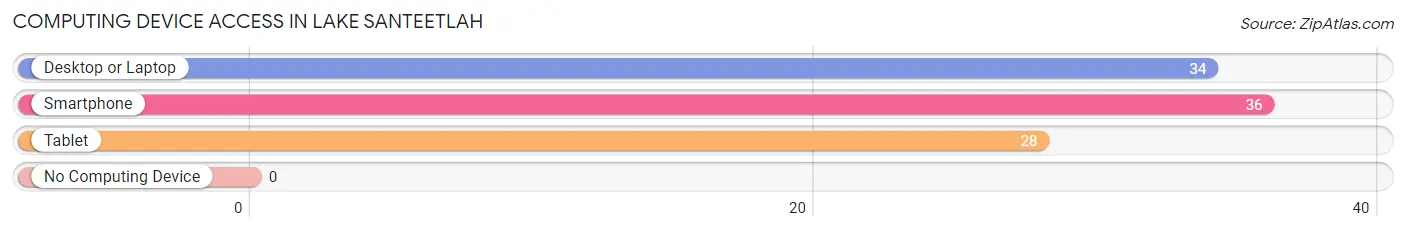
| Device Type | # Households | % Households |
| Desktop or Laptop | 34 | 94.4% |
| Smartphone | 36 | 100.0% |
| Tablet | 28 | 77.8% |
| No Computing Device | 0 | 0.0% |
| Total | 36 | 100.0% |
Internet Access in Lake Santeetlah
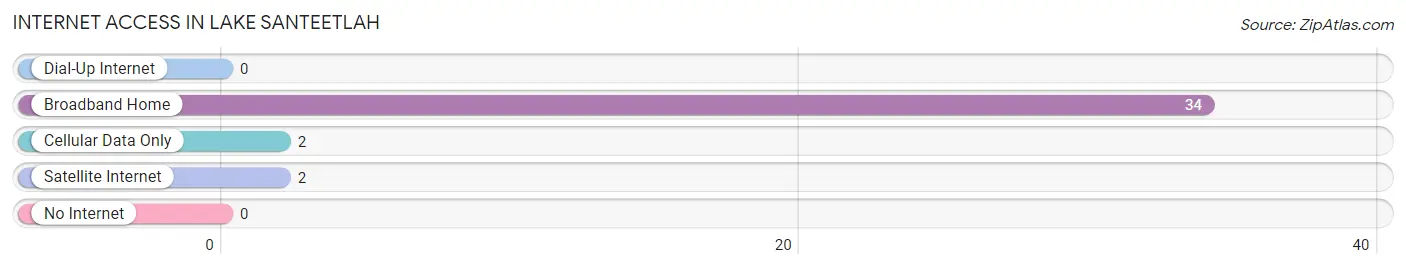
| Internet Type | # Households | % Households |
| Dial-Up Internet | 0 | 0.0% |
| Broadband Home | 34 | 94.4% |
| Cellular Data Only | 2 | 5.6% |
| Satellite Internet | 2 | 5.6% |
| No Internet | 0 | 0.0% |
| Total | 36 | 100.0% |
Lake Santeetlah Summary
History
Lake Santeetlah is a lake located in the Nantahala National Forest in Graham County, North Carolina. It was created in 1928 when the Santeetlah Dam was built on the Cheoah River. The lake is named after the Santeetlah Indians, a Cherokee tribe that once lived in the area. The lake is a popular destination for fishing, boating, and camping.
The area around Lake Santeetlah has a long history of human habitation. The Santeetlah Indians were the first known inhabitants of the area, and they lived in the area for centuries before the arrival of European settlers. The Santeetlah Indians were part of the Cherokee Nation, and they were forcibly removed from the area in the 1830s as part of the Indian Removal Act.
The area around Lake Santeetlah was first settled by European settlers in the late 1800s. The first settlers were mostly farmers and loggers, and they cleared the land for farming and logging. The area was also home to several small towns, including Santeetlah, Robbinsville, and Fontana.
In 1928, the Santeetlah Dam was built on the Cheoah River, creating Lake Santeetlah. The lake was created to provide hydroelectric power to the area, and it quickly became a popular destination for fishing, boating, and camping. The lake is now a popular destination for tourists and locals alike.
Geography
Lake Santeetlah is located in the Nantahala National Forest in Graham County, North Carolina. The lake is approximately 8 miles long and 1 mile wide, and it has a surface area of approximately 2,400 acres. The lake is fed by the Cheoah River, and it is surrounded by the Nantahala National Forest. The lake is located at an elevation of 1,800 feet, and it is surrounded by the Great Smoky Mountains.
The lake is a popular destination for fishing, boating, and camping. There are several boat ramps located around the lake, and there are also several campgrounds located nearby. The lake is also home to several species of fish, including bass, catfish, and trout.
Economy
The economy of Lake Santeetlah is largely based on tourism. The lake is a popular destination for fishing, boating, and camping, and it attracts visitors from all over the country. The lake is also home to several marinas, which provide boat rentals and other services to visitors.
The area around Lake Santeetlah is also home to several small businesses, including restaurants, lodging, and retail stores. The area is also home to several farms, which produce a variety of crops, including corn, soybeans, and tobacco.
Demographics
As of the 2010 census, the population of Lake Santeetlah was 1,845. The population is largely white (94.3%), with small percentages of African American (2.2%), Native American (1.2%), and Asian (0.7%) residents. The median household income in the area is $37,917, and the median age is 44.7 years.
Conclusion
Lake Santeetlah is a popular destination for fishing, boating, and camping in Graham County, North Carolina. The lake was created in 1928 when the Santeetlah Dam was built on the Cheoah River, and it has since become a popular destination for tourists and locals alike. The economy of the area is largely based on tourism, and the population is largely white. The area is also home to several small businesses, farms, and marinas.
Common Questions
What is Per Capita Income in Lake Santeetlah?
Per Capita income in Lake Santeetlah is $31,126.
What is the Median Family Income in Lake Santeetlah?
Median Family Income in Lake Santeetlah is $113,625.
What is the Median Household income in Lake Santeetlah?
Median Household Income in Lake Santeetlah is $112,750.
What is Inequality or Gini Index in Lake Santeetlah?
Inequality or Gini Index in Lake Santeetlah is 0.31.
What is the Total Population of Lake Santeetlah?
Total Population of Lake Santeetlah is 121.
What is the Total Male Population of Lake Santeetlah?
Total Male Population of Lake Santeetlah is 47.
What is the Total Female Population of Lake Santeetlah?
Total Female Population of Lake Santeetlah is 74.
What is the Ratio of Males per 100 Females in Lake Santeetlah?
There are 63.51 Males per 100 Females in Lake Santeetlah.
What is the Ratio of Females per 100 Males in Lake Santeetlah?
There are 157.45 Females per 100 Males in Lake Santeetlah.
What is the Median Population Age in Lake Santeetlah?
Median Population Age in Lake Santeetlah is 49.5 Years.
What is the Average Family Size in Lake Santeetlah
Average Family Size in Lake Santeetlah is 3.9 People.
What is the Average Household Size in Lake Santeetlah
Average Household Size in Lake Santeetlah is 3.4 People.
How Large is the Labor Force in Lake Santeetlah?
There are 25 People in the Labor Forcein in Lake Santeetlah.
What is the Percentage of People in the Labor Force in Lake Santeetlah?
23.6% of People are in the Labor Force in Lake Santeetlah.