Whispering Pines, NC Map & Demographics
Whispering Pines Map
Whispering Pines Overview
$41,538
PER CAPITA INCOME
$115,556
AVG FAMILY INCOME
$105,707
AVG HOUSEHOLD INCOME
38.1%
WAGE / INCOME GAP [ % ]
61.9¢/ $1
WAGE / INCOME GAP [ $ ]
0.35
INEQUALITY / GINI INDEX
4,938
TOTAL POPULATION
2,385
MALE POPULATION
2,553
FEMALE POPULATION
93.42
MALES / 100 FEMALES
107.04
FEMALES / 100 MALES
37.2
MEDIAN AGE
3.1
AVG FAMILY SIZE
2.9
AVG HOUSEHOLD SIZE
2,155
LABOR FORCE [ PEOPLE ]
60.1%
PERCENT IN LABOR FORCE
5.1%
UNEMPLOYMENT RATE
Whispering Pines Area Codes
Income in Whispering Pines
Income Overview in Whispering Pines
Per Capita Income in Whispering Pines is $41,538, while median incomes of families and households are $115,556 and $105,707 respectively.
| Characteristic | Number | Measure |
| Per Capita Income | 4,938 | $41,538 |
| Median Family Income | 1,482 | $115,556 |
| Mean Family Income | 1,482 | $135,268 |
| Median Household Income | 1,712 | $105,707 |
| Mean Household Income | 1,712 | $125,475 |
| Income Deficit | 1,482 | $0 |
| Wage / Income Gap (%) | 4,938 | 38.14% |
| Wage / Income Gap ($) | 4,938 | 61.86¢ per $1 |
| Gini / Inequality Index | 4,938 | 0.35 |
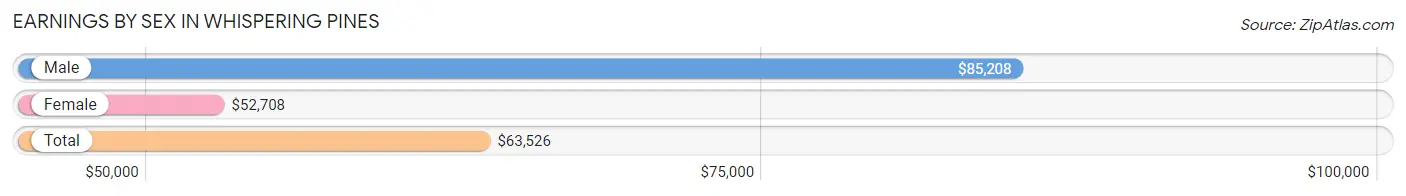
Earnings by Sex in Whispering Pines
Average Earnings in Whispering Pines are $63,526, $85,208 for men and $52,708 for women, a difference of 38.1%.
| Sex | Number | Average Earnings |
| Male | 1,223 (53.4%) | $85,208 |
| Female | 1,067 (46.6%) | $52,708 |
| Total | 2,290 (100.0%) | $63,526 |
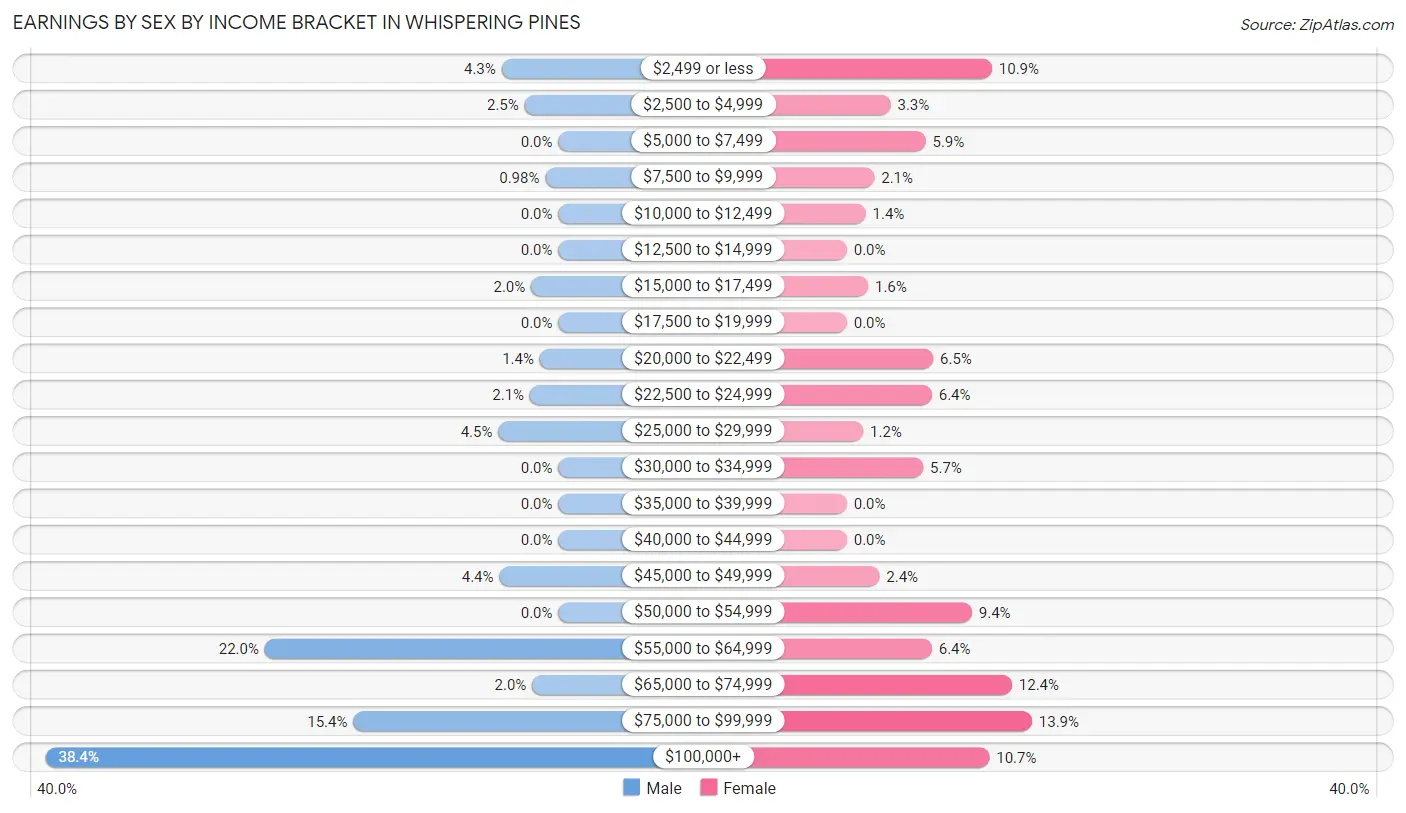
Earnings by Sex by Income Bracket in Whispering Pines
The most common earnings brackets in Whispering Pines are $100,000+ for men (470 | 38.4%) and $75,000 to $99,999 for women (148 | 13.9%).
| Income | Male | Female |
| $2,499 or less | 52 (4.3%) | 116 (10.9%) |
| $2,500 to $4,999 | 31 (2.5%) | 35 (3.3%) |
| $5,000 to $7,499 | 0 (0.0%) | 63 (5.9%) |
| $7,500 to $9,999 | 12 (1.0%) | 22 (2.1%) |
| $10,000 to $12,499 | 0 (0.0%) | 15 (1.4%) |
| $12,500 to $14,999 | 0 (0.0%) | 0 (0.0%) |
| $15,000 to $17,499 | 25 (2.0%) | 17 (1.6%) |
| $17,500 to $19,999 | 0 (0.0%) | 0 (0.0%) |
| $20,000 to $22,499 | 17 (1.4%) | 69 (6.5%) |
| $22,500 to $24,999 | 26 (2.1%) | 68 (6.4%) |
| $25,000 to $29,999 | 55 (4.5%) | 13 (1.2%) |
| $30,000 to $34,999 | 0 (0.0%) | 61 (5.7%) |
| $35,000 to $39,999 | 0 (0.0%) | 0 (0.0%) |
| $40,000 to $44,999 | 0 (0.0%) | 0 (0.0%) |
| $45,000 to $49,999 | 54 (4.4%) | 26 (2.4%) |
| $50,000 to $54,999 | 0 (0.0%) | 100 (9.4%) |
| $55,000 to $64,999 | 269 (22.0%) | 68 (6.4%) |
| $65,000 to $74,999 | 24 (2.0%) | 132 (12.4%) |
| $75,000 to $99,999 | 188 (15.4%) | 148 (13.9%) |
| $100,000+ | 470 (38.4%) | 114 (10.7%) |
| Total | 1,223 (100.0%) | 1,067 (100.0%) |
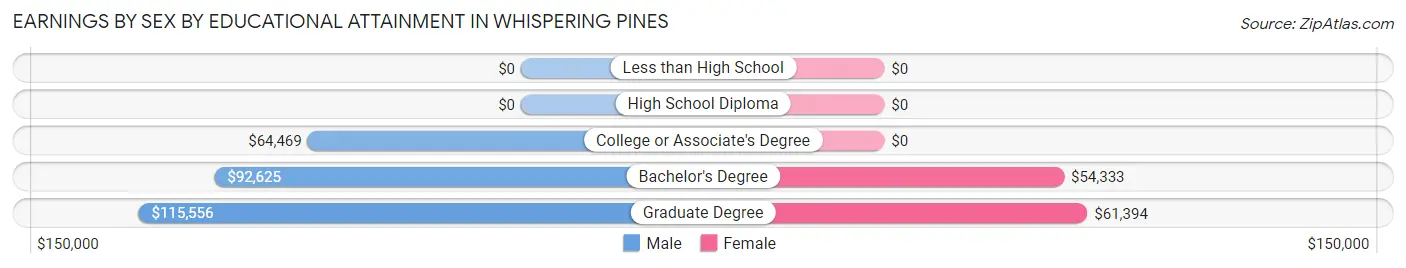
Earnings by Sex by Educational Attainment in Whispering Pines
Average earnings in Whispering Pines are $91,875 for men and $53,093 for women, a difference of 42.2%. Men with an educational attainment of graduate degree enjoy the highest average annual earnings of $115,556, while those with college or associate's degree education earn the least with $64,469. Women with an educational attainment of graduate degree earn the most with the average annual earnings of $61,394, while those with bachelor's degree education have the smallest earnings of $54,333.
| Educational Attainment | Male Income | Female Income |
| Less than High School | - | - |
| High School Diploma | - | - |
| College or Associate's Degree | $64,469 | $0 |
| Bachelor's Degree | $92,625 | $54,333 |
| Graduate Degree | $115,556 | $61,394 |
| Total | $91,875 | $53,093 |
Family Income in Whispering Pines
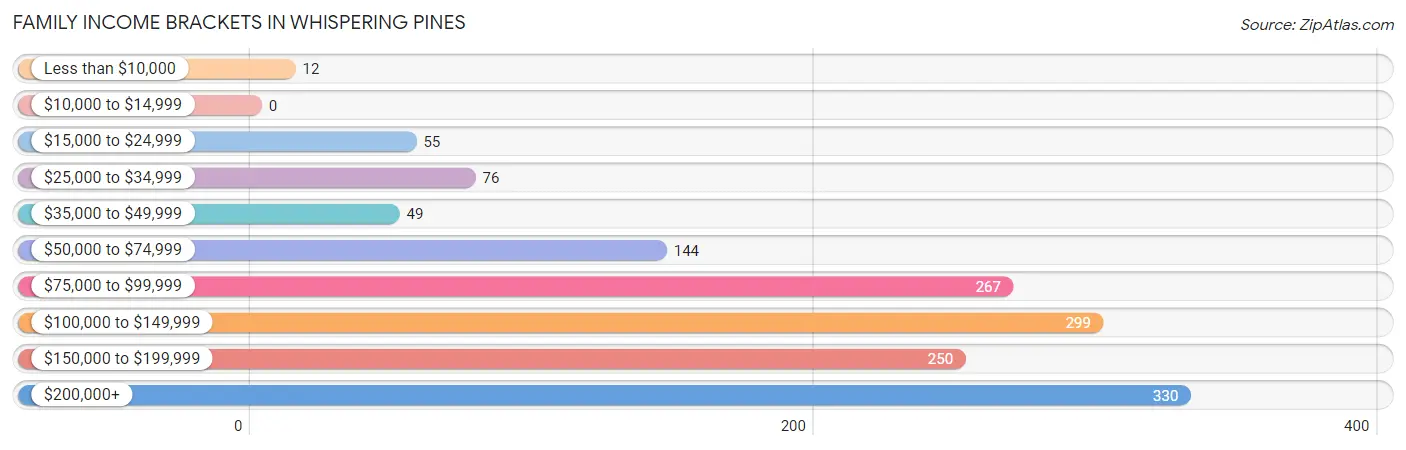
Family Income Brackets in Whispering Pines
According to the Whispering Pines family income data, there are 330 families falling into the $200,000+ income range, which is the most common income bracket and makes up 22.3% of all families.
| Income Bracket | # Families | % Families |
| Less than $10,000 | 12 | 0.8% |
| $10,000 to $14,999 | 0 | 0.0% |
| $15,000 to $24,999 | 55 | 3.7% |
| $25,000 to $34,999 | 76 | 5.1% |
| $35,000 to $49,999 | 49 | 3.3% |
| $50,000 to $74,999 | 144 | 9.7% |
| $75,000 to $99,999 | 267 | 18.0% |
| $100,000 to $149,999 | 299 | 20.2% |
| $150,000 to $199,999 | 250 | 16.9% |
| $200,000+ | 330 | 22.3% |
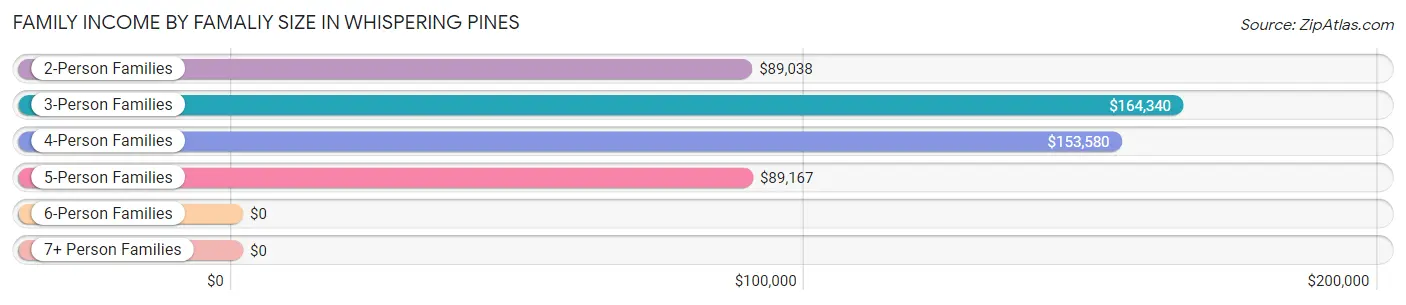
Family Income by Famaliy Size in Whispering Pines
3-person families (423 | 28.5%) account for the highest median family income in Whispering Pines with $164,340 per family, while 3-person families (423 | 28.5%) have the highest median income of $54,780 per family member.
| Income Bracket | # Families | Median Income |
| 2-Person Families | 518 (34.9%) | $89,038 |
| 3-Person Families | 423 (28.5%) | $164,340 |
| 4-Person Families | 251 (16.9%) | $153,580 |
| 5-Person Families | 240 (16.2%) | $89,167 |
| 6-Person Families | 50 (3.4%) | $0 |
| 7+ Person Families | 0 (0.0%) | $0 |
| Total | 1,482 (100.0%) | $115,556 |
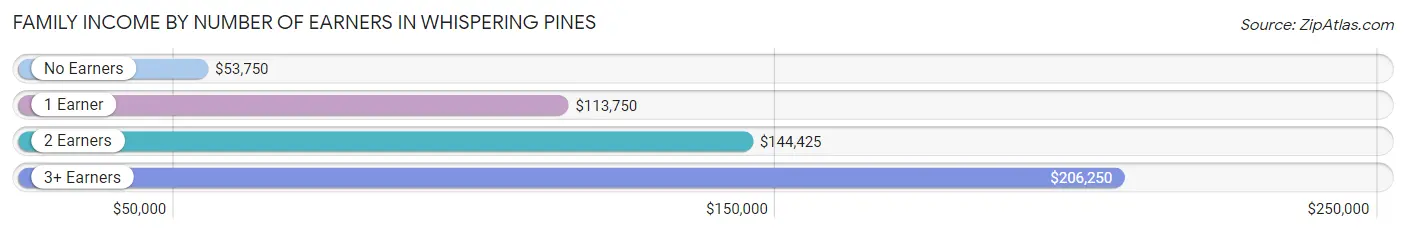
Family Income by Number of Earners in Whispering Pines
The median family income in Whispering Pines is $115,556, with families comprising 3+ earners (43) having the highest median family income of $206,250, while families with no earners (216) have the lowest median family income of $53,750, accounting for 2.9% and 14.6% of families, respectively.
| Number of Earners | # Families | Median Income |
| No Earners | 216 (14.6%) | $53,750 |
| 1 Earner | 330 (22.3%) | $113,750 |
| 2 Earners | 893 (60.3%) | $144,425 |
| 3+ Earners | 43 (2.9%) | $206,250 |
| Total | 1,482 (100.0%) | $115,556 |
Household Income in Whispering Pines
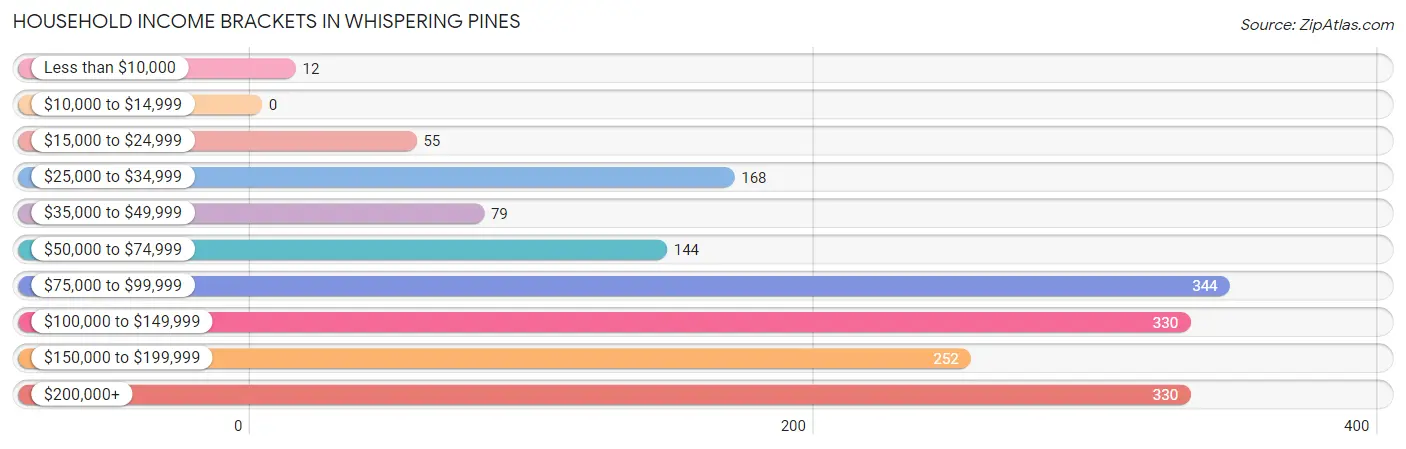
Household Income Brackets in Whispering Pines
With 344 households falling in the category, the $75,000 to $99,999 income range is the most frequent in Whispering Pines, accounting for 20.1% of all households.
| Income Bracket | # Households | % Households |
| Less than $10,000 | 12 | 0.7% |
| $10,000 to $14,999 | 0 | 0.0% |
| $15,000 to $24,999 | 55 | 3.2% |
| $25,000 to $34,999 | 168 | 9.8% |
| $35,000 to $49,999 | 79 | 4.6% |
| $50,000 to $74,999 | 144 | 8.4% |
| $75,000 to $99,999 | 344 | 20.1% |
| $100,000 to $149,999 | 330 | 19.3% |
| $150,000 to $199,999 | 252 | 14.7% |
| $200,000+ | 330 | 19.3% |
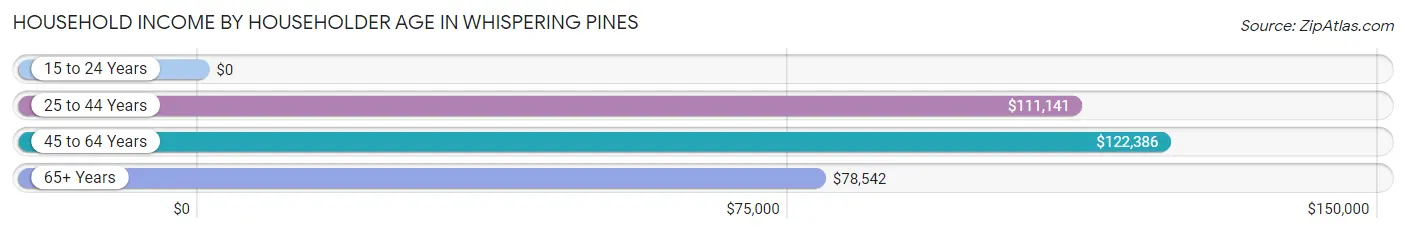
Household Income by Householder Age in Whispering Pines
The median household income in Whispering Pines is $105,707, with the highest median household income of $122,386 found in the 45 to 64 years age bracket for the primary householder. A total of 682 households (39.8%) fall into this category. Meanwhile, the 15 to 24 years age bracket for the primary householder has the lowest median household income of $0, with 33 households (1.9%) in this group.
| Income Bracket | # Households | Median Income |
| 15 to 24 Years | 33 (1.9%) | $0 |
| 25 to 44 Years | 661 (38.6%) | $111,141 |
| 45 to 64 Years | 682 (39.8%) | $122,386 |
| 65+ Years | 336 (19.6%) | $78,542 |
| Total | 1,712 (100.0%) | $105,707 |
Poverty in Whispering Pines
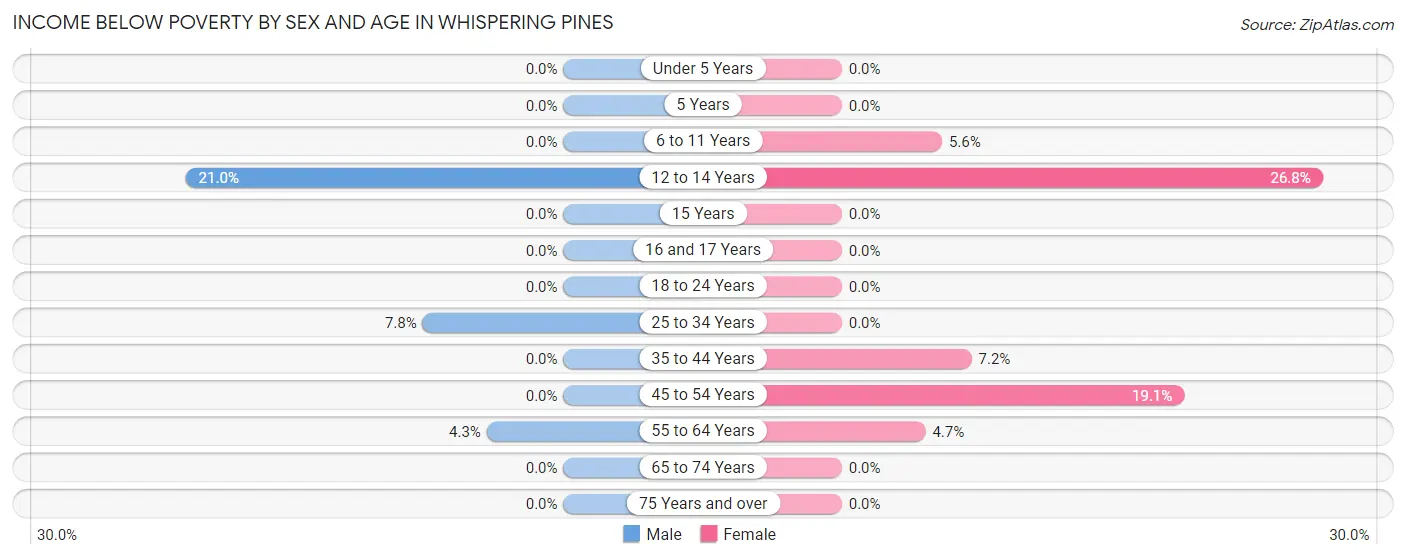
Income Below Poverty by Sex and Age in Whispering Pines
With 2.9% poverty level for males and 6.8% for females among the residents of Whispering Pines, 12 to 14 year old males and 12 to 14 year old females are the most vulnerable to poverty, with 45 males (21.0%) and 34 females (26.8%) in their respective age groups living below the poverty level.
| Age Bracket | Male | Female |
| Under 5 Years | 0 (0.0%) | 0 (0.0%) |
| 5 Years | 0 (0.0%) | 0 (0.0%) |
| 6 to 11 Years | 0 (0.0%) | 26 (5.6%) |
| 12 to 14 Years | 45 (21.0%) | 34 (26.8%) |
| 15 Years | 0 (0.0%) | 0 (0.0%) |
| 16 and 17 Years | 0 (0.0%) | 0 (0.0%) |
| 18 to 24 Years | 0 (0.0%) | 0 (0.0%) |
| 25 to 34 Years | 12 (7.8%) | 0 (0.0%) |
| 35 to 44 Years | 0 (0.0%) | 29 (7.2%) |
| 45 to 54 Years | 0 (0.0%) | 73 (19.1%) |
| 55 to 64 Years | 12 (4.3%) | 11 (4.7%) |
| 65 to 74 Years | 0 (0.0%) | 0 (0.0%) |
| 75 Years and over | 0 (0.0%) | 0 (0.0%) |
| Total | 69 (2.9%) | 173 (6.8%) |
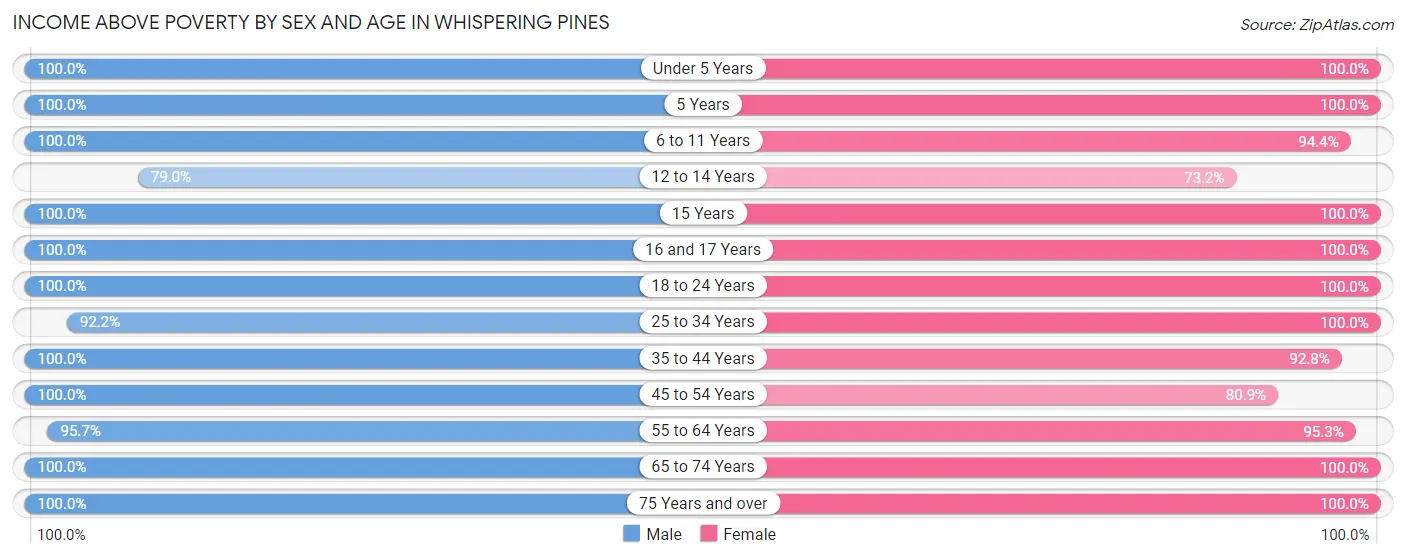
Income Above Poverty by Sex and Age in Whispering Pines
According to the poverty statistics in Whispering Pines, males aged under 5 years and females aged under 5 years are the age groups that are most secure financially, with 100.0% of males and 100.0% of females in these age groups living above the poverty line.
| Age Bracket | Male | Female |
| Under 5 Years | 160 (100.0%) | 105 (100.0%) |
| 5 Years | 62 (100.0%) | 63 (100.0%) |
| 6 to 11 Years | 131 (100.0%) | 440 (94.4%) |
| 12 to 14 Years | 169 (79.0%) | 93 (73.2%) |
| 15 Years | 11 (100.0%) | 14 (100.0%) |
| 16 and 17 Years | 192 (100.0%) | 141 (100.0%) |
| 18 to 24 Years | 159 (100.0%) | 75 (100.0%) |
| 25 to 34 Years | 141 (92.2%) | 217 (100.0%) |
| 35 to 44 Years | 473 (100.0%) | 372 (92.8%) |
| 45 to 54 Years | 236 (100.0%) | 310 (80.9%) |
| 55 to 64 Years | 269 (95.7%) | 225 (95.3%) |
| 65 to 74 Years | 180 (100.0%) | 210 (100.0%) |
| 75 Years and over | 133 (100.0%) | 115 (100.0%) |
| Total | 2,316 (97.1%) | 2,380 (93.2%) |
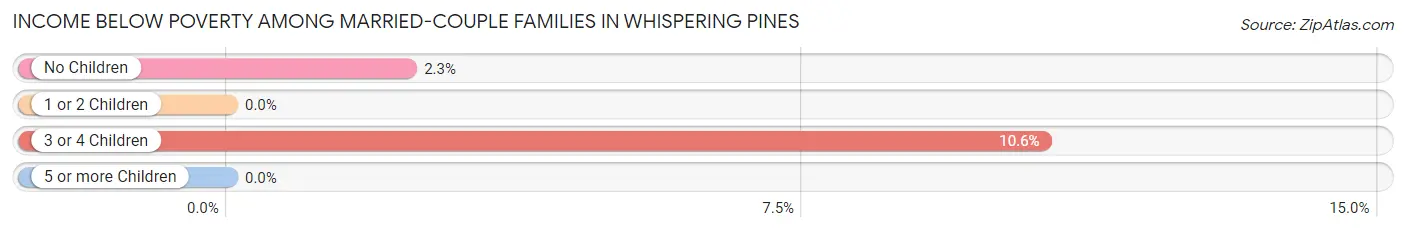
Income Below Poverty Among Married-Couple Families in Whispering Pines
The poverty statistics for married-couple families in Whispering Pines show that 3.2% or 41 of the total 1,300 families live below the poverty line. Families with 3 or 4 children have the highest poverty rate of 10.6%, comprising of 29 families. On the other hand, families with 1 or 2 children have the lowest poverty rate of 0.0%, which includes 0 families.
| Children | Above Poverty | Below Poverty |
| No Children | 501 (97.7%) | 12 (2.3%) |
| 1 or 2 Children | 514 (100.0%) | 0 (0.0%) |
| 3 or 4 Children | 244 (89.4%) | 29 (10.6%) |
| 5 or more Children | 0 (0.0%) | 0 (0.0%) |
| Total | 1,259 (96.9%) | 41 (3.2%) |
Income Below Poverty Among Single-Parent Households in Whispering Pines
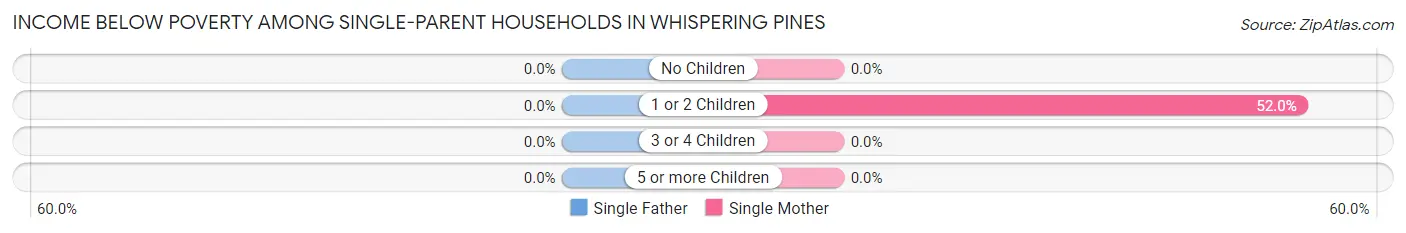
| Children | Single Father | Single Mother |
| No Children | 0 (0.0%) | 0 (0.0%) |
| 1 or 2 Children | 0 (0.0%) | 40 (51.9%) |
| 3 or 4 Children | 0 (0.0%) | 0 (0.0%) |
| 5 or more Children | 0 (0.0%) | 0 (0.0%) |
| Total | 0 (0.0%) | 40 (28.4%) |
Income Below Poverty Among Married-Couple vs Single-Parent Households in Whispering Pines
The poverty data for Whispering Pines shows that 41 of the married-couple family households (3.2%) and 40 of the single-parent households (22.0%) are living below the poverty level. Within the married-couple family households, those with 3 or 4 children have the highest poverty rate, with 29 households (10.6%) falling below the poverty line. Among the single-parent households, those with 1 or 2 children have the highest poverty rate, with 40 household (40.0%) living below poverty.
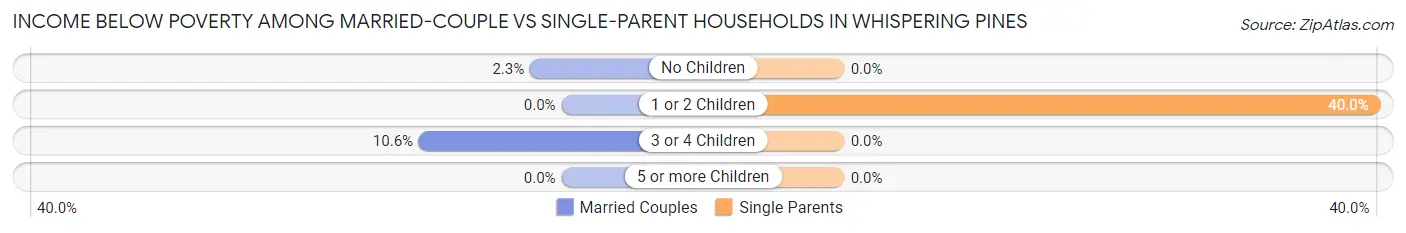
| Children | Married-Couple Families | Single-Parent Households |
| No Children | 12 (2.3%) | 0 (0.0%) |
| 1 or 2 Children | 0 (0.0%) | 40 (40.0%) |
| 3 or 4 Children | 29 (10.6%) | 0 (0.0%) |
| 5 or more Children | 0 (0.0%) | 0 (0.0%) |
| Total | 41 (3.2%) | 40 (22.0%) |
Race in Whispering Pines
The most populous races in Whispering Pines are White / Caucasian (4,463 | 90.4%), Hispanic or Latino (583 | 11.8%), and Two or more Races (216 | 4.4%).
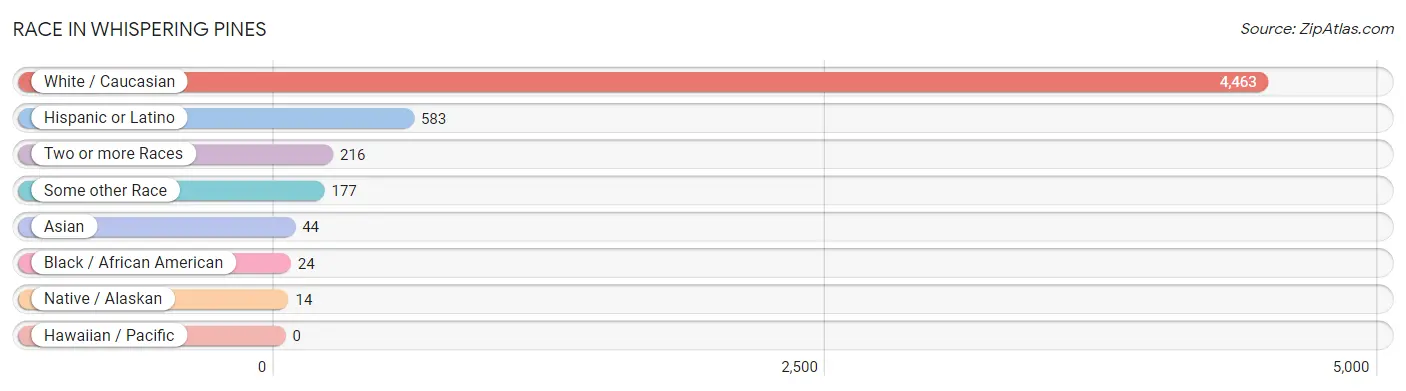
| Race | # Population | % Population |
| Asian | 44 | 0.9% |
| Black / African American | 24 | 0.5% |
| Hawaiian / Pacific | 0 | 0.0% |
| Hispanic or Latino | 583 | 11.8% |
| Native / Alaskan | 14 | 0.3% |
| White / Caucasian | 4,463 | 90.4% |
| Two or more Races | 216 | 4.4% |
| Some other Race | 177 | 3.6% |
| Total | 4,938 | 100.0% |
Ancestry in Whispering Pines
The most populous ancestries reported in Whispering Pines are German (1,352 | 27.4%), Irish (1,237 | 25.1%), English (719 | 14.6%), Italian (371 | 7.5%), and Mexican (293 | 5.9%), together accounting for 80.4% of all Whispering Pines residents.
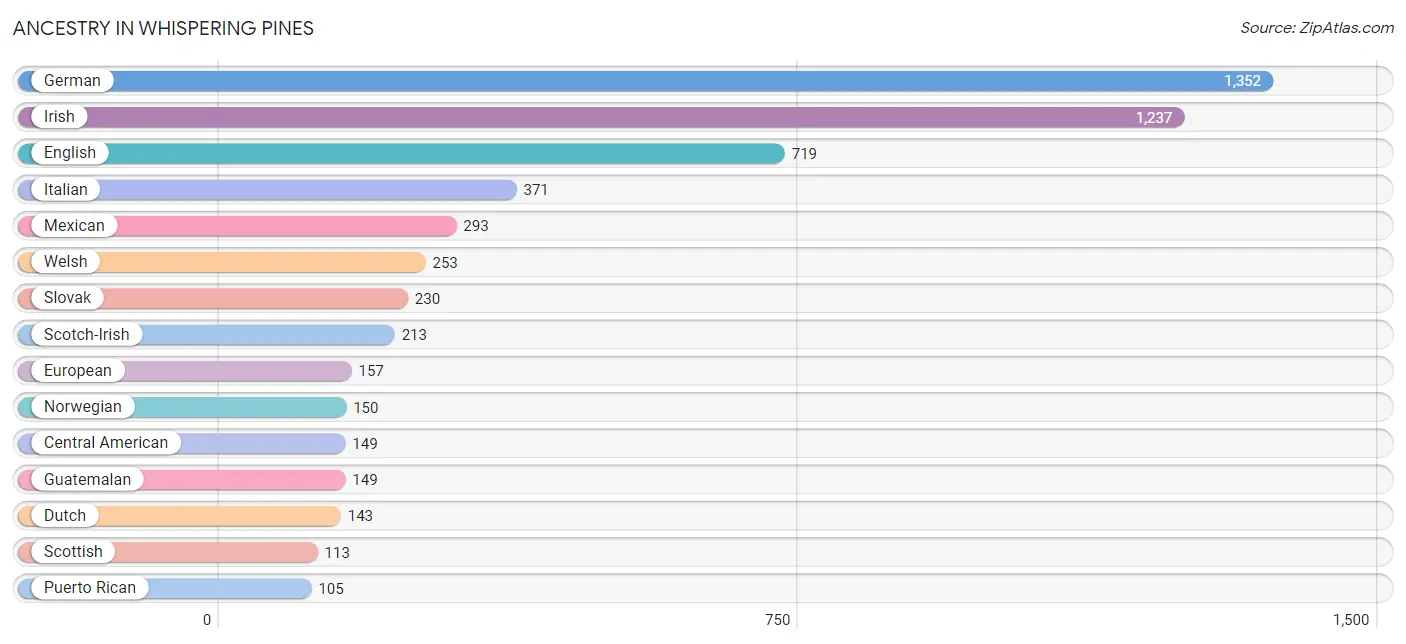
| Ancestry | # Population | % Population |
| American | 71 | 1.4% |
| British | 57 | 1.1% |
| Burmese | 33 | 0.7% |
| Cajun | 18 | 0.4% |
| Canadian | 9 | 0.2% |
| Central American | 149 | 3.0% |
| Cherokee | 26 | 0.5% |
| Cuban | 16 | 0.3% |
| Czech | 17 | 0.3% |
| Czechoslovakian | 12 | 0.2% |
| Danish | 53 | 1.1% |
| Dutch | 143 | 2.9% |
| Eastern European | 69 | 1.4% |
| English | 719 | 14.6% |
| European | 157 | 3.2% |
| French | 82 | 1.7% |
| French Canadian | 38 | 0.8% |
| German | 1,352 | 27.4% |
| Guatemalan | 149 | 3.0% |
| Irish | 1,237 | 25.1% |
| Italian | 371 | 7.5% |
| Korean | 11 | 0.2% |
| Mexican | 293 | 5.9% |
| Norwegian | 150 | 3.0% |
| Polish | 79 | 1.6% |
| Puerto Rican | 105 | 2.1% |
| Russian | 10 | 0.2% |
| Scandinavian | 85 | 1.7% |
| Scotch-Irish | 213 | 4.3% |
| Scottish | 113 | 2.3% |
| Slovak | 230 | 4.7% |
| Spaniard | 20 | 0.4% |
| Swedish | 15 | 0.3% |
| Swiss | 25 | 0.5% |
| Welsh | 253 | 5.1% | View All 35 Rows |
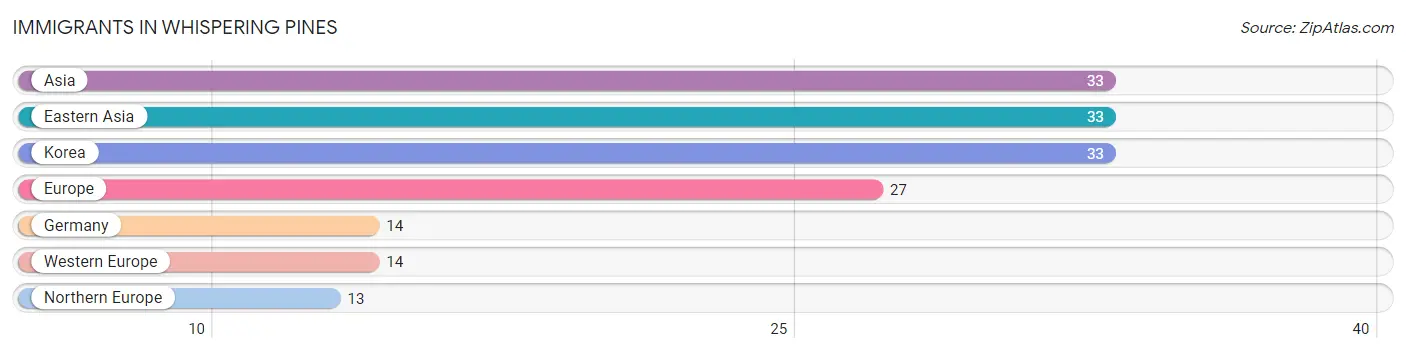
Immigrants in Whispering Pines
The most numerous immigrant groups reported in Whispering Pines came from Asia (33 | 0.7%), Eastern Asia (33 | 0.7%), Korea (33 | 0.7%), Europe (27 | 0.5%), and Germany (14 | 0.3%), together accounting for 2.8% of all Whispering Pines residents.
| Immigration Origin | # Population | % Population |
| Asia | 33 | 0.7% |
| Eastern Asia | 33 | 0.7% |
| Europe | 27 | 0.5% |
| Germany | 14 | 0.3% |
| Korea | 33 | 0.7% |
| Northern Europe | 13 | 0.3% |
| Western Europe | 14 | 0.3% | View All 7 Rows |
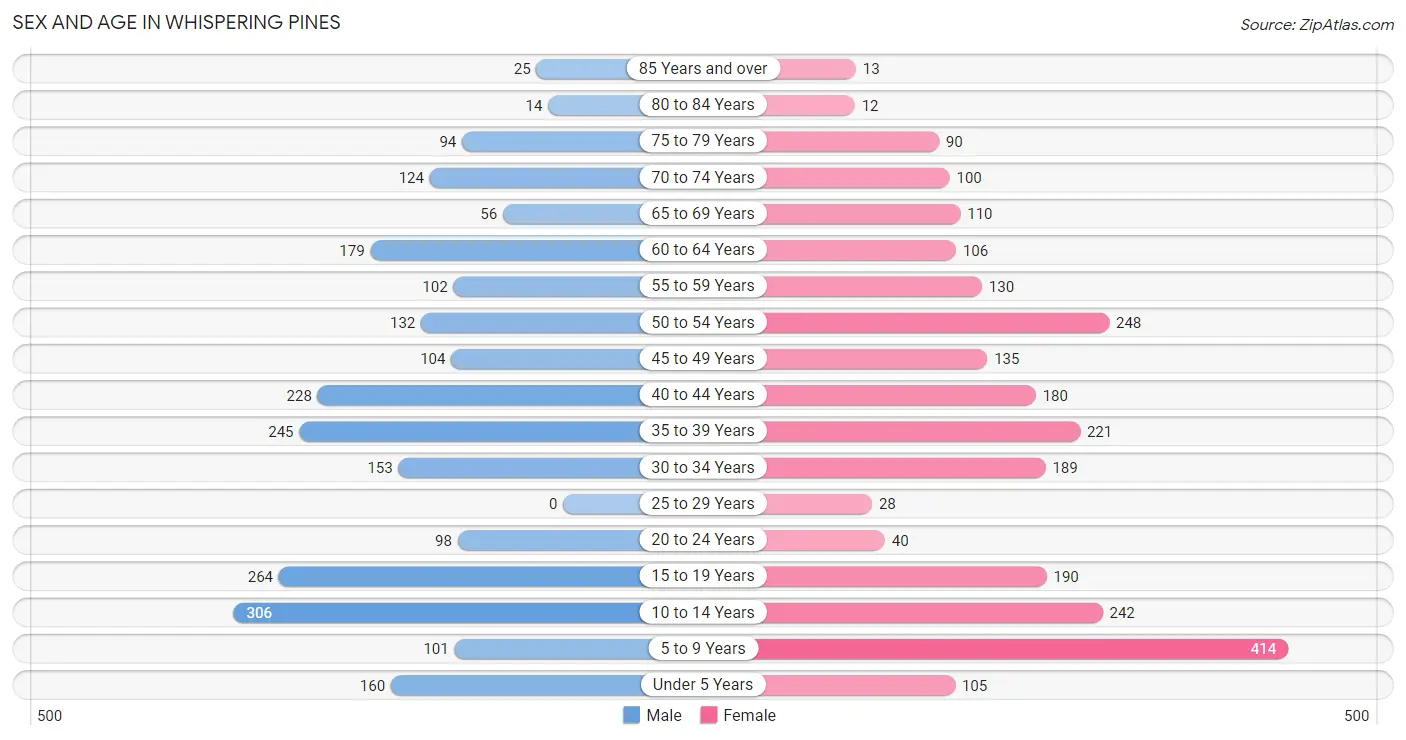
Sex and Age in Whispering Pines
Sex and Age in Whispering Pines
The most populous age groups in Whispering Pines are 10 to 14 Years (306 | 12.8%) for men and 5 to 9 Years (414 | 16.2%) for women.
| Age Bracket | Male | Female |
| Under 5 Years | 160 (6.7%) | 105 (4.1%) |
| 5 to 9 Years | 101 (4.2%) | 414 (16.2%) |
| 10 to 14 Years | 306 (12.8%) | 242 (9.5%) |
| 15 to 19 Years | 264 (11.1%) | 190 (7.4%) |
| 20 to 24 Years | 98 (4.1%) | 40 (1.6%) |
| 25 to 29 Years | 0 (0.0%) | 28 (1.1%) |
| 30 to 34 Years | 153 (6.4%) | 189 (7.4%) |
| 35 to 39 Years | 245 (10.3%) | 221 (8.7%) |
| 40 to 44 Years | 228 (9.6%) | 180 (7.0%) |
| 45 to 49 Years | 104 (4.4%) | 135 (5.3%) |
| 50 to 54 Years | 132 (5.5%) | 248 (9.7%) |
| 55 to 59 Years | 102 (4.3%) | 130 (5.1%) |
| 60 to 64 Years | 179 (7.5%) | 106 (4.2%) |
| 65 to 69 Years | 56 (2.4%) | 110 (4.3%) |
| 70 to 74 Years | 124 (5.2%) | 100 (3.9%) |
| 75 to 79 Years | 94 (3.9%) | 90 (3.5%) |
| 80 to 84 Years | 14 (0.6%) | 12 (0.5%) |
| 85 Years and over | 25 (1.1%) | 13 (0.5%) |
| Total | 2,385 (100.0%) | 2,553 (100.0%) |
Families and Households in Whispering Pines
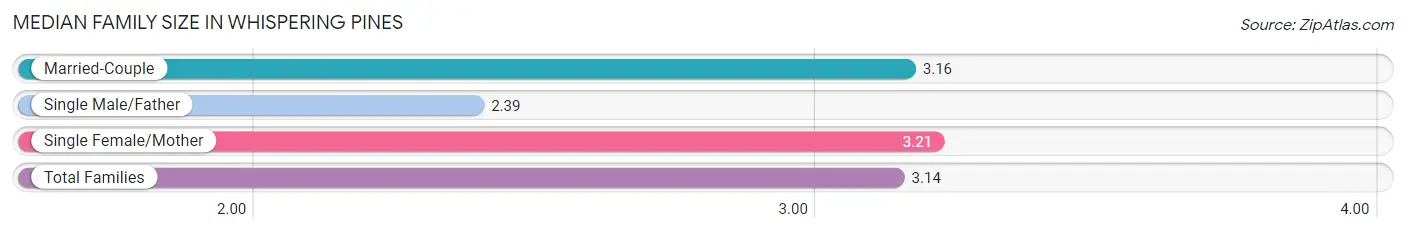
Median Family Size in Whispering Pines
The median family size in Whispering Pines is 3.14 persons per family, with single female/mother families (141 | 9.5%) accounting for the largest median family size of 3.21 persons per family. On the other hand, single male/father families (41 | 2.8%) represent the smallest median family size with 2.39 persons per family.
| Family Type | # Families | Family Size |
| Married-Couple | 1,300 (87.7%) | 3.16 |
| Single Male/Father | 41 (2.8%) | 2.39 |
| Single Female/Mother | 141 (9.5%) | 3.21 |
| Total Families | 1,482 (100.0%) | 3.14 |
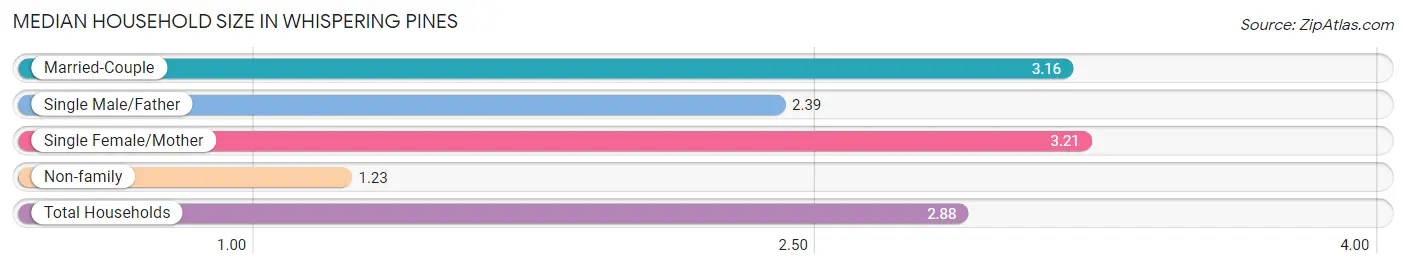
Median Household Size in Whispering Pines
The median household size in Whispering Pines is 2.88 persons per household, with single female/mother households (141 | 8.2%) accounting for the largest median household size of 3.21 persons per household. non-family households (230 | 13.4%) represent the smallest median household size with 1.23 persons per household.
| Household Type | # Households | Household Size |
| Married-Couple | 1,300 (75.9%) | 3.16 |
| Single Male/Father | 41 (2.4%) | 2.39 |
| Single Female/Mother | 141 (8.2%) | 3.21 |
| Non-family | 230 (13.4%) | 1.23 |
| Total Households | 1,712 (100.0%) | 2.88 |
Household Size by Marriage Status in Whispering Pines
Out of a total of 1,712 households in Whispering Pines, 1,482 (86.6%) are family households, while 230 (13.4%) are nonfamily households. The most numerous type of family households are 2-person households, comprising 518, and the most common type of nonfamily households are 1-person households, comprising 184.
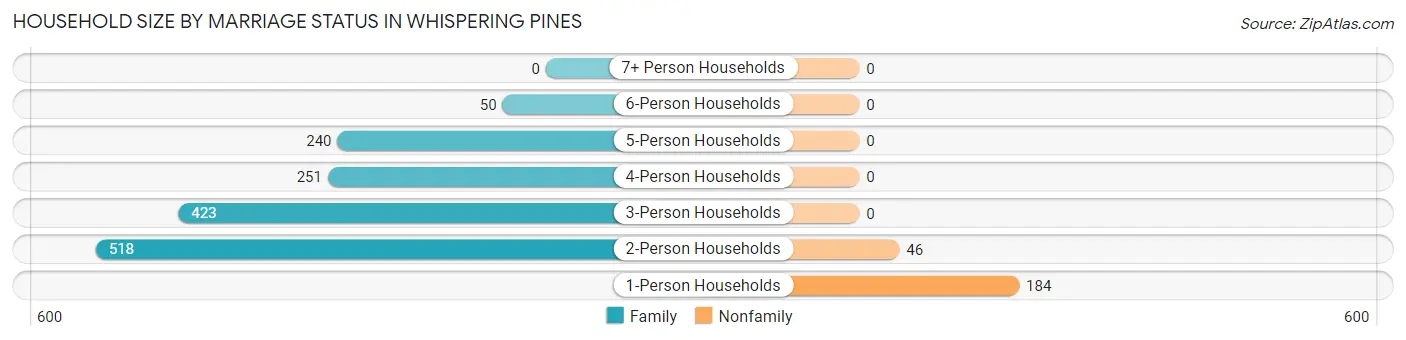
| Household Size | Family Households | Nonfamily Households |
| 1-Person Households | - | 184 (10.7%) |
| 2-Person Households | 518 (30.3%) | 46 (2.7%) |
| 3-Person Households | 423 (24.7%) | 0 (0.0%) |
| 4-Person Households | 251 (14.7%) | 0 (0.0%) |
| 5-Person Households | 240 (14.0%) | 0 (0.0%) |
| 6-Person Households | 50 (2.9%) | 0 (0.0%) |
| 7+ Person Households | 0 (0.0%) | 0 (0.0%) |
| Total | 1,482 (86.6%) | 230 (13.4%) |
Female Fertility in Whispering Pines
Fertility by Age in Whispering Pines
| Age Bracket | Women with Births | Births / 1,000 Women |
| 15 to 19 years | 0 (0.0%) | 0.0 |
| 20 to 34 years | 0 (0.0%) | 0.0 |
| 35 to 50 years | 0 (0.0%) | 0.0 |
| Total | 0 (0.0%) | 0.0 |
Fertility by Age by Marriage Status in Whispering Pines
| Age Bracket | Married | Unmarried |
| 15 to 19 years | 0 (0.0%) | 0 (0.0%) |
| 20 to 34 years | 0 (0.0%) | 0 (0.0%) |
| 35 to 50 years | 0 (0.0%) | 0 (0.0%) |
| Total | 0 (0.0%) | 0 (0.0%) |
Fertility by Education in Whispering Pines
| Educational Attainment | Women with Births | Births / 1,000 Women |
| Less than High School | 0 (0.0%) | 0.0 |
| High School Diploma | 0 (0.0%) | 0.0 |
| College or Associate's Degree | 0 (0.0%) | 0.0 |
| Bachelor's Degree | 0 (0.0%) | 0.0 |
| Graduate Degree | 0 (0.0%) | 0.0 |
| Total | 0 (0.0%) | 0.0 |
Fertility by Education by Marriage Status in Whispering Pines
| Educational Attainment | Married | Unmarried |
| Less than High School | 0 (0.0%) | 0 (0.0%) |
| High School Diploma | 0 (0.0%) | 0 (0.0%) |
| College or Associate's Degree | 0 (0.0%) | 0 (0.0%) |
| Bachelor's Degree | 0 (0.0%) | 0 (0.0%) |
| Graduate Degree | 0 (0.0%) | 0 (0.0%) |
| Total | 0 (0.0%) | 0 (0.0%) |
Employment Characteristics in Whispering Pines
Employment by Class of Employer in Whispering Pines
Among the 2,047 employed individuals in Whispering Pines, private company employees (820 | 40.1%), federal government employees (607 | 29.6%), and local government employees (209 | 10.2%) make up the most common classes of employment.
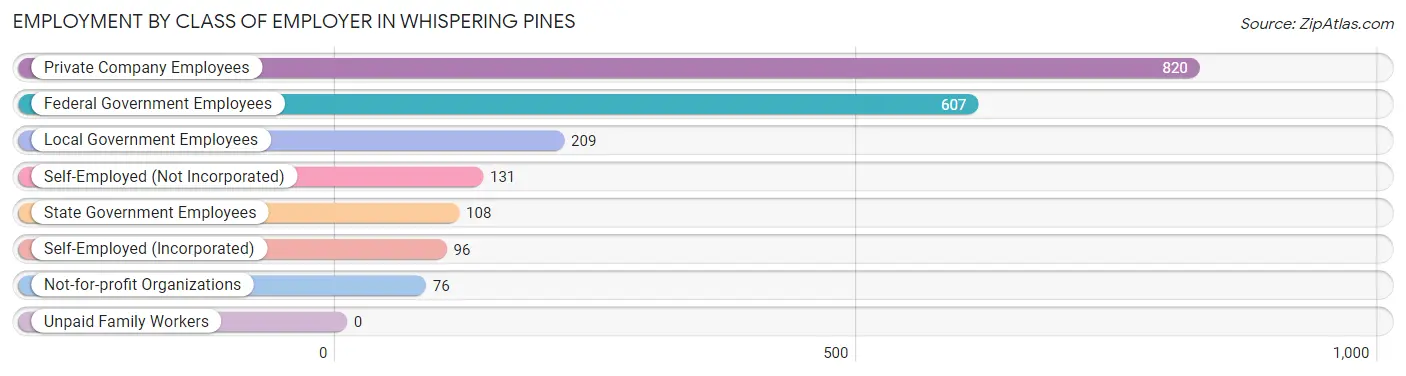
| Employer Class | # Employees | % Employees |
| Private Company Employees | 820 | 40.1% |
| Self-Employed (Incorporated) | 96 | 4.7% |
| Self-Employed (Not Incorporated) | 131 | 6.4% |
| Not-for-profit Organizations | 76 | 3.7% |
| Local Government Employees | 209 | 10.2% |
| State Government Employees | 108 | 5.3% |
| Federal Government Employees | 607 | 29.6% |
| Unpaid Family Workers | 0 | 0.0% |
| Total | 2,047 | 100.0% |
Employment Status by Age in Whispering Pines
According to the labor force statistics for Whispering Pines, out of the total population over 16 years of age (3,585), 60.1% or 2,155 individuals are in the labor force, with 5.1% or 110 of them unemployed. The age group with the highest labor force participation rate is 30 to 34 years, with 100.0% or 342 individuals in the labor force. Within the labor force, the 65 to 74 years age range has the highest percentage of unemployed individuals, with 17.7% or 14 of them being unemployed.
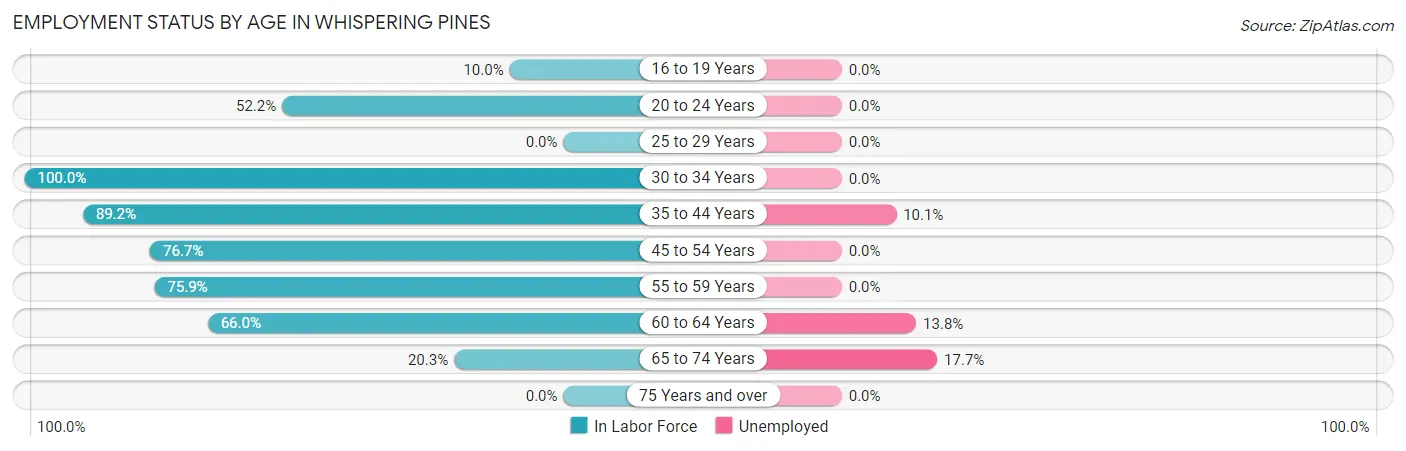
| Age Bracket | In Labor Force | Unemployed |
| 16 to 19 Years | 43 (10.0%) | 0 (0.0%) |
| 20 to 24 Years | 72 (52.2%) | 0 (0.0%) |
| 25 to 29 Years | 0 (0.0%) | 0 (0.0%) |
| 30 to 34 Years | 342 (100.0%) | 0 (0.0%) |
| 35 to 44 Years | 780 (89.2%) | 79 (10.1%) |
| 45 to 54 Years | 475 (76.7%) | 0 (0.0%) |
| 55 to 59 Years | 176 (75.9%) | 0 (0.0%) |
| 60 to 64 Years | 188 (66.0%) | 26 (13.8%) |
| 65 to 74 Years | 79 (20.3%) | 14 (17.7%) |
| 75 Years and over | 0 (0.0%) | 0 (0.0%) |
| Total | 2,155 (60.1%) | 110 (5.1%) |
Employment Status by Educational Attainment in Whispering Pines
According to labor force statistics for Whispering Pines, 82.4% of individuals (1,961) out of the total population between 25 and 64 years of age (2,380) are in the labor force, with 4.9% or 96 of them being unemployed. The group with the highest labor force participation rate are those with the educational attainment of less than high school, with 100.0% or 31 individuals in the labor force. Within the labor force, individuals with high school diploma education have the highest percentage of unemployment, with 56.0% or 51 of them being unemployed.
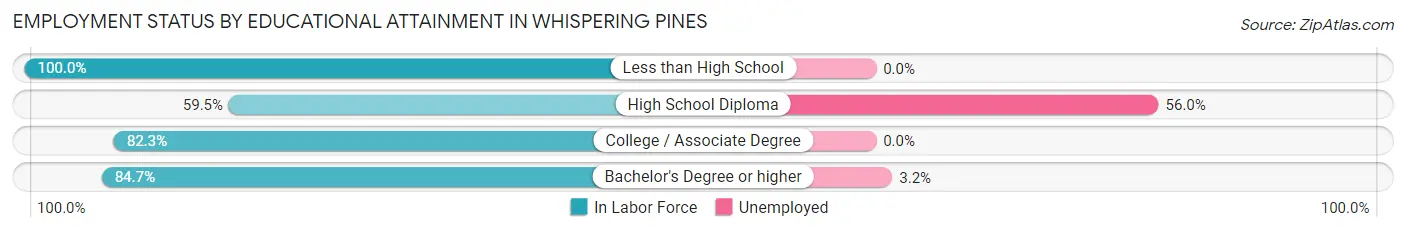
| Educational Attainment | In Labor Force | Unemployed |
| Less than High School | 31 (100.0%) | 0 (0.0%) |
| High School Diploma | 91 (59.5%) | 86 (56.0%) |
| College / Associate Degree | 705 (82.3%) | 0 (0.0%) |
| Bachelor's Degree or higher | 1,134 (84.7%) | 43 (3.2%) |
| Total | 1,961 (82.4%) | 117 (4.9%) |
Employment Occupations by Sex in Whispering Pines
Management, Business, Science and Arts Occupations
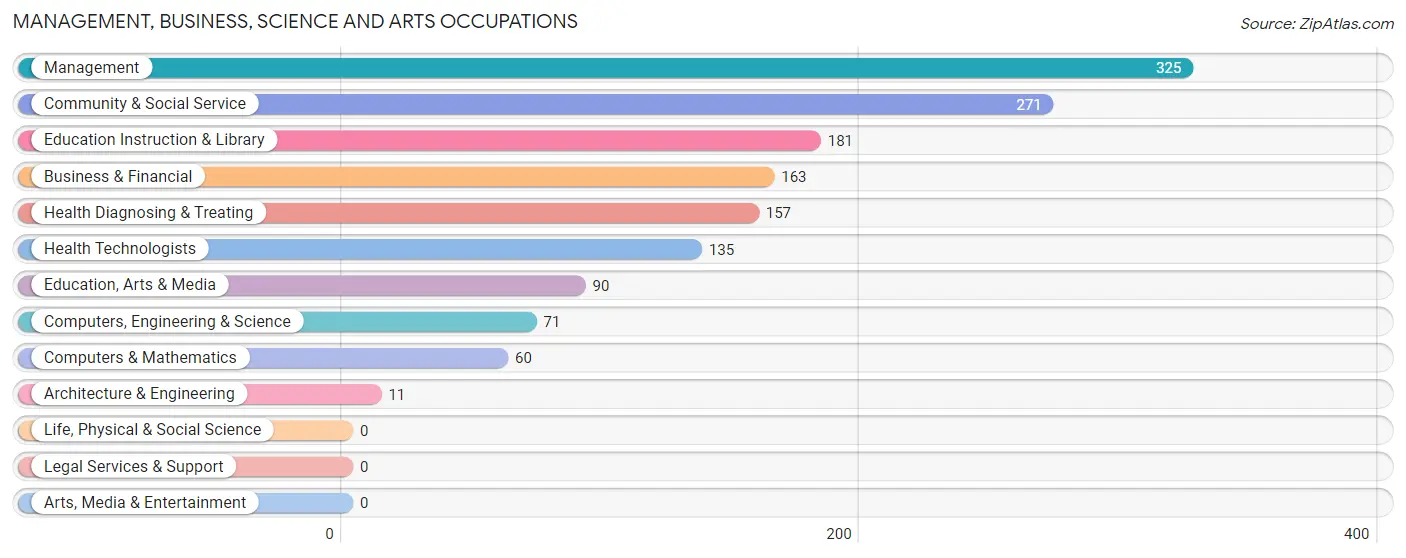
The most common Management, Business, Science and Arts occupations in Whispering Pines are Management (325 | 19.4%), Community & Social Service (271 | 16.2%), Education Instruction & Library (181 | 10.8%), Business & Financial (163 | 9.7%), and Health Diagnosing & Treating (157 | 9.4%).
Management, Business, Science and Arts Occupations by Sex
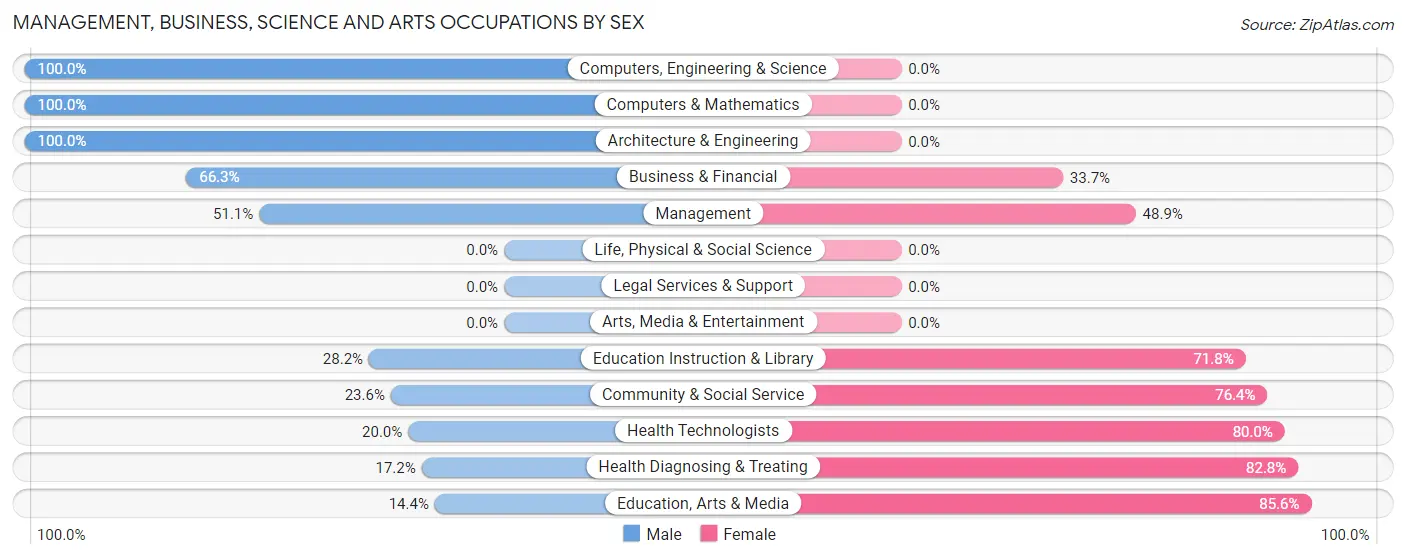
Within the Management, Business, Science and Arts occupations in Whispering Pines, the most male-oriented occupations are Computers, Engineering & Science (100.0%), Computers & Mathematics (100.0%), and Architecture & Engineering (100.0%), while the most female-oriented occupations are Education, Arts & Media (85.6%), Health Diagnosing & Treating (82.8%), and Health Technologists (80.0%).
| Occupation | Male | Female |
| Management | 166 (51.1%) | 159 (48.9%) |
| Business & Financial | 108 (66.3%) | 55 (33.7%) |
| Computers, Engineering & Science | 71 (100.0%) | 0 (0.0%) |
| Computers & Mathematics | 60 (100.0%) | 0 (0.0%) |
| Architecture & Engineering | 11 (100.0%) | 0 (0.0%) |
| Life, Physical & Social Science | 0 (0.0%) | 0 (0.0%) |
| Community & Social Service | 64 (23.6%) | 207 (76.4%) |
| Education, Arts & Media | 13 (14.4%) | 77 (85.6%) |
| Legal Services & Support | 0 (0.0%) | 0 (0.0%) |
| Education Instruction & Library | 51 (28.2%) | 130 (71.8%) |
| Arts, Media & Entertainment | 0 (0.0%) | 0 (0.0%) |
| Health Diagnosing & Treating | 27 (17.2%) | 130 (82.8%) |
| Health Technologists | 27 (20.0%) | 108 (80.0%) |
| Total (Category) | 436 (44.2%) | 551 (55.8%) |
| Total (Overall) | 759 (45.2%) | 919 (54.8%) |
Services Occupations
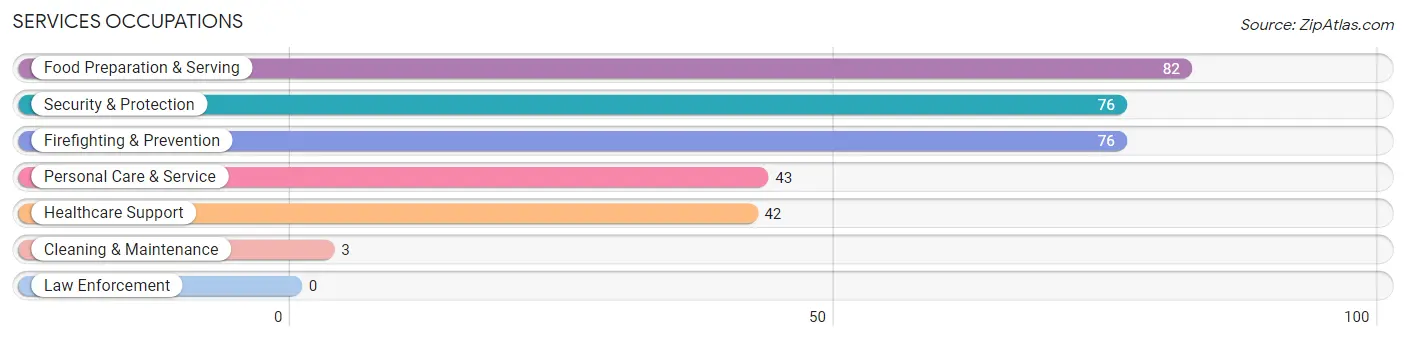
The most common Services occupations in Whispering Pines are Food Preparation & Serving (82 | 4.9%), Security & Protection (76 | 4.5%), Firefighting & Prevention (76 | 4.5%), Personal Care & Service (43 | 2.6%), and Healthcare Support (42 | 2.5%).
Services Occupations by Sex
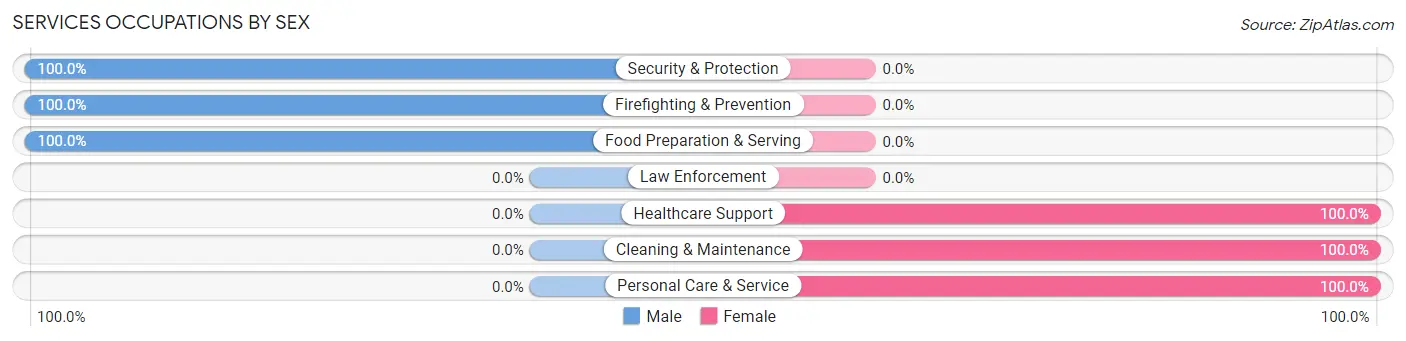
Within the Services occupations in Whispering Pines, the most male-oriented occupations are Security & Protection (100.0%), Firefighting & Prevention (100.0%), and Food Preparation & Serving (100.0%), while the most female-oriented occupations are Healthcare Support (100.0%), Cleaning & Maintenance (100.0%), and Personal Care & Service (100.0%).
| Occupation | Male | Female |
| Healthcare Support | 0 (0.0%) | 42 (100.0%) |
| Security & Protection | 76 (100.0%) | 0 (0.0%) |
| Firefighting & Prevention | 76 (100.0%) | 0 (0.0%) |
| Law Enforcement | 0 (0.0%) | 0 (0.0%) |
| Food Preparation & Serving | 82 (100.0%) | 0 (0.0%) |
| Cleaning & Maintenance | 0 (0.0%) | 3 (100.0%) |
| Personal Care & Service | 0 (0.0%) | 43 (100.0%) |
| Total (Category) | 158 (64.2%) | 88 (35.8%) |
| Total (Overall) | 759 (45.2%) | 919 (54.8%) |
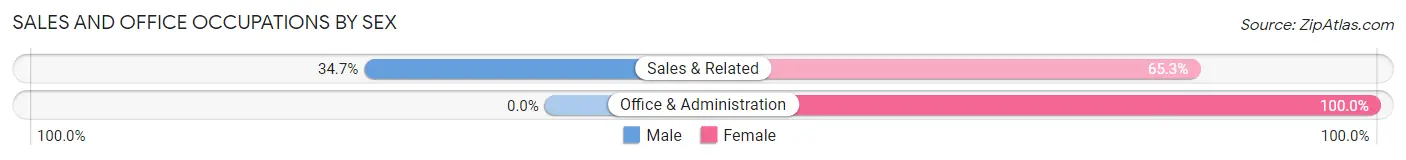
Sales and Office Occupations
The most common Sales and Office occupations in Whispering Pines are Sales & Related (216 | 12.9%), and Office & Administration (139 | 8.3%).

Sales and Office Occupations by Sex
| Occupation | Male | Female |
| Sales & Related | 75 (34.7%) | 141 (65.3%) |
| Office & Administration | 0 (0.0%) | 139 (100.0%) |
| Total (Category) | 75 (21.1%) | 280 (78.9%) |
| Total (Overall) | 759 (45.2%) | 919 (54.8%) |
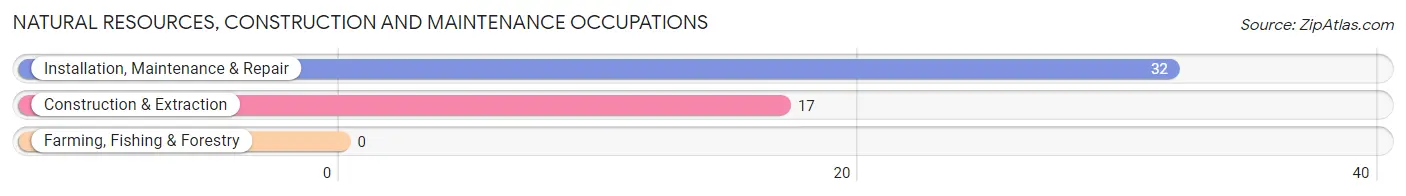
Natural Resources, Construction and Maintenance Occupations
The most common Natural Resources, Construction and Maintenance occupations in Whispering Pines are Installation, Maintenance & Repair (32 | 1.9%), and Construction & Extraction (17 | 1.0%).
Natural Resources, Construction and Maintenance Occupations by Sex

| Occupation | Male | Female |
| Farming, Fishing & Forestry | 0 (0.0%) | 0 (0.0%) |
| Construction & Extraction | 17 (100.0%) | 0 (0.0%) |
| Installation, Maintenance & Repair | 32 (100.0%) | 0 (0.0%) |
| Total (Category) | 49 (100.0%) | 0 (0.0%) |
| Total (Overall) | 759 (45.2%) | 919 (54.8%) |
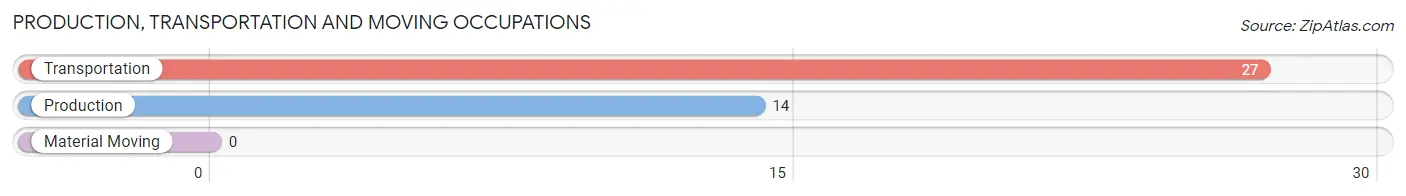
Production, Transportation and Moving Occupations
The most common Production, Transportation and Moving occupations in Whispering Pines are Transportation (27 | 1.6%), and Production (14 | 0.8%).
Production, Transportation and Moving Occupations by Sex
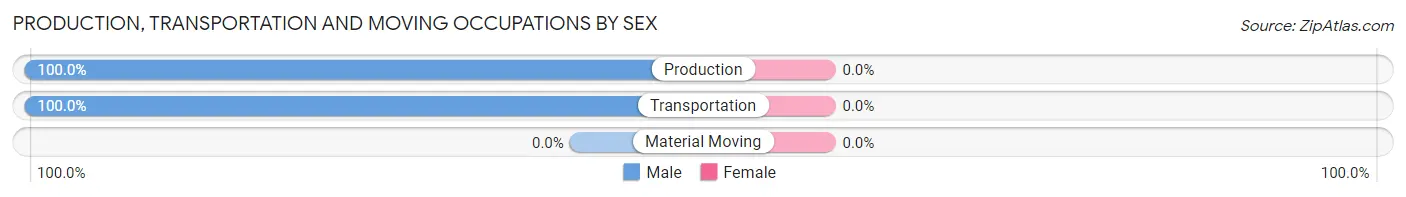
| Occupation | Male | Female |
| Production | 14 (100.0%) | 0 (0.0%) |
| Transportation | 27 (100.0%) | 0 (0.0%) |
| Material Moving | 0 (0.0%) | 0 (0.0%) |
| Total (Category) | 41 (100.0%) | 0 (0.0%) |
| Total (Overall) | 759 (45.2%) | 919 (54.8%) |
Employment Industries by Sex in Whispering Pines
Employment Industries in Whispering Pines
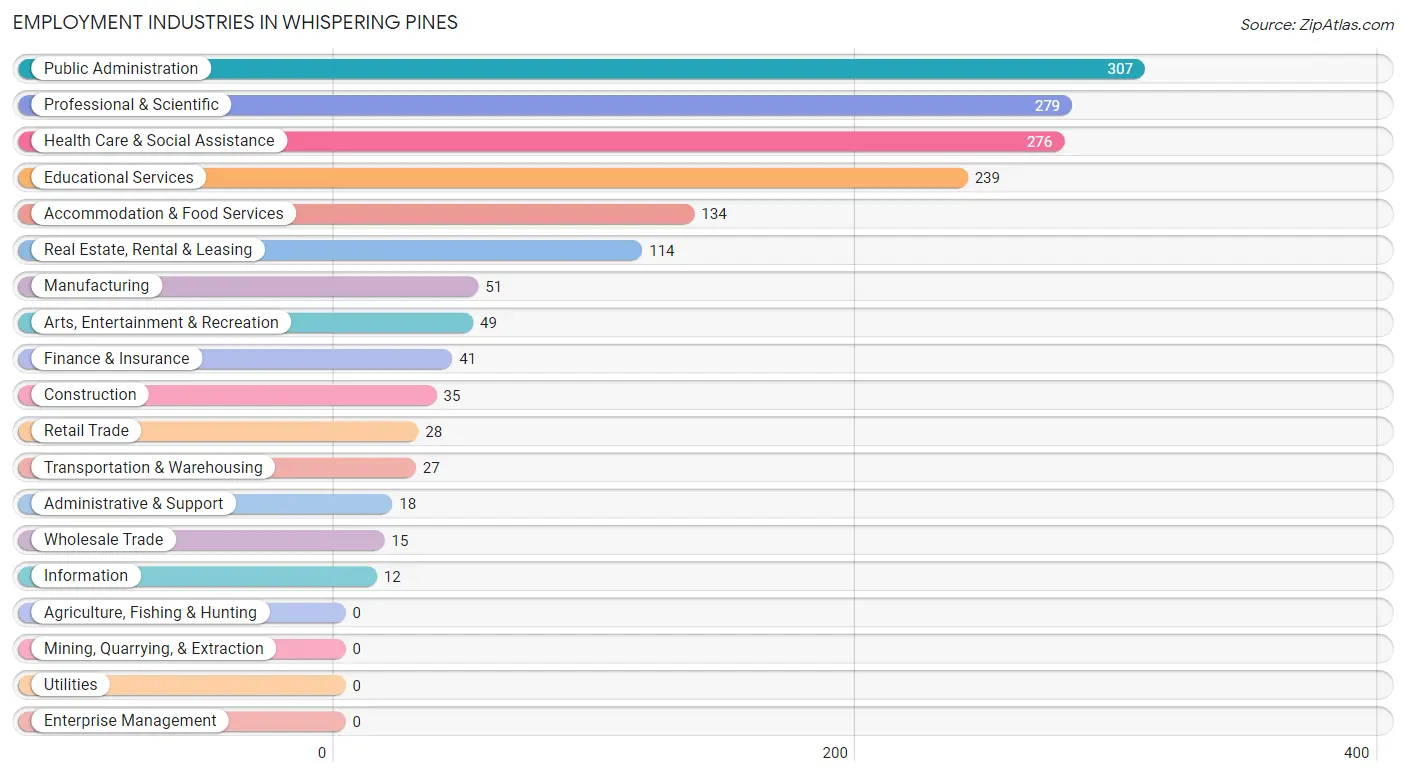
The major employment industries in Whispering Pines include Public Administration (307 | 18.3%), Professional & Scientific (279 | 16.6%), Health Care & Social Assistance (276 | 16.5%), Educational Services (239 | 14.2%), and Accommodation & Food Services (134 | 8.0%).
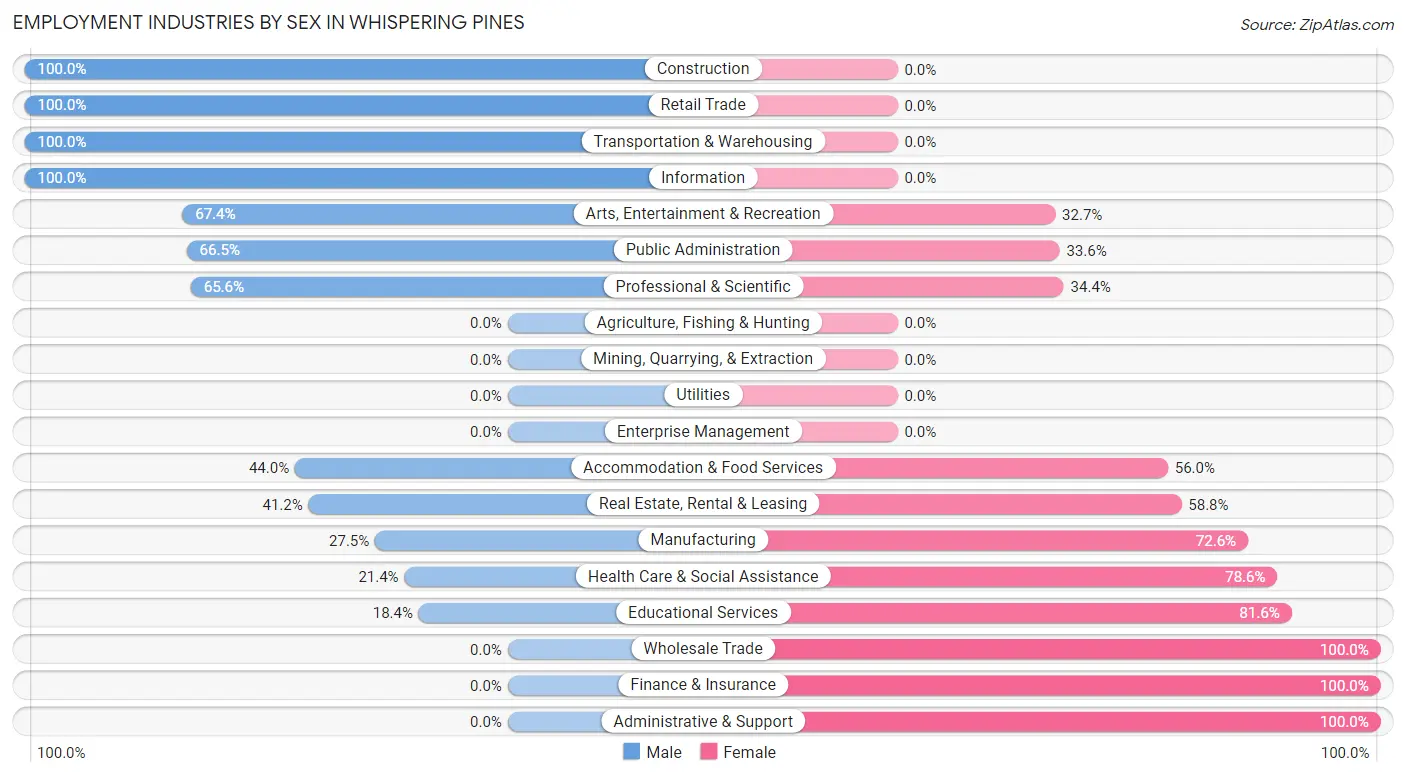
Employment Industries by Sex in Whispering Pines
The Whispering Pines industries that see more men than women are Construction (100.0%), Retail Trade (100.0%), and Transportation & Warehousing (100.0%), whereas the industries that tend to have a higher number of women are Wholesale Trade (100.0%), Finance & Insurance (100.0%), and Administrative & Support (100.0%).
| Industry | Male | Female |
| Agriculture, Fishing & Hunting | 0 (0.0%) | 0 (0.0%) |
| Mining, Quarrying, & Extraction | 0 (0.0%) | 0 (0.0%) |
| Construction | 35 (100.0%) | 0 (0.0%) |
| Manufacturing | 14 (27.5%) | 37 (72.6%) |
| Wholesale Trade | 0 (0.0%) | 15 (100.0%) |
| Retail Trade | 28 (100.0%) | 0 (0.0%) |
| Transportation & Warehousing | 27 (100.0%) | 0 (0.0%) |
| Utilities | 0 (0.0%) | 0 (0.0%) |
| Information | 12 (100.0%) | 0 (0.0%) |
| Finance & Insurance | 0 (0.0%) | 41 (100.0%) |
| Real Estate, Rental & Leasing | 47 (41.2%) | 67 (58.8%) |
| Professional & Scientific | 183 (65.6%) | 96 (34.4%) |
| Enterprise Management | 0 (0.0%) | 0 (0.0%) |
| Administrative & Support | 0 (0.0%) | 18 (100.0%) |
| Educational Services | 44 (18.4%) | 195 (81.6%) |
| Health Care & Social Assistance | 59 (21.4%) | 217 (78.6%) |
| Arts, Entertainment & Recreation | 33 (67.3%) | 16 (32.7%) |
| Accommodation & Food Services | 59 (44.0%) | 75 (56.0%) |
| Public Administration | 204 (66.4%) | 103 (33.6%) |
| Total | 759 (45.2%) | 919 (54.8%) |
Education in Whispering Pines
School Enrollment in Whispering Pines
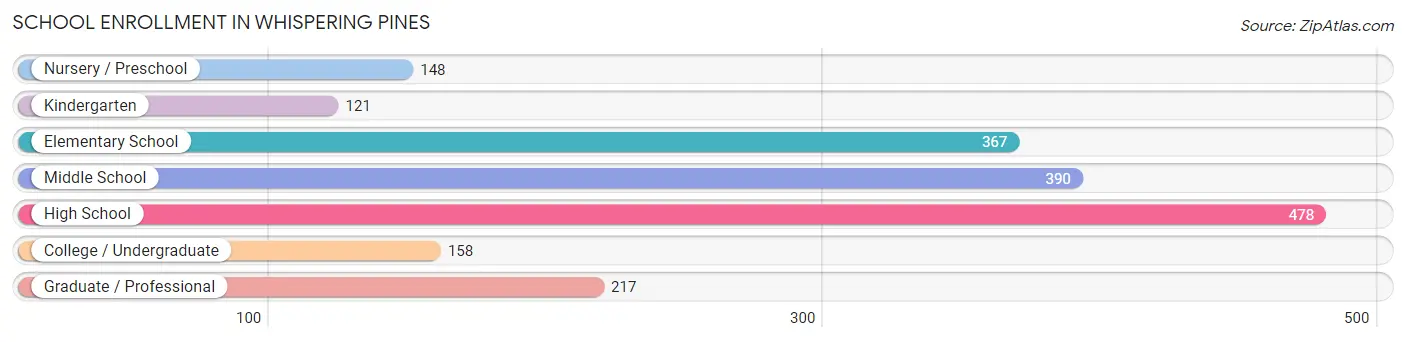
The most common levels of schooling among the 1,879 students in Whispering Pines are high school (478 | 25.4%), middle school (390 | 20.8%), and elementary school (367 | 19.5%).
| School Level | # Students | % Students |
| Nursery / Preschool | 148 | 7.9% |
| Kindergarten | 121 | 6.4% |
| Elementary School | 367 | 19.5% |
| Middle School | 390 | 20.8% |
| High School | 478 | 25.4% |
| College / Undergraduate | 158 | 8.4% |
| Graduate / Professional | 217 | 11.6% |
| Total | 1,879 | 100.0% |
School Enrollment by Age by Funding Source in Whispering Pines
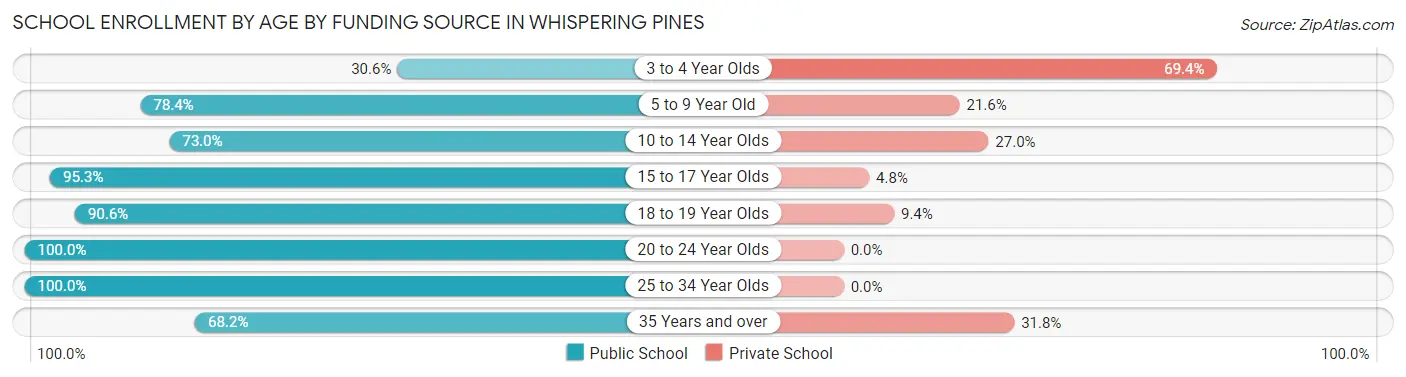
Out of a total of 1,879 students who are enrolled in schools in Whispering Pines, 428 (22.8%) attend a private institution, while the remaining 1,451 (77.2%) are enrolled in public schools. The age group of 3 to 4 year olds has the highest likelihood of being enrolled in private schools, with 59 (69.4% in the age bracket) enrolled. Conversely, the age group of 20 to 24 year olds has the lowest likelihood of being enrolled in a private school, with 13 (100.0% in the age bracket) attending a public institution.
| Age Bracket | Public School | Private School |
| 3 to 4 Year Olds | 26 (30.6%) | 59 (69.4%) |
| 5 to 9 Year Old | 367 (78.4%) | 101 (21.6%) |
| 10 to 14 Year Olds | 363 (73.0%) | 134 (27.0%) |
| 15 to 17 Year Olds | 341 (95.3%) | 17 (4.8%) |
| 18 to 19 Year Olds | 87 (90.6%) | 9 (9.4%) |
| 20 to 24 Year Olds | 13 (100.0%) | 0 (0.0%) |
| 25 to 34 Year Olds | 22 (100.0%) | 0 (0.0%) |
| 35 Years and over | 232 (68.2%) | 108 (31.8%) |
| Total | 1,451 (77.2%) | 428 (22.8%) |
Educational Attainment by Field of Study in Whispering Pines
Business (365 | 20.8%), education (270 | 15.4%), science & technology (186 | 10.6%), social sciences (124 | 7.1%), and arts & humanities (121 | 6.9%) are the most common fields of study among 1,752 individuals in Whispering Pines who have obtained a bachelor's degree or higher.
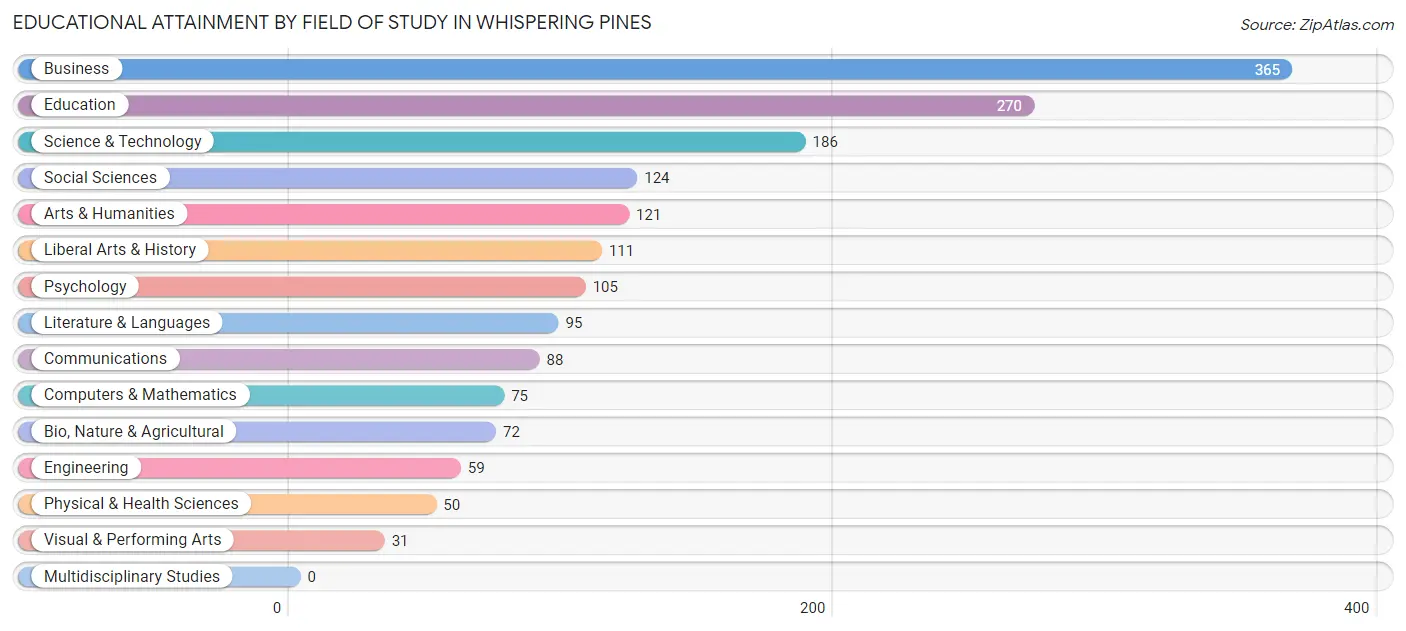
| Field of Study | # Graduates | % Graduates |
| Computers & Mathematics | 75 | 4.3% |
| Bio, Nature & Agricultural | 72 | 4.1% |
| Physical & Health Sciences | 50 | 2.9% |
| Psychology | 105 | 6.0% |
| Social Sciences | 124 | 7.1% |
| Engineering | 59 | 3.4% |
| Multidisciplinary Studies | 0 | 0.0% |
| Science & Technology | 186 | 10.6% |
| Business | 365 | 20.8% |
| Education | 270 | 15.4% |
| Literature & Languages | 95 | 5.4% |
| Liberal Arts & History | 111 | 6.3% |
| Visual & Performing Arts | 31 | 1.8% |
| Communications | 88 | 5.0% |
| Arts & Humanities | 121 | 6.9% |
| Total | 1,752 | 100.0% |
Transportation & Commute in Whispering Pines
Vehicle Availability by Sex in Whispering Pines
The most prevalent vehicle ownership categories in Whispering Pines are males with 2 vehicles (545, accounting for 48.4%) and females with 2 vehicles (365, making up 59.2%).
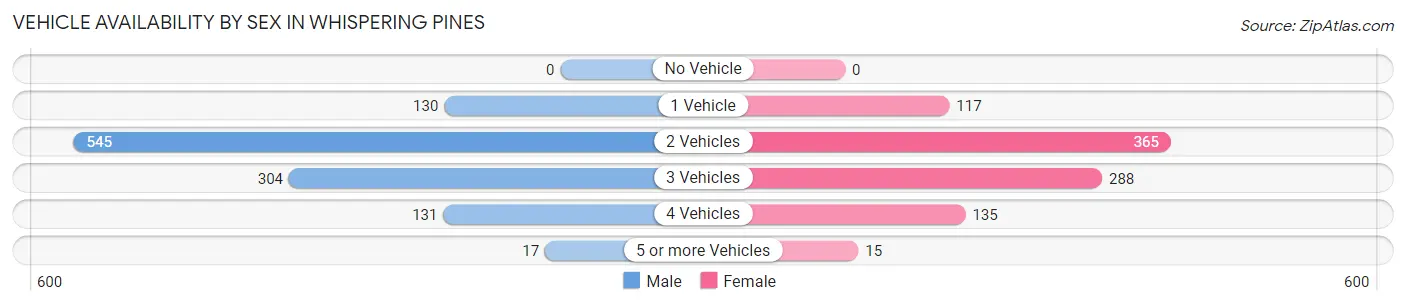
| Vehicles Available | Male | Female |
| No Vehicle | 0 (0.0%) | 0 (0.0%) |
| 1 Vehicle | 130 (11.5%) | 117 (12.7%) |
| 2 Vehicles | 545 (48.4%) | 365 (39.7%) |
| 3 Vehicles | 304 (27.0%) | 288 (31.3%) |
| 4 Vehicles | 131 (11.6%) | 135 (14.7%) |
| 5 or more Vehicles | 17 (1.5%) | 15 (1.6%) |
| Total | 1,127 (100.0%) | 920 (100.0%) |
Commute Time in Whispering Pines
The most frequently occuring commute durations in Whispering Pines are 10 to 14 minutes (403 commuters, 23.4%), 45 to 59 minutes (316 commuters, 18.4%), and 30 to 34 minutes (250 commuters, 14.5%).
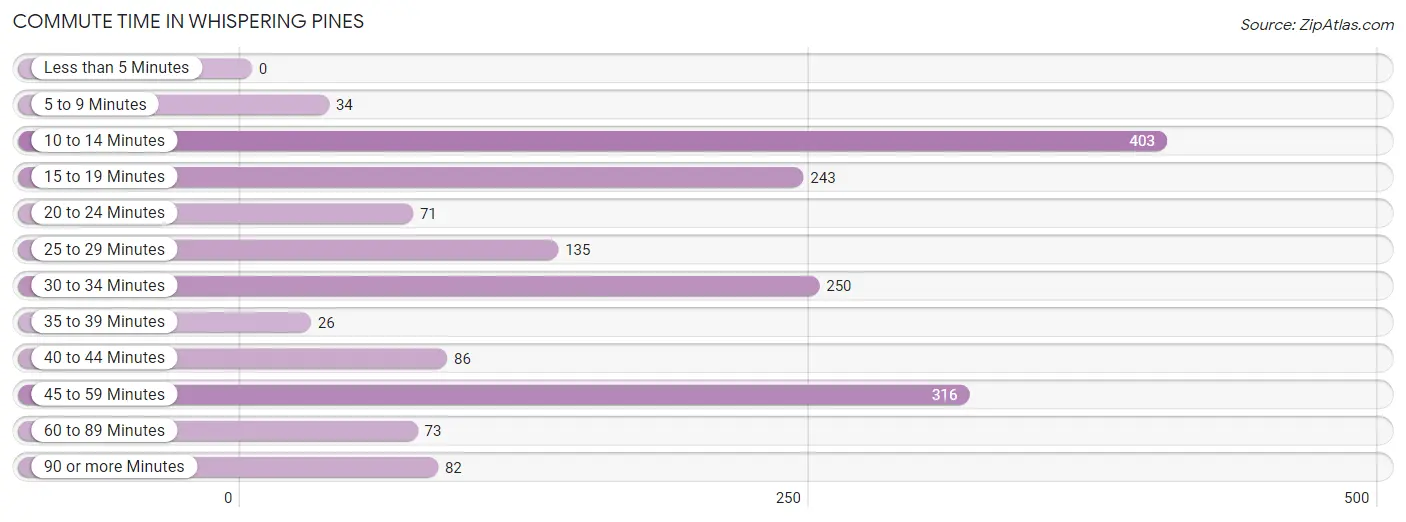
| Commute Time | # Commuters | % Commuters |
| Less than 5 Minutes | 0 | 0.0% |
| 5 to 9 Minutes | 34 | 2.0% |
| 10 to 14 Minutes | 403 | 23.4% |
| 15 to 19 Minutes | 243 | 14.1% |
| 20 to 24 Minutes | 71 | 4.1% |
| 25 to 29 Minutes | 135 | 7.9% |
| 30 to 34 Minutes | 250 | 14.5% |
| 35 to 39 Minutes | 26 | 1.5% |
| 40 to 44 Minutes | 86 | 5.0% |
| 45 to 59 Minutes | 316 | 18.4% |
| 60 to 89 Minutes | 73 | 4.3% |
| 90 or more Minutes | 82 | 4.8% |
Commute Time by Sex in Whispering Pines
The most common commute times in Whispering Pines are 45 to 59 minutes (282 commuters, 27.3%) for males and 10 to 14 minutes (255 commuters, 37.1%) for females.
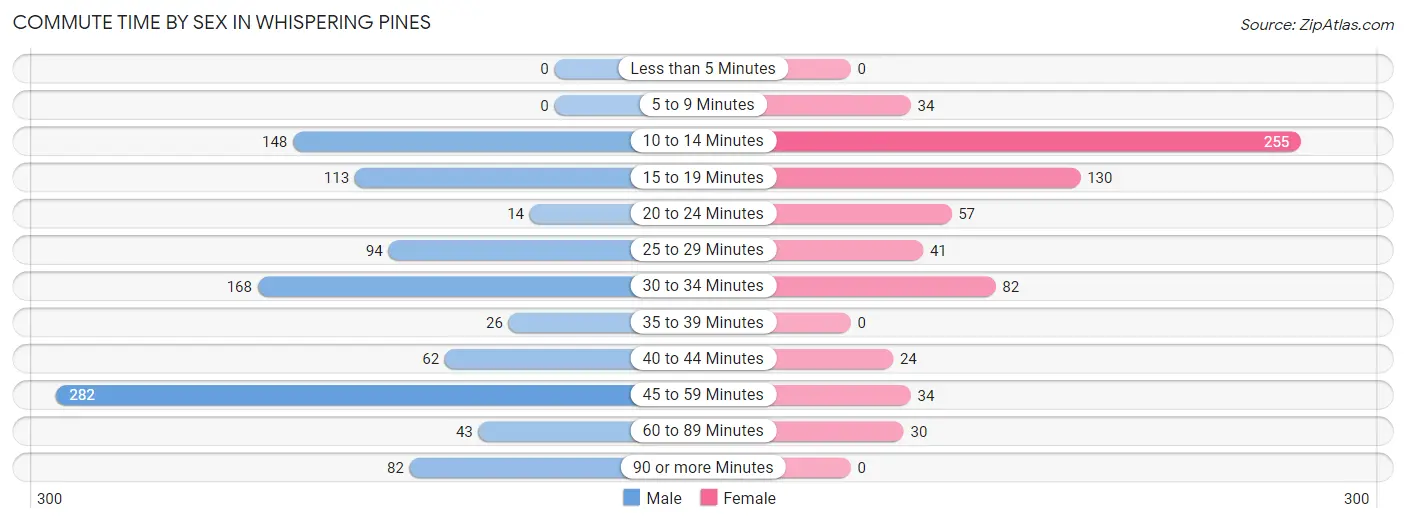
| Commute Time | Male | Female |
| Less than 5 Minutes | 0 (0.0%) | 0 (0.0%) |
| 5 to 9 Minutes | 0 (0.0%) | 34 (5.0%) |
| 10 to 14 Minutes | 148 (14.3%) | 255 (37.1%) |
| 15 to 19 Minutes | 113 (11.0%) | 130 (18.9%) |
| 20 to 24 Minutes | 14 (1.4%) | 57 (8.3%) |
| 25 to 29 Minutes | 94 (9.1%) | 41 (6.0%) |
| 30 to 34 Minutes | 168 (16.3%) | 82 (11.9%) |
| 35 to 39 Minutes | 26 (2.5%) | 0 (0.0%) |
| 40 to 44 Minutes | 62 (6.0%) | 24 (3.5%) |
| 45 to 59 Minutes | 282 (27.3%) | 34 (5.0%) |
| 60 to 89 Minutes | 43 (4.2%) | 30 (4.4%) |
| 90 or more Minutes | 82 (8.0%) | 0 (0.0%) |
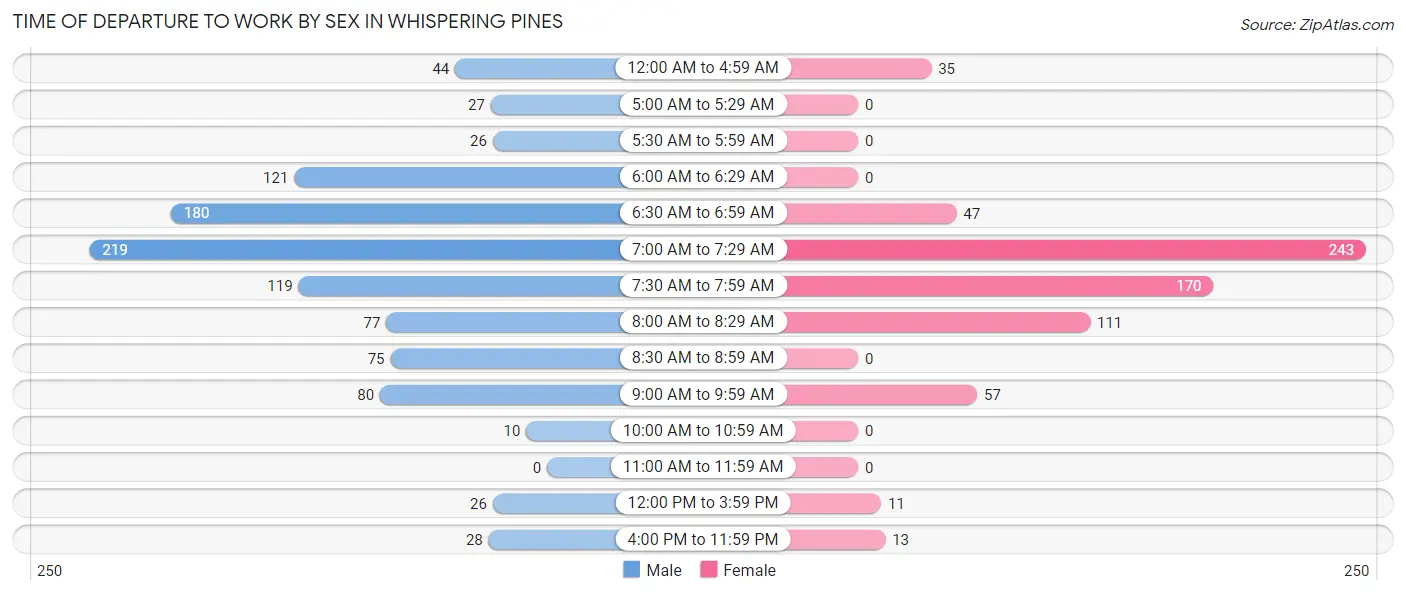
Time of Departure to Work by Sex in Whispering Pines
The most frequent times of departure to work in Whispering Pines are 7:00 AM to 7:29 AM (219, 21.2%) for males and 7:00 AM to 7:29 AM (243, 35.4%) for females.
| Time of Departure | Male | Female |
| 12:00 AM to 4:59 AM | 44 (4.3%) | 35 (5.1%) |
| 5:00 AM to 5:29 AM | 27 (2.6%) | 0 (0.0%) |
| 5:30 AM to 5:59 AM | 26 (2.5%) | 0 (0.0%) |
| 6:00 AM to 6:29 AM | 121 (11.7%) | 0 (0.0%) |
| 6:30 AM to 6:59 AM | 180 (17.4%) | 47 (6.8%) |
| 7:00 AM to 7:29 AM | 219 (21.2%) | 243 (35.4%) |
| 7:30 AM to 7:59 AM | 119 (11.5%) | 170 (24.7%) |
| 8:00 AM to 8:29 AM | 77 (7.5%) | 111 (16.2%) |
| 8:30 AM to 8:59 AM | 75 (7.3%) | 0 (0.0%) |
| 9:00 AM to 9:59 AM | 80 (7.7%) | 57 (8.3%) |
| 10:00 AM to 10:59 AM | 10 (1.0%) | 0 (0.0%) |
| 11:00 AM to 11:59 AM | 0 (0.0%) | 0 (0.0%) |
| 12:00 PM to 3:59 PM | 26 (2.5%) | 11 (1.6%) |
| 4:00 PM to 11:59 PM | 28 (2.7%) | 13 (1.9%) |
| Total | 1,032 (100.0%) | 687 (100.0%) |
Housing Occupancy in Whispering Pines
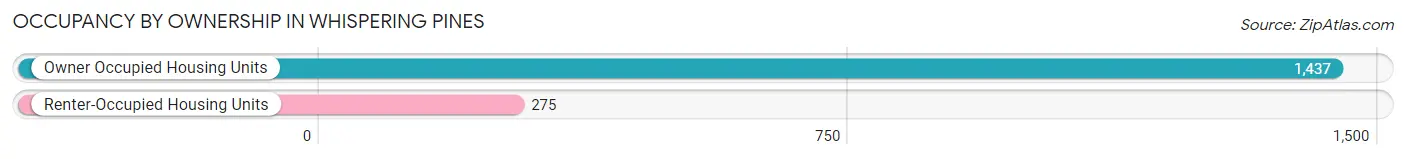
Occupancy by Ownership in Whispering Pines
Of the total 1,712 dwellings in Whispering Pines, owner-occupied units account for 1,437 (83.9%), while renter-occupied units make up 275 (16.1%).
| Occupancy | # Housing Units | % Housing Units |
| Owner Occupied Housing Units | 1,437 | 83.9% |
| Renter-Occupied Housing Units | 275 | 16.1% |
| Total Occupied Housing Units | 1,712 | 100.0% |
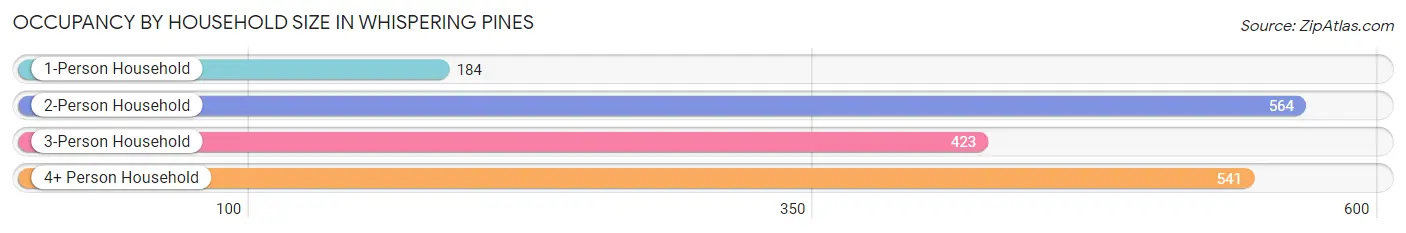
Occupancy by Household Size in Whispering Pines
| Household Size | # Housing Units | % Housing Units |
| 1-Person Household | 184 | 10.7% |
| 2-Person Household | 564 | 32.9% |
| 3-Person Household | 423 | 24.7% |
| 4+ Person Household | 541 | 31.6% |
| Total Housing Units | 1,712 | 100.0% |
Occupancy by Ownership by Household Size in Whispering Pines
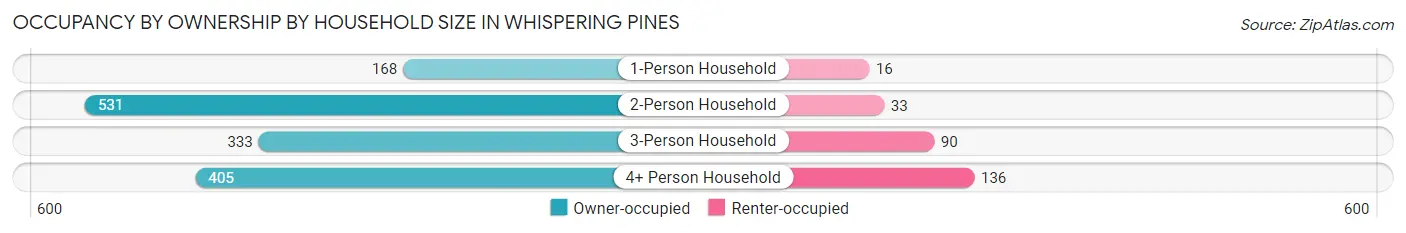
| Household Size | Owner-occupied | Renter-occupied |
| 1-Person Household | 168 (91.3%) | 16 (8.7%) |
| 2-Person Household | 531 (94.2%) | 33 (5.9%) |
| 3-Person Household | 333 (78.7%) | 90 (21.3%) |
| 4+ Person Household | 405 (74.9%) | 136 (25.1%) |
| Total Housing Units | 1,437 (83.9%) | 275 (16.1%) |
Occupancy by Educational Attainment in Whispering Pines
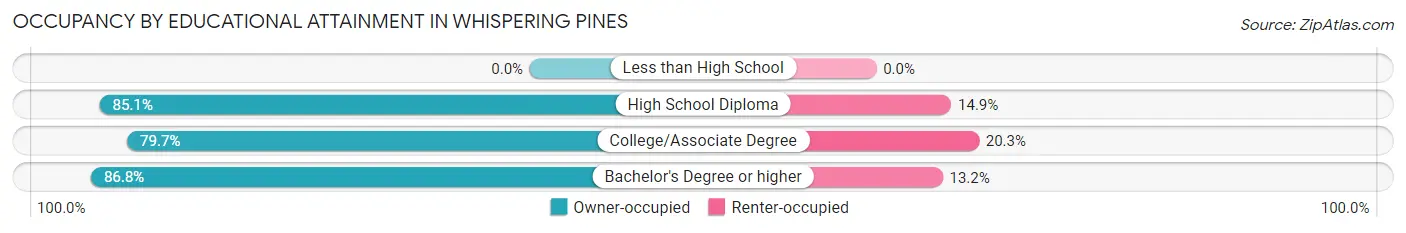
| Household Size | Owner-occupied | Renter-occupied |
| Less than High School | 0 (0.0%) | 0 (0.0%) |
| High School Diploma | 189 (85.1%) | 33 (14.9%) |
| College/Associate Degree | 509 (79.7%) | 130 (20.3%) |
| Bachelor's Degree or higher | 739 (86.8%) | 112 (13.2%) |
Occupancy by Age of Householder in Whispering Pines
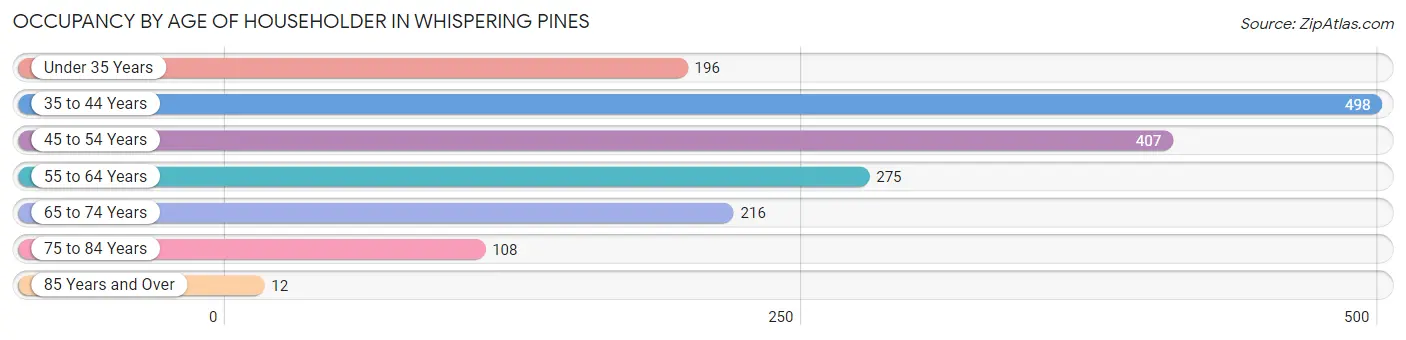
| Age Bracket | # Households | % Households |
| Under 35 Years | 196 | 11.5% |
| 35 to 44 Years | 498 | 29.1% |
| 45 to 54 Years | 407 | 23.8% |
| 55 to 64 Years | 275 | 16.1% |
| 65 to 74 Years | 216 | 12.6% |
| 75 to 84 Years | 108 | 6.3% |
| 85 Years and Over | 12 | 0.7% |
| Total | 1,712 | 100.0% |
Housing Finances in Whispering Pines
Median Income by Occupancy in Whispering Pines
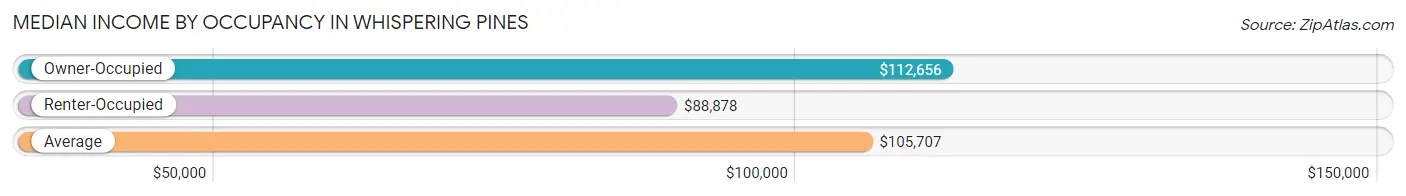
| Occupancy Type | # Households | Median Income |
| Owner-Occupied | 1,437 (83.9%) | $112,656 |
| Renter-Occupied | 275 (16.1%) | $88,878 |
| Average | 1,712 (100.0%) | $105,707 |
Occupancy by Householder Income Bracket in Whispering Pines
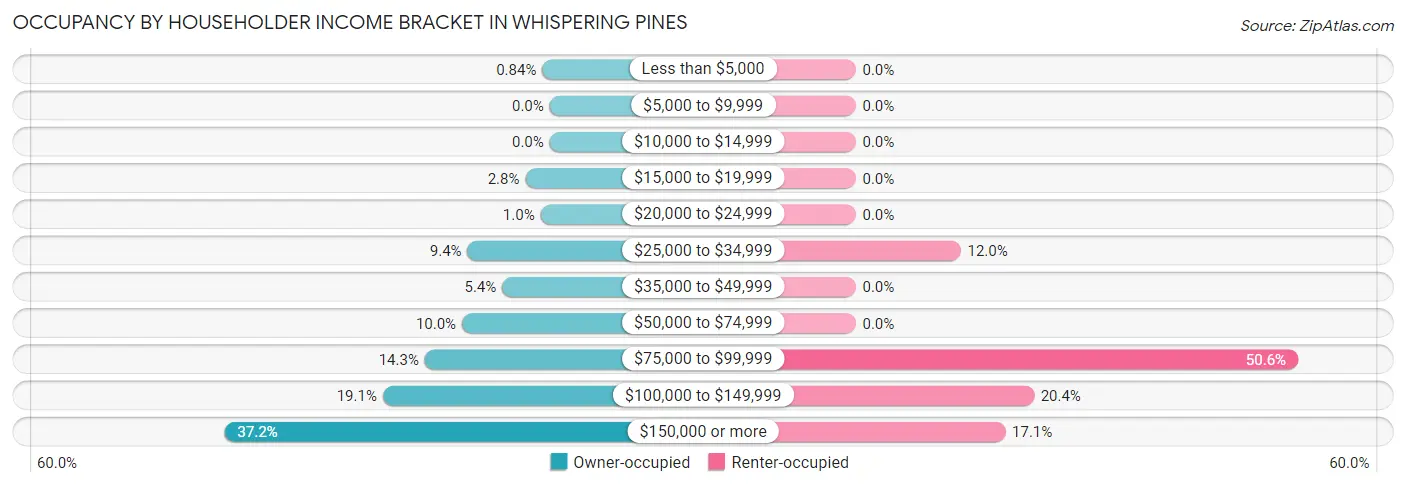
| Income Bracket | Owner-occupied | Renter-occupied |
| Less than $5,000 | 12 (0.8%) | 0 (0.0%) |
| $5,000 to $9,999 | 0 (0.0%) | 0 (0.0%) |
| $10,000 to $14,999 | 0 (0.0%) | 0 (0.0%) |
| $15,000 to $19,999 | 40 (2.8%) | 0 (0.0%) |
| $20,000 to $24,999 | 15 (1.0%) | 0 (0.0%) |
| $25,000 to $34,999 | 135 (9.4%) | 33 (12.0%) |
| $35,000 to $49,999 | 78 (5.4%) | 0 (0.0%) |
| $50,000 to $74,999 | 144 (10.0%) | 0 (0.0%) |
| $75,000 to $99,999 | 205 (14.3%) | 139 (50.5%) |
| $100,000 to $149,999 | 274 (19.1%) | 56 (20.4%) |
| $150,000 or more | 534 (37.2%) | 47 (17.1%) |
| Total | 1,437 (100.0%) | 275 (100.0%) |
Monthly Housing Cost Tiers in Whispering Pines
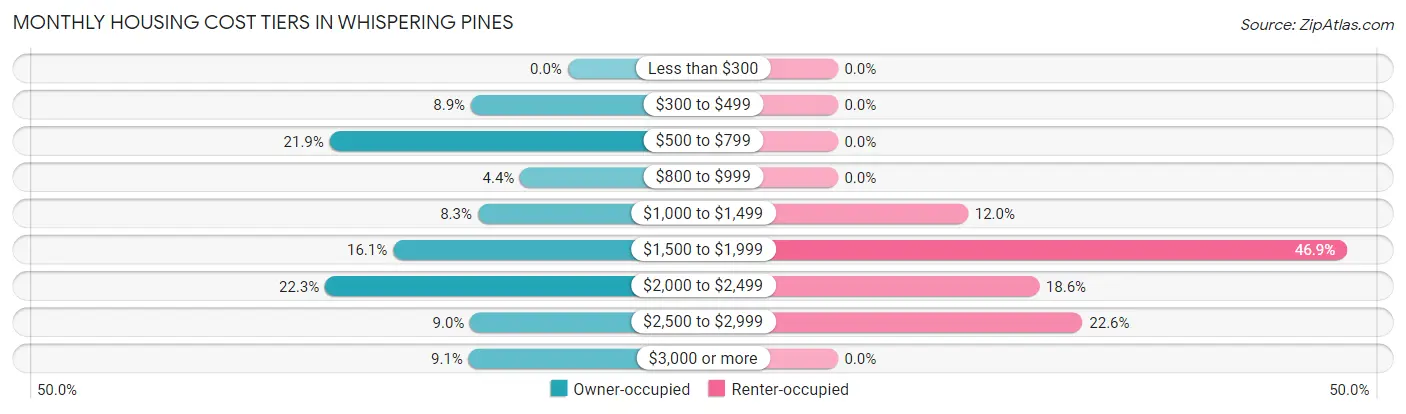
| Monthly Cost | Owner-occupied | Renter-occupied |
| Less than $300 | 0 (0.0%) | 0 (0.0%) |
| $300 to $499 | 128 (8.9%) | 0 (0.0%) |
| $500 to $799 | 315 (21.9%) | 0 (0.0%) |
| $800 to $999 | 63 (4.4%) | 0 (0.0%) |
| $1,000 to $1,499 | 119 (8.3%) | 33 (12.0%) |
| $1,500 to $1,999 | 231 (16.1%) | 129 (46.9%) |
| $2,000 to $2,499 | 321 (22.3%) | 51 (18.5%) |
| $2,500 to $2,999 | 129 (9.0%) | 62 (22.6%) |
| $3,000 or more | 131 (9.1%) | 0 (0.0%) |
| Total | 1,437 (100.0%) | 275 (100.0%) |
Physical Housing Characteristics in Whispering Pines
Housing Structures in Whispering Pines
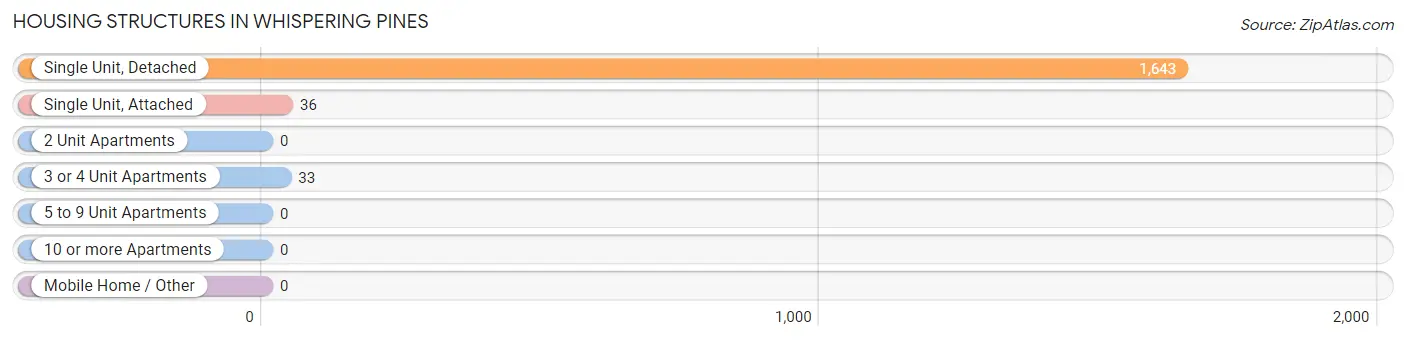
| Structure Type | # Housing Units | % Housing Units |
| Single Unit, Detached | 1,643 | 96.0% |
| Single Unit, Attached | 36 | 2.1% |
| 2 Unit Apartments | 0 | 0.0% |
| 3 or 4 Unit Apartments | 33 | 1.9% |
| 5 to 9 Unit Apartments | 0 | 0.0% |
| 10 or more Apartments | 0 | 0.0% |
| Mobile Home / Other | 0 | 0.0% |
| Total | 1,712 | 100.0% |
Housing Structures by Occupancy in Whispering Pines
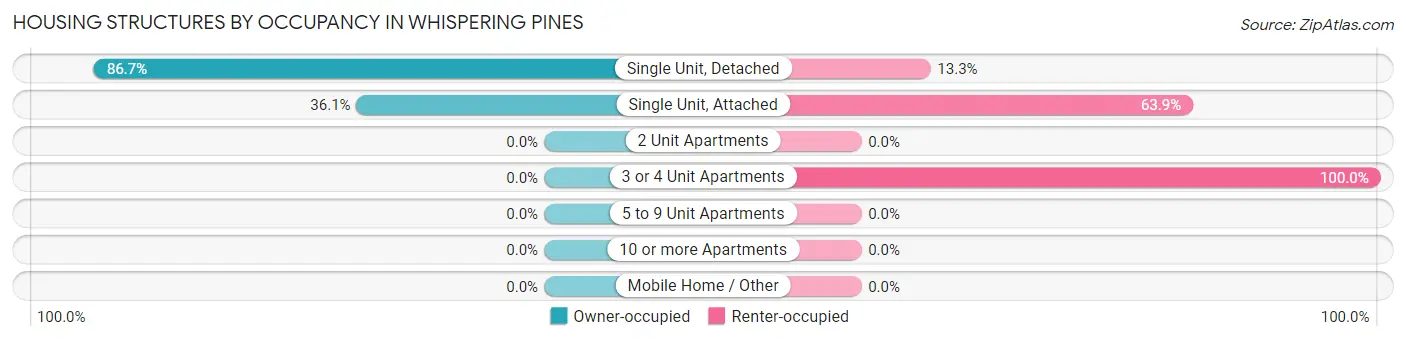
| Structure Type | Owner-occupied | Renter-occupied |
| Single Unit, Detached | 1,424 (86.7%) | 219 (13.3%) |
| Single Unit, Attached | 13 (36.1%) | 23 (63.9%) |
| 2 Unit Apartments | 0 (0.0%) | 0 (0.0%) |
| 3 or 4 Unit Apartments | 0 (0.0%) | 33 (100.0%) |
| 5 to 9 Unit Apartments | 0 (0.0%) | 0 (0.0%) |
| 10 or more Apartments | 0 (0.0%) | 0 (0.0%) |
| Mobile Home / Other | 0 (0.0%) | 0 (0.0%) |
| Total | 1,437 (83.9%) | 275 (16.1%) |
Housing Structures by Number of Rooms in Whispering Pines
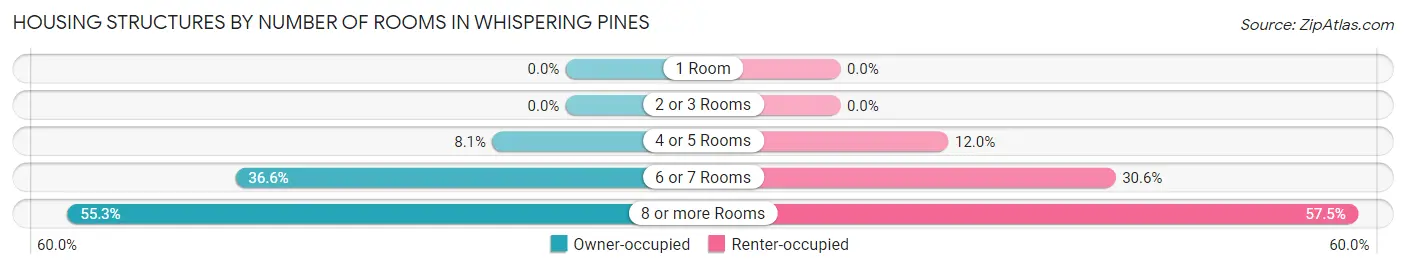
| Number of Rooms | Owner-occupied | Renter-occupied |
| 1 Room | 0 (0.0%) | 0 (0.0%) |
| 2 or 3 Rooms | 0 (0.0%) | 0 (0.0%) |
| 4 or 5 Rooms | 117 (8.1%) | 33 (12.0%) |
| 6 or 7 Rooms | 526 (36.6%) | 84 (30.5%) |
| 8 or more Rooms | 794 (55.2%) | 158 (57.5%) |
| Total | 1,437 (100.0%) | 275 (100.0%) |
Housing Structure by Heating Type in Whispering Pines
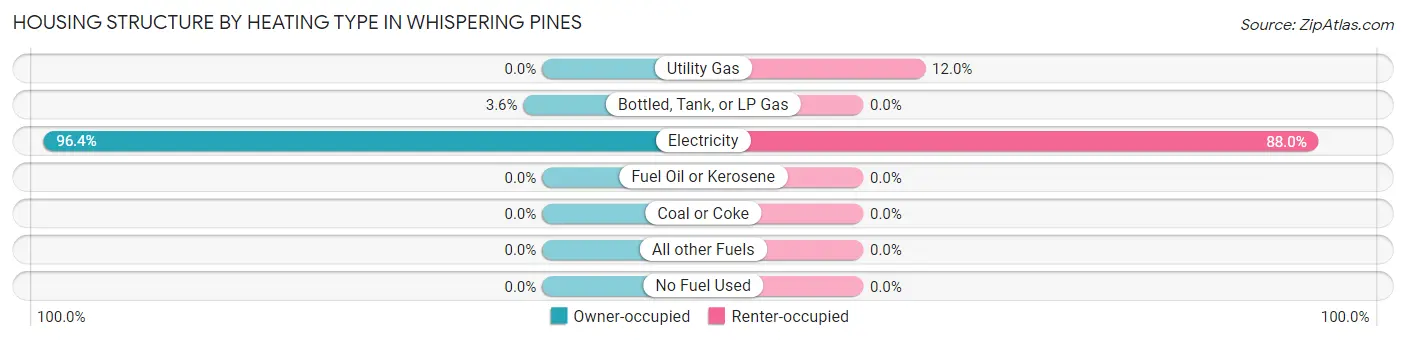
| Heating Type | Owner-occupied | Renter-occupied |
| Utility Gas | 0 (0.0%) | 33 (12.0%) |
| Bottled, Tank, or LP Gas | 52 (3.6%) | 0 (0.0%) |
| Electricity | 1,385 (96.4%) | 242 (88.0%) |
| Fuel Oil or Kerosene | 0 (0.0%) | 0 (0.0%) |
| Coal or Coke | 0 (0.0%) | 0 (0.0%) |
| All other Fuels | 0 (0.0%) | 0 (0.0%) |
| No Fuel Used | 0 (0.0%) | 0 (0.0%) |
| Total | 1,437 (100.0%) | 275 (100.0%) |
Household Vehicle Usage in Whispering Pines
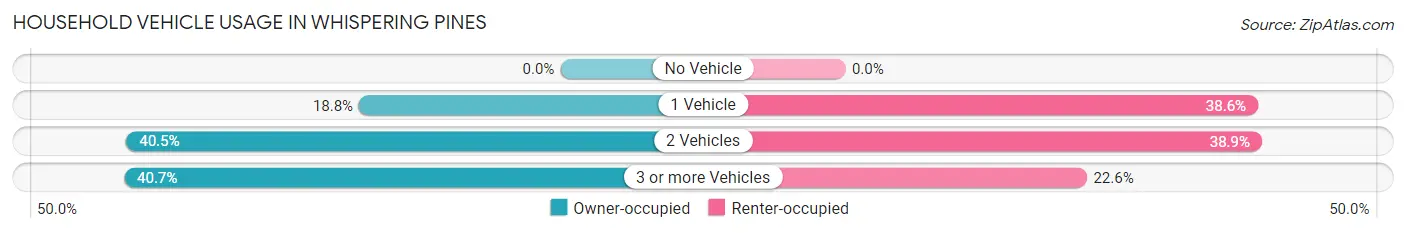
| Vehicles per Household | Owner-occupied | Renter-occupied |
| No Vehicle | 0 (0.0%) | 0 (0.0%) |
| 1 Vehicle | 270 (18.8%) | 106 (38.6%) |
| 2 Vehicles | 582 (40.5%) | 107 (38.9%) |
| 3 or more Vehicles | 585 (40.7%) | 62 (22.6%) |
| Total | 1,437 (100.0%) | 275 (100.0%) |
Real Estate & Mortgages in Whispering Pines
Real Estate and Mortgage Overview in Whispering Pines
| Characteristic | Without Mortgage | With Mortgage |
| Housing Units | 455 | 982 |
| Median Property Value | $443,600 | $397,500 |
| Median Household Income | $92,604 | $423 |
| Monthly Housing Costs | $627 | $131 |
| Real Estate Taxes | $2,962 | $0 |
Property Value by Mortgage Status in Whispering Pines
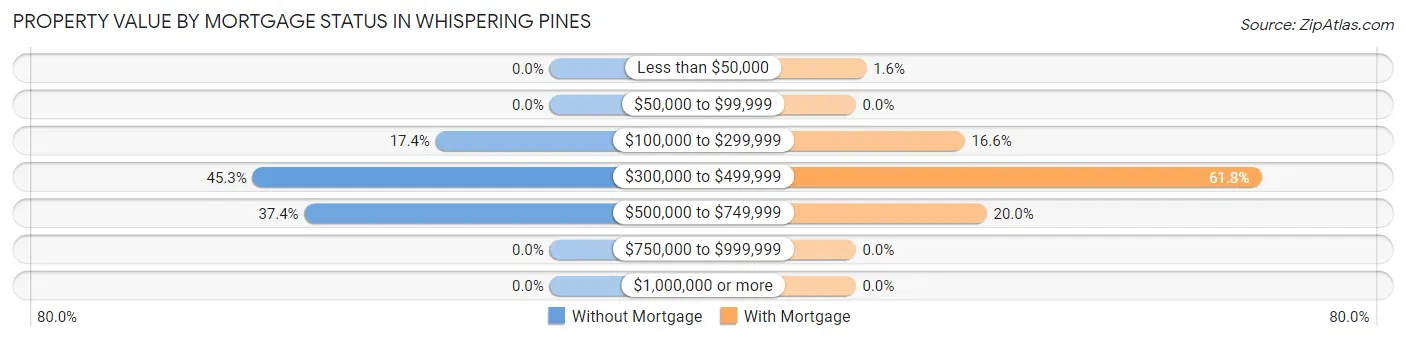
| Property Value | Without Mortgage | With Mortgage |
| Less than $50,000 | 0 (0.0%) | 16 (1.6%) |
| $50,000 to $99,999 | 0 (0.0%) | 0 (0.0%) |
| $100,000 to $299,999 | 79 (17.4%) | 163 (16.6%) |
| $300,000 to $499,999 | 206 (45.3%) | 607 (61.8%) |
| $500,000 to $749,999 | 170 (37.4%) | 196 (20.0%) |
| $750,000 to $999,999 | 0 (0.0%) | 0 (0.0%) |
| $1,000,000 or more | 0 (0.0%) | 0 (0.0%) |
| Total | 455 (100.0%) | 982 (100.0%) |
Household Income by Mortgage Status in Whispering Pines
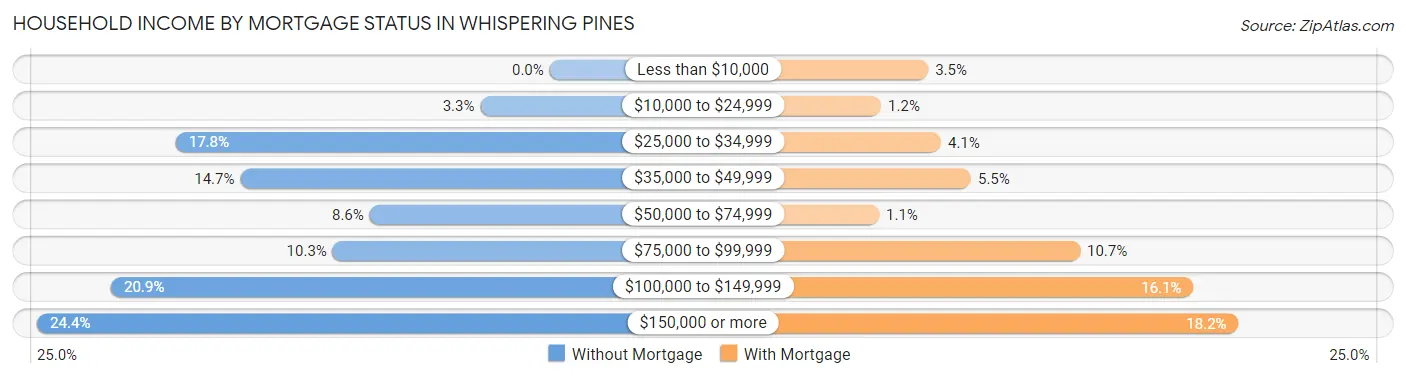
| Household Income | Without Mortgage | With Mortgage |
| Less than $10,000 | 0 (0.0%) | 34 (3.5%) |
| $10,000 to $24,999 | 15 (3.3%) | 12 (1.2%) |
| $25,000 to $34,999 | 81 (17.8%) | 40 (4.1%) |
| $35,000 to $49,999 | 67 (14.7%) | 54 (5.5%) |
| $50,000 to $74,999 | 39 (8.6%) | 11 (1.1%) |
| $75,000 to $99,999 | 47 (10.3%) | 105 (10.7%) |
| $100,000 to $149,999 | 95 (20.9%) | 158 (16.1%) |
| $150,000 or more | 111 (24.4%) | 179 (18.2%) |
| Total | 455 (100.0%) | 982 (100.0%) |
Property Value to Household Income Ratio in Whispering Pines
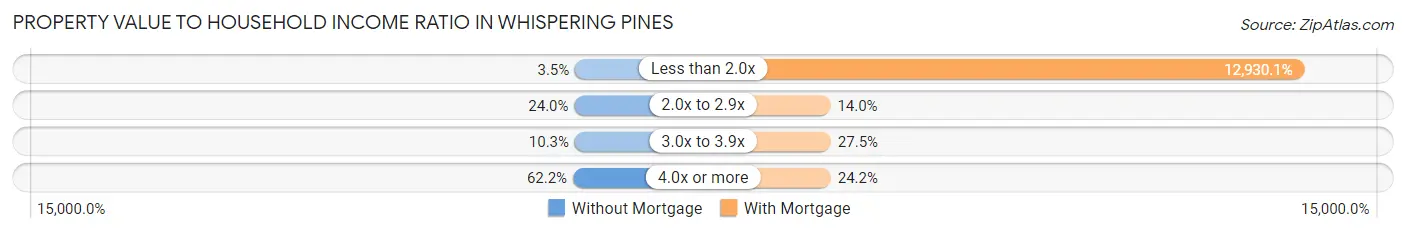
| Value-to-Income Ratio | Without Mortgage | With Mortgage |
| Less than 2.0x | 16 (3.5%) | 126,974 (12,930.1%) |
| 2.0x to 2.9x | 109 (24.0%) | 137 (14.0%) |
| 3.0x to 3.9x | 47 (10.3%) | 270 (27.5%) |
| 4.0x or more | 283 (62.2%) | 238 (24.2%) |
| Total | 455 (100.0%) | 982 (100.0%) |
Real Estate Taxes by Mortgage Status in Whispering Pines
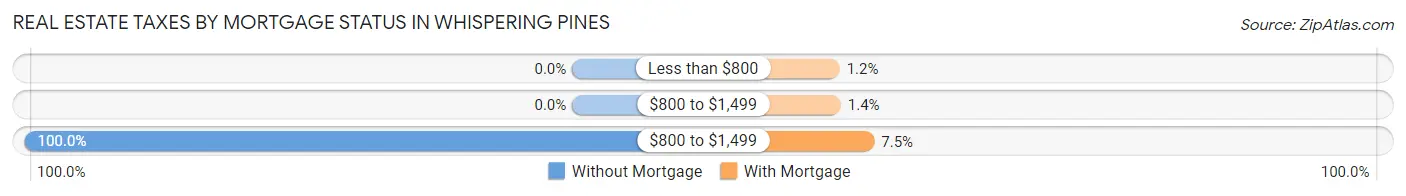
| Property Taxes | Without Mortgage | With Mortgage |
| Less than $800 | 0 (0.0%) | 12 (1.2%) |
| $800 to $1,499 | 0 (0.0%) | 14 (1.4%) |
| $800 to $1,499 | 455 (100.0%) | 74 (7.5%) |
| Total | 455 (100.0%) | 982 (100.0%) |
Health & Disability in Whispering Pines
Health Insurance Coverage by Age in Whispering Pines
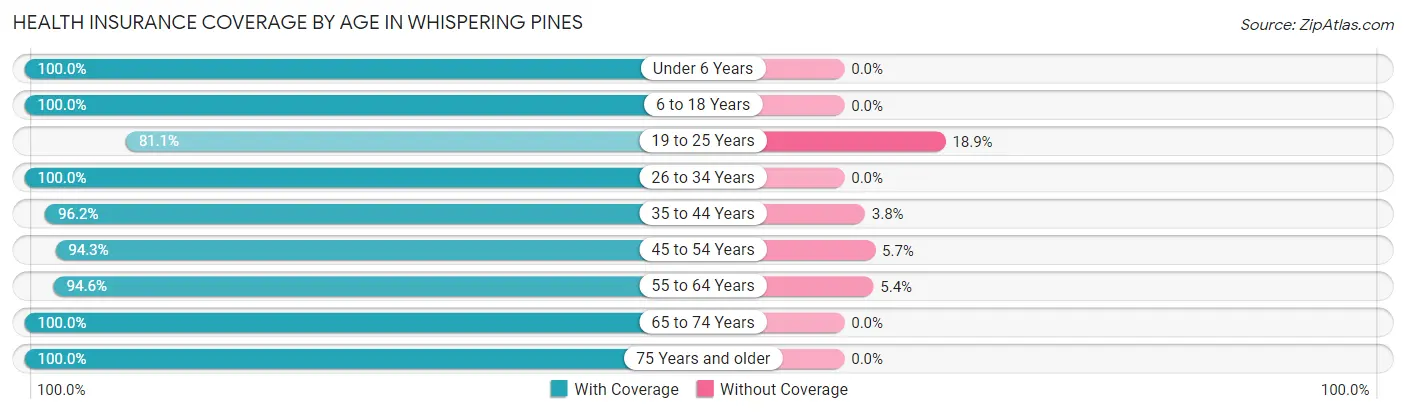
| Age Bracket | With Coverage | Without Coverage |
| Under 6 Years | 390 (100.0%) | 0 (0.0%) |
| 6 to 18 Years | 1,383 (100.0%) | 0 (0.0%) |
| 19 to 25 Years | 142 (81.1%) | 33 (18.9%) |
| 26 to 34 Years | 256 (100.0%) | 0 (0.0%) |
| 35 to 44 Years | 578 (96.2%) | 23 (3.8%) |
| 45 to 54 Years | 558 (94.3%) | 34 (5.7%) |
| 55 to 64 Years | 489 (94.6%) | 28 (5.4%) |
| 65 to 74 Years | 390 (100.0%) | 0 (0.0%) |
| 75 Years and older | 248 (100.0%) | 0 (0.0%) |
| Total | 4,434 (97.4%) | 118 (2.6%) |
Health Insurance Coverage by Citizenship Status in Whispering Pines
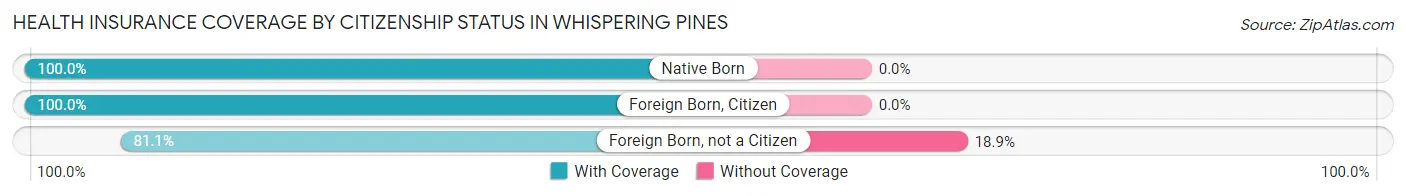
| Citizenship Status | With Coverage | Without Coverage |
| Native Born | 390 (100.0%) | 0 (0.0%) |
| Foreign Born, Citizen | 1,383 (100.0%) | 0 (0.0%) |
| Foreign Born, not a Citizen | 142 (81.1%) | 33 (18.9%) |
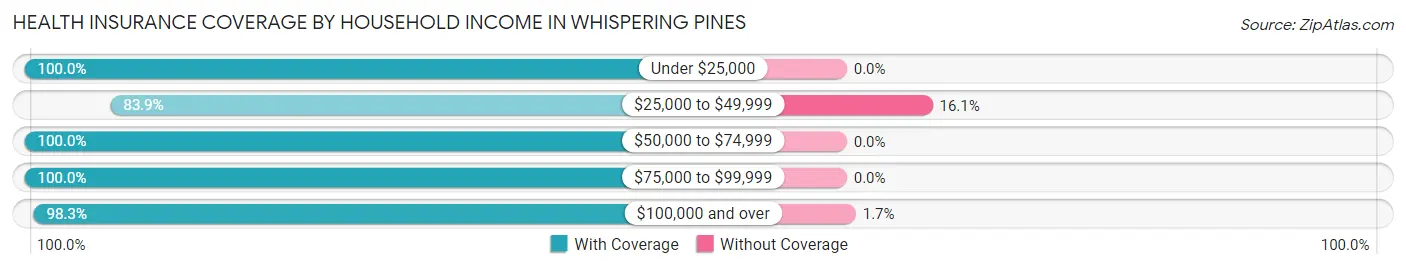
Health Insurance Coverage by Household Income in Whispering Pines
| Household Income | With Coverage | Without Coverage |
| Under $25,000 | 126 (100.0%) | 0 (0.0%) |
| $25,000 to $49,999 | 392 (83.9%) | 75 (16.1%) |
| $50,000 to $74,999 | 413 (100.0%) | 0 (0.0%) |
| $75,000 to $99,999 | 1,005 (100.0%) | 0 (0.0%) |
| $100,000 and over | 2,498 (98.3%) | 43 (1.7%) |
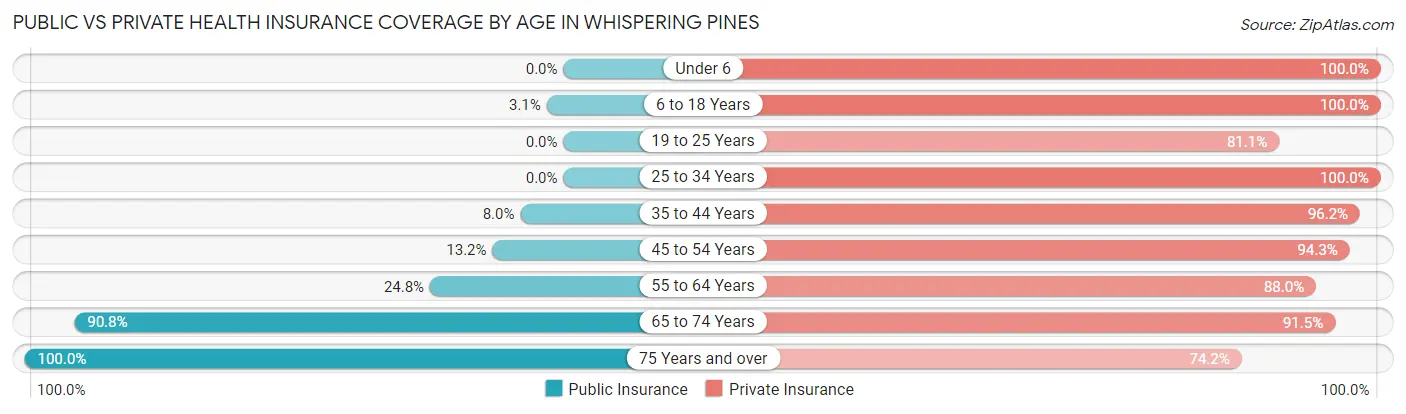
Public vs Private Health Insurance Coverage by Age in Whispering Pines
| Age Bracket | Public Insurance | Private Insurance |
| Under 6 | 0 (0.0%) | 390 (100.0%) |
| 6 to 18 Years | 43 (3.1%) | 1,383 (100.0%) |
| 19 to 25 Years | 0 (0.0%) | 142 (81.1%) |
| 25 to 34 Years | 0 (0.0%) | 256 (100.0%) |
| 35 to 44 Years | 48 (8.0%) | 578 (96.2%) |
| 45 to 54 Years | 78 (13.2%) | 558 (94.3%) |
| 55 to 64 Years | 128 (24.8%) | 455 (88.0%) |
| 65 to 74 Years | 354 (90.8%) | 357 (91.5%) |
| 75 Years and over | 248 (100.0%) | 184 (74.2%) |
| Total | 899 (19.8%) | 4,303 (94.5%) |
Disability Status by Sex by Age in Whispering Pines
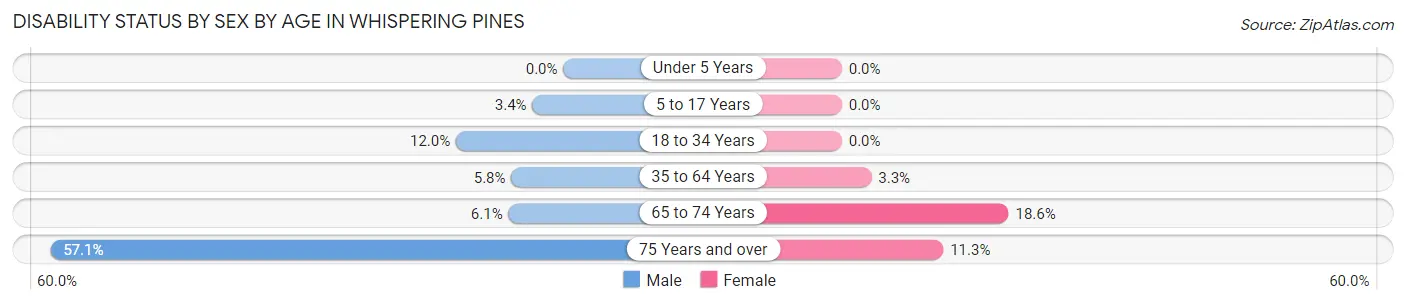
| Age Bracket | Male | Female |
| Under 5 Years | 0 (0.0%) | 0 (0.0%) |
| 5 to 17 Years | 21 (3.4%) | 0 (0.0%) |
| 18 to 34 Years | 27 (11.9%) | 0 (0.0%) |
| 35 to 64 Years | 41 (5.8%) | 33 (3.3%) |
| 65 to 74 Years | 11 (6.1%) | 39 (18.6%) |
| 75 Years and over | 76 (57.1%) | 13 (11.3%) |
Disability Class by Sex by Age in Whispering Pines
Disability Class: Hearing Difficulty
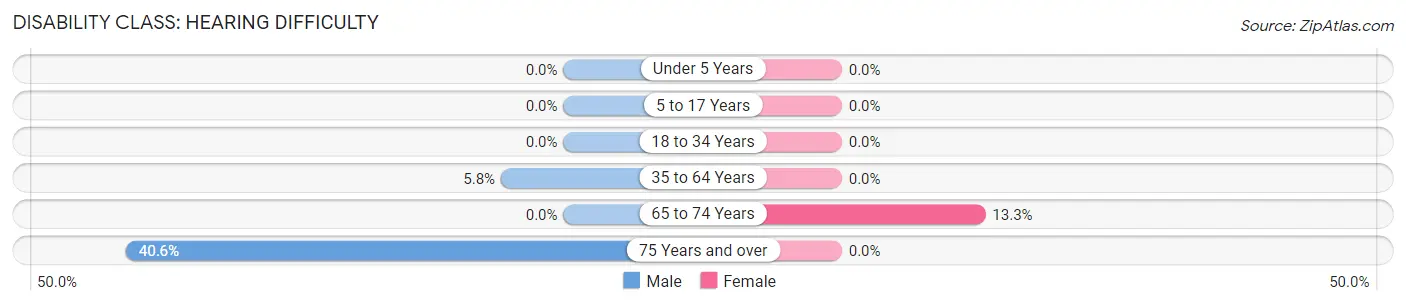
| Age Bracket | Male | Female |
| Under 5 Years | 0 (0.0%) | 0 (0.0%) |
| 5 to 17 Years | 0 (0.0%) | 0 (0.0%) |
| 18 to 34 Years | 0 (0.0%) | 0 (0.0%) |
| 35 to 64 Years | 41 (5.8%) | 0 (0.0%) |
| 65 to 74 Years | 0 (0.0%) | 28 (13.3%) |
| 75 Years and over | 54 (40.6%) | 0 (0.0%) |
Disability Class: Vision Difficulty
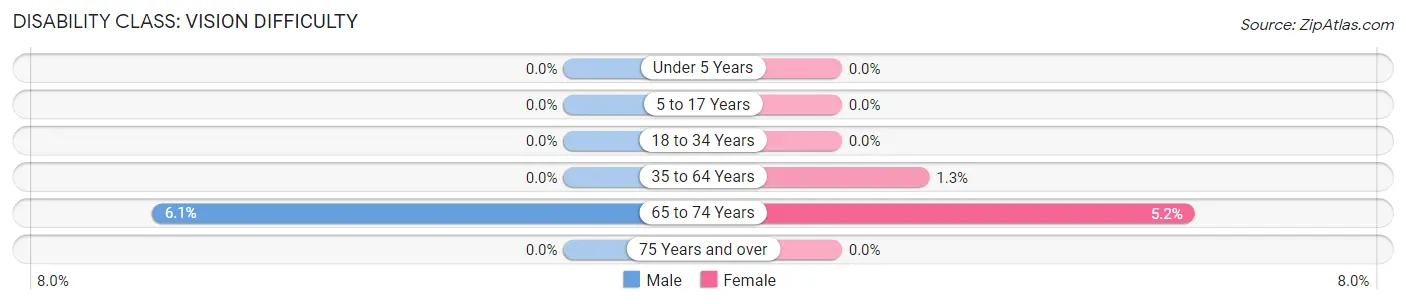
| Age Bracket | Male | Female |
| Under 5 Years | 0 (0.0%) | 0 (0.0%) |
| 5 to 17 Years | 0 (0.0%) | 0 (0.0%) |
| 18 to 34 Years | 0 (0.0%) | 0 (0.0%) |
| 35 to 64 Years | 0 (0.0%) | 13 (1.3%) |
| 65 to 74 Years | 11 (6.1%) | 11 (5.2%) |
| 75 Years and over | 0 (0.0%) | 0 (0.0%) |
Disability Class: Cognitive Difficulty
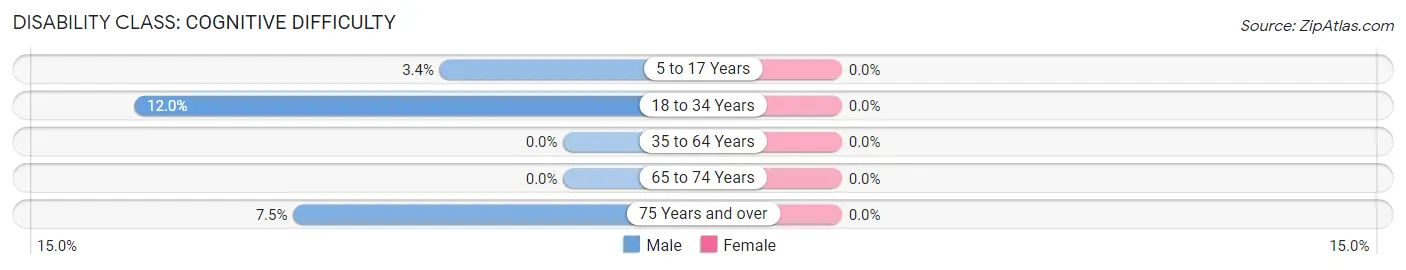
| Age Bracket | Male | Female |
| 5 to 17 Years | 21 (3.4%) | 0 (0.0%) |
| 18 to 34 Years | 27 (11.9%) | 0 (0.0%) |
| 35 to 64 Years | 0 (0.0%) | 0 (0.0%) |
| 65 to 74 Years | 0 (0.0%) | 0 (0.0%) |
| 75 Years and over | 10 (7.5%) | 0 (0.0%) |
Disability Class: Ambulatory Difficulty
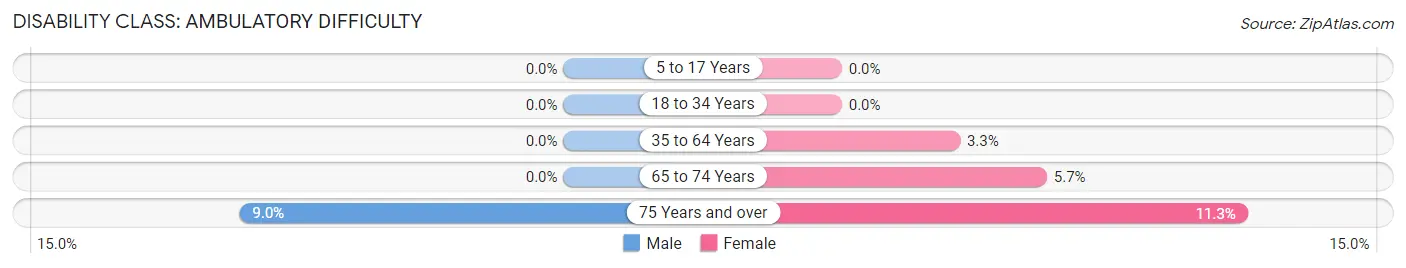
| Age Bracket | Male | Female |
| 5 to 17 Years | 0 (0.0%) | 0 (0.0%) |
| 18 to 34 Years | 0 (0.0%) | 0 (0.0%) |
| 35 to 64 Years | 0 (0.0%) | 33 (3.3%) |
| 65 to 74 Years | 0 (0.0%) | 12 (5.7%) |
| 75 Years and over | 12 (9.0%) | 13 (11.3%) |
Disability Class: Self-Care Difficulty
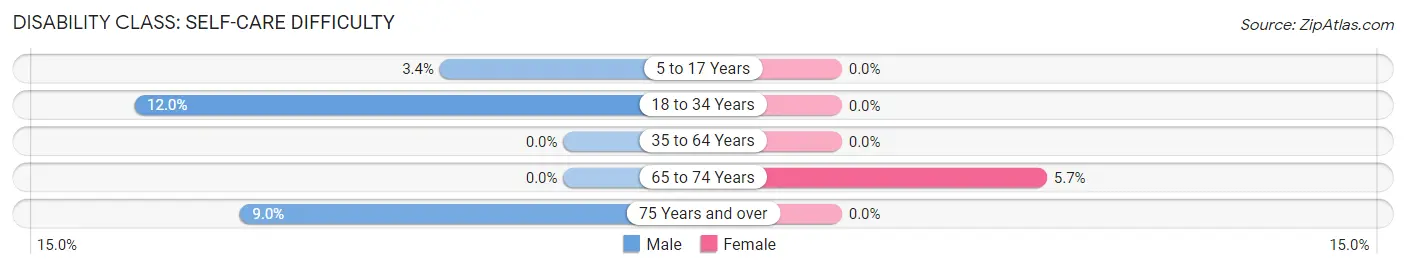
| Age Bracket | Male | Female |
| 5 to 17 Years | 21 (3.4%) | 0 (0.0%) |
| 18 to 34 Years | 27 (11.9%) | 0 (0.0%) |
| 35 to 64 Years | 0 (0.0%) | 0 (0.0%) |
| 65 to 74 Years | 0 (0.0%) | 12 (5.7%) |
| 75 Years and over | 12 (9.0%) | 0 (0.0%) |
Technology Access in Whispering Pines
Computing Device Access in Whispering Pines
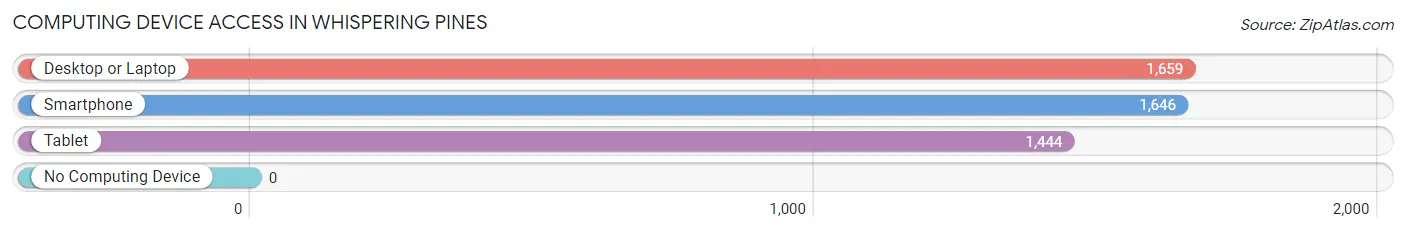
| Device Type | # Households | % Households |
| Desktop or Laptop | 1,659 | 96.9% |
| Smartphone | 1,646 | 96.1% |
| Tablet | 1,444 | 84.4% |
| No Computing Device | 0 | 0.0% |
| Total | 1,712 | 100.0% |
Internet Access in Whispering Pines
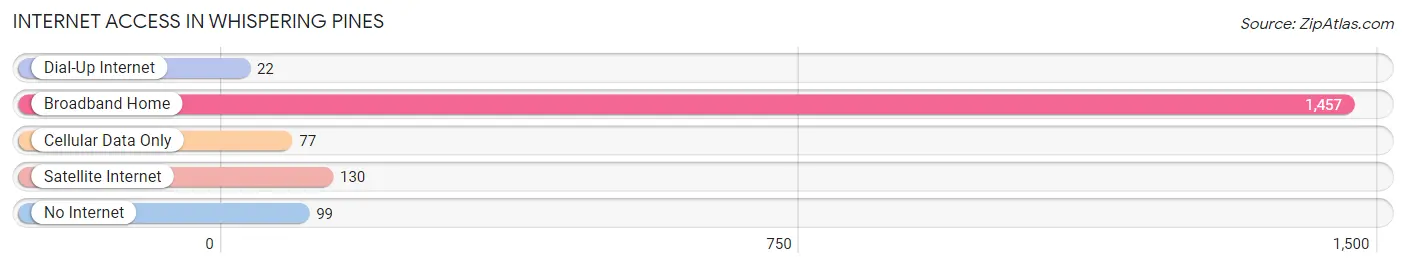
| Internet Type | # Households | % Households |
| Dial-Up Internet | 22 | 1.3% |
| Broadband Home | 1,457 | 85.1% |
| Cellular Data Only | 77 | 4.5% |
| Satellite Internet | 130 | 7.6% |
| No Internet | 99 | 5.8% |
| Total | 1,712 | 100.0% |
Whispering Pines Summary
Whispering Pines, North Carolina is a small town located in Moore County, in the heart of the Sandhills region of the state. The town was founded in the late 1800s and has a population of approximately 2,000 people. The town is known for its rural charm and its close proximity to the larger cities of Fayetteville and Raleigh.
Geography
Whispering Pines is located in the Sandhills region of North Carolina, which is characterized by rolling hills and sandy soils. The town is situated in the center of Moore County, about 25 miles south of Fayetteville and 40 miles west of Raleigh. The town is surrounded by the towns of Pinehurst, Southern Pines, Aberdeen, and Carthage. The town is located in the Cape Fear River Basin, and is part of the larger Piedmont region of the state.
The town is located at an elevation of approximately 500 feet above sea level, and the climate is generally mild and humid. The average temperature in the summer is around 80 degrees Fahrenheit, and the average temperature in the winter is around 40 degrees Fahrenheit. The town receives an average of 48 inches of precipitation per year, with most of it falling in the form of rain.
Economy
Whispering Pines is a small, rural town, and the economy is largely based on agriculture and tourism. The town is home to several farms, which produce a variety of crops, including corn, soybeans, and tobacco. The town is also home to several small businesses, including restaurants, retail stores, and service providers.
The town is also home to several golf courses, which attract tourists from all over the country. The town is also home to several resorts, which offer a variety of amenities, including golf courses, swimming pools, and spas.
Demographics
As of the 2010 census, the population of Whispering Pines was 2,037. The population is predominantly white, with African Americans making up about 8% of the population. The median household income is $45,000, and the median age is 44. The town is home to several churches, and the largest religious denomination is Baptist.
Whispering Pines is a small, rural town with a close-knit community. The town is known for its friendly atmosphere and its commitment to preserving its rural charm. The town is home to several parks and recreational areas, and the town is committed to preserving its natural beauty. The town is also home to several festivals and events throughout the year, which attract visitors from all over the state.
Common Questions
What is Per Capita Income in Whispering Pines?
Per Capita income in Whispering Pines is $41,538.
What is the Median Family Income in Whispering Pines?
Median Family Income in Whispering Pines is $115,556.
What is the Median Household income in Whispering Pines?
Median Household Income in Whispering Pines is $105,707.
What is Income or Wage Gap in Whispering Pines?
Income or Wage Gap in Whispering Pines is 38.1%.
Women in Whispering Pines earn 61.9 cents for every dollar earned by a man.
What is Inequality or Gini Index in Whispering Pines?
Inequality or Gini Index in Whispering Pines is 0.35.
What is the Total Population of Whispering Pines?
Total Population of Whispering Pines is 4,938.
What is the Total Male Population of Whispering Pines?
Total Male Population of Whispering Pines is 2,385.
What is the Total Female Population of Whispering Pines?
Total Female Population of Whispering Pines is 2,553.
What is the Ratio of Males per 100 Females in Whispering Pines?
There are 93.42 Males per 100 Females in Whispering Pines.
What is the Ratio of Females per 100 Males in Whispering Pines?
There are 107.04 Females per 100 Males in Whispering Pines.
What is the Median Population Age in Whispering Pines?
Median Population Age in Whispering Pines is 37.2 Years.
What is the Average Family Size in Whispering Pines
Average Family Size in Whispering Pines is 3.1 People.
What is the Average Household Size in Whispering Pines
Average Household Size in Whispering Pines is 2.9 People.
How Large is the Labor Force in Whispering Pines?
There are 2,155 People in the Labor Forcein in Whispering Pines.
What is the Percentage of People in the Labor Force in Whispering Pines?
60.1% of People are in the Labor Force in Whispering Pines.
What is the Unemployment Rate in Whispering Pines?
Unemployment Rate in Whispering Pines is 5.1%.