Bayview, NC Map & Demographics
Bayview Map
Bayview Overview
$50,835
PER CAPITA INCOME
$112,180
AVG FAMILY INCOME
$110,698
AVG HOUSEHOLD INCOME
0.31
INEQUALITY / GINI INDEX
398
TOTAL POPULATION
232
MALE POPULATION
166
FEMALE POPULATION
139.76
MALES / 100 FEMALES
71.55
FEMALES / 100 MALES
48.7
MEDIAN AGE
2.3
AVG FAMILY SIZE
2.2
AVG HOUSEHOLD SIZE
225
LABOR FORCE [ PEOPLE ]
58.1%
PERCENT IN LABOR FORCE
Income in Bayview
Income Overview in Bayview
Per Capita Income in Bayview is $50,835, while median incomes of families and households are $112,180 and $110,698 respectively.
| Characteristic | Number | Measure |
| Per Capita Income | 398 | $50,835 |
| Median Family Income | 133 | $112,180 |
| Mean Family Income | 133 | $125,634 |
| Median Household Income | 184 | $110,698 |
| Mean Household Income | 184 | $98,364 |
| Income Deficit | 133 | $0 |
| Wage / Income Gap (%) | 398 | 0.00% |
| Wage / Income Gap ($) | 398 | 100.00¢ per $1 |
| Gini / Inequality Index | 398 | 0.31 |
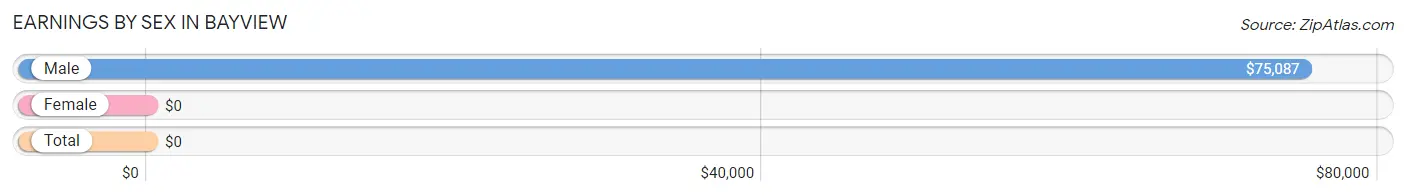
Earnings by Sex in Bayview
| Sex | Number | Average Earnings |
| Male | 195 (71.4%) | $75,087 |
| Female | 78 (28.6%) | $0 |
| Total | 273 (100.0%) | $0 |
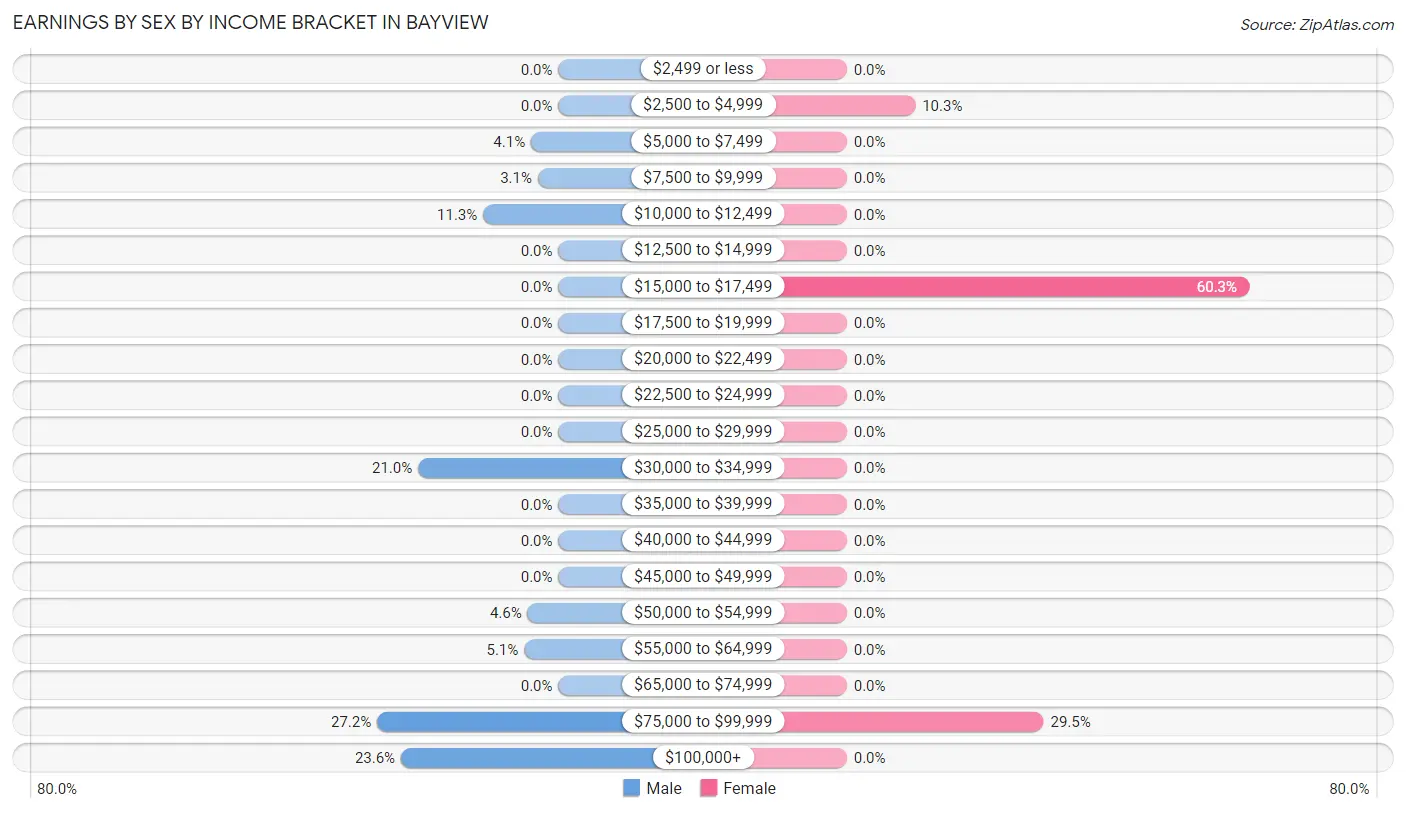
Earnings by Sex by Income Bracket in Bayview
The most common earnings brackets in Bayview are $75,000 to $99,999 for men (53 | 27.2%) and $15,000 to $17,499 for women (47 | 60.3%).
| Income | Male | Female |
| $2,499 or less | 0 (0.0%) | 0 (0.0%) |
| $2,500 to $4,999 | 0 (0.0%) | 8 (10.3%) |
| $5,000 to $7,499 | 8 (4.1%) | 0 (0.0%) |
| $7,500 to $9,999 | 6 (3.1%) | 0 (0.0%) |
| $10,000 to $12,499 | 22 (11.3%) | 0 (0.0%) |
| $12,500 to $14,999 | 0 (0.0%) | 0 (0.0%) |
| $15,000 to $17,499 | 0 (0.0%) | 47 (60.3%) |
| $17,500 to $19,999 | 0 (0.0%) | 0 (0.0%) |
| $20,000 to $22,499 | 0 (0.0%) | 0 (0.0%) |
| $22,500 to $24,999 | 0 (0.0%) | 0 (0.0%) |
| $25,000 to $29,999 | 0 (0.0%) | 0 (0.0%) |
| $30,000 to $34,999 | 41 (21.0%) | 0 (0.0%) |
| $35,000 to $39,999 | 0 (0.0%) | 0 (0.0%) |
| $40,000 to $44,999 | 0 (0.0%) | 0 (0.0%) |
| $45,000 to $49,999 | 0 (0.0%) | 0 (0.0%) |
| $50,000 to $54,999 | 9 (4.6%) | 0 (0.0%) |
| $55,000 to $64,999 | 10 (5.1%) | 0 (0.0%) |
| $65,000 to $74,999 | 0 (0.0%) | 0 (0.0%) |
| $75,000 to $99,999 | 53 (27.2%) | 23 (29.5%) |
| $100,000+ | 46 (23.6%) | 0 (0.0%) |
| Total | 195 (100.0%) | 78 (100.0%) |
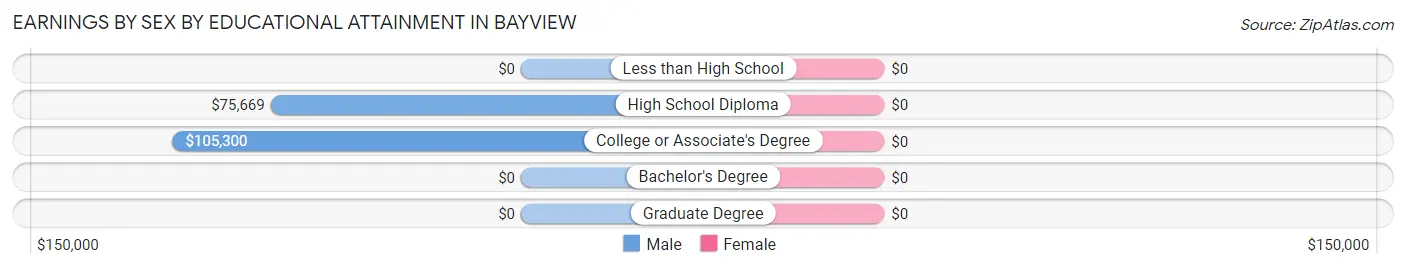
Earnings by Sex by Educational Attainment in Bayview
| Educational Attainment | Male Income | Female Income |
| Less than High School | - | - |
| High School Diploma | $75,669 | $0 |
| College or Associate's Degree | $105,300 | $0 |
| Bachelor's Degree | - | - |
| Graduate Degree | - | - |
| Total | $75,262 | $0 |
Family Income in Bayview
Family Income Brackets in Bayview
According to the Bayview family income data, there are 89 families falling into the $100,000 to $149,999 income range, which is the most common income bracket and makes up 66.9% of all families.
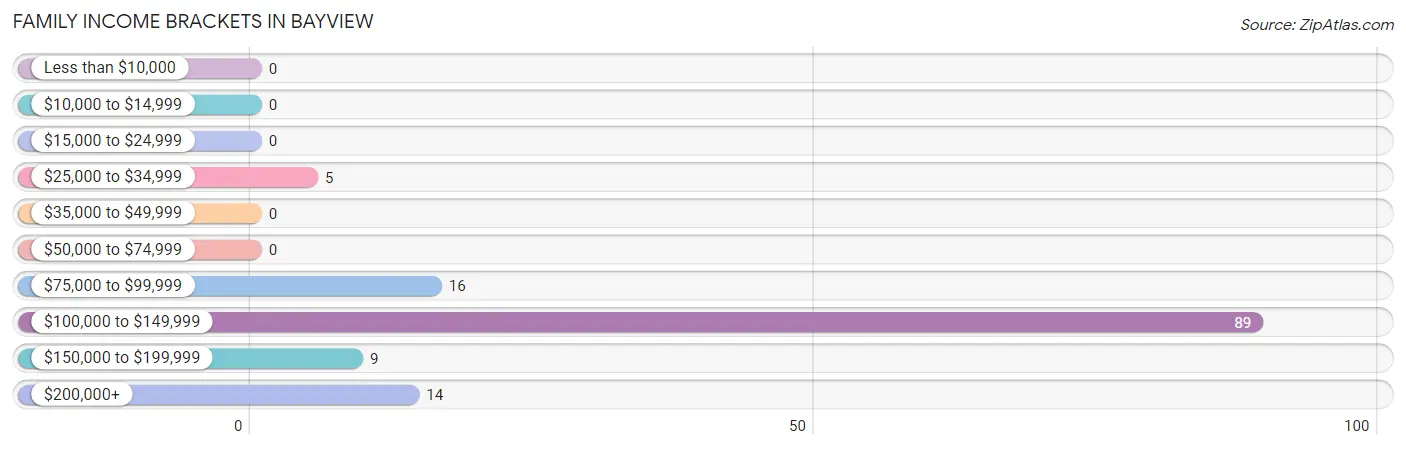
| Income Bracket | # Families | % Families |
| Less than $10,000 | 0 | 0.0% |
| $10,000 to $14,999 | 0 | 0.0% |
| $15,000 to $24,999 | 0 | 0.0% |
| $25,000 to $34,999 | 5 | 3.8% |
| $35,000 to $49,999 | 0 | 0.0% |
| $50,000 to $74,999 | 0 | 0.0% |
| $75,000 to $99,999 | 16 | 12.0% |
| $100,000 to $149,999 | 89 | 66.9% |
| $150,000 to $199,999 | 9 | 6.8% |
| $200,000+ | 14 | 10.5% |
Family Income by Famaliy Size in Bayview
3-person families (28 | 21.0%) account for the highest median family income in Bayview with $162,500 per family, while 2-person families (105 | 78.9%) have the highest median income of $55,828 per family member.
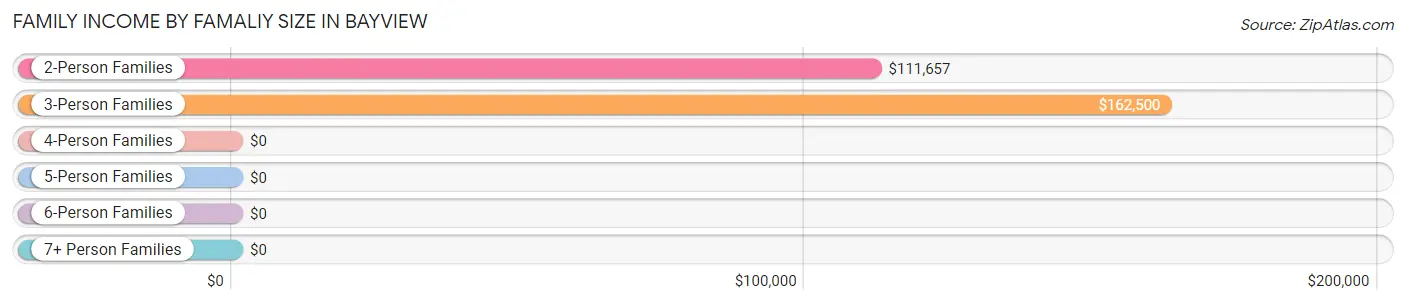
| Income Bracket | # Families | Median Income |
| 2-Person Families | 105 (78.9%) | $111,657 |
| 3-Person Families | 28 (21.0%) | $162,500 |
| 4-Person Families | 0 (0.0%) | $0 |
| 5-Person Families | 0 (0.0%) | $0 |
| 6-Person Families | 0 (0.0%) | $0 |
| 7+ Person Families | 0 (0.0%) | $0 |
| Total | 133 (100.0%) | $112,180 |
Family Income by Number of Earners in Bayview
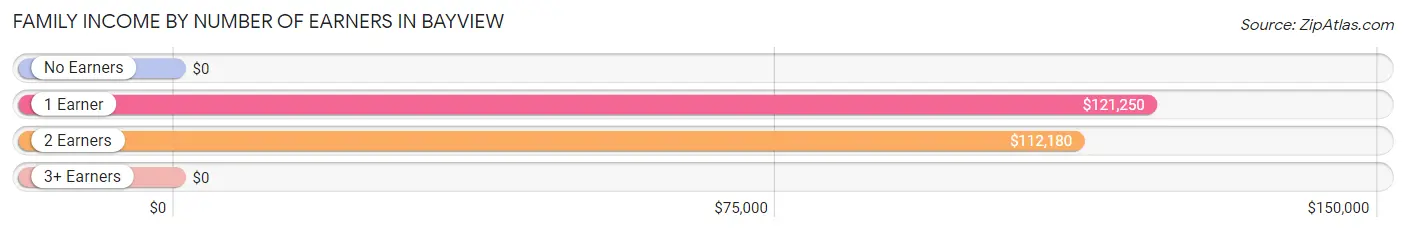
| Number of Earners | # Families | Median Income |
| No Earners | 10 (7.5%) | $0 |
| 1 Earner | 48 (36.1%) | $121,250 |
| 2 Earners | 75 (56.4%) | $112,180 |
| 3+ Earners | 0 (0.0%) | $0 |
| Total | 133 (100.0%) | $112,180 |
Household Income in Bayview
Household Income Brackets in Bayview
With 89 households falling in the category, the $100,000 to $149,999 income range is the most frequent in Bayview, accounting for 48.4% of all households.
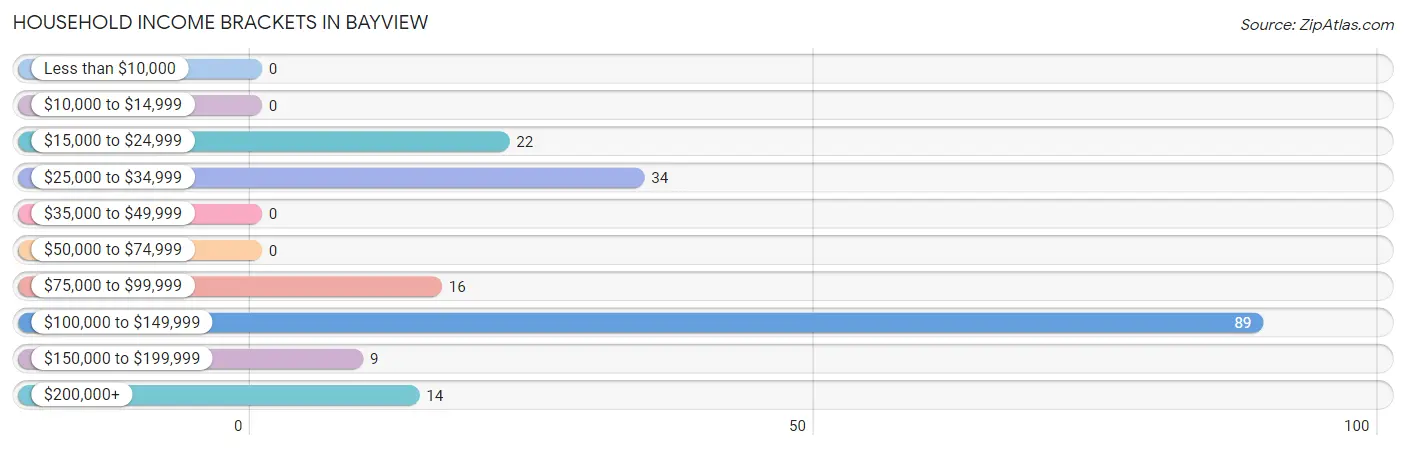
| Income Bracket | # Households | % Households |
| Less than $10,000 | 0 | 0.0% |
| $10,000 to $14,999 | 0 | 0.0% |
| $15,000 to $24,999 | 22 | 12.0% |
| $25,000 to $34,999 | 34 | 18.5% |
| $35,000 to $49,999 | 0 | 0.0% |
| $50,000 to $74,999 | 0 | 0.0% |
| $75,000 to $99,999 | 16 | 8.7% |
| $100,000 to $149,999 | 89 | 48.4% |
| $150,000 to $199,999 | 9 | 4.9% |
| $200,000+ | 14 | 7.6% |
Household Income by Householder Age in Bayview
The median household income in Bayview is $110,698, with the highest median household income of $120,750 found in the 65+ years age bracket for the primary householder. A total of 52 households (28.3%) fall into this category.
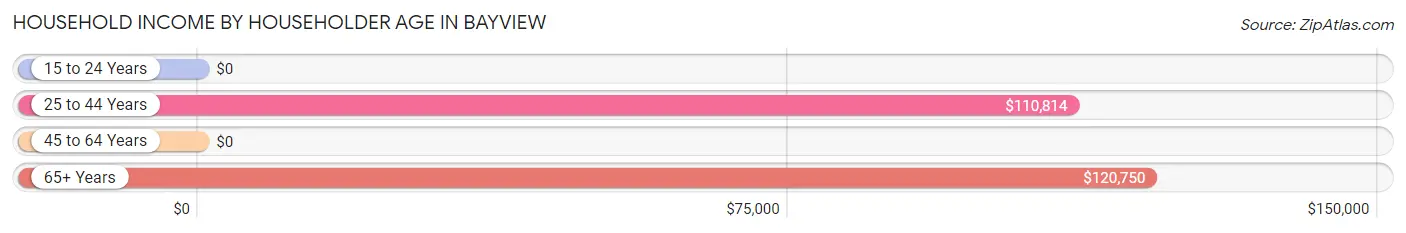
| Income Bracket | # Households | Median Income |
| 15 to 24 Years | 0 (0.0%) | $0 |
| 25 to 44 Years | 86 (46.7%) | $110,814 |
| 45 to 64 Years | 46 (25.0%) | $0 |
| 65+ Years | 52 (28.3%) | $120,750 |
| Total | 184 (100.0%) | $110,698 |
Poverty in Bayview
Income Below Poverty by Sex and Age in Bayview

| Age Bracket | Male | Female |
| Under 5 Years | 0 (0.0%) | 0 (0.0%) |
| 5 Years | 0 (0.0%) | 0 (0.0%) |
| 6 to 11 Years | 0 (0.0%) | 0 (0.0%) |
| 12 to 14 Years | 0 (0.0%) | 0 (0.0%) |
| 15 Years | 0 (0.0%) | 0 (0.0%) |
| 16 and 17 Years | 0 (0.0%) | 0 (0.0%) |
| 18 to 24 Years | 0 (0.0%) | 0 (0.0%) |
| 25 to 34 Years | 0 (0.0%) | 0 (0.0%) |
| 35 to 44 Years | 0 (0.0%) | 29 (67.4%) |
| 45 to 54 Years | 0 (0.0%) | 0 (0.0%) |
| 55 to 64 Years | 0 (0.0%) | 0 (0.0%) |
| 65 to 74 Years | 0 (0.0%) | 0 (0.0%) |
| 75 Years and over | 0 (0.0%) | 0 (0.0%) |
| Total | 0 (0.0%) | 29 (17.5%) |
Income Above Poverty by Sex and Age in Bayview
According to the poverty statistics in Bayview, males aged 18 to 24 years and females aged 6 to 11 years are the age groups that are most secure financially, with 100.0% of males and 100.0% of females in these age groups living above the poverty line.
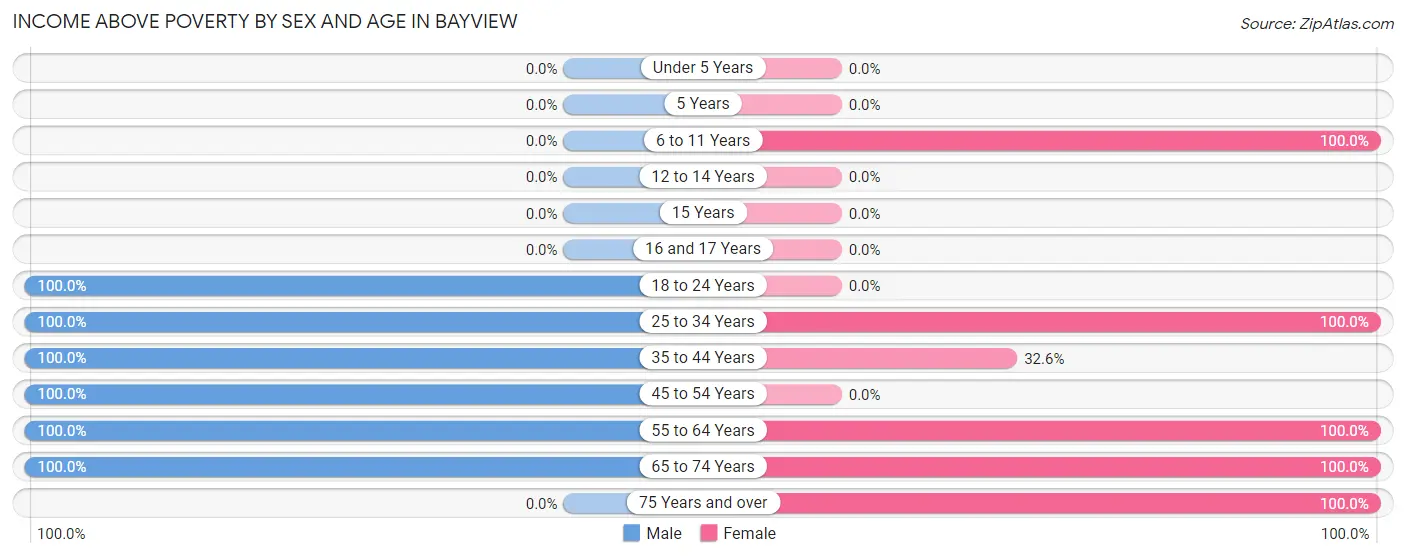
| Age Bracket | Male | Female |
| Under 5 Years | 0 (0.0%) | 0 (0.0%) |
| 5 Years | 0 (0.0%) | 0 (0.0%) |
| 6 to 11 Years | 0 (0.0%) | 11 (100.0%) |
| 12 to 14 Years | 0 (0.0%) | 0 (0.0%) |
| 15 Years | 0 (0.0%) | 0 (0.0%) |
| 16 and 17 Years | 0 (0.0%) | 0 (0.0%) |
| 18 to 24 Years | 6 (100.0%) | 0 (0.0%) |
| 25 to 34 Years | 52 (100.0%) | 38 (100.0%) |
| 35 to 44 Years | 21 (100.0%) | 14 (32.6%) |
| 45 to 54 Years | 41 (100.0%) | 0 (0.0%) |
| 55 to 64 Years | 22 (100.0%) | 24 (100.0%) |
| 65 to 74 Years | 90 (100.0%) | 40 (100.0%) |
| 75 Years and over | 0 (0.0%) | 10 (100.0%) |
| Total | 232 (100.0%) | 137 (82.5%) |
Income Below Poverty Among Married-Couple Families in Bayview
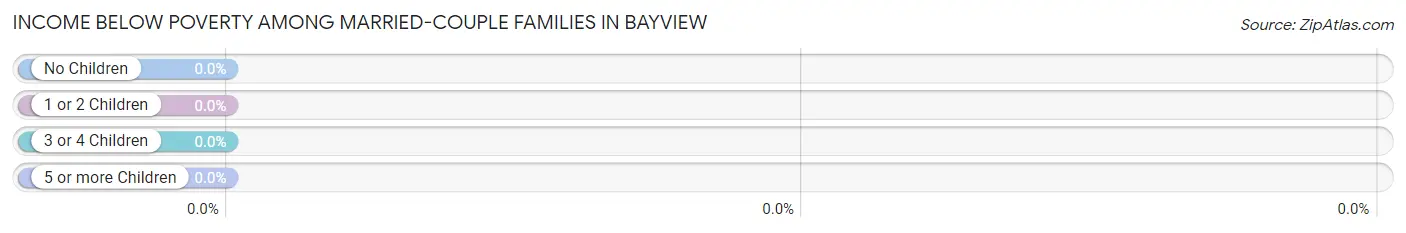
| Children | Above Poverty | Below Poverty |
| No Children | 119 (100.0%) | 0 (0.0%) |
| 1 or 2 Children | 14 (100.0%) | 0 (0.0%) |
| 3 or 4 Children | 0 (0.0%) | 0 (0.0%) |
| 5 or more Children | 0 (0.0%) | 0 (0.0%) |
| Total | 133 (100.0%) | 0 (0.0%) |
Income Below Poverty Among Single-Parent Households in Bayview
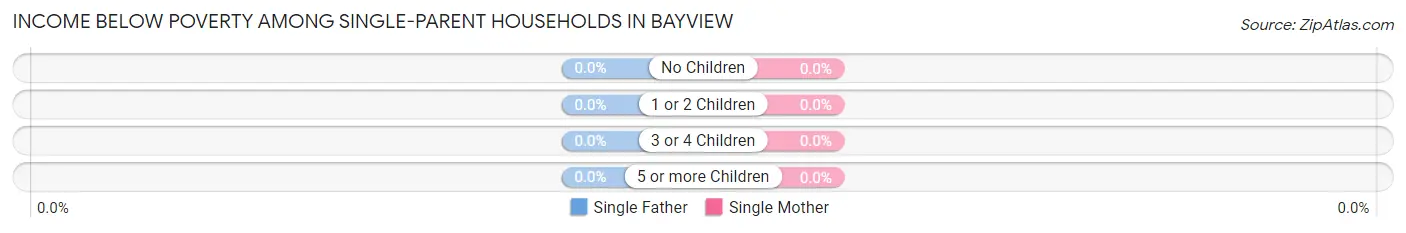
| Children | Single Father | Single Mother |
| No Children | 0 (0.0%) | 0 (0.0%) |
| 1 or 2 Children | 0 (0.0%) | 0 (0.0%) |
| 3 or 4 Children | 0 (0.0%) | 0 (0.0%) |
| 5 or more Children | 0 (0.0%) | 0 (0.0%) |
| Total | 0 (0.0%) | 0 (0.0%) |
Income Below Poverty Among Married-Couple vs Single-Parent Households in Bayview
| Children | Married-Couple Families | Single-Parent Households |
| No Children | 0 (0.0%) | 0 (0.0%) |
| 1 or 2 Children | 0 (0.0%) | 0 (0.0%) |
| 3 or 4 Children | 0 (0.0%) | 0 (0.0%) |
| 5 or more Children | 0 (0.0%) | 0 (0.0%) |
| Total | 0 (0.0%) | 0 (0.0%) |
Race in Bayview
The most populous races in Bayview are White / Caucasian (398 | 100.0%), and Hispanic or Latino (81 | 20.3%).
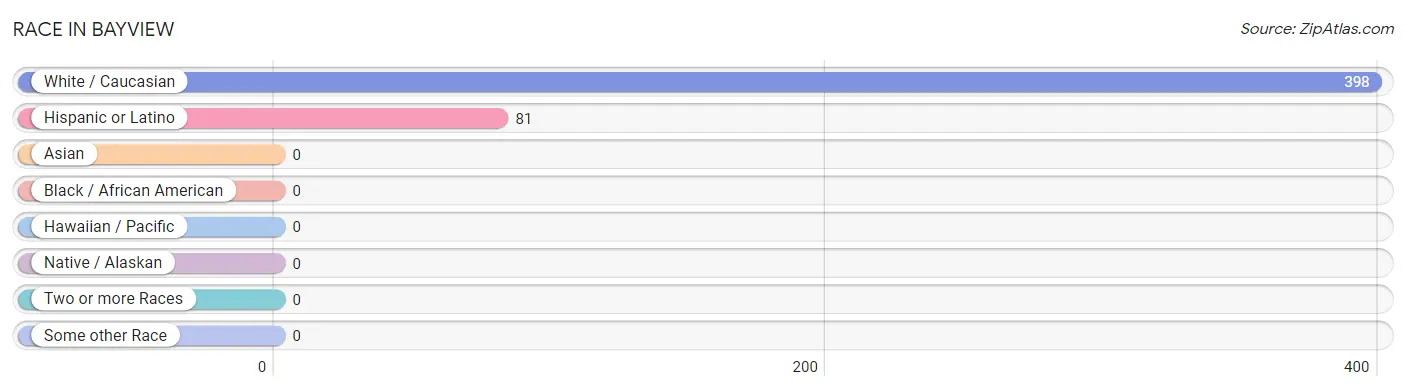
| Race | # Population | % Population |
| Asian | 0 | 0.0% |
| Black / African American | 0 | 0.0% |
| Hawaiian / Pacific | 0 | 0.0% |
| Hispanic or Latino | 81 | 20.3% |
| Native / Alaskan | 0 | 0.0% |
| White / Caucasian | 398 | 100.0% |
| Two or more Races | 0 | 0.0% |
| Some other Race | 0 | 0.0% |
| Total | 398 | 100.0% |
Ancestry in Bayview
The most populous ancestries reported in Bayview are American (86 | 21.6%), English (50 | 12.6%), German (39 | 9.8%), Irish (17 | 4.3%), and Scotch-Irish (17 | 4.3%), together accounting for 52.5% of all Bayview residents.
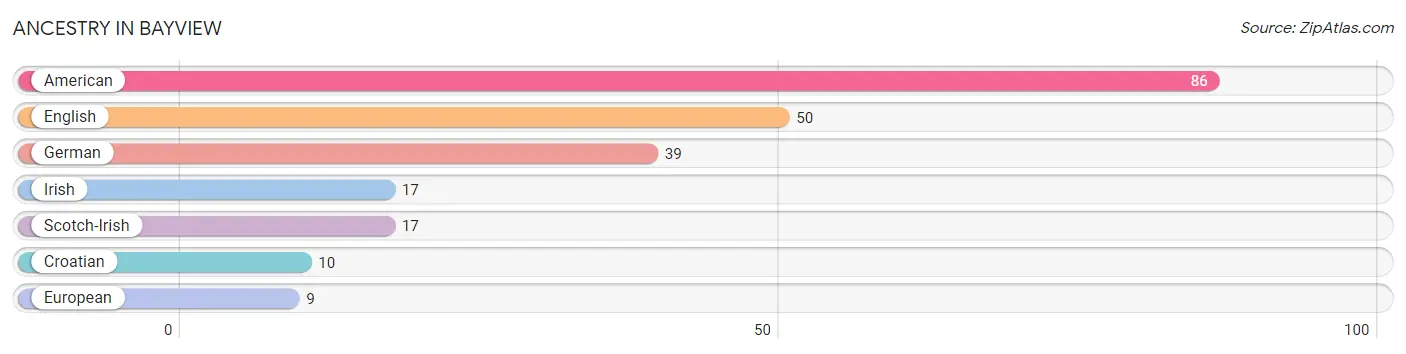
| Ancestry | # Population | % Population |
| American | 86 | 21.6% |
| Croatian | 10 | 2.5% |
| English | 50 | 12.6% |
| European | 9 | 2.3% |
| German | 39 | 9.8% |
| Irish | 17 | 4.3% |
| Scotch-Irish | 17 | 4.3% | View All 7 Rows |
Immigrants in Bayview

| Immigration Origin | # Population | % Population | View All 0 Rows |
Sex and Age in Bayview
Sex and Age in Bayview
The most populous age groups in Bayview are 70 to 74 Years (80 | 34.5%) for men and 25 to 29 Years (38 | 22.9%) for women.
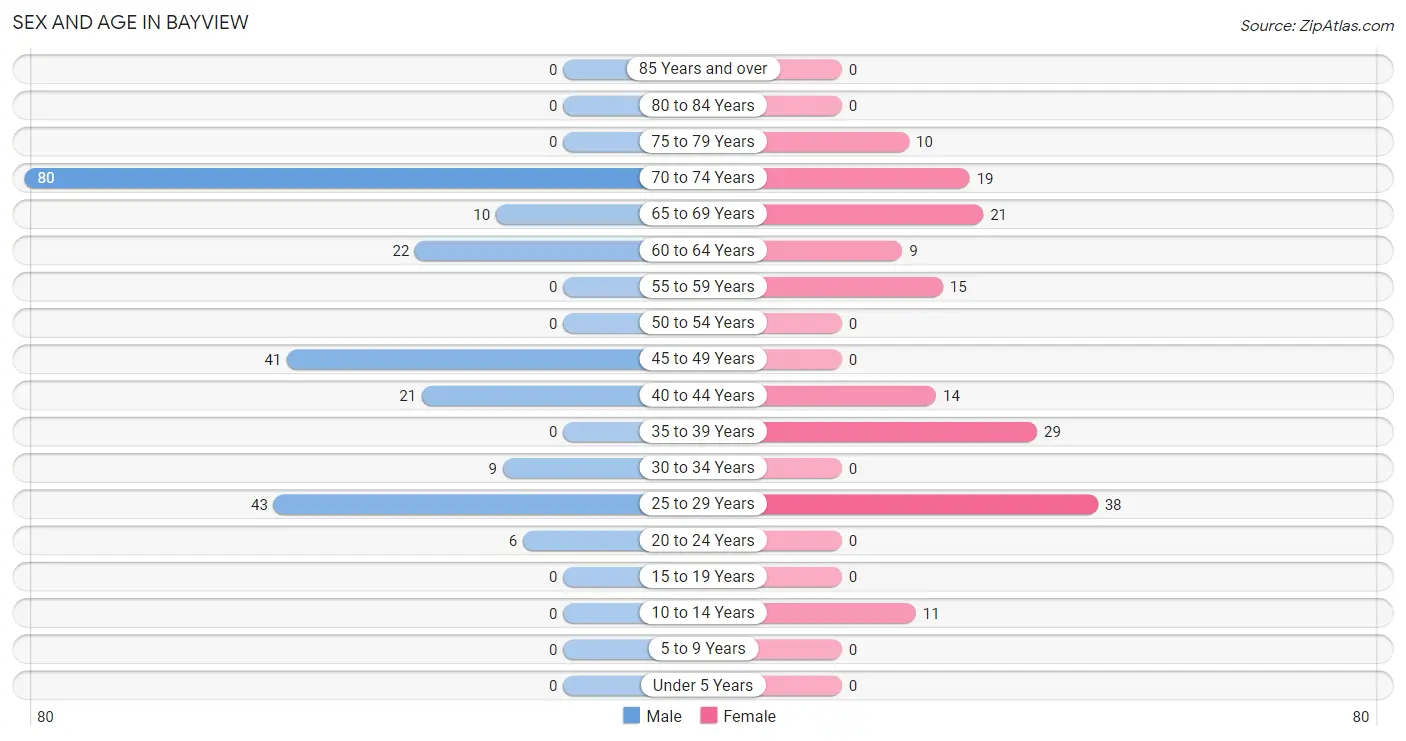
| Age Bracket | Male | Female |
| Under 5 Years | 0 (0.0%) | 0 (0.0%) |
| 5 to 9 Years | 0 (0.0%) | 0 (0.0%) |
| 10 to 14 Years | 0 (0.0%) | 11 (6.6%) |
| 15 to 19 Years | 0 (0.0%) | 0 (0.0%) |
| 20 to 24 Years | 6 (2.6%) | 0 (0.0%) |
| 25 to 29 Years | 43 (18.5%) | 38 (22.9%) |
| 30 to 34 Years | 9 (3.9%) | 0 (0.0%) |
| 35 to 39 Years | 0 (0.0%) | 29 (17.5%) |
| 40 to 44 Years | 21 (9.0%) | 14 (8.4%) |
| 45 to 49 Years | 41 (17.7%) | 0 (0.0%) |
| 50 to 54 Years | 0 (0.0%) | 0 (0.0%) |
| 55 to 59 Years | 0 (0.0%) | 15 (9.0%) |
| 60 to 64 Years | 22 (9.5%) | 9 (5.4%) |
| 65 to 69 Years | 10 (4.3%) | 21 (12.7%) |
| 70 to 74 Years | 80 (34.5%) | 19 (11.5%) |
| 75 to 79 Years | 0 (0.0%) | 10 (6.0%) |
| 80 to 84 Years | 0 (0.0%) | 0 (0.0%) |
| 85 Years and over | 0 (0.0%) | 0 (0.0%) |
| Total | 232 (100.0%) | 166 (100.0%) |
Families and Households in Bayview
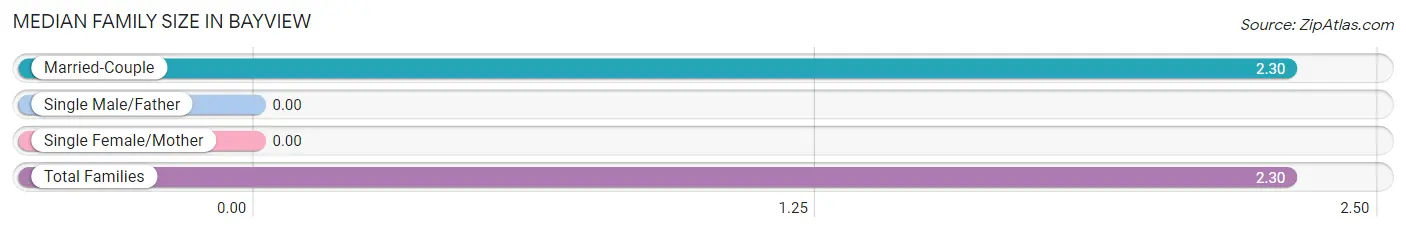
Median Family Size in Bayview
| Family Type | # Families | Family Size |
| Married-Couple | 133 (100.0%) | 2.30 |
| Single Male/Father | 0 (0.0%) | - |
| Single Female/Mother | 0 (0.0%) | - |
| Total Families | 133 (100.0%) | 2.30 |
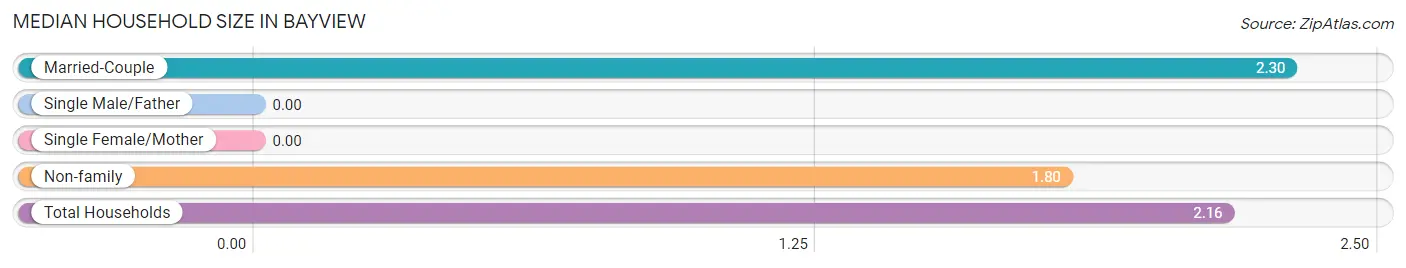
Median Household Size in Bayview
| Household Type | # Households | Household Size |
| Married-Couple | 133 (72.3%) | 2.30 |
| Single Male/Father | 0 (0.0%) | - |
| Single Female/Mother | 0 (0.0%) | - |
| Non-family | 51 (27.7%) | 1.80 |
| Total Households | 184 (100.0%) | 2.16 |
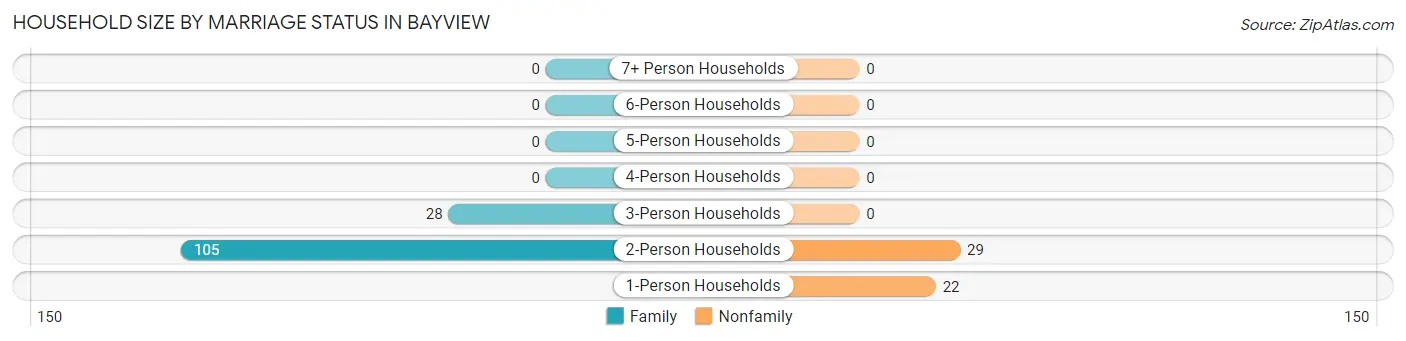
Household Size by Marriage Status in Bayview
Out of a total of 184 households in Bayview, 133 (72.3%) are family households, while 51 (27.7%) are nonfamily households. The most numerous type of family households are 2-person households, comprising 105, and the most common type of nonfamily households are 2-person households, comprising 29.
| Household Size | Family Households | Nonfamily Households |
| 1-Person Households | - | 22 (12.0%) |
| 2-Person Households | 105 (57.1%) | 29 (15.8%) |
| 3-Person Households | 28 (15.2%) | 0 (0.0%) |
| 4-Person Households | 0 (0.0%) | 0 (0.0%) |
| 5-Person Households | 0 (0.0%) | 0 (0.0%) |
| 6-Person Households | 0 (0.0%) | 0 (0.0%) |
| 7+ Person Households | 0 (0.0%) | 0 (0.0%) |
| Total | 133 (72.3%) | 51 (27.7%) |
Female Fertility in Bayview
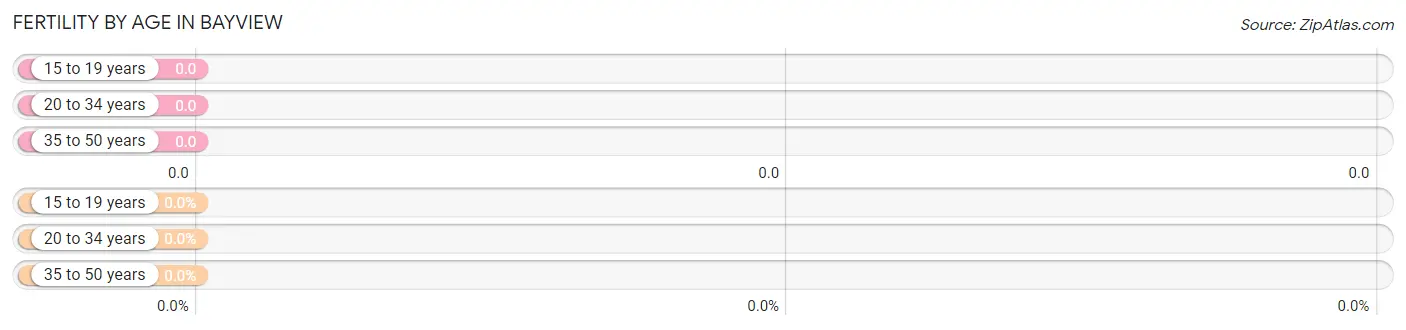
Fertility by Age in Bayview
| Age Bracket | Women with Births | Births / 1,000 Women |
| 15 to 19 years | 0 (0.0%) | 0.0 |
| 20 to 34 years | 0 (0.0%) | 0.0 |
| 35 to 50 years | 0 (0.0%) | 0.0 |
| Total | 0 (0.0%) | 0.0 |
Fertility by Age by Marriage Status in Bayview
| Age Bracket | Married | Unmarried |
| 15 to 19 years | 0 (0.0%) | 0 (0.0%) |
| 20 to 34 years | 0 (0.0%) | 0 (0.0%) |
| 35 to 50 years | 0 (0.0%) | 0 (0.0%) |
| Total | 0 (0.0%) | 0 (0.0%) |
Fertility by Education in Bayview
| Educational Attainment | Women with Births | Births / 1,000 Women |
| Less than High School | 0 (0.0%) | 0.0 |
| High School Diploma | 0 (0.0%) | 0.0 |
| College or Associate's Degree | 0 (0.0%) | 0.0 |
| Bachelor's Degree | 0 (0.0%) | 0.0 |
| Graduate Degree | 0 (0.0%) | 0.0 |
| Total | 0 (0.0%) | 0.0 |
Fertility by Education by Marriage Status in Bayview
| Educational Attainment | Married | Unmarried |
| Less than High School | 0 (0.0%) | 0 (0.0%) |
| High School Diploma | 0 (0.0%) | 0 (0.0%) |
| College or Associate's Degree | 0 (0.0%) | 0 (0.0%) |
| Bachelor's Degree | 0 (0.0%) | 0 (0.0%) |
| Graduate Degree | 0 (0.0%) | 0 (0.0%) |
| Total | 0 (0.0%) | 0 (0.0%) |
Employment Characteristics in Bayview
Employment by Class of Employer in Bayview
Among the 225 employed individuals in Bayview, private company employees (150 | 66.7%), self-employed (not incorporated) (66 | 29.3%), and state government employees (9 | 4.0%) make up the most common classes of employment.
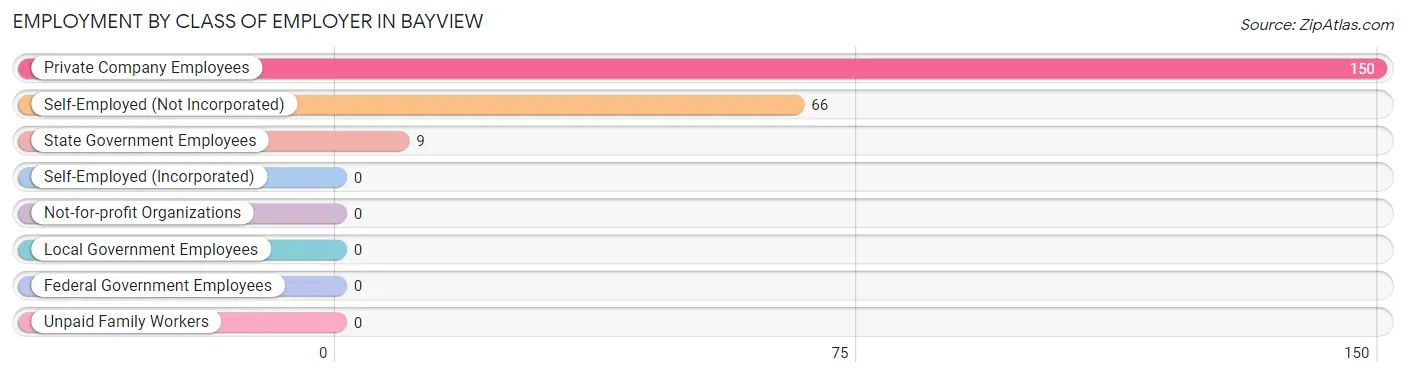
| Employer Class | # Employees | % Employees |
| Private Company Employees | 150 | 66.7% |
| Self-Employed (Incorporated) | 0 | 0.0% |
| Self-Employed (Not Incorporated) | 66 | 29.3% |
| Not-for-profit Organizations | 0 | 0.0% |
| Local Government Employees | 0 | 0.0% |
| State Government Employees | 9 | 4.0% |
| Federal Government Employees | 0 | 0.0% |
| Unpaid Family Workers | 0 | 0.0% |
| Total | 225 | 100.0% |
Employment Status by Age in Bayview
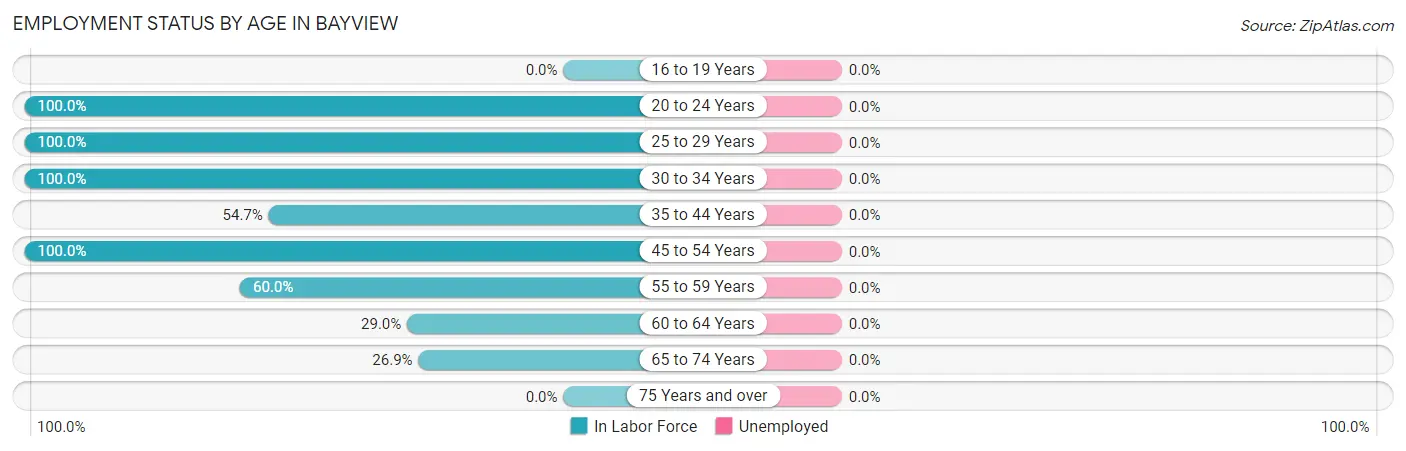
| Age Bracket | In Labor Force | Unemployed |
| 16 to 19 Years | 0 (0.0%) | 0 (0.0%) |
| 20 to 24 Years | 6 (100.0%) | 0 (0.0%) |
| 25 to 29 Years | 81 (100.0%) | 0 (0.0%) |
| 30 to 34 Years | 9 (100.0%) | 0 (0.0%) |
| 35 to 44 Years | 35 (54.7%) | 0 (0.0%) |
| 45 to 54 Years | 41 (100.0%) | 0 (0.0%) |
| 55 to 59 Years | 9 (60.0%) | 0 (0.0%) |
| 60 to 64 Years | 9 (29.0%) | 0 (0.0%) |
| 65 to 74 Years | 35 (26.9%) | 0 (0.0%) |
| 75 Years and over | 0 (0.0%) | 0 (0.0%) |
| Total | 225 (58.1%) | 0 (0.0%) |
Employment Status by Educational Attainment in Bayview
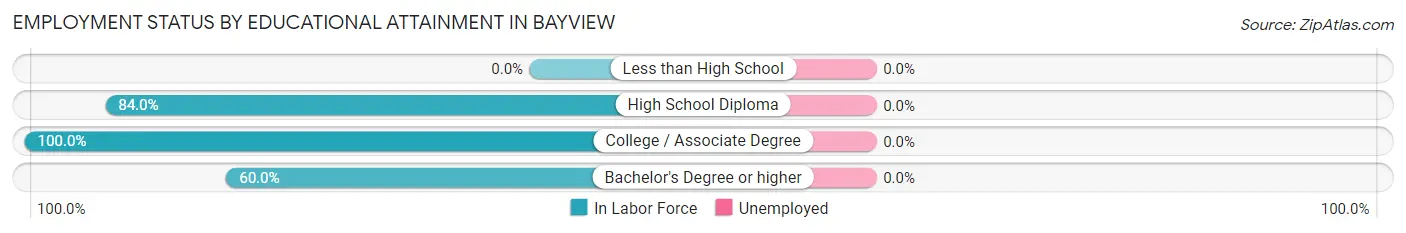
| Educational Attainment | In Labor Force | Unemployed |
| Less than High School | 0 (0.0%) | 0 (0.0%) |
| High School Diploma | 152 (84.0%) | 0 (0.0%) |
| College / Associate Degree | 23 (100.0%) | 0 (0.0%) |
| Bachelor's Degree or higher | 9 (60.0%) | 0 (0.0%) |
| Total | 184 (76.3%) | 0 (0.0%) |
Employment Occupations by Sex in Bayview
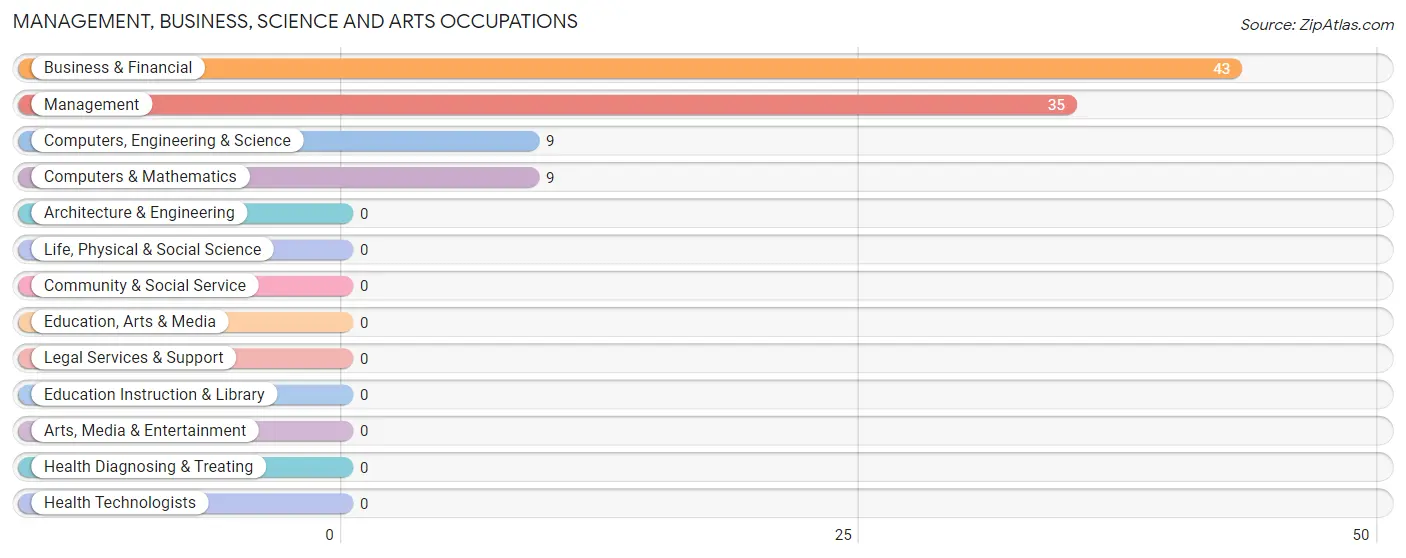
Management, Business, Science and Arts Occupations
The most common Management, Business, Science and Arts occupations in Bayview are Business & Financial (43 | 19.1%), Management (35 | 15.6%), Computers, Engineering & Science (9 | 4.0%), and Computers & Mathematics (9 | 4.0%).
Management, Business, Science and Arts Occupations by Sex
Within the Management, Business, Science and Arts occupations in Bayview, the most male-oriented occupations are Management (100.0%), and Business & Financial (100.0%), while the most female-oriented occupations are Computers, Engineering & Science (100.0%), and Computers & Mathematics (100.0%).
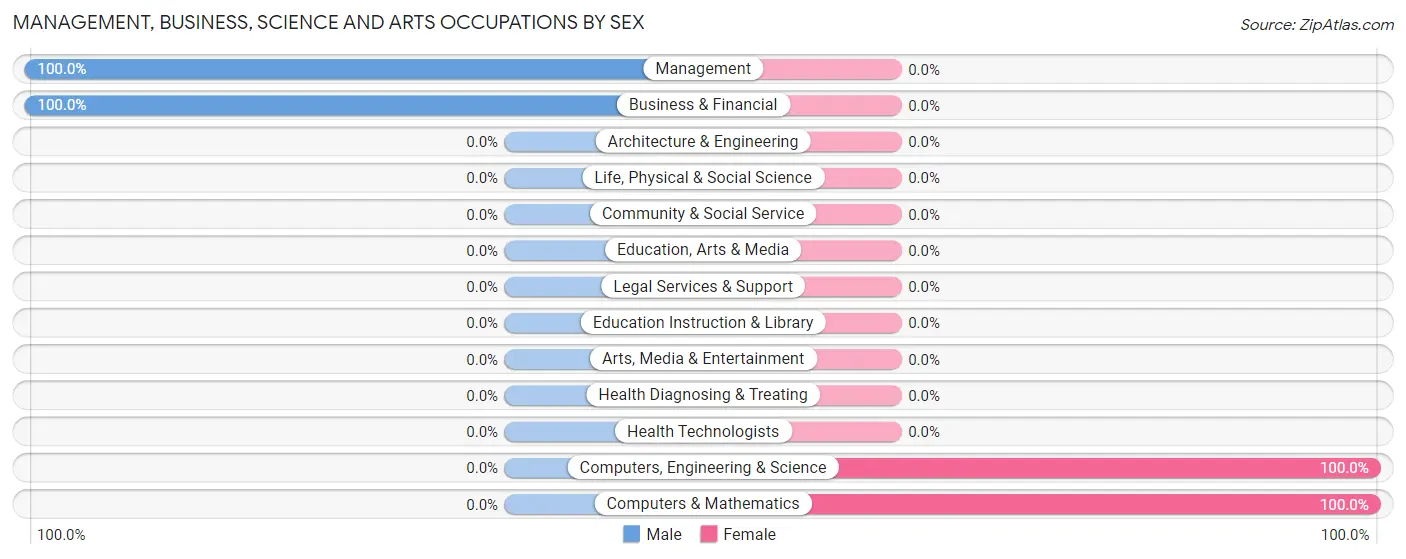
| Occupation | Male | Female |
| Management | 35 (100.0%) | 0 (0.0%) |
| Business & Financial | 43 (100.0%) | 0 (0.0%) |
| Computers, Engineering & Science | 0 (0.0%) | 9 (100.0%) |
| Computers & Mathematics | 0 (0.0%) | 9 (100.0%) |
| Architecture & Engineering | 0 (0.0%) | 0 (0.0%) |
| Life, Physical & Social Science | 0 (0.0%) | 0 (0.0%) |
| Community & Social Service | 0 (0.0%) | 0 (0.0%) |
| Education, Arts & Media | 0 (0.0%) | 0 (0.0%) |
| Legal Services & Support | 0 (0.0%) | 0 (0.0%) |
| Education Instruction & Library | 0 (0.0%) | 0 (0.0%) |
| Arts, Media & Entertainment | 0 (0.0%) | 0 (0.0%) |
| Health Diagnosing & Treating | 0 (0.0%) | 0 (0.0%) |
| Health Technologists | 0 (0.0%) | 0 (0.0%) |
| Total (Category) | 78 (89.7%) | 9 (10.3%) |
| Total (Overall) | 155 (68.9%) | 70 (31.1%) |
Services Occupations
The most common Services occupations in Bayview are , and Food Preparation & Serving (6 | 2.7%).
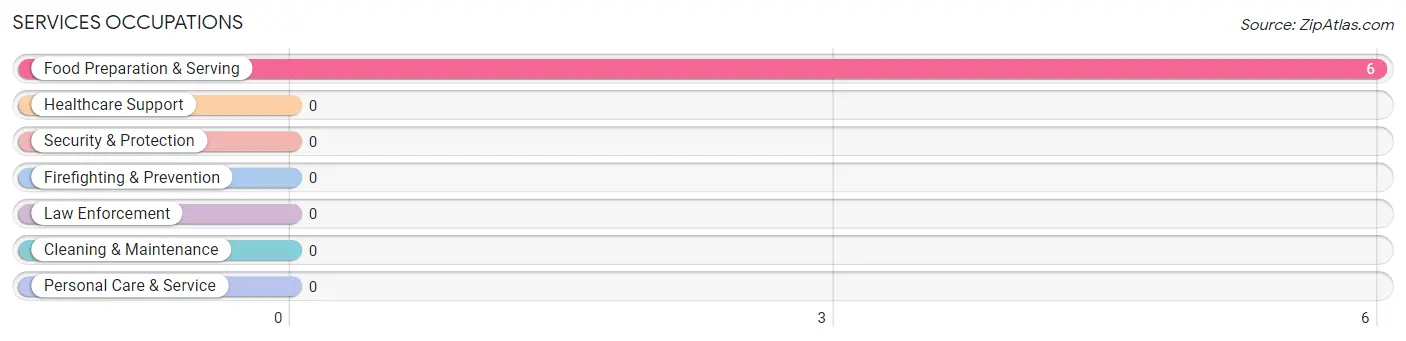
Services Occupations by Sex
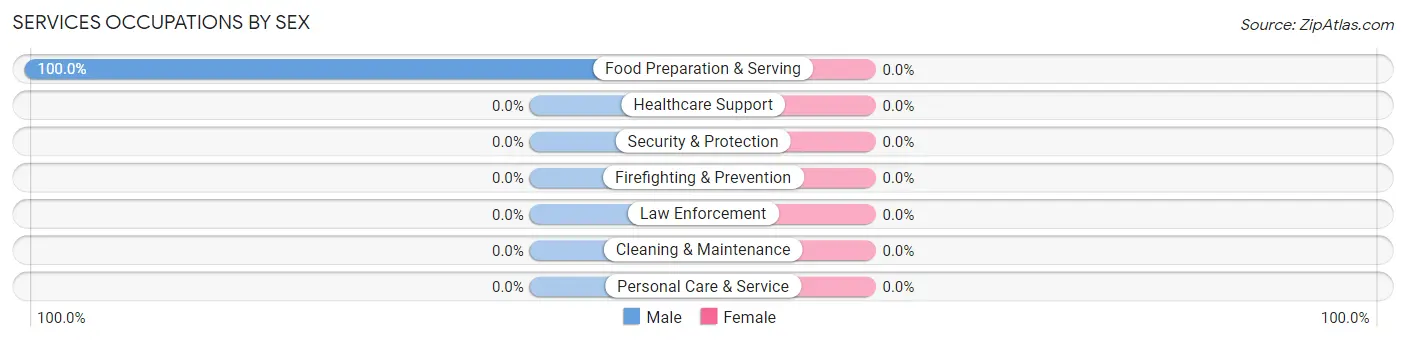
| Occupation | Male | Female |
| Healthcare Support | 0 (0.0%) | 0 (0.0%) |
| Security & Protection | 0 (0.0%) | 0 (0.0%) |
| Firefighting & Prevention | 0 (0.0%) | 0 (0.0%) |
| Law Enforcement | 0 (0.0%) | 0 (0.0%) |
| Food Preparation & Serving | 6 (100.0%) | 0 (0.0%) |
| Cleaning & Maintenance | 0 (0.0%) | 0 (0.0%) |
| Personal Care & Service | 0 (0.0%) | 0 (0.0%) |
| Total (Category) | 6 (100.0%) | 0 (0.0%) |
| Total (Overall) | 155 (68.9%) | 70 (31.1%) |
Sales and Office Occupations
The most common Sales and Office occupations in Bayview are , and Office & Administration (61 | 27.1%).

Sales and Office Occupations by Sex

| Occupation | Male | Female |
| Sales & Related | 0 (0.0%) | 0 (0.0%) |
| Office & Administration | 0 (0.0%) | 61 (100.0%) |
| Total (Category) | 0 (0.0%) | 61 (100.0%) |
| Total (Overall) | 155 (68.9%) | 70 (31.1%) |
Natural Resources, Construction and Maintenance Occupations
The most common Natural Resources, Construction and Maintenance occupations in Bayview are , and Construction & Extraction (41 | 18.2%).

Natural Resources, Construction and Maintenance Occupations by Sex

| Occupation | Male | Female |
| Farming, Fishing & Forestry | 0 (0.0%) | 0 (0.0%) |
| Construction & Extraction | 41 (100.0%) | 0 (0.0%) |
| Installation, Maintenance & Repair | 0 (0.0%) | 0 (0.0%) |
| Total (Category) | 41 (100.0%) | 0 (0.0%) |
| Total (Overall) | 155 (68.9%) | 70 (31.1%) |
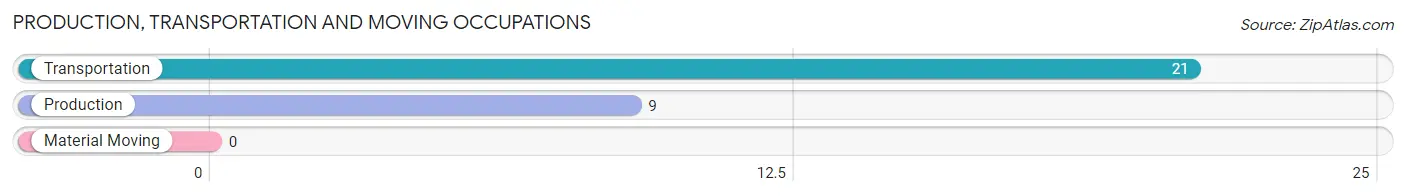
Production, Transportation and Moving Occupations
The most common Production, Transportation and Moving occupations in Bayview are Transportation (21 | 9.3%), and Production (9 | 4.0%).
Production, Transportation and Moving Occupations by Sex
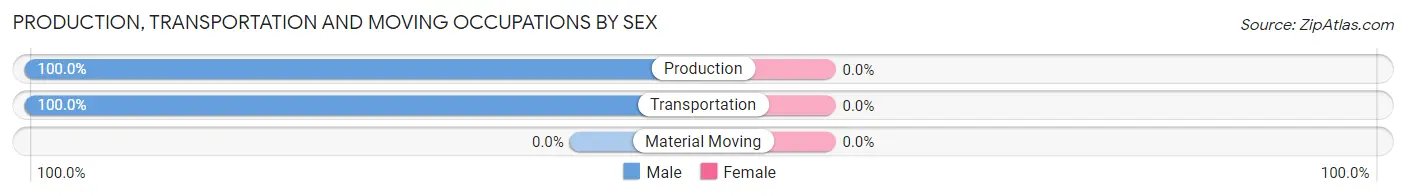
| Occupation | Male | Female |
| Production | 9 (100.0%) | 0 (0.0%) |
| Transportation | 21 (100.0%) | 0 (0.0%) |
| Material Moving | 0 (0.0%) | 0 (0.0%) |
| Total (Category) | 30 (100.0%) | 0 (0.0%) |
| Total (Overall) | 155 (68.9%) | 70 (31.1%) |
Employment Industries by Sex in Bayview
Employment Industries in Bayview
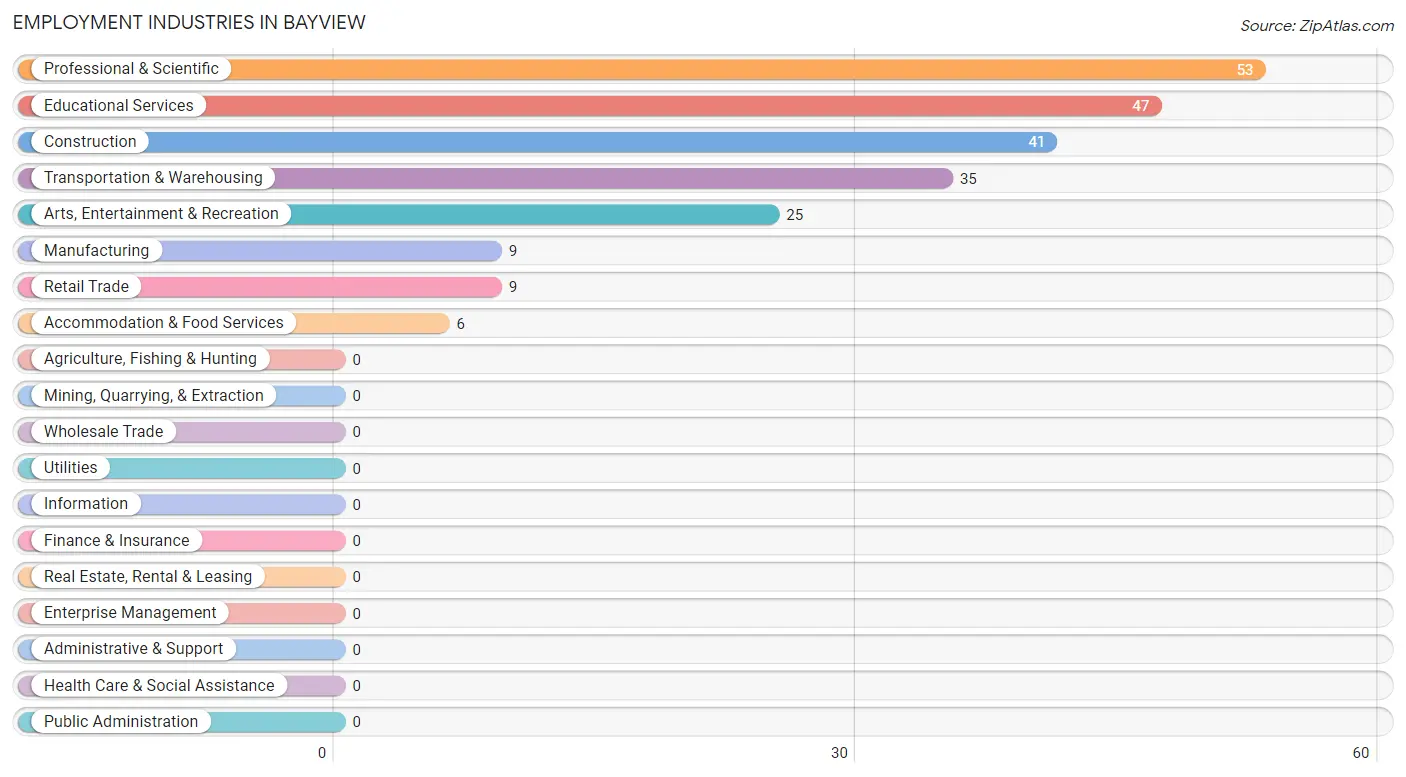
The major employment industries in Bayview include Professional & Scientific (53 | 23.6%), Educational Services (47 | 20.9%), Construction (41 | 18.2%), Transportation & Warehousing (35 | 15.6%), and Arts, Entertainment & Recreation (25 | 11.1%).
Employment Industries by Sex in Bayview
The Bayview industries that see more men than women are Construction (100.0%), Manufacturing (100.0%), and Professional & Scientific (100.0%), whereas the industries that tend to have a higher number of women are Retail Trade (100.0%), Educational Services (100.0%), and Transportation & Warehousing (40.0%).
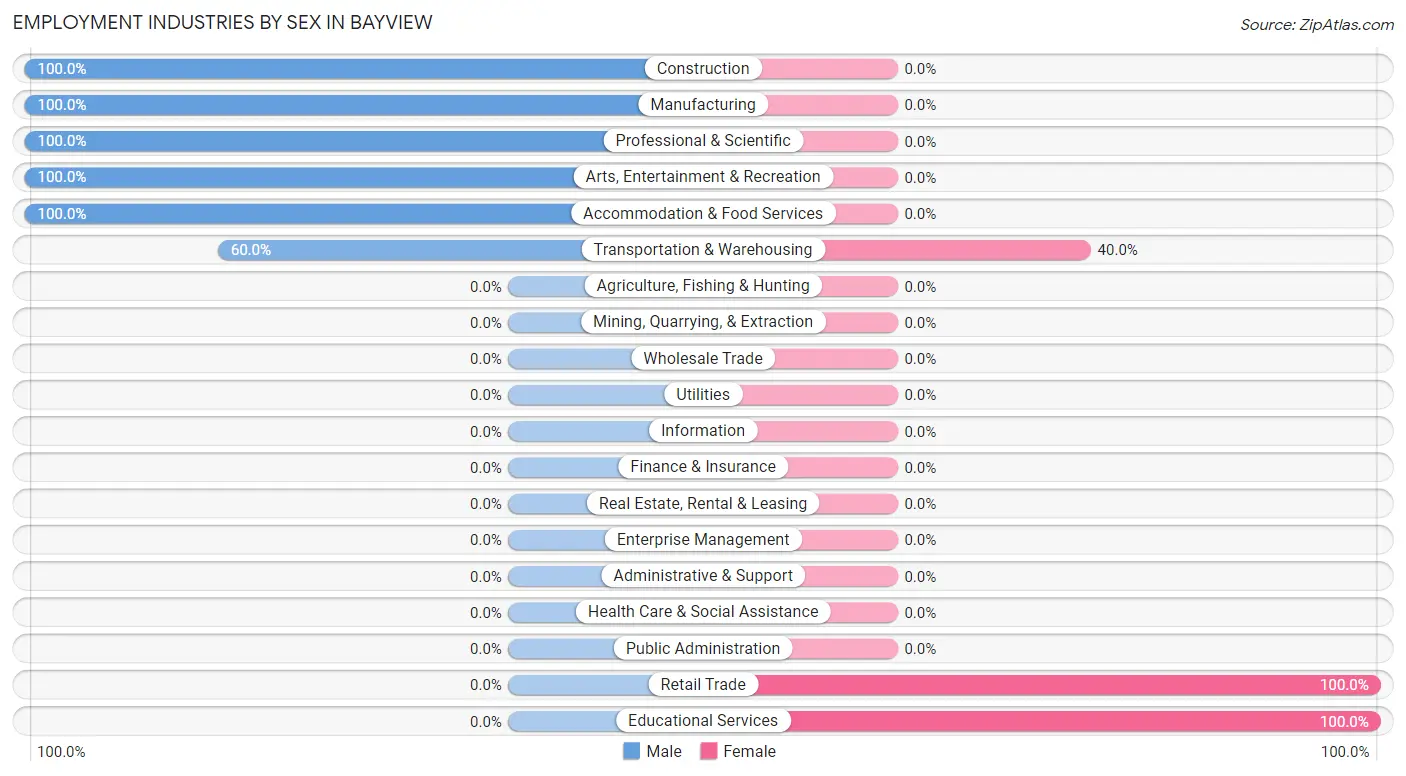
| Industry | Male | Female |
| Agriculture, Fishing & Hunting | 0 (0.0%) | 0 (0.0%) |
| Mining, Quarrying, & Extraction | 0 (0.0%) | 0 (0.0%) |
| Construction | 41 (100.0%) | 0 (0.0%) |
| Manufacturing | 9 (100.0%) | 0 (0.0%) |
| Wholesale Trade | 0 (0.0%) | 0 (0.0%) |
| Retail Trade | 0 (0.0%) | 9 (100.0%) |
| Transportation & Warehousing | 21 (60.0%) | 14 (40.0%) |
| Utilities | 0 (0.0%) | 0 (0.0%) |
| Information | 0 (0.0%) | 0 (0.0%) |
| Finance & Insurance | 0 (0.0%) | 0 (0.0%) |
| Real Estate, Rental & Leasing | 0 (0.0%) | 0 (0.0%) |
| Professional & Scientific | 53 (100.0%) | 0 (0.0%) |
| Enterprise Management | 0 (0.0%) | 0 (0.0%) |
| Administrative & Support | 0 (0.0%) | 0 (0.0%) |
| Educational Services | 0 (0.0%) | 47 (100.0%) |
| Health Care & Social Assistance | 0 (0.0%) | 0 (0.0%) |
| Arts, Entertainment & Recreation | 25 (100.0%) | 0 (0.0%) |
| Accommodation & Food Services | 6 (100.0%) | 0 (0.0%) |
| Public Administration | 0 (0.0%) | 0 (0.0%) |
| Total | 155 (68.9%) | 70 (31.1%) |
Education in Bayview
School Enrollment in Bayview
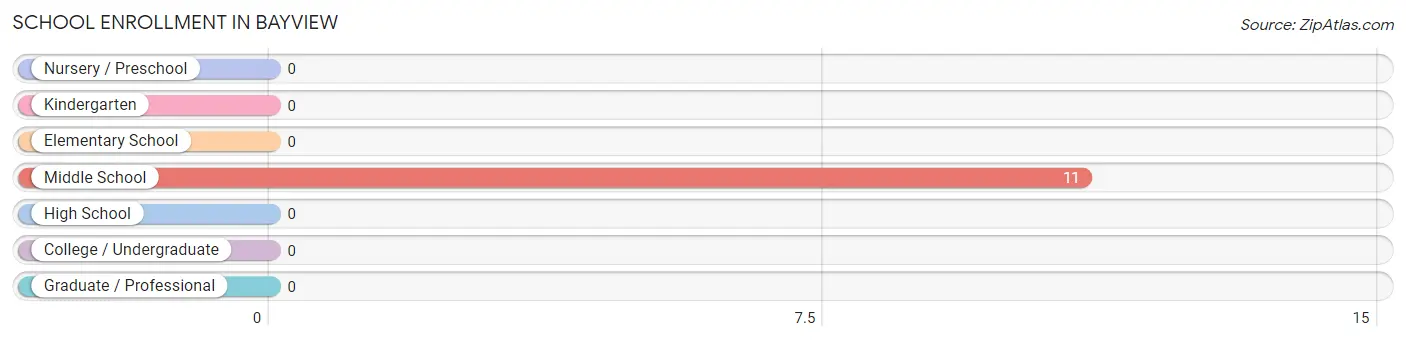
| School Level | # Students | % Students |
| Nursery / Preschool | 0 | 0.0% |
| Kindergarten | 0 | 0.0% |
| Elementary School | 0 | 0.0% |
| Middle School | 11 | 100.0% |
| High School | 0 | 0.0% |
| College / Undergraduate | 0 | 0.0% |
| Graduate / Professional | 0 | 0.0% |
| Total | 11 | 100.0% |
School Enrollment by Age by Funding Source in Bayview
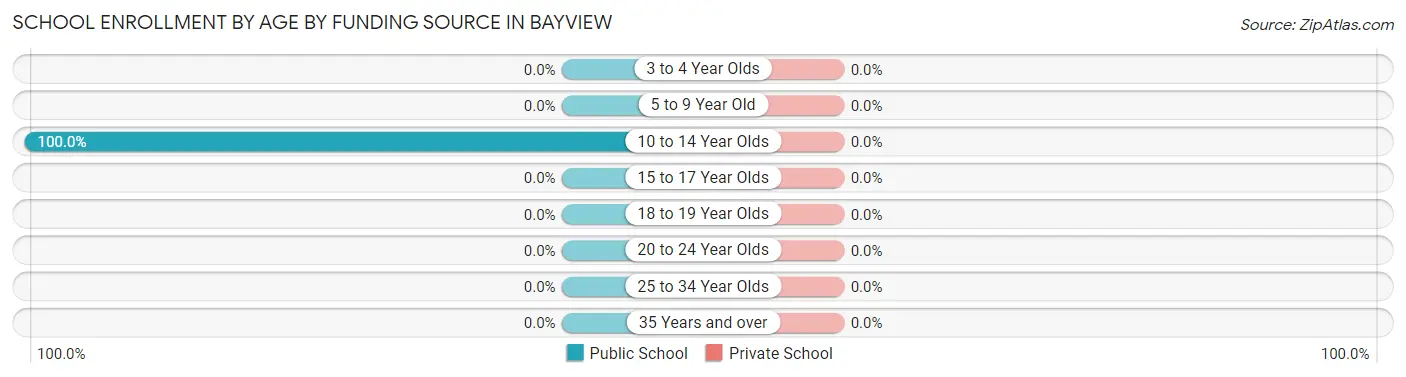
| Age Bracket | Public School | Private School |
| 3 to 4 Year Olds | 0 (0.0%) | 0 (0.0%) |
| 5 to 9 Year Old | 0 (0.0%) | 0 (0.0%) |
| 10 to 14 Year Olds | 11 (100.0%) | 0 (0.0%) |
| 15 to 17 Year Olds | 0 (0.0%) | 0 (0.0%) |
| 18 to 19 Year Olds | 0 (0.0%) | 0 (0.0%) |
| 20 to 24 Year Olds | 0 (0.0%) | 0 (0.0%) |
| 25 to 34 Year Olds | 0 (0.0%) | 0 (0.0%) |
| 35 Years and over | 0 (0.0%) | 0 (0.0%) |
| Total | 11 (100.0%) | 0 (0.0%) |
Educational Attainment by Field of Study in Bayview
Education (32 | 42.1%), computers & mathematics (10 | 13.2%), science & technology (10 | 13.2%), business (9 | 11.8%), and bio, nature & agricultural (8 | 10.5%) are the most common fields of study among 76 individuals in Bayview who have obtained a bachelor's degree or higher.
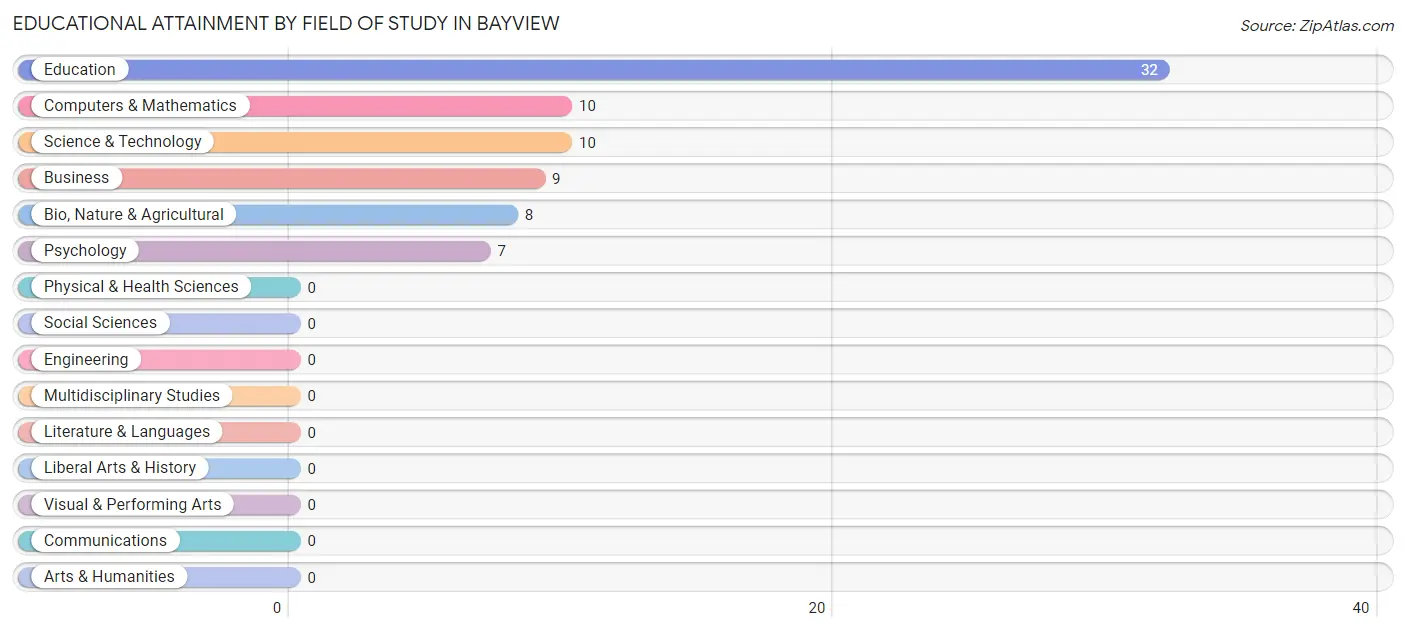
| Field of Study | # Graduates | % Graduates |
| Computers & Mathematics | 10 | 13.2% |
| Bio, Nature & Agricultural | 8 | 10.5% |
| Physical & Health Sciences | 0 | 0.0% |
| Psychology | 7 | 9.2% |
| Social Sciences | 0 | 0.0% |
| Engineering | 0 | 0.0% |
| Multidisciplinary Studies | 0 | 0.0% |
| Science & Technology | 10 | 13.2% |
| Business | 9 | 11.8% |
| Education | 32 | 42.1% |
| Literature & Languages | 0 | 0.0% |
| Liberal Arts & History | 0 | 0.0% |
| Visual & Performing Arts | 0 | 0.0% |
| Communications | 0 | 0.0% |
| Arts & Humanities | 0 | 0.0% |
| Total | 76 | 100.0% |
Transportation & Commute in Bayview
Vehicle Availability by Sex in Bayview
The most prevalent vehicle ownership categories in Bayview are males with 2 vehicles (90, accounting for 58.1%) and females with 2 vehicles (38, making up 128.6%).
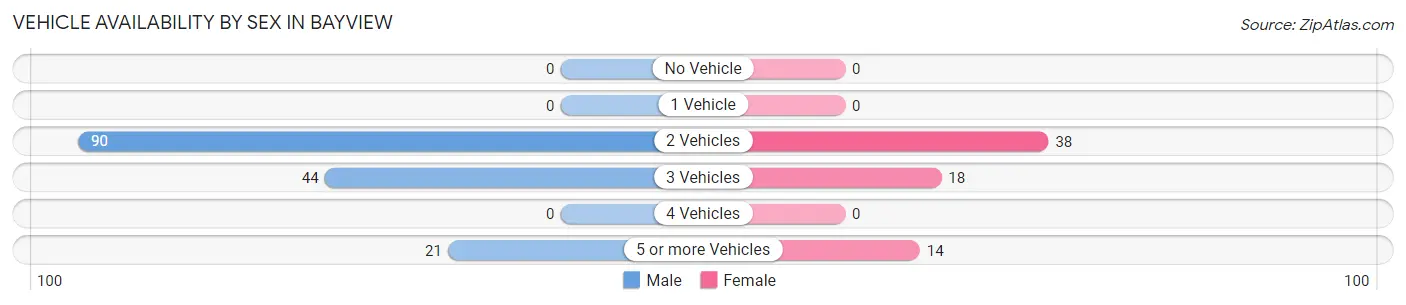
| Vehicles Available | Male | Female |
| No Vehicle | 0 (0.0%) | 0 (0.0%) |
| 1 Vehicle | 0 (0.0%) | 0 (0.0%) |
| 2 Vehicles | 90 (58.1%) | 38 (54.3%) |
| 3 Vehicles | 44 (28.4%) | 18 (25.7%) |
| 4 Vehicles | 0 (0.0%) | 0 (0.0%) |
| 5 or more Vehicles | 21 (13.6%) | 14 (20.0%) |
| Total | 155 (100.0%) | 70 (100.0%) |
Commute Time in Bayview
The most frequently occuring commute durations in Bayview are 10 to 14 minutes (41 commuters, 25.2%), 15 to 19 minutes (38 commuters, 23.3%), and 60 to 89 minutes (30 commuters, 18.4%).
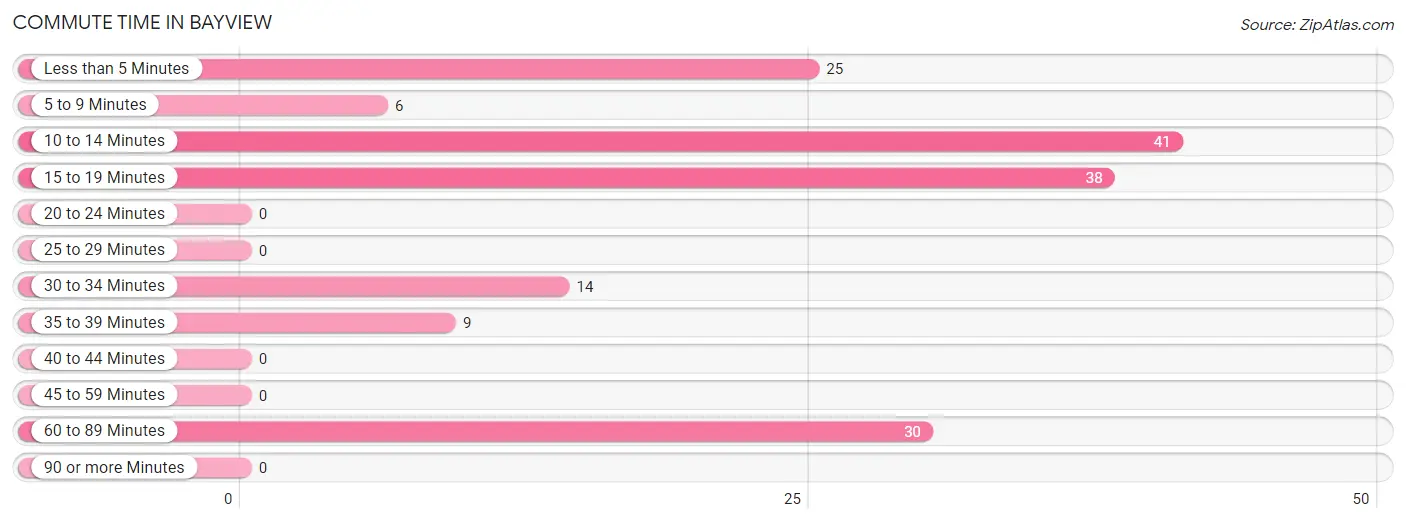
| Commute Time | # Commuters | % Commuters |
| Less than 5 Minutes | 25 | 15.3% |
| 5 to 9 Minutes | 6 | 3.7% |
| 10 to 14 Minutes | 41 | 25.2% |
| 15 to 19 Minutes | 38 | 23.3% |
| 20 to 24 Minutes | 0 | 0.0% |
| 25 to 29 Minutes | 0 | 0.0% |
| 30 to 34 Minutes | 14 | 8.6% |
| 35 to 39 Minutes | 9 | 5.5% |
| 40 to 44 Minutes | 0 | 0.0% |
| 45 to 59 Minutes | 0 | 0.0% |
| 60 to 89 Minutes | 30 | 18.4% |
| 90 or more Minutes | 0 | 0.0% |
Commute Time by Sex in Bayview
The most common commute times in Bayview are 10 to 14 minutes (41 commuters, 40.2%) for males and 15 to 19 minutes (38 commuters, 62.3%) for females.
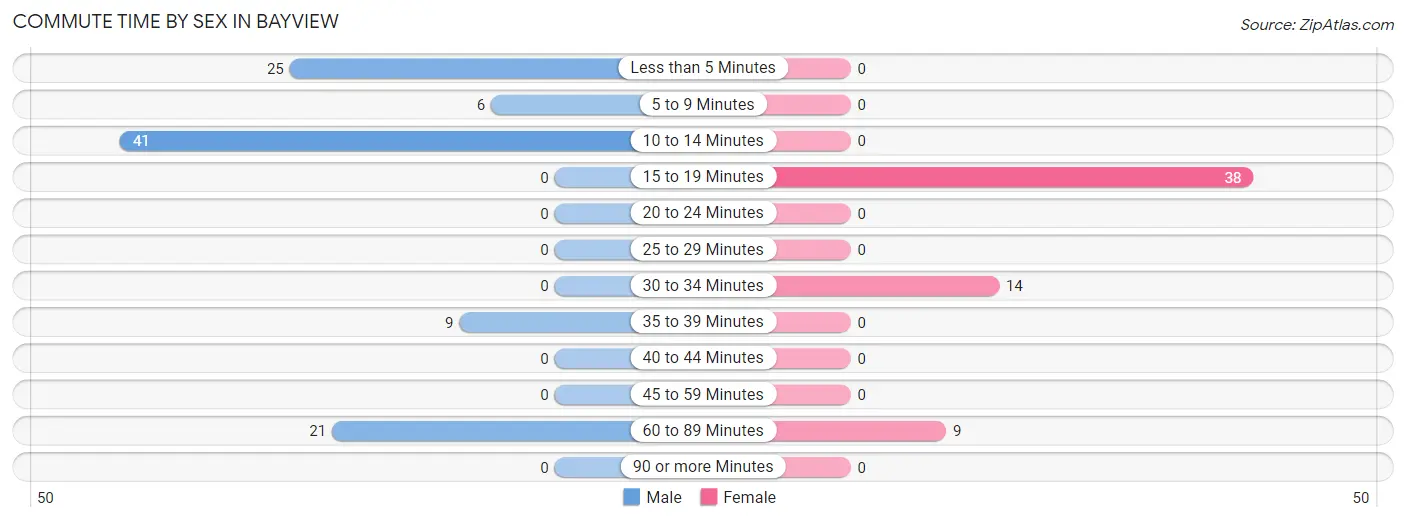
| Commute Time | Male | Female |
| Less than 5 Minutes | 25 (24.5%) | 0 (0.0%) |
| 5 to 9 Minutes | 6 (5.9%) | 0 (0.0%) |
| 10 to 14 Minutes | 41 (40.2%) | 0 (0.0%) |
| 15 to 19 Minutes | 0 (0.0%) | 38 (62.3%) |
| 20 to 24 Minutes | 0 (0.0%) | 0 (0.0%) |
| 25 to 29 Minutes | 0 (0.0%) | 0 (0.0%) |
| 30 to 34 Minutes | 0 (0.0%) | 14 (23.0%) |
| 35 to 39 Minutes | 9 (8.8%) | 0 (0.0%) |
| 40 to 44 Minutes | 0 (0.0%) | 0 (0.0%) |
| 45 to 59 Minutes | 0 (0.0%) | 0 (0.0%) |
| 60 to 89 Minutes | 21 (20.6%) | 9 (14.7%) |
| 90 or more Minutes | 0 (0.0%) | 0 (0.0%) |
Time of Departure to Work by Sex in Bayview
The most frequent times of departure to work in Bayview are 8:00 AM to 8:29 AM (75, 73.5%) for males and 7:30 AM to 7:59 AM (38, 62.3%) for females.
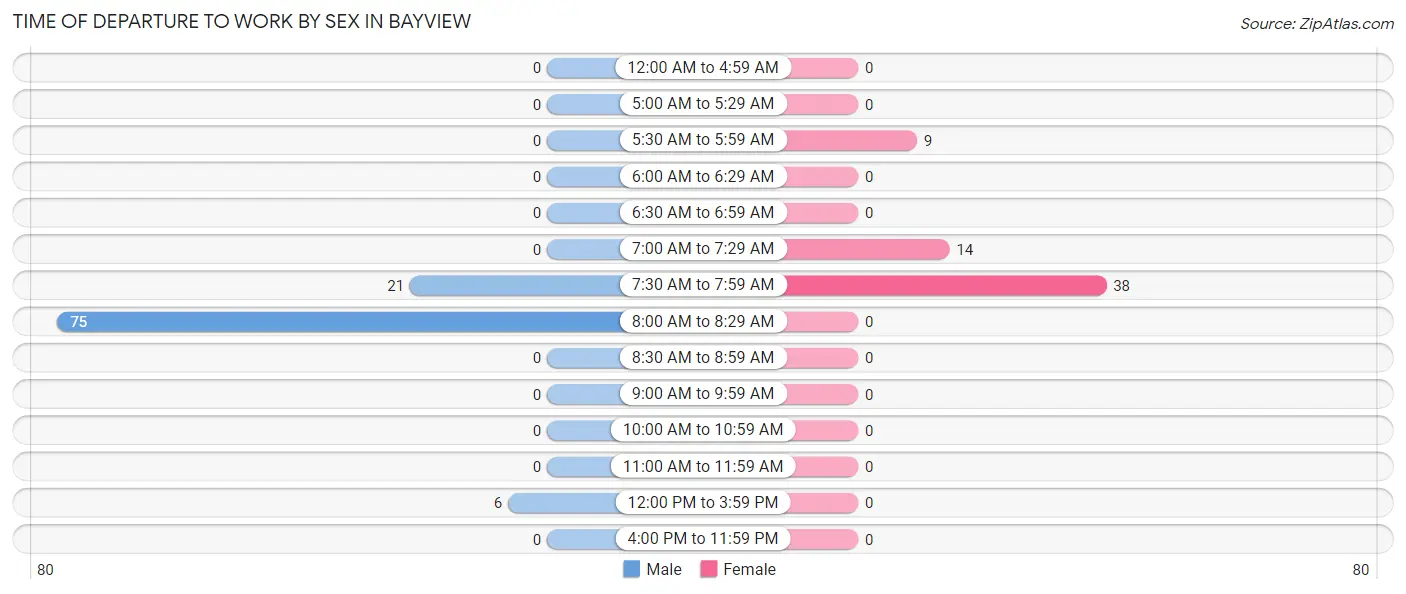
| Time of Departure | Male | Female |
| 12:00 AM to 4:59 AM | 0 (0.0%) | 0 (0.0%) |
| 5:00 AM to 5:29 AM | 0 (0.0%) | 0 (0.0%) |
| 5:30 AM to 5:59 AM | 0 (0.0%) | 9 (14.7%) |
| 6:00 AM to 6:29 AM | 0 (0.0%) | 0 (0.0%) |
| 6:30 AM to 6:59 AM | 0 (0.0%) | 0 (0.0%) |
| 7:00 AM to 7:29 AM | 0 (0.0%) | 14 (23.0%) |
| 7:30 AM to 7:59 AM | 21 (20.6%) | 38 (62.3%) |
| 8:00 AM to 8:29 AM | 75 (73.5%) | 0 (0.0%) |
| 8:30 AM to 8:59 AM | 0 (0.0%) | 0 (0.0%) |
| 9:00 AM to 9:59 AM | 0 (0.0%) | 0 (0.0%) |
| 10:00 AM to 10:59 AM | 0 (0.0%) | 0 (0.0%) |
| 11:00 AM to 11:59 AM | 0 (0.0%) | 0 (0.0%) |
| 12:00 PM to 3:59 PM | 6 (5.9%) | 0 (0.0%) |
| 4:00 PM to 11:59 PM | 0 (0.0%) | 0 (0.0%) |
| Total | 102 (100.0%) | 61 (100.0%) |
Housing Occupancy in Bayview
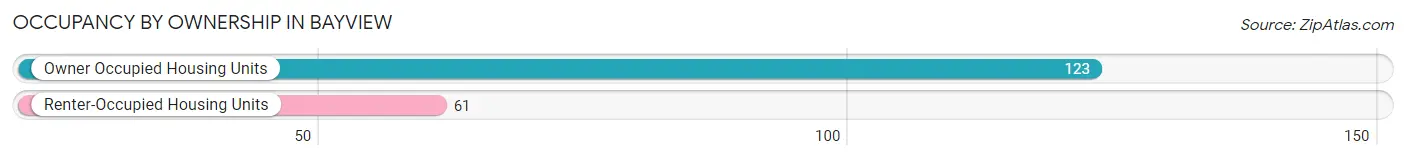
Occupancy by Ownership in Bayview
Of the total 184 dwellings in Bayview, owner-occupied units account for 123 (66.8%), while renter-occupied units make up 61 (33.2%).
| Occupancy | # Housing Units | % Housing Units |
| Owner Occupied Housing Units | 123 | 66.8% |
| Renter-Occupied Housing Units | 61 | 33.2% |
| Total Occupied Housing Units | 184 | 100.0% |
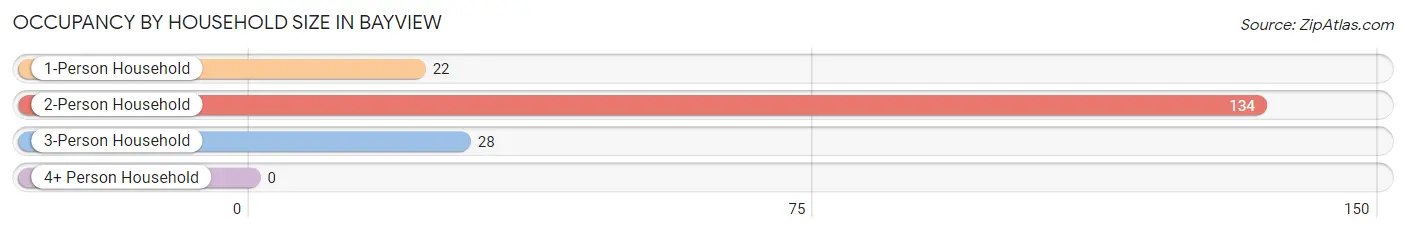
Occupancy by Household Size in Bayview
| Household Size | # Housing Units | % Housing Units |
| 1-Person Household | 22 | 12.0% |
| 2-Person Household | 134 | 72.8% |
| 3-Person Household | 28 | 15.2% |
| 4+ Person Household | 0 | 0.0% |
| Total Housing Units | 184 | 100.0% |
Occupancy by Ownership by Household Size in Bayview
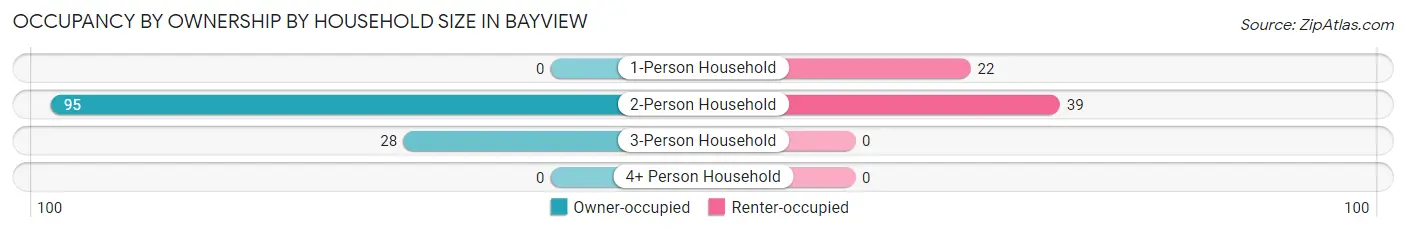
| Household Size | Owner-occupied | Renter-occupied |
| 1-Person Household | 0 (0.0%) | 22 (100.0%) |
| 2-Person Household | 95 (70.9%) | 39 (29.1%) |
| 3-Person Household | 28 (100.0%) | 0 (0.0%) |
| 4+ Person Household | 0 (0.0%) | 0 (0.0%) |
| Total Housing Units | 123 (66.8%) | 61 (33.2%) |
Occupancy by Educational Attainment in Bayview
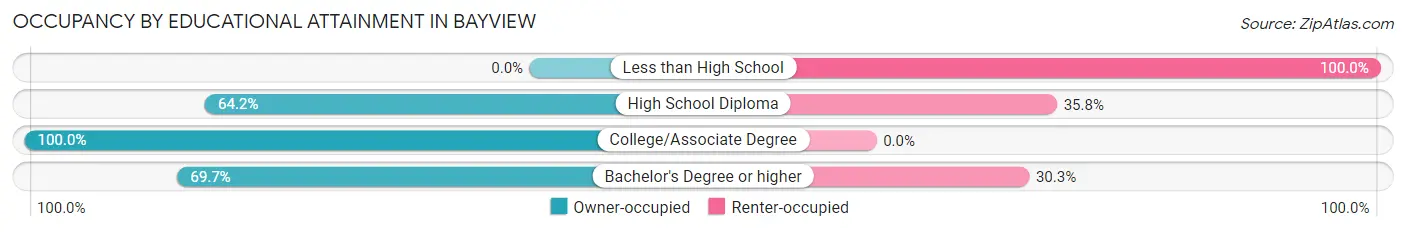
| Household Size | Owner-occupied | Renter-occupied |
| Less than High School | 0 (0.0%) | 22 (100.0%) |
| High School Diploma | 52 (64.2%) | 29 (35.8%) |
| College/Associate Degree | 48 (100.0%) | 0 (0.0%) |
| Bachelor's Degree or higher | 23 (69.7%) | 10 (30.3%) |
Occupancy by Age of Householder in Bayview
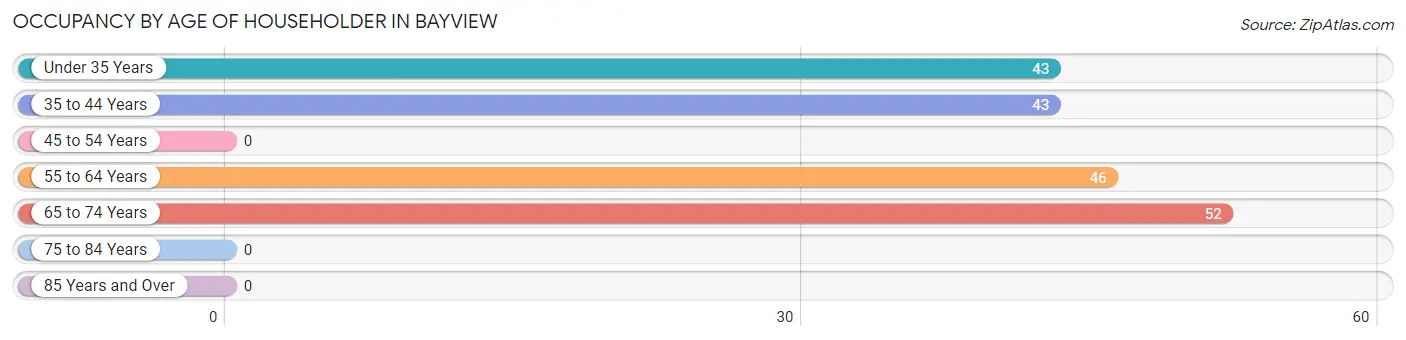
| Age Bracket | # Households | % Households |
| Under 35 Years | 43 | 23.4% |
| 35 to 44 Years | 43 | 23.4% |
| 45 to 54 Years | 0 | 0.0% |
| 55 to 64 Years | 46 | 25.0% |
| 65 to 74 Years | 52 | 28.3% |
| 75 to 84 Years | 0 | 0.0% |
| 85 Years and Over | 0 | 0.0% |
| Total | 184 | 100.0% |
Housing Finances in Bayview
Median Income by Occupancy in Bayview
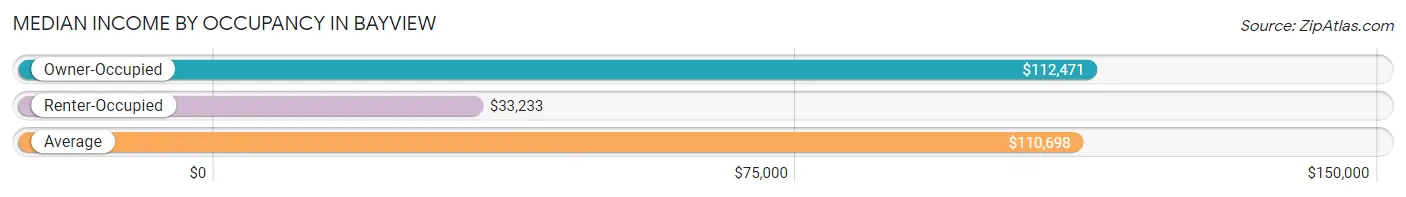
| Occupancy Type | # Households | Median Income |
| Owner-Occupied | 123 (66.8%) | $112,471 |
| Renter-Occupied | 61 (33.2%) | $33,233 |
| Average | 184 (100.0%) | $110,698 |
Occupancy by Householder Income Bracket in Bayview
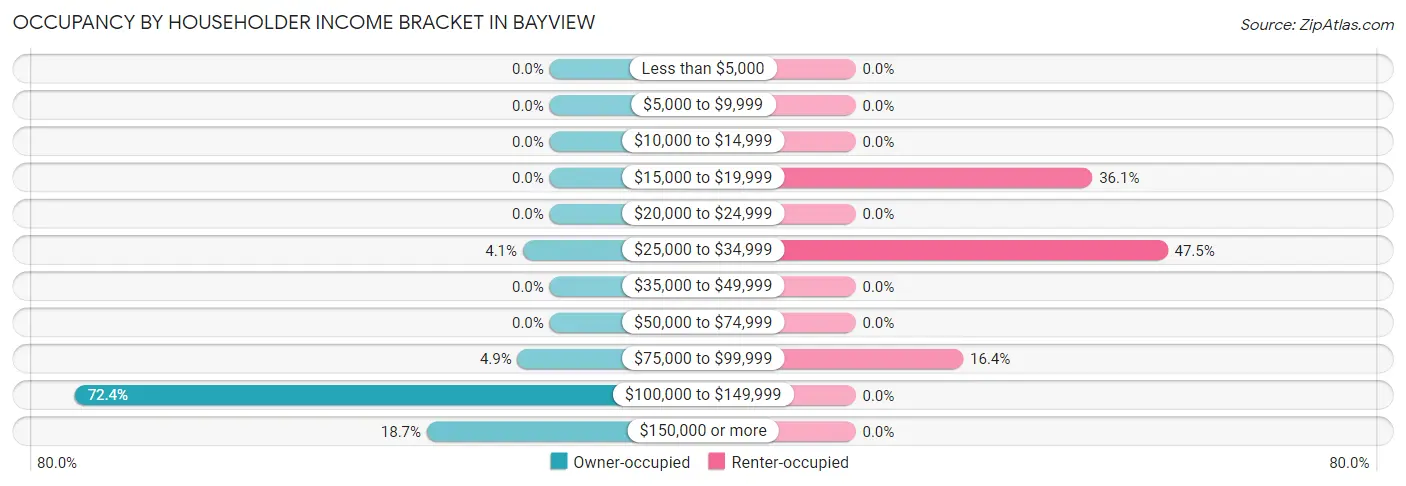
| Income Bracket | Owner-occupied | Renter-occupied |
| Less than $5,000 | 0 (0.0%) | 0 (0.0%) |
| $5,000 to $9,999 | 0 (0.0%) | 0 (0.0%) |
| $10,000 to $14,999 | 0 (0.0%) | 0 (0.0%) |
| $15,000 to $19,999 | 0 (0.0%) | 22 (36.1%) |
| $20,000 to $24,999 | 0 (0.0%) | 0 (0.0%) |
| $25,000 to $34,999 | 5 (4.1%) | 29 (47.5%) |
| $35,000 to $49,999 | 0 (0.0%) | 0 (0.0%) |
| $50,000 to $74,999 | 0 (0.0%) | 0 (0.0%) |
| $75,000 to $99,999 | 6 (4.9%) | 10 (16.4%) |
| $100,000 to $149,999 | 89 (72.4%) | 0 (0.0%) |
| $150,000 or more | 23 (18.7%) | 0 (0.0%) |
| Total | 123 (100.0%) | 61 (100.0%) |
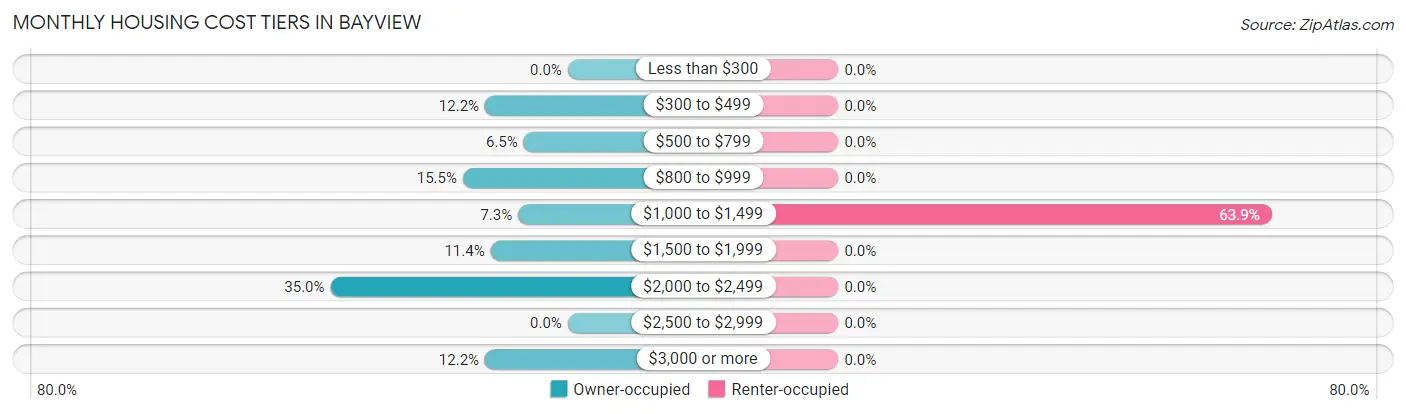
Monthly Housing Cost Tiers in Bayview
| Monthly Cost | Owner-occupied | Renter-occupied |
| Less than $300 | 0 (0.0%) | 0 (0.0%) |
| $300 to $499 | 15 (12.2%) | 0 (0.0%) |
| $500 to $799 | 8 (6.5%) | 0 (0.0%) |
| $800 to $999 | 19 (15.4%) | 0 (0.0%) |
| $1,000 to $1,499 | 9 (7.3%) | 39 (63.9%) |
| $1,500 to $1,999 | 14 (11.4%) | 0 (0.0%) |
| $2,000 to $2,499 | 43 (35.0%) | 0 (0.0%) |
| $2,500 to $2,999 | 0 (0.0%) | 0 (0.0%) |
| $3,000 or more | 15 (12.2%) | 0 (0.0%) |
| Total | 123 (100.0%) | 61 (100.0%) |
Physical Housing Characteristics in Bayview
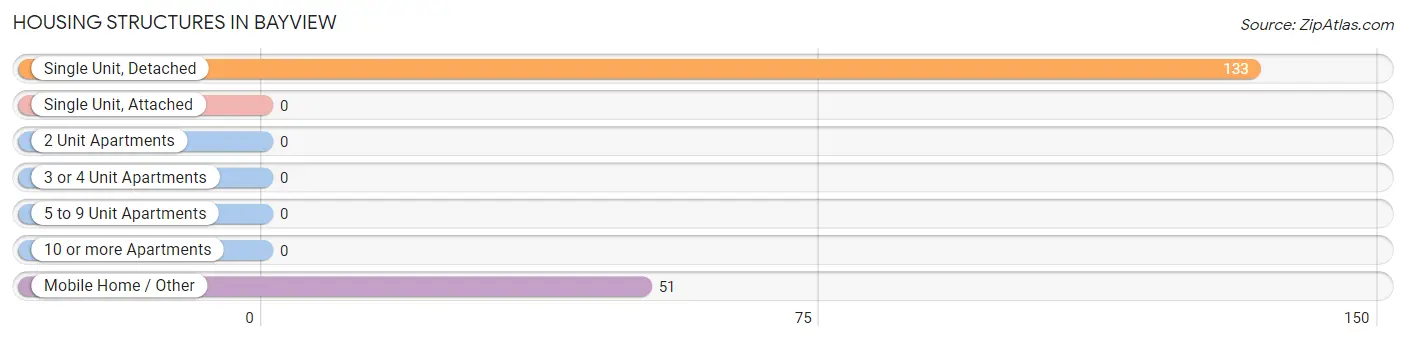
Housing Structures in Bayview
| Structure Type | # Housing Units | % Housing Units |
| Single Unit, Detached | 133 | 72.3% |
| Single Unit, Attached | 0 | 0.0% |
| 2 Unit Apartments | 0 | 0.0% |
| 3 or 4 Unit Apartments | 0 | 0.0% |
| 5 to 9 Unit Apartments | 0 | 0.0% |
| 10 or more Apartments | 0 | 0.0% |
| Mobile Home / Other | 51 | 27.7% |
| Total | 184 | 100.0% |
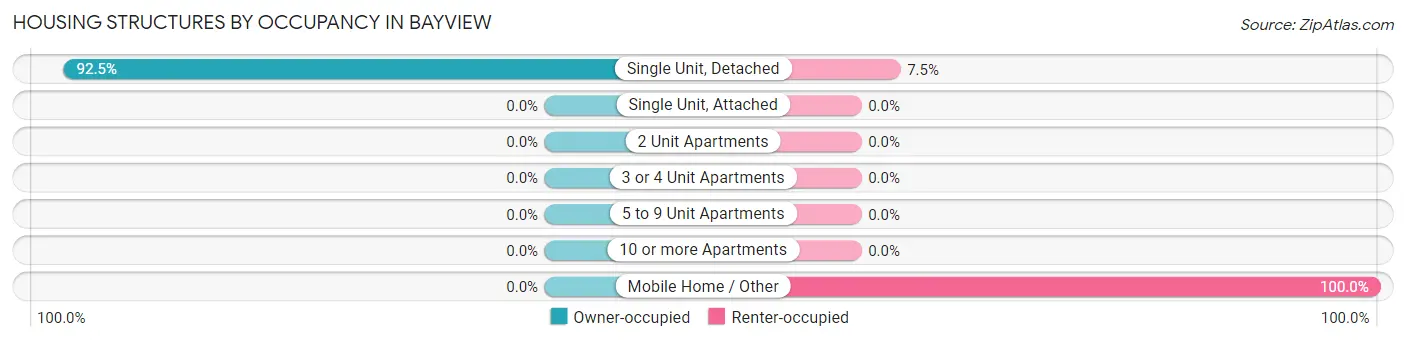
Housing Structures by Occupancy in Bayview
| Structure Type | Owner-occupied | Renter-occupied |
| Single Unit, Detached | 123 (92.5%) | 10 (7.5%) |
| Single Unit, Attached | 0 (0.0%) | 0 (0.0%) |
| 2 Unit Apartments | 0 (0.0%) | 0 (0.0%) |
| 3 or 4 Unit Apartments | 0 (0.0%) | 0 (0.0%) |
| 5 to 9 Unit Apartments | 0 (0.0%) | 0 (0.0%) |
| 10 or more Apartments | 0 (0.0%) | 0 (0.0%) |
| Mobile Home / Other | 0 (0.0%) | 51 (100.0%) |
| Total | 123 (66.8%) | 61 (33.2%) |
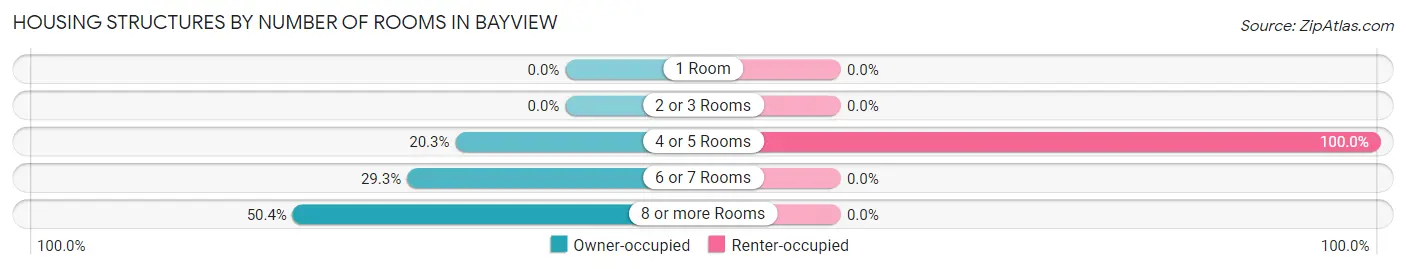
Housing Structures by Number of Rooms in Bayview
| Number of Rooms | Owner-occupied | Renter-occupied |
| 1 Room | 0 (0.0%) | 0 (0.0%) |
| 2 or 3 Rooms | 0 (0.0%) | 0 (0.0%) |
| 4 or 5 Rooms | 25 (20.3%) | 61 (100.0%) |
| 6 or 7 Rooms | 36 (29.3%) | 0 (0.0%) |
| 8 or more Rooms | 62 (50.4%) | 0 (0.0%) |
| Total | 123 (100.0%) | 61 (100.0%) |
Housing Structure by Heating Type in Bayview
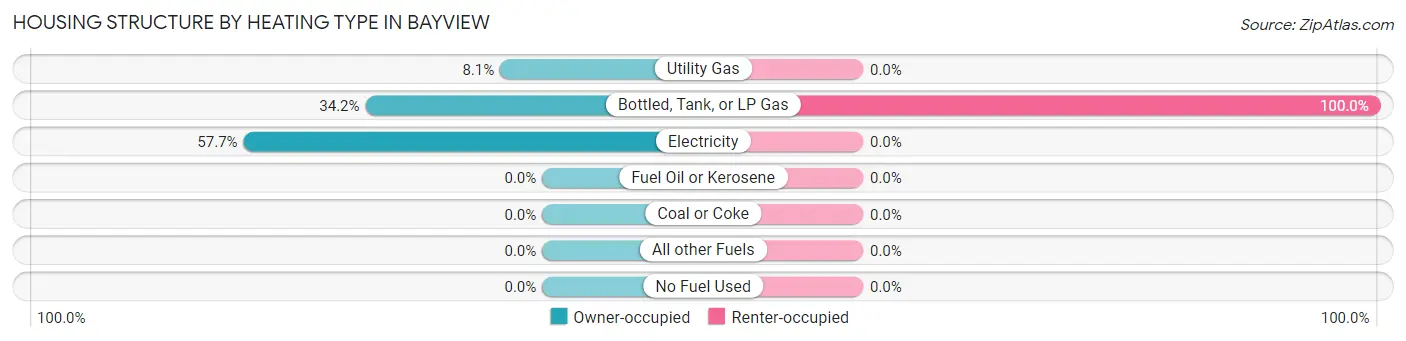
| Heating Type | Owner-occupied | Renter-occupied |
| Utility Gas | 10 (8.1%) | 0 (0.0%) |
| Bottled, Tank, or LP Gas | 42 (34.2%) | 61 (100.0%) |
| Electricity | 71 (57.7%) | 0 (0.0%) |
| Fuel Oil or Kerosene | 0 (0.0%) | 0 (0.0%) |
| Coal or Coke | 0 (0.0%) | 0 (0.0%) |
| All other Fuels | 0 (0.0%) | 0 (0.0%) |
| No Fuel Used | 0 (0.0%) | 0 (0.0%) |
| Total | 123 (100.0%) | 61 (100.0%) |
Household Vehicle Usage in Bayview
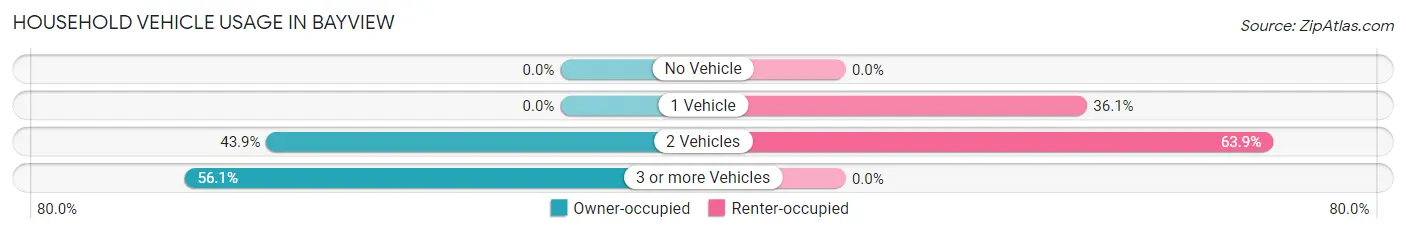
| Vehicles per Household | Owner-occupied | Renter-occupied |
| No Vehicle | 0 (0.0%) | 0 (0.0%) |
| 1 Vehicle | 0 (0.0%) | 22 (36.1%) |
| 2 Vehicles | 54 (43.9%) | 39 (63.9%) |
| 3 or more Vehicles | 69 (56.1%) | 0 (0.0%) |
| Total | 123 (100.0%) | 61 (100.0%) |
Real Estate & Mortgages in Bayview
Real Estate and Mortgage Overview in Bayview
| Characteristic | Without Mortgage | With Mortgage |
| Housing Units | 42 | 81 |
| Median Property Value | $189,500 | $514,500 |
| Median Household Income | $122,000 | $23 |
| Monthly Housing Costs | - | - |
| Real Estate Taxes | $1,658 | $0 |
Property Value by Mortgage Status in Bayview
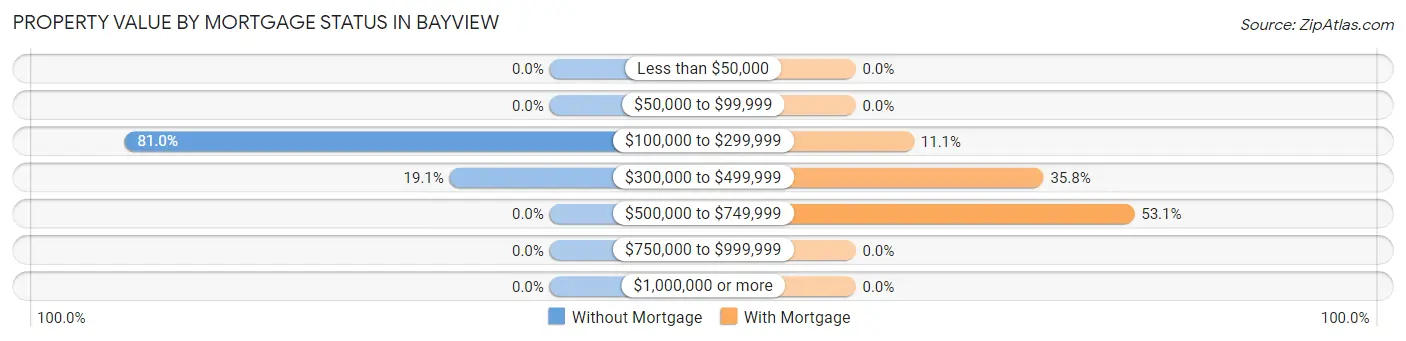
| Property Value | Without Mortgage | With Mortgage |
| Less than $50,000 | 0 (0.0%) | 0 (0.0%) |
| $50,000 to $99,999 | 0 (0.0%) | 0 (0.0%) |
| $100,000 to $299,999 | 34 (80.9%) | 9 (11.1%) |
| $300,000 to $499,999 | 8 (19.1%) | 29 (35.8%) |
| $500,000 to $749,999 | 0 (0.0%) | 43 (53.1%) |
| $750,000 to $999,999 | 0 (0.0%) | 0 (0.0%) |
| $1,000,000 or more | 0 (0.0%) | 0 (0.0%) |
| Total | 42 (100.0%) | 81 (100.0%) |
Household Income by Mortgage Status in Bayview
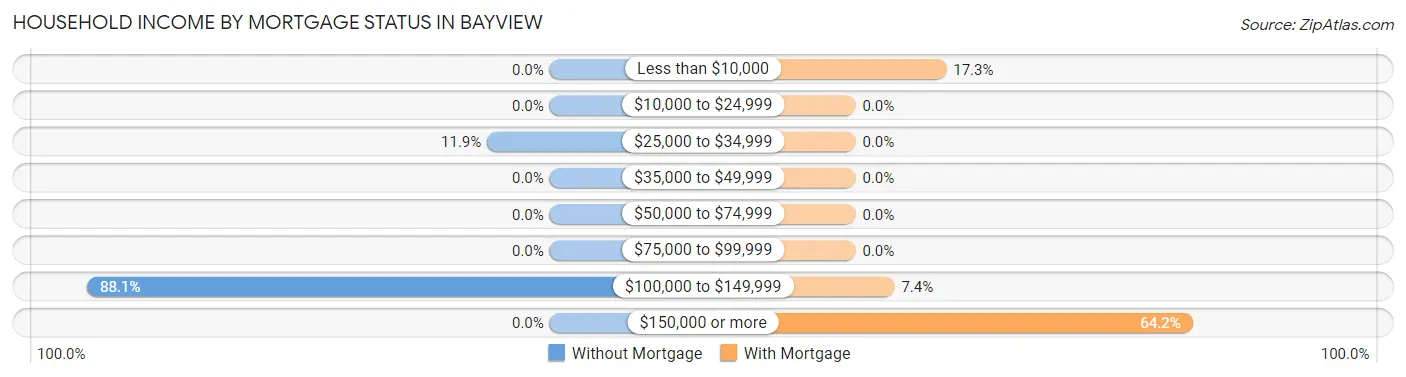
| Household Income | Without Mortgage | With Mortgage |
| Less than $10,000 | 0 (0.0%) | 14 (17.3%) |
| $10,000 to $24,999 | 0 (0.0%) | 0 (0.0%) |
| $25,000 to $34,999 | 5 (11.9%) | 0 (0.0%) |
| $35,000 to $49,999 | 0 (0.0%) | 0 (0.0%) |
| $50,000 to $74,999 | 0 (0.0%) | 0 (0.0%) |
| $75,000 to $99,999 | 0 (0.0%) | 0 (0.0%) |
| $100,000 to $149,999 | 37 (88.1%) | 6 (7.4%) |
| $150,000 or more | 0 (0.0%) | 52 (64.2%) |
| Total | 42 (100.0%) | 81 (100.0%) |
Property Value to Household Income Ratio in Bayview
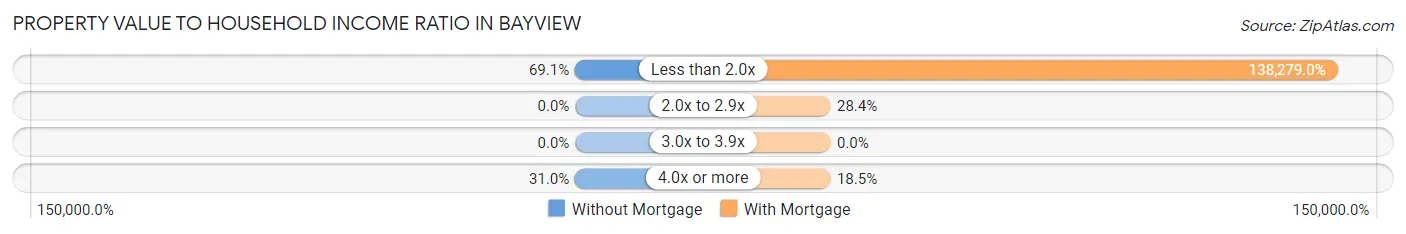
| Value-to-Income Ratio | Without Mortgage | With Mortgage |
| Less than 2.0x | 29 (69.1%) | 112,006 (138,279.0%) |
| 2.0x to 2.9x | 0 (0.0%) | 23 (28.4%) |
| 3.0x to 3.9x | 0 (0.0%) | 0 (0.0%) |
| 4.0x or more | 13 (30.9%) | 15 (18.5%) |
| Total | 42 (100.0%) | 81 (100.0%) |
Real Estate Taxes by Mortgage Status in Bayview
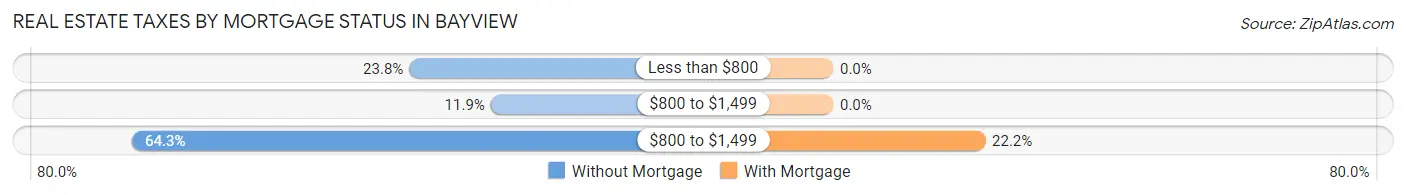
| Property Taxes | Without Mortgage | With Mortgage |
| Less than $800 | 10 (23.8%) | 0 (0.0%) |
| $800 to $1,499 | 5 (11.9%) | 0 (0.0%) |
| $800 to $1,499 | 27 (64.3%) | 18 (22.2%) |
| Total | 42 (100.0%) | 81 (100.0%) |
Health & Disability in Bayview
Health Insurance Coverage by Age in Bayview
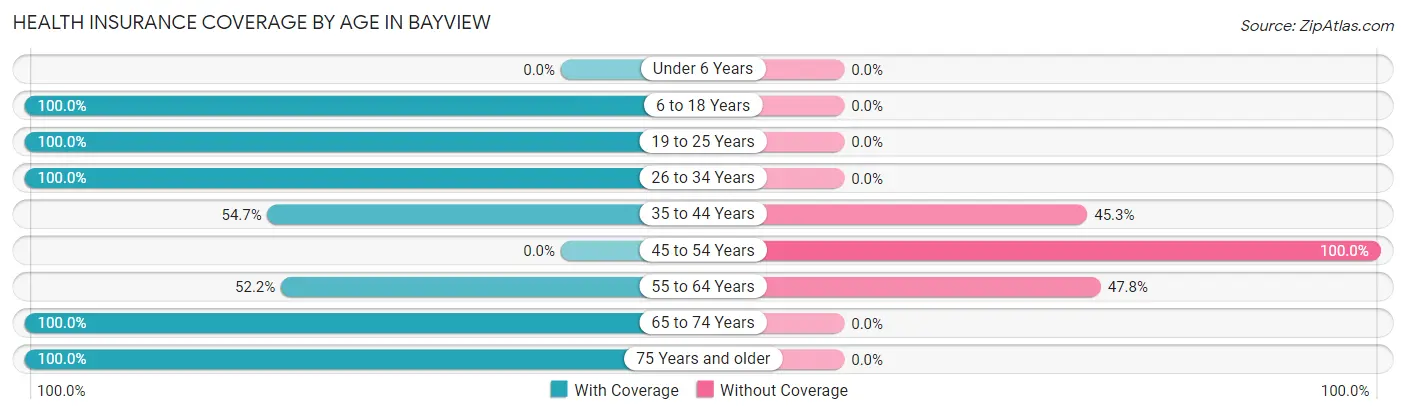
| Age Bracket | With Coverage | Without Coverage |
| Under 6 Years | 0 (0.0%) | 0 (0.0%) |
| 6 to 18 Years | 11 (100.0%) | 0 (0.0%) |
| 19 to 25 Years | 6 (100.0%) | 0 (0.0%) |
| 26 to 34 Years | 90 (100.0%) | 0 (0.0%) |
| 35 to 44 Years | 35 (54.7%) | 29 (45.3%) |
| 45 to 54 Years | 0 (0.0%) | 41 (100.0%) |
| 55 to 64 Years | 24 (52.2%) | 22 (47.8%) |
| 65 to 74 Years | 130 (100.0%) | 0 (0.0%) |
| 75 Years and older | 10 (100.0%) | 0 (0.0%) |
| Total | 306 (76.9%) | 92 (23.1%) |
Health Insurance Coverage by Citizenship Status in Bayview

| Citizenship Status | With Coverage | Without Coverage |
| Native Born | 0 (0.0%) | 0 (0.0%) |
| Foreign Born, Citizen | 11 (100.0%) | 0 (0.0%) |
| Foreign Born, not a Citizen | 6 (100.0%) | 0 (0.0%) |
Health Insurance Coverage by Household Income in Bayview

| Household Income | With Coverage | Without Coverage |
| Under $25,000 | 0 (0.0%) | 22 (100.0%) |
| $25,000 to $49,999 | 18 (20.4%) | 70 (79.5%) |
| $50,000 to $74,999 | 0 (0.0%) | 0 (0.0%) |
| $75,000 to $99,999 | 34 (100.0%) | 0 (0.0%) |
| $100,000 and over | 254 (100.0%) | 0 (0.0%) |
Public vs Private Health Insurance Coverage by Age in Bayview
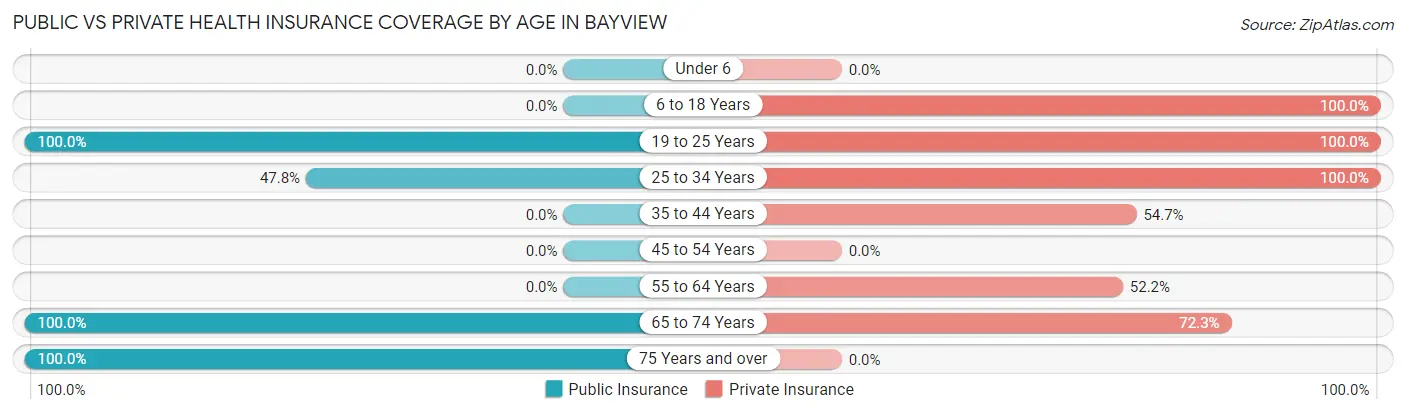
| Age Bracket | Public Insurance | Private Insurance |
| Under 6 | 0 (0.0%) | 0 (0.0%) |
| 6 to 18 Years | 0 (0.0%) | 11 (100.0%) |
| 19 to 25 Years | 6 (100.0%) | 6 (100.0%) |
| 25 to 34 Years | 43 (47.8%) | 90 (100.0%) |
| 35 to 44 Years | 0 (0.0%) | 35 (54.7%) |
| 45 to 54 Years | 0 (0.0%) | 0 (0.0%) |
| 55 to 64 Years | 0 (0.0%) | 24 (52.2%) |
| 65 to 74 Years | 130 (100.0%) | 94 (72.3%) |
| 75 Years and over | 10 (100.0%) | 0 (0.0%) |
| Total | 189 (47.5%) | 260 (65.3%) |
Disability Status by Sex by Age in Bayview
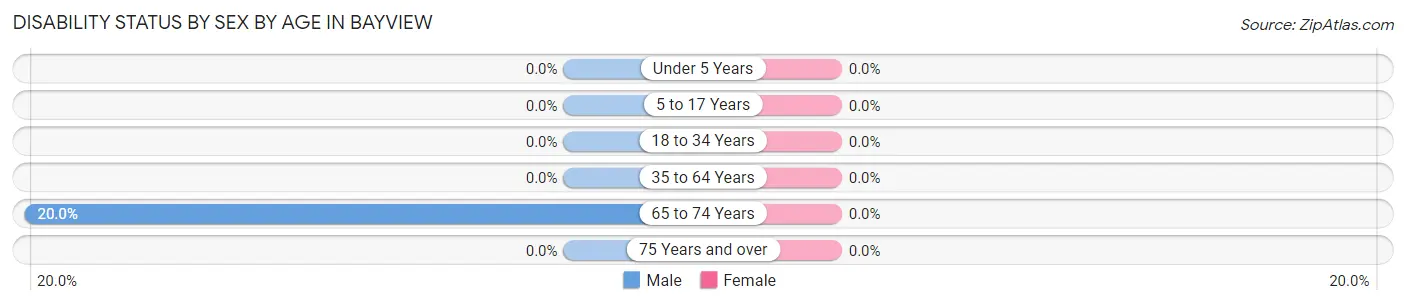
| Age Bracket | Male | Female |
| Under 5 Years | 0 (0.0%) | 0 (0.0%) |
| 5 to 17 Years | 0 (0.0%) | 0 (0.0%) |
| 18 to 34 Years | 0 (0.0%) | 0 (0.0%) |
| 35 to 64 Years | 0 (0.0%) | 0 (0.0%) |
| 65 to 74 Years | 18 (20.0%) | 0 (0.0%) |
| 75 Years and over | 0 (0.0%) | 0 (0.0%) |
Disability Class by Sex by Age in Bayview
Disability Class: Hearing Difficulty
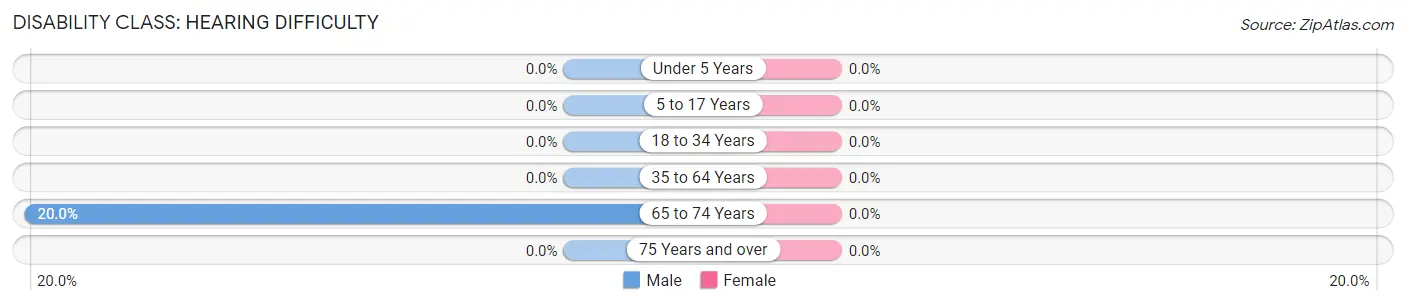
| Age Bracket | Male | Female |
| Under 5 Years | 0 (0.0%) | 0 (0.0%) |
| 5 to 17 Years | 0 (0.0%) | 0 (0.0%) |
| 18 to 34 Years | 0 (0.0%) | 0 (0.0%) |
| 35 to 64 Years | 0 (0.0%) | 0 (0.0%) |
| 65 to 74 Years | 18 (20.0%) | 0 (0.0%) |
| 75 Years and over | 0 (0.0%) | 0 (0.0%) |
Disability Class: Vision Difficulty
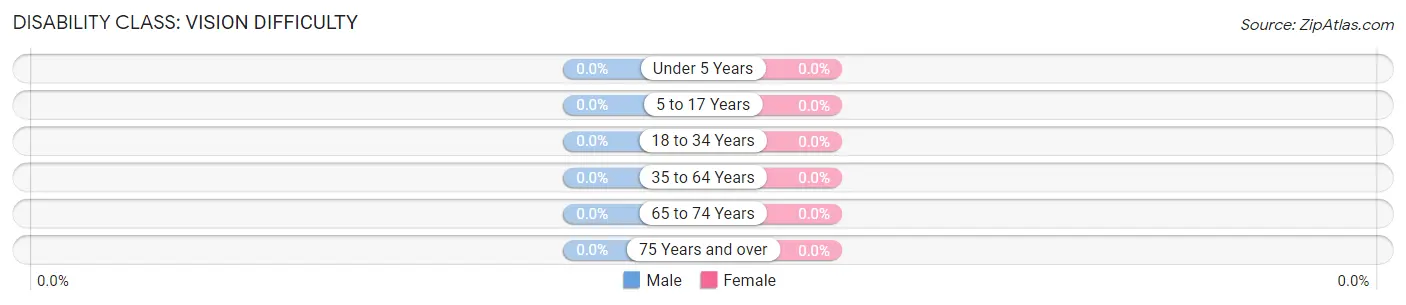
| Age Bracket | Male | Female |
| Under 5 Years | 0 (0.0%) | 0 (0.0%) |
| 5 to 17 Years | 0 (0.0%) | 0 (0.0%) |
| 18 to 34 Years | 0 (0.0%) | 0 (0.0%) |
| 35 to 64 Years | 0 (0.0%) | 0 (0.0%) |
| 65 to 74 Years | 0 (0.0%) | 0 (0.0%) |
| 75 Years and over | 0 (0.0%) | 0 (0.0%) |
Disability Class: Cognitive Difficulty
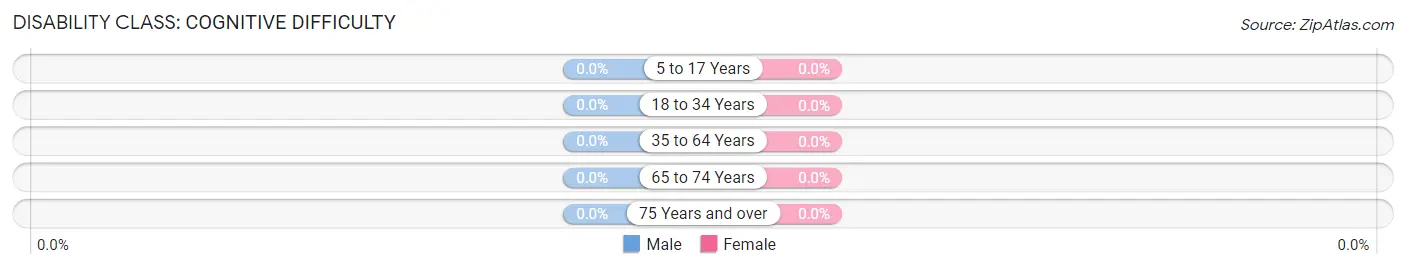
| Age Bracket | Male | Female |
| 5 to 17 Years | 0 (0.0%) | 0 (0.0%) |
| 18 to 34 Years | 0 (0.0%) | 0 (0.0%) |
| 35 to 64 Years | 0 (0.0%) | 0 (0.0%) |
| 65 to 74 Years | 0 (0.0%) | 0 (0.0%) |
| 75 Years and over | 0 (0.0%) | 0 (0.0%) |
Disability Class: Ambulatory Difficulty
| Age Bracket | Male | Female |
| 5 to 17 Years | 0 (0.0%) | 0 (0.0%) |
| 18 to 34 Years | 0 (0.0%) | 0 (0.0%) |
| 35 to 64 Years | 0 (0.0%) | 0 (0.0%) |
| 65 to 74 Years | 0 (0.0%) | 0 (0.0%) |
| 75 Years and over | 0 (0.0%) | 0 (0.0%) |
Disability Class: Self-Care Difficulty
| Age Bracket | Male | Female |
| 5 to 17 Years | 0 (0.0%) | 0 (0.0%) |
| 18 to 34 Years | 0 (0.0%) | 0 (0.0%) |
| 35 to 64 Years | 0 (0.0%) | 0 (0.0%) |
| 65 to 74 Years | 0 (0.0%) | 0 (0.0%) |
| 75 Years and over | 0 (0.0%) | 0 (0.0%) |
Technology Access in Bayview
Computing Device Access in Bayview
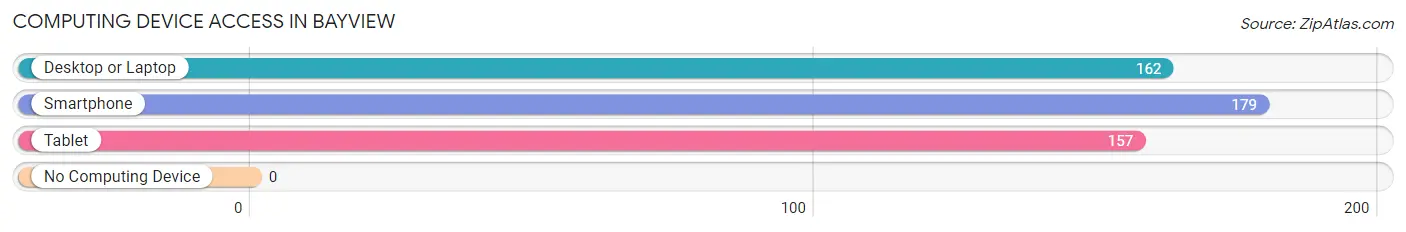
| Device Type | # Households | % Households |
| Desktop or Laptop | 162 | 88.0% |
| Smartphone | 179 | 97.3% |
| Tablet | 157 | 85.3% |
| No Computing Device | 0 | 0.0% |
| Total | 184 | 100.0% |
Internet Access in Bayview
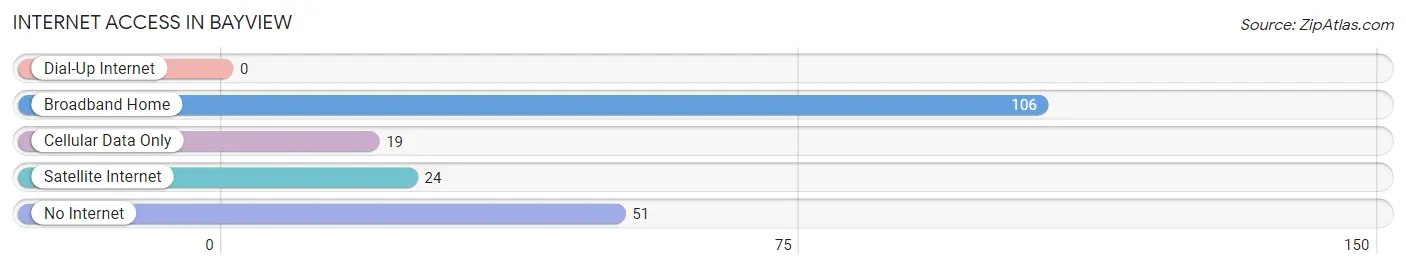
| Internet Type | # Households | % Households |
| Dial-Up Internet | 0 | 0.0% |
| Broadband Home | 106 | 57.6% |
| Cellular Data Only | 19 | 10.3% |
| Satellite Internet | 24 | 13.0% |
| No Internet | 51 | 27.7% |
| Total | 184 | 100.0% |
Bayview Summary
Bayview is a small town located in the northeastern corner of North Carolina, in the United States. It is situated on the banks of the Pamlico River, and is part of the Outer Banks region. The town has a population of approximately 1,000 people, and is known for its fishing and seafood industry.
History
The area that is now Bayview was first settled in the late 1700s by English settlers. The town was originally known as “Pamlico”, after the river that runs through it. In the early 1800s, the town was renamed “Bayview”, after the view of the bay from the town.
In the late 1800s, the town began to grow and develop. The first post office was established in 1887, and the first school was built in 1895. The town was incorporated in 1901, and the first mayor was elected in 1902.
In the early 1900s, the town began to develop its fishing and seafood industry. The first commercial fishing boats were built in the 1920s, and the first seafood processing plant was built in the 1930s. The town has since become known for its seafood industry, and is home to several seafood restaurants and markets.
Geography
Bayview is located in the northeastern corner of North Carolina, in the United States. It is situated on the banks of the Pamlico River, and is part of the Outer Banks region. The town is located approximately 30 miles south of the Virginia border, and is approximately 50 miles east of Raleigh, the state capital.
The town is located in a coastal plain region, and is surrounded by wetlands and marshlands. The town is located on the Pamlico Sound, and is bordered by the Atlantic Ocean to the east. The town is located in a temperate climate, with mild winters and hot, humid summers.
Economy
The economy of Bayview is largely based on the fishing and seafood industry. The town is home to several seafood restaurants and markets, and is known for its fresh seafood. The town is also home to several boat builders, and is a popular destination for recreational fishing.
The town is also home to several small businesses, including a grocery store, a hardware store, and a few restaurants. The town is also home to a few small manufacturing companies, and is a popular destination for tourists.
Demographics
As of the 2010 census, the population of Bayview was 1,000 people. The town is predominantly white, with approximately 95% of the population being white. The town is also home to a small African American population, with approximately 4% of the population being African American. The town is also home to a small Hispanic population, with approximately 1% of the population being Hispanic.
The median household income in Bayview is approximately $35,000, and the median home value is approximately $150,000. The town has a low unemployment rate, and the majority of the population is employed in the fishing and seafood industry.
Common Questions
What is Per Capita Income in Bayview?
Per Capita income in Bayview is $50,835.
What is the Median Family Income in Bayview?
Median Family Income in Bayview is $112,180.
What is the Median Household income in Bayview?
Median Household Income in Bayview is $110,698.
What is Inequality or Gini Index in Bayview?
Inequality or Gini Index in Bayview is 0.31.
What is the Total Population of Bayview?
Total Population of Bayview is 398.
What is the Total Male Population of Bayview?
Total Male Population of Bayview is 232.
What is the Total Female Population of Bayview?
Total Female Population of Bayview is 166.
What is the Ratio of Males per 100 Females in Bayview?
There are 139.76 Males per 100 Females in Bayview.
What is the Ratio of Females per 100 Males in Bayview?
There are 71.55 Females per 100 Males in Bayview.
What is the Median Population Age in Bayview?
Median Population Age in Bayview is 48.7 Years.
What is the Average Family Size in Bayview
Average Family Size in Bayview is 2.3 People.
What is the Average Household Size in Bayview
Average Household Size in Bayview is 2.2 People.
How Large is the Labor Force in Bayview?
There are 225 People in the Labor Forcein in Bayview.
What is the Percentage of People in the Labor Force in Bayview?
58.1% of People are in the Labor Force in Bayview.