Caswell Beach, NC Map & Demographics
Caswell Beach Map
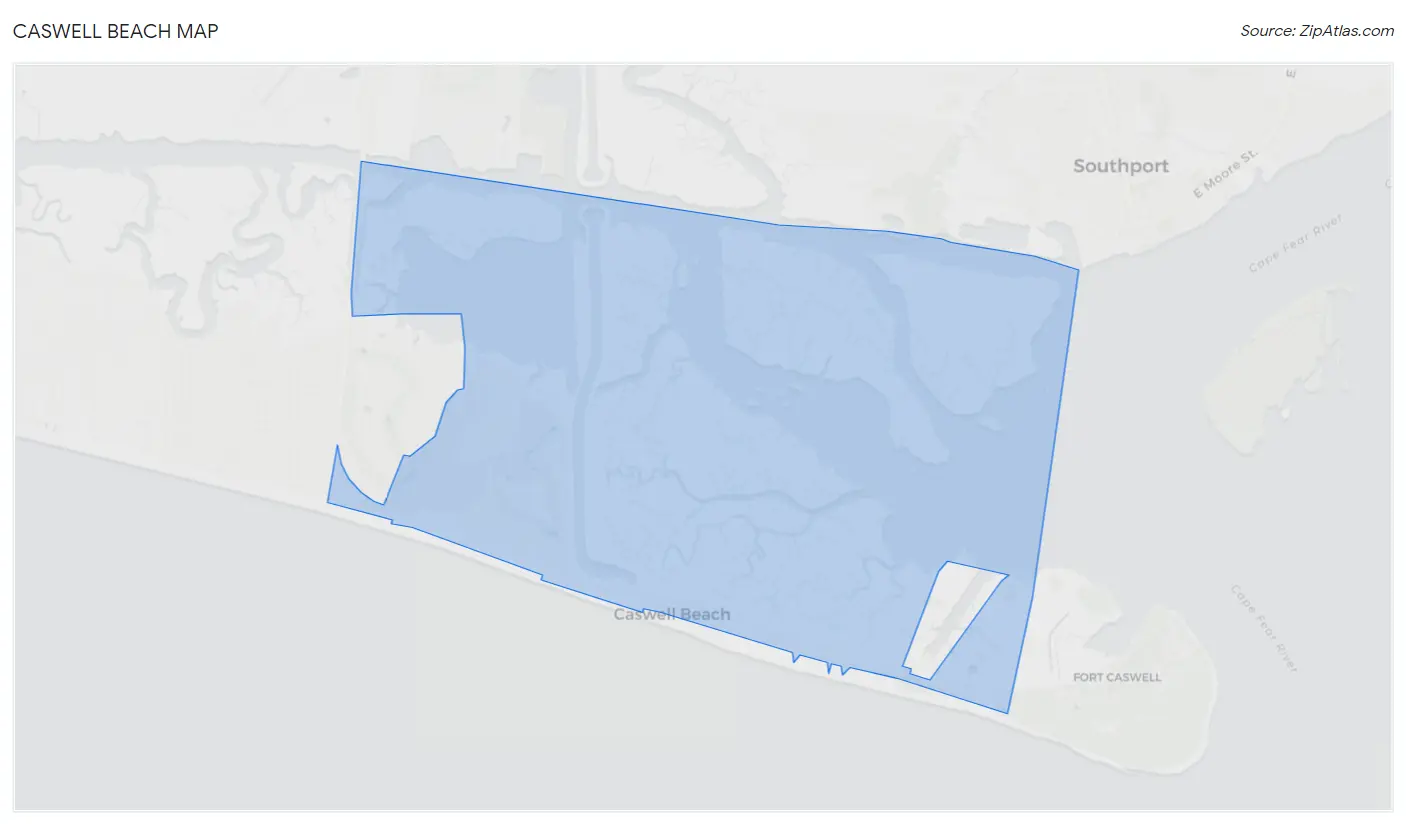
Caswell Beach Overview
$70,598
PER CAPITA INCOME
$140,938
AVG FAMILY INCOME
$121,125
AVG HOUSEHOLD INCOME
24.0%
WAGE / INCOME GAP [ % ]
76.0¢/ $1
WAGE / INCOME GAP [ $ ]
0.47
INEQUALITY / GINI INDEX
489
TOTAL POPULATION
224
MALE POPULATION
265
FEMALE POPULATION
84.53
MALES / 100 FEMALES
118.30
FEMALES / 100 MALES
58.5
MEDIAN AGE
2.7
AVG FAMILY SIZE
2.2
AVG HOUSEHOLD SIZE
226
LABOR FORCE [ PEOPLE ]
48.9%
PERCENT IN LABOR FORCE
0.9%
UNEMPLOYMENT RATE
Caswell Beach Area Codes
Income in Caswell Beach
Income Overview in Caswell Beach
Per Capita Income in Caswell Beach is $70,598, while median incomes of families and households are $140,938 and $121,125 respectively.
| Characteristic | Number | Measure |
| Per Capita Income | 489 | $70,598 |
| Median Family Income | 145 | $140,938 |
| Mean Family Income | 145 | $160,356 |
| Median Household Income | 219 | $121,125 |
| Mean Household Income | 219 | $146,512 |
| Income Deficit | 145 | $0 |
| Wage / Income Gap (%) | 489 | 24.01% |
| Wage / Income Gap ($) | 489 | 75.99¢ per $1 |
| Gini / Inequality Index | 489 | 0.47 |
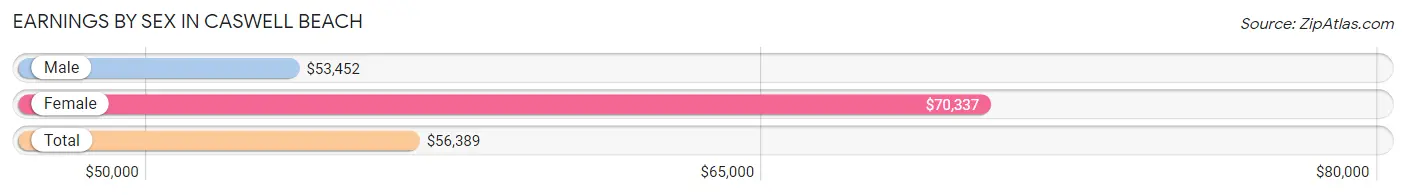
Earnings by Sex in Caswell Beach
Average Earnings in Caswell Beach are $56,389, $53,452 for men and $70,337 for women, a difference of 24.0%.
| Sex | Number | Average Earnings |
| Male | 116 (48.7%) | $53,452 |
| Female | 122 (51.3%) | $70,337 |
| Total | 238 (100.0%) | $56,389 |
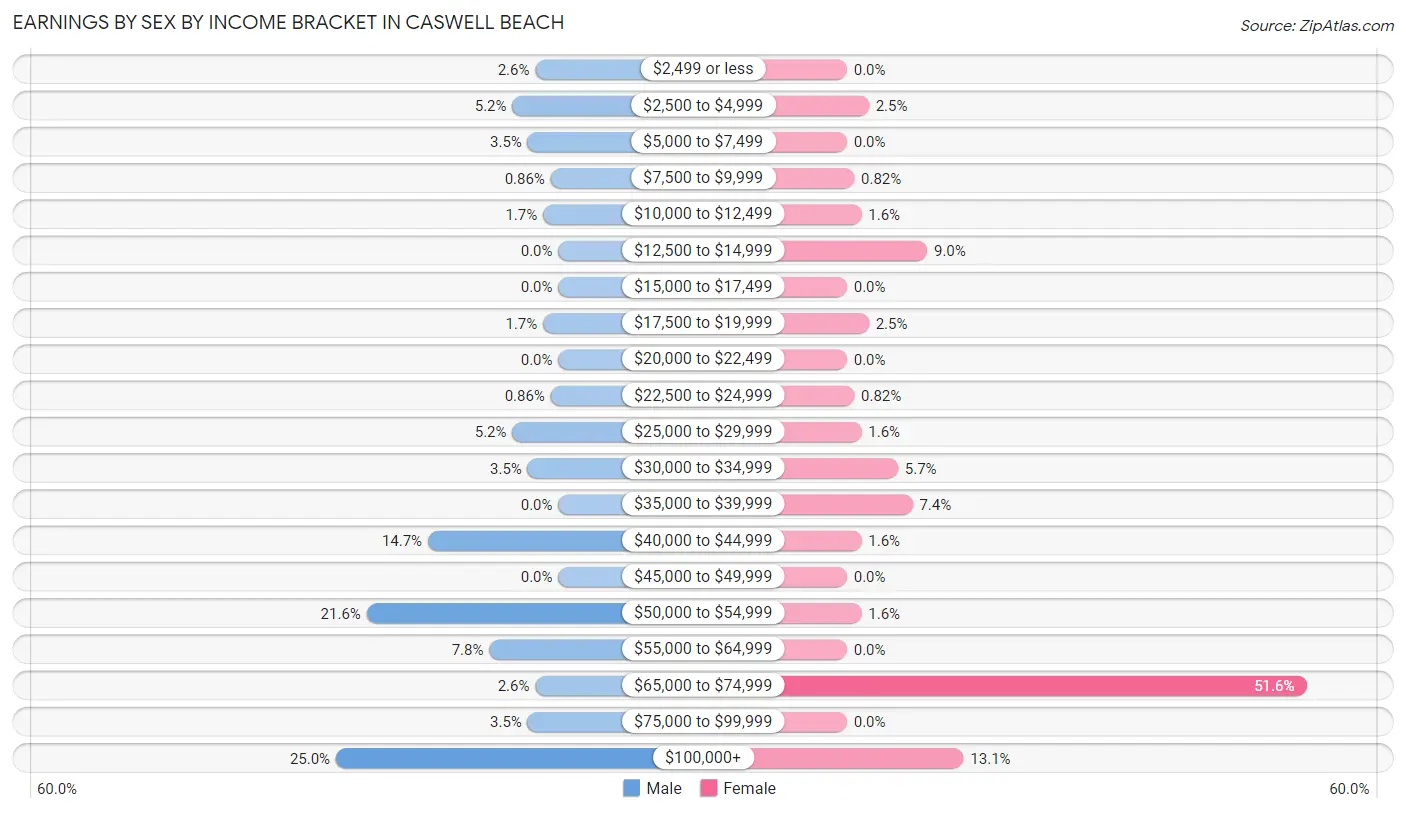
Earnings by Sex by Income Bracket in Caswell Beach
The most common earnings brackets in Caswell Beach are $100,000+ for men (29 | 25.0%) and $65,000 to $74,999 for women (63 | 51.6%).
| Income | Male | Female |
| $2,499 or less | 3 (2.6%) | 0 (0.0%) |
| $2,500 to $4,999 | 6 (5.2%) | 3 (2.5%) |
| $5,000 to $7,499 | 4 (3.5%) | 0 (0.0%) |
| $7,500 to $9,999 | 1 (0.9%) | 1 (0.8%) |
| $10,000 to $12,499 | 2 (1.7%) | 2 (1.6%) |
| $12,500 to $14,999 | 0 (0.0%) | 11 (9.0%) |
| $15,000 to $17,499 | 0 (0.0%) | 0 (0.0%) |
| $17,500 to $19,999 | 2 (1.7%) | 3 (2.5%) |
| $20,000 to $22,499 | 0 (0.0%) | 0 (0.0%) |
| $22,500 to $24,999 | 1 (0.9%) | 1 (0.8%) |
| $25,000 to $29,999 | 6 (5.2%) | 2 (1.6%) |
| $30,000 to $34,999 | 4 (3.5%) | 7 (5.7%) |
| $35,000 to $39,999 | 0 (0.0%) | 9 (7.4%) |
| $40,000 to $44,999 | 17 (14.7%) | 2 (1.6%) |
| $45,000 to $49,999 | 0 (0.0%) | 0 (0.0%) |
| $50,000 to $54,999 | 25 (21.5%) | 2 (1.6%) |
| $55,000 to $64,999 | 9 (7.8%) | 0 (0.0%) |
| $65,000 to $74,999 | 3 (2.6%) | 63 (51.6%) |
| $75,000 to $99,999 | 4 (3.5%) | 0 (0.0%) |
| $100,000+ | 29 (25.0%) | 16 (13.1%) |
| Total | 116 (100.0%) | 122 (100.0%) |
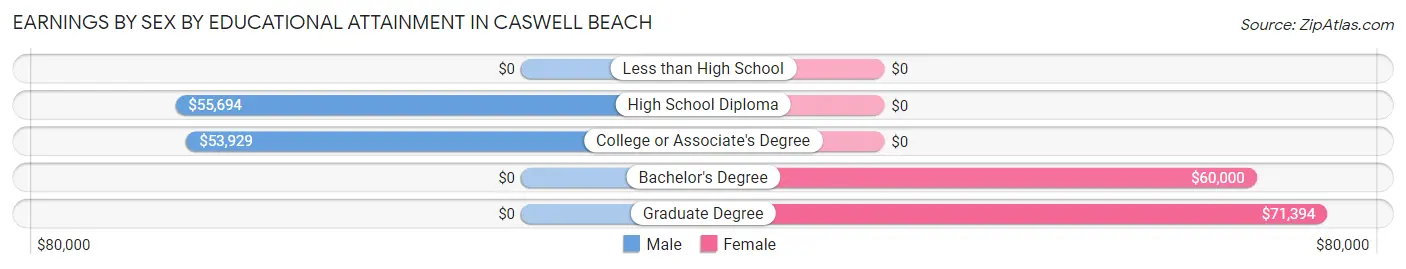
Earnings by Sex by Educational Attainment in Caswell Beach
Average earnings in Caswell Beach are $53,869 for men and $70,457 for women, a difference of 23.5%. Men with an educational attainment of high school diploma enjoy the highest average annual earnings of $55,694, while those with college or associate's degree education earn the least with $53,929. Women with an educational attainment of graduate degree earn the most with the average annual earnings of $71,394, while those with bachelor's degree education have the smallest earnings of $60,000.
| Educational Attainment | Male Income | Female Income |
| Less than High School | - | - |
| High School Diploma | $55,694 | $0 |
| College or Associate's Degree | $53,929 | $0 |
| Bachelor's Degree | - | - |
| Graduate Degree | - | - |
| Total | $53,869 | $70,457 |
Family Income in Caswell Beach
Family Income Brackets in Caswell Beach
According to the Caswell Beach family income data, there are 50 families falling into the $100,000 to $149,999 income range, which is the most common income bracket and makes up 34.5% of all families.
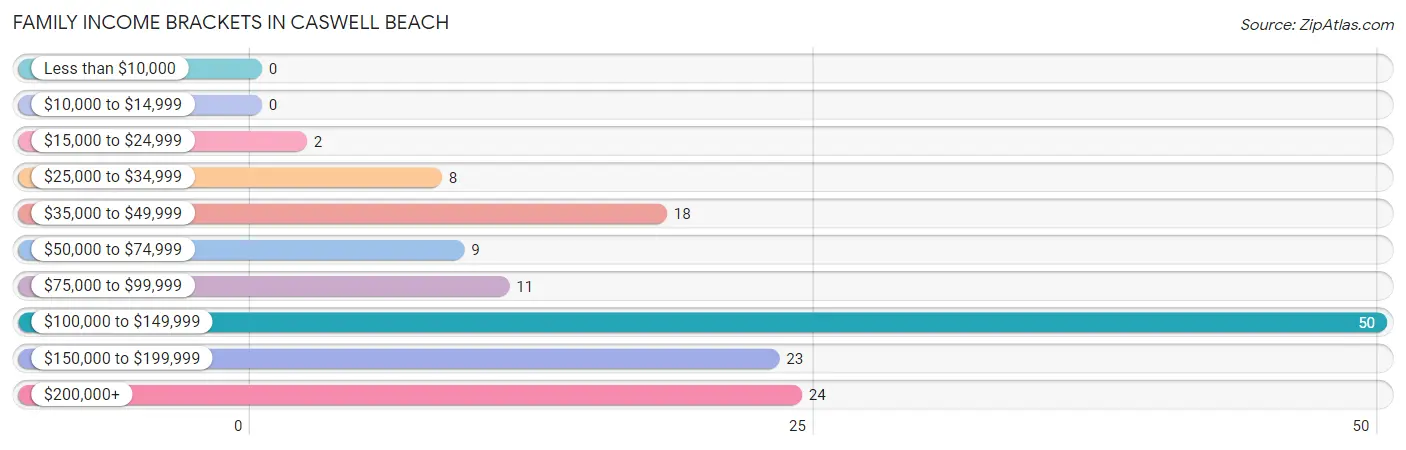
| Income Bracket | # Families | % Families |
| Less than $10,000 | 0 | 0.0% |
| $10,000 to $14,999 | 0 | 0.0% |
| $15,000 to $24,999 | 2 | 1.4% |
| $25,000 to $34,999 | 8 | 5.5% |
| $35,000 to $49,999 | 18 | 12.4% |
| $50,000 to $74,999 | 9 | 6.2% |
| $75,000 to $99,999 | 11 | 7.6% |
| $100,000 to $149,999 | 50 | 34.5% |
| $150,000 to $199,999 | 23 | 15.9% |
| $200,000+ | 24 | 16.6% |
Family Income by Famaliy Size in Caswell Beach
3-person families (20 | 13.8%) account for the highest median family income in Caswell Beach with $183,750 per family, while 3-person families (20 | 13.8%) have the highest median income of $61,250 per family member.
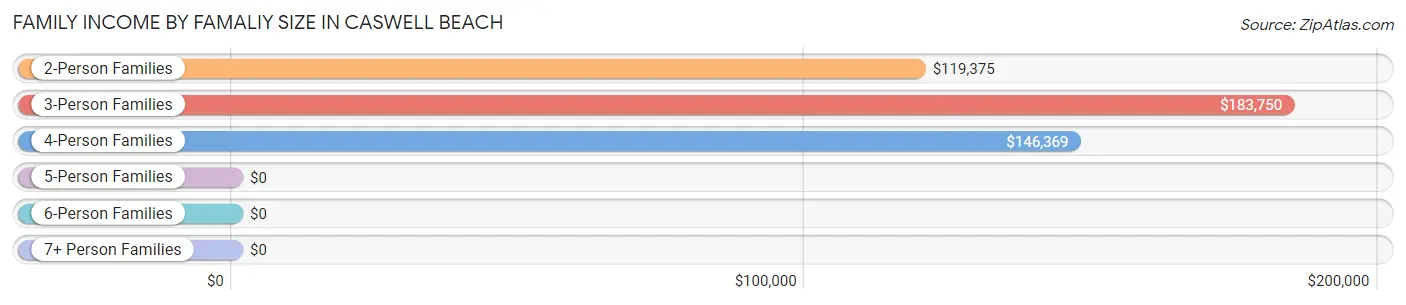
| Income Bracket | # Families | Median Income |
| 2-Person Families | 100 (69.0%) | $119,375 |
| 3-Person Families | 20 (13.8%) | $183,750 |
| 4-Person Families | 23 (15.9%) | $146,369 |
| 5-Person Families | 2 (1.4%) | $0 |
| 6-Person Families | 0 (0.0%) | $0 |
| 7+ Person Families | 0 (0.0%) | $0 |
| Total | 145 (100.0%) | $140,938 |
Family Income by Number of Earners in Caswell Beach
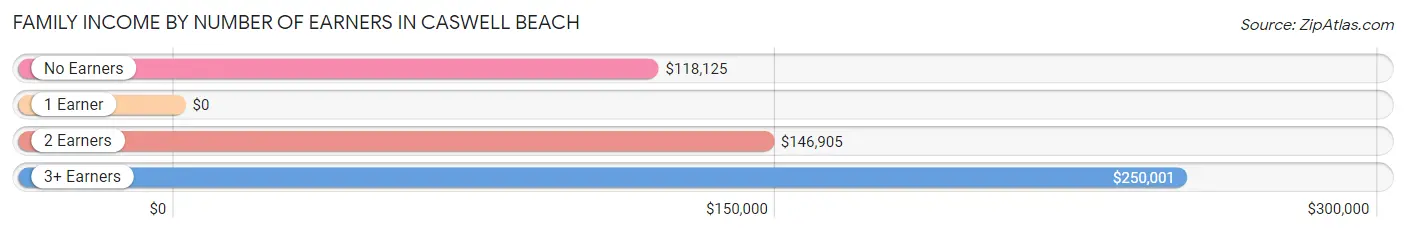
| Number of Earners | # Families | Median Income |
| No Earners | 56 (38.6%) | $118,125 |
| 1 Earner | 34 (23.4%) | $0 |
| 2 Earners | 46 (31.7%) | $146,905 |
| 3+ Earners | 9 (6.2%) | $250,001 |
| Total | 145 (100.0%) | $140,938 |
Household Income in Caswell Beach
Household Income Brackets in Caswell Beach
With 63 households falling in the category, the $100,000 to $149,999 income range is the most frequent in Caswell Beach, accounting for 28.8% of all households.
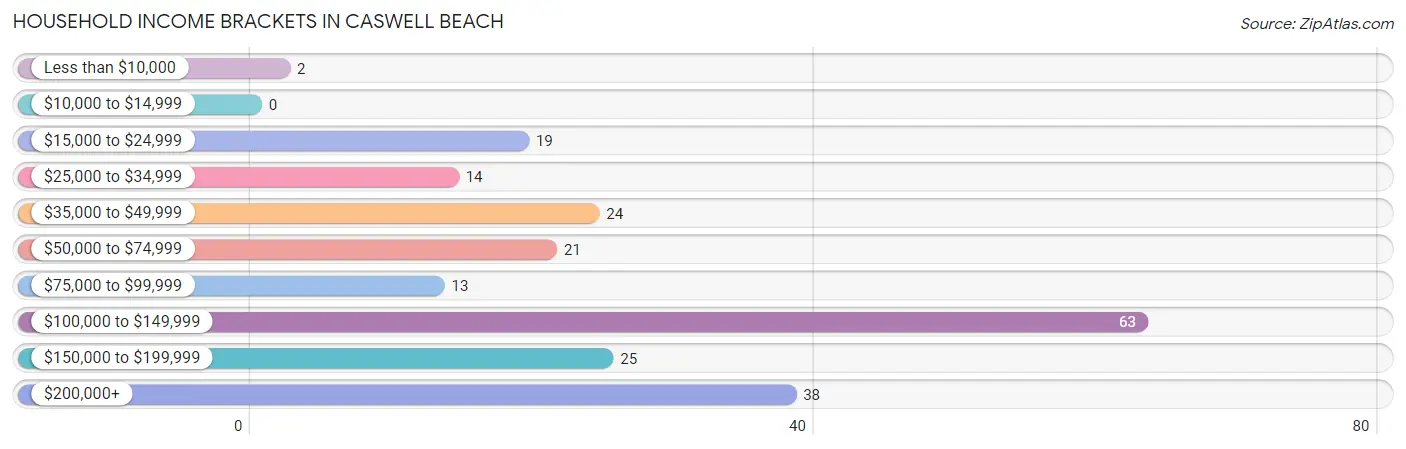
| Income Bracket | # Households | % Households |
| Less than $10,000 | 2 | 0.9% |
| $10,000 to $14,999 | 0 | 0.0% |
| $15,000 to $24,999 | 19 | 8.7% |
| $25,000 to $34,999 | 14 | 6.4% |
| $35,000 to $49,999 | 24 | 11.0% |
| $50,000 to $74,999 | 21 | 9.6% |
| $75,000 to $99,999 | 13 | 5.9% |
| $100,000 to $149,999 | 63 | 28.8% |
| $150,000 to $199,999 | 25 | 11.4% |
| $200,000+ | 38 | 17.4% |
Household Income by Householder Age in Caswell Beach
The median household income in Caswell Beach is $121,125, with the highest median household income of $146,190 found in the 25 to 44 years age bracket for the primary householder. A total of 24 households (11.0%) fall into this category.
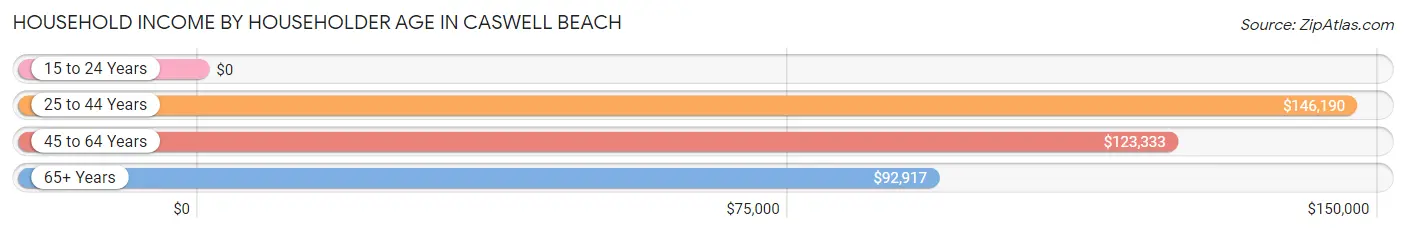
| Income Bracket | # Households | Median Income |
| 15 to 24 Years | 0 (0.0%) | $0 |
| 25 to 44 Years | 24 (11.0%) | $146,190 |
| 45 to 64 Years | 88 (40.2%) | $123,333 |
| 65+ Years | 107 (48.9%) | $92,917 |
| Total | 219 (100.0%) | $121,125 |
Poverty in Caswell Beach
Income Below Poverty by Sex and Age in Caswell Beach
With 1.3% poverty level for males and 3.8% for females among the residents of Caswell Beach, 55 to 64 year old males and 75 year old and over females are the most vulnerable to poverty, with 3 males (6.0%) and 6 females (15.4%) in their respective age groups living below the poverty level.
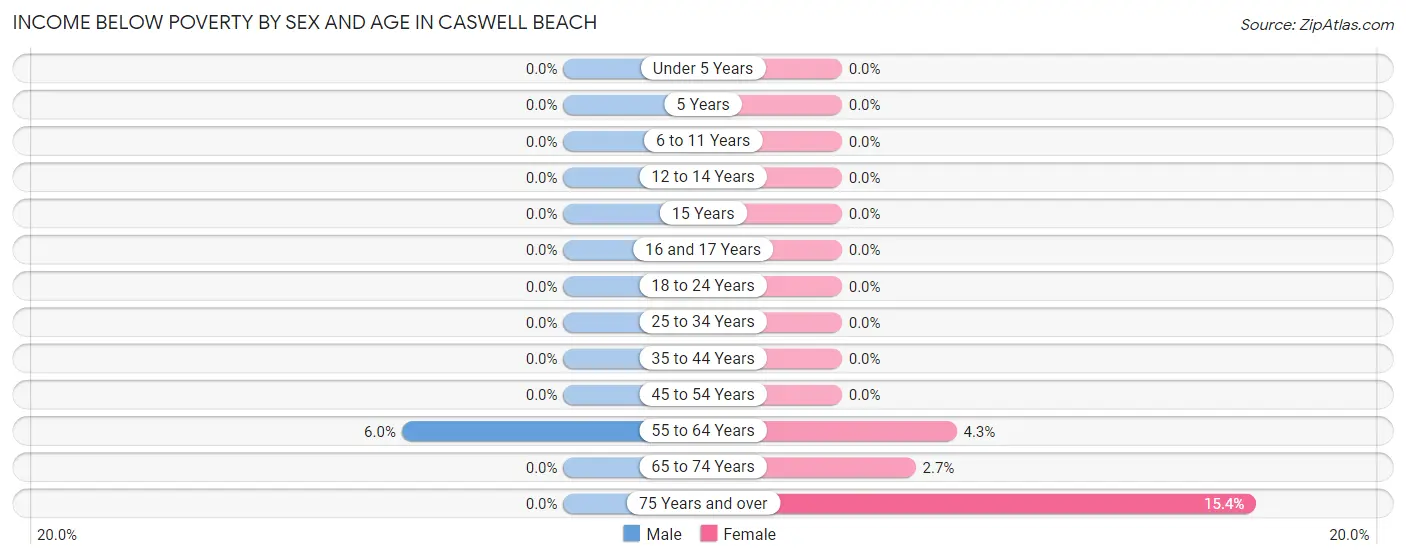
| Age Bracket | Male | Female |
| Under 5 Years | 0 (0.0%) | 0 (0.0%) |
| 5 Years | 0 (0.0%) | 0 (0.0%) |
| 6 to 11 Years | 0 (0.0%) | 0 (0.0%) |
| 12 to 14 Years | 0 (0.0%) | 0 (0.0%) |
| 15 Years | 0 (0.0%) | 0 (0.0%) |
| 16 and 17 Years | 0 (0.0%) | 0 (0.0%) |
| 18 to 24 Years | 0 (0.0%) | 0 (0.0%) |
| 25 to 34 Years | 0 (0.0%) | 0 (0.0%) |
| 35 to 44 Years | 0 (0.0%) | 0 (0.0%) |
| 45 to 54 Years | 0 (0.0%) | 0 (0.0%) |
| 55 to 64 Years | 3 (6.0%) | 2 (4.3%) |
| 65 to 74 Years | 0 (0.0%) | 2 (2.7%) |
| 75 Years and over | 0 (0.0%) | 6 (15.4%) |
| Total | 3 (1.3%) | 10 (3.8%) |
Income Above Poverty by Sex and Age in Caswell Beach
According to the poverty statistics in Caswell Beach, males aged under 5 years and females aged 12 to 14 years are the age groups that are most secure financially, with 100.0% of males and 100.0% of females in these age groups living above the poverty line.
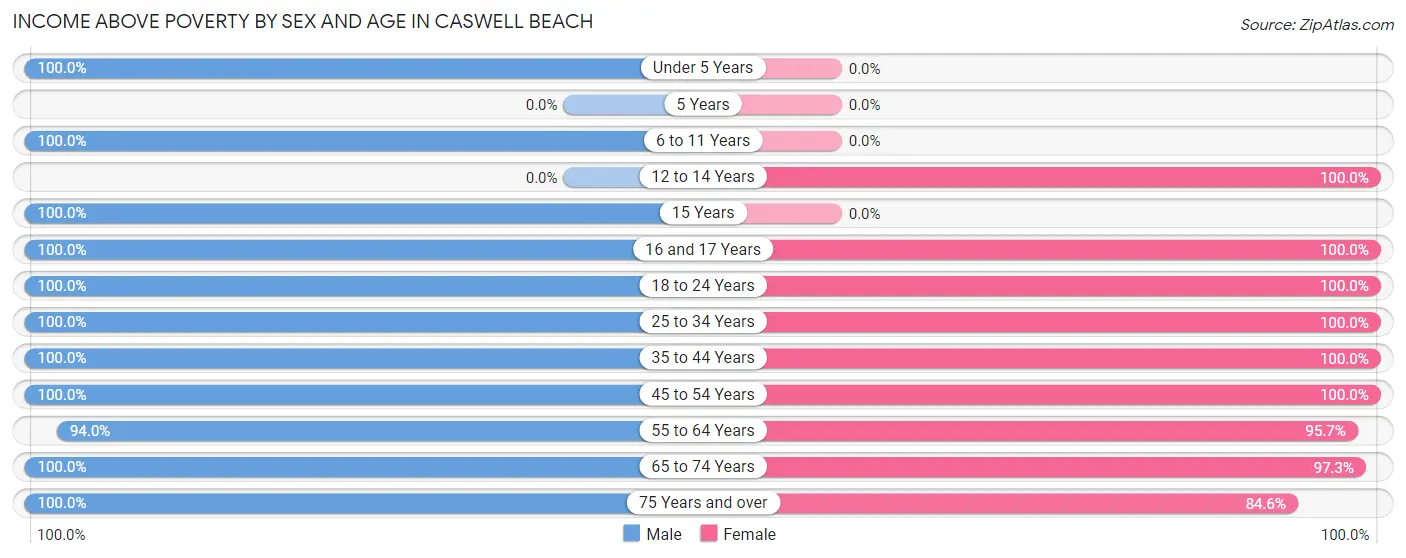
| Age Bracket | Male | Female |
| Under 5 Years | 3 (100.0%) | 0 (0.0%) |
| 5 Years | 0 (0.0%) | 0 (0.0%) |
| 6 to 11 Years | 1 (100.0%) | 0 (0.0%) |
| 12 to 14 Years | 0 (0.0%) | 5 (100.0%) |
| 15 Years | 18 (100.0%) | 0 (0.0%) |
| 16 and 17 Years | 2 (100.0%) | 2 (100.0%) |
| 18 to 24 Years | 12 (100.0%) | 3 (100.0%) |
| 25 to 34 Years | 2 (100.0%) | 7 (100.0%) |
| 35 to 44 Years | 24 (100.0%) | 3 (100.0%) |
| 45 to 54 Years | 38 (100.0%) | 86 (100.0%) |
| 55 to 64 Years | 47 (94.0%) | 45 (95.7%) |
| 65 to 74 Years | 41 (100.0%) | 71 (97.3%) |
| 75 Years and over | 33 (100.0%) | 33 (84.6%) |
| Total | 221 (98.7%) | 255 (96.2%) |
Income Below Poverty Among Married-Couple Families in Caswell Beach
The poverty statistics for married-couple families in Caswell Beach show that 1.4% or 2 of the total 145 families live below the poverty line. Families with no children have the highest poverty rate of 1.8%, comprising of 2 families. On the other hand, families with 1 or 2 children have the lowest poverty rate of 0.0%, which includes 0 families.
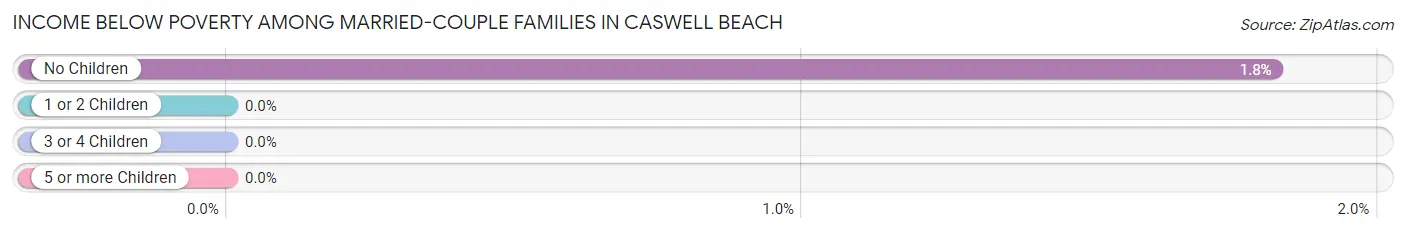
| Children | Above Poverty | Below Poverty |
| No Children | 108 (98.2%) | 2 (1.8%) |
| 1 or 2 Children | 35 (100.0%) | 0 (0.0%) |
| 3 or 4 Children | 0 (0.0%) | 0 (0.0%) |
| 5 or more Children | 0 (0.0%) | 0 (0.0%) |
| Total | 143 (98.6%) | 2 (1.4%) |
Income Below Poverty Among Single-Parent Households in Caswell Beach
| Children | Single Father | Single Mother |
| No Children | 0 (0.0%) | 0 (0.0%) |
| 1 or 2 Children | 0 (0.0%) | 0 (0.0%) |
| 3 or 4 Children | 0 (0.0%) | 0 (0.0%) |
| 5 or more Children | 0 (0.0%) | 0 (0.0%) |
| Total | 0 (0.0%) | 0 (0.0%) |
Income Below Poverty Among Married-Couple vs Single-Parent Households in Caswell Beach
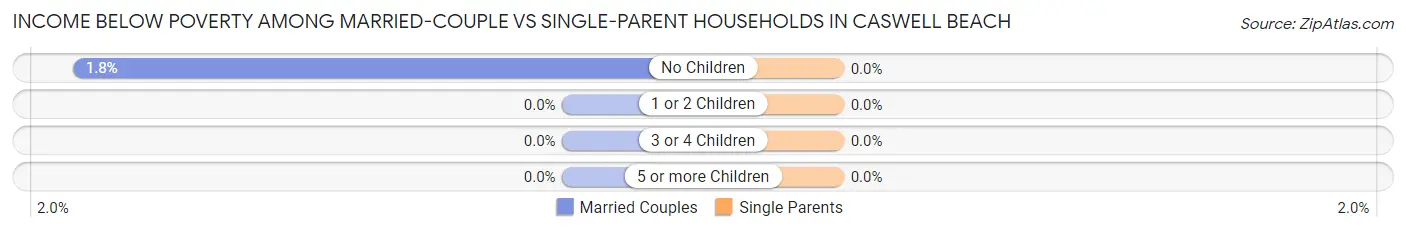
| Children | Married-Couple Families | Single-Parent Households |
| No Children | 2 (1.8%) | 0 (0.0%) |
| 1 or 2 Children | 0 (0.0%) | 0 (0.0%) |
| 3 or 4 Children | 0 (0.0%) | 0 (0.0%) |
| 5 or more Children | 0 (0.0%) | 0 (0.0%) |
| Total | 2 (1.4%) | 0 (0.0%) |
Race in Caswell Beach
The most populous races in Caswell Beach are White / Caucasian (476 | 97.3%), Asian (12 | 2.5%), and Hispanic or Latino (8 | 1.6%).
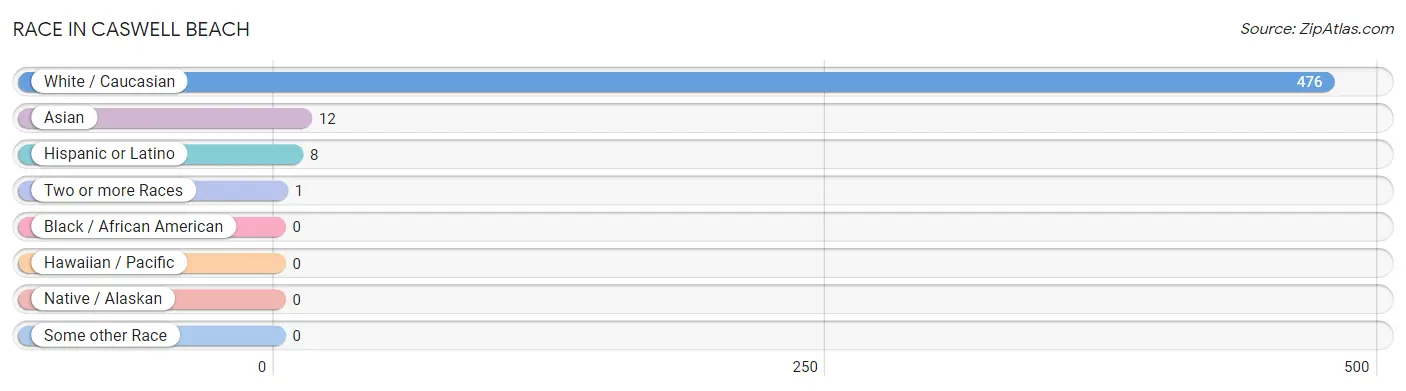
| Race | # Population | % Population |
| Asian | 12 | 2.5% |
| Black / African American | 0 | 0.0% |
| Hawaiian / Pacific | 0 | 0.0% |
| Hispanic or Latino | 8 | 1.6% |
| Native / Alaskan | 0 | 0.0% |
| White / Caucasian | 476 | 97.3% |
| Two or more Races | 1 | 0.2% |
| Some other Race | 0 | 0.0% |
| Total | 489 | 100.0% |
Ancestry in Caswell Beach
The most populous ancestries reported in Caswell Beach are English (187 | 38.2%), German (138 | 28.2%), Irish (93 | 19.0%), Italian (25 | 5.1%), and American (21 | 4.3%), together accounting for 94.9% of all Caswell Beach residents.
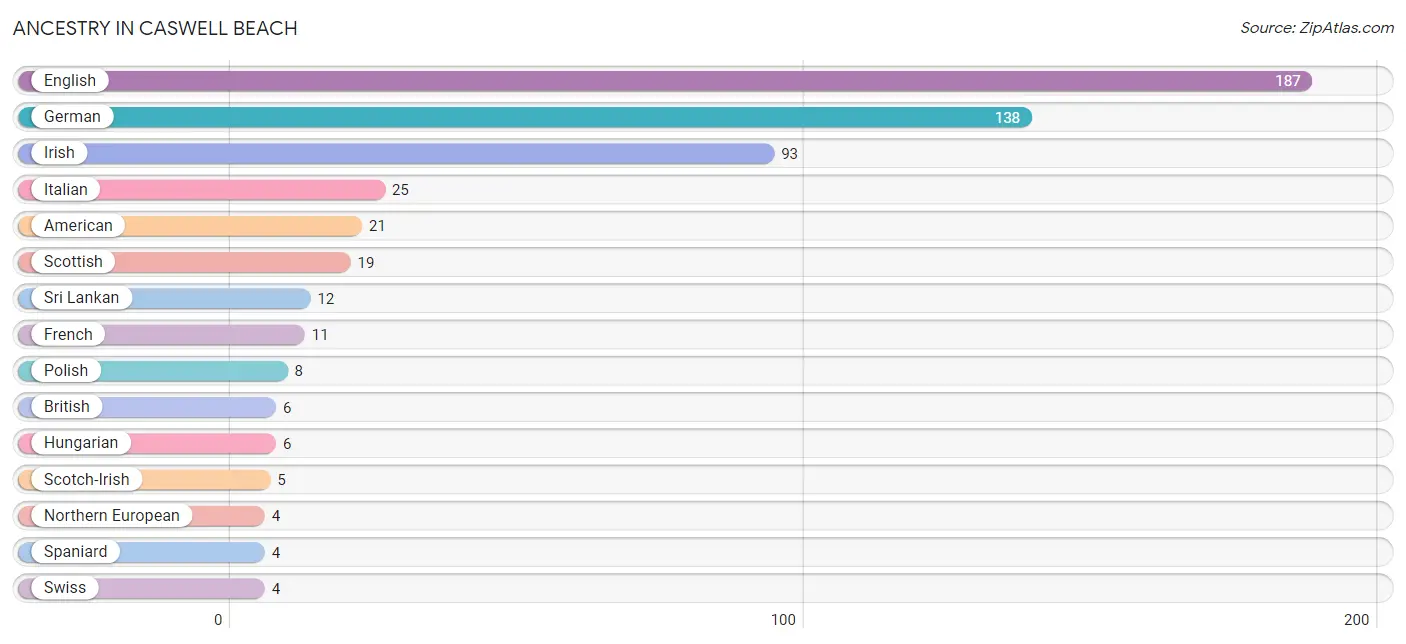
| Ancestry | # Population | % Population |
| American | 21 | 4.3% |
| Austrian | 2 | 0.4% |
| British | 6 | 1.2% |
| Cuban | 1 | 0.2% |
| Czechoslovakian | 2 | 0.4% |
| English | 187 | 38.2% |
| European | 2 | 0.4% |
| French | 11 | 2.2% |
| German | 138 | 28.2% |
| Hungarian | 6 | 1.2% |
| Irish | 93 | 19.0% |
| Italian | 25 | 5.1% |
| Northern European | 4 | 0.8% |
| Norwegian | 3 | 0.6% |
| Polish | 8 | 1.6% |
| Puerto Rican | 3 | 0.6% |
| Russian | 2 | 0.4% |
| Scandinavian | 2 | 0.4% |
| Scotch-Irish | 5 | 1.0% |
| Scottish | 19 | 3.9% |
| Slovak | 2 | 0.4% |
| Spaniard | 4 | 0.8% |
| Sri Lankan | 12 | 2.5% |
| Swedish | 3 | 0.6% |
| Swiss | 4 | 0.8% |
| Ukrainian | 2 | 0.4% |
| Welsh | 1 | 0.2% | View All 27 Rows |
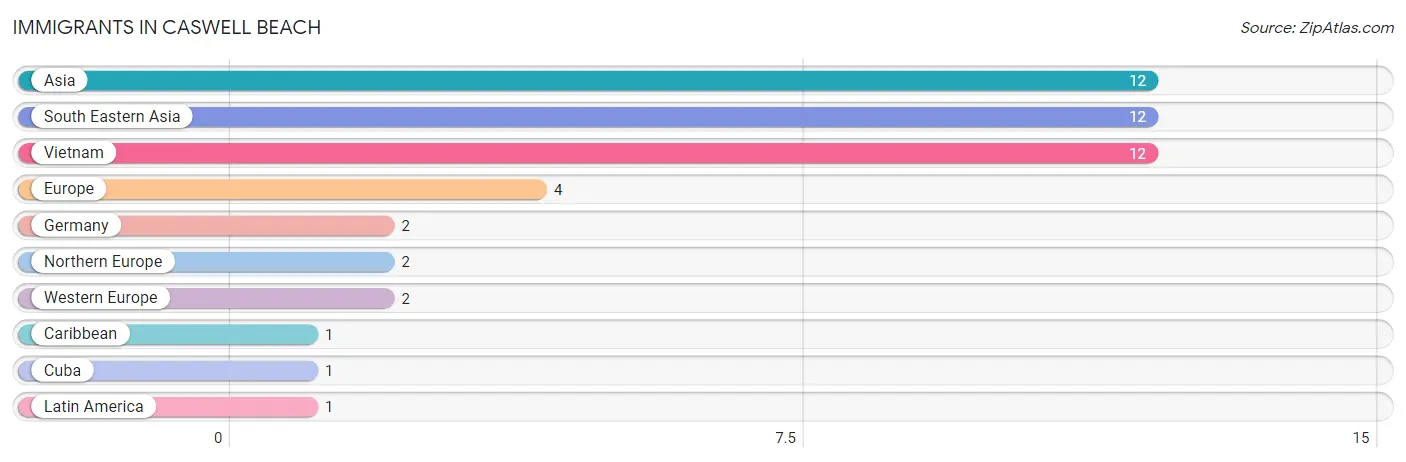
Immigrants in Caswell Beach
The most numerous immigrant groups reported in Caswell Beach came from Asia (12 | 2.5%), South Eastern Asia (12 | 2.5%), Vietnam (12 | 2.5%), Europe (4 | 0.8%), and Germany (2 | 0.4%), together accounting for 8.6% of all Caswell Beach residents.
| Immigration Origin | # Population | % Population |
| Asia | 12 | 2.5% |
| Caribbean | 1 | 0.2% |
| Cuba | 1 | 0.2% |
| Europe | 4 | 0.8% |
| Germany | 2 | 0.4% |
| Latin America | 1 | 0.2% |
| Northern Europe | 2 | 0.4% |
| South Eastern Asia | 12 | 2.5% |
| Vietnam | 12 | 2.5% |
| Western Europe | 2 | 0.4% | View All 10 Rows |
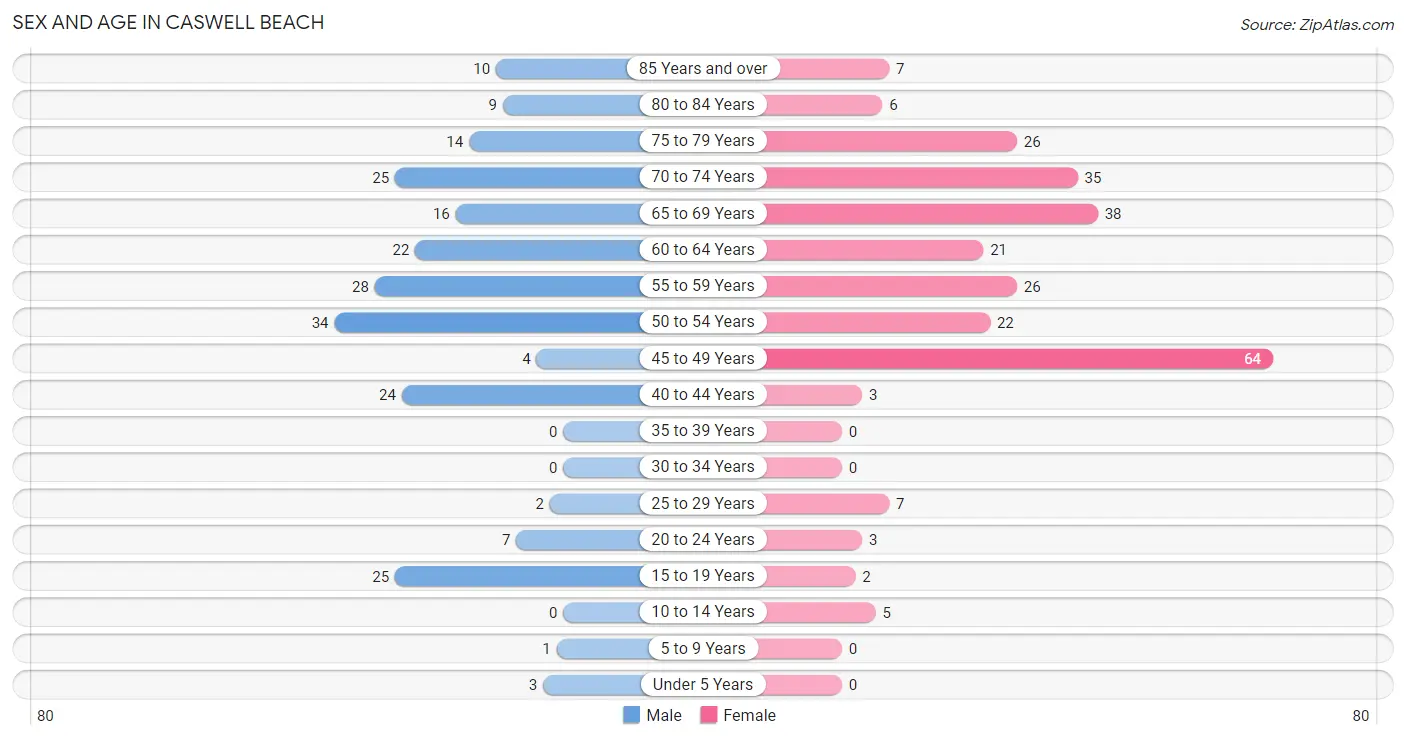
Sex and Age in Caswell Beach
Sex and Age in Caswell Beach
The most populous age groups in Caswell Beach are 50 to 54 Years (34 | 15.2%) for men and 45 to 49 Years (64 | 24.1%) for women.
| Age Bracket | Male | Female |
| Under 5 Years | 3 (1.3%) | 0 (0.0%) |
| 5 to 9 Years | 1 (0.4%) | 0 (0.0%) |
| 10 to 14 Years | 0 (0.0%) | 5 (1.9%) |
| 15 to 19 Years | 25 (11.2%) | 2 (0.7%) |
| 20 to 24 Years | 7 (3.1%) | 3 (1.1%) |
| 25 to 29 Years | 2 (0.9%) | 7 (2.6%) |
| 30 to 34 Years | 0 (0.0%) | 0 (0.0%) |
| 35 to 39 Years | 0 (0.0%) | 0 (0.0%) |
| 40 to 44 Years | 24 (10.7%) | 3 (1.1%) |
| 45 to 49 Years | 4 (1.8%) | 64 (24.1%) |
| 50 to 54 Years | 34 (15.2%) | 22 (8.3%) |
| 55 to 59 Years | 28 (12.5%) | 26 (9.8%) |
| 60 to 64 Years | 22 (9.8%) | 21 (7.9%) |
| 65 to 69 Years | 16 (7.1%) | 38 (14.3%) |
| 70 to 74 Years | 25 (11.2%) | 35 (13.2%) |
| 75 to 79 Years | 14 (6.2%) | 26 (9.8%) |
| 80 to 84 Years | 9 (4.0%) | 6 (2.3%) |
| 85 Years and over | 10 (4.5%) | 7 (2.6%) |
| Total | 224 (100.0%) | 265 (100.0%) |
Families and Households in Caswell Beach
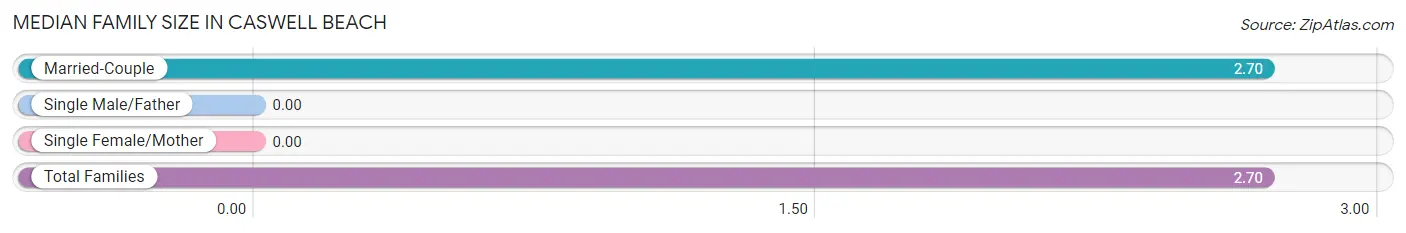
Median Family Size in Caswell Beach
| Family Type | # Families | Family Size |
| Married-Couple | 145 (100.0%) | 2.70 |
| Single Male/Father | 0 (0.0%) | - |
| Single Female/Mother | 0 (0.0%) | - |
| Total Families | 145 (100.0%) | 2.70 |
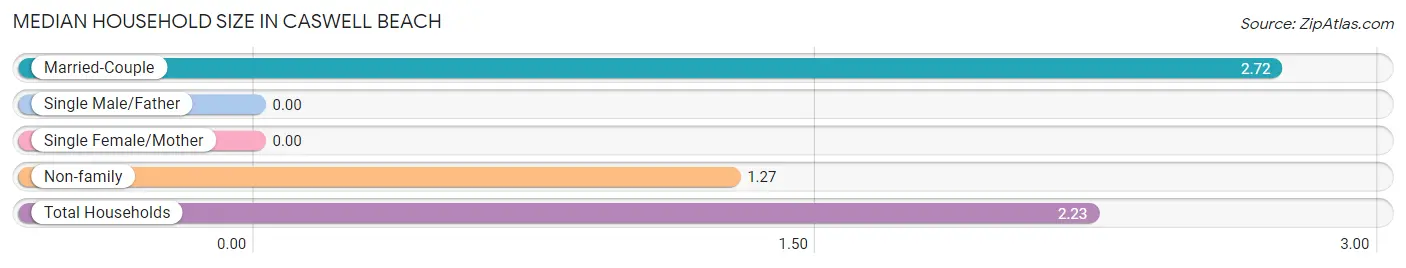
Median Household Size in Caswell Beach
| Household Type | # Households | Household Size |
| Married-Couple | 145 (66.2%) | 2.72 |
| Single Male/Father | 0 (0.0%) | - |
| Single Female/Mother | 0 (0.0%) | - |
| Non-family | 74 (33.8%) | 1.27 |
| Total Households | 219 (100.0%) | 2.23 |
Household Size by Marriage Status in Caswell Beach
Out of a total of 219 households in Caswell Beach, 145 (66.2%) are family households, while 74 (33.8%) are nonfamily households. The most numerous type of family households are 2-person households, comprising 98, and the most common type of nonfamily households are 1-person households, comprising 56.
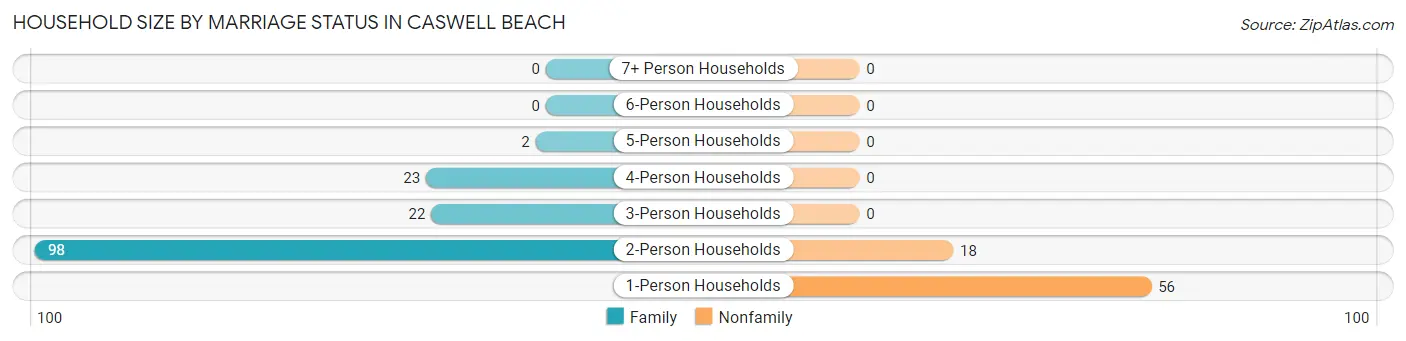
| Household Size | Family Households | Nonfamily Households |
| 1-Person Households | - | 56 (25.6%) |
| 2-Person Households | 98 (44.8%) | 18 (8.2%) |
| 3-Person Households | 22 (10.1%) | 0 (0.0%) |
| 4-Person Households | 23 (10.5%) | 0 (0.0%) |
| 5-Person Households | 2 (0.9%) | 0 (0.0%) |
| 6-Person Households | 0 (0.0%) | 0 (0.0%) |
| 7+ Person Households | 0 (0.0%) | 0 (0.0%) |
| Total | 145 (66.2%) | 74 (33.8%) |
Female Fertility in Caswell Beach
Fertility by Age in Caswell Beach
Average fertility rate in Caswell Beach is 11.0 births per 1,000 women. Women in the age bracket of 35 to 50 years have the highest fertility rate with 13.0 births per 1,000 women. Women in the age bracket of 35 to 50 years acount for 100.0% of all women with births.
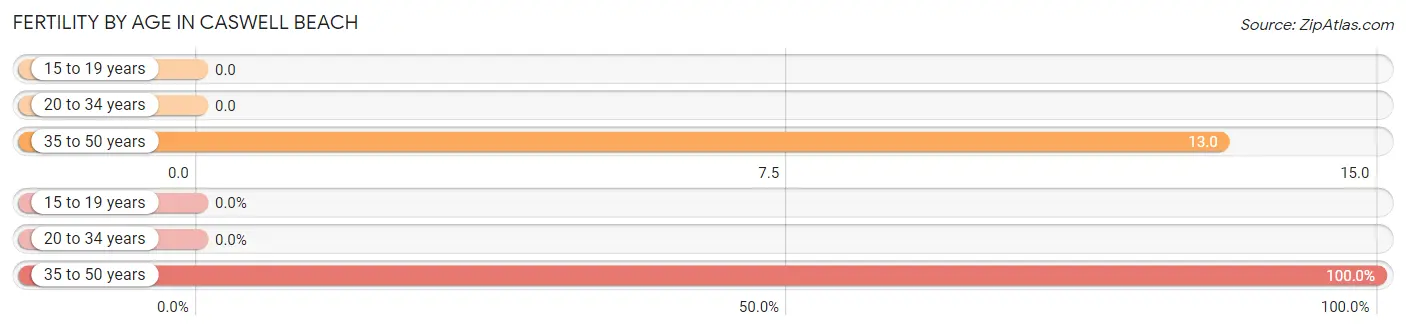
| Age Bracket | Women with Births | Births / 1,000 Women |
| 15 to 19 years | 0 (0.0%) | 0.0 |
| 20 to 34 years | 0 (0.0%) | 0.0 |
| 35 to 50 years | 1 (100.0%) | 13.0 |
| Total | 1 (100.0%) | 11.0 |
Fertility by Age by Marriage Status in Caswell Beach
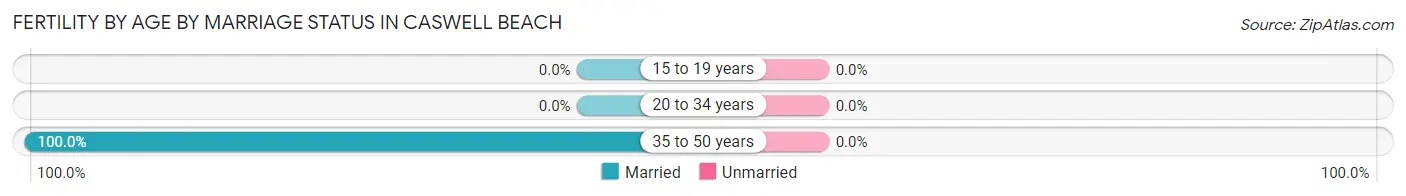
| Age Bracket | Married | Unmarried |
| 15 to 19 years | 0 (0.0%) | 0 (0.0%) |
| 20 to 34 years | 0 (0.0%) | 0 (0.0%) |
| 35 to 50 years | 1 (100.0%) | 0 (0.0%) |
| Total | 1 (100.0%) | 0 (0.0%) |
Fertility by Education in Caswell Beach
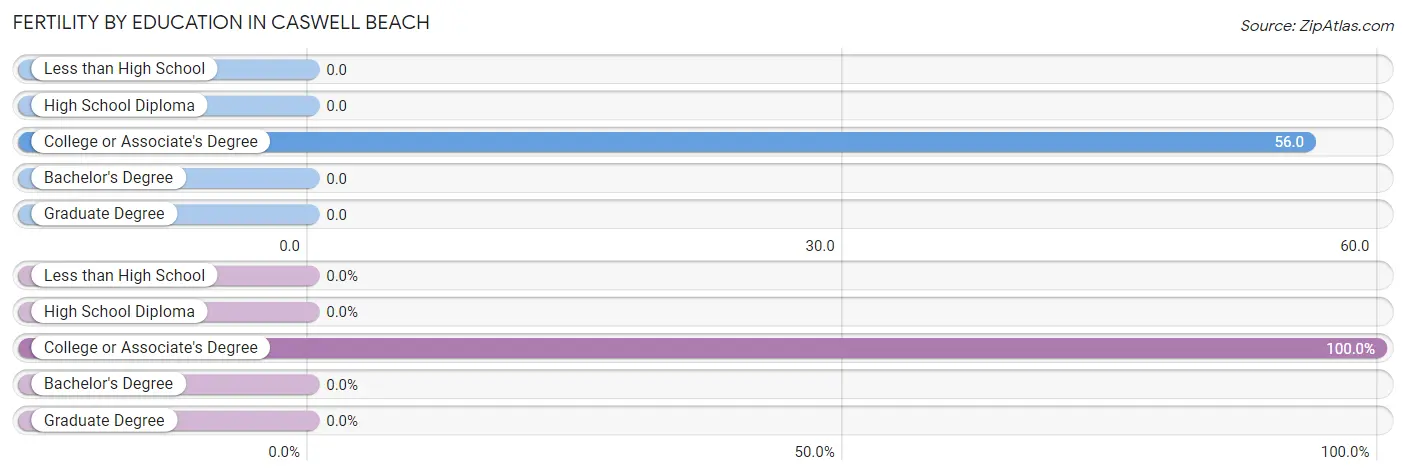
| Educational Attainment | Women with Births | Births / 1,000 Women |
| Less than High School | 0 (0.0%) | 0.0 |
| High School Diploma | 0 (0.0%) | 0.0 |
| College or Associate's Degree | 1 (100.0%) | 56.0 |
| Bachelor's Degree | 0 (0.0%) | 0.0 |
| Graduate Degree | 0 (0.0%) | 0.0 |
| Total | 1 (100.0%) | 11.0 |
Fertility by Education by Marriage Status in Caswell Beach
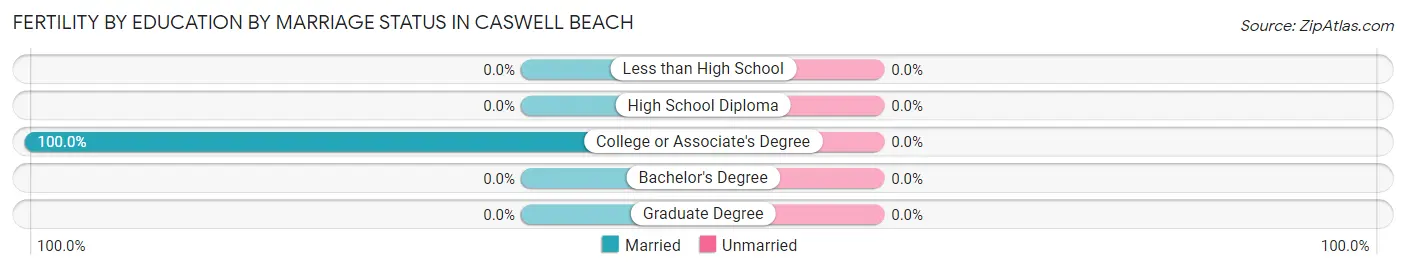
| Educational Attainment | Married | Unmarried |
| Less than High School | 0 (0.0%) | 0 (0.0%) |
| High School Diploma | 0 (0.0%) | 0 (0.0%) |
| College or Associate's Degree | 1 (100.0%) | 0 (0.0%) |
| Bachelor's Degree | 0 (0.0%) | 0 (0.0%) |
| Graduate Degree | 0 (0.0%) | 0 (0.0%) |
| Total | 1 (100.0%) | 0 (0.0%) |
Employment Characteristics in Caswell Beach
Employment by Class of Employer in Caswell Beach
Among the 224 employed individuals in Caswell Beach, private company employees (183 | 81.7%), local government employees (12 | 5.4%), and state government employees (9 | 4.0%) make up the most common classes of employment.
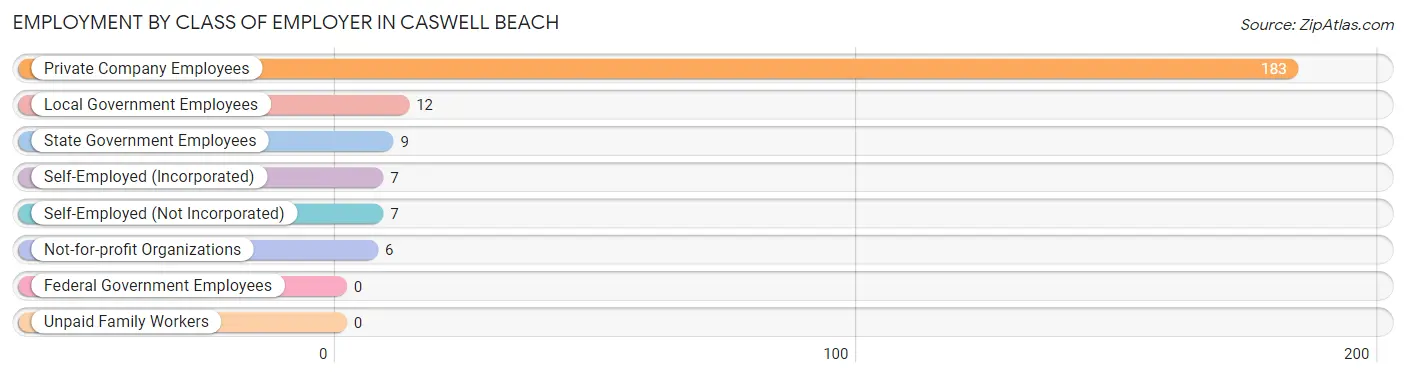
| Employer Class | # Employees | % Employees |
| Private Company Employees | 183 | 81.7% |
| Self-Employed (Incorporated) | 7 | 3.1% |
| Self-Employed (Not Incorporated) | 7 | 3.1% |
| Not-for-profit Organizations | 6 | 2.7% |
| Local Government Employees | 12 | 5.4% |
| State Government Employees | 9 | 4.0% |
| Federal Government Employees | 0 | 0.0% |
| Unpaid Family Workers | 0 | 0.0% |
| Total | 224 | 100.0% |
Employment Status by Age in Caswell Beach
According to the labor force statistics for Caswell Beach, out of the total population over 16 years of age (462), 48.9% or 226 individuals are in the labor force, with 0.9% or 2 of them unemployed. The age group with the highest labor force participation rate is 25 to 29 years, with 100.0% or 9 individuals in the labor force. Within the labor force, the 25 to 29 years age range has the highest percentage of unemployed individuals, with 22.2% or 2 of them being unemployed.
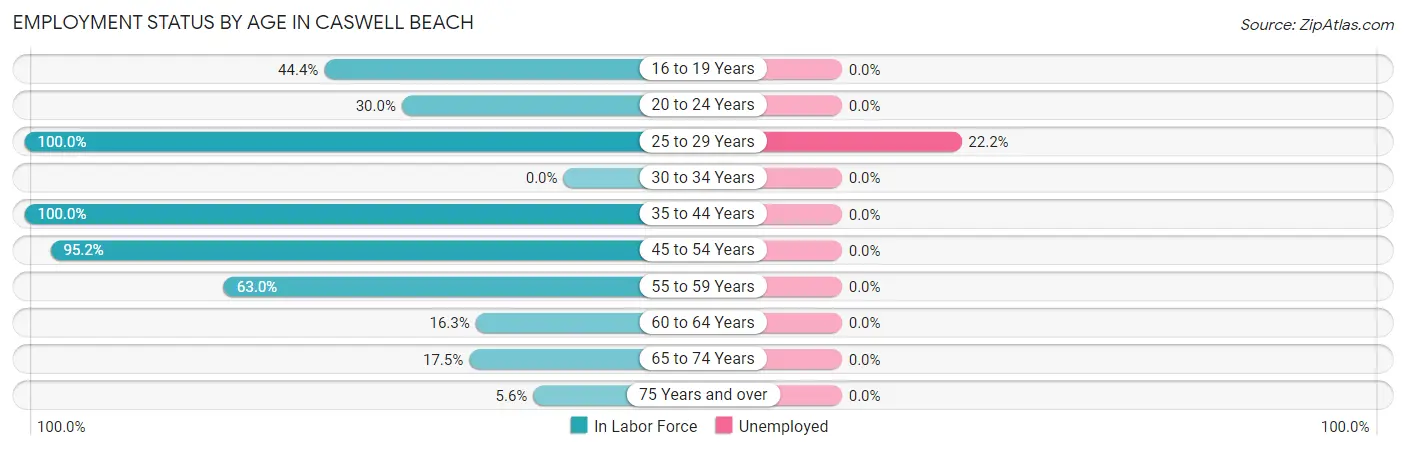
| Age Bracket | In Labor Force | Unemployed |
| 16 to 19 Years | 4 (44.4%) | 0 (0.0%) |
| 20 to 24 Years | 3 (30.0%) | 0 (0.0%) |
| 25 to 29 Years | 9 (100.0%) | 2 (22.2%) |
| 30 to 34 Years | 0 (0.0%) | 0 (0.0%) |
| 35 to 44 Years | 27 (100.0%) | 0 (0.0%) |
| 45 to 54 Years | 118 (95.2%) | 0 (0.0%) |
| 55 to 59 Years | 34 (63.0%) | 0 (0.0%) |
| 60 to 64 Years | 7 (16.3%) | 0 (0.0%) |
| 65 to 74 Years | 20 (17.5%) | 0 (0.0%) |
| 75 Years and over | 4 (5.6%) | 0 (0.0%) |
| Total | 226 (48.9%) | 2 (0.9%) |
Employment Status by Educational Attainment in Caswell Beach
According to labor force statistics for Caswell Beach, 75.9% of individuals (195) out of the total population between 25 and 64 years of age (257) are in the labor force, with 1.0% or 2 of them being unemployed. The group with the highest labor force participation rate are those with the educational attainment of bachelor's degree or higher, with 80.7% or 121 individuals in the labor force. Within the labor force, individuals with bachelor's degree or higher education have the highest percentage of unemployment, with 1.7% or 2 of them being unemployed.
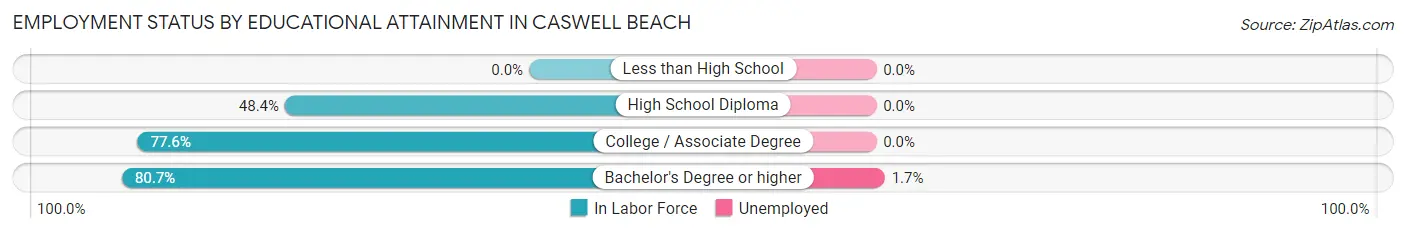
| Educational Attainment | In Labor Force | Unemployed |
| Less than High School | 0 (0.0%) | 0 (0.0%) |
| High School Diploma | 15 (48.4%) | 0 (0.0%) |
| College / Associate Degree | 59 (77.6%) | 0 (0.0%) |
| Bachelor's Degree or higher | 121 (80.7%) | 3 (1.7%) |
| Total | 195 (75.9%) | 3 (1.0%) |
Employment Occupations by Sex in Caswell Beach
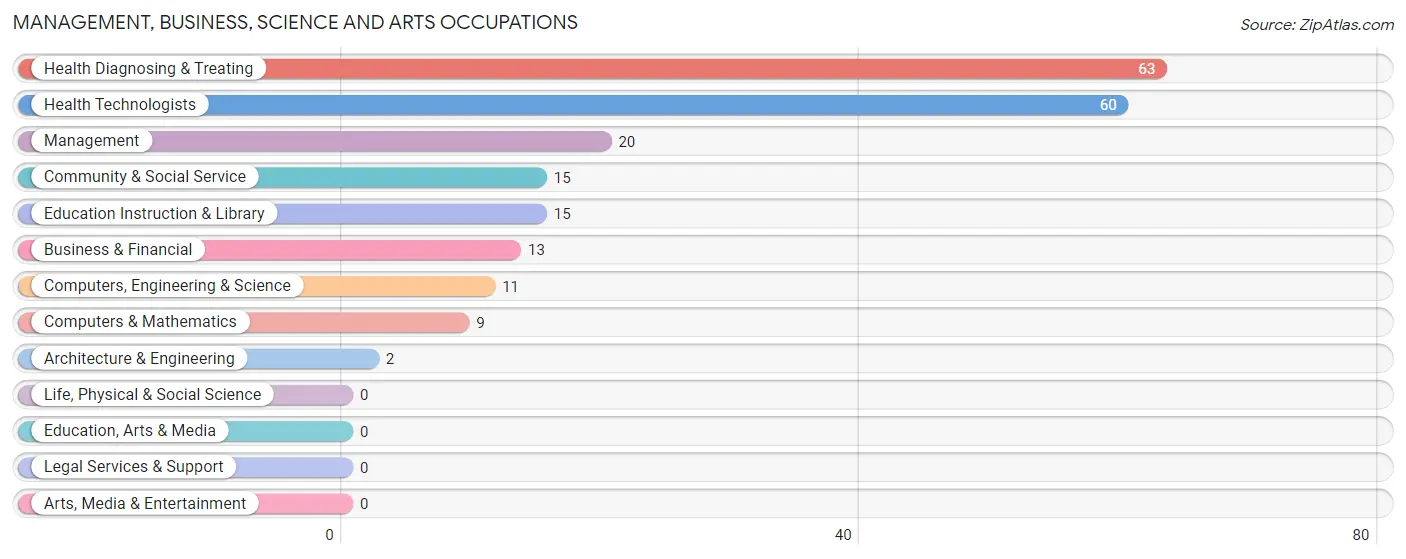
Management, Business, Science and Arts Occupations
The most common Management, Business, Science and Arts occupations in Caswell Beach are Health Diagnosing & Treating (63 | 28.1%), Health Technologists (60 | 26.8%), Management (20 | 8.9%), Community & Social Service (15 | 6.7%), and Education Instruction & Library (15 | 6.7%).
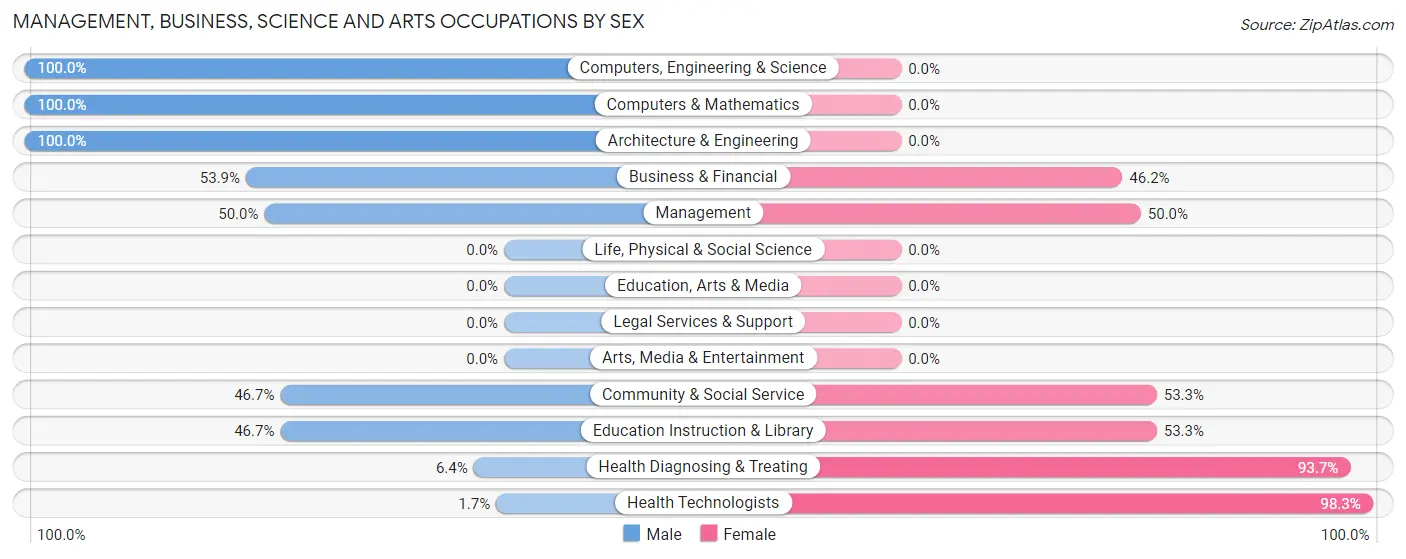
Management, Business, Science and Arts Occupations by Sex
Within the Management, Business, Science and Arts occupations in Caswell Beach, the most male-oriented occupations are Computers, Engineering & Science (100.0%), Computers & Mathematics (100.0%), and Architecture & Engineering (100.0%), while the most female-oriented occupations are Health Technologists (98.3%), Health Diagnosing & Treating (93.6%), and Community & Social Service (53.3%).
| Occupation | Male | Female |
| Management | 10 (50.0%) | 10 (50.0%) |
| Business & Financial | 7 (53.8%) | 6 (46.2%) |
| Computers, Engineering & Science | 11 (100.0%) | 0 (0.0%) |
| Computers & Mathematics | 9 (100.0%) | 0 (0.0%) |
| Architecture & Engineering | 2 (100.0%) | 0 (0.0%) |
| Life, Physical & Social Science | 0 (0.0%) | 0 (0.0%) |
| Community & Social Service | 7 (46.7%) | 8 (53.3%) |
| Education, Arts & Media | 0 (0.0%) | 0 (0.0%) |
| Legal Services & Support | 0 (0.0%) | 0 (0.0%) |
| Education Instruction & Library | 7 (46.7%) | 8 (53.3%) |
| Arts, Media & Entertainment | 0 (0.0%) | 0 (0.0%) |
| Health Diagnosing & Treating | 4 (6.4%) | 59 (93.6%) |
| Health Technologists | 1 (1.7%) | 59 (98.3%) |
| Total (Category) | 39 (32.0%) | 83 (68.0%) |
| Total (Overall) | 106 (47.3%) | 118 (52.7%) |
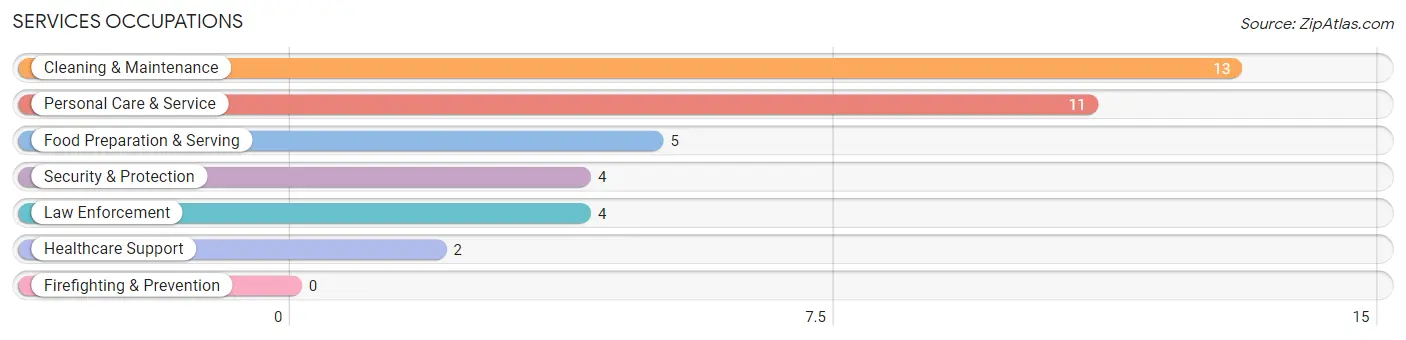
Services Occupations
The most common Services occupations in Caswell Beach are Cleaning & Maintenance (13 | 5.8%), Personal Care & Service (11 | 4.9%), Food Preparation & Serving (5 | 2.2%), Security & Protection (4 | 1.8%), and Law Enforcement (4 | 1.8%).
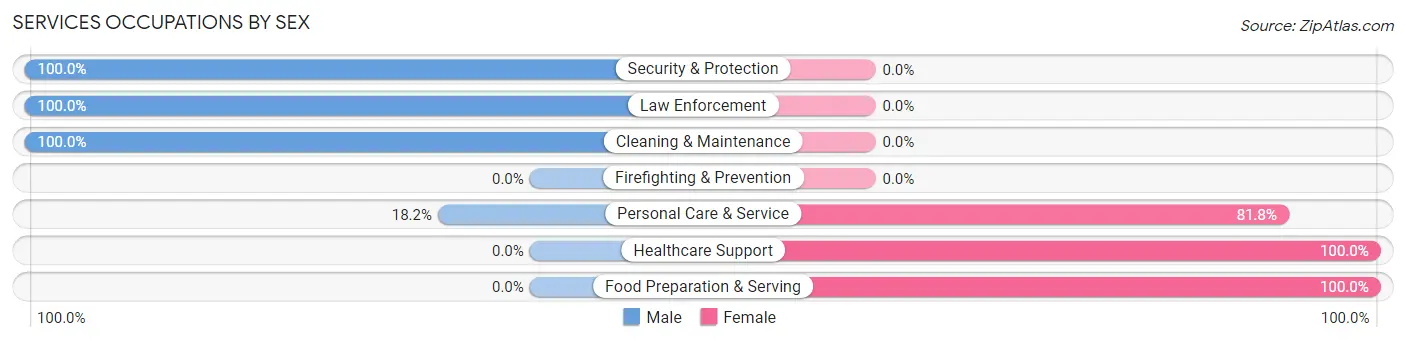
Services Occupations by Sex
Within the Services occupations in Caswell Beach, the most male-oriented occupations are Security & Protection (100.0%), Law Enforcement (100.0%), and Cleaning & Maintenance (100.0%), while the most female-oriented occupations are Healthcare Support (100.0%), Food Preparation & Serving (100.0%), and Personal Care & Service (81.8%).
| Occupation | Male | Female |
| Healthcare Support | 0 (0.0%) | 2 (100.0%) |
| Security & Protection | 4 (100.0%) | 0 (0.0%) |
| Firefighting & Prevention | 0 (0.0%) | 0 (0.0%) |
| Law Enforcement | 4 (100.0%) | 0 (0.0%) |
| Food Preparation & Serving | 0 (0.0%) | 5 (100.0%) |
| Cleaning & Maintenance | 13 (100.0%) | 0 (0.0%) |
| Personal Care & Service | 2 (18.2%) | 9 (81.8%) |
| Total (Category) | 19 (54.3%) | 16 (45.7%) |
| Total (Overall) | 106 (47.3%) | 118 (52.7%) |
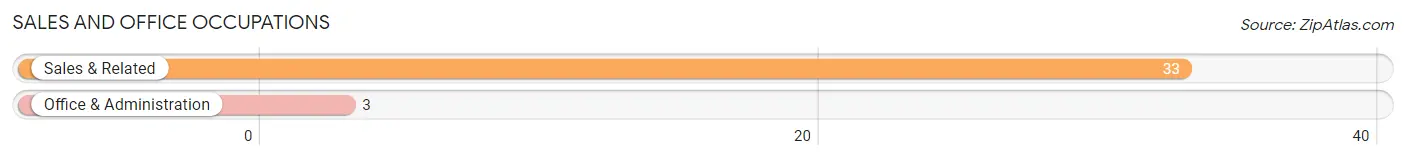
Sales and Office Occupations
The most common Sales and Office occupations in Caswell Beach are Sales & Related (33 | 14.7%), and Office & Administration (3 | 1.3%).
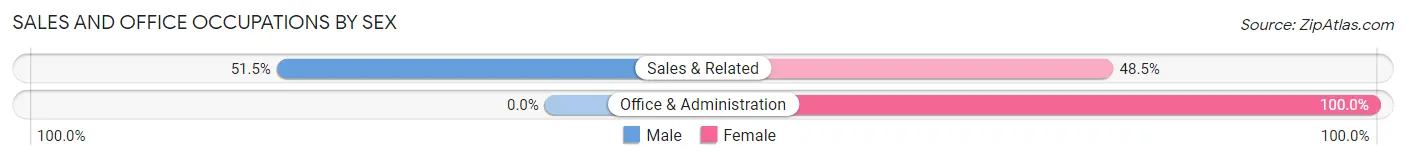
Sales and Office Occupations by Sex
| Occupation | Male | Female |
| Sales & Related | 17 (51.5%) | 16 (48.5%) |
| Office & Administration | 0 (0.0%) | 3 (100.0%) |
| Total (Category) | 17 (47.2%) | 19 (52.8%) |
| Total (Overall) | 106 (47.3%) | 118 (52.7%) |
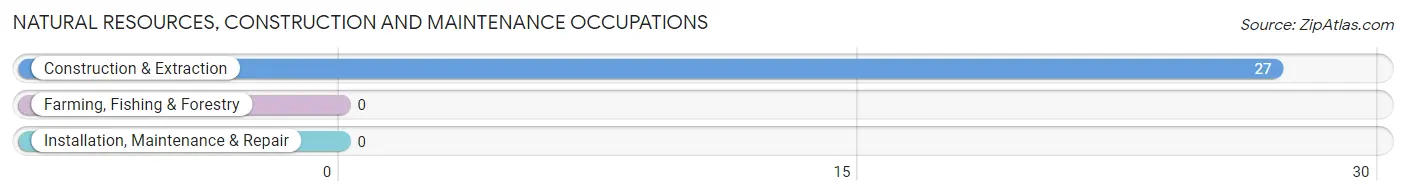
Natural Resources, Construction and Maintenance Occupations
The most common Natural Resources, Construction and Maintenance occupations in Caswell Beach are , and Construction & Extraction (27 | 12.0%).
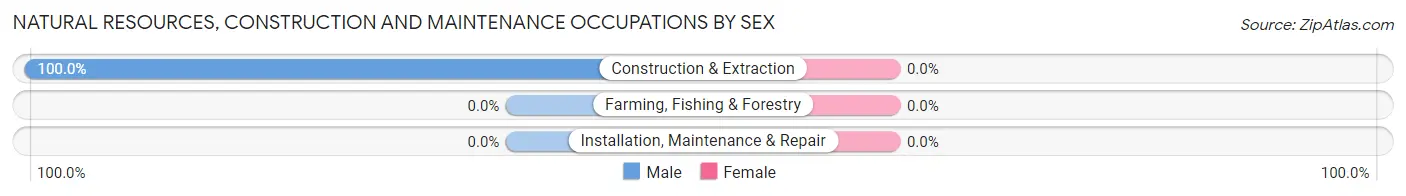
Natural Resources, Construction and Maintenance Occupations by Sex
| Occupation | Male | Female |
| Farming, Fishing & Forestry | 0 (0.0%) | 0 (0.0%) |
| Construction & Extraction | 27 (100.0%) | 0 (0.0%) |
| Installation, Maintenance & Repair | 0 (0.0%) | 0 (0.0%) |
| Total (Category) | 27 (100.0%) | 0 (0.0%) |
| Total (Overall) | 106 (47.3%) | 118 (52.7%) |
Production, Transportation and Moving Occupations
The most common Production, Transportation and Moving occupations in Caswell Beach are Transportation (2 | 0.9%), and Material Moving (2 | 0.9%).
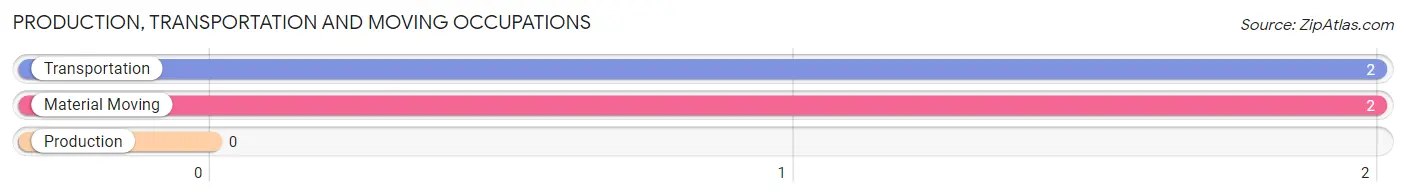
Production, Transportation and Moving Occupations by Sex
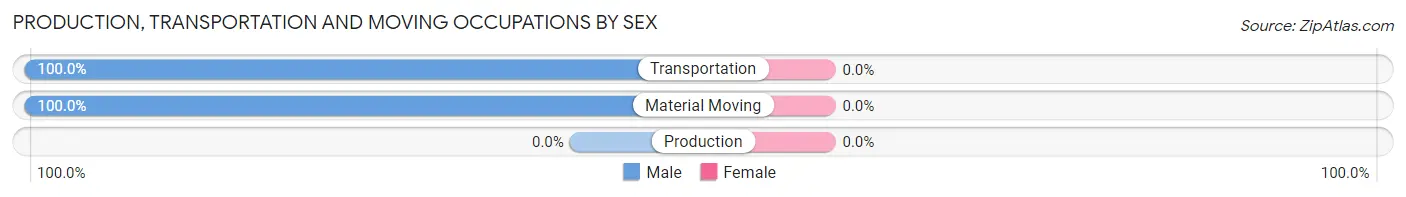
| Occupation | Male | Female |
| Production | 0 (0.0%) | 0 (0.0%) |
| Transportation | 2 (100.0%) | 0 (0.0%) |
| Material Moving | 2 (100.0%) | 0 (0.0%) |
| Total (Category) | 4 (100.0%) | 0 (0.0%) |
| Total (Overall) | 106 (47.3%) | 118 (52.7%) |
Employment Industries by Sex in Caswell Beach
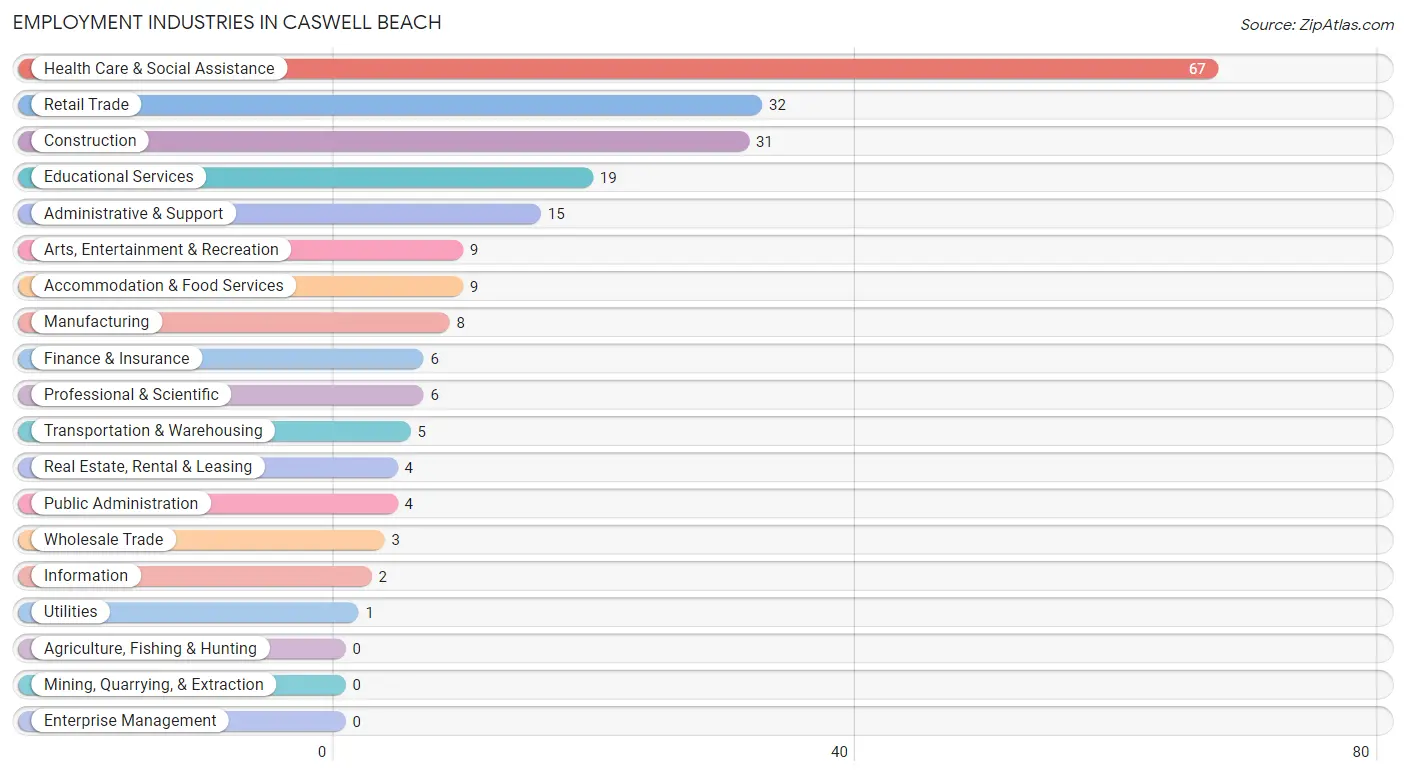
Employment Industries in Caswell Beach
The major employment industries in Caswell Beach include Health Care & Social Assistance (67 | 29.9%), Retail Trade (32 | 14.3%), Construction (31 | 13.8%), Educational Services (19 | 8.5%), and Administrative & Support (15 | 6.7%).
Employment Industries by Sex in Caswell Beach
The Caswell Beach industries that see more men than women are Transportation & Warehousing (100.0%), Information (100.0%), and Real Estate, Rental & Leasing (100.0%), whereas the industries that tend to have a higher number of women are Wholesale Trade (100.0%), Utilities (100.0%), and Health Care & Social Assistance (94.0%).
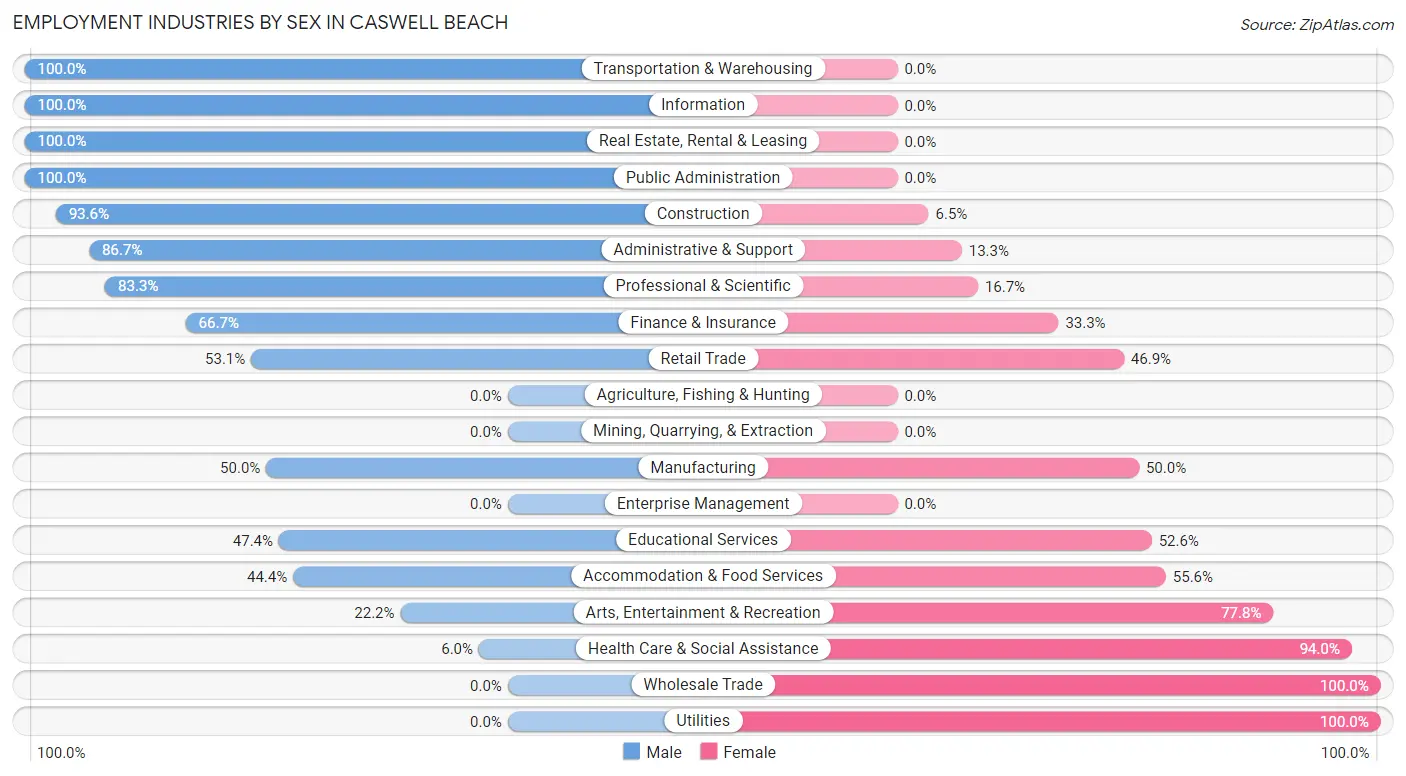
| Industry | Male | Female |
| Agriculture, Fishing & Hunting | 0 (0.0%) | 0 (0.0%) |
| Mining, Quarrying, & Extraction | 0 (0.0%) | 0 (0.0%) |
| Construction | 29 (93.5%) | 2 (6.5%) |
| Manufacturing | 4 (50.0%) | 4 (50.0%) |
| Wholesale Trade | 0 (0.0%) | 3 (100.0%) |
| Retail Trade | 17 (53.1%) | 15 (46.9%) |
| Transportation & Warehousing | 5 (100.0%) | 0 (0.0%) |
| Utilities | 0 (0.0%) | 1 (100.0%) |
| Information | 2 (100.0%) | 0 (0.0%) |
| Finance & Insurance | 4 (66.7%) | 2 (33.3%) |
| Real Estate, Rental & Leasing | 4 (100.0%) | 0 (0.0%) |
| Professional & Scientific | 5 (83.3%) | 1 (16.7%) |
| Enterprise Management | 0 (0.0%) | 0 (0.0%) |
| Administrative & Support | 13 (86.7%) | 2 (13.3%) |
| Educational Services | 9 (47.4%) | 10 (52.6%) |
| Health Care & Social Assistance | 4 (6.0%) | 63 (94.0%) |
| Arts, Entertainment & Recreation | 2 (22.2%) | 7 (77.8%) |
| Accommodation & Food Services | 4 (44.4%) | 5 (55.6%) |
| Public Administration | 4 (100.0%) | 0 (0.0%) |
| Total | 106 (47.3%) | 118 (52.7%) |
Education in Caswell Beach
School Enrollment in Caswell Beach
The most common levels of schooling among the 57 students in Caswell Beach are high school (25 | 43.9%), college / undergraduate (18 | 31.6%), and middle school (5 | 8.8%).
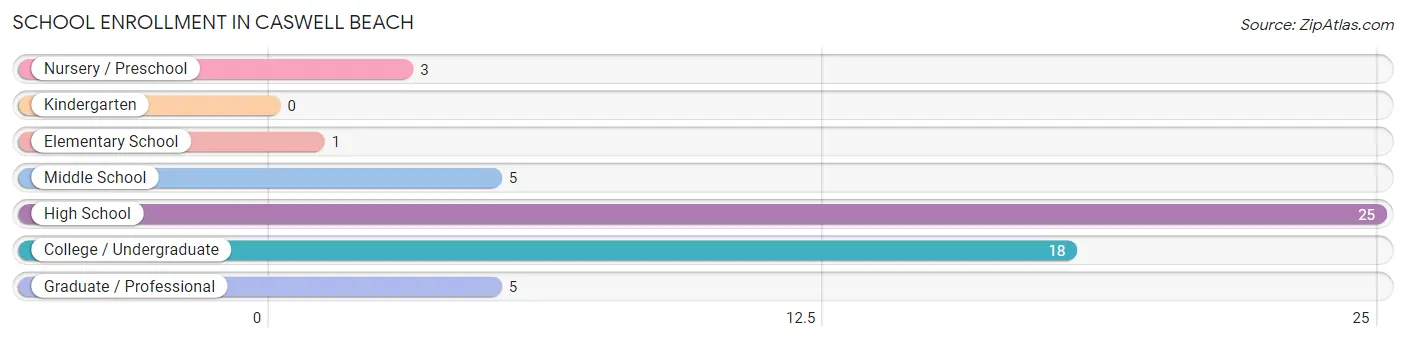
| School Level | # Students | % Students |
| Nursery / Preschool | 3 | 5.3% |
| Kindergarten | 0 | 0.0% |
| Elementary School | 1 | 1.8% |
| Middle School | 5 | 8.8% |
| High School | 25 | 43.9% |
| College / Undergraduate | 18 | 31.6% |
| Graduate / Professional | 5 | 8.8% |
| Total | 57 | 100.0% |
School Enrollment by Age by Funding Source in Caswell Beach
Out of a total of 57 students who are enrolled in schools in Caswell Beach, 8 (14.0%) attend a private institution, while the remaining 49 (86.0%) are enrolled in public schools. The age group of 10 to 14 year olds has the highest likelihood of being enrolled in private schools, with 3 (60.0% in the age bracket) enrolled. Conversely, the age group of 3 to 4 year olds has the lowest likelihood of being enrolled in a private school, with 3 (100.0% in the age bracket) attending a public institution.
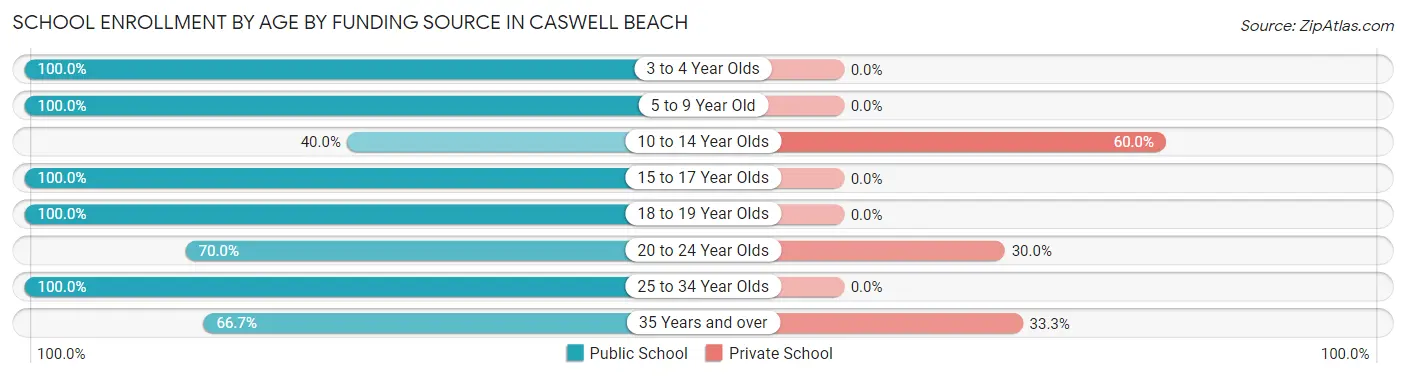
| Age Bracket | Public School | Private School |
| 3 to 4 Year Olds | 3 (100.0%) | 0 (0.0%) |
| 5 to 9 Year Old | 1 (100.0%) | 0 (0.0%) |
| 10 to 14 Year Olds | 2 (40.0%) | 3 (60.0%) |
| 15 to 17 Year Olds | 22 (100.0%) | 0 (0.0%) |
| 18 to 19 Year Olds | 5 (100.0%) | 0 (0.0%) |
| 20 to 24 Year Olds | 7 (70.0%) | 3 (30.0%) |
| 25 to 34 Year Olds | 5 (100.0%) | 0 (0.0%) |
| 35 Years and over | 4 (66.7%) | 2 (33.3%) |
| Total | 49 (86.0%) | 8 (14.0%) |
Educational Attainment by Field of Study in Caswell Beach
Science & technology (64 | 24.4%), business (55 | 21.0%), education (34 | 13.0%), social sciences (23 | 8.8%), and visual & performing arts (20 | 7.6%) are the most common fields of study among 262 individuals in Caswell Beach who have obtained a bachelor's degree or higher.
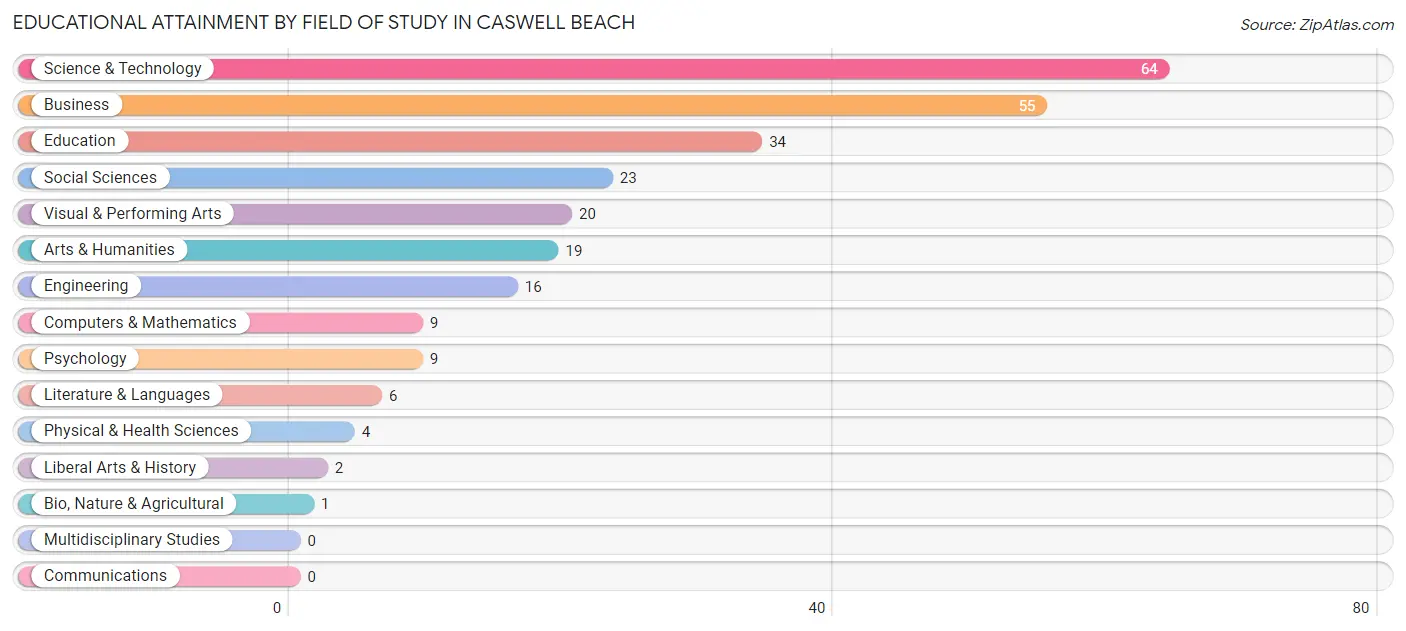
| Field of Study | # Graduates | % Graduates |
| Computers & Mathematics | 9 | 3.4% |
| Bio, Nature & Agricultural | 1 | 0.4% |
| Physical & Health Sciences | 4 | 1.5% |
| Psychology | 9 | 3.4% |
| Social Sciences | 23 | 8.8% |
| Engineering | 16 | 6.1% |
| Multidisciplinary Studies | 0 | 0.0% |
| Science & Technology | 64 | 24.4% |
| Business | 55 | 21.0% |
| Education | 34 | 13.0% |
| Literature & Languages | 6 | 2.3% |
| Liberal Arts & History | 2 | 0.8% |
| Visual & Performing Arts | 20 | 7.6% |
| Communications | 0 | 0.0% |
| Arts & Humanities | 19 | 7.2% |
| Total | 262 | 100.0% |
Transportation & Commute in Caswell Beach
Vehicle Availability by Sex in Caswell Beach
The most prevalent vehicle ownership categories in Caswell Beach are males with 2 vehicles (54, accounting for 50.9%) and females with 2 vehicles (35, making up 45.8%).
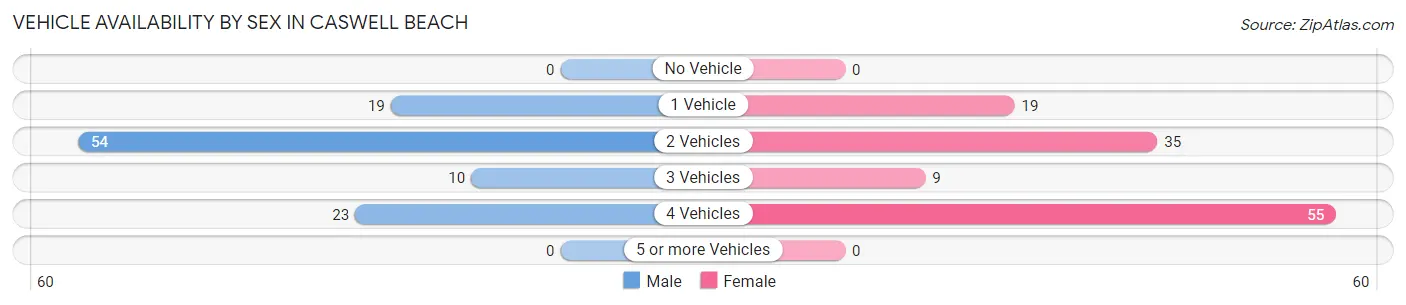
| Vehicles Available | Male | Female |
| No Vehicle | 0 (0.0%) | 0 (0.0%) |
| 1 Vehicle | 19 (17.9%) | 19 (16.1%) |
| 2 Vehicles | 54 (50.9%) | 35 (29.7%) |
| 3 Vehicles | 10 (9.4%) | 9 (7.6%) |
| 4 Vehicles | 23 (21.7%) | 55 (46.6%) |
| 5 or more Vehicles | 0 (0.0%) | 0 (0.0%) |
| Total | 106 (100.0%) | 118 (100.0%) |
Commute Time in Caswell Beach
The most frequently occuring commute durations in Caswell Beach are 10 to 14 minutes (66 commuters, 37.3%), 15 to 19 minutes (48 commuters, 27.1%), and 20 to 24 minutes (17 commuters, 9.6%).
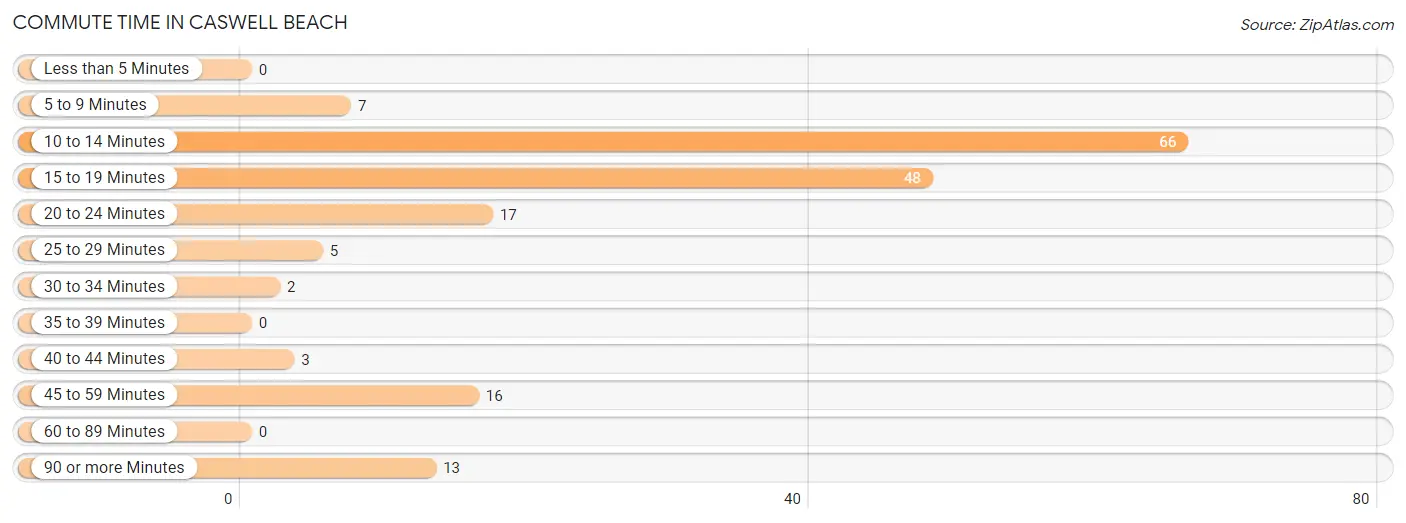
| Commute Time | # Commuters | % Commuters |
| Less than 5 Minutes | 0 | 0.0% |
| 5 to 9 Minutes | 7 | 4.0% |
| 10 to 14 Minutes | 66 | 37.3% |
| 15 to 19 Minutes | 48 | 27.1% |
| 20 to 24 Minutes | 17 | 9.6% |
| 25 to 29 Minutes | 5 | 2.8% |
| 30 to 34 Minutes | 2 | 1.1% |
| 35 to 39 Minutes | 0 | 0.0% |
| 40 to 44 Minutes | 3 | 1.7% |
| 45 to 59 Minutes | 16 | 9.0% |
| 60 to 89 Minutes | 0 | 0.0% |
| 90 or more Minutes | 13 | 7.3% |
Commute Time by Sex in Caswell Beach
The most common commute times in Caswell Beach are 15 to 19 minutes (44 commuters, 54.3%) for males and 10 to 14 minutes (63 commuters, 65.6%) for females.
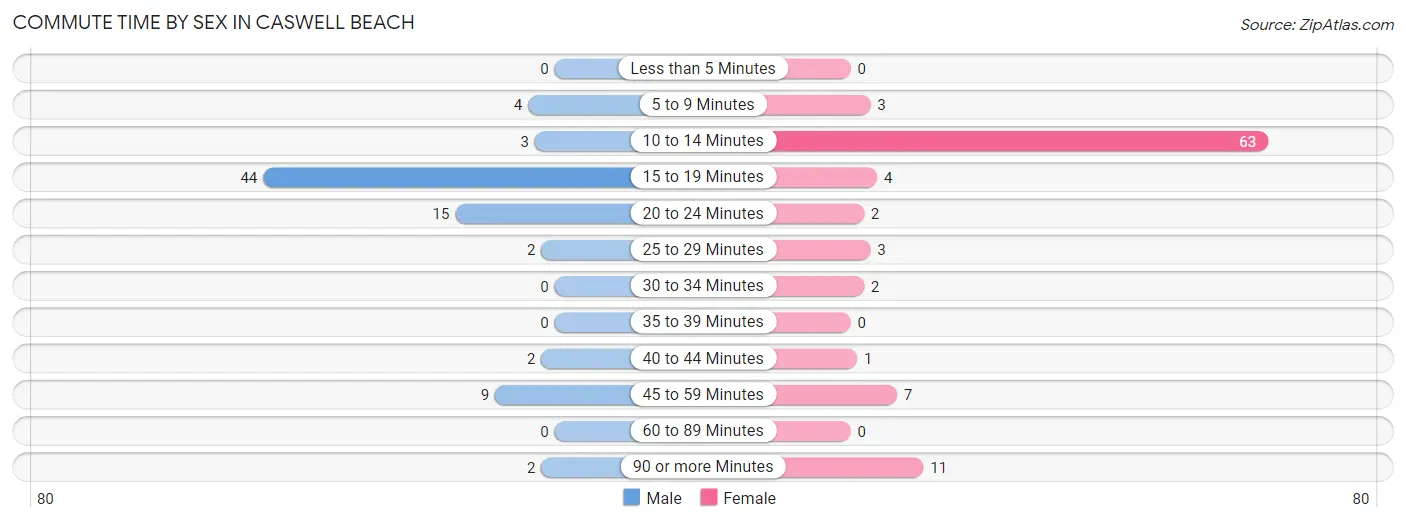
| Commute Time | Male | Female |
| Less than 5 Minutes | 0 (0.0%) | 0 (0.0%) |
| 5 to 9 Minutes | 4 (4.9%) | 3 (3.1%) |
| 10 to 14 Minutes | 3 (3.7%) | 63 (65.6%) |
| 15 to 19 Minutes | 44 (54.3%) | 4 (4.2%) |
| 20 to 24 Minutes | 15 (18.5%) | 2 (2.1%) |
| 25 to 29 Minutes | 2 (2.5%) | 3 (3.1%) |
| 30 to 34 Minutes | 0 (0.0%) | 2 (2.1%) |
| 35 to 39 Minutes | 0 (0.0%) | 0 (0.0%) |
| 40 to 44 Minutes | 2 (2.5%) | 1 (1.0%) |
| 45 to 59 Minutes | 9 (11.1%) | 7 (7.3%) |
| 60 to 89 Minutes | 0 (0.0%) | 0 (0.0%) |
| 90 or more Minutes | 2 (2.5%) | 11 (11.5%) |
Time of Departure to Work by Sex in Caswell Beach
The most frequent times of departure to work in Caswell Beach are 7:00 AM to 7:29 AM (33, 40.7%) for males and 8:00 AM to 8:29 AM (59, 61.5%) for females.
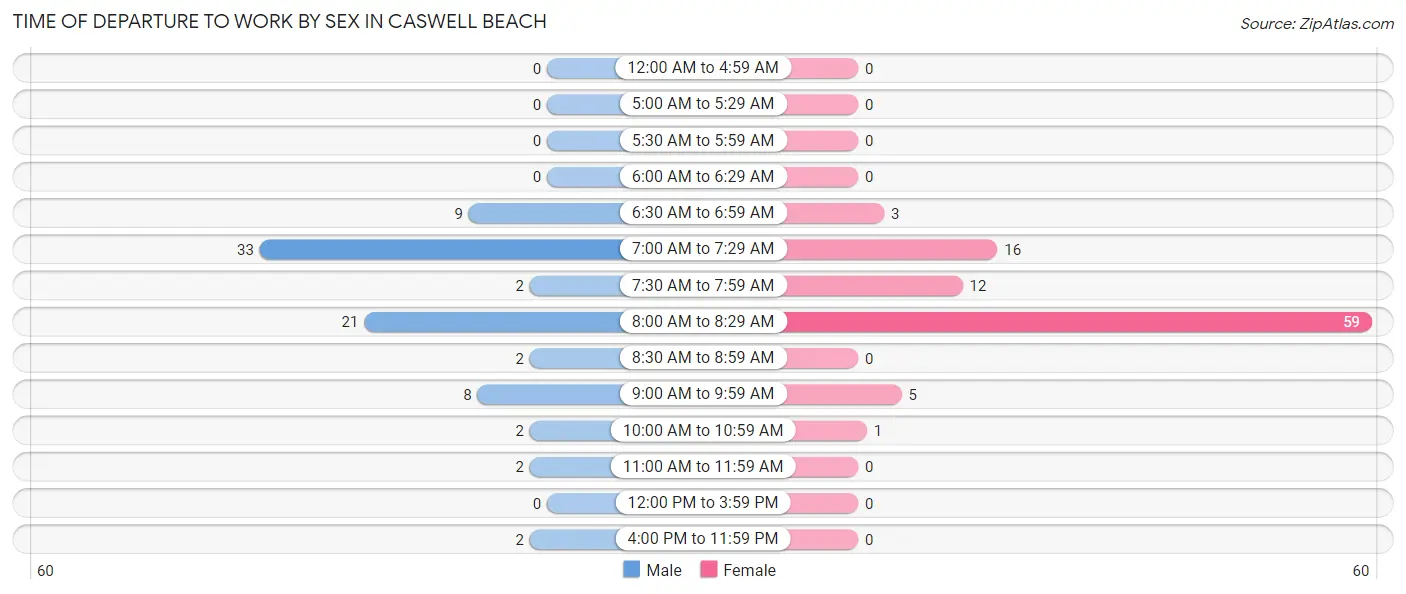
| Time of Departure | Male | Female |
| 12:00 AM to 4:59 AM | 0 (0.0%) | 0 (0.0%) |
| 5:00 AM to 5:29 AM | 0 (0.0%) | 0 (0.0%) |
| 5:30 AM to 5:59 AM | 0 (0.0%) | 0 (0.0%) |
| 6:00 AM to 6:29 AM | 0 (0.0%) | 0 (0.0%) |
| 6:30 AM to 6:59 AM | 9 (11.1%) | 3 (3.1%) |
| 7:00 AM to 7:29 AM | 33 (40.7%) | 16 (16.7%) |
| 7:30 AM to 7:59 AM | 2 (2.5%) | 12 (12.5%) |
| 8:00 AM to 8:29 AM | 21 (25.9%) | 59 (61.5%) |
| 8:30 AM to 8:59 AM | 2 (2.5%) | 0 (0.0%) |
| 9:00 AM to 9:59 AM | 8 (9.9%) | 5 (5.2%) |
| 10:00 AM to 10:59 AM | 2 (2.5%) | 1 (1.0%) |
| 11:00 AM to 11:59 AM | 2 (2.5%) | 0 (0.0%) |
| 12:00 PM to 3:59 PM | 0 (0.0%) | 0 (0.0%) |
| 4:00 PM to 11:59 PM | 2 (2.5%) | 0 (0.0%) |
| Total | 81 (100.0%) | 96 (100.0%) |
Housing Occupancy in Caswell Beach
Occupancy by Ownership in Caswell Beach
Of the total 219 dwellings in Caswell Beach, owner-occupied units account for 210 (95.9%), while renter-occupied units make up 9 (4.1%).
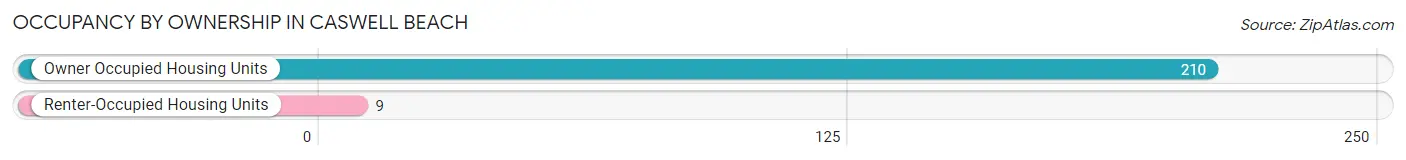
| Occupancy | # Housing Units | % Housing Units |
| Owner Occupied Housing Units | 210 | 95.9% |
| Renter-Occupied Housing Units | 9 | 4.1% |
| Total Occupied Housing Units | 219 | 100.0% |
Occupancy by Household Size in Caswell Beach
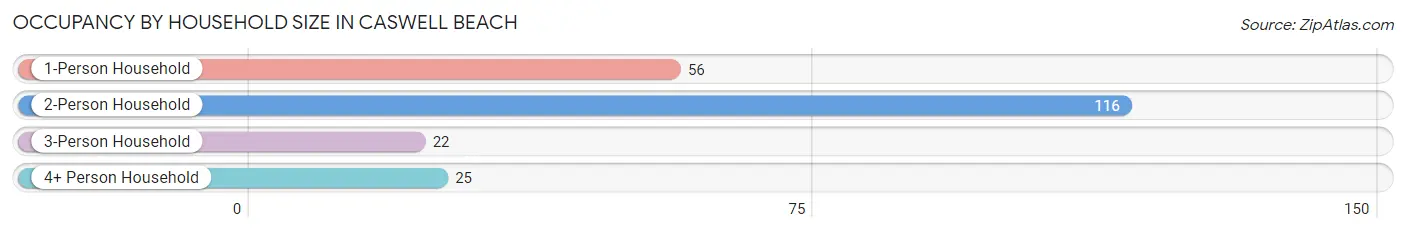
| Household Size | # Housing Units | % Housing Units |
| 1-Person Household | 56 | 25.6% |
| 2-Person Household | 116 | 53.0% |
| 3-Person Household | 22 | 10.1% |
| 4+ Person Household | 25 | 11.4% |
| Total Housing Units | 219 | 100.0% |
Occupancy by Ownership by Household Size in Caswell Beach
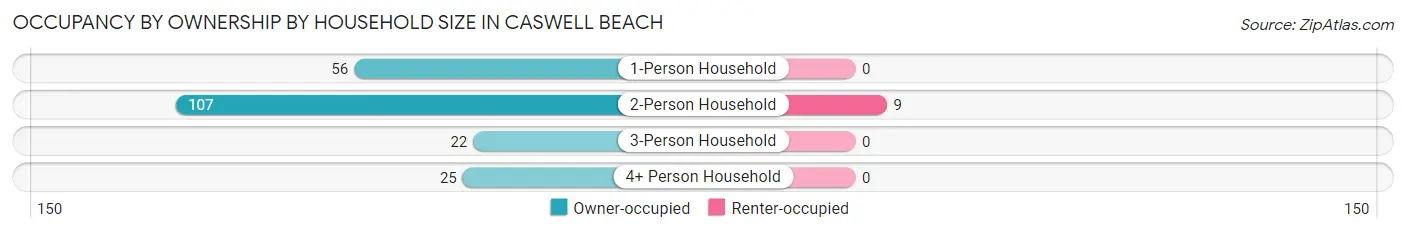
| Household Size | Owner-occupied | Renter-occupied |
| 1-Person Household | 56 (100.0%) | 0 (0.0%) |
| 2-Person Household | 107 (92.2%) | 9 (7.8%) |
| 3-Person Household | 22 (100.0%) | 0 (0.0%) |
| 4+ Person Household | 25 (100.0%) | 0 (0.0%) |
| Total Housing Units | 210 (95.9%) | 9 (4.1%) |
Occupancy by Educational Attainment in Caswell Beach
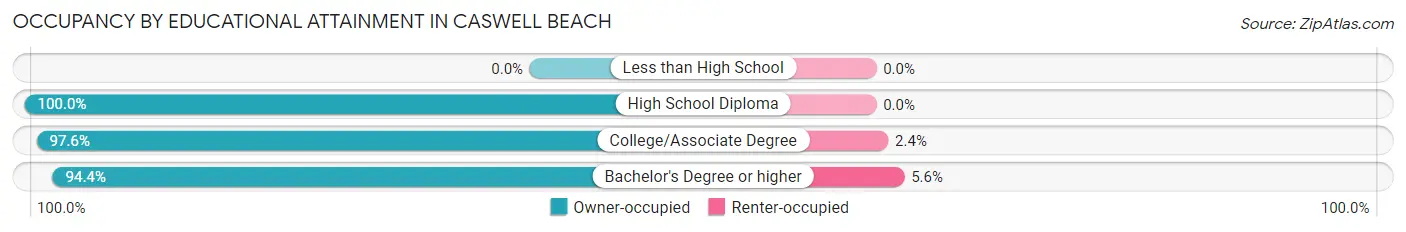
| Household Size | Owner-occupied | Renter-occupied |
| Less than High School | 0 (0.0%) | 0 (0.0%) |
| High School Diploma | 9 (100.0%) | 0 (0.0%) |
| College/Associate Degree | 82 (97.6%) | 2 (2.4%) |
| Bachelor's Degree or higher | 119 (94.4%) | 7 (5.6%) |
Occupancy by Age of Householder in Caswell Beach
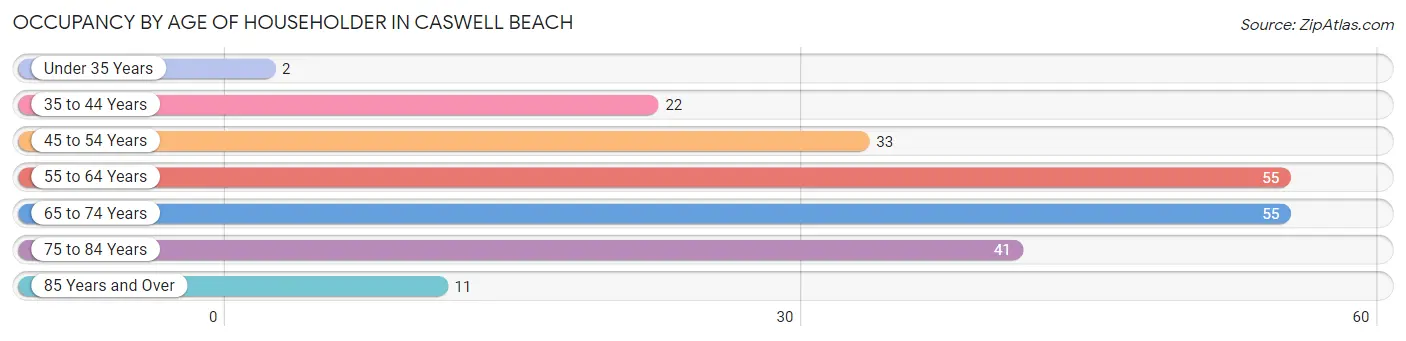
| Age Bracket | # Households | % Households |
| Under 35 Years | 2 | 0.9% |
| 35 to 44 Years | 22 | 10.1% |
| 45 to 54 Years | 33 | 15.1% |
| 55 to 64 Years | 55 | 25.1% |
| 65 to 74 Years | 55 | 25.1% |
| 75 to 84 Years | 41 | 18.7% |
| 85 Years and Over | 11 | 5.0% |
| Total | 219 | 100.0% |
Housing Finances in Caswell Beach
Median Income by Occupancy in Caswell Beach
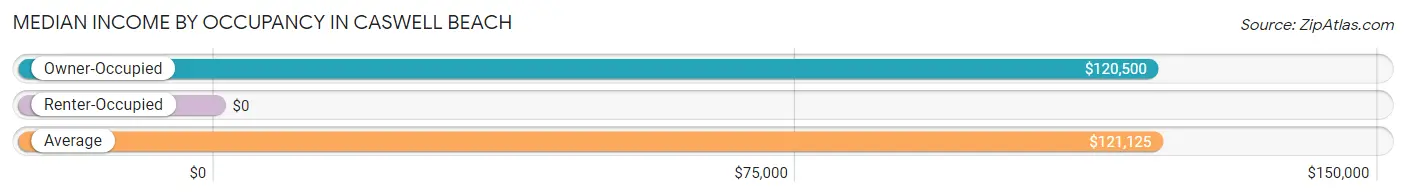
| Occupancy Type | # Households | Median Income |
| Owner-Occupied | 210 (95.9%) | $120,500 |
| Renter-Occupied | 9 (4.1%) | $0 |
| Average | 219 (100.0%) | $121,125 |
Occupancy by Householder Income Bracket in Caswell Beach
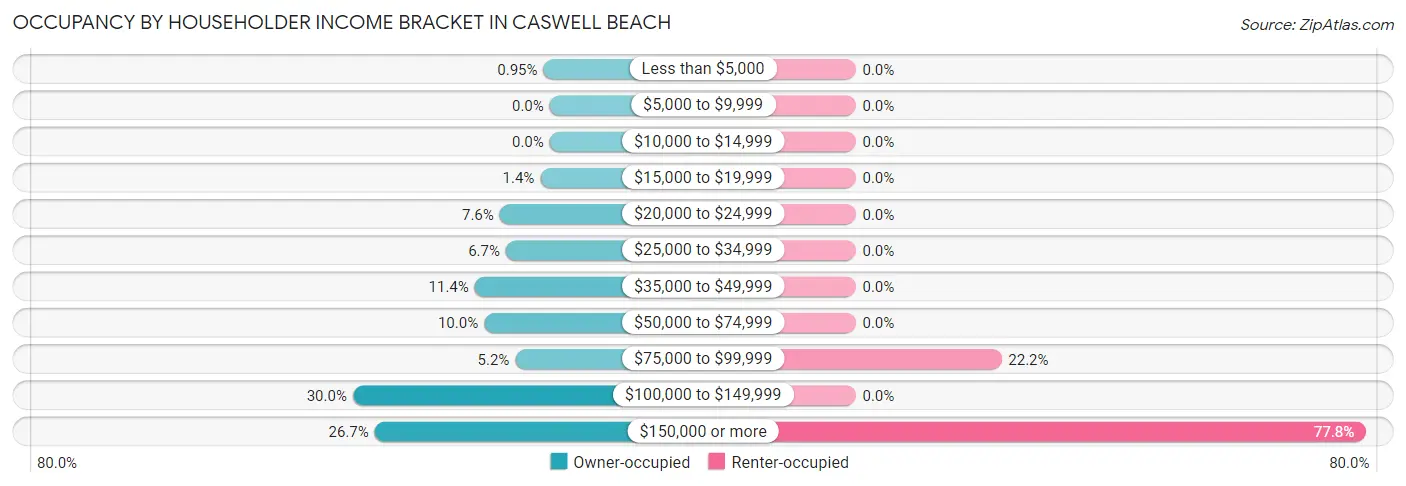
| Income Bracket | Owner-occupied | Renter-occupied |
| Less than $5,000 | 2 (0.9%) | 0 (0.0%) |
| $5,000 to $9,999 | 0 (0.0%) | 0 (0.0%) |
| $10,000 to $14,999 | 0 (0.0%) | 0 (0.0%) |
| $15,000 to $19,999 | 3 (1.4%) | 0 (0.0%) |
| $20,000 to $24,999 | 16 (7.6%) | 0 (0.0%) |
| $25,000 to $34,999 | 14 (6.7%) | 0 (0.0%) |
| $35,000 to $49,999 | 24 (11.4%) | 0 (0.0%) |
| $50,000 to $74,999 | 21 (10.0%) | 0 (0.0%) |
| $75,000 to $99,999 | 11 (5.2%) | 2 (22.2%) |
| $100,000 to $149,999 | 63 (30.0%) | 0 (0.0%) |
| $150,000 or more | 56 (26.7%) | 7 (77.8%) |
| Total | 210 (100.0%) | 9 (100.0%) |
Monthly Housing Cost Tiers in Caswell Beach
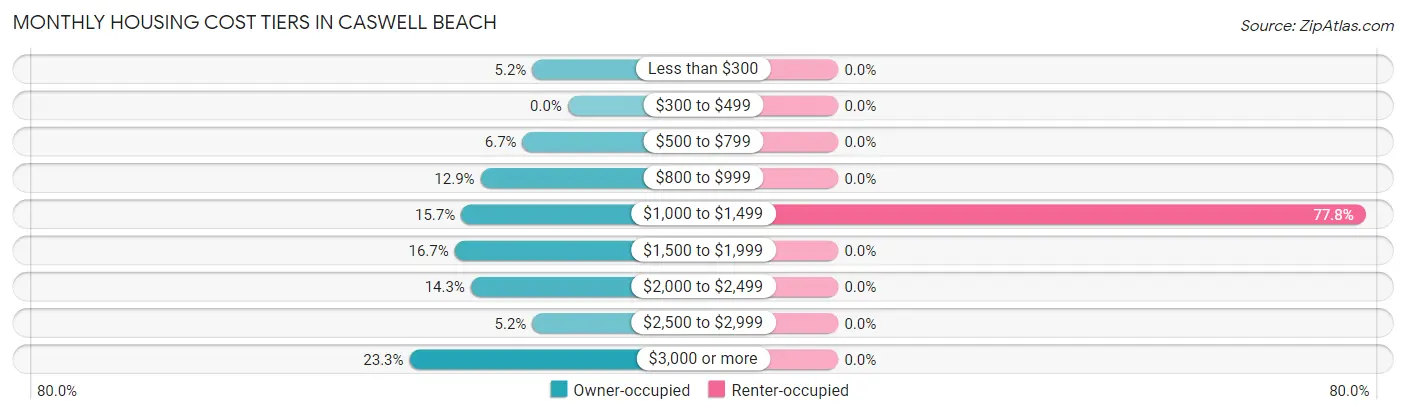
| Monthly Cost | Owner-occupied | Renter-occupied |
| Less than $300 | 11 (5.2%) | 0 (0.0%) |
| $300 to $499 | 0 (0.0%) | 0 (0.0%) |
| $500 to $799 | 14 (6.7%) | 0 (0.0%) |
| $800 to $999 | 27 (12.9%) | 0 (0.0%) |
| $1,000 to $1,499 | 33 (15.7%) | 7 (77.8%) |
| $1,500 to $1,999 | 35 (16.7%) | 0 (0.0%) |
| $2,000 to $2,499 | 30 (14.3%) | 0 (0.0%) |
| $2,500 to $2,999 | 11 (5.2%) | 0 (0.0%) |
| $3,000 or more | 49 (23.3%) | 0 (0.0%) |
| Total | 210 (100.0%) | 9 (100.0%) |
Physical Housing Characteristics in Caswell Beach
Housing Structures in Caswell Beach
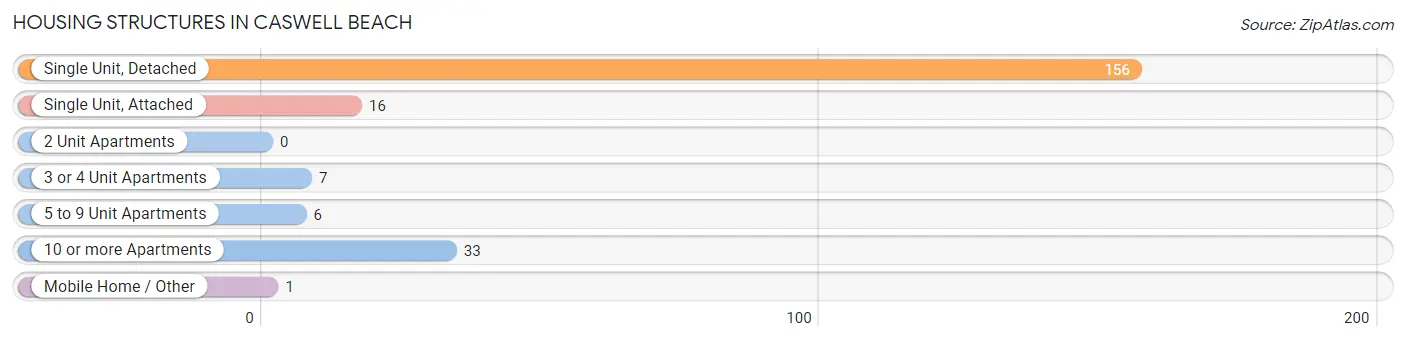
| Structure Type | # Housing Units | % Housing Units |
| Single Unit, Detached | 156 | 71.2% |
| Single Unit, Attached | 16 | 7.3% |
| 2 Unit Apartments | 0 | 0.0% |
| 3 or 4 Unit Apartments | 7 | 3.2% |
| 5 to 9 Unit Apartments | 6 | 2.7% |
| 10 or more Apartments | 33 | 15.1% |
| Mobile Home / Other | 1 | 0.5% |
| Total | 219 | 100.0% |
Housing Structures by Occupancy in Caswell Beach
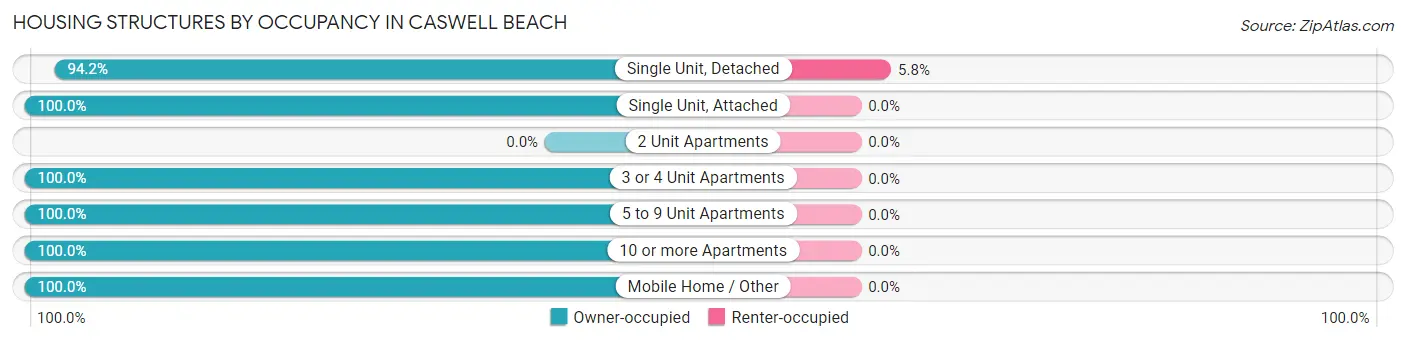
| Structure Type | Owner-occupied | Renter-occupied |
| Single Unit, Detached | 147 (94.2%) | 9 (5.8%) |
| Single Unit, Attached | 16 (100.0%) | 0 (0.0%) |
| 2 Unit Apartments | 0 (0.0%) | 0 (0.0%) |
| 3 or 4 Unit Apartments | 7 (100.0%) | 0 (0.0%) |
| 5 to 9 Unit Apartments | 6 (100.0%) | 0 (0.0%) |
| 10 or more Apartments | 33 (100.0%) | 0 (0.0%) |
| Mobile Home / Other | 1 (100.0%) | 0 (0.0%) |
| Total | 210 (95.9%) | 9 (4.1%) |
Housing Structures by Number of Rooms in Caswell Beach
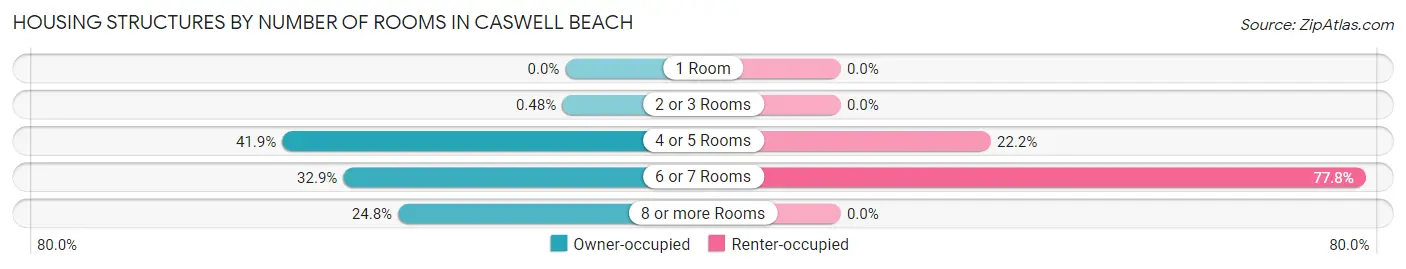
| Number of Rooms | Owner-occupied | Renter-occupied |
| 1 Room | 0 (0.0%) | 0 (0.0%) |
| 2 or 3 Rooms | 1 (0.5%) | 0 (0.0%) |
| 4 or 5 Rooms | 88 (41.9%) | 2 (22.2%) |
| 6 or 7 Rooms | 69 (32.9%) | 7 (77.8%) |
| 8 or more Rooms | 52 (24.8%) | 0 (0.0%) |
| Total | 210 (100.0%) | 9 (100.0%) |
Housing Structure by Heating Type in Caswell Beach
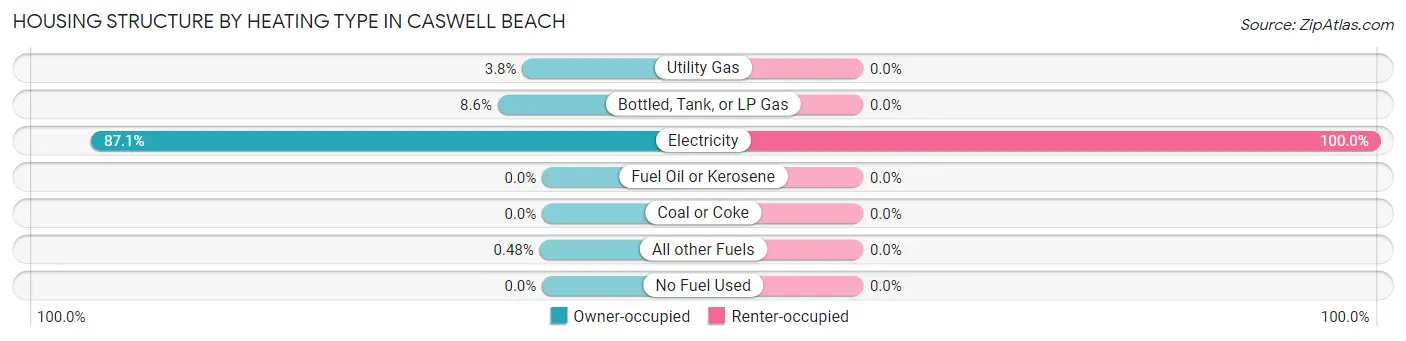
| Heating Type | Owner-occupied | Renter-occupied |
| Utility Gas | 8 (3.8%) | 0 (0.0%) |
| Bottled, Tank, or LP Gas | 18 (8.6%) | 0 (0.0%) |
| Electricity | 183 (87.1%) | 9 (100.0%) |
| Fuel Oil or Kerosene | 0 (0.0%) | 0 (0.0%) |
| Coal or Coke | 0 (0.0%) | 0 (0.0%) |
| All other Fuels | 1 (0.5%) | 0 (0.0%) |
| No Fuel Used | 0 (0.0%) | 0 (0.0%) |
| Total | 210 (100.0%) | 9 (100.0%) |
Household Vehicle Usage in Caswell Beach
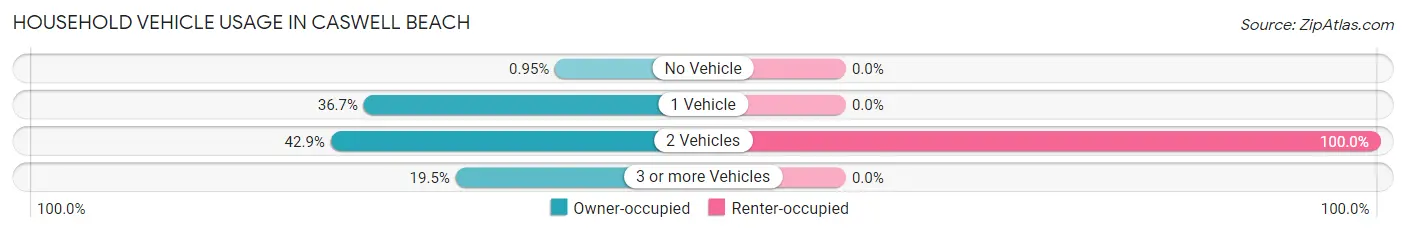
| Vehicles per Household | Owner-occupied | Renter-occupied |
| No Vehicle | 2 (0.9%) | 0 (0.0%) |
| 1 Vehicle | 77 (36.7%) | 0 (0.0%) |
| 2 Vehicles | 90 (42.9%) | 9 (100.0%) |
| 3 or more Vehicles | 41 (19.5%) | 0 (0.0%) |
| Total | 210 (100.0%) | 9 (100.0%) |
Real Estate & Mortgages in Caswell Beach
Real Estate and Mortgage Overview in Caswell Beach
| Characteristic | Without Mortgage | With Mortgage |
| Housing Units | 108 | 102 |
| Median Property Value | $532,300 | $564,100 |
| Median Household Income | $58,750 | $33 |
| Monthly Housing Costs | $1,033 | $49 |
| Real Estate Taxes | $3,400 | $0 |
Property Value by Mortgage Status in Caswell Beach
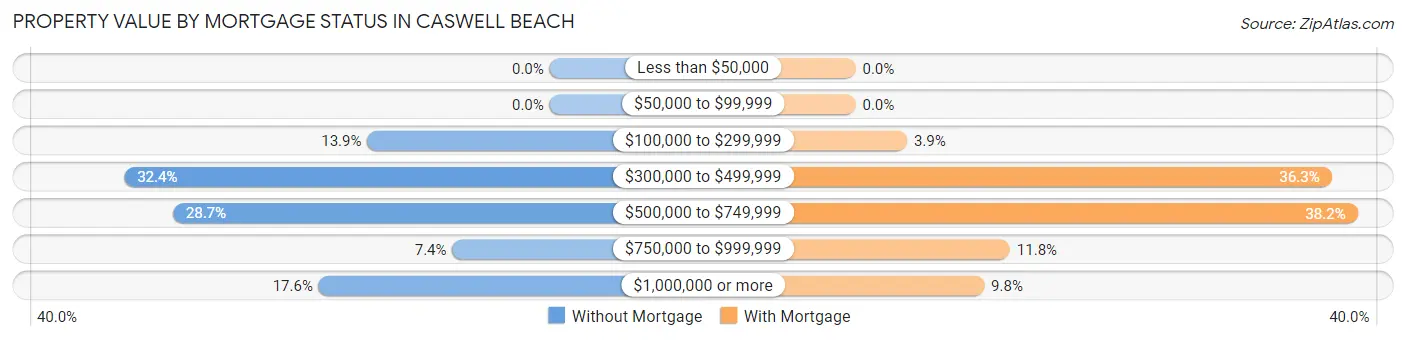
| Property Value | Without Mortgage | With Mortgage |
| Less than $50,000 | 0 (0.0%) | 0 (0.0%) |
| $50,000 to $99,999 | 0 (0.0%) | 0 (0.0%) |
| $100,000 to $299,999 | 15 (13.9%) | 4 (3.9%) |
| $300,000 to $499,999 | 35 (32.4%) | 37 (36.3%) |
| $500,000 to $749,999 | 31 (28.7%) | 39 (38.2%) |
| $750,000 to $999,999 | 8 (7.4%) | 12 (11.8%) |
| $1,000,000 or more | 19 (17.6%) | 10 (9.8%) |
| Total | 108 (100.0%) | 102 (100.0%) |
Household Income by Mortgage Status in Caswell Beach
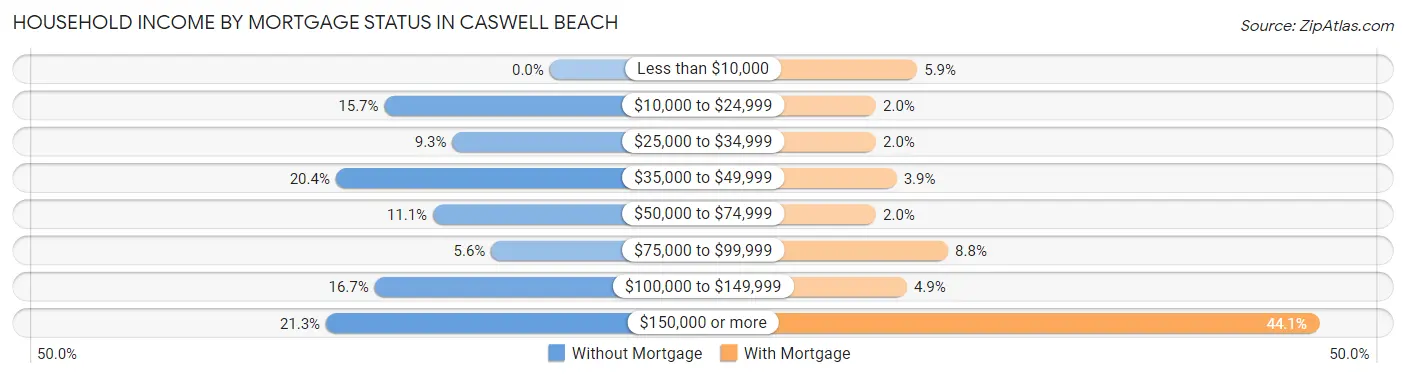
| Household Income | Without Mortgage | With Mortgage |
| Less than $10,000 | 0 (0.0%) | 6 (5.9%) |
| $10,000 to $24,999 | 17 (15.7%) | 2 (2.0%) |
| $25,000 to $34,999 | 10 (9.3%) | 2 (2.0%) |
| $35,000 to $49,999 | 22 (20.4%) | 4 (3.9%) |
| $50,000 to $74,999 | 12 (11.1%) | 2 (2.0%) |
| $75,000 to $99,999 | 6 (5.6%) | 9 (8.8%) |
| $100,000 to $149,999 | 18 (16.7%) | 5 (4.9%) |
| $150,000 or more | 23 (21.3%) | 45 (44.1%) |
| Total | 108 (100.0%) | 102 (100.0%) |
Property Value to Household Income Ratio in Caswell Beach
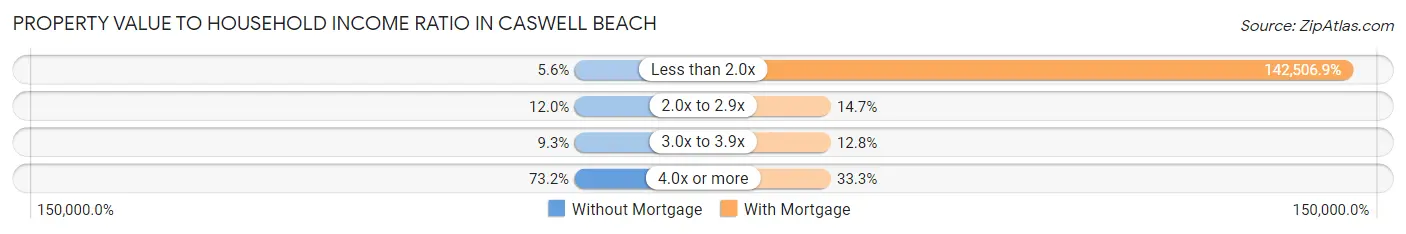
| Value-to-Income Ratio | Without Mortgage | With Mortgage |
| Less than 2.0x | 6 (5.6%) | 145,357 (142,506.9%) |
| 2.0x to 2.9x | 13 (12.0%) | 15 (14.7%) |
| 3.0x to 3.9x | 10 (9.3%) | 13 (12.8%) |
| 4.0x or more | 79 (73.2%) | 34 (33.3%) |
| Total | 108 (100.0%) | 102 (100.0%) |
Real Estate Taxes by Mortgage Status in Caswell Beach
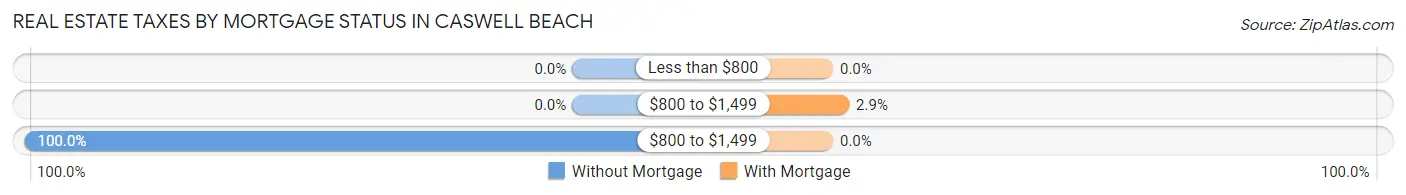
| Property Taxes | Without Mortgage | With Mortgage |
| Less than $800 | 0 (0.0%) | 0 (0.0%) |
| $800 to $1,499 | 0 (0.0%) | 3 (2.9%) |
| $800 to $1,499 | 108 (100.0%) | 0 (0.0%) |
| Total | 108 (100.0%) | 102 (100.0%) |
Health & Disability in Caswell Beach
Health Insurance Coverage by Age in Caswell Beach
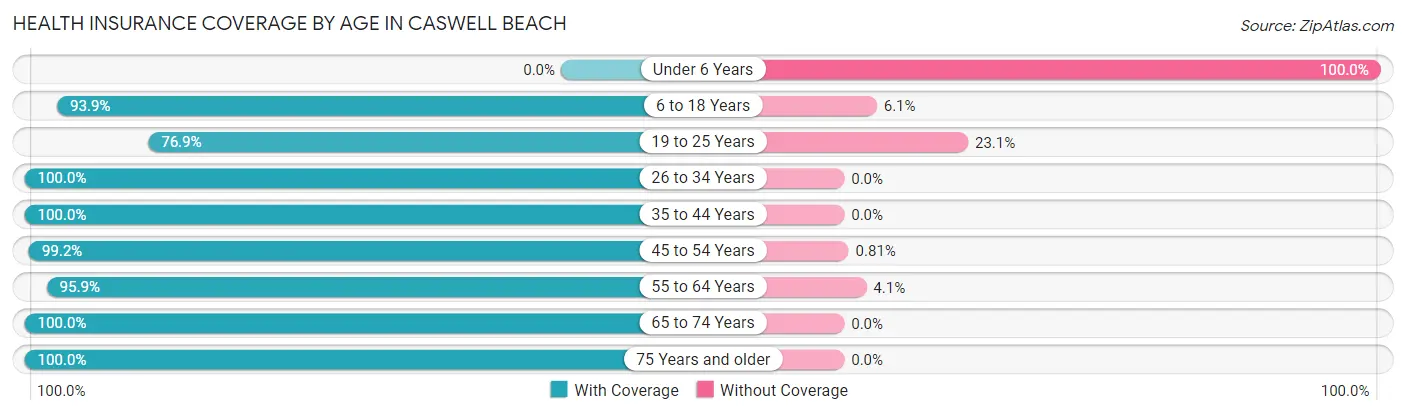
| Age Bracket | With Coverage | Without Coverage |
| Under 6 Years | 0 (0.0%) | 3 (100.0%) |
| 6 to 18 Years | 31 (93.9%) | 2 (6.1%) |
| 19 to 25 Years | 10 (76.9%) | 3 (23.1%) |
| 26 to 34 Years | 6 (100.0%) | 0 (0.0%) |
| 35 to 44 Years | 27 (100.0%) | 0 (0.0%) |
| 45 to 54 Years | 123 (99.2%) | 1 (0.8%) |
| 55 to 64 Years | 93 (95.9%) | 4 (4.1%) |
| 65 to 74 Years | 114 (100.0%) | 0 (0.0%) |
| 75 Years and older | 72 (100.0%) | 0 (0.0%) |
| Total | 476 (97.3%) | 13 (2.7%) |
Health Insurance Coverage by Citizenship Status in Caswell Beach
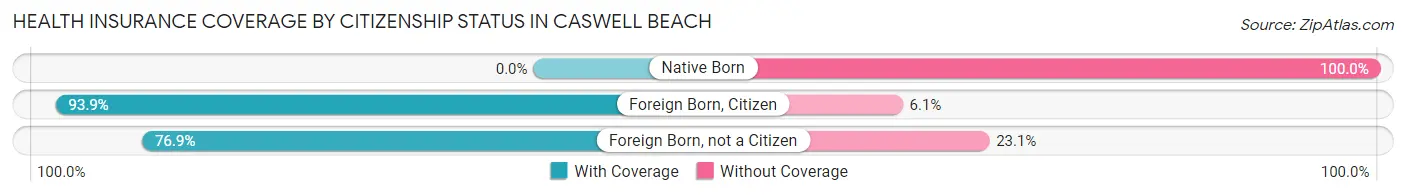
| Citizenship Status | With Coverage | Without Coverage |
| Native Born | 0 (0.0%) | 3 (100.0%) |
| Foreign Born, Citizen | 31 (93.9%) | 2 (6.1%) |
| Foreign Born, not a Citizen | 10 (76.9%) | 3 (23.1%) |
Health Insurance Coverage by Household Income in Caswell Beach
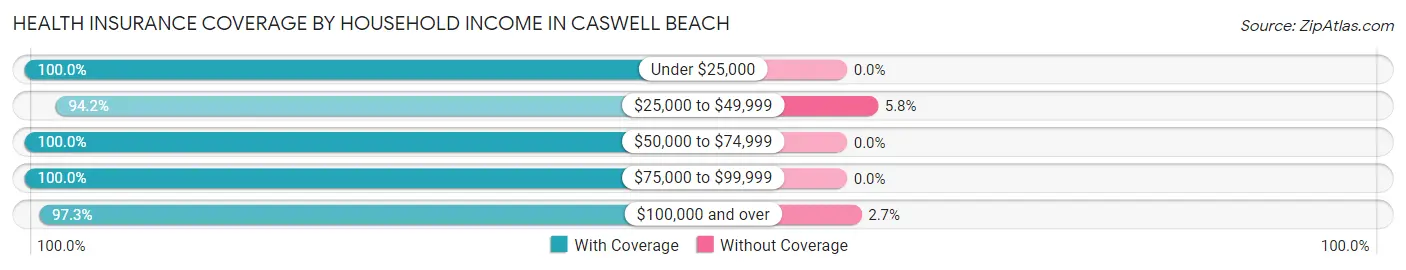
| Household Income | With Coverage | Without Coverage |
| Under $25,000 | 24 (100.0%) | 0 (0.0%) |
| $25,000 to $49,999 | 65 (94.2%) | 4 (5.8%) |
| $50,000 to $74,999 | 39 (100.0%) | 0 (0.0%) |
| $75,000 to $99,999 | 25 (100.0%) | 0 (0.0%) |
| $100,000 and over | 323 (97.3%) | 9 (2.7%) |
Public vs Private Health Insurance Coverage by Age in Caswell Beach
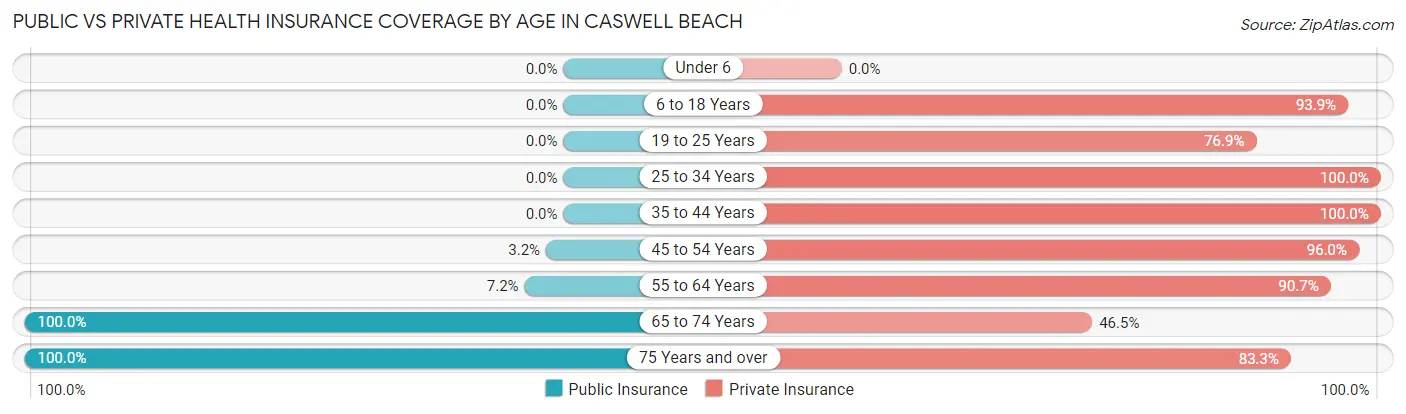
| Age Bracket | Public Insurance | Private Insurance |
| Under 6 | 0 (0.0%) | 0 (0.0%) |
| 6 to 18 Years | 0 (0.0%) | 31 (93.9%) |
| 19 to 25 Years | 0 (0.0%) | 10 (76.9%) |
| 25 to 34 Years | 0 (0.0%) | 6 (100.0%) |
| 35 to 44 Years | 0 (0.0%) | 27 (100.0%) |
| 45 to 54 Years | 4 (3.2%) | 119 (96.0%) |
| 55 to 64 Years | 7 (7.2%) | 88 (90.7%) |
| 65 to 74 Years | 114 (100.0%) | 53 (46.5%) |
| 75 Years and over | 72 (100.0%) | 60 (83.3%) |
| Total | 197 (40.3%) | 394 (80.6%) |
Disability Status by Sex by Age in Caswell Beach
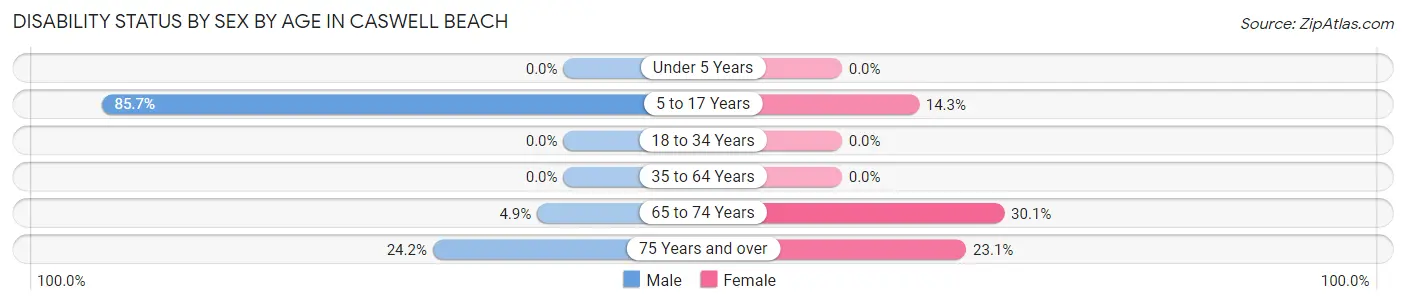
| Age Bracket | Male | Female |
| Under 5 Years | 0 (0.0%) | 0 (0.0%) |
| 5 to 17 Years | 18 (85.7%) | 1 (14.3%) |
| 18 to 34 Years | 0 (0.0%) | 0 (0.0%) |
| 35 to 64 Years | 0 (0.0%) | 0 (0.0%) |
| 65 to 74 Years | 2 (4.9%) | 22 (30.1%) |
| 75 Years and over | 8 (24.2%) | 9 (23.1%) |
Disability Class by Sex by Age in Caswell Beach
Disability Class: Hearing Difficulty
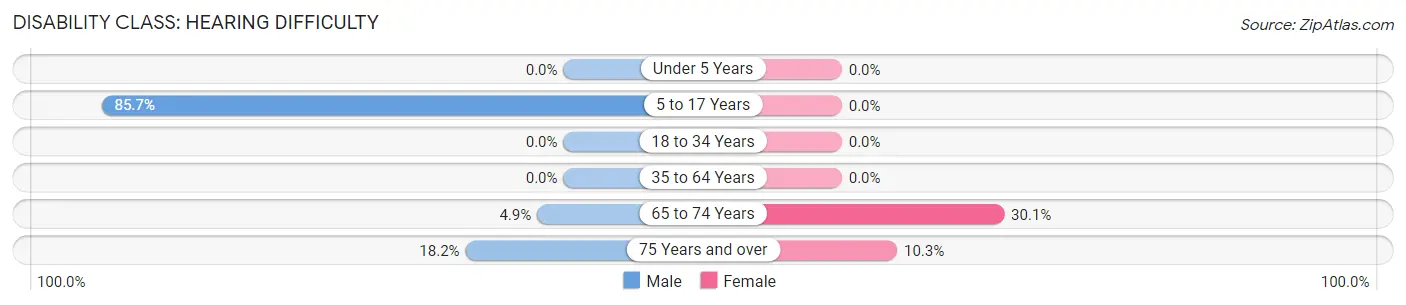
| Age Bracket | Male | Female |
| Under 5 Years | 0 (0.0%) | 0 (0.0%) |
| 5 to 17 Years | 18 (85.7%) | 0 (0.0%) |
| 18 to 34 Years | 0 (0.0%) | 0 (0.0%) |
| 35 to 64 Years | 0 (0.0%) | 0 (0.0%) |
| 65 to 74 Years | 2 (4.9%) | 22 (30.1%) |
| 75 Years and over | 6 (18.2%) | 4 (10.3%) |
Disability Class: Vision Difficulty
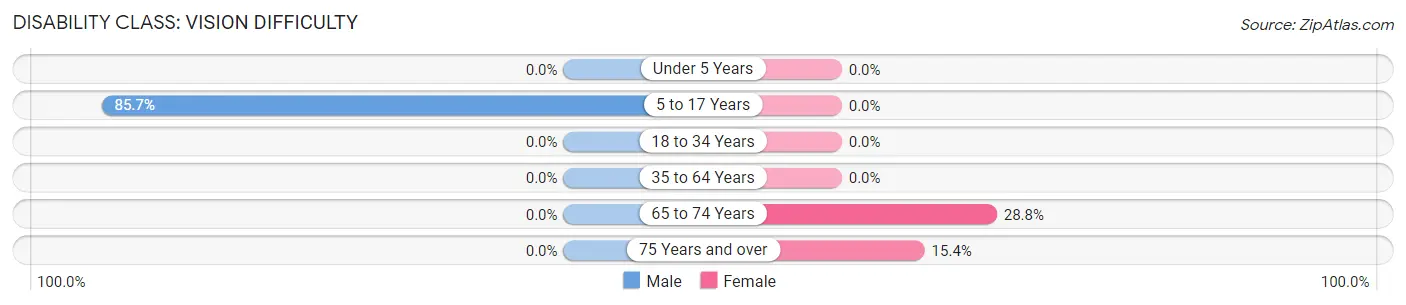
| Age Bracket | Male | Female |
| Under 5 Years | 0 (0.0%) | 0 (0.0%) |
| 5 to 17 Years | 18 (85.7%) | 0 (0.0%) |
| 18 to 34 Years | 0 (0.0%) | 0 (0.0%) |
| 35 to 64 Years | 0 (0.0%) | 0 (0.0%) |
| 65 to 74 Years | 0 (0.0%) | 21 (28.8%) |
| 75 Years and over | 0 (0.0%) | 6 (15.4%) |
Disability Class: Cognitive Difficulty
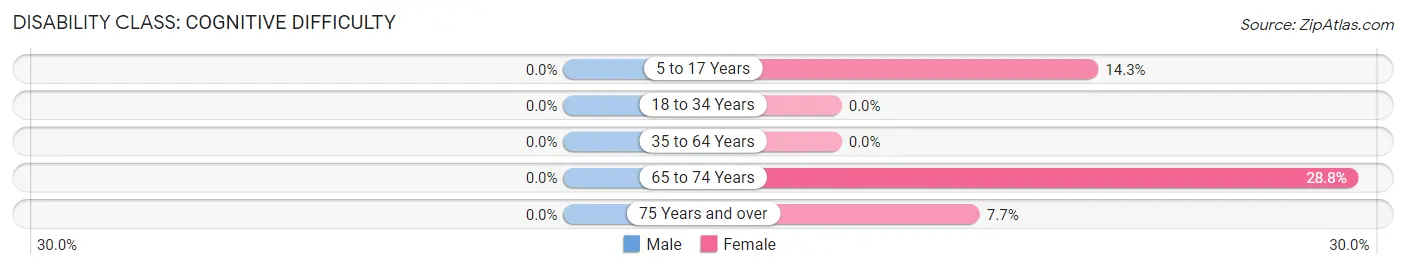
| Age Bracket | Male | Female |
| 5 to 17 Years | 0 (0.0%) | 1 (14.3%) |
| 18 to 34 Years | 0 (0.0%) | 0 (0.0%) |
| 35 to 64 Years | 0 (0.0%) | 0 (0.0%) |
| 65 to 74 Years | 0 (0.0%) | 21 (28.8%) |
| 75 Years and over | 0 (0.0%) | 3 (7.7%) |
Disability Class: Ambulatory Difficulty
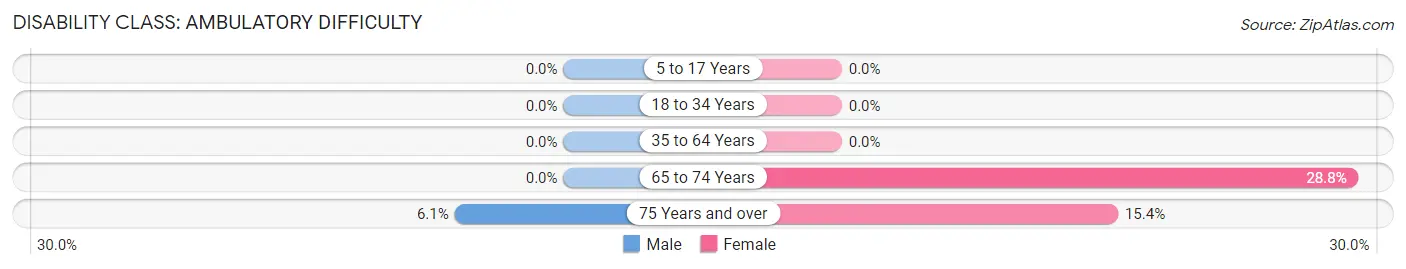
| Age Bracket | Male | Female |
| 5 to 17 Years | 0 (0.0%) | 0 (0.0%) |
| 18 to 34 Years | 0 (0.0%) | 0 (0.0%) |
| 35 to 64 Years | 0 (0.0%) | 0 (0.0%) |
| 65 to 74 Years | 0 (0.0%) | 21 (28.8%) |
| 75 Years and over | 2 (6.1%) | 6 (15.4%) |
Disability Class: Self-Care Difficulty
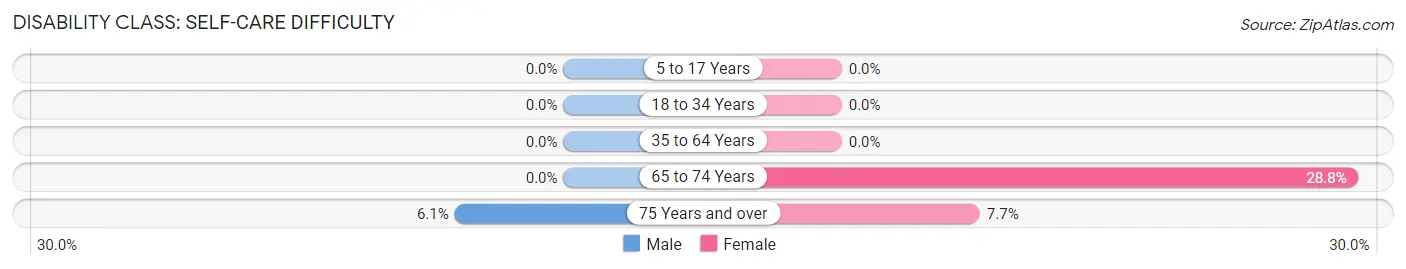
| Age Bracket | Male | Female |
| 5 to 17 Years | 0 (0.0%) | 0 (0.0%) |
| 18 to 34 Years | 0 (0.0%) | 0 (0.0%) |
| 35 to 64 Years | 0 (0.0%) | 0 (0.0%) |
| 65 to 74 Years | 0 (0.0%) | 21 (28.8%) |
| 75 Years and over | 2 (6.1%) | 3 (7.7%) |
Technology Access in Caswell Beach
Computing Device Access in Caswell Beach
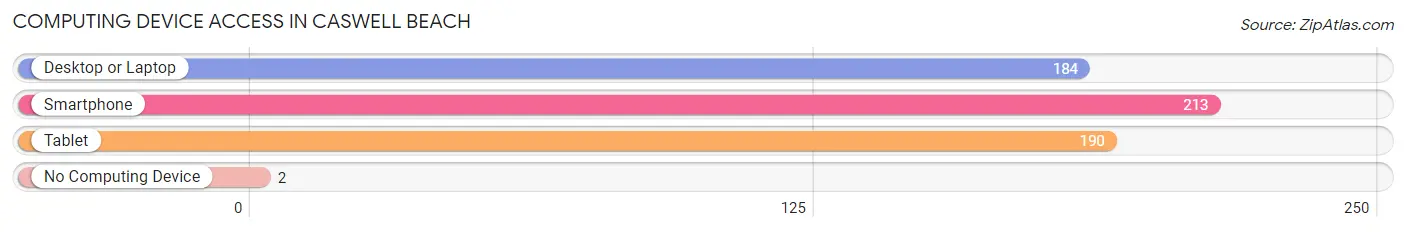
| Device Type | # Households | % Households |
| Desktop or Laptop | 184 | 84.0% |
| Smartphone | 213 | 97.3% |
| Tablet | 190 | 86.8% |
| No Computing Device | 2 | 0.9% |
| Total | 219 | 100.0% |
Internet Access in Caswell Beach
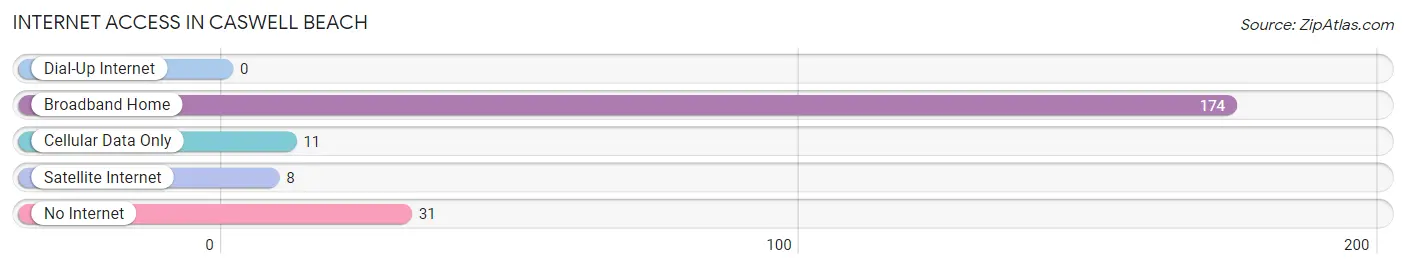
| Internet Type | # Households | % Households |
| Dial-Up Internet | 0 | 0.0% |
| Broadband Home | 174 | 79.4% |
| Cellular Data Only | 11 | 5.0% |
| Satellite Internet | 8 | 3.6% |
| No Internet | 31 | 14.2% |
| Total | 219 | 100.0% |
Caswell Beach Summary
Caswell Beach is a small town located on the southeastern coast of North Carolina, in the United States. It is situated on the barrier island of Oak Island, which is part of the larger Brunswick Islands. Caswell Beach is located in the county of Brunswick, and is part of the Wilmington Metropolitan Statistical Area. The town has a population of approximately 500 people, and is a popular tourist destination due to its beautiful beaches and proximity to Wilmington.
History
The area that is now Caswell Beach has a long and varied history. The first inhabitants of the area were Native Americans, who lived in the area for thousands of years before the arrival of Europeans. The first Europeans to settle in the area were the English, who arrived in the late 1600s. The area was part of the colonial province of North Carolina, and was part of the county of New Hanover.
In the late 1800s, the area began to be developed as a resort destination. The town of Caswell Beach was founded in 1887, and was named after the Caswell family, who owned much of the land in the area. The town was a popular destination for wealthy vacationers from the North, and many of the original buildings in the town were built in the late 1800s.
In the early 1900s, the town began to decline in popularity as a resort destination, and the population began to decline. In the 1950s, the town was revitalized as a beach resort, and the population began to grow again. In the late 1990s, the town was incorporated, and the population has continued to grow since then.
Geography
Caswell Beach is located on the southeastern coast of North Carolina, in the United States. It is situated on the barrier island of Oak Island, which is part of the larger Brunswick Islands. The town is located in the county of Brunswick, and is part of the Wilmington Metropolitan Statistical Area. The town is located on the Atlantic Ocean, and is bordered by the Intracoastal Waterway to the west.
The town has a total area of 0.9 square miles, all of which is land. The town is located on the Atlantic Ocean, and is bordered by the Intracoastal Waterway to the west. The town is located on the barrier island of Oak Island, which is part of the larger Brunswick Islands. The town is located in the county of Brunswick, and is part of the Wilmington Metropolitan Statistical Area.
Economy
The economy of Caswell Beach is largely based on tourism. The town is a popular destination for beachgoers, and the town has a number of hotels, restaurants, and other businesses catering to tourists. The town also has a number of marinas, which provide services to boaters. The town is also home to a number of small businesses, including retail stores, restaurants, and other services.
Demographics
As of the 2010 census, the population of Caswell Beach was 500 people. The racial makeup of the town was 97.2% White, 0.8% African American, 0.2% Native American, 0.4% Asian, and 1.4% from other races. The median household income in the town was $50,000, and the median family income was $60,000. The per capita income in the town was $25,000. The town has a population of approximately 500 people, and is a popular tourist destination due to its beautiful beaches and proximity to Wilmington.
Common Questions
What is Per Capita Income in Caswell Beach?
Per Capita income in Caswell Beach is $70,598.
What is the Median Family Income in Caswell Beach?
Median Family Income in Caswell Beach is $140,938.
What is the Median Household income in Caswell Beach?
Median Household Income in Caswell Beach is $121,125.
What is Income or Wage Gap in Caswell Beach?
Income or Wage Gap in Caswell Beach is 24.0%.
Women in Caswell Beach earn 76.0 cents for every dollar earned by a man.
What is Inequality or Gini Index in Caswell Beach?
Inequality or Gini Index in Caswell Beach is 0.47.
What is the Total Population of Caswell Beach?
Total Population of Caswell Beach is 489.
What is the Total Male Population of Caswell Beach?
Total Male Population of Caswell Beach is 224.
What is the Total Female Population of Caswell Beach?
Total Female Population of Caswell Beach is 265.
What is the Ratio of Males per 100 Females in Caswell Beach?
There are 84.53 Males per 100 Females in Caswell Beach.
What is the Ratio of Females per 100 Males in Caswell Beach?
There are 118.30 Females per 100 Males in Caswell Beach.
What is the Median Population Age in Caswell Beach?
Median Population Age in Caswell Beach is 58.5 Years.
What is the Average Family Size in Caswell Beach
Average Family Size in Caswell Beach is 2.7 People.
What is the Average Household Size in Caswell Beach
Average Household Size in Caswell Beach is 2.2 People.
How Large is the Labor Force in Caswell Beach?
There are 226 People in the Labor Forcein in Caswell Beach.
What is the Percentage of People in the Labor Force in Caswell Beach?
48.9% of People are in the Labor Force in Caswell Beach.
What is the Unemployment Rate in Caswell Beach?
Unemployment Rate in Caswell Beach is 0.9%.