Grandfather, NC Map & Demographics
Grandfather Overview
$165,807
PER CAPITA INCOME
$223,125
AVG FAMILY INCOME
$220,000
AVG HOUSEHOLD INCOME
0.47
INEQUALITY / GINI INDEX
57
TOTAL POPULATION
28
MALE POPULATION
29
FEMALE POPULATION
96.55
MALES / 100 FEMALES
103.57
FEMALES / 100 MALES
69.5
MEDIAN AGE
2.4
AVG FAMILY SIZE
2.4
AVG HOUSEHOLD SIZE
14
LABOR FORCE [ PEOPLE ]
24.6%
PERCENT IN LABOR FORCE
Income in Grandfather
Income Overview in Grandfather
Per Capita Income in Grandfather is $165,807, while median incomes of families and households are $223,125 and $220,000 respectively.
| Characteristic | Number | Measure |
| Per Capita Income | 57 | $165,807 |
| Median Family Income | 23 | $223,125 |
| Mean Family Income | 23 | $390,022 |
| Median Household Income | 24 | $220,000 |
| Mean Household Income | 24 | $374,767 |
| Income Deficit | 23 | $0 |
| Wage / Income Gap (%) | 57 | 0.00% |
| Wage / Income Gap ($) | 57 | 100.00¢ per $1 |
| Gini / Inequality Index | 57 | 0.47 |
Earnings by Sex in Grandfather
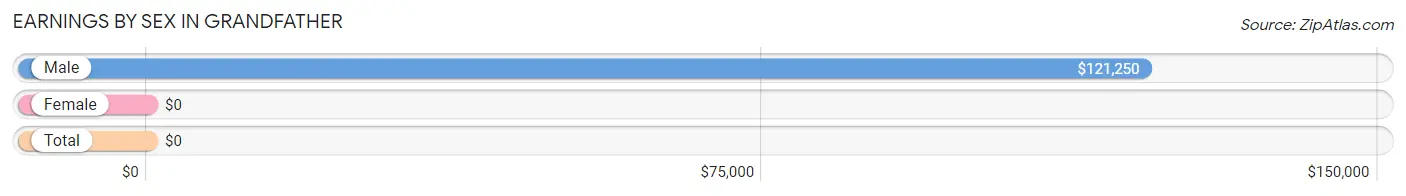
| Sex | Number | Average Earnings |
| Male | 10 (47.6%) | $121,250 |
| Female | 11 (52.4%) | $0 |
| Total | 21 (100.0%) | $0 |
Earnings by Sex by Income Bracket in Grandfather
The most common earnings brackets in Grandfather are $100,000+ for men (7 | 70.0%) and $10,000 to $12,499 for women (4 | 36.4%).
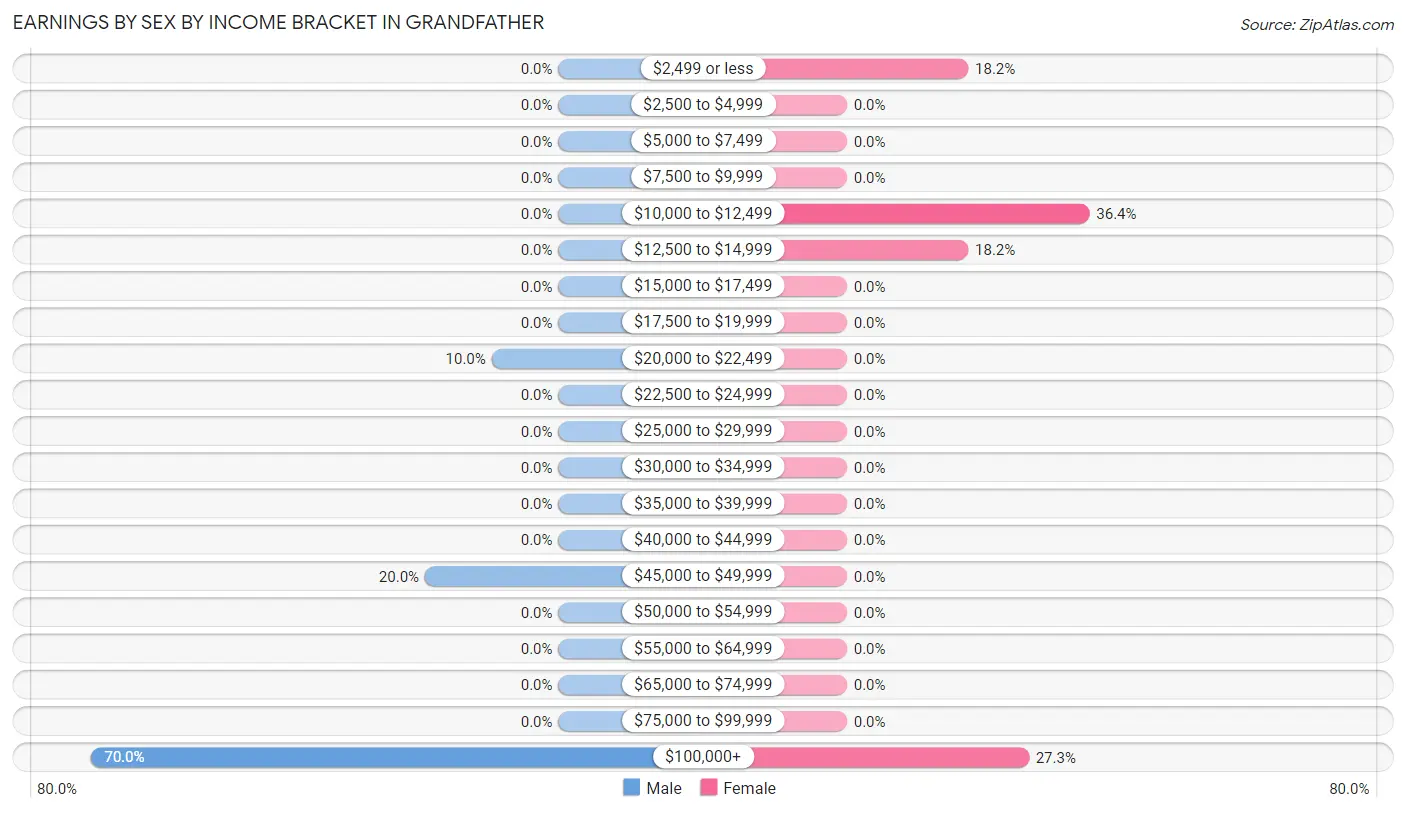
| Income | Male | Female |
| $2,499 or less | 0 (0.0%) | 2 (18.2%) |
| $2,500 to $4,999 | 0 (0.0%) | 0 (0.0%) |
| $5,000 to $7,499 | 0 (0.0%) | 0 (0.0%) |
| $7,500 to $9,999 | 0 (0.0%) | 0 (0.0%) |
| $10,000 to $12,499 | 0 (0.0%) | 4 (36.4%) |
| $12,500 to $14,999 | 0 (0.0%) | 2 (18.2%) |
| $15,000 to $17,499 | 0 (0.0%) | 0 (0.0%) |
| $17,500 to $19,999 | 0 (0.0%) | 0 (0.0%) |
| $20,000 to $22,499 | 1 (10.0%) | 0 (0.0%) |
| $22,500 to $24,999 | 0 (0.0%) | 0 (0.0%) |
| $25,000 to $29,999 | 0 (0.0%) | 0 (0.0%) |
| $30,000 to $34,999 | 0 (0.0%) | 0 (0.0%) |
| $35,000 to $39,999 | 0 (0.0%) | 0 (0.0%) |
| $40,000 to $44,999 | 0 (0.0%) | 0 (0.0%) |
| $45,000 to $49,999 | 2 (20.0%) | 0 (0.0%) |
| $50,000 to $54,999 | 0 (0.0%) | 0 (0.0%) |
| $55,000 to $64,999 | 0 (0.0%) | 0 (0.0%) |
| $65,000 to $74,999 | 0 (0.0%) | 0 (0.0%) |
| $75,000 to $99,999 | 0 (0.0%) | 0 (0.0%) |
| $100,000+ | 7 (70.0%) | 3 (27.3%) |
| Total | 10 (100.0%) | 11 (100.0%) |
Earnings by Sex by Educational Attainment in Grandfather
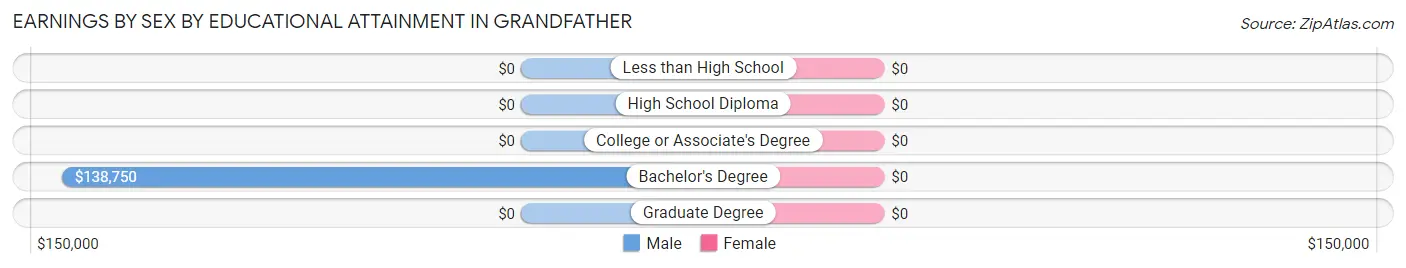
| Educational Attainment | Male Income | Female Income |
| Less than High School | - | - |
| High School Diploma | - | - |
| College or Associate's Degree | - | - |
| Bachelor's Degree | $138,750 | $0 |
| Graduate Degree | - | - |
| Total | $121,250 | $0 |
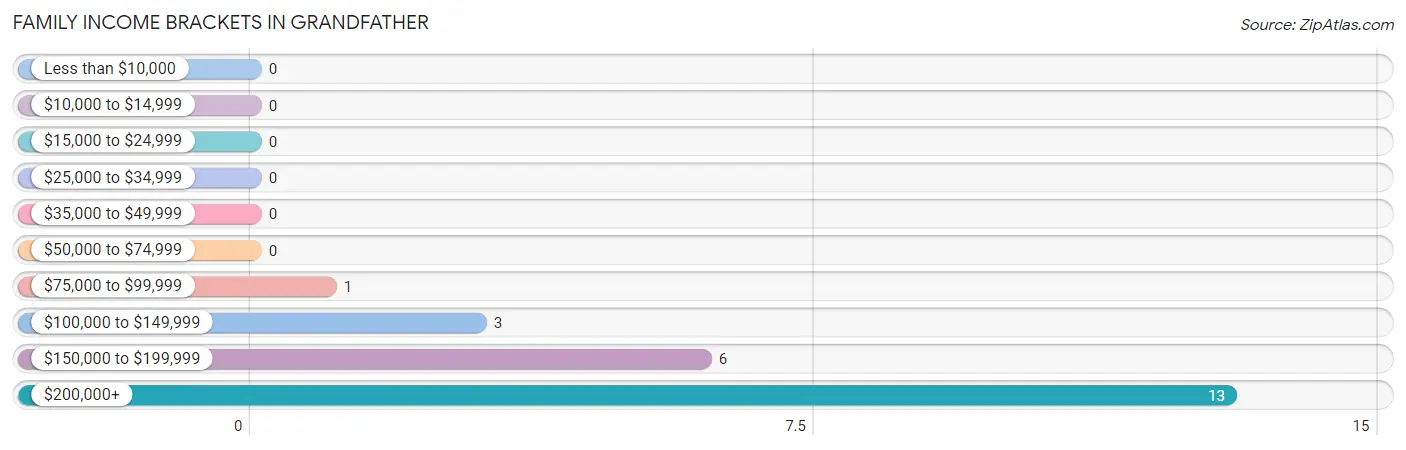
Family Income in Grandfather
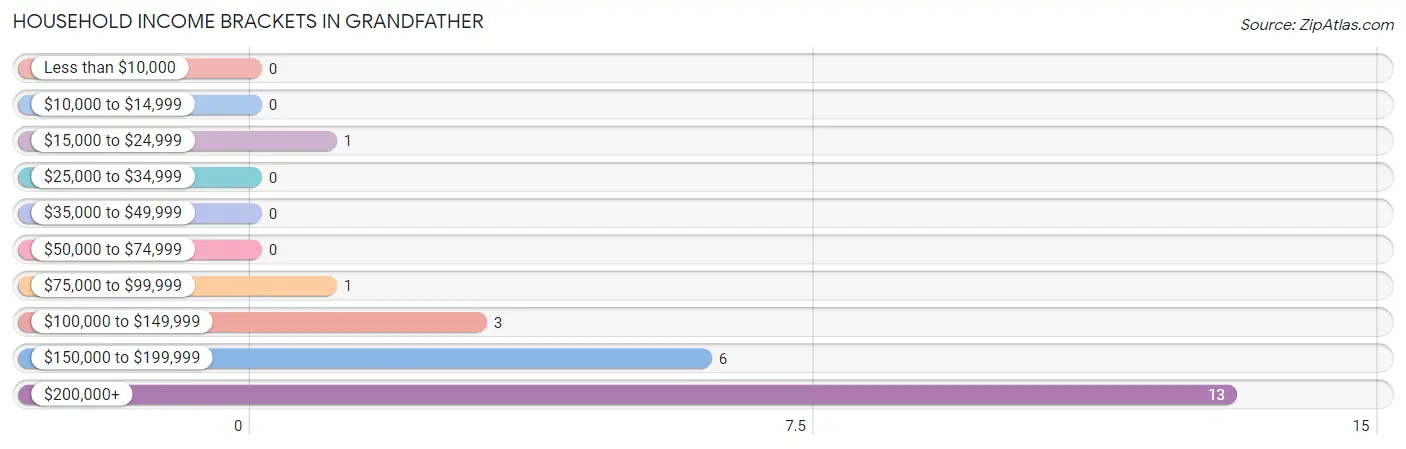
Family Income Brackets in Grandfather
According to the Grandfather family income data, there are 13 families falling into the $200,000+ income range, which is the most common income bracket and makes up 56.5% of all families.
| Income Bracket | # Families | % Families |
| Less than $10,000 | 0 | 0.0% |
| $10,000 to $14,999 | 0 | 0.0% |
| $15,000 to $24,999 | 0 | 0.0% |
| $25,000 to $34,999 | 0 | 0.0% |
| $35,000 to $49,999 | 0 | 0.0% |
| $50,000 to $74,999 | 0 | 0.0% |
| $75,000 to $99,999 | 1 | 4.3% |
| $100,000 to $149,999 | 3 | 13.0% |
| $150,000 to $199,999 | 6 | 26.1% |
| $200,000+ | 13 | 56.5% |
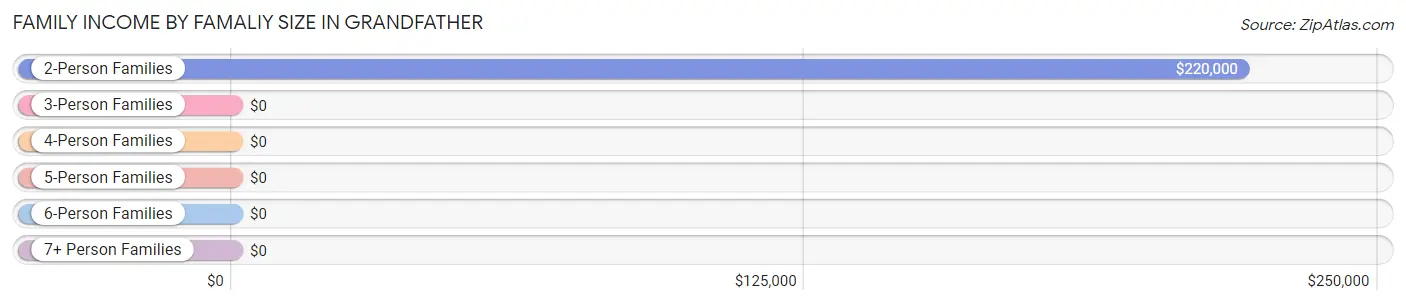
Family Income by Famaliy Size in Grandfather
2-person families (22 | 95.7%) account for the highest median family income in Grandfather with $220,000 per family, while 2-person families (22 | 95.7%) have the highest median income of $110,000 per family member.
| Income Bracket | # Families | Median Income |
| 2-Person Families | 22 (95.7%) | $220,000 |
| 3-Person Families | 0 (0.0%) | $0 |
| 4-Person Families | 0 (0.0%) | $0 |
| 5-Person Families | 1 (4.3%) | $0 |
| 6-Person Families | 0 (0.0%) | $0 |
| 7+ Person Families | 0 (0.0%) | $0 |
| Total | 23 (100.0%) | $223,125 |
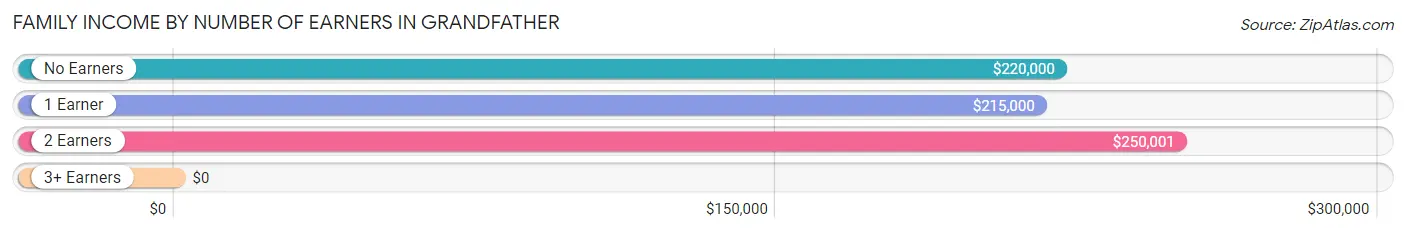
Family Income by Number of Earners in Grandfather
| Number of Earners | # Families | Median Income |
| No Earners | 8 (34.8%) | $220,000 |
| 1 Earner | 12 (52.2%) | $215,000 |
| 2 Earners | 3 (13.0%) | $250,001 |
| 3+ Earners | 0 (0.0%) | $0 |
| Total | 23 (100.0%) | $223,125 |
Household Income in Grandfather
Household Income Brackets in Grandfather
With 13 households falling in the category, the $200,000+ income range is the most frequent in Grandfather, accounting for 54.2% of all households.
| Income Bracket | # Households | % Households |
| Less than $10,000 | 0 | 0.0% |
| $10,000 to $14,999 | 0 | 0.0% |
| $15,000 to $24,999 | 1 | 4.2% |
| $25,000 to $34,999 | 0 | 0.0% |
| $35,000 to $49,999 | 0 | 0.0% |
| $50,000 to $74,999 | 0 | 0.0% |
| $75,000 to $99,999 | 1 | 4.2% |
| $100,000 to $149,999 | 3 | 12.5% |
| $150,000 to $199,999 | 6 | 25.0% |
| $200,000+ | 13 | 54.2% |
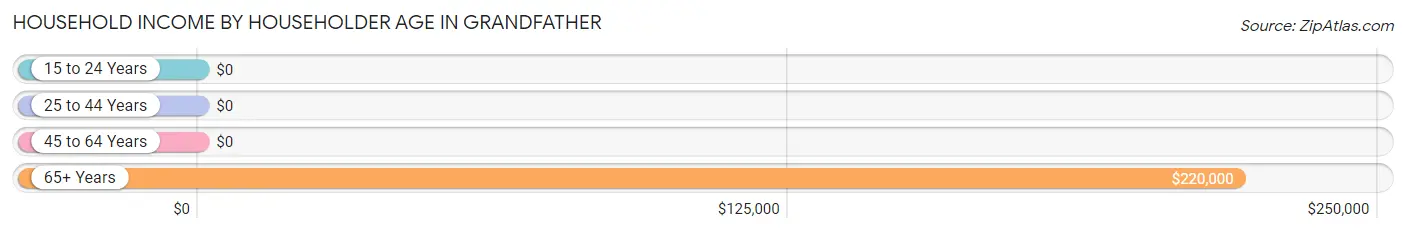
Household Income by Householder Age in Grandfather
The median household income in Grandfather is $220,000, with the highest median household income of $220,000 found in the 65+ years age bracket for the primary householder. A total of 18 households (75.0%) fall into this category.
| Income Bracket | # Households | Median Income |
| 15 to 24 Years | 0 (0.0%) | $0 |
| 25 to 44 Years | 0 (0.0%) | $0 |
| 45 to 64 Years | 6 (25.0%) | $0 |
| 65+ Years | 18 (75.0%) | $220,000 |
| Total | 24 (100.0%) | $220,000 |
Poverty in Grandfather
Income Below Poverty by Sex and Age in Grandfather
| Age Bracket | Male | Female |
| Under 5 Years | 0 (0.0%) | 0 (0.0%) |
| 5 Years | 0 (0.0%) | 0 (0.0%) |
| 6 to 11 Years | 0 (0.0%) | 0 (0.0%) |
| 12 to 14 Years | 0 (0.0%) | 0 (0.0%) |
| 15 Years | 0 (0.0%) | 0 (0.0%) |
| 16 and 17 Years | 0 (0.0%) | 0 (0.0%) |
| 18 to 24 Years | 0 (0.0%) | 0 (0.0%) |
| 25 to 34 Years | 0 (0.0%) | 0 (0.0%) |
| 35 to 44 Years | 0 (0.0%) | 0 (0.0%) |
| 45 to 54 Years | 0 (0.0%) | 0 (0.0%) |
| 55 to 64 Years | 0 (0.0%) | 0 (0.0%) |
| 65 to 74 Years | 0 (0.0%) | 0 (0.0%) |
| 75 Years and over | 0 (0.0%) | 0 (0.0%) |
| Total | 0 (0.0%) | 0 (0.0%) |
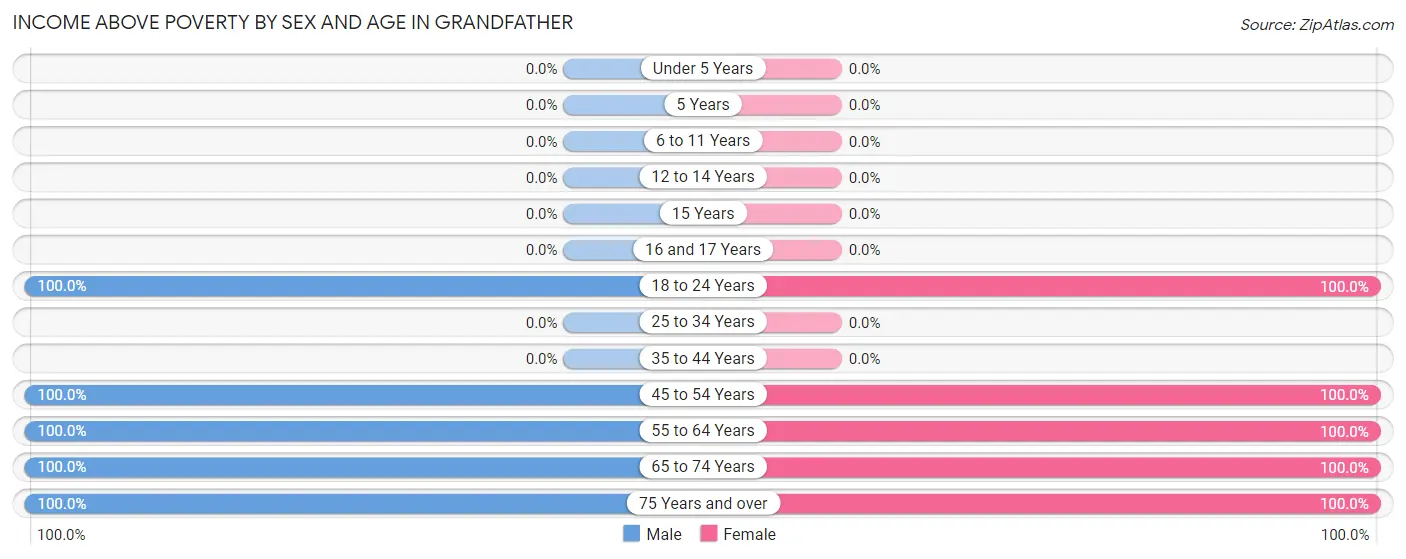
Income Above Poverty by Sex and Age in Grandfather
According to the poverty statistics in Grandfather, males aged 18 to 24 years and females aged 18 to 24 years are the age groups that are most secure financially, with 100.0% of males and 100.0% of females in these age groups living above the poverty line.
| Age Bracket | Male | Female |
| Under 5 Years | 0 (0.0%) | 0 (0.0%) |
| 5 Years | 0 (0.0%) | 0 (0.0%) |
| 6 to 11 Years | 0 (0.0%) | 0 (0.0%) |
| 12 to 14 Years | 0 (0.0%) | 0 (0.0%) |
| 15 Years | 0 (0.0%) | 0 (0.0%) |
| 16 and 17 Years | 0 (0.0%) | 0 (0.0%) |
| 18 to 24 Years | 3 (100.0%) | 2 (100.0%) |
| 25 to 34 Years | 0 (0.0%) | 0 (0.0%) |
| 35 to 44 Years | 0 (0.0%) | 0 (0.0%) |
| 45 to 54 Years | 1 (100.0%) | 3 (100.0%) |
| 55 to 64 Years | 5 (100.0%) | 5 (100.0%) |
| 65 to 74 Years | 7 (100.0%) | 13 (100.0%) |
| 75 Years and over | 12 (100.0%) | 6 (100.0%) |
| Total | 28 (100.0%) | 29 (100.0%) |
Income Below Poverty Among Married-Couple Families in Grandfather
| Children | Above Poverty | Below Poverty |
| No Children | 23 (100.0%) | 0 (0.0%) |
| 1 or 2 Children | 0 (0.0%) | 0 (0.0%) |
| 3 or 4 Children | 0 (0.0%) | 0 (0.0%) |
| 5 or more Children | 0 (0.0%) | 0 (0.0%) |
| Total | 23 (100.0%) | 0 (0.0%) |
Income Below Poverty Among Single-Parent Households in Grandfather
| Children | Single Father | Single Mother |
| No Children | 0 (0.0%) | 0 (0.0%) |
| 1 or 2 Children | 0 (0.0%) | 0 (0.0%) |
| 3 or 4 Children | 0 (0.0%) | 0 (0.0%) |
| 5 or more Children | 0 (0.0%) | 0 (0.0%) |
| Total | 0 (0.0%) | 0 (0.0%) |
Income Below Poverty Among Married-Couple vs Single-Parent Households in Grandfather
| Children | Married-Couple Families | Single-Parent Households |
| No Children | 0 (0.0%) | 0 (0.0%) |
| 1 or 2 Children | 0 (0.0%) | 0 (0.0%) |
| 3 or 4 Children | 0 (0.0%) | 0 (0.0%) |
| 5 or more Children | 0 (0.0%) | 0 (0.0%) |
| Total | 0 (0.0%) | 0 (0.0%) |
Race in Grandfather
The most populous races in Grandfather are , and White / Caucasian (57 | 100.0%).
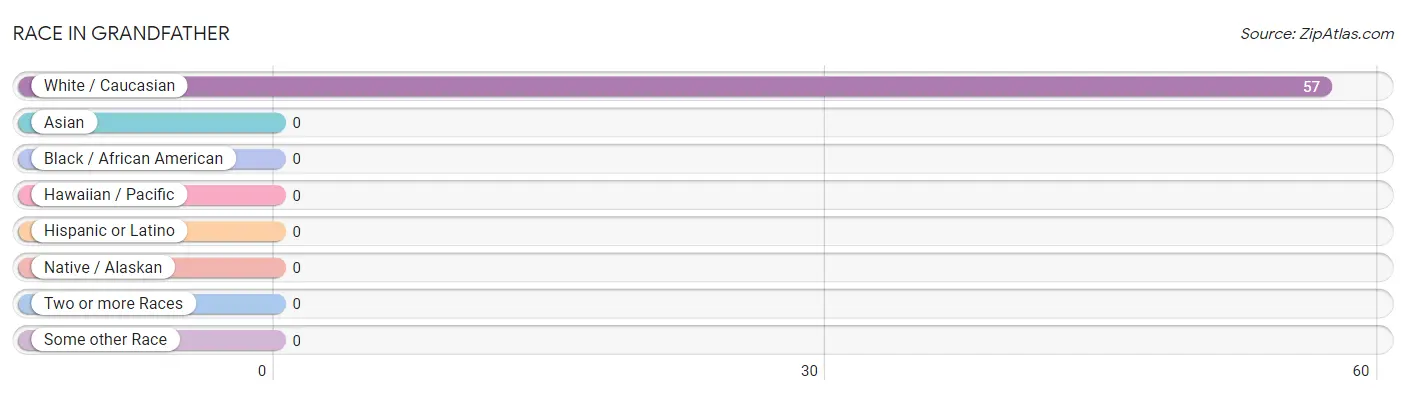
| Race | # Population | % Population |
| Asian | 0 | 0.0% |
| Black / African American | 0 | 0.0% |
| Hawaiian / Pacific | 0 | 0.0% |
| Hispanic or Latino | 0 | 0.0% |
| Native / Alaskan | 0 | 0.0% |
| White / Caucasian | 57 | 100.0% |
| Two or more Races | 0 | 0.0% |
| Some other Race | 0 | 0.0% |
| Total | 57 | 100.0% |
Ancestry in Grandfather
The most populous ancestries reported in Grandfather are English (17 | 29.8%), Irish (16 | 28.1%), American (13 | 22.8%), German (8 | 14.0%), and Scottish (8 | 14.0%), together accounting for 108.8% of all Grandfather residents.
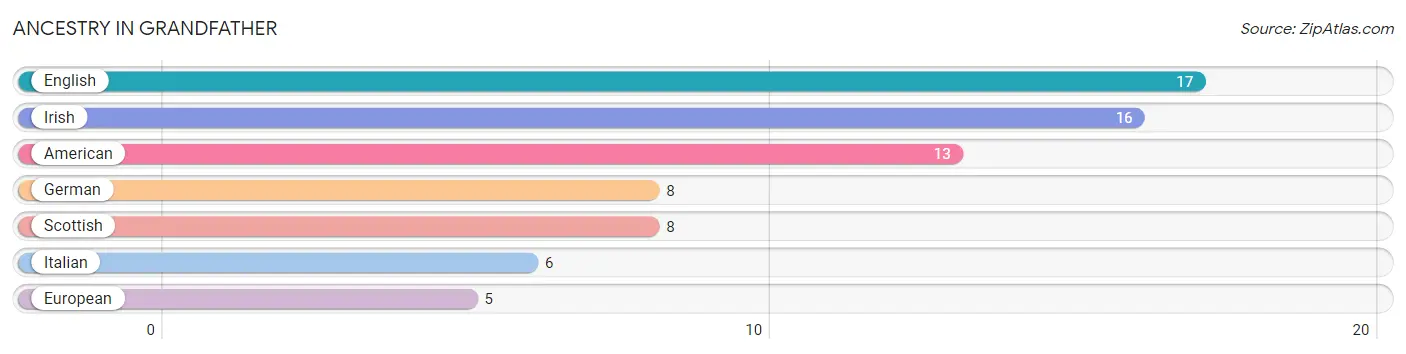
| Ancestry | # Population | % Population |
| American | 13 | 22.8% |
| English | 17 | 29.8% |
| European | 5 | 8.8% |
| German | 8 | 14.0% |
| Irish | 16 | 28.1% |
| Italian | 6 | 10.5% |
| Scottish | 8 | 14.0% | View All 7 Rows |
Immigrants in Grandfather
The most numerous immigrant groups reported in Grandfather came from , and Canada (1 | 1.8%), together accounting for 1.8% of all Grandfather residents.

| Immigration Origin | # Population | % Population |
| Canada | 1 | 1.8% | View All 1 Rows |
Sex and Age in Grandfather
Sex and Age in Grandfather
The most populous age groups in Grandfather are 75 to 79 Years (9 | 32.1%) for men and 65 to 69 Years (7 | 24.1%) for women.
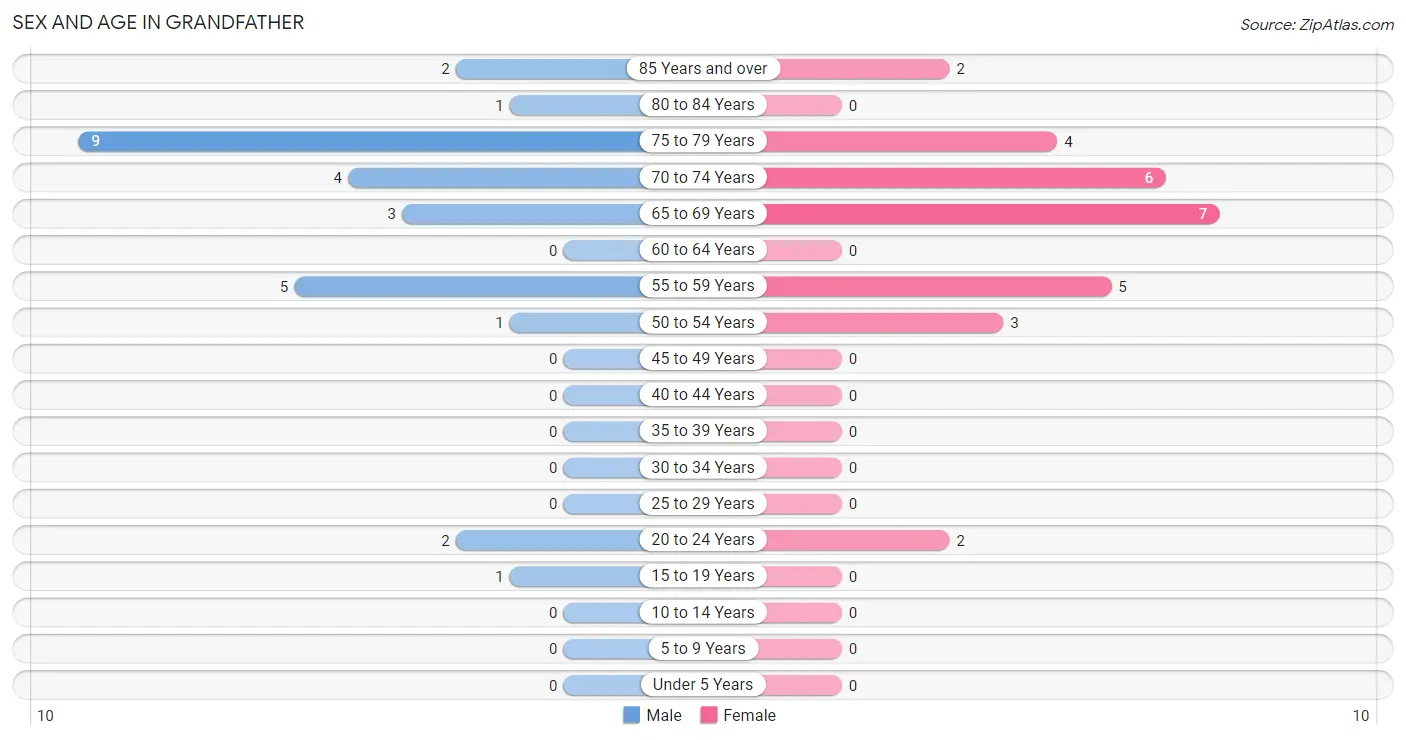
| Age Bracket | Male | Female |
| Under 5 Years | 0 (0.0%) | 0 (0.0%) |
| 5 to 9 Years | 0 (0.0%) | 0 (0.0%) |
| 10 to 14 Years | 0 (0.0%) | 0 (0.0%) |
| 15 to 19 Years | 1 (3.6%) | 0 (0.0%) |
| 20 to 24 Years | 2 (7.1%) | 2 (6.9%) |
| 25 to 29 Years | 0 (0.0%) | 0 (0.0%) |
| 30 to 34 Years | 0 (0.0%) | 0 (0.0%) |
| 35 to 39 Years | 0 (0.0%) | 0 (0.0%) |
| 40 to 44 Years | 0 (0.0%) | 0 (0.0%) |
| 45 to 49 Years | 0 (0.0%) | 0 (0.0%) |
| 50 to 54 Years | 1 (3.6%) | 3 (10.3%) |
| 55 to 59 Years | 5 (17.9%) | 5 (17.2%) |
| 60 to 64 Years | 0 (0.0%) | 0 (0.0%) |
| 65 to 69 Years | 3 (10.7%) | 7 (24.1%) |
| 70 to 74 Years | 4 (14.3%) | 6 (20.7%) |
| 75 to 79 Years | 9 (32.1%) | 4 (13.8%) |
| 80 to 84 Years | 1 (3.6%) | 0 (0.0%) |
| 85 Years and over | 2 (7.1%) | 2 (6.9%) |
| Total | 28 (100.0%) | 29 (100.0%) |
Families and Households in Grandfather
Median Family Size in Grandfather
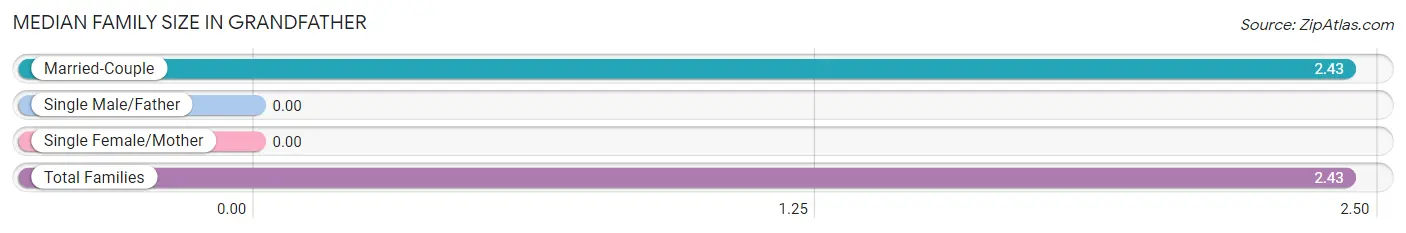
| Family Type | # Families | Family Size |
| Married-Couple | 23 (100.0%) | 2.43 |
| Single Male/Father | 0 (0.0%) | - |
| Single Female/Mother | 0 (0.0%) | - |
| Total Families | 23 (100.0%) | 2.43 |
Median Household Size in Grandfather
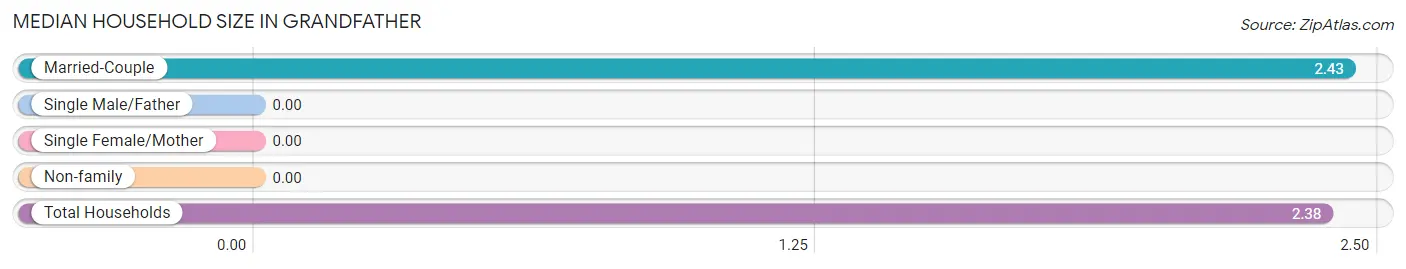
| Household Type | # Households | Household Size |
| Married-Couple | 23 (95.8%) | 2.43 |
| Single Male/Father | 0 (0.0%) | - |
| Single Female/Mother | 0 (0.0%) | - |
| Non-family | 1 (4.2%) | - |
| Total Households | 24 (100.0%) | 2.38 |
Household Size by Marriage Status in Grandfather
Out of a total of 24 households in Grandfather, 23 (95.8%) are family households, while 1 (4.2%) are nonfamily households. The most numerous type of family households are 2-person households, comprising 22, and the most common type of nonfamily households are 1-person households, comprising 1.
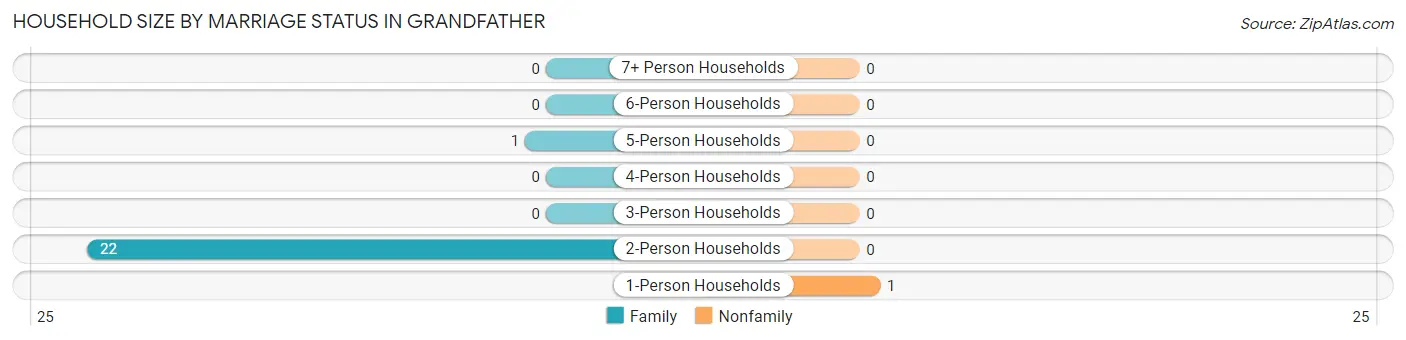
| Household Size | Family Households | Nonfamily Households |
| 1-Person Households | - | 1 (4.2%) |
| 2-Person Households | 22 (91.7%) | 0 (0.0%) |
| 3-Person Households | 0 (0.0%) | 0 (0.0%) |
| 4-Person Households | 0 (0.0%) | 0 (0.0%) |
| 5-Person Households | 1 (4.2%) | 0 (0.0%) |
| 6-Person Households | 0 (0.0%) | 0 (0.0%) |
| 7+ Person Households | 0 (0.0%) | 0 (0.0%) |
| Total | 23 (95.8%) | 1 (4.2%) |
Female Fertility in Grandfather
Fertility by Age in Grandfather
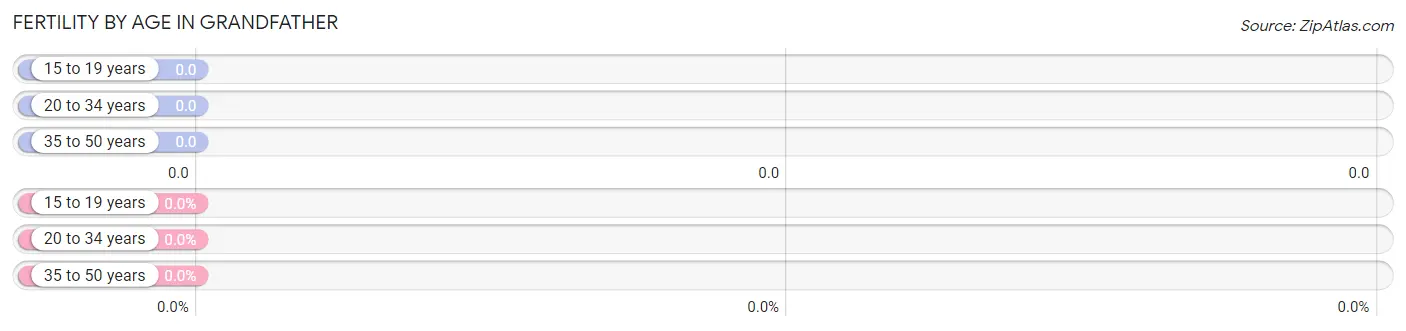
| Age Bracket | Women with Births | Births / 1,000 Women |
| 15 to 19 years | 0 (0.0%) | 0.0 |
| 20 to 34 years | 0 (0.0%) | 0.0 |
| 35 to 50 years | 0 (0.0%) | 0.0 |
| Total | 0 (0.0%) | 0.0 |
Fertility by Age by Marriage Status in Grandfather
| Age Bracket | Married | Unmarried |
| 15 to 19 years | 0 (0.0%) | 0 (0.0%) |
| 20 to 34 years | 0 (0.0%) | 0 (0.0%) |
| 35 to 50 years | 0 (0.0%) | 0 (0.0%) |
| Total | 0 (0.0%) | 0 (0.0%) |
Fertility by Education in Grandfather
| Educational Attainment | Women with Births | Births / 1,000 Women |
| Less than High School | 0 (0.0%) | 0.0 |
| High School Diploma | 0 (0.0%) | 0.0 |
| College or Associate's Degree | 0 (0.0%) | 0.0 |
| Bachelor's Degree | 0 (0.0%) | 0.0 |
| Graduate Degree | 0 (0.0%) | 0.0 |
| Total | 0 (0.0%) | 0.0 |
Fertility by Education by Marriage Status in Grandfather
| Educational Attainment | Married | Unmarried |
| Less than High School | 0 (0.0%) | 0 (0.0%) |
| High School Diploma | 0 (0.0%) | 0 (0.0%) |
| College or Associate's Degree | 0 (0.0%) | 0 (0.0%) |
| Bachelor's Degree | 0 (0.0%) | 0 (0.0%) |
| Graduate Degree | 0 (0.0%) | 0 (0.0%) |
| Total | 0 (0.0%) | 0 (0.0%) |
Employment Characteristics in Grandfather
Employment by Class of Employer in Grandfather
Among the 14 employed individuals in Grandfather, private company employees (7 | 50.0%), self-employed (not incorporated) (3 | 21.4%), and self-employed (incorporated) (2 | 14.3%) make up the most common classes of employment.
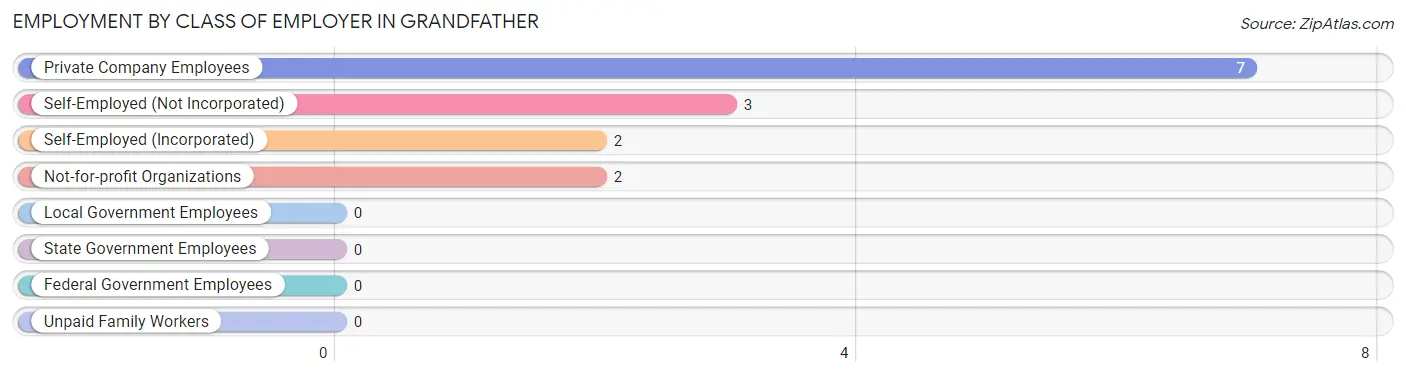
| Employer Class | # Employees | % Employees |
| Private Company Employees | 7 | 50.0% |
| Self-Employed (Incorporated) | 2 | 14.3% |
| Self-Employed (Not Incorporated) | 3 | 21.4% |
| Not-for-profit Organizations | 2 | 14.3% |
| Local Government Employees | 0 | 0.0% |
| State Government Employees | 0 | 0.0% |
| Federal Government Employees | 0 | 0.0% |
| Unpaid Family Workers | 0 | 0.0% |
| Total | 14 | 100.0% |
Employment Status by Age in Grandfather
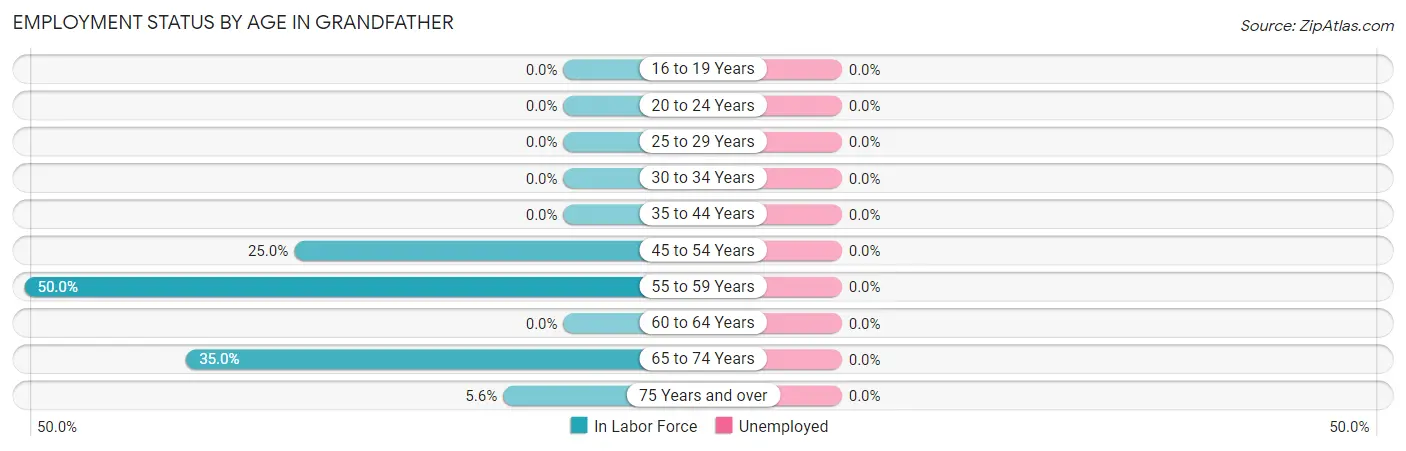
| Age Bracket | In Labor Force | Unemployed |
| 16 to 19 Years | 0 (0.0%) | 0 (0.0%) |
| 20 to 24 Years | 0 (0.0%) | 0 (0.0%) |
| 25 to 29 Years | 0 (0.0%) | 0 (0.0%) |
| 30 to 34 Years | 0 (0.0%) | 0 (0.0%) |
| 35 to 44 Years | 0 (0.0%) | 0 (0.0%) |
| 45 to 54 Years | 1 (25.0%) | 0 (0.0%) |
| 55 to 59 Years | 5 (50.0%) | 0 (0.0%) |
| 60 to 64 Years | 0 (0.0%) | 0 (0.0%) |
| 65 to 74 Years | 7 (35.0%) | 0 (0.0%) |
| 75 Years and over | 1 (5.6%) | 0 (0.0%) |
| Total | 14 (24.6%) | 0 (0.0%) |
Employment Status by Educational Attainment in Grandfather
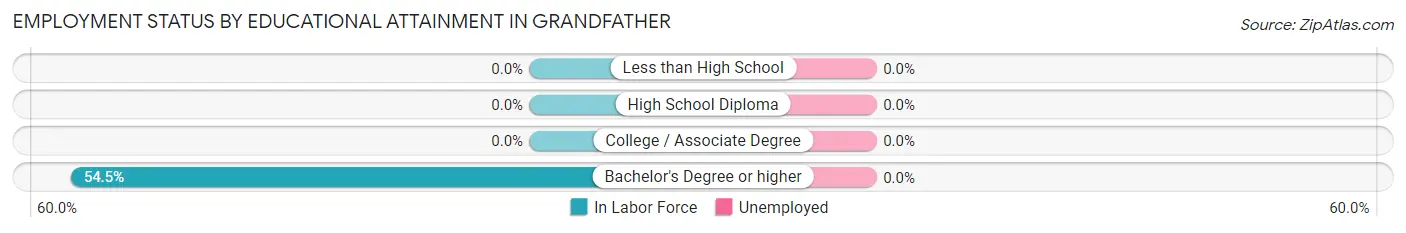
| Educational Attainment | In Labor Force | Unemployed |
| Less than High School | 0 (0.0%) | 0 (0.0%) |
| High School Diploma | 0 (0.0%) | 0 (0.0%) |
| College / Associate Degree | 0 (0.0%) | 0 (0.0%) |
| Bachelor's Degree or higher | 6 (54.5%) | 0 (0.0%) |
| Total | 6 (42.9%) | 0 (0.0%) |
Employment Occupations by Sex in Grandfather
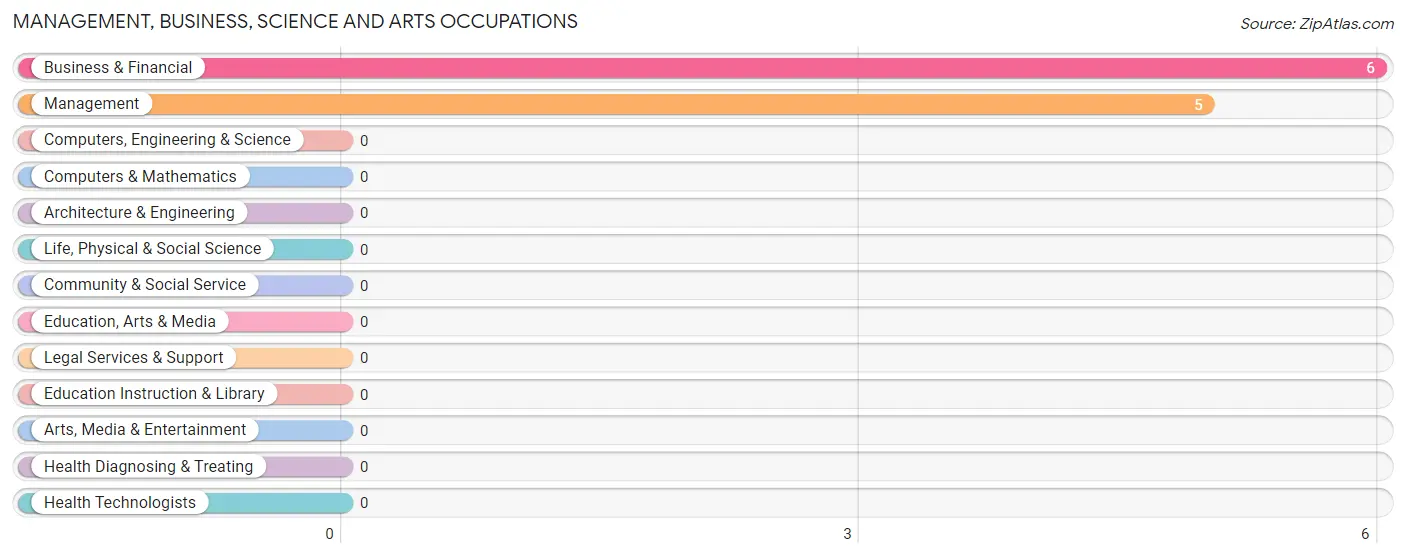
Management, Business, Science and Arts Occupations
The most common Management, Business, Science and Arts occupations in Grandfather are Business & Financial (6 | 42.9%), and Management (5 | 35.7%).
Management, Business, Science and Arts Occupations by Sex
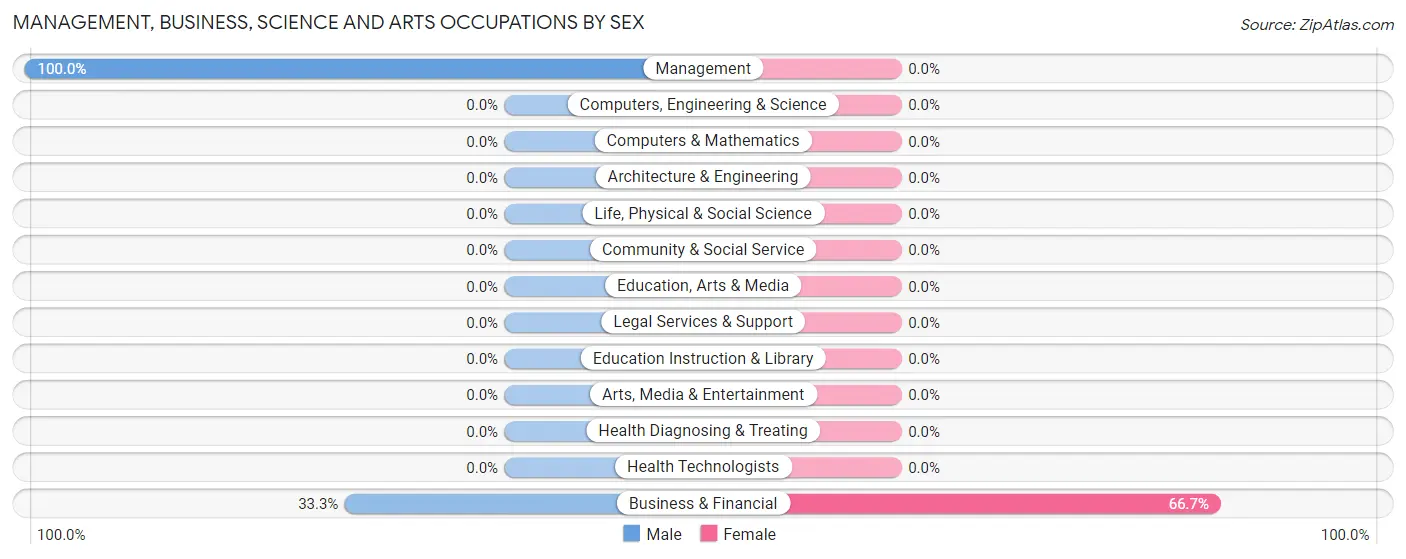
| Occupation | Male | Female |
| Management | 5 (100.0%) | 0 (0.0%) |
| Business & Financial | 2 (33.3%) | 4 (66.7%) |
| Computers, Engineering & Science | 0 (0.0%) | 0 (0.0%) |
| Computers & Mathematics | 0 (0.0%) | 0 (0.0%) |
| Architecture & Engineering | 0 (0.0%) | 0 (0.0%) |
| Life, Physical & Social Science | 0 (0.0%) | 0 (0.0%) |
| Community & Social Service | 0 (0.0%) | 0 (0.0%) |
| Education, Arts & Media | 0 (0.0%) | 0 (0.0%) |
| Legal Services & Support | 0 (0.0%) | 0 (0.0%) |
| Education Instruction & Library | 0 (0.0%) | 0 (0.0%) |
| Arts, Media & Entertainment | 0 (0.0%) | 0 (0.0%) |
| Health Diagnosing & Treating | 0 (0.0%) | 0 (0.0%) |
| Health Technologists | 0 (0.0%) | 0 (0.0%) |
| Total (Category) | 7 (63.6%) | 4 (36.4%) |
| Total (Overall) | 8 (57.1%) | 6 (42.9%) |
Services Occupations
Services Occupations by Sex
| Occupation | Male | Female |
| Healthcare Support | 0 (0.0%) | 0 (0.0%) |
| Security & Protection | 0 (0.0%) | 0 (0.0%) |
| Firefighting & Prevention | 0 (0.0%) | 0 (0.0%) |
| Law Enforcement | 0 (0.0%) | 0 (0.0%) |
| Food Preparation & Serving | 0 (0.0%) | 0 (0.0%) |
| Cleaning & Maintenance | 0 (0.0%) | 0 (0.0%) |
| Personal Care & Service | 0 (0.0%) | 0 (0.0%) |
| Total (Category) | 0 (0.0%) | 0 (0.0%) |
| Total (Overall) | 8 (57.1%) | 6 (42.9%) |
Sales and Office Occupations
The most common Sales and Office occupations in Grandfather are , and Office & Administration (2 | 14.3%).
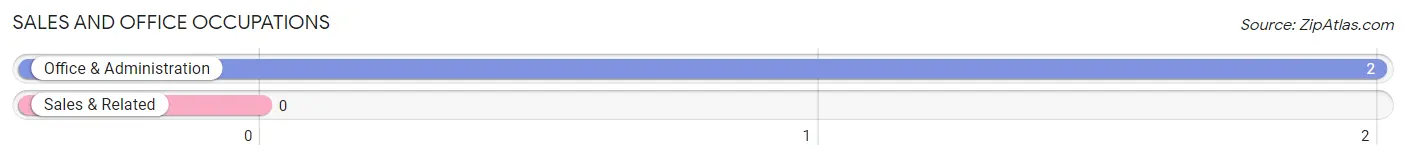
Sales and Office Occupations by Sex
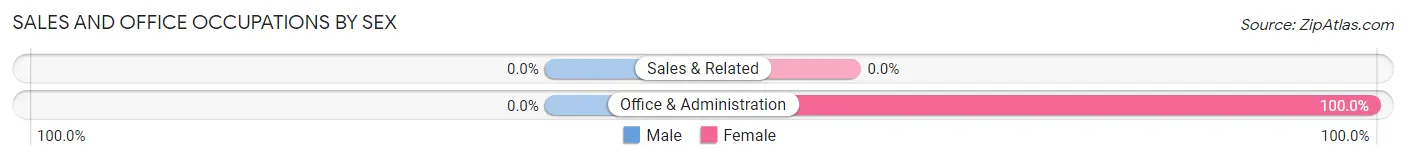
| Occupation | Male | Female |
| Sales & Related | 0 (0.0%) | 0 (0.0%) |
| Office & Administration | 0 (0.0%) | 2 (100.0%) |
| Total (Category) | 0 (0.0%) | 2 (100.0%) |
| Total (Overall) | 8 (57.1%) | 6 (42.9%) |
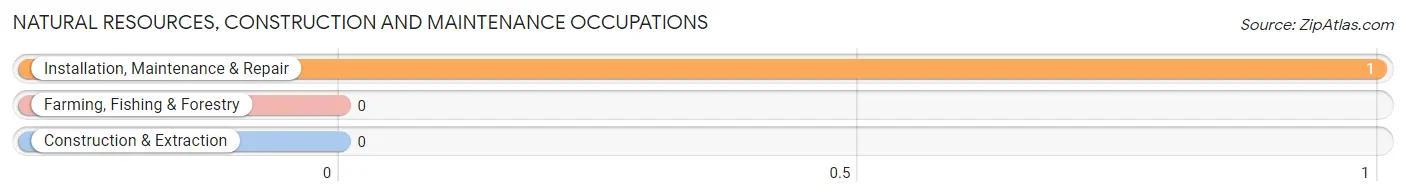
Natural Resources, Construction and Maintenance Occupations
The most common Natural Resources, Construction and Maintenance occupations in Grandfather are , and Installation, Maintenance & Repair (1 | 7.1%).
Natural Resources, Construction and Maintenance Occupations by Sex
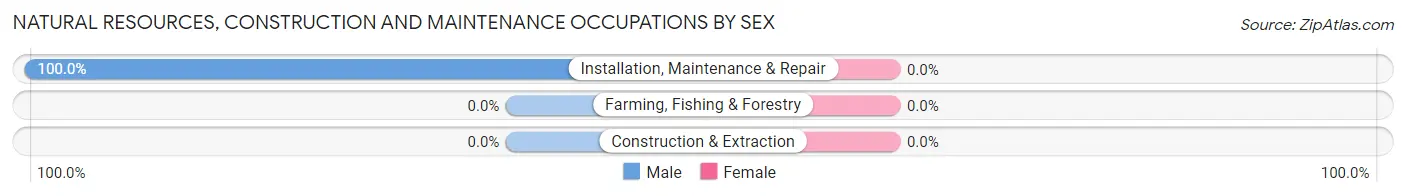
| Occupation | Male | Female |
| Farming, Fishing & Forestry | 0 (0.0%) | 0 (0.0%) |
| Construction & Extraction | 0 (0.0%) | 0 (0.0%) |
| Installation, Maintenance & Repair | 1 (100.0%) | 0 (0.0%) |
| Total (Category) | 1 (100.0%) | 0 (0.0%) |
| Total (Overall) | 8 (57.1%) | 6 (42.9%) |
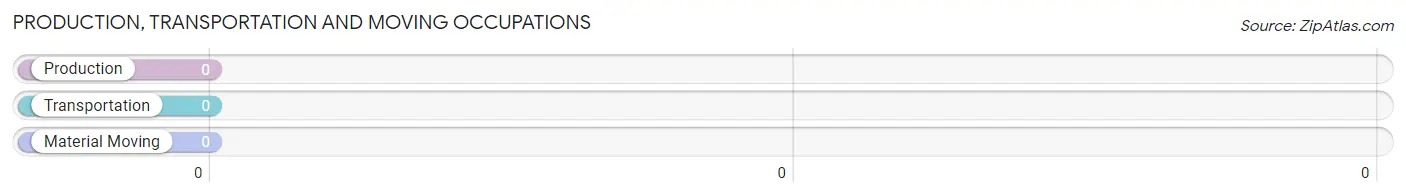
Production, Transportation and Moving Occupations
Production, Transportation and Moving Occupations by Sex
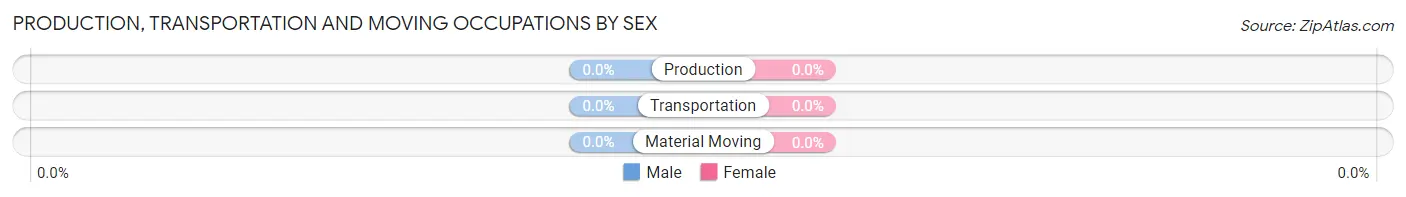
| Occupation | Male | Female |
| Production | 0 (0.0%) | 0 (0.0%) |
| Transportation | 0 (0.0%) | 0 (0.0%) |
| Material Moving | 0 (0.0%) | 0 (0.0%) |
| Total (Category) | 0 (0.0%) | 0 (0.0%) |
| Total (Overall) | 8 (57.1%) | 6 (42.9%) |
Employment Industries by Sex in Grandfather
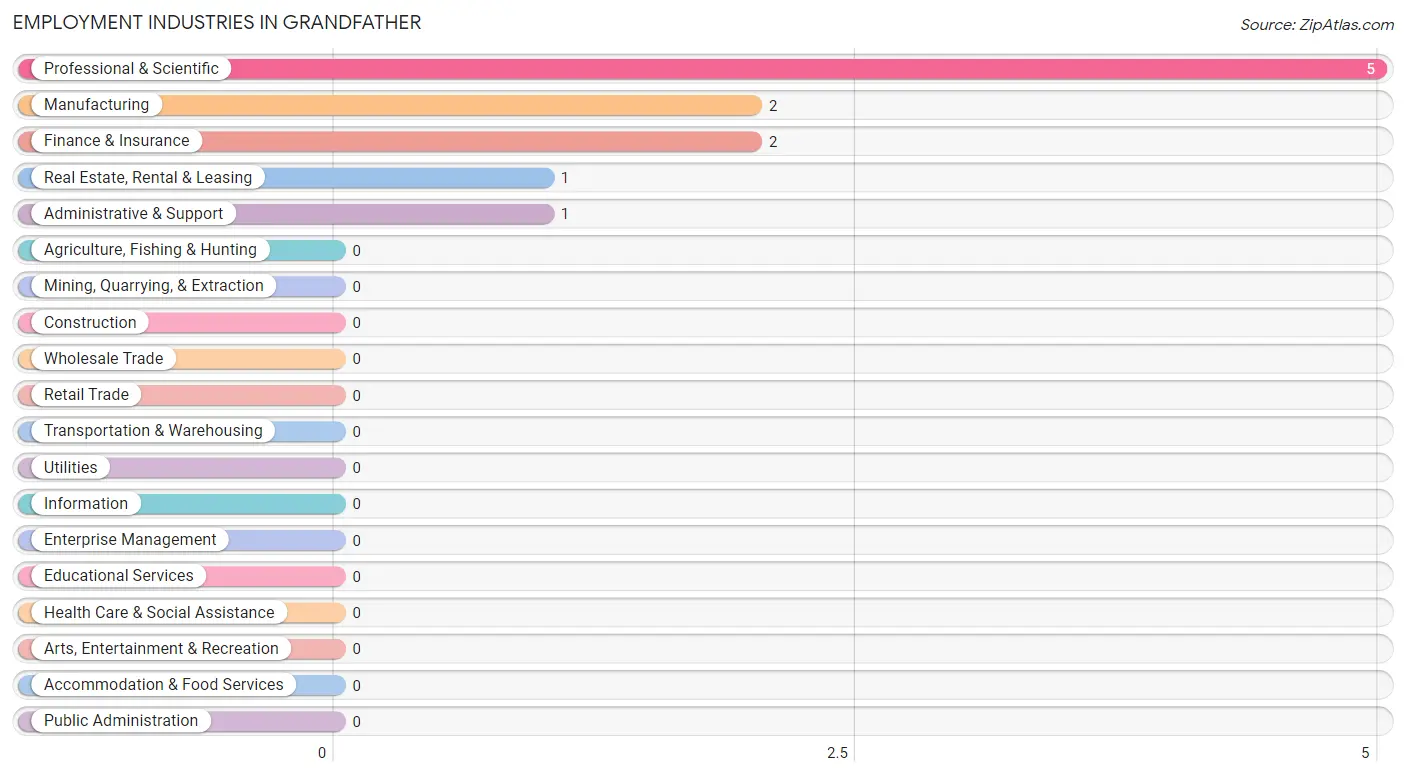
Employment Industries in Grandfather
The major employment industries in Grandfather include Professional & Scientific (5 | 35.7%), Manufacturing (2 | 14.3%), Finance & Insurance (2 | 14.3%), Real Estate, Rental & Leasing (1 | 7.1%), and Administrative & Support (1 | 7.1%).
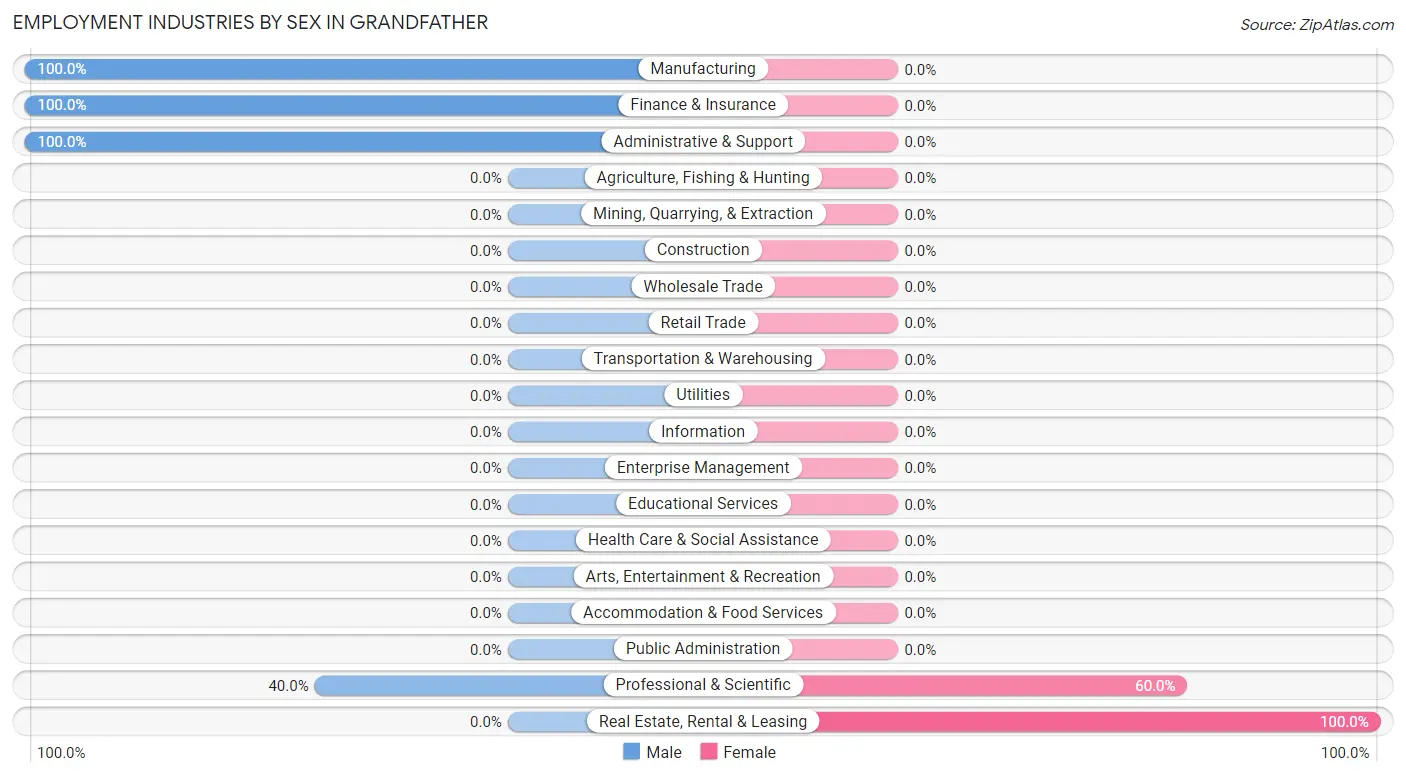
Employment Industries by Sex in Grandfather
The Grandfather industries that see more men than women are Manufacturing (100.0%), Finance & Insurance (100.0%), and Administrative & Support (100.0%), whereas the industries that tend to have a higher number of women are Real Estate, Rental & Leasing (100.0%), and Professional & Scientific (60.0%).
| Industry | Male | Female |
| Agriculture, Fishing & Hunting | 0 (0.0%) | 0 (0.0%) |
| Mining, Quarrying, & Extraction | 0 (0.0%) | 0 (0.0%) |
| Construction | 0 (0.0%) | 0 (0.0%) |
| Manufacturing | 2 (100.0%) | 0 (0.0%) |
| Wholesale Trade | 0 (0.0%) | 0 (0.0%) |
| Retail Trade | 0 (0.0%) | 0 (0.0%) |
| Transportation & Warehousing | 0 (0.0%) | 0 (0.0%) |
| Utilities | 0 (0.0%) | 0 (0.0%) |
| Information | 0 (0.0%) | 0 (0.0%) |
| Finance & Insurance | 2 (100.0%) | 0 (0.0%) |
| Real Estate, Rental & Leasing | 0 (0.0%) | 1 (100.0%) |
| Professional & Scientific | 2 (40.0%) | 3 (60.0%) |
| Enterprise Management | 0 (0.0%) | 0 (0.0%) |
| Administrative & Support | 1 (100.0%) | 0 (0.0%) |
| Educational Services | 0 (0.0%) | 0 (0.0%) |
| Health Care & Social Assistance | 0 (0.0%) | 0 (0.0%) |
| Arts, Entertainment & Recreation | 0 (0.0%) | 0 (0.0%) |
| Accommodation & Food Services | 0 (0.0%) | 0 (0.0%) |
| Public Administration | 0 (0.0%) | 0 (0.0%) |
| Total | 8 (57.1%) | 6 (42.9%) |
Education in Grandfather
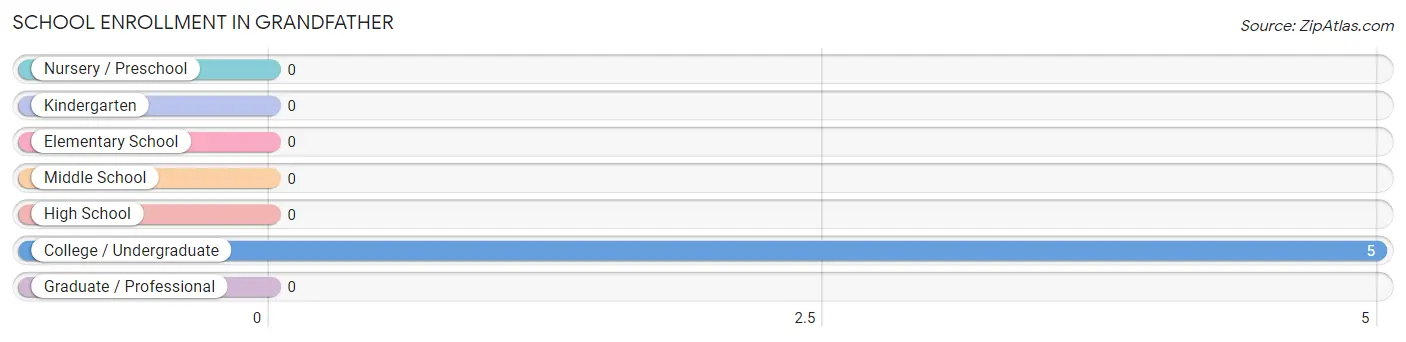
School Enrollment in Grandfather
| School Level | # Students | % Students |
| Nursery / Preschool | 0 | 0.0% |
| Kindergarten | 0 | 0.0% |
| Elementary School | 0 | 0.0% |
| Middle School | 0 | 0.0% |
| High School | 0 | 0.0% |
| College / Undergraduate | 5 | 100.0% |
| Graduate / Professional | 0 | 0.0% |
| Total | 5 | 100.0% |
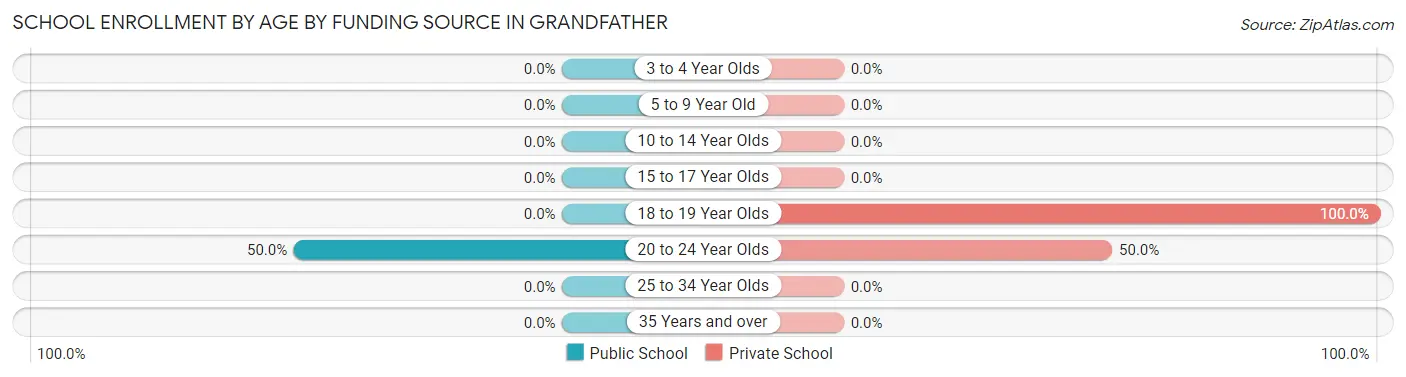
School Enrollment by Age by Funding Source in Grandfather
Out of a total of 5 students who are enrolled in schools in Grandfather, 3 (60.0%) attend a private institution, while the remaining 2 (40.0%) are enrolled in public schools. The age group of 18 to 19 year olds has the highest likelihood of being enrolled in private schools, with 1 (100.0% in the age bracket) enrolled. Conversely, the age group of 20 to 24 year olds has the lowest likelihood of being enrolled in a private school, with 2 (50.0% in the age bracket) attending a public institution.
| Age Bracket | Public School | Private School |
| 3 to 4 Year Olds | 0 (0.0%) | 0 (0.0%) |
| 5 to 9 Year Old | 0 (0.0%) | 0 (0.0%) |
| 10 to 14 Year Olds | 0 (0.0%) | 0 (0.0%) |
| 15 to 17 Year Olds | 0 (0.0%) | 0 (0.0%) |
| 18 to 19 Year Olds | 0 (0.0%) | 1 (100.0%) |
| 20 to 24 Year Olds | 2 (50.0%) | 2 (50.0%) |
| 25 to 34 Year Olds | 0 (0.0%) | 0 (0.0%) |
| 35 Years and over | 0 (0.0%) | 0 (0.0%) |
| Total | 2 (40.0%) | 3 (60.0%) |
Educational Attainment by Field of Study in Grandfather
Business (10 | 20.0%), engineering (8 | 16.0%), computers & mathematics (6 | 12.0%), psychology (4 | 8.0%), and science & technology (4 | 8.0%) are the most common fields of study among 50 individuals in Grandfather who have obtained a bachelor's degree or higher.
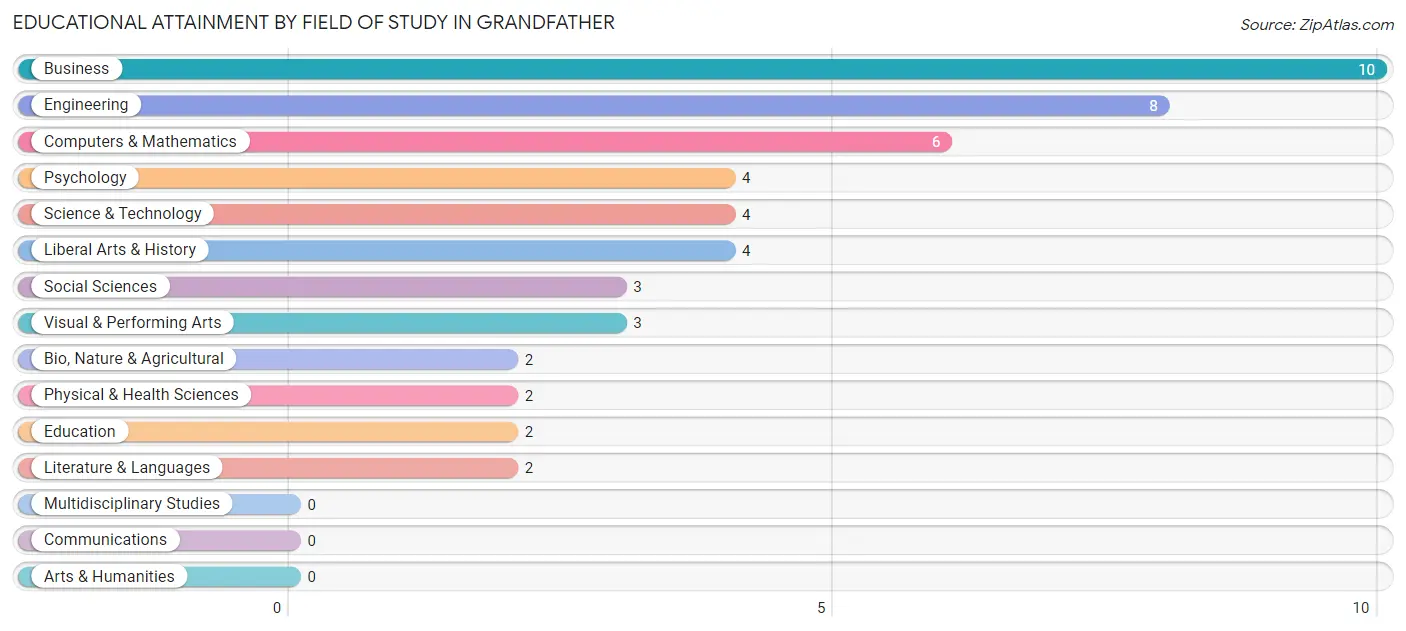
| Field of Study | # Graduates | % Graduates |
| Computers & Mathematics | 6 | 12.0% |
| Bio, Nature & Agricultural | 2 | 4.0% |
| Physical & Health Sciences | 2 | 4.0% |
| Psychology | 4 | 8.0% |
| Social Sciences | 3 | 6.0% |
| Engineering | 8 | 16.0% |
| Multidisciplinary Studies | 0 | 0.0% |
| Science & Technology | 4 | 8.0% |
| Business | 10 | 20.0% |
| Education | 2 | 4.0% |
| Literature & Languages | 2 | 4.0% |
| Liberal Arts & History | 4 | 8.0% |
| Visual & Performing Arts | 3 | 6.0% |
| Communications | 0 | 0.0% |
| Arts & Humanities | 0 | 0.0% |
| Total | 50 | 100.0% |
Transportation & Commute in Grandfather
Vehicle Availability by Sex in Grandfather
The most prevalent vehicle ownership categories in Grandfather are males with 2 vehicles (7, accounting for 87.5%) and females with 2 vehicles (6, making up 116.7%).
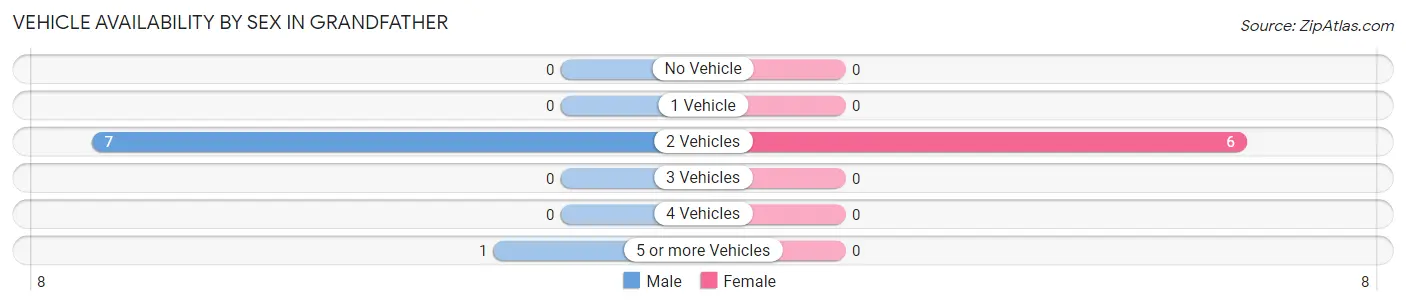
| Vehicles Available | Male | Female |
| No Vehicle | 0 (0.0%) | 0 (0.0%) |
| 1 Vehicle | 0 (0.0%) | 0 (0.0%) |
| 2 Vehicles | 7 (87.5%) | 6 (100.0%) |
| 3 Vehicles | 0 (0.0%) | 0 (0.0%) |
| 4 Vehicles | 0 (0.0%) | 0 (0.0%) |
| 5 or more Vehicles | 1 (12.5%) | 0 (0.0%) |
| Total | 8 (100.0%) | 6 (100.0%) |
Commute Time in Grandfather
The most frequently occuring commute durations in Grandfather are 10 to 14 minutes (5 commuters, 45.5%), 15 to 19 minutes (3 commuters, 27.3%), and 90 or more minutes (2 commuters, 18.2%).
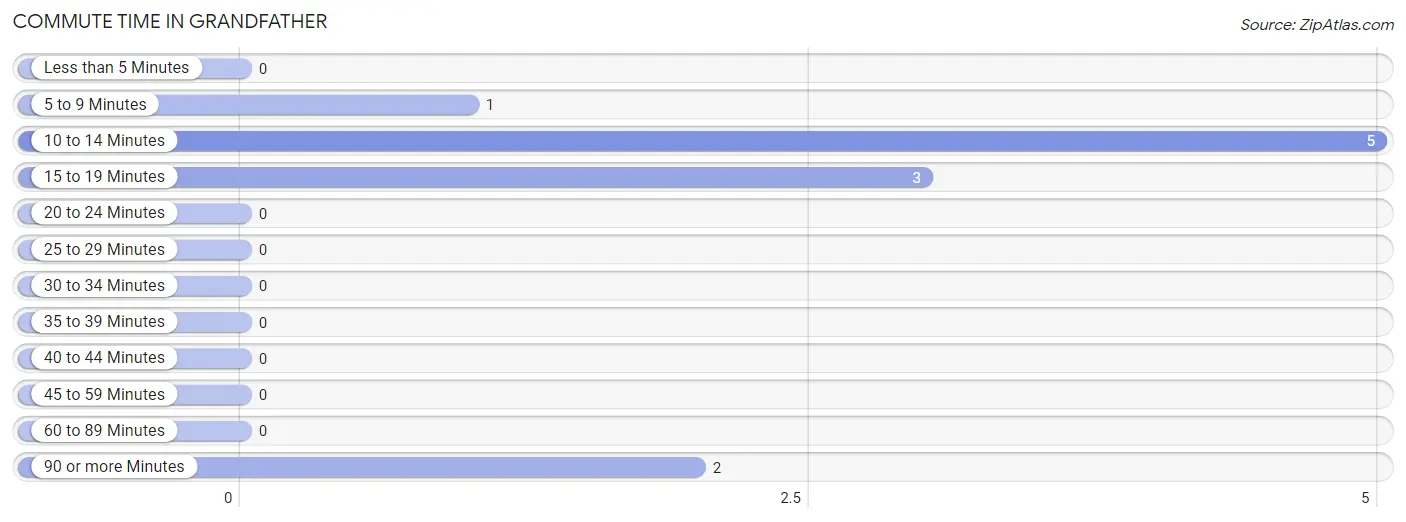
| Commute Time | # Commuters | % Commuters |
| Less than 5 Minutes | 0 | 0.0% |
| 5 to 9 Minutes | 1 | 9.1% |
| 10 to 14 Minutes | 5 | 45.5% |
| 15 to 19 Minutes | 3 | 27.3% |
| 20 to 24 Minutes | 0 | 0.0% |
| 25 to 29 Minutes | 0 | 0.0% |
| 30 to 34 Minutes | 0 | 0.0% |
| 35 to 39 Minutes | 0 | 0.0% |
| 40 to 44 Minutes | 0 | 0.0% |
| 45 to 59 Minutes | 0 | 0.0% |
| 60 to 89 Minutes | 0 | 0.0% |
| 90 or more Minutes | 2 | 18.2% |
Commute Time by Sex in Grandfather
The most common commute times in Grandfather are 15 to 19 minutes (3 commuters, 37.5%) for males and 10 to 14 minutes (3 commuters, 100.0%) for females.
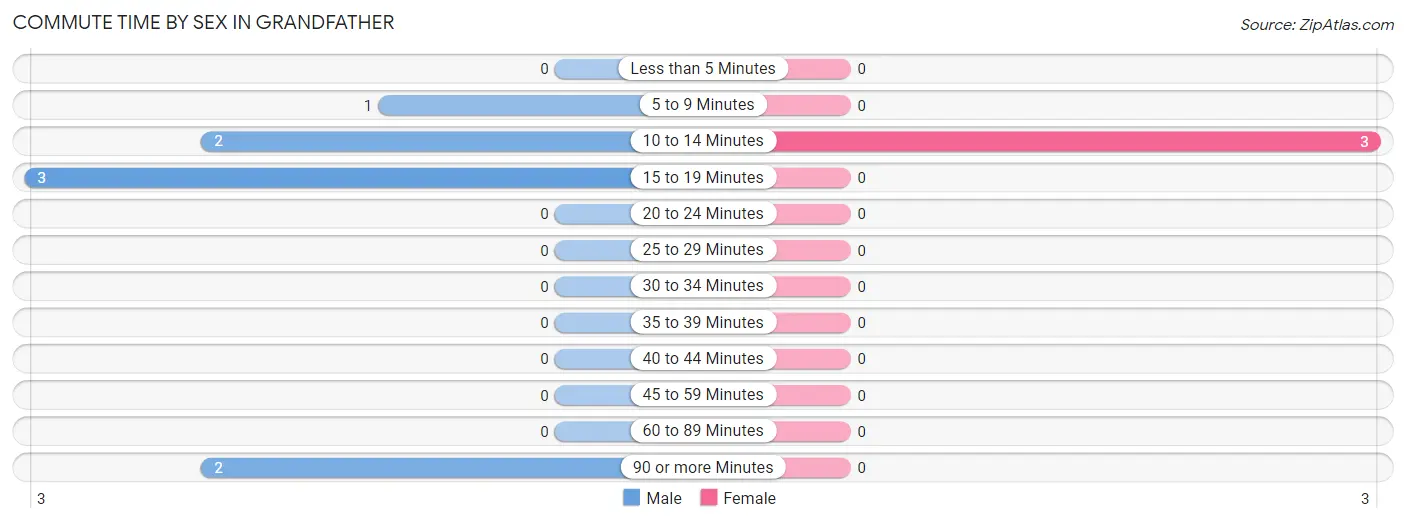
| Commute Time | Male | Female |
| Less than 5 Minutes | 0 (0.0%) | 0 (0.0%) |
| 5 to 9 Minutes | 1 (12.5%) | 0 (0.0%) |
| 10 to 14 Minutes | 2 (25.0%) | 3 (100.0%) |
| 15 to 19 Minutes | 3 (37.5%) | 0 (0.0%) |
| 20 to 24 Minutes | 0 (0.0%) | 0 (0.0%) |
| 25 to 29 Minutes | 0 (0.0%) | 0 (0.0%) |
| 30 to 34 Minutes | 0 (0.0%) | 0 (0.0%) |
| 35 to 39 Minutes | 0 (0.0%) | 0 (0.0%) |
| 40 to 44 Minutes | 0 (0.0%) | 0 (0.0%) |
| 45 to 59 Minutes | 0 (0.0%) | 0 (0.0%) |
| 60 to 89 Minutes | 0 (0.0%) | 0 (0.0%) |
| 90 or more Minutes | 2 (25.0%) | 0 (0.0%) |
Time of Departure to Work by Sex in Grandfather
The most frequent times of departure to work in Grandfather are 8:00 AM to 8:29 AM (4, 50.0%) for males and 10:00 AM to 10:59 AM (3, 100.0%) for females.
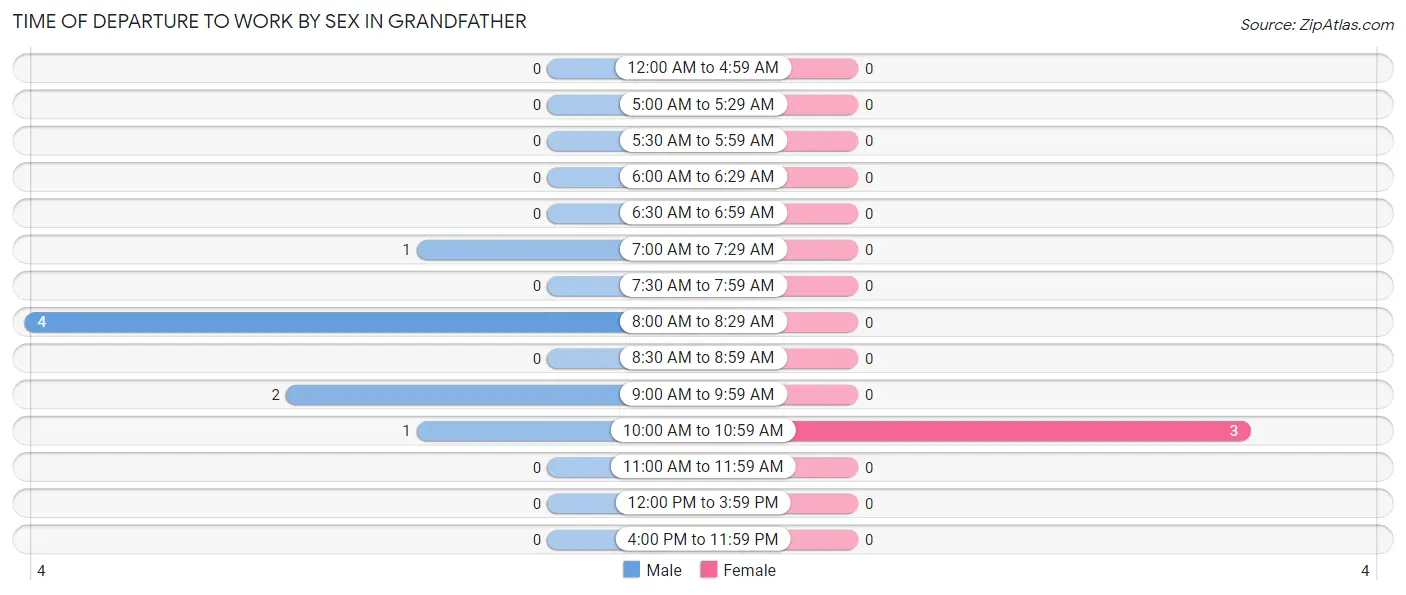
| Time of Departure | Male | Female |
| 12:00 AM to 4:59 AM | 0 (0.0%) | 0 (0.0%) |
| 5:00 AM to 5:29 AM | 0 (0.0%) | 0 (0.0%) |
| 5:30 AM to 5:59 AM | 0 (0.0%) | 0 (0.0%) |
| 6:00 AM to 6:29 AM | 0 (0.0%) | 0 (0.0%) |
| 6:30 AM to 6:59 AM | 0 (0.0%) | 0 (0.0%) |
| 7:00 AM to 7:29 AM | 1 (12.5%) | 0 (0.0%) |
| 7:30 AM to 7:59 AM | 0 (0.0%) | 0 (0.0%) |
| 8:00 AM to 8:29 AM | 4 (50.0%) | 0 (0.0%) |
| 8:30 AM to 8:59 AM | 0 (0.0%) | 0 (0.0%) |
| 9:00 AM to 9:59 AM | 2 (25.0%) | 0 (0.0%) |
| 10:00 AM to 10:59 AM | 1 (12.5%) | 3 (100.0%) |
| 11:00 AM to 11:59 AM | 0 (0.0%) | 0 (0.0%) |
| 12:00 PM to 3:59 PM | 0 (0.0%) | 0 (0.0%) |
| 4:00 PM to 11:59 PM | 0 (0.0%) | 0 (0.0%) |
| Total | 8 (100.0%) | 3 (100.0%) |
Housing Occupancy in Grandfather
Occupancy by Ownership in Grandfather
Of the total 24 dwellings in Grandfather, owner-occupied units account for 24 (100.0%), while renter-occupied units make up 0 (0.0%).
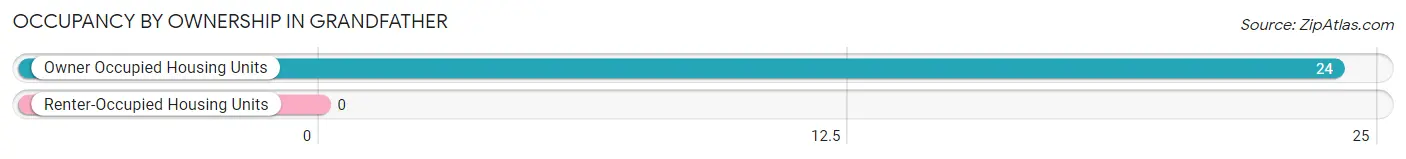
| Occupancy | # Housing Units | % Housing Units |
| Owner Occupied Housing Units | 24 | 100.0% |
| Renter-Occupied Housing Units | 0 | 0.0% |
| Total Occupied Housing Units | 24 | 100.0% |
Occupancy by Household Size in Grandfather
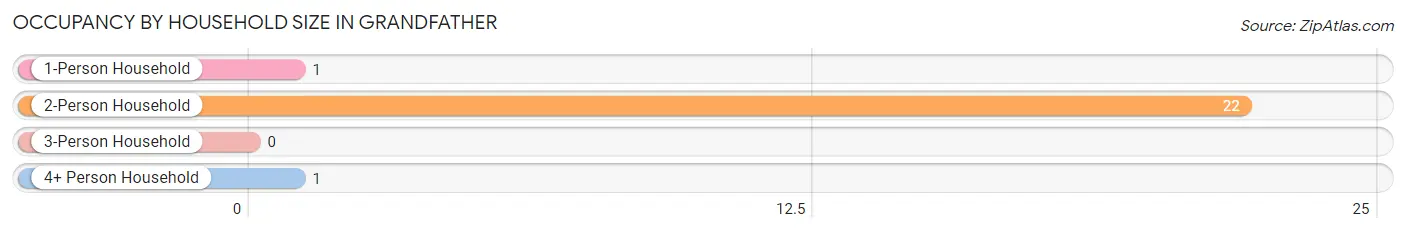
| Household Size | # Housing Units | % Housing Units |
| 1-Person Household | 1 | 4.2% |
| 2-Person Household | 22 | 91.7% |
| 3-Person Household | 0 | 0.0% |
| 4+ Person Household | 1 | 4.2% |
| Total Housing Units | 24 | 100.0% |
Occupancy by Ownership by Household Size in Grandfather
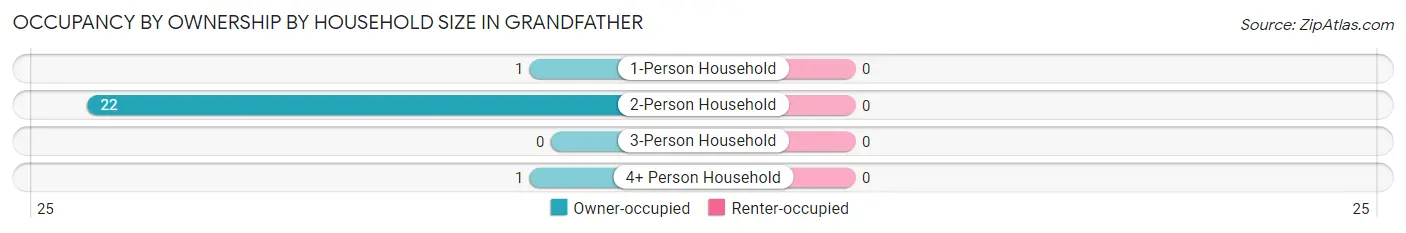
| Household Size | Owner-occupied | Renter-occupied |
| 1-Person Household | 1 (100.0%) | 0 (0.0%) |
| 2-Person Household | 22 (100.0%) | 0 (0.0%) |
| 3-Person Household | 0 (0.0%) | 0 (0.0%) |
| 4+ Person Household | 1 (100.0%) | 0 (0.0%) |
| Total Housing Units | 24 (100.0%) | 0 (0.0%) |
Occupancy by Educational Attainment in Grandfather
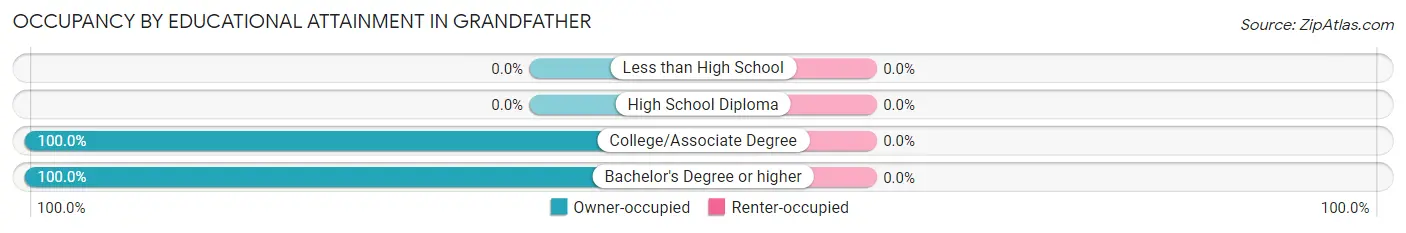
| Household Size | Owner-occupied | Renter-occupied |
| Less than High School | 0 (0.0%) | 0 (0.0%) |
| High School Diploma | 0 (0.0%) | 0 (0.0%) |
| College/Associate Degree | 4 (100.0%) | 0 (0.0%) |
| Bachelor's Degree or higher | 20 (100.0%) | 0 (0.0%) |
Occupancy by Age of Householder in Grandfather
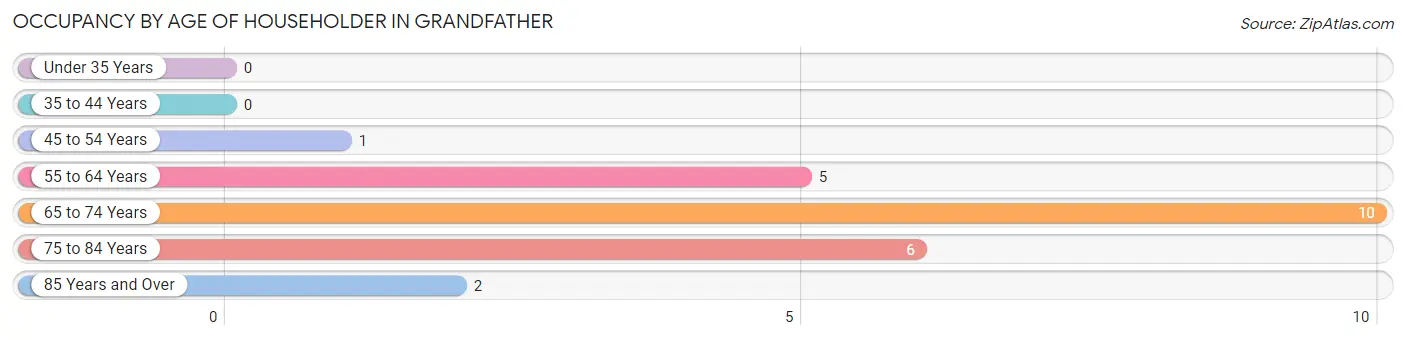
| Age Bracket | # Households | % Households |
| Under 35 Years | 0 | 0.0% |
| 35 to 44 Years | 0 | 0.0% |
| 45 to 54 Years | 1 | 4.2% |
| 55 to 64 Years | 5 | 20.8% |
| 65 to 74 Years | 10 | 41.7% |
| 75 to 84 Years | 6 | 25.0% |
| 85 Years and Over | 2 | 8.3% |
| Total | 24 | 100.0% |
Housing Finances in Grandfather
Median Income by Occupancy in Grandfather
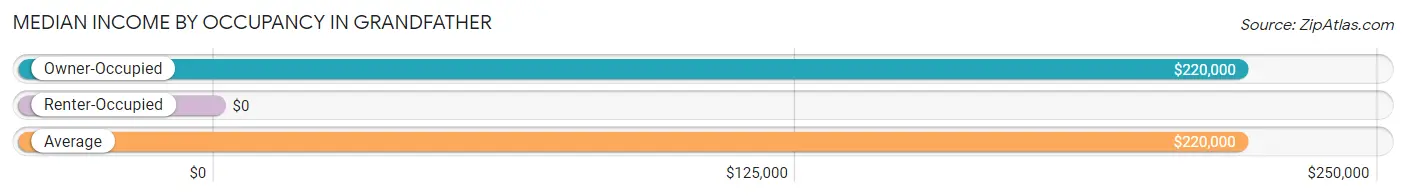
| Occupancy Type | # Households | Median Income |
| Owner-Occupied | 24 (100.0%) | $220,000 |
| Renter-Occupied | 0 (0.0%) | $0 |
| Average | 24 (100.0%) | $220,000 |
Occupancy by Householder Income Bracket in Grandfather
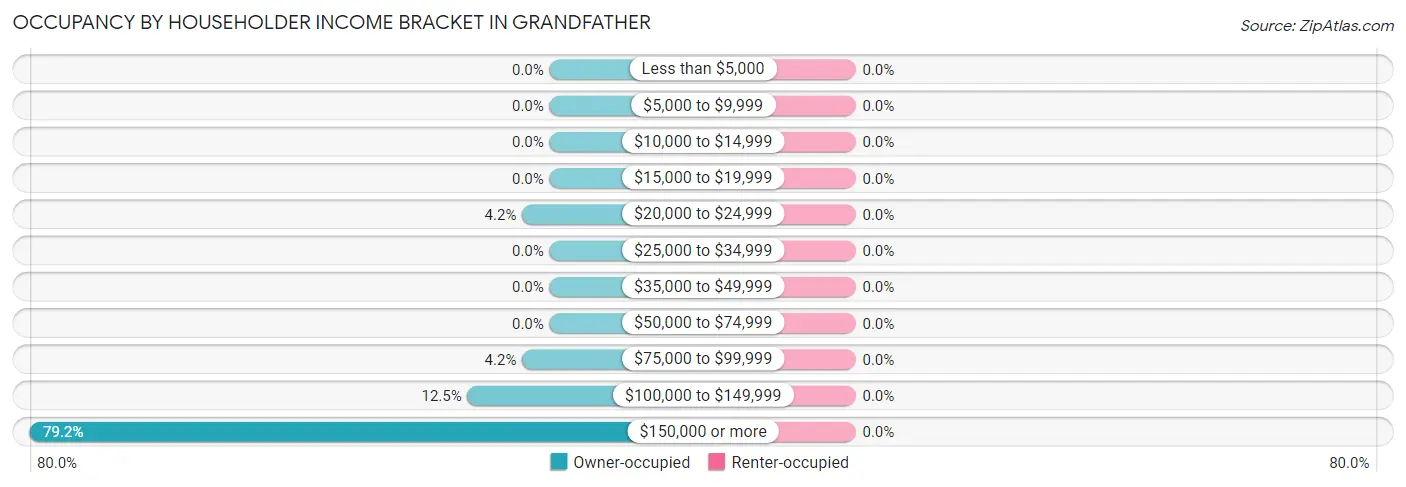
| Income Bracket | Owner-occupied | Renter-occupied |
| Less than $5,000 | 0 (0.0%) | 0 (0.0%) |
| $5,000 to $9,999 | 0 (0.0%) | 0 (0.0%) |
| $10,000 to $14,999 | 0 (0.0%) | 0 (0.0%) |
| $15,000 to $19,999 | 0 (0.0%) | 0 (0.0%) |
| $20,000 to $24,999 | 1 (4.2%) | 0 (0.0%) |
| $25,000 to $34,999 | 0 (0.0%) | 0 (0.0%) |
| $35,000 to $49,999 | 0 (0.0%) | 0 (0.0%) |
| $50,000 to $74,999 | 0 (0.0%) | 0 (0.0%) |
| $75,000 to $99,999 | 1 (4.2%) | 0 (0.0%) |
| $100,000 to $149,999 | 3 (12.5%) | 0 (0.0%) |
| $150,000 or more | 19 (79.2%) | 0 (0.0%) |
| Total | 24 (100.0%) | 0 (0.0%) |
Monthly Housing Cost Tiers in Grandfather
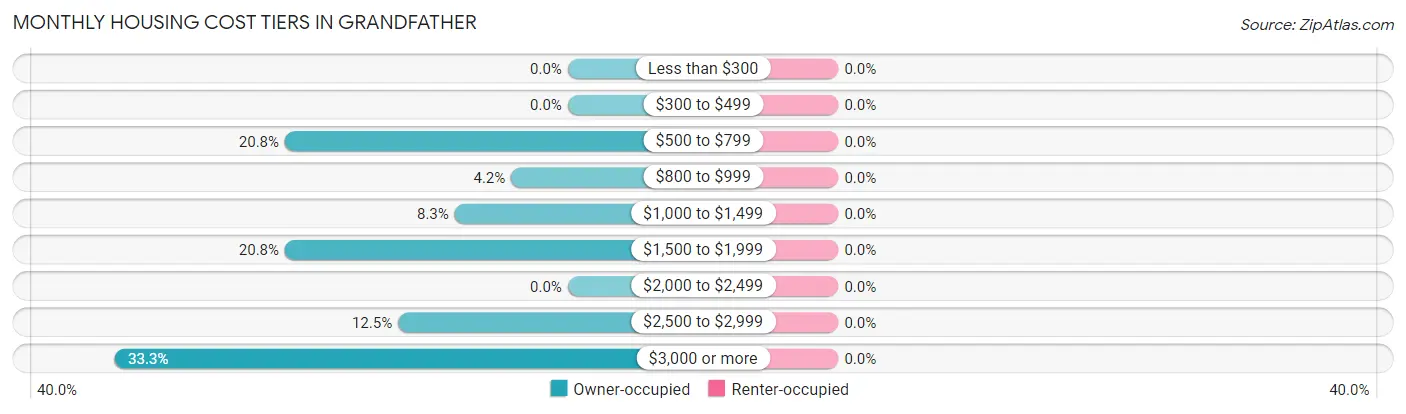
| Monthly Cost | Owner-occupied | Renter-occupied |
| Less than $300 | 0 (0.0%) | 0 (0.0%) |
| $300 to $499 | 0 (0.0%) | 0 (0.0%) |
| $500 to $799 | 5 (20.8%) | 0 (0.0%) |
| $800 to $999 | 1 (4.2%) | 0 (0.0%) |
| $1,000 to $1,499 | 2 (8.3%) | 0 (0.0%) |
| $1,500 to $1,999 | 5 (20.8%) | 0 (0.0%) |
| $2,000 to $2,499 | 0 (0.0%) | 0 (0.0%) |
| $2,500 to $2,999 | 3 (12.5%) | 0 (0.0%) |
| $3,000 or more | 8 (33.3%) | 0 (0.0%) |
| Total | 24 (100.0%) | 0 (0.0%) |
Physical Housing Characteristics in Grandfather
Housing Structures in Grandfather
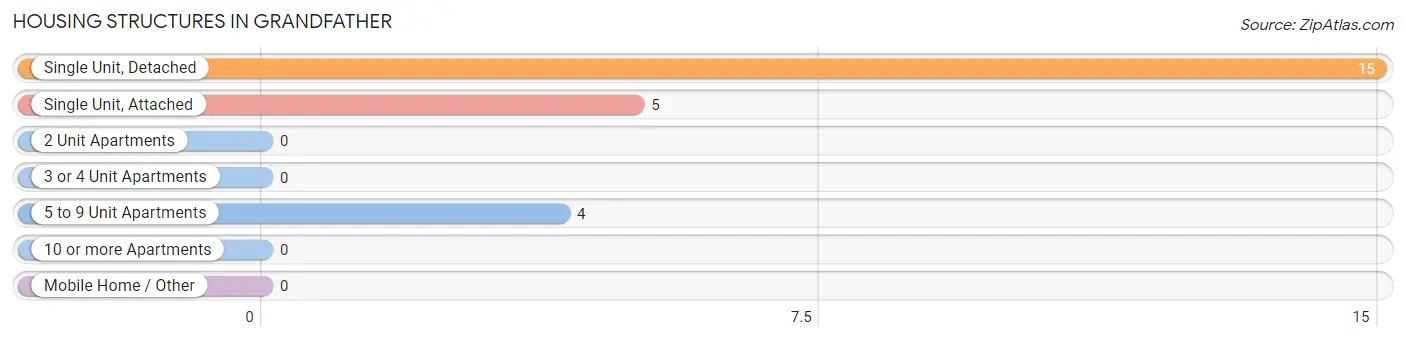
| Structure Type | # Housing Units | % Housing Units |
| Single Unit, Detached | 15 | 62.5% |
| Single Unit, Attached | 5 | 20.8% |
| 2 Unit Apartments | 0 | 0.0% |
| 3 or 4 Unit Apartments | 0 | 0.0% |
| 5 to 9 Unit Apartments | 4 | 16.7% |
| 10 or more Apartments | 0 | 0.0% |
| Mobile Home / Other | 0 | 0.0% |
| Total | 24 | 100.0% |
Housing Structures by Occupancy in Grandfather
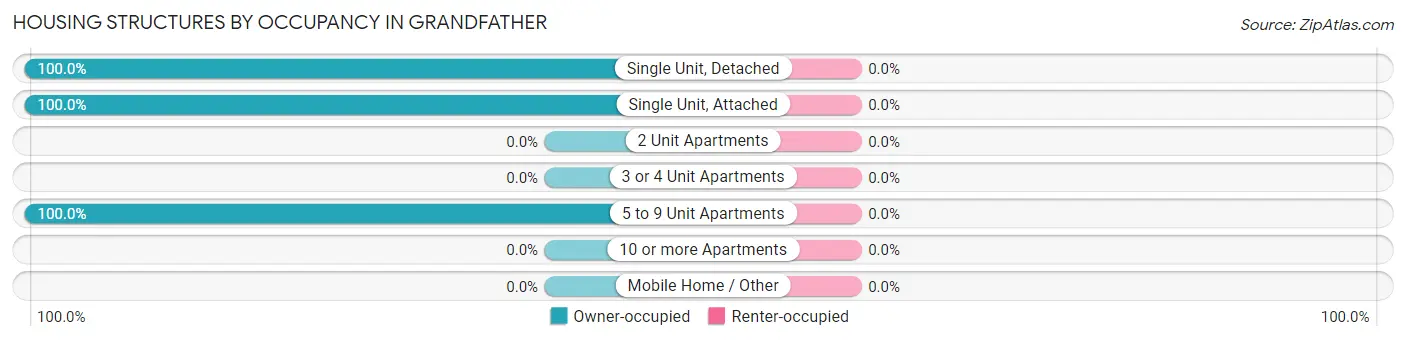
| Structure Type | Owner-occupied | Renter-occupied |
| Single Unit, Detached | 15 (100.0%) | 0 (0.0%) |
| Single Unit, Attached | 5 (100.0%) | 0 (0.0%) |
| 2 Unit Apartments | 0 (0.0%) | 0 (0.0%) |
| 3 or 4 Unit Apartments | 0 (0.0%) | 0 (0.0%) |
| 5 to 9 Unit Apartments | 4 (100.0%) | 0 (0.0%) |
| 10 or more Apartments | 0 (0.0%) | 0 (0.0%) |
| Mobile Home / Other | 0 (0.0%) | 0 (0.0%) |
| Total | 24 (100.0%) | 0 (0.0%) |
Housing Structures by Number of Rooms in Grandfather
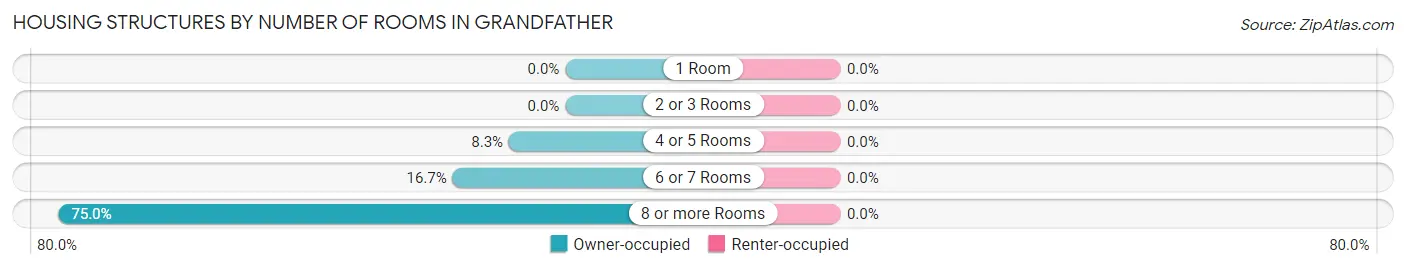
| Number of Rooms | Owner-occupied | Renter-occupied |
| 1 Room | 0 (0.0%) | 0 (0.0%) |
| 2 or 3 Rooms | 0 (0.0%) | 0 (0.0%) |
| 4 or 5 Rooms | 2 (8.3%) | 0 (0.0%) |
| 6 or 7 Rooms | 4 (16.7%) | 0 (0.0%) |
| 8 or more Rooms | 18 (75.0%) | 0 (0.0%) |
| Total | 24 (100.0%) | 0 (0.0%) |
Housing Structure by Heating Type in Grandfather
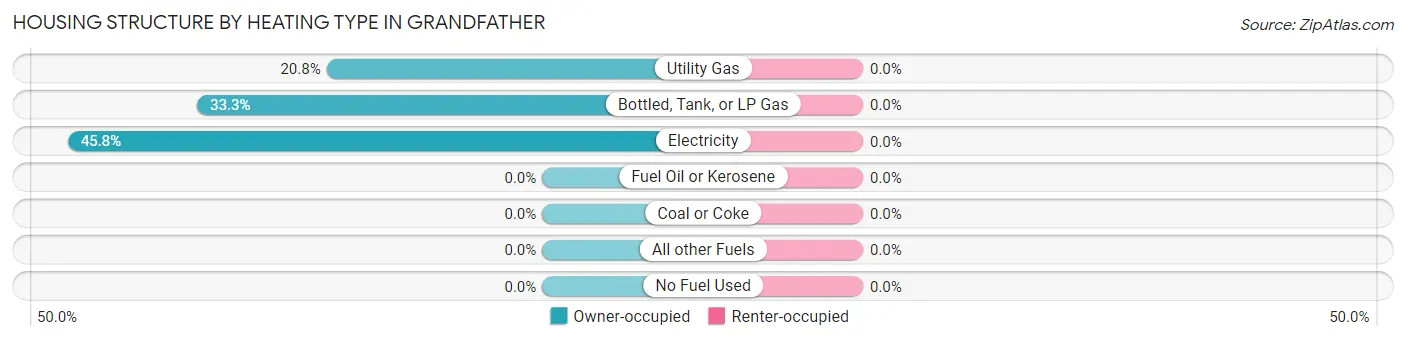
| Heating Type | Owner-occupied | Renter-occupied |
| Utility Gas | 5 (20.8%) | 0 (0.0%) |
| Bottled, Tank, or LP Gas | 8 (33.3%) | 0 (0.0%) |
| Electricity | 11 (45.8%) | 0 (0.0%) |
| Fuel Oil or Kerosene | 0 (0.0%) | 0 (0.0%) |
| Coal or Coke | 0 (0.0%) | 0 (0.0%) |
| All other Fuels | 0 (0.0%) | 0 (0.0%) |
| No Fuel Used | 0 (0.0%) | 0 (0.0%) |
| Total | 24 (100.0%) | 0 (0.0%) |
Household Vehicle Usage in Grandfather
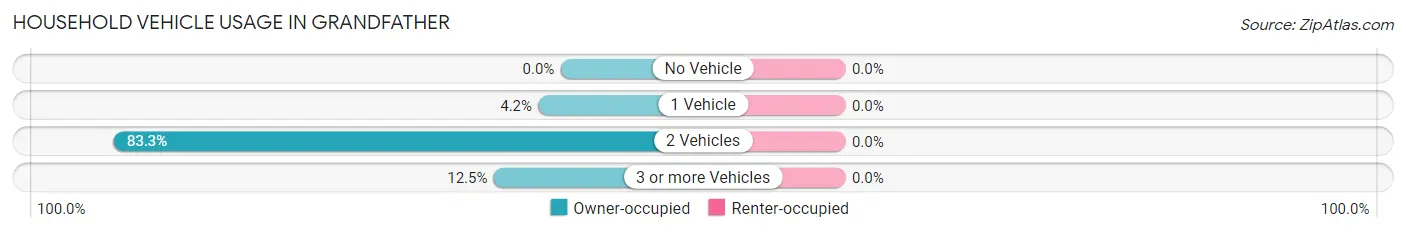
| Vehicles per Household | Owner-occupied | Renter-occupied |
| No Vehicle | 0 (0.0%) | 0 (0.0%) |
| 1 Vehicle | 1 (4.2%) | 0 (0.0%) |
| 2 Vehicles | 20 (83.3%) | 0 (0.0%) |
| 3 or more Vehicles | 3 (12.5%) | 0 (0.0%) |
| Total | 24 (100.0%) | 0 (0.0%) |
Real Estate & Mortgages in Grandfather
Real Estate and Mortgage Overview in Grandfather
| Characteristic | Without Mortgage | With Mortgage |
| Housing Units | 13 | 11 |
| Median Property Value | $937,500 | $1,343,800 |
| Median Household Income | $223,125 | $8 |
| Monthly Housing Costs | $1,150 | $4 |
| Real Estate Taxes | $5,938 | $0 |
Property Value by Mortgage Status in Grandfather
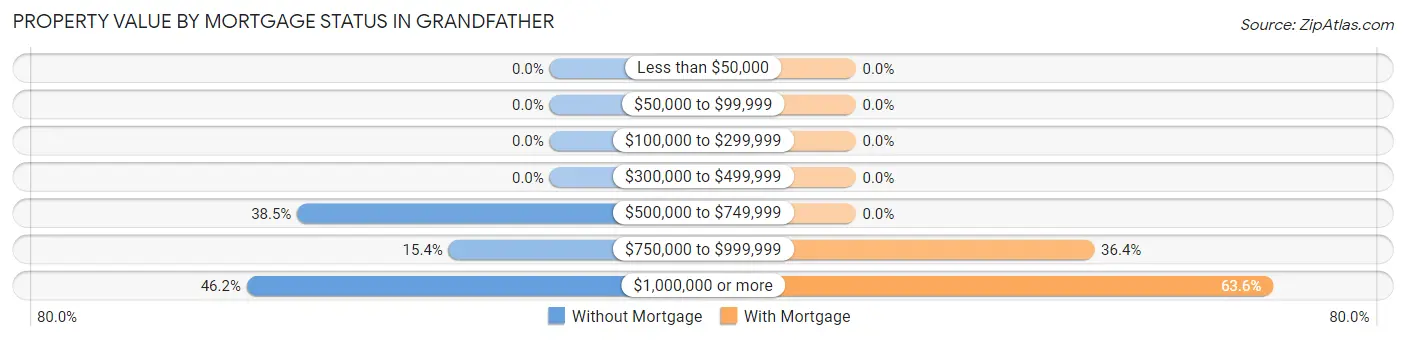
| Property Value | Without Mortgage | With Mortgage |
| Less than $50,000 | 0 (0.0%) | 0 (0.0%) |
| $50,000 to $99,999 | 0 (0.0%) | 0 (0.0%) |
| $100,000 to $299,999 | 0 (0.0%) | 0 (0.0%) |
| $300,000 to $499,999 | 0 (0.0%) | 0 (0.0%) |
| $500,000 to $749,999 | 5 (38.5%) | 0 (0.0%) |
| $750,000 to $999,999 | 2 (15.4%) | 4 (36.4%) |
| $1,000,000 or more | 6 (46.2%) | 7 (63.6%) |
| Total | 13 (100.0%) | 11 (100.0%) |
Household Income by Mortgage Status in Grandfather
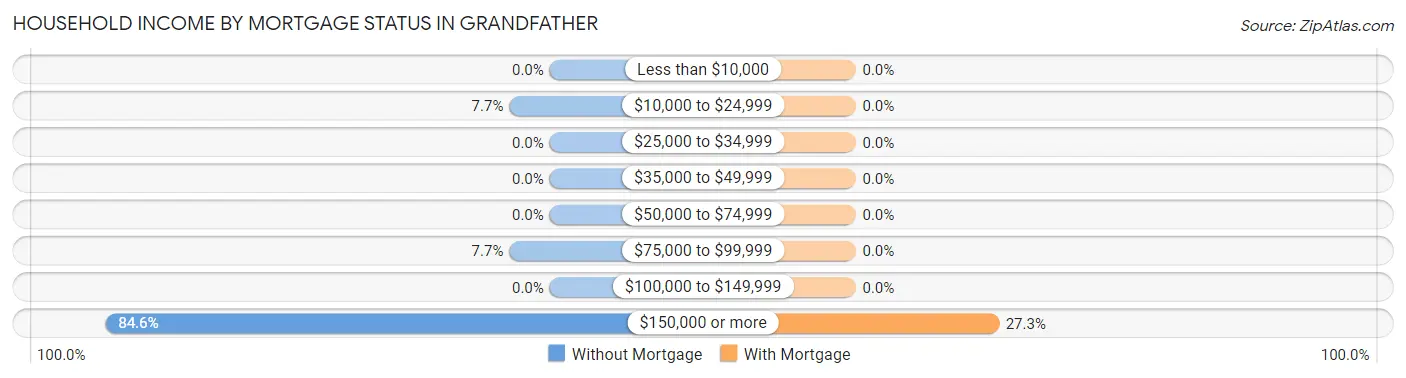
| Household Income | Without Mortgage | With Mortgage |
| Less than $10,000 | 0 (0.0%) | 0 (0.0%) |
| $10,000 to $24,999 | 1 (7.7%) | 0 (0.0%) |
| $25,000 to $34,999 | 0 (0.0%) | 0 (0.0%) |
| $35,000 to $49,999 | 0 (0.0%) | 0 (0.0%) |
| $50,000 to $74,999 | 0 (0.0%) | 0 (0.0%) |
| $75,000 to $99,999 | 1 (7.7%) | 0 (0.0%) |
| $100,000 to $149,999 | 0 (0.0%) | 0 (0.0%) |
| $150,000 or more | 11 (84.6%) | 3 (27.3%) |
| Total | 13 (100.0%) | 11 (100.0%) |
Property Value to Household Income Ratio in Grandfather
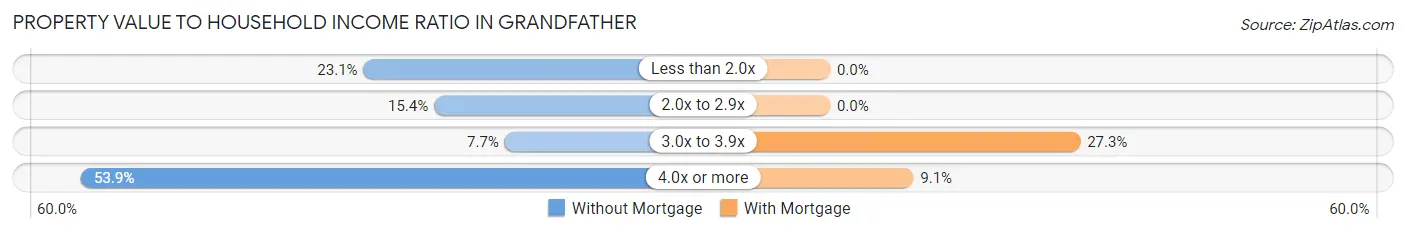
| Value-to-Income Ratio | Without Mortgage | With Mortgage |
| Less than 2.0x | 3 (23.1%) | 0 (0.0%) |
| 2.0x to 2.9x | 2 (15.4%) | 0 (0.0%) |
| 3.0x to 3.9x | 1 (7.7%) | 3 (27.3%) |
| 4.0x or more | 7 (53.8%) | 1 (9.1%) |
| Total | 13 (100.0%) | 11 (100.0%) |
Real Estate Taxes by Mortgage Status in Grandfather
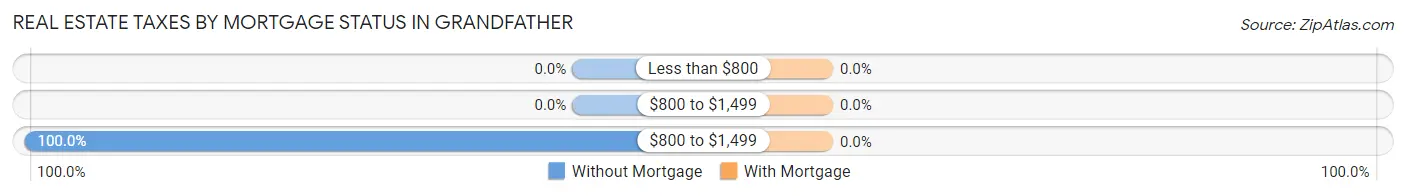
| Property Taxes | Without Mortgage | With Mortgage |
| Less than $800 | 0 (0.0%) | 0 (0.0%) |
| $800 to $1,499 | 0 (0.0%) | 0 (0.0%) |
| $800 to $1,499 | 13 (100.0%) | 0 (0.0%) |
| Total | 13 (100.0%) | 11 (100.0%) |
Health & Disability in Grandfather
Health Insurance Coverage by Age in Grandfather
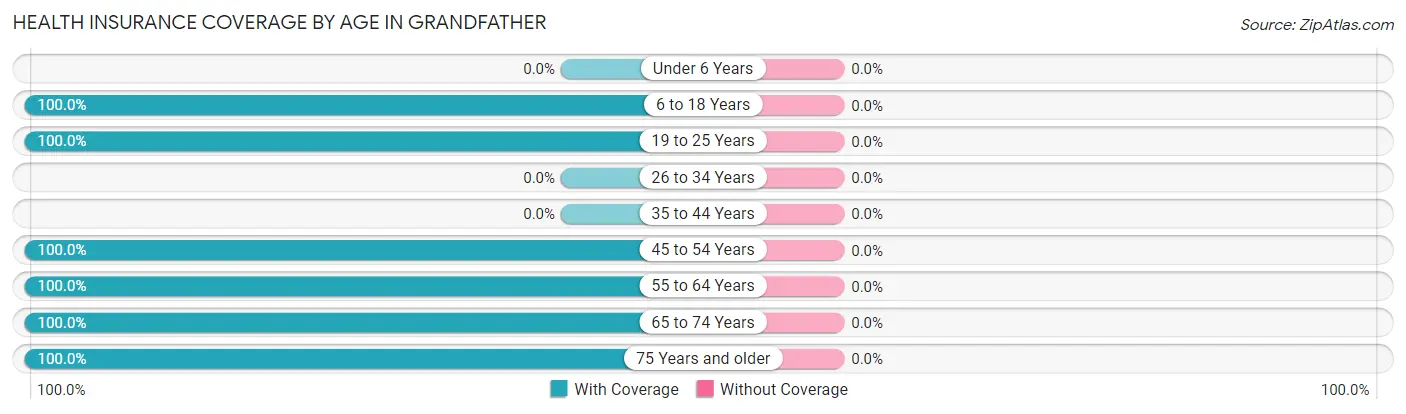
| Age Bracket | With Coverage | Without Coverage |
| Under 6 Years | 0 (0.0%) | 0 (0.0%) |
| 6 to 18 Years | 1 (100.0%) | 0 (0.0%) |
| 19 to 25 Years | 4 (100.0%) | 0 (0.0%) |
| 26 to 34 Years | 0 (0.0%) | 0 (0.0%) |
| 35 to 44 Years | 0 (0.0%) | 0 (0.0%) |
| 45 to 54 Years | 4 (100.0%) | 0 (0.0%) |
| 55 to 64 Years | 10 (100.0%) | 0 (0.0%) |
| 65 to 74 Years | 20 (100.0%) | 0 (0.0%) |
| 75 Years and older | 18 (100.0%) | 0 (0.0%) |
| Total | 57 (100.0%) | 0 (0.0%) |
Health Insurance Coverage by Citizenship Status in Grandfather
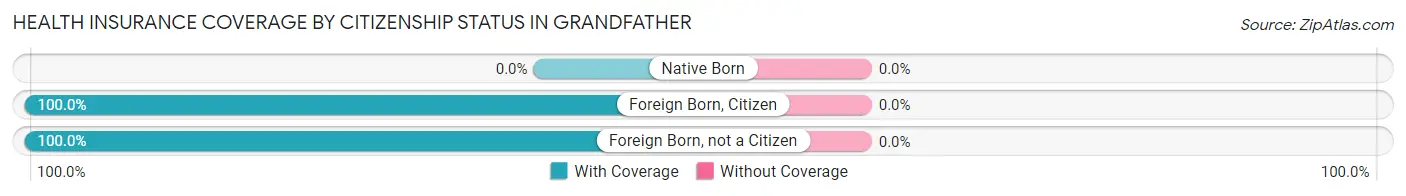
| Citizenship Status | With Coverage | Without Coverage |
| Native Born | 0 (0.0%) | 0 (0.0%) |
| Foreign Born, Citizen | 1 (100.0%) | 0 (0.0%) |
| Foreign Born, not a Citizen | 4 (100.0%) | 0 (0.0%) |
Health Insurance Coverage by Household Income in Grandfather
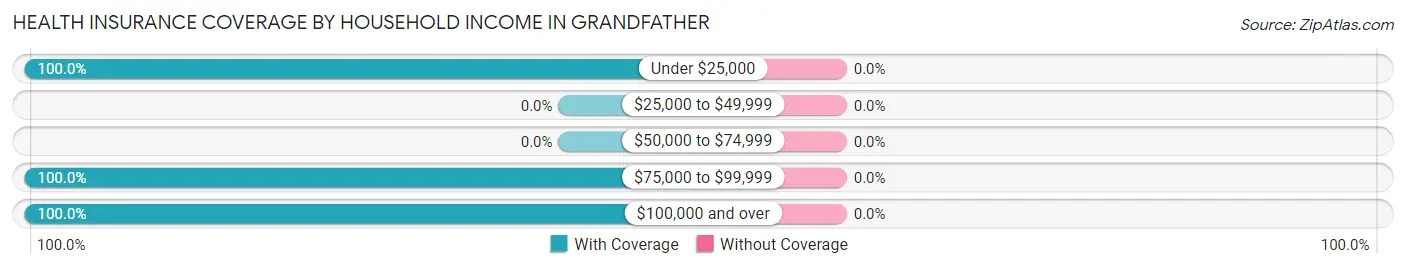
| Household Income | With Coverage | Without Coverage |
| Under $25,000 | 1 (100.0%) | 0 (0.0%) |
| $25,000 to $49,999 | 0 (0.0%) | 0 (0.0%) |
| $50,000 to $74,999 | 0 (0.0%) | 0 (0.0%) |
| $75,000 to $99,999 | 3 (100.0%) | 0 (0.0%) |
| $100,000 and over | 53 (100.0%) | 0 (0.0%) |
Public vs Private Health Insurance Coverage by Age in Grandfather
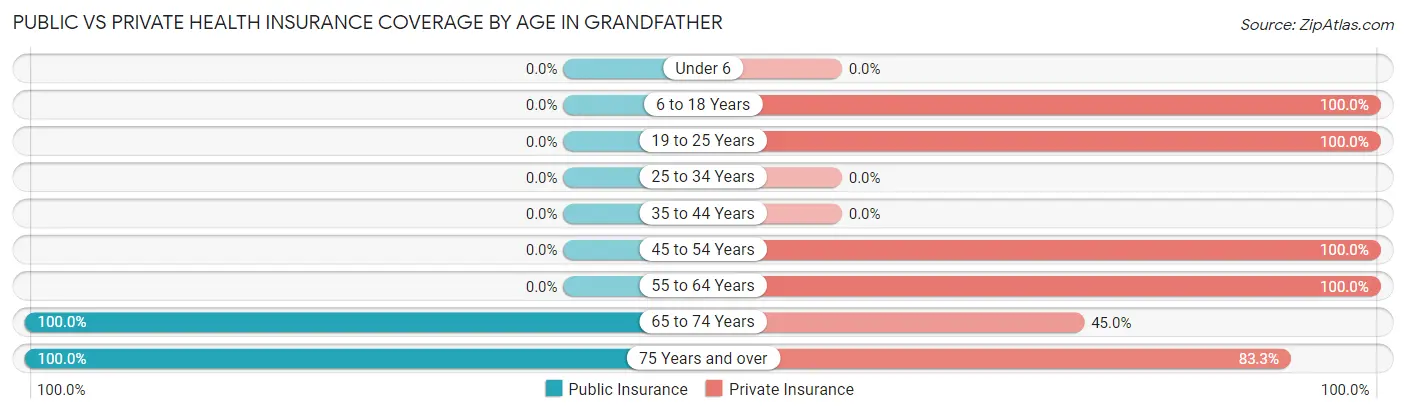
| Age Bracket | Public Insurance | Private Insurance |
| Under 6 | 0 (0.0%) | 0 (0.0%) |
| 6 to 18 Years | 0 (0.0%) | 1 (100.0%) |
| 19 to 25 Years | 0 (0.0%) | 4 (100.0%) |
| 25 to 34 Years | 0 (0.0%) | 0 (0.0%) |
| 35 to 44 Years | 0 (0.0%) | 0 (0.0%) |
| 45 to 54 Years | 0 (0.0%) | 4 (100.0%) |
| 55 to 64 Years | 0 (0.0%) | 10 (100.0%) |
| 65 to 74 Years | 20 (100.0%) | 9 (45.0%) |
| 75 Years and over | 18 (100.0%) | 15 (83.3%) |
| Total | 38 (66.7%) | 43 (75.4%) |
Disability Status by Sex by Age in Grandfather
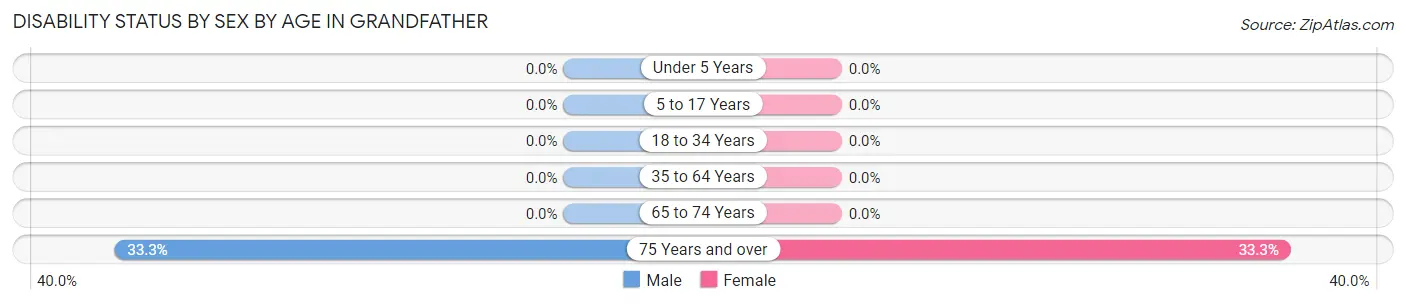
| Age Bracket | Male | Female |
| Under 5 Years | 0 (0.0%) | 0 (0.0%) |
| 5 to 17 Years | 0 (0.0%) | 0 (0.0%) |
| 18 to 34 Years | 0 (0.0%) | 0 (0.0%) |
| 35 to 64 Years | 0 (0.0%) | 0 (0.0%) |
| 65 to 74 Years | 0 (0.0%) | 0 (0.0%) |
| 75 Years and over | 4 (33.3%) | 2 (33.3%) |
Disability Class by Sex by Age in Grandfather
Disability Class: Hearing Difficulty
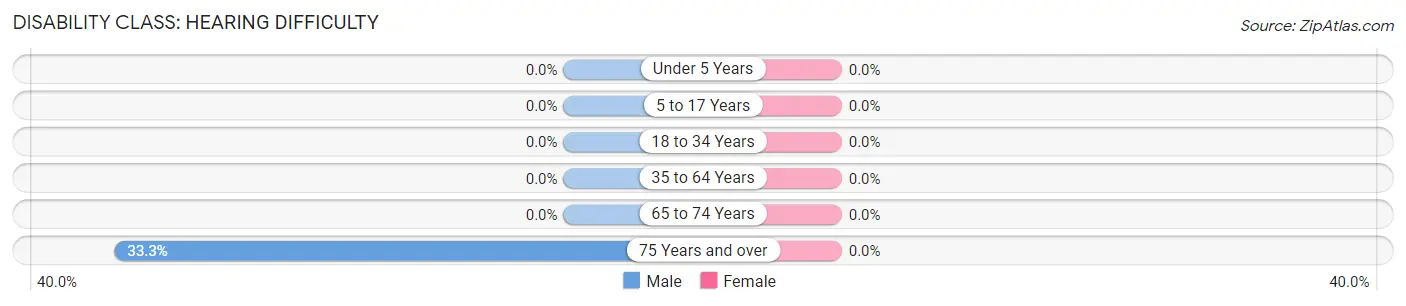
| Age Bracket | Male | Female |
| Under 5 Years | 0 (0.0%) | 0 (0.0%) |
| 5 to 17 Years | 0 (0.0%) | 0 (0.0%) |
| 18 to 34 Years | 0 (0.0%) | 0 (0.0%) |
| 35 to 64 Years | 0 (0.0%) | 0 (0.0%) |
| 65 to 74 Years | 0 (0.0%) | 0 (0.0%) |
| 75 Years and over | 4 (33.3%) | 0 (0.0%) |
Disability Class: Vision Difficulty
| Age Bracket | Male | Female |
| Under 5 Years | 0 (0.0%) | 0 (0.0%) |
| 5 to 17 Years | 0 (0.0%) | 0 (0.0%) |
| 18 to 34 Years | 0 (0.0%) | 0 (0.0%) |
| 35 to 64 Years | 0 (0.0%) | 0 (0.0%) |
| 65 to 74 Years | 0 (0.0%) | 0 (0.0%) |
| 75 Years and over | 0 (0.0%) | 0 (0.0%) |
Disability Class: Cognitive Difficulty
| Age Bracket | Male | Female |
| 5 to 17 Years | 0 (0.0%) | 0 (0.0%) |
| 18 to 34 Years | 0 (0.0%) | 0 (0.0%) |
| 35 to 64 Years | 0 (0.0%) | 0 (0.0%) |
| 65 to 74 Years | 0 (0.0%) | 0 (0.0%) |
| 75 Years and over | 0 (0.0%) | 0 (0.0%) |
Disability Class: Ambulatory Difficulty
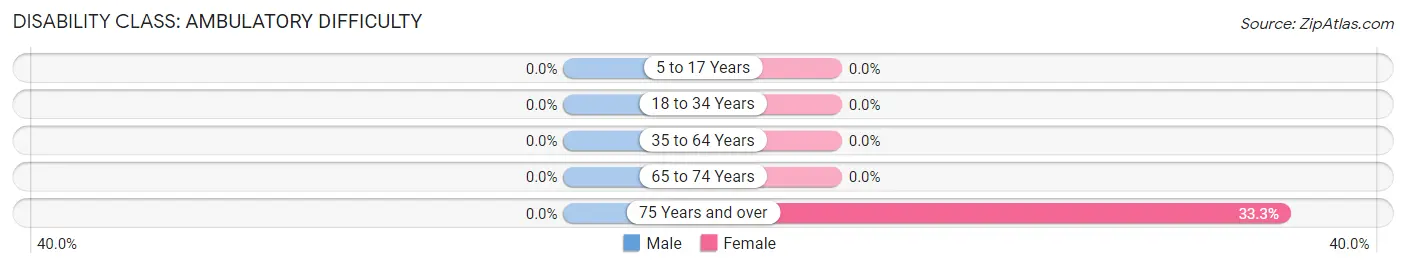
| Age Bracket | Male | Female |
| 5 to 17 Years | 0 (0.0%) | 0 (0.0%) |
| 18 to 34 Years | 0 (0.0%) | 0 (0.0%) |
| 35 to 64 Years | 0 (0.0%) | 0 (0.0%) |
| 65 to 74 Years | 0 (0.0%) | 0 (0.0%) |
| 75 Years and over | 0 (0.0%) | 2 (33.3%) |
Disability Class: Self-Care Difficulty
| Age Bracket | Male | Female |
| 5 to 17 Years | 0 (0.0%) | 0 (0.0%) |
| 18 to 34 Years | 0 (0.0%) | 0 (0.0%) |
| 35 to 64 Years | 0 (0.0%) | 0 (0.0%) |
| 65 to 74 Years | 0 (0.0%) | 0 (0.0%) |
| 75 Years and over | 0 (0.0%) | 0 (0.0%) |
Technology Access in Grandfather
Computing Device Access in Grandfather
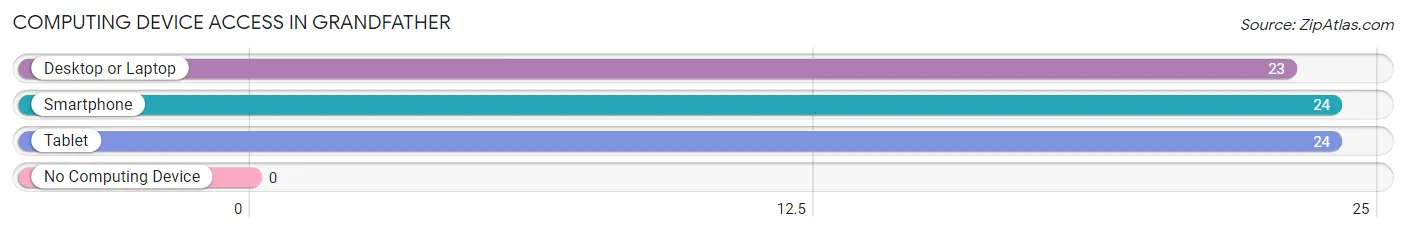
| Device Type | # Households | % Households |
| Desktop or Laptop | 23 | 95.8% |
| Smartphone | 24 | 100.0% |
| Tablet | 24 | 100.0% |
| No Computing Device | 0 | 0.0% |
| Total | 24 | 100.0% |
Internet Access in Grandfather
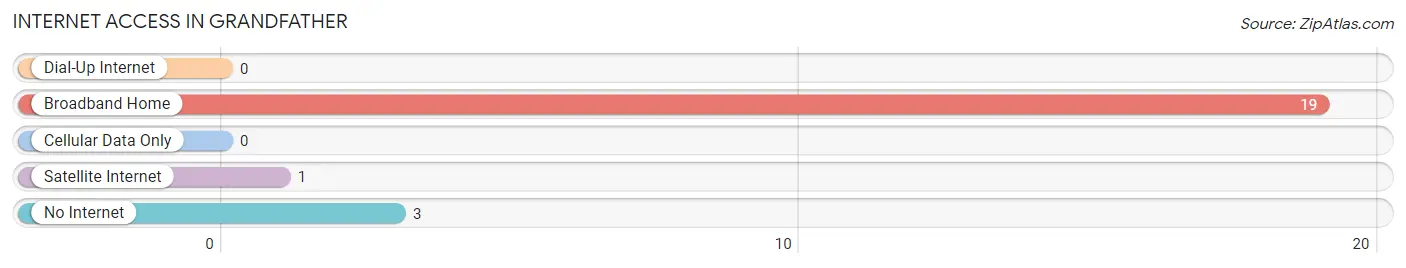
| Internet Type | # Households | % Households |
| Dial-Up Internet | 0 | 0.0% |
| Broadband Home | 19 | 79.2% |
| Cellular Data Only | 0 | 0.0% |
| Satellite Internet | 1 | 4.2% |
| No Internet | 3 | 12.5% |
| Total | 24 | 100.0% |
Grandfather Summary
Grandfather, North Carolina is a small town located in the Blue Ridge Mountains of North Carolina. It is situated in the foothills of the Appalachian Mountains and is part of the larger Foothills region of the state. Grandfather is located in Caldwell County, which is part of the Hickory-Lenoir-Morganton Metropolitan Statistical Area. The town has a population of approximately 1,000 people and is known for its scenic beauty and outdoor recreation opportunities.
Geography
Grandfather is located in the foothills of the Appalachian Mountains in western North Carolina. The town is situated in the Blue Ridge Mountains, which are part of the larger Appalachian Mountain Range. The town is located in Caldwell County, which is part of the Hickory-Lenoir-Morganton Metropolitan Statistical Area. The town is located at an elevation of 1,890 feet above sea level. The town is surrounded by the Pisgah National Forest, which provides a variety of outdoor recreation opportunities.
The town is located near the Catawba River, which is a major tributary of the Yadkin River. The Catawba River is a popular destination for fishing, canoeing, and kayaking. The town is also located near the Blue Ridge Parkway, which is a scenic highway that runs through the Appalachian Mountains.
History
Grandfather was founded in 1887 by a group of settlers from the nearby town of Lenoir. The town was named after the nearby Grandfather Mountain, which is the highest peak in the Blue Ridge Mountains. The town was originally a small farming community, but it soon became a popular tourist destination due to its scenic beauty and outdoor recreation opportunities.
In the early 20th century, the town became a popular destination for hikers, campers, and other outdoor enthusiasts. The town was also home to a number of summer camps, which attracted visitors from all over the country. The town was also home to a number of resorts, which provided visitors with a variety of recreational activities.
Economy
Grandfather is a small town with a population of approximately 1,000 people. The town’s economy is largely based on tourism, as it is a popular destination for outdoor recreation. The town is home to a number of resorts, campgrounds, and other tourist attractions. The town is also home to a number of small businesses, including restaurants, shops, and other services.
Demographics
As of the 2010 census, the population of Grandfather was 1,000 people. The town is predominantly white, with approximately 95% of the population being white. The town also has a small Hispanic population, with approximately 4% of the population being Hispanic. The median household income in Grandfather is $37,000, which is slightly lower than the national average.
Conclusion
Grandfather, North Carolina is a small town located in the Blue Ridge Mountains of North Carolina. The town is known for its scenic beauty and outdoor recreation opportunities. The town has a population of approximately 1,000 people and is predominantly white. The town’s economy is largely based on tourism, as it is a popular destination for outdoor recreation. The town is also home to a number of small businesses, including restaurants, shops, and other services.
Common Questions
What is Per Capita Income in Grandfather?
Per Capita income in Grandfather is $165,807.
What is the Median Family Income in Grandfather?
Median Family Income in Grandfather is $223,125.
What is the Median Household income in Grandfather?
Median Household Income in Grandfather is $220,000.
What is Inequality or Gini Index in Grandfather?
Inequality or Gini Index in Grandfather is 0.47.
What is the Total Population of Grandfather?
Total Population of Grandfather is 57.
What is the Total Male Population of Grandfather?
Total Male Population of Grandfather is 28.
What is the Total Female Population of Grandfather?
Total Female Population of Grandfather is 29.
What is the Ratio of Males per 100 Females in Grandfather?
There are 96.55 Males per 100 Females in Grandfather.
What is the Ratio of Females per 100 Males in Grandfather?
There are 103.57 Females per 100 Males in Grandfather.
What is the Median Population Age in Grandfather?
Median Population Age in Grandfather is 69.5 Years.
What is the Average Family Size in Grandfather
Average Family Size in Grandfather is 2.4 People.
What is the Average Household Size in Grandfather
Average Household Size in Grandfather is 2.4 People.
How Large is the Labor Force in Grandfather?
There are 14 People in the Labor Forcein in Grandfather.
What is the Percentage of People in the Labor Force in Grandfather?
24.6% of People are in the Labor Force in Grandfather.