Faith, NC Map & Demographics
Faith Map
Faith Overview
$47,933
PER CAPITA INCOME
$172,656
AVG FAMILY INCOME
$123,456
AVG HOUSEHOLD INCOME
38.4%
WAGE / INCOME GAP [ % ]
61.6¢/ $1
WAGE / INCOME GAP [ $ ]
0.32
INEQUALITY / GINI INDEX
1,096
TOTAL POPULATION
604
MALE POPULATION
492
FEMALE POPULATION
122.76
MALES / 100 FEMALES
81.46
FEMALES / 100 MALES
41.8
MEDIAN AGE
2.9
AVG FAMILY SIZE
2.5
AVG HOUSEHOLD SIZE
678
LABOR FORCE [ PEOPLE ]
78.6%
PERCENT IN LABOR FORCE
Faith Zip Codes
Income in Faith
Income Overview in Faith
Per Capita Income in Faith is $47,933, while median incomes of families and households are $172,656 and $123,456 respectively.
| Characteristic | Number | Measure |
| Per Capita Income | 1,096 | $47,933 |
| Median Family Income | 352 | $172,656 |
| Mean Family Income | 352 | $145,772 |
| Median Household Income | 439 | $123,456 |
| Mean Household Income | 439 | $126,586 |
| Income Deficit | 352 | $0 |
| Wage / Income Gap (%) | 1,096 | 38.36% |
| Wage / Income Gap ($) | 1,096 | 61.64¢ per $1 |
| Gini / Inequality Index | 1,096 | 0.32 |
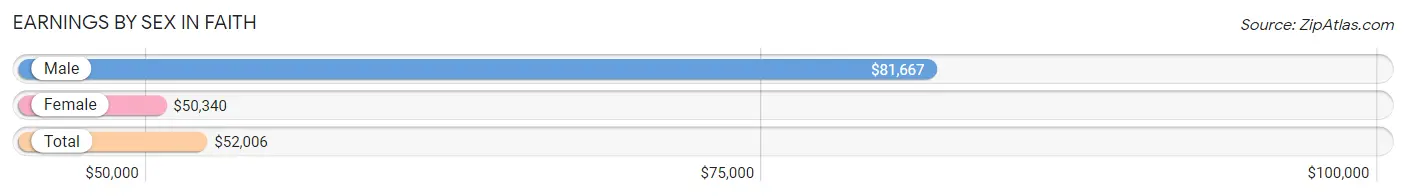
Earnings by Sex in Faith
Average Earnings in Faith are $52,006, $81,667 for men and $50,340 for women, a difference of 38.4%.
| Sex | Number | Average Earnings |
| Male | 400 (58.2%) | $81,667 |
| Female | 287 (41.8%) | $50,340 |
| Total | 687 (100.0%) | $52,006 |
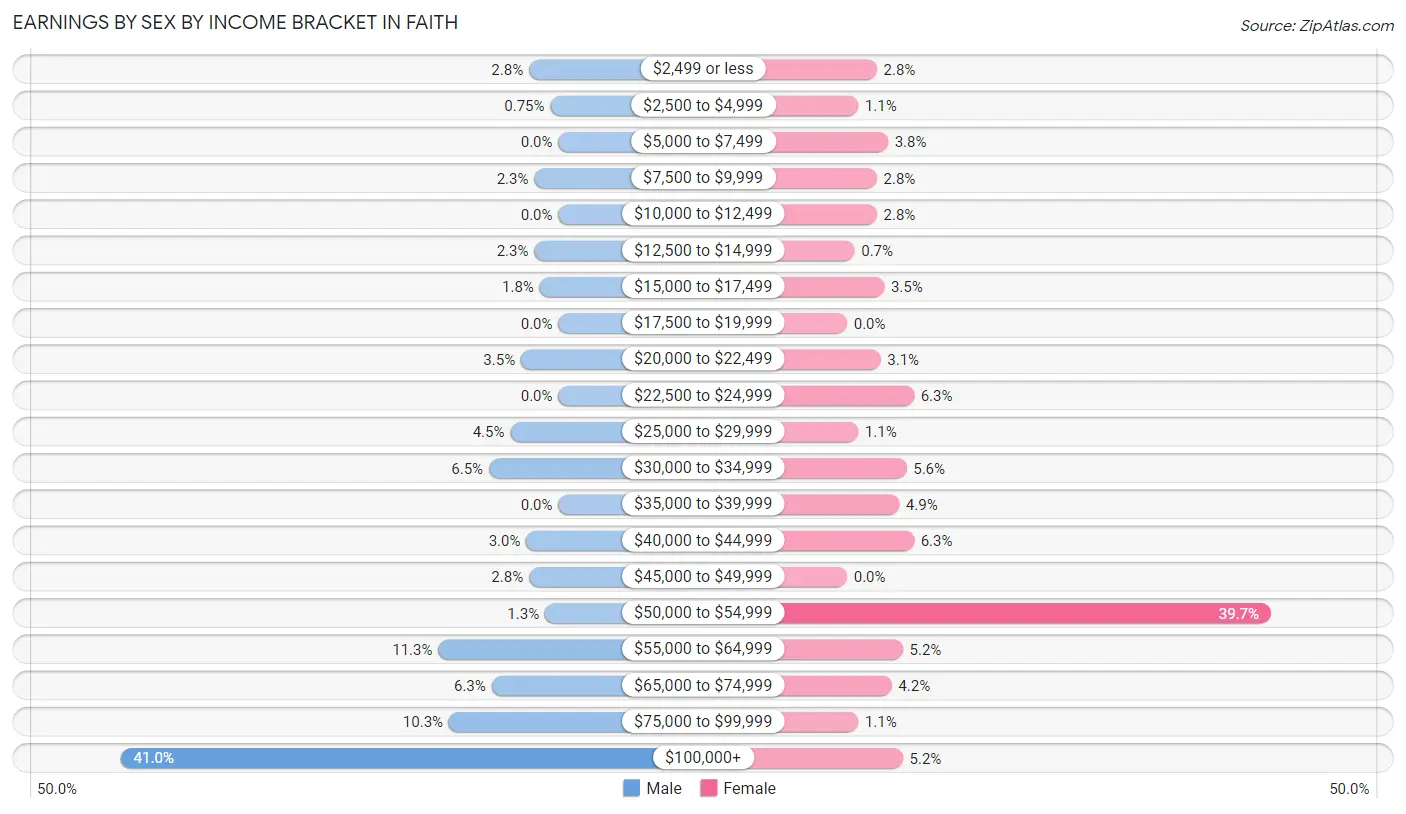
Earnings by Sex by Income Bracket in Faith
The most common earnings brackets in Faith are $100,000+ for men (164 | 41.0%) and $50,000 to $54,999 for women (114 | 39.7%).
| Income | Male | Female |
| $2,499 or less | 11 (2.8%) | 8 (2.8%) |
| $2,500 to $4,999 | 3 (0.7%) | 3 (1.1%) |
| $5,000 to $7,499 | 0 (0.0%) | 11 (3.8%) |
| $7,500 to $9,999 | 9 (2.2%) | 8 (2.8%) |
| $10,000 to $12,499 | 0 (0.0%) | 8 (2.8%) |
| $12,500 to $14,999 | 9 (2.2%) | 2 (0.7%) |
| $15,000 to $17,499 | 7 (1.8%) | 10 (3.5%) |
| $17,500 to $19,999 | 0 (0.0%) | 0 (0.0%) |
| $20,000 to $22,499 | 14 (3.5%) | 9 (3.1%) |
| $22,500 to $24,999 | 0 (0.0%) | 18 (6.3%) |
| $25,000 to $29,999 | 18 (4.5%) | 3 (1.1%) |
| $30,000 to $34,999 | 26 (6.5%) | 16 (5.6%) |
| $35,000 to $39,999 | 0 (0.0%) | 14 (4.9%) |
| $40,000 to $44,999 | 12 (3.0%) | 18 (6.3%) |
| $45,000 to $49,999 | 11 (2.8%) | 0 (0.0%) |
| $50,000 to $54,999 | 5 (1.3%) | 114 (39.7%) |
| $55,000 to $64,999 | 45 (11.3%) | 15 (5.2%) |
| $65,000 to $74,999 | 25 (6.2%) | 12 (4.2%) |
| $75,000 to $99,999 | 41 (10.2%) | 3 (1.1%) |
| $100,000+ | 164 (41.0%) | 15 (5.2%) |
| Total | 400 (100.0%) | 287 (100.0%) |
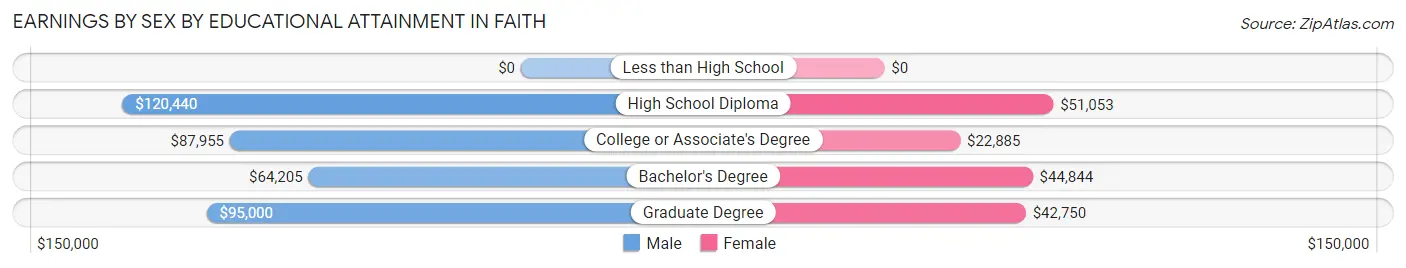
Earnings by Sex by Educational Attainment in Faith
Average earnings in Faith are $86,328 for men and $50,373 for women, a difference of 41.6%. Men with an educational attainment of high school diploma enjoy the highest average annual earnings of $120,440, while those with bachelor's degree education earn the least with $64,205. Women with an educational attainment of high school diploma earn the most with the average annual earnings of $51,053, while those with college or associate's degree education have the smallest earnings of $22,885.
| Educational Attainment | Male Income | Female Income |
| Less than High School | - | - |
| High School Diploma | $120,440 | $51,053 |
| College or Associate's Degree | $87,955 | $22,885 |
| Bachelor's Degree | $64,205 | $44,844 |
| Graduate Degree | $95,000 | $42,750 |
| Total | $86,328 | $50,373 |
Family Income in Faith
Family Income Brackets in Faith
According to the Faith family income data, there are 162 families falling into the $150,000 to $199,999 income range, which is the most common income bracket and makes up 46.0% of all families.
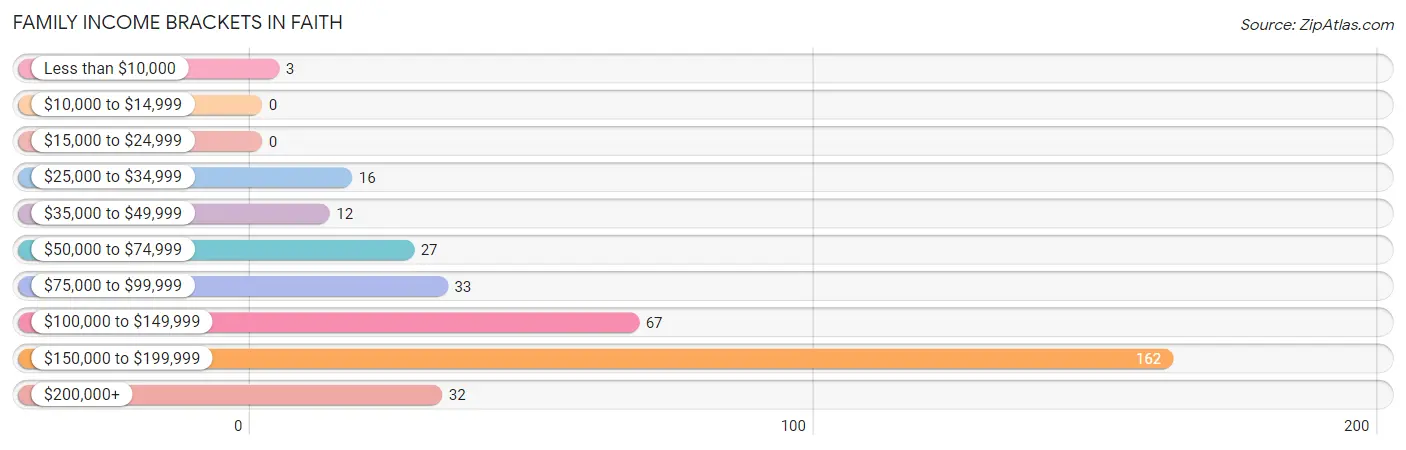
| Income Bracket | # Families | % Families |
| Less than $10,000 | 3 | 0.9% |
| $10,000 to $14,999 | 0 | 0.0% |
| $15,000 to $24,999 | 0 | 0.0% |
| $25,000 to $34,999 | 16 | 4.5% |
| $35,000 to $49,999 | 12 | 3.4% |
| $50,000 to $74,999 | 27 | 7.7% |
| $75,000 to $99,999 | 33 | 9.4% |
| $100,000 to $149,999 | 67 | 19.0% |
| $150,000 to $199,999 | 162 | 46.0% |
| $200,000+ | 32 | 9.1% |
Family Income by Famaliy Size in Faith
5-person families (21 | 6.0%) account for the highest median family income in Faith with $195,114 per family, while 2-person families (178 | 50.6%) have the highest median income of $86,470 per family member.
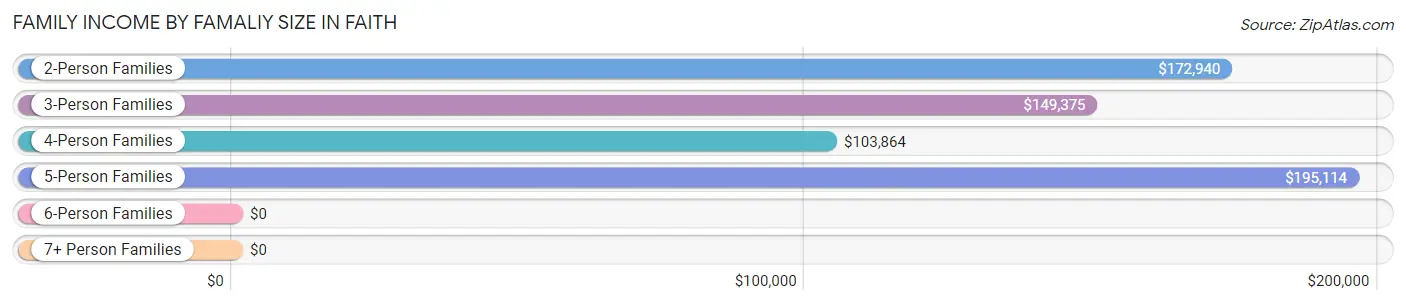
| Income Bracket | # Families | Median Income |
| 2-Person Families | 178 (50.6%) | $172,940 |
| 3-Person Families | 103 (29.3%) | $149,375 |
| 4-Person Families | 44 (12.5%) | $103,864 |
| 5-Person Families | 21 (6.0%) | $195,114 |
| 6-Person Families | 4 (1.1%) | $0 |
| 7+ Person Families | 2 (0.6%) | $0 |
| Total | 352 (100.0%) | $172,656 |
Family Income by Number of Earners in Faith
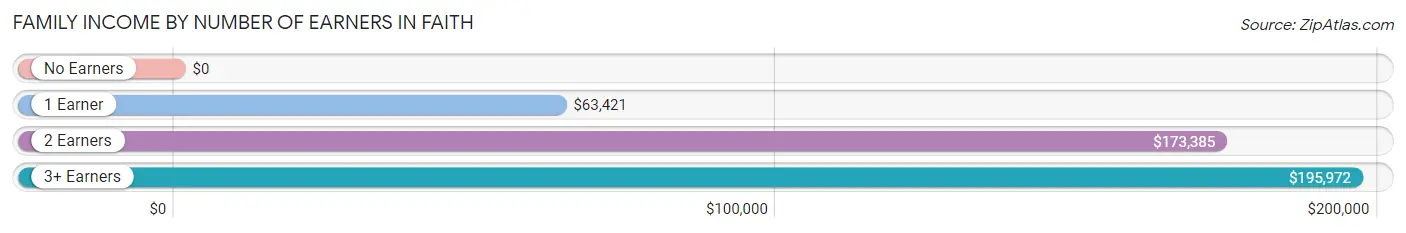
| Number of Earners | # Families | Median Income |
| No Earners | 27 (7.7%) | $0 |
| 1 Earner | 56 (15.9%) | $63,421 |
| 2 Earners | 226 (64.2%) | $173,385 |
| 3+ Earners | 43 (12.2%) | $195,972 |
| Total | 352 (100.0%) | $172,656 |
Household Income in Faith
Household Income Brackets in Faith
With 164 households falling in the category, the $150,000 to $199,999 income range is the most frequent in Faith, accounting for 37.4% of all households. In contrast, only 2 households (0.5%) fall into the $10,000 to $14,999 income bracket, making it the least populous group.
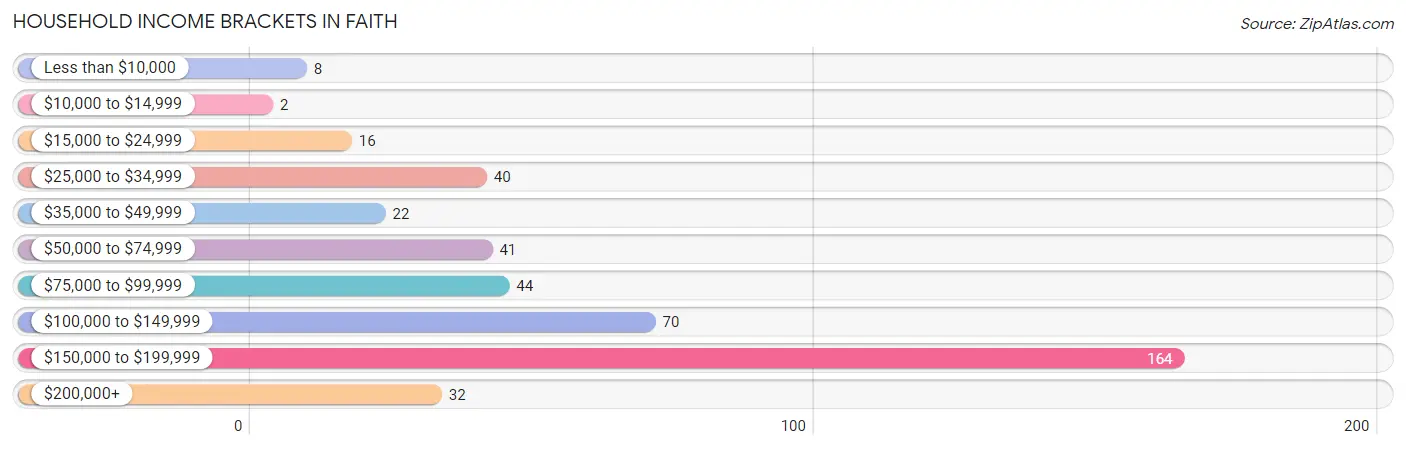
| Income Bracket | # Households | % Households |
| Less than $10,000 | 8 | 1.8% |
| $10,000 to $14,999 | 2 | 0.5% |
| $15,000 to $24,999 | 16 | 3.6% |
| $25,000 to $34,999 | 40 | 9.1% |
| $35,000 to $49,999 | 22 | 5.0% |
| $50,000 to $74,999 | 41 | 9.3% |
| $75,000 to $99,999 | 44 | 10.0% |
| $100,000 to $149,999 | 70 | 15.9% |
| $150,000 to $199,999 | 164 | 37.4% |
| $200,000+ | 32 | 7.3% |
Household Income by Householder Age in Faith
The median household income in Faith is $123,456, with the highest median household income of $173,352 found in the 45 to 64 years age bracket for the primary householder. A total of 270 households (61.5%) fall into this category.
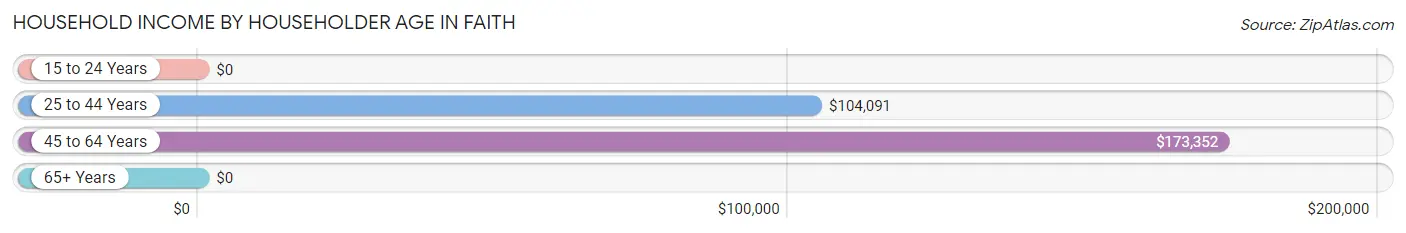
| Income Bracket | # Households | Median Income |
| 15 to 24 Years | 0 (0.0%) | $0 |
| 25 to 44 Years | 86 (19.6%) | $104,091 |
| 45 to 64 Years | 270 (61.5%) | $173,352 |
| 65+ Years | 83 (18.9%) | $0 |
| Total | 439 (100.0%) | $123,456 |
Poverty in Faith
Income Below Poverty by Sex and Age in Faith
With 1.7% poverty level for males and 2.4% for females among the residents of Faith, 6 to 11 year old males and 35 to 44 year old females are the most vulnerable to poverty, with 7 males (18.4%) and 7 females (5.7%) in their respective age groups living below the poverty level.
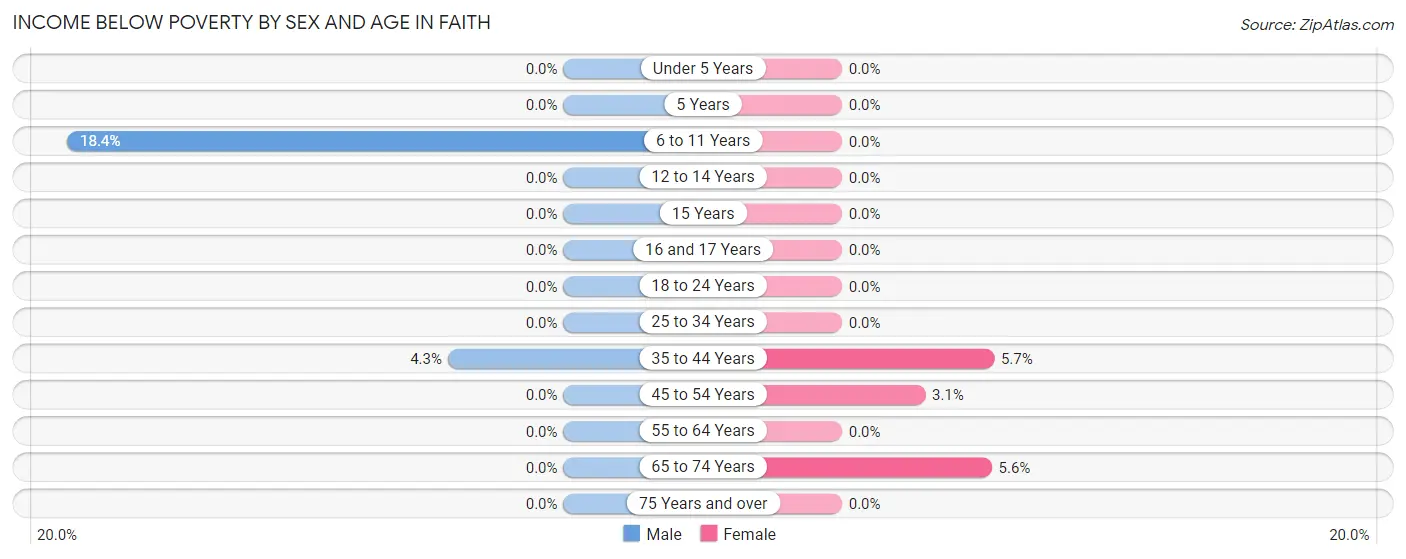
| Age Bracket | Male | Female |
| Under 5 Years | 0 (0.0%) | 0 (0.0%) |
| 5 Years | 0 (0.0%) | 0 (0.0%) |
| 6 to 11 Years | 7 (18.4%) | 0 (0.0%) |
| 12 to 14 Years | 0 (0.0%) | 0 (0.0%) |
| 15 Years | 0 (0.0%) | 0 (0.0%) |
| 16 and 17 Years | 0 (0.0%) | 0 (0.0%) |
| 18 to 24 Years | 0 (0.0%) | 0 (0.0%) |
| 25 to 34 Years | 0 (0.0%) | 0 (0.0%) |
| 35 to 44 Years | 3 (4.3%) | 7 (5.7%) |
| 45 to 54 Years | 0 (0.0%) | 3 (3.1%) |
| 55 to 64 Years | 0 (0.0%) | 0 (0.0%) |
| 65 to 74 Years | 0 (0.0%) | 2 (5.6%) |
| 75 Years and over | 0 (0.0%) | 0 (0.0%) |
| Total | 10 (1.7%) | 12 (2.4%) |
Income Above Poverty by Sex and Age in Faith
According to the poverty statistics in Faith, males aged under 5 years and females aged under 5 years are the age groups that are most secure financially, with 100.0% of males and 100.0% of females in these age groups living above the poverty line.
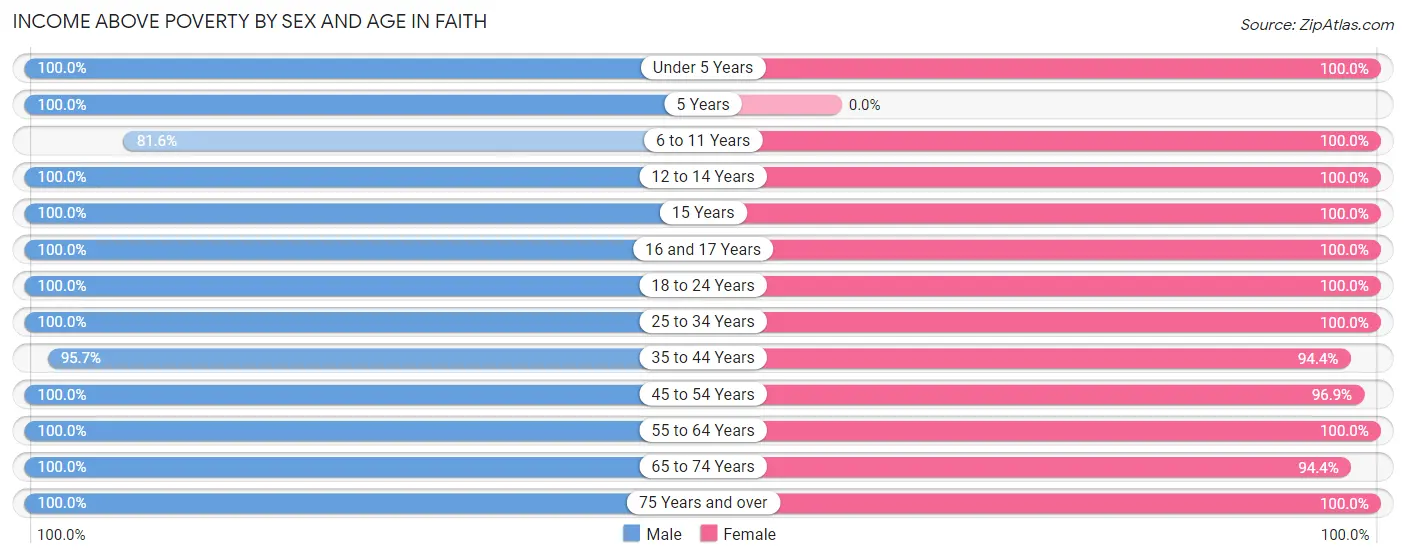
| Age Bracket | Male | Female |
| Under 5 Years | 69 (100.0%) | 17 (100.0%) |
| 5 Years | 4 (100.0%) | 0 (0.0%) |
| 6 to 11 Years | 31 (81.6%) | 32 (100.0%) |
| 12 to 14 Years | 7 (100.0%) | 35 (100.0%) |
| 15 Years | 9 (100.0%) | 22 (100.0%) |
| 16 and 17 Years | 13 (100.0%) | 3 (100.0%) |
| 18 to 24 Years | 14 (100.0%) | 46 (100.0%) |
| 25 to 34 Years | 51 (100.0%) | 21 (100.0%) |
| 35 to 44 Years | 67 (95.7%) | 117 (94.4%) |
| 45 to 54 Years | 169 (100.0%) | 94 (96.9%) |
| 55 to 64 Years | 88 (100.0%) | 49 (100.0%) |
| 65 to 74 Years | 53 (100.0%) | 34 (94.4%) |
| 75 Years and over | 19 (100.0%) | 10 (100.0%) |
| Total | 594 (98.3%) | 480 (97.6%) |
Income Below Poverty Among Married-Couple Families in Faith
The poverty statistics for married-couple families in Faith show that 0.9% or 3 of the total 318 families live below the poverty line. Families with 1 or 2 children have the highest poverty rate of 4.7%, comprising of 3 families. On the other hand, families with no children have the lowest poverty rate of 0.0%, which includes 0 families.
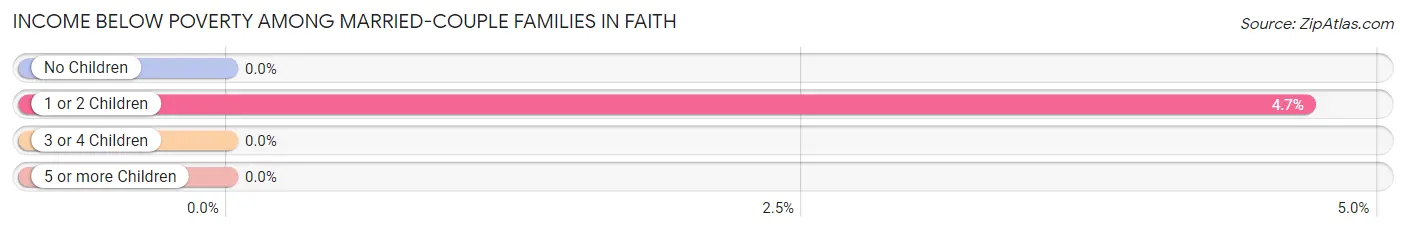
| Children | Above Poverty | Below Poverty |
| No Children | 236 (100.0%) | 0 (0.0%) |
| 1 or 2 Children | 61 (95.3%) | 3 (4.7%) |
| 3 or 4 Children | 16 (100.0%) | 0 (0.0%) |
| 5 or more Children | 2 (100.0%) | 0 (0.0%) |
| Total | 315 (99.1%) | 3 (0.9%) |
Income Below Poverty Among Single-Parent Households in Faith
| Children | Single Father | Single Mother |
| No Children | 0 (0.0%) | 0 (0.0%) |
| 1 or 2 Children | 0 (0.0%) | 0 (0.0%) |
| 3 or 4 Children | 0 (0.0%) | 0 (0.0%) |
| 5 or more Children | 0 (0.0%) | 0 (0.0%) |
| Total | 0 (0.0%) | 0 (0.0%) |
Income Below Poverty Among Married-Couple vs Single-Parent Households in Faith
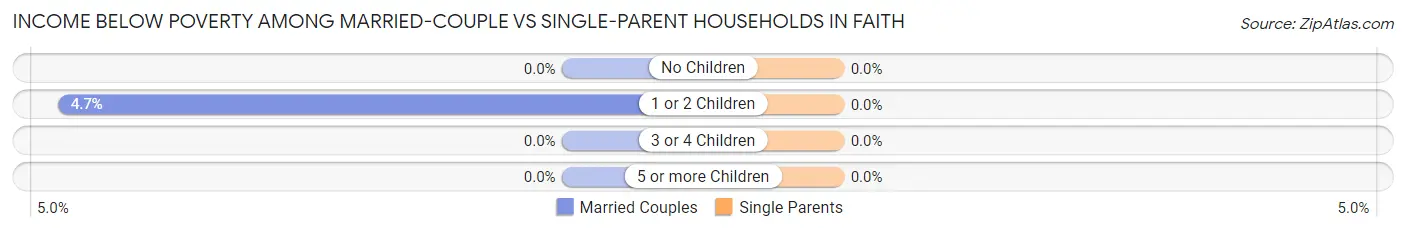
| Children | Married-Couple Families | Single-Parent Households |
| No Children | 0 (0.0%) | 0 (0.0%) |
| 1 or 2 Children | 3 (4.7%) | 0 (0.0%) |
| 3 or 4 Children | 0 (0.0%) | 0 (0.0%) |
| 5 or more Children | 0 (0.0%) | 0 (0.0%) |
| Total | 3 (0.9%) | 0 (0.0%) |
Race in Faith
The most populous races in Faith are White / Caucasian (1,035 | 94.4%), Asian (35 | 3.2%), and Black / African American (16 | 1.5%).
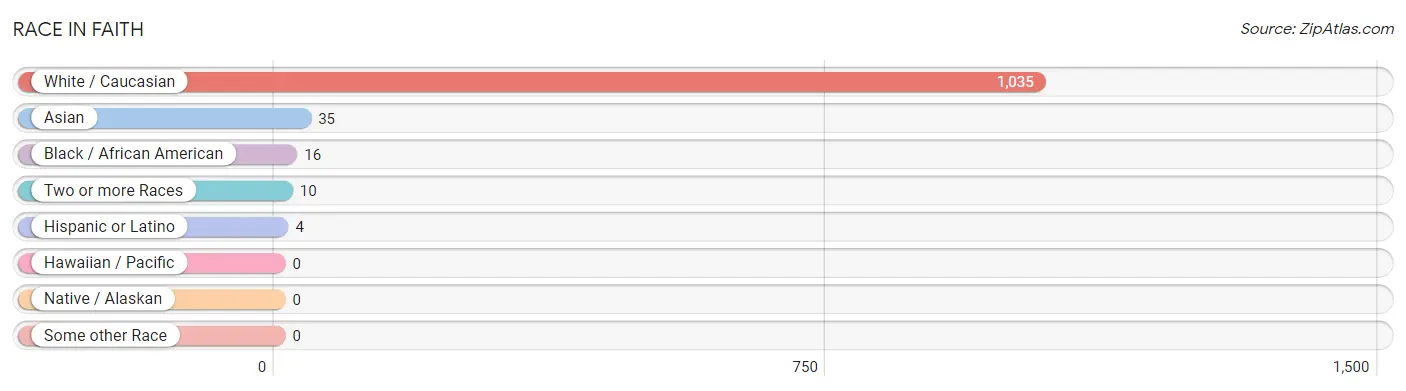
| Race | # Population | % Population |
| Asian | 35 | 3.2% |
| Black / African American | 16 | 1.5% |
| Hawaiian / Pacific | 0 | 0.0% |
| Hispanic or Latino | 4 | 0.4% |
| Native / Alaskan | 0 | 0.0% |
| White / Caucasian | 1,035 | 94.4% |
| Two or more Races | 10 | 0.9% |
| Some other Race | 0 | 0.0% |
| Total | 1,096 | 100.0% |
Ancestry in Faith
The most populous ancestries reported in Faith are German (284 | 25.9%), American (162 | 14.8%), Irish (113 | 10.3%), English (76 | 6.9%), and Scandinavian (58 | 5.3%), together accounting for 63.2% of all Faith residents.
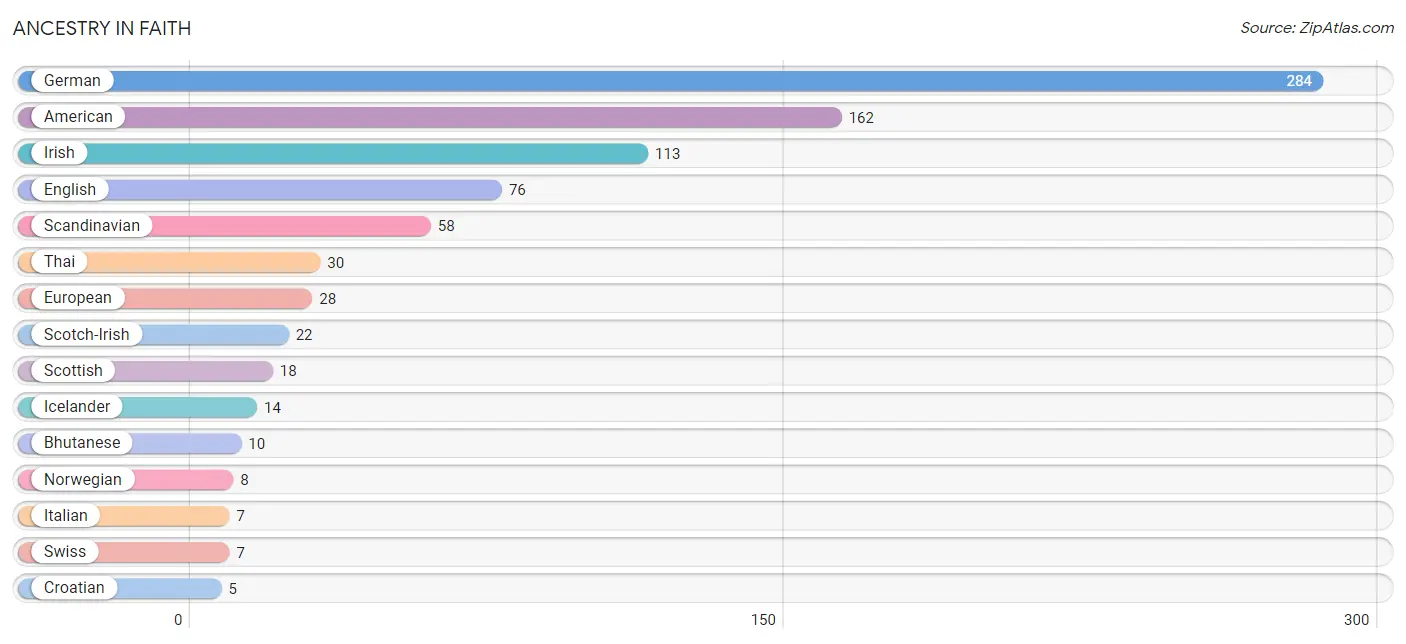
| Ancestry | # Population | % Population |
| American | 162 | 14.8% |
| Bhutanese | 10 | 0.9% |
| Croatian | 5 | 0.5% |
| English | 76 | 6.9% |
| European | 28 | 2.5% |
| French | 4 | 0.4% |
| German | 284 | 25.9% |
| Hungarian | 4 | 0.4% |
| Icelander | 14 | 1.3% |
| Irish | 113 | 10.3% |
| Italian | 7 | 0.6% |
| Korean | 5 | 0.5% |
| Mexican | 4 | 0.4% |
| Norwegian | 8 | 0.7% |
| Polish | 2 | 0.2% |
| Scandinavian | 58 | 5.3% |
| Scotch-Irish | 22 | 2.0% |
| Scottish | 18 | 1.6% |
| Swiss | 7 | 0.6% |
| Thai | 30 | 2.7% |
| Welsh | 5 | 0.5% | View All 21 Rows |
Immigrants in Faith
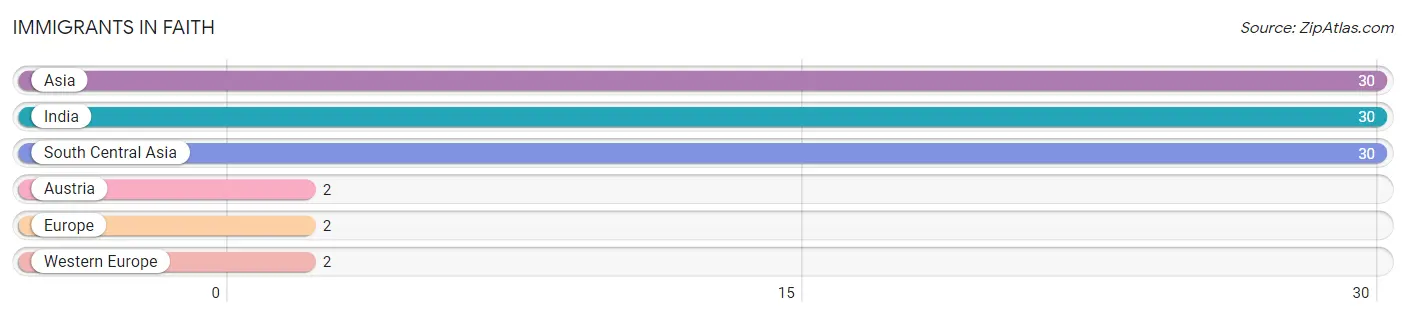
The most numerous immigrant groups reported in Faith came from Asia (30 | 2.7%), India (30 | 2.7%), South Central Asia (30 | 2.7%), Austria (2 | 0.2%), and Europe (2 | 0.2%), together accounting for 8.6% of all Faith residents.
| Immigration Origin | # Population | % Population |
| Asia | 30 | 2.7% |
| Austria | 2 | 0.2% |
| Europe | 2 | 0.2% |
| India | 30 | 2.7% |
| South Central Asia | 30 | 2.7% |
| Western Europe | 2 | 0.2% | View All 6 Rows |
Sex and Age in Faith
Sex and Age in Faith
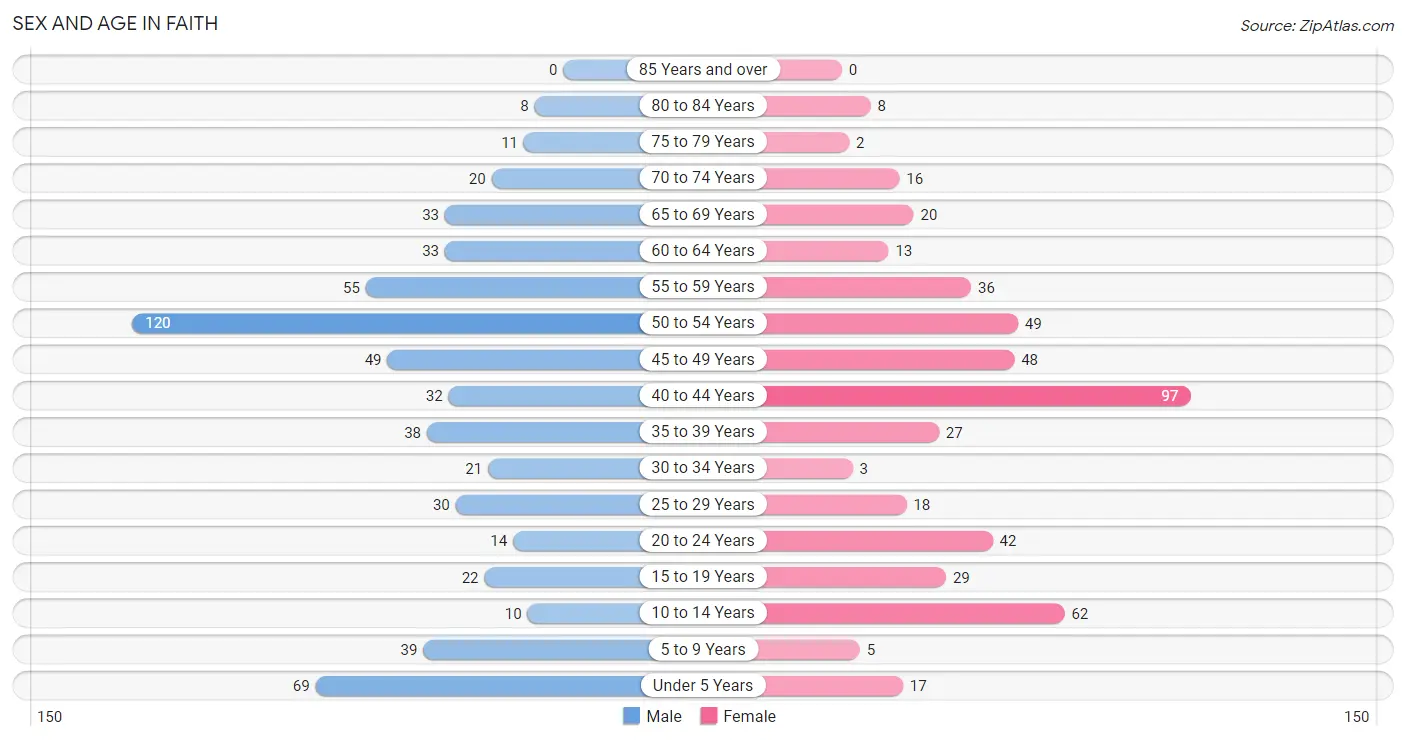
The most populous age groups in Faith are 50 to 54 Years (120 | 19.9%) for men and 40 to 44 Years (97 | 19.7%) for women.
| Age Bracket | Male | Female |
| Under 5 Years | 69 (11.4%) | 17 (3.5%) |
| 5 to 9 Years | 39 (6.5%) | 5 (1.0%) |
| 10 to 14 Years | 10 (1.7%) | 62 (12.6%) |
| 15 to 19 Years | 22 (3.6%) | 29 (5.9%) |
| 20 to 24 Years | 14 (2.3%) | 42 (8.5%) |
| 25 to 29 Years | 30 (5.0%) | 18 (3.7%) |
| 30 to 34 Years | 21 (3.5%) | 3 (0.6%) |
| 35 to 39 Years | 38 (6.3%) | 27 (5.5%) |
| 40 to 44 Years | 32 (5.3%) | 97 (19.7%) |
| 45 to 49 Years | 49 (8.1%) | 48 (9.8%) |
| 50 to 54 Years | 120 (19.9%) | 49 (10.0%) |
| 55 to 59 Years | 55 (9.1%) | 36 (7.3%) |
| 60 to 64 Years | 33 (5.5%) | 13 (2.6%) |
| 65 to 69 Years | 33 (5.5%) | 20 (4.1%) |
| 70 to 74 Years | 20 (3.3%) | 16 (3.3%) |
| 75 to 79 Years | 11 (1.8%) | 2 (0.4%) |
| 80 to 84 Years | 8 (1.3%) | 8 (1.6%) |
| 85 Years and over | 0 (0.0%) | 0 (0.0%) |
| Total | 604 (100.0%) | 492 (100.0%) |
Families and Households in Faith
Median Family Size in Faith
The median family size in Faith is 2.86 persons per family, with single male/father families (29 | 8.2%) accounting for the largest median family size of 3.17 persons per family. On the other hand, single female/mother families (5 | 1.4%) represent the smallest median family size with 2.60 persons per family.
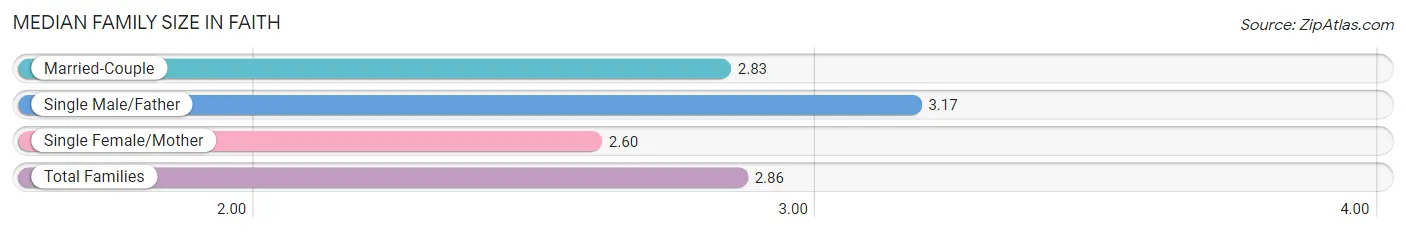
| Family Type | # Families | Family Size |
| Married-Couple | 318 (90.3%) | 2.83 |
| Single Male/Father | 29 (8.2%) | 3.17 |
| Single Female/Mother | 5 (1.4%) | 2.60 |
| Total Families | 352 (100.0%) | 2.86 |
Median Household Size in Faith
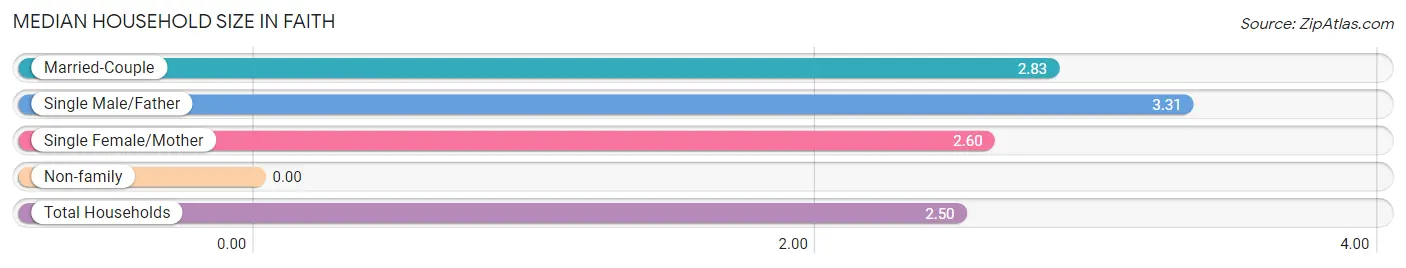
| Household Type | # Households | Household Size |
| Married-Couple | 318 (72.4%) | 2.83 |
| Single Male/Father | 29 (6.6%) | 3.31 |
| Single Female/Mother | 5 (1.1%) | 2.60 |
| Non-family | 87 (19.8%) | - |
| Total Households | 439 (100.0%) | 2.50 |
Household Size by Marriage Status in Faith
Out of a total of 439 households in Faith, 352 (80.2%) are family households, while 87 (19.8%) are nonfamily households. The most numerous type of family households are 2-person households, comprising 173, and the most common type of nonfamily households are 1-person households, comprising 87.
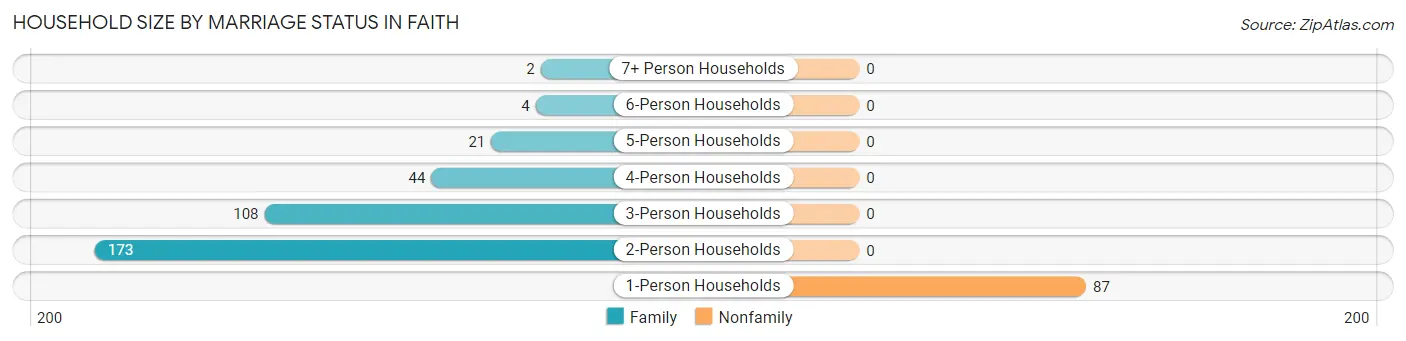
| Household Size | Family Households | Nonfamily Households |
| 1-Person Households | - | 87 (19.8%) |
| 2-Person Households | 173 (39.4%) | 0 (0.0%) |
| 3-Person Households | 108 (24.6%) | 0 (0.0%) |
| 4-Person Households | 44 (10.0%) | 0 (0.0%) |
| 5-Person Households | 21 (4.8%) | 0 (0.0%) |
| 6-Person Households | 4 (0.9%) | 0 (0.0%) |
| 7+ Person Households | 2 (0.5%) | 0 (0.0%) |
| Total | 352 (80.2%) | 87 (19.8%) |
Female Fertility in Faith
Fertility by Age in Faith
Average fertility rate in Faith is 14.0 births per 1,000 women. Women in the age bracket of 35 to 50 years have the highest fertility rate with 22.0 births per 1,000 women. Women in the age bracket of 35 to 50 years acount for 100.0% of all women with births.
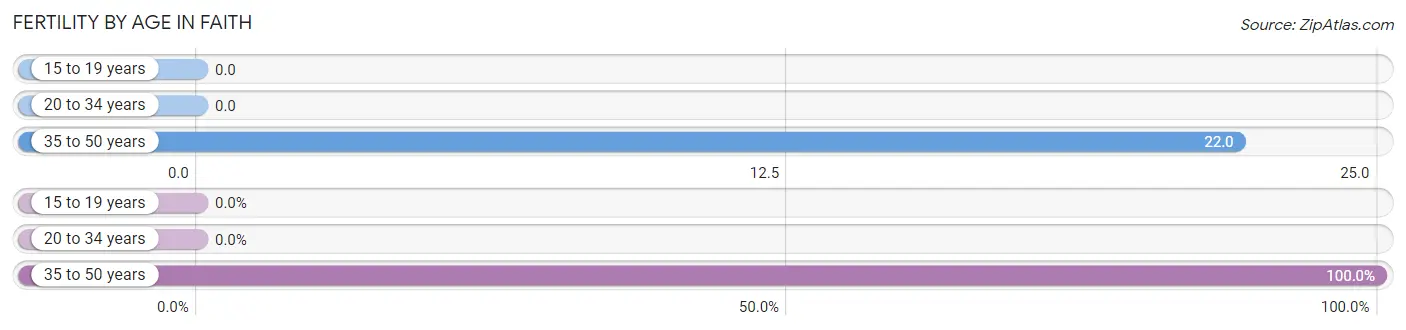
| Age Bracket | Women with Births | Births / 1,000 Women |
| 15 to 19 years | 0 (0.0%) | 0.0 |
| 20 to 34 years | 0 (0.0%) | 0.0 |
| 35 to 50 years | 4 (100.0%) | 22.0 |
| Total | 4 (100.0%) | 14.0 |
Fertility by Age by Marriage Status in Faith
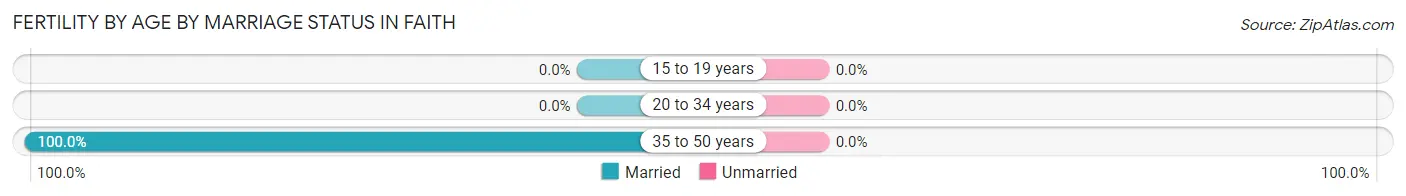
| Age Bracket | Married | Unmarried |
| 15 to 19 years | 0 (0.0%) | 0 (0.0%) |
| 20 to 34 years | 0 (0.0%) | 0 (0.0%) |
| 35 to 50 years | 4 (100.0%) | 0 (0.0%) |
| Total | 4 (100.0%) | 0 (0.0%) |
Fertility by Education in Faith
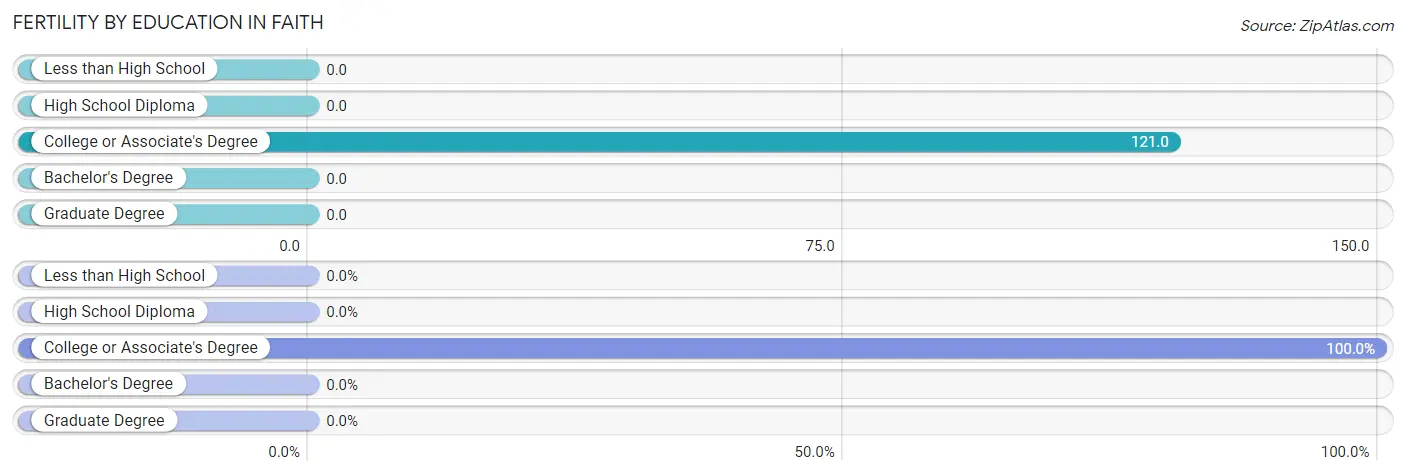
| Educational Attainment | Women with Births | Births / 1,000 Women |
| Less than High School | 0 (0.0%) | 0.0 |
| High School Diploma | 0 (0.0%) | 0.0 |
| College or Associate's Degree | 4 (100.0%) | 121.0 |
| Bachelor's Degree | 0 (0.0%) | 0.0 |
| Graduate Degree | 0 (0.0%) | 0.0 |
| Total | 4 (100.0%) | 14.0 |
Fertility by Education by Marriage Status in Faith
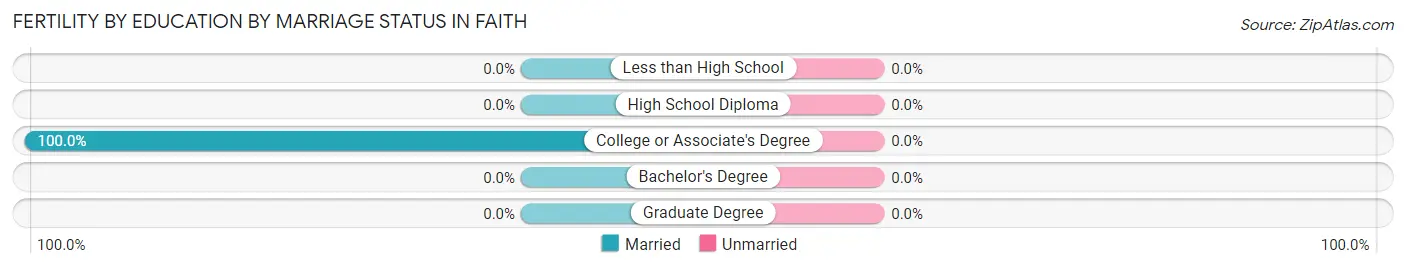
| Educational Attainment | Married | Unmarried |
| Less than High School | 0 (0.0%) | 0 (0.0%) |
| High School Diploma | 0 (0.0%) | 0 (0.0%) |
| College or Associate's Degree | 4 (100.0%) | 0 (0.0%) |
| Bachelor's Degree | 0 (0.0%) | 0 (0.0%) |
| Graduate Degree | 0 (0.0%) | 0 (0.0%) |
| Total | 4 (100.0%) | 0 (0.0%) |
Employment Characteristics in Faith
Employment by Class of Employer in Faith
Among the 678 employed individuals in Faith, private company employees (400 | 59.0%), local government employees (123 | 18.1%), and self-employed (incorporated) (45 | 6.6%) make up the most common classes of employment.
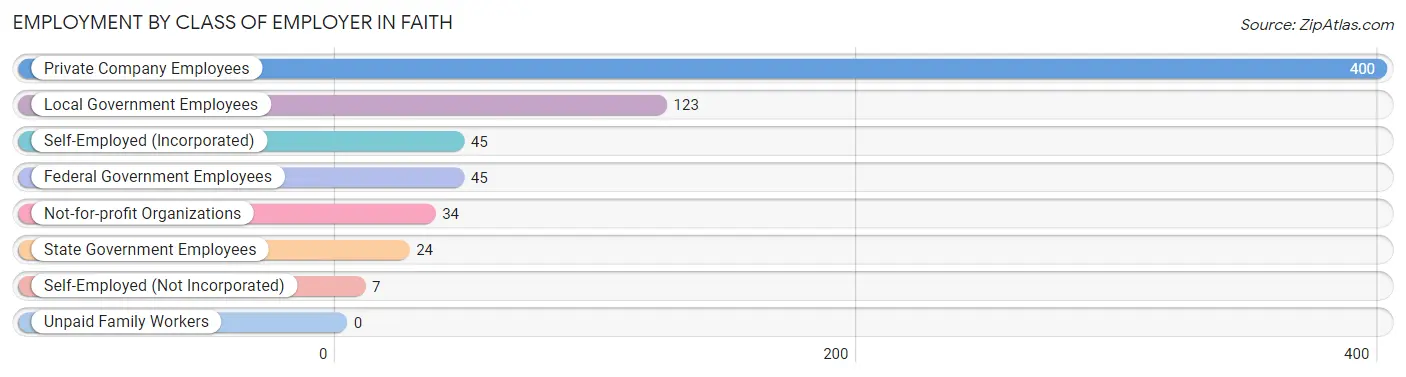
| Employer Class | # Employees | % Employees |
| Private Company Employees | 400 | 59.0% |
| Self-Employed (Incorporated) | 45 | 6.6% |
| Self-Employed (Not Incorporated) | 7 | 1.0% |
| Not-for-profit Organizations | 34 | 5.0% |
| Local Government Employees | 123 | 18.1% |
| State Government Employees | 24 | 3.5% |
| Federal Government Employees | 45 | 6.6% |
| Unpaid Family Workers | 0 | 0.0% |
| Total | 678 | 100.0% |
Employment Status by Age in Faith
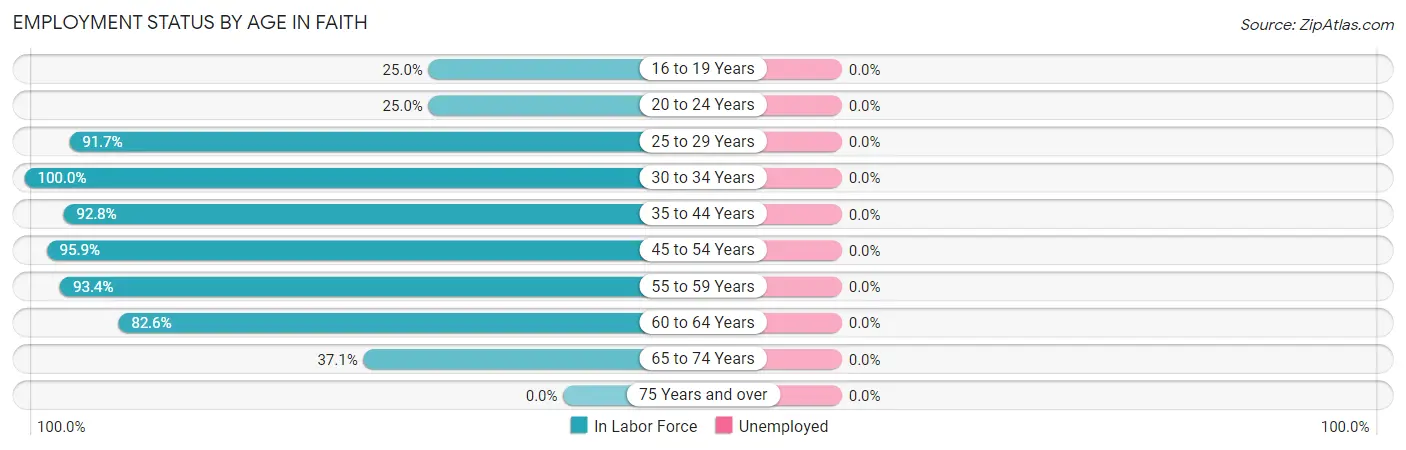
| Age Bracket | In Labor Force | Unemployed |
| 16 to 19 Years | 5 (25.0%) | 0 (0.0%) |
| 20 to 24 Years | 14 (25.0%) | 0 (0.0%) |
| 25 to 29 Years | 44 (91.7%) | 0 (0.0%) |
| 30 to 34 Years | 24 (100.0%) | 0 (0.0%) |
| 35 to 44 Years | 180 (92.8%) | 0 (0.0%) |
| 45 to 54 Years | 255 (95.9%) | 0 (0.0%) |
| 55 to 59 Years | 85 (93.4%) | 0 (0.0%) |
| 60 to 64 Years | 38 (82.6%) | 0 (0.0%) |
| 65 to 74 Years | 33 (37.1%) | 0 (0.0%) |
| 75 Years and over | 0 (0.0%) | 0 (0.0%) |
| Total | 678 (78.6%) | 0 (0.0%) |
Employment Status by Educational Attainment in Faith
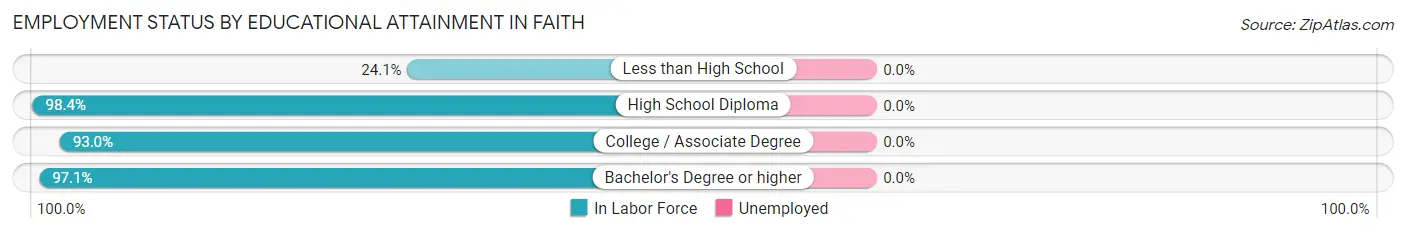
| Educational Attainment | In Labor Force | Unemployed |
| Less than High School | 7 (24.1%) | 0 (0.0%) |
| High School Diploma | 304 (98.4%) | 0 (0.0%) |
| College / Associate Degree | 146 (93.0%) | 0 (0.0%) |
| Bachelor's Degree or higher | 169 (97.1%) | 0 (0.0%) |
| Total | 626 (93.6%) | 0 (0.0%) |
Employment Occupations by Sex in Faith
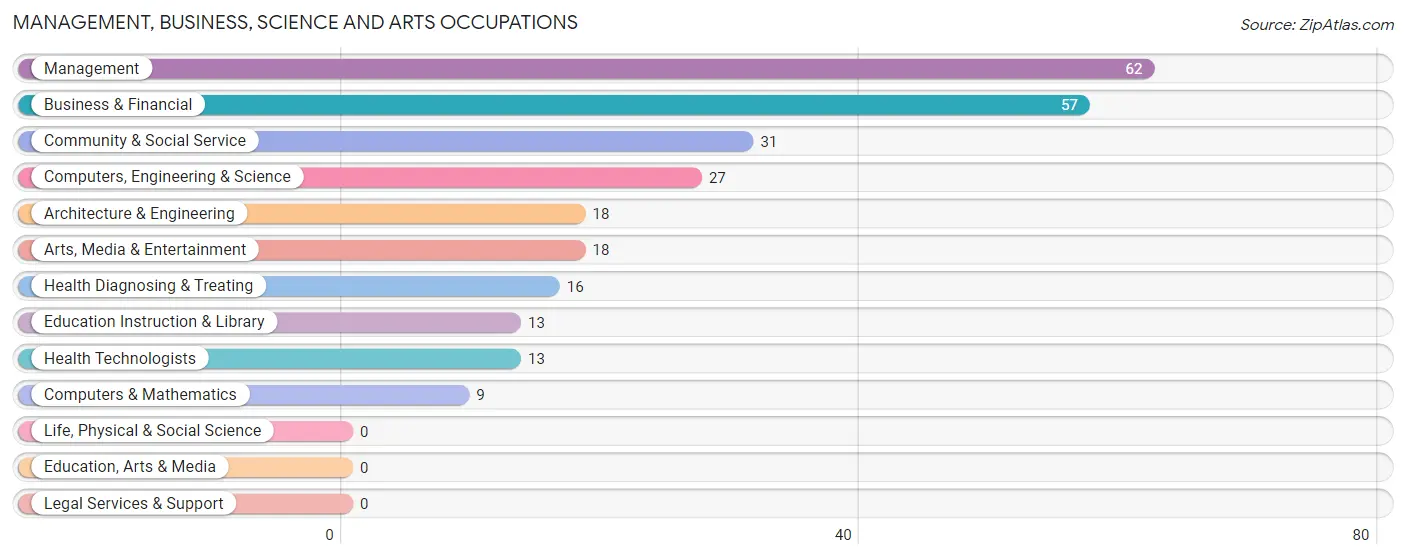
Management, Business, Science and Arts Occupations
The most common Management, Business, Science and Arts occupations in Faith are Management (62 | 9.1%), Business & Financial (57 | 8.4%), Community & Social Service (31 | 4.6%), Computers, Engineering & Science (27 | 4.0%), and Architecture & Engineering (18 | 2.6%).
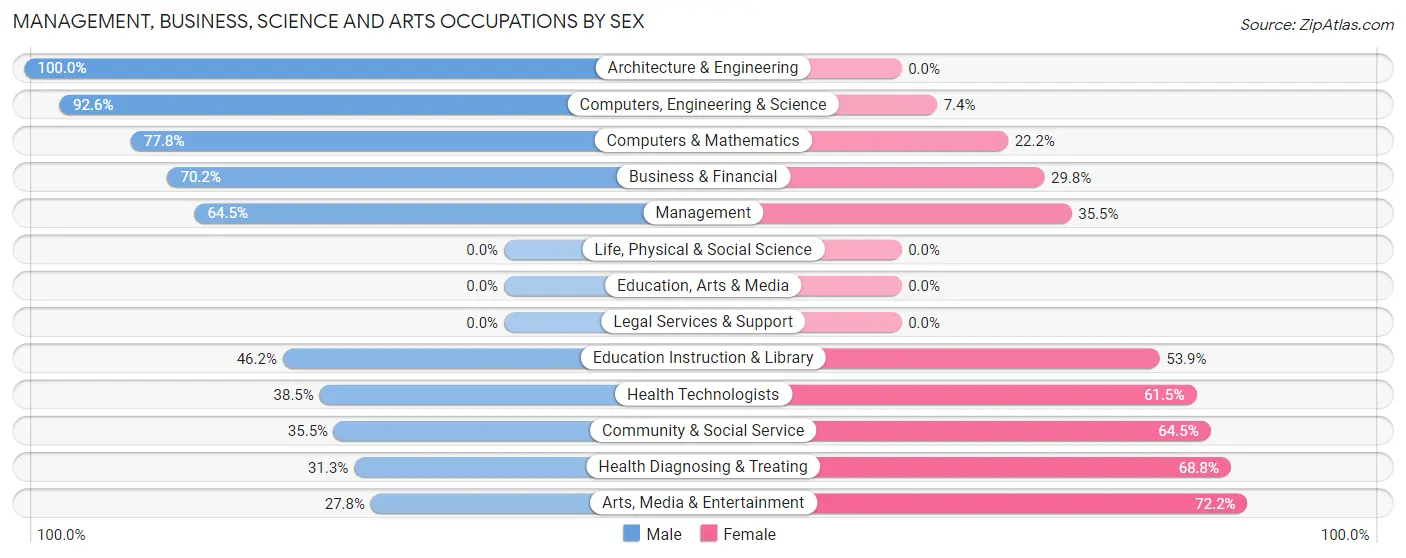
Management, Business, Science and Arts Occupations by Sex
Within the Management, Business, Science and Arts occupations in Faith, the most male-oriented occupations are Architecture & Engineering (100.0%), Computers, Engineering & Science (92.6%), and Computers & Mathematics (77.8%), while the most female-oriented occupations are Arts, Media & Entertainment (72.2%), Health Diagnosing & Treating (68.8%), and Community & Social Service (64.5%).
| Occupation | Male | Female |
| Management | 40 (64.5%) | 22 (35.5%) |
| Business & Financial | 40 (70.2%) | 17 (29.8%) |
| Computers, Engineering & Science | 25 (92.6%) | 2 (7.4%) |
| Computers & Mathematics | 7 (77.8%) | 2 (22.2%) |
| Architecture & Engineering | 18 (100.0%) | 0 (0.0%) |
| Life, Physical & Social Science | 0 (0.0%) | 0 (0.0%) |
| Community & Social Service | 11 (35.5%) | 20 (64.5%) |
| Education, Arts & Media | 0 (0.0%) | 0 (0.0%) |
| Legal Services & Support | 0 (0.0%) | 0 (0.0%) |
| Education Instruction & Library | 6 (46.2%) | 7 (53.8%) |
| Arts, Media & Entertainment | 5 (27.8%) | 13 (72.2%) |
| Health Diagnosing & Treating | 5 (31.2%) | 11 (68.8%) |
| Health Technologists | 5 (38.5%) | 8 (61.5%) |
| Total (Category) | 121 (62.7%) | 72 (37.3%) |
| Total (Overall) | 396 (58.4%) | 282 (41.6%) |
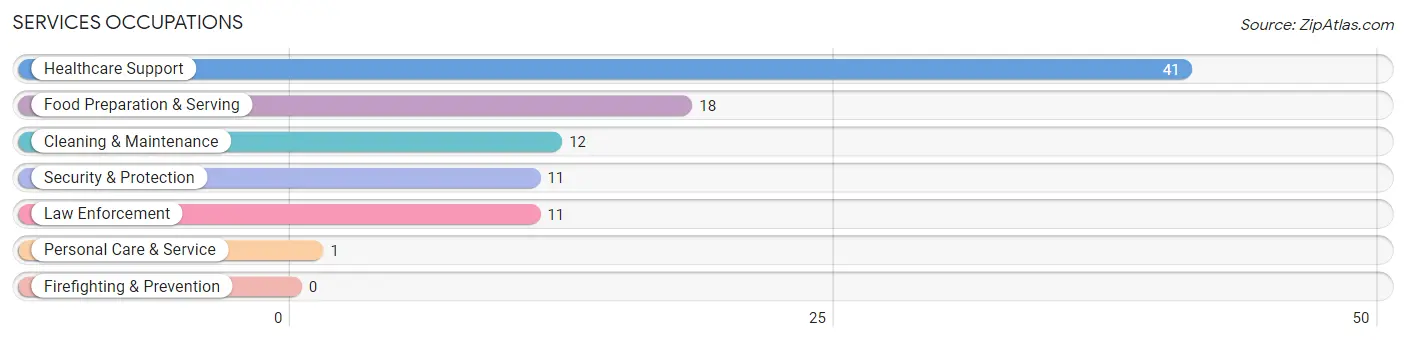
Services Occupations
The most common Services occupations in Faith are Healthcare Support (41 | 6.0%), Food Preparation & Serving (18 | 2.6%), Cleaning & Maintenance (12 | 1.8%), Security & Protection (11 | 1.6%), and Law Enforcement (11 | 1.6%).
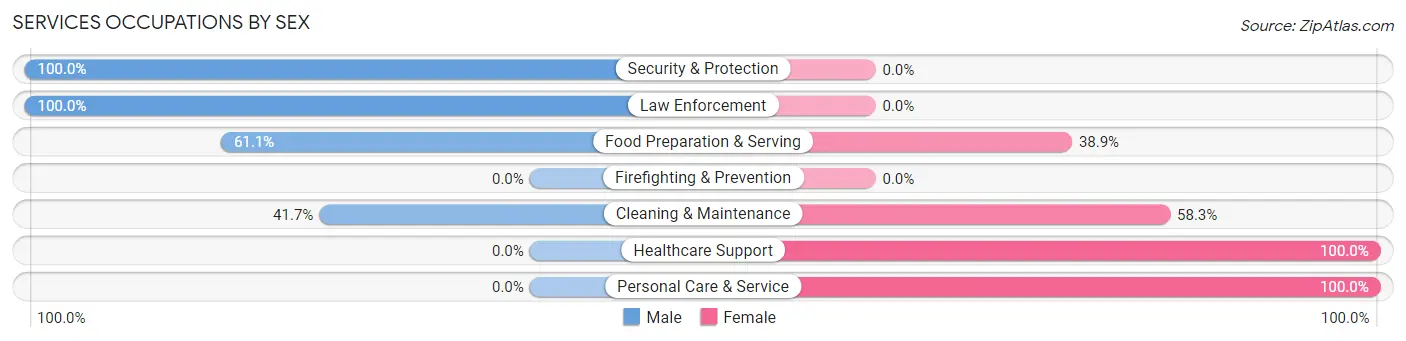
Services Occupations by Sex
Within the Services occupations in Faith, the most male-oriented occupations are Security & Protection (100.0%), Law Enforcement (100.0%), and Food Preparation & Serving (61.1%), while the most female-oriented occupations are Healthcare Support (100.0%), Personal Care & Service (100.0%), and Cleaning & Maintenance (58.3%).
| Occupation | Male | Female |
| Healthcare Support | 0 (0.0%) | 41 (100.0%) |
| Security & Protection | 11 (100.0%) | 0 (0.0%) |
| Firefighting & Prevention | 0 (0.0%) | 0 (0.0%) |
| Law Enforcement | 11 (100.0%) | 0 (0.0%) |
| Food Preparation & Serving | 11 (61.1%) | 7 (38.9%) |
| Cleaning & Maintenance | 5 (41.7%) | 7 (58.3%) |
| Personal Care & Service | 0 (0.0%) | 1 (100.0%) |
| Total (Category) | 27 (32.5%) | 56 (67.5%) |
| Total (Overall) | 396 (58.4%) | 282 (41.6%) |
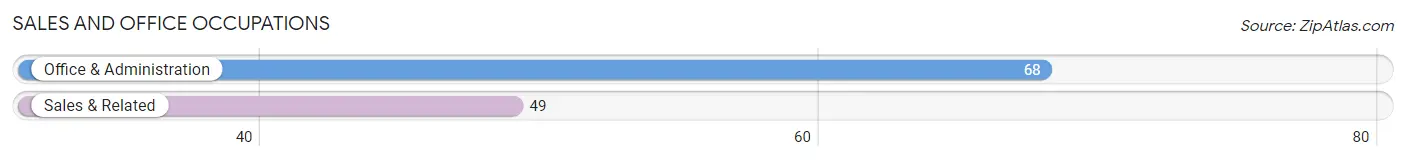
Sales and Office Occupations
The most common Sales and Office occupations in Faith are Office & Administration (68 | 10.0%), and Sales & Related (49 | 7.2%).
Sales and Office Occupations by Sex
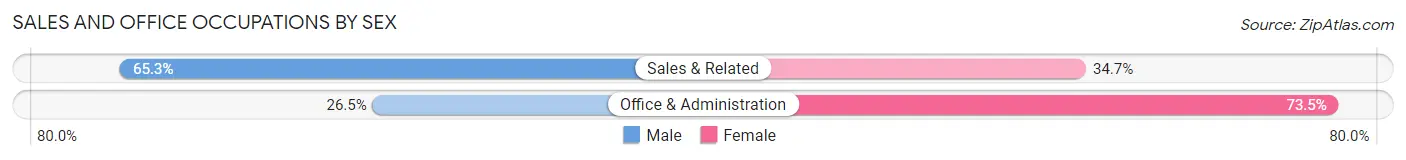
| Occupation | Male | Female |
| Sales & Related | 32 (65.3%) | 17 (34.7%) |
| Office & Administration | 18 (26.5%) | 50 (73.5%) |
| Total (Category) | 50 (42.7%) | 67 (57.3%) |
| Total (Overall) | 396 (58.4%) | 282 (41.6%) |
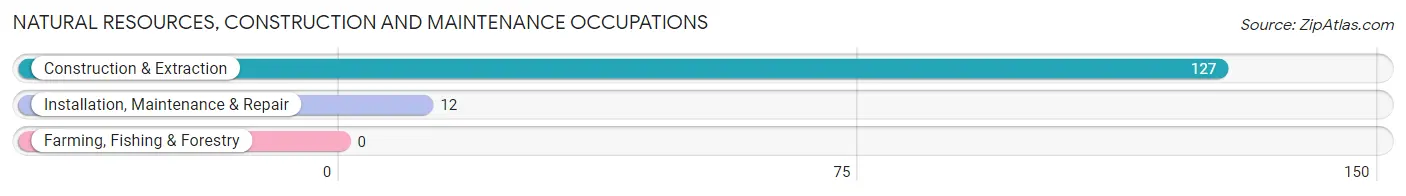
Natural Resources, Construction and Maintenance Occupations
The most common Natural Resources, Construction and Maintenance occupations in Faith are Construction & Extraction (127 | 18.7%), and Installation, Maintenance & Repair (12 | 1.8%).
Natural Resources, Construction and Maintenance Occupations by Sex
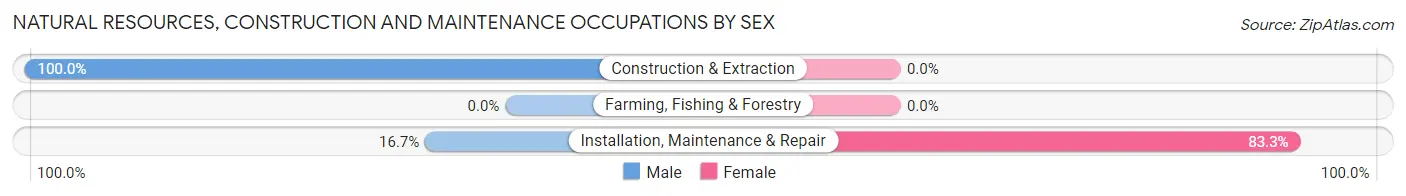
| Occupation | Male | Female |
| Farming, Fishing & Forestry | 0 (0.0%) | 0 (0.0%) |
| Construction & Extraction | 127 (100.0%) | 0 (0.0%) |
| Installation, Maintenance & Repair | 2 (16.7%) | 10 (83.3%) |
| Total (Category) | 129 (92.8%) | 10 (7.2%) |
| Total (Overall) | 396 (58.4%) | 282 (41.6%) |
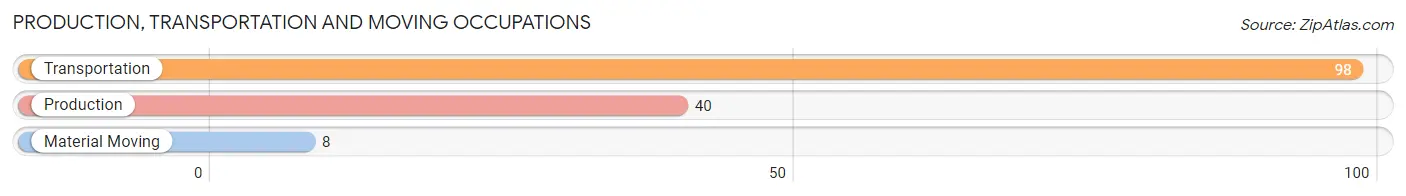
Production, Transportation and Moving Occupations
The most common Production, Transportation and Moving occupations in Faith are Transportation (98 | 14.4%), Production (40 | 5.9%), and Material Moving (8 | 1.2%).
Production, Transportation and Moving Occupations by Sex
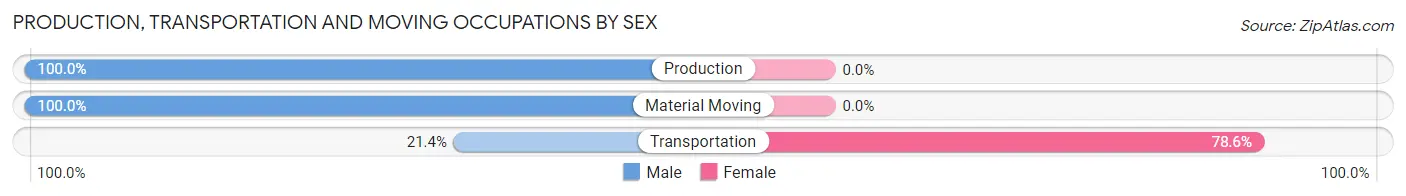
| Occupation | Male | Female |
| Production | 40 (100.0%) | 0 (0.0%) |
| Transportation | 21 (21.4%) | 77 (78.6%) |
| Material Moving | 8 (100.0%) | 0 (0.0%) |
| Total (Category) | 69 (47.3%) | 77 (52.7%) |
| Total (Overall) | 396 (58.4%) | 282 (41.6%) |
Employment Industries by Sex in Faith
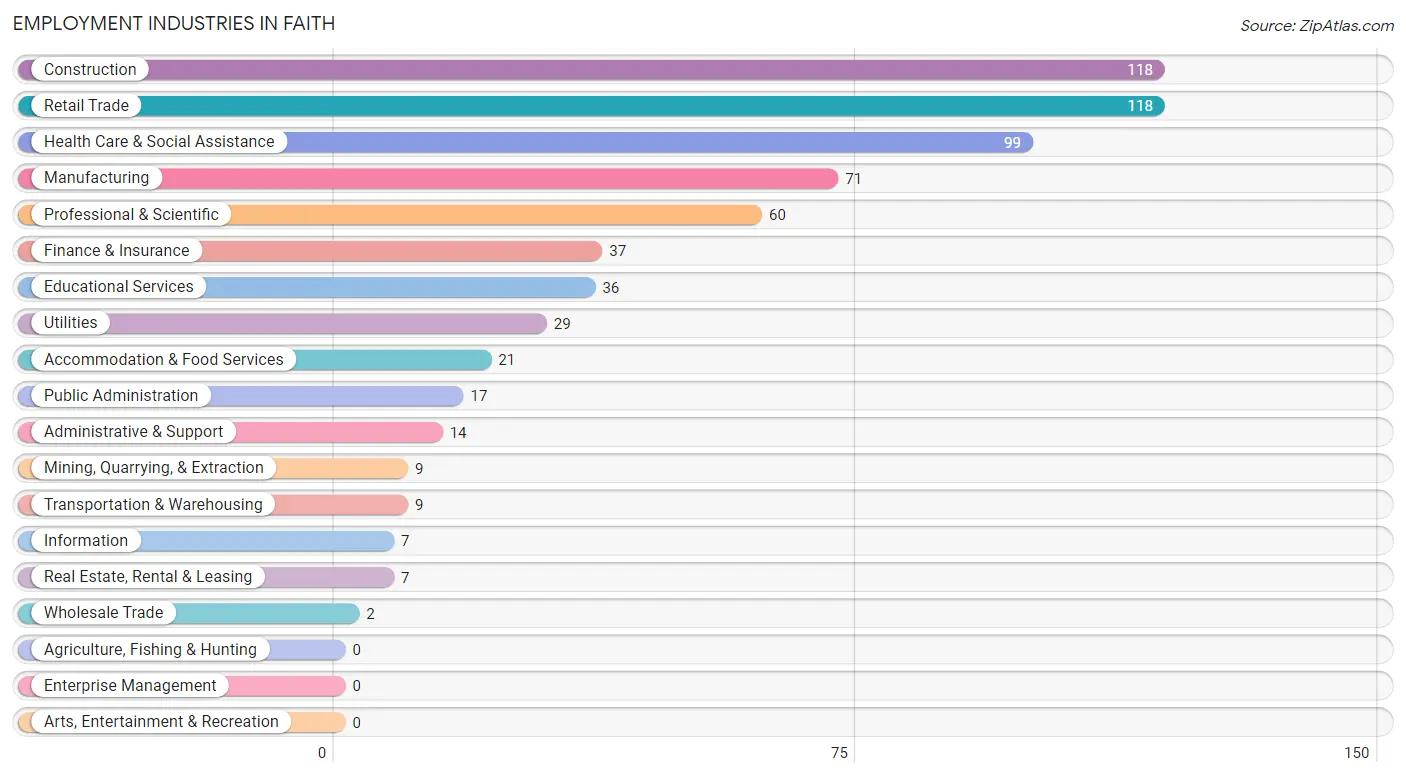
Employment Industries in Faith
The major employment industries in Faith include Construction (118 | 17.4%), Retail Trade (118 | 17.4%), Health Care & Social Assistance (99 | 14.6%), Manufacturing (71 | 10.5%), and Professional & Scientific (60 | 8.8%).
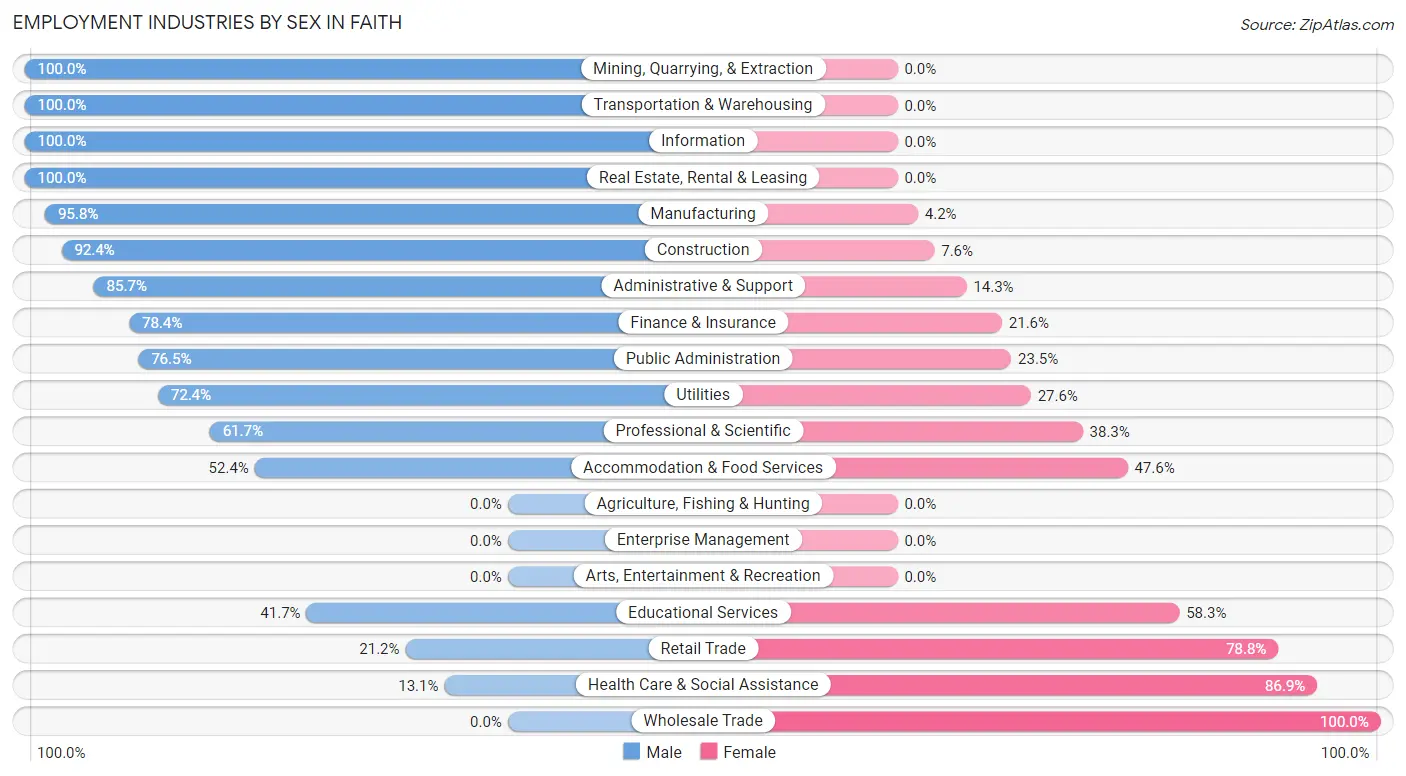
Employment Industries by Sex in Faith
The Faith industries that see more men than women are Mining, Quarrying, & Extraction (100.0%), Transportation & Warehousing (100.0%), and Information (100.0%), whereas the industries that tend to have a higher number of women are Wholesale Trade (100.0%), Health Care & Social Assistance (86.9%), and Retail Trade (78.8%).
| Industry | Male | Female |
| Agriculture, Fishing & Hunting | 0 (0.0%) | 0 (0.0%) |
| Mining, Quarrying, & Extraction | 9 (100.0%) | 0 (0.0%) |
| Construction | 109 (92.4%) | 9 (7.6%) |
| Manufacturing | 68 (95.8%) | 3 (4.2%) |
| Wholesale Trade | 0 (0.0%) | 2 (100.0%) |
| Retail Trade | 25 (21.2%) | 93 (78.8%) |
| Transportation & Warehousing | 9 (100.0%) | 0 (0.0%) |
| Utilities | 21 (72.4%) | 8 (27.6%) |
| Information | 7 (100.0%) | 0 (0.0%) |
| Finance & Insurance | 29 (78.4%) | 8 (21.6%) |
| Real Estate, Rental & Leasing | 7 (100.0%) | 0 (0.0%) |
| Professional & Scientific | 37 (61.7%) | 23 (38.3%) |
| Enterprise Management | 0 (0.0%) | 0 (0.0%) |
| Administrative & Support | 12 (85.7%) | 2 (14.3%) |
| Educational Services | 15 (41.7%) | 21 (58.3%) |
| Health Care & Social Assistance | 13 (13.1%) | 86 (86.9%) |
| Arts, Entertainment & Recreation | 0 (0.0%) | 0 (0.0%) |
| Accommodation & Food Services | 11 (52.4%) | 10 (47.6%) |
| Public Administration | 13 (76.5%) | 4 (23.5%) |
| Total | 396 (58.4%) | 282 (41.6%) |
Education in Faith
School Enrollment in Faith
The most common levels of schooling among the 274 students in Faith are college / undergraduate (71 | 25.9%), high school (67 | 24.4%), and elementary school (49 | 17.9%).
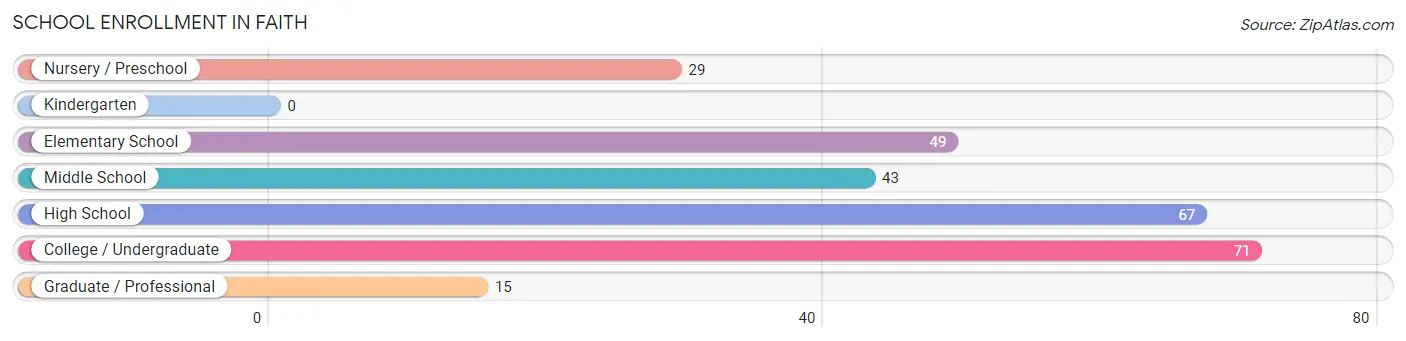
| School Level | # Students | % Students |
| Nursery / Preschool | 29 | 10.6% |
| Kindergarten | 0 | 0.0% |
| Elementary School | 49 | 17.9% |
| Middle School | 43 | 15.7% |
| High School | 67 | 24.4% |
| College / Undergraduate | 71 | 25.9% |
| Graduate / Professional | 15 | 5.5% |
| Total | 274 | 100.0% |
School Enrollment by Age by Funding Source in Faith
Out of a total of 274 students who are enrolled in schools in Faith, 34 (12.4%) attend a private institution, while the remaining 240 (87.6%) are enrolled in public schools. The age group of 3 to 4 year olds has the highest likelihood of being enrolled in private schools, with 29 (100.0% in the age bracket) enrolled. Conversely, the age group of 5 to 9 year old has the lowest likelihood of being enrolled in a private school, with 40 (100.0% in the age bracket) attending a public institution.
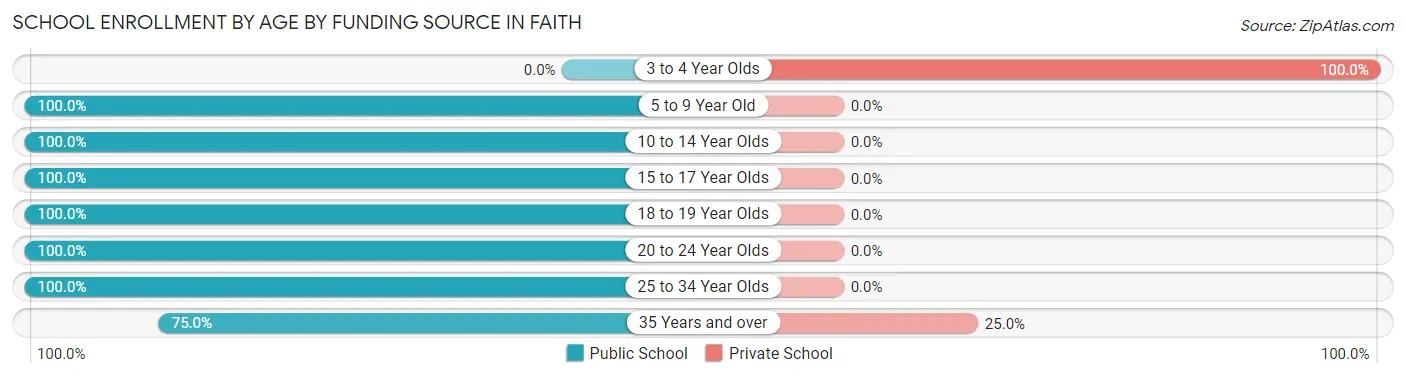
| Age Bracket | Public School | Private School |
| 3 to 4 Year Olds | 0 (0.0%) | 29 (100.0%) |
| 5 to 9 Year Old | 40 (100.0%) | 0 (0.0%) |
| 10 to 14 Year Olds | 72 (100.0%) | 0 (0.0%) |
| 15 to 17 Year Olds | 47 (100.0%) | 0 (0.0%) |
| 18 to 19 Year Olds | 4 (100.0%) | 0 (0.0%) |
| 20 to 24 Year Olds | 52 (100.0%) | 0 (0.0%) |
| 25 to 34 Year Olds | 10 (100.0%) | 0 (0.0%) |
| 35 Years and over | 15 (75.0%) | 5 (25.0%) |
| Total | 240 (87.6%) | 34 (12.4%) |
Educational Attainment by Field of Study in Faith
Business (66 | 30.1%), education (46 | 21.0%), science & technology (32 | 14.6%), arts & humanities (29 | 13.2%), and engineering (11 | 5.0%) are the most common fields of study among 219 individuals in Faith who have obtained a bachelor's degree or higher.
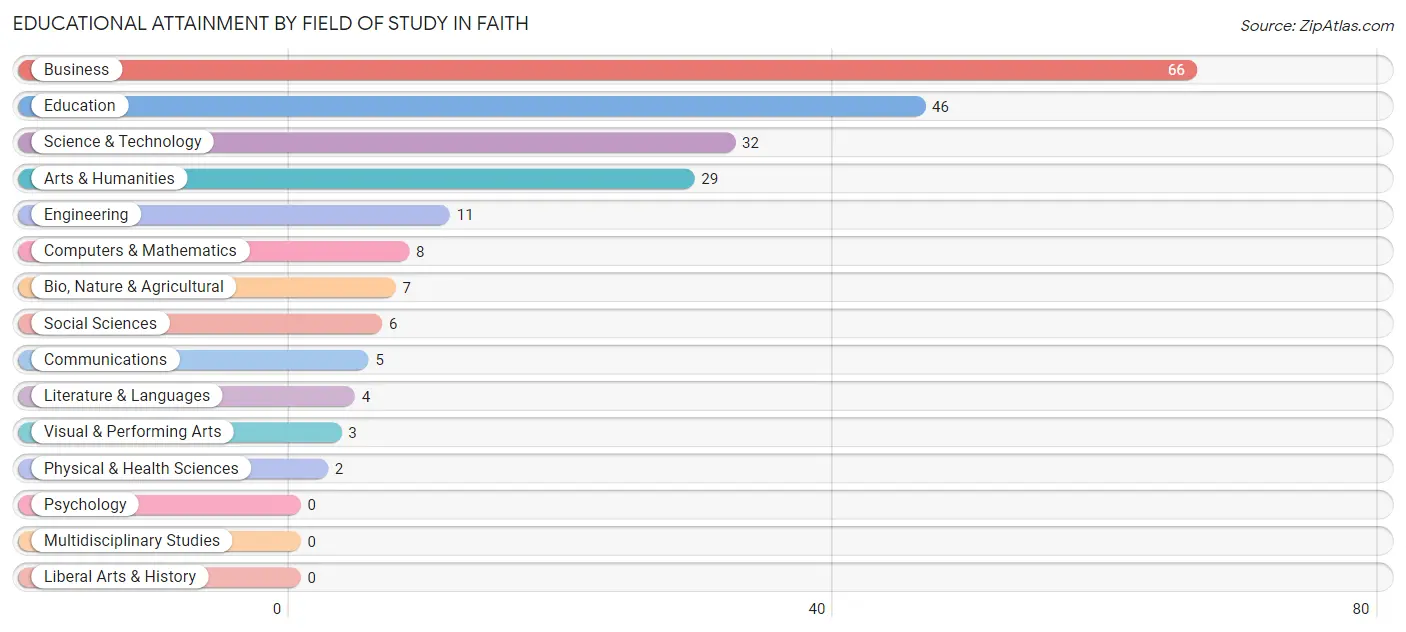
| Field of Study | # Graduates | % Graduates |
| Computers & Mathematics | 8 | 3.6% |
| Bio, Nature & Agricultural | 7 | 3.2% |
| Physical & Health Sciences | 2 | 0.9% |
| Psychology | 0 | 0.0% |
| Social Sciences | 6 | 2.7% |
| Engineering | 11 | 5.0% |
| Multidisciplinary Studies | 0 | 0.0% |
| Science & Technology | 32 | 14.6% |
| Business | 66 | 30.1% |
| Education | 46 | 21.0% |
| Literature & Languages | 4 | 1.8% |
| Liberal Arts & History | 0 | 0.0% |
| Visual & Performing Arts | 3 | 1.4% |
| Communications | 5 | 2.3% |
| Arts & Humanities | 29 | 13.2% |
| Total | 219 | 100.0% |
Transportation & Commute in Faith
Vehicle Availability by Sex in Faith
The most prevalent vehicle ownership categories in Faith are males with 3 vehicles (169, accounting for 42.7%) and females with 3 vehicles (154, making up 59.9%).
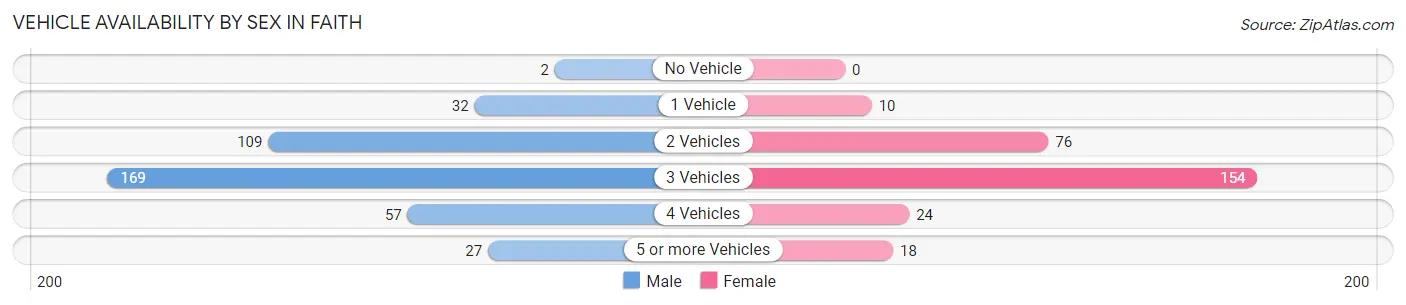
| Vehicles Available | Male | Female |
| No Vehicle | 2 (0.5%) | 0 (0.0%) |
| 1 Vehicle | 32 (8.1%) | 10 (3.5%) |
| 2 Vehicles | 109 (27.5%) | 76 (27.0%) |
| 3 Vehicles | 169 (42.7%) | 154 (54.6%) |
| 4 Vehicles | 57 (14.4%) | 24 (8.5%) |
| 5 or more Vehicles | 27 (6.8%) | 18 (6.4%) |
| Total | 396 (100.0%) | 282 (100.0%) |
Commute Time in Faith
The most frequently occuring commute durations in Faith are 40 to 44 minutes (108 commuters, 16.5%), less than 5 minutes (103 commuters, 15.7%), and 20 to 24 minutes (99 commuters, 15.1%).
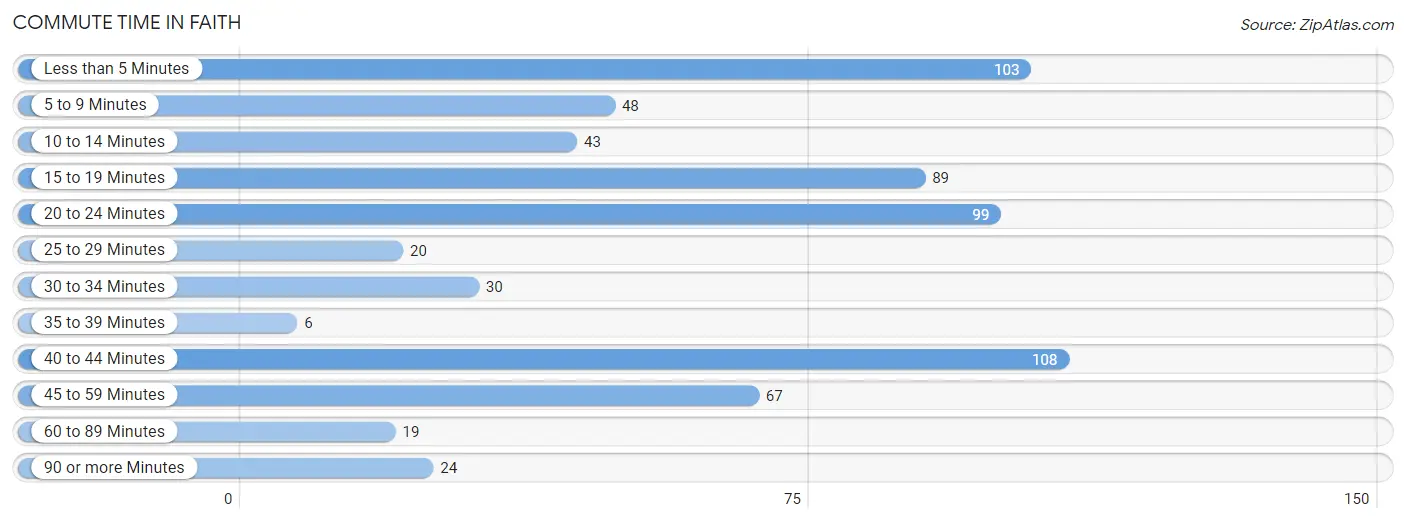
| Commute Time | # Commuters | % Commuters |
| Less than 5 Minutes | 103 | 15.7% |
| 5 to 9 Minutes | 48 | 7.3% |
| 10 to 14 Minutes | 43 | 6.6% |
| 15 to 19 Minutes | 89 | 13.6% |
| 20 to 24 Minutes | 99 | 15.1% |
| 25 to 29 Minutes | 20 | 3.0% |
| 30 to 34 Minutes | 30 | 4.6% |
| 35 to 39 Minutes | 6 | 0.9% |
| 40 to 44 Minutes | 108 | 16.5% |
| 45 to 59 Minutes | 67 | 10.2% |
| 60 to 89 Minutes | 19 | 2.9% |
| 90 or more Minutes | 24 | 3.7% |
Commute Time by Sex in Faith
The most common commute times in Faith are 40 to 44 minutes (99 commuters, 26.3%) for males and less than 5 minutes (90 commuters, 32.1%) for females.
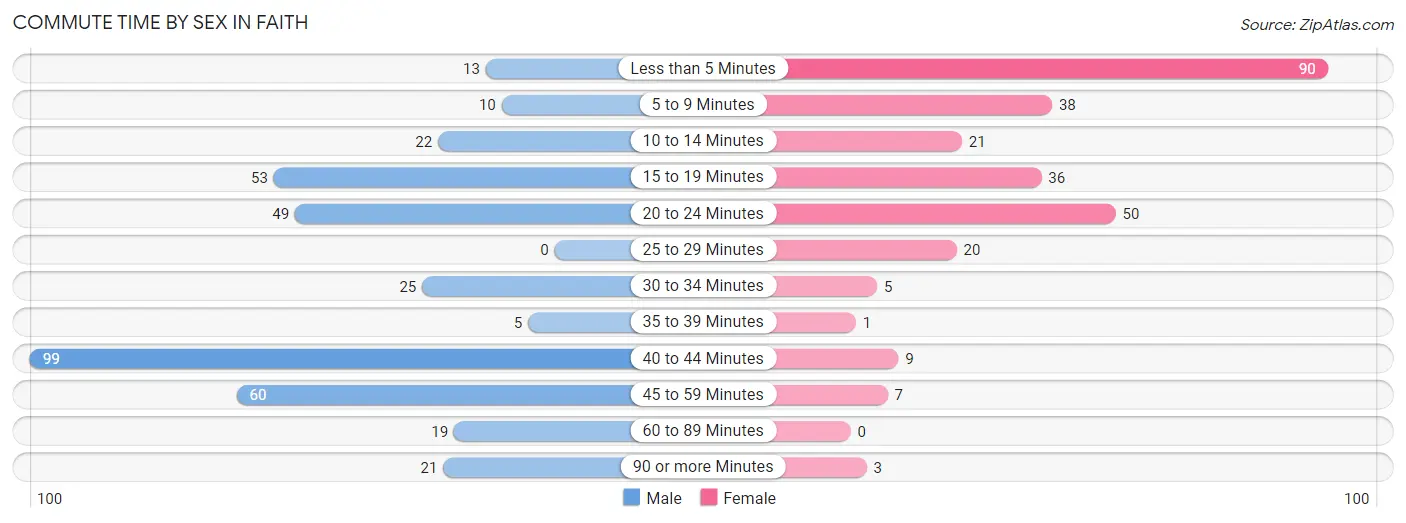
| Commute Time | Male | Female |
| Less than 5 Minutes | 13 (3.5%) | 90 (32.1%) |
| 5 to 9 Minutes | 10 (2.7%) | 38 (13.6%) |
| 10 to 14 Minutes | 22 (5.9%) | 21 (7.5%) |
| 15 to 19 Minutes | 53 (14.1%) | 36 (12.9%) |
| 20 to 24 Minutes | 49 (13.0%) | 50 (17.9%) |
| 25 to 29 Minutes | 0 (0.0%) | 20 (7.1%) |
| 30 to 34 Minutes | 25 (6.7%) | 5 (1.8%) |
| 35 to 39 Minutes | 5 (1.3%) | 1 (0.4%) |
| 40 to 44 Minutes | 99 (26.3%) | 9 (3.2%) |
| 45 to 59 Minutes | 60 (16.0%) | 7 (2.5%) |
| 60 to 89 Minutes | 19 (5.1%) | 0 (0.0%) |
| 90 or more Minutes | 21 (5.6%) | 3 (1.1%) |
Time of Departure to Work by Sex in Faith
The most frequent times of departure to work in Faith are 8:00 AM to 8:29 AM (113, 30.0%) for males and 7:00 AM to 7:29 AM (103, 36.8%) for females.
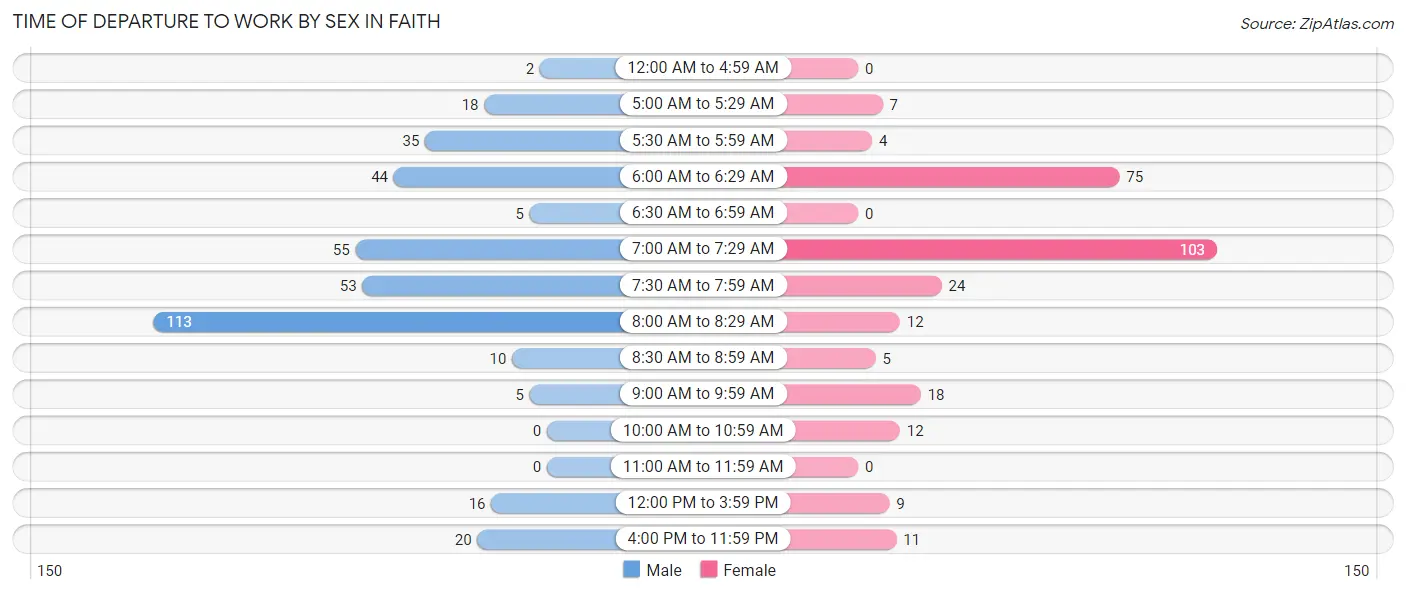
| Time of Departure | Male | Female |
| 12:00 AM to 4:59 AM | 2 (0.5%) | 0 (0.0%) |
| 5:00 AM to 5:29 AM | 18 (4.8%) | 7 (2.5%) |
| 5:30 AM to 5:59 AM | 35 (9.3%) | 4 (1.4%) |
| 6:00 AM to 6:29 AM | 44 (11.7%) | 75 (26.8%) |
| 6:30 AM to 6:59 AM | 5 (1.3%) | 0 (0.0%) |
| 7:00 AM to 7:29 AM | 55 (14.6%) | 103 (36.8%) |
| 7:30 AM to 7:59 AM | 53 (14.1%) | 24 (8.6%) |
| 8:00 AM to 8:29 AM | 113 (30.0%) | 12 (4.3%) |
| 8:30 AM to 8:59 AM | 10 (2.7%) | 5 (1.8%) |
| 9:00 AM to 9:59 AM | 5 (1.3%) | 18 (6.4%) |
| 10:00 AM to 10:59 AM | 0 (0.0%) | 12 (4.3%) |
| 11:00 AM to 11:59 AM | 0 (0.0%) | 0 (0.0%) |
| 12:00 PM to 3:59 PM | 16 (4.3%) | 9 (3.2%) |
| 4:00 PM to 11:59 PM | 20 (5.3%) | 11 (3.9%) |
| Total | 376 (100.0%) | 280 (100.0%) |
Housing Occupancy in Faith
Occupancy by Ownership in Faith
Of the total 439 dwellings in Faith, owner-occupied units account for 381 (86.8%), while renter-occupied units make up 58 (13.2%).
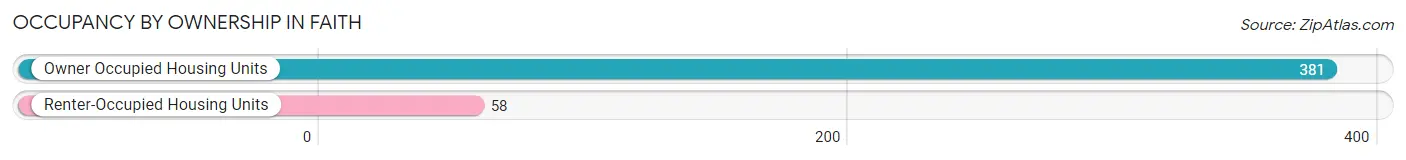
| Occupancy | # Housing Units | % Housing Units |
| Owner Occupied Housing Units | 381 | 86.8% |
| Renter-Occupied Housing Units | 58 | 13.2% |
| Total Occupied Housing Units | 439 | 100.0% |
Occupancy by Household Size in Faith
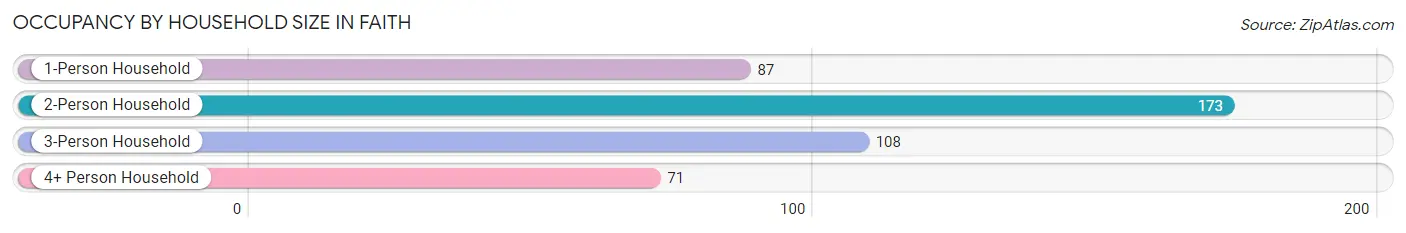
| Household Size | # Housing Units | % Housing Units |
| 1-Person Household | 87 | 19.8% |
| 2-Person Household | 173 | 39.4% |
| 3-Person Household | 108 | 24.6% |
| 4+ Person Household | 71 | 16.2% |
| Total Housing Units | 439 | 100.0% |
Occupancy by Ownership by Household Size in Faith
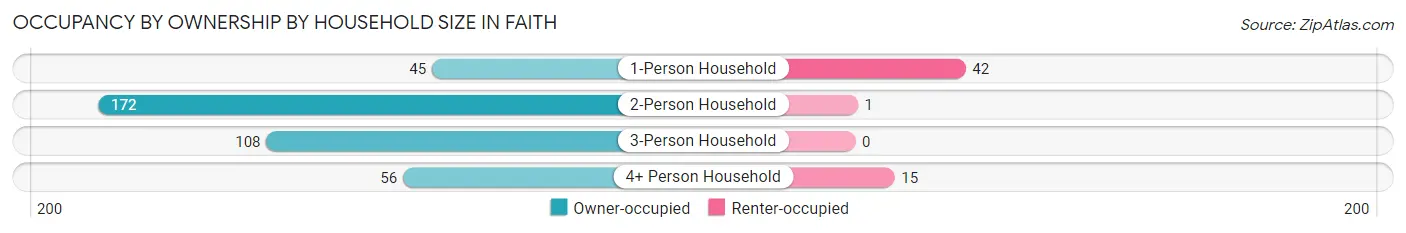
| Household Size | Owner-occupied | Renter-occupied |
| 1-Person Household | 45 (51.7%) | 42 (48.3%) |
| 2-Person Household | 172 (99.4%) | 1 (0.6%) |
| 3-Person Household | 108 (100.0%) | 0 (0.0%) |
| 4+ Person Household | 56 (78.9%) | 15 (21.1%) |
| Total Housing Units | 381 (86.8%) | 58 (13.2%) |
Occupancy by Educational Attainment in Faith

| Household Size | Owner-occupied | Renter-occupied |
| Less than High School | 7 (70.0%) | 3 (30.0%) |
| High School Diploma | 199 (90.9%) | 20 (9.1%) |
| College/Associate Degree | 57 (74.0%) | 20 (26.0%) |
| Bachelor's Degree or higher | 118 (88.7%) | 15 (11.3%) |
Occupancy by Age of Householder in Faith
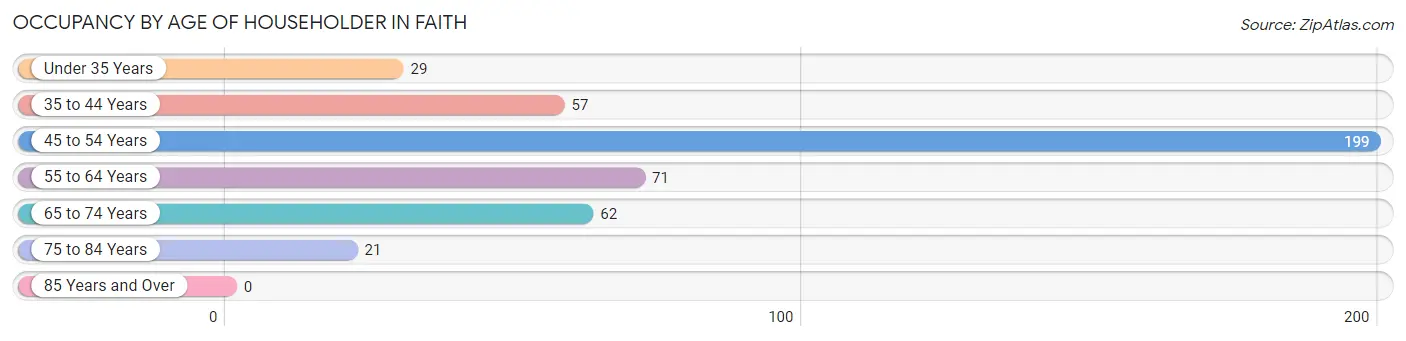
| Age Bracket | # Households | % Households |
| Under 35 Years | 29 | 6.6% |
| 35 to 44 Years | 57 | 13.0% |
| 45 to 54 Years | 199 | 45.3% |
| 55 to 64 Years | 71 | 16.2% |
| 65 to 74 Years | 62 | 14.1% |
| 75 to 84 Years | 21 | 4.8% |
| 85 Years and Over | 0 | 0.0% |
| Total | 439 | 100.0% |
Housing Finances in Faith
Median Income by Occupancy in Faith
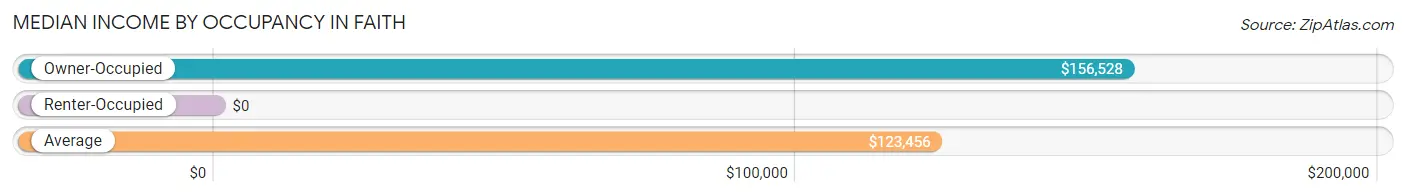
| Occupancy Type | # Households | Median Income |
| Owner-Occupied | 381 (86.8%) | $156,528 |
| Renter-Occupied | 58 (13.2%) | $0 |
| Average | 439 (100.0%) | $123,456 |
Occupancy by Householder Income Bracket in Faith
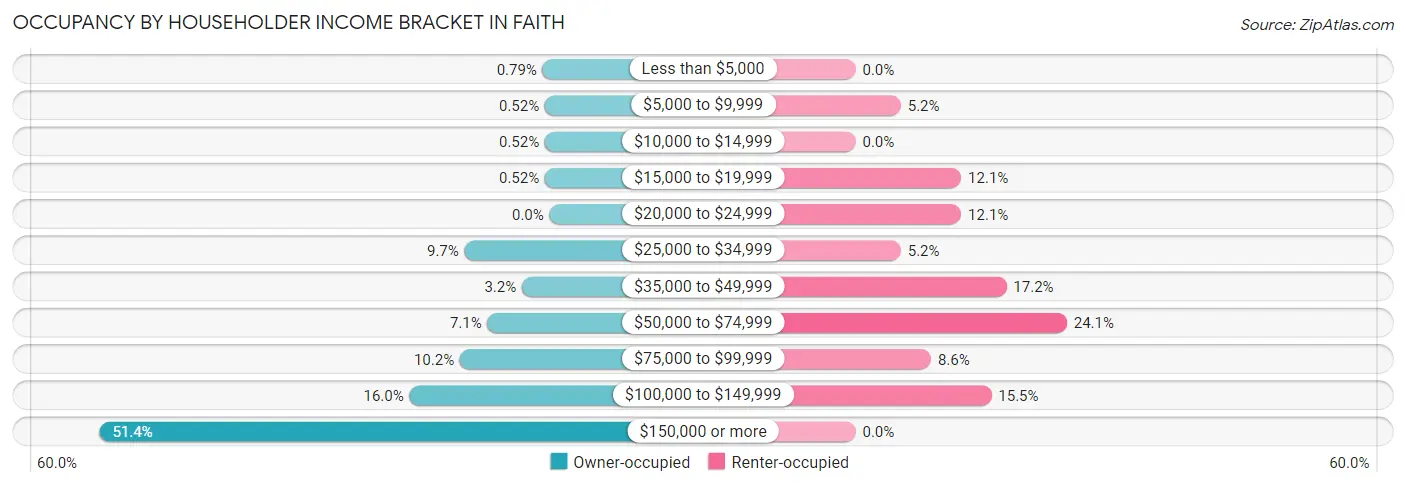
| Income Bracket | Owner-occupied | Renter-occupied |
| Less than $5,000 | 3 (0.8%) | 0 (0.0%) |
| $5,000 to $9,999 | 2 (0.5%) | 3 (5.2%) |
| $10,000 to $14,999 | 2 (0.5%) | 0 (0.0%) |
| $15,000 to $19,999 | 2 (0.5%) | 7 (12.1%) |
| $20,000 to $24,999 | 0 (0.0%) | 7 (12.1%) |
| $25,000 to $34,999 | 37 (9.7%) | 3 (5.2%) |
| $35,000 to $49,999 | 12 (3.2%) | 10 (17.2%) |
| $50,000 to $74,999 | 27 (7.1%) | 14 (24.1%) |
| $75,000 to $99,999 | 39 (10.2%) | 5 (8.6%) |
| $100,000 to $149,999 | 61 (16.0%) | 9 (15.5%) |
| $150,000 or more | 196 (51.4%) | 0 (0.0%) |
| Total | 381 (100.0%) | 58 (100.0%) |
Monthly Housing Cost Tiers in Faith
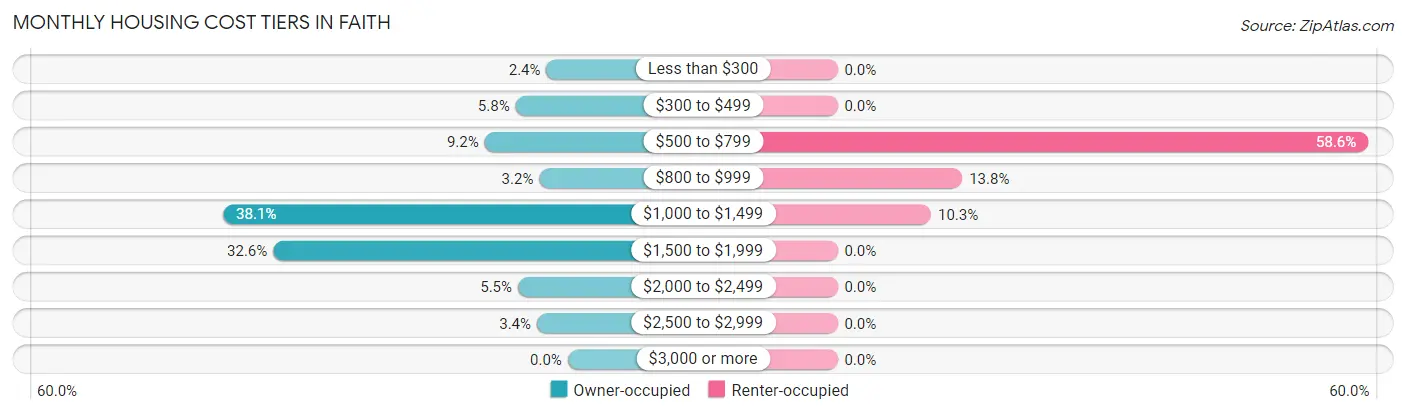
| Monthly Cost | Owner-occupied | Renter-occupied |
| Less than $300 | 9 (2.4%) | 0 (0.0%) |
| $300 to $499 | 22 (5.8%) | 0 (0.0%) |
| $500 to $799 | 35 (9.2%) | 34 (58.6%) |
| $800 to $999 | 12 (3.2%) | 8 (13.8%) |
| $1,000 to $1,499 | 145 (38.1%) | 6 (10.3%) |
| $1,500 to $1,999 | 124 (32.6%) | 0 (0.0%) |
| $2,000 to $2,499 | 21 (5.5%) | 0 (0.0%) |
| $2,500 to $2,999 | 13 (3.4%) | 0 (0.0%) |
| $3,000 or more | 0 (0.0%) | 0 (0.0%) |
| Total | 381 (100.0%) | 58 (100.0%) |
Physical Housing Characteristics in Faith
Housing Structures in Faith
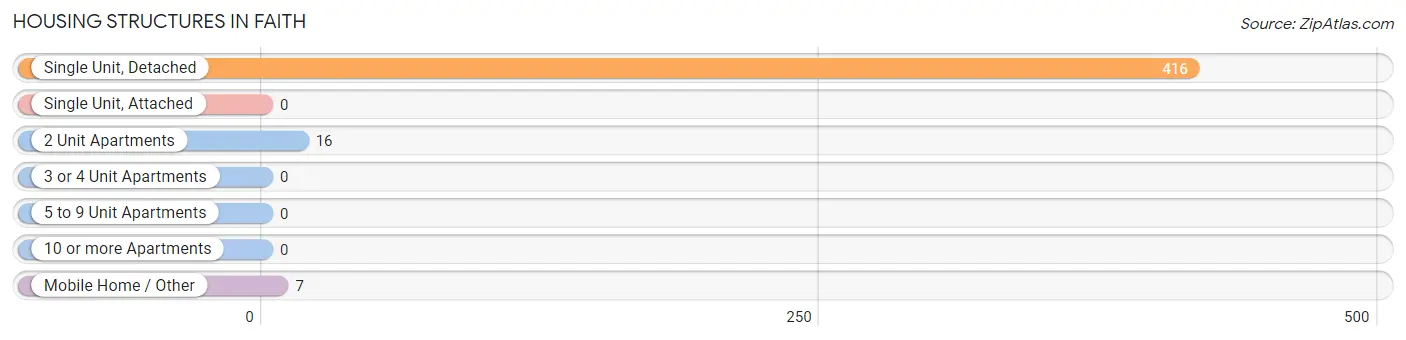
| Structure Type | # Housing Units | % Housing Units |
| Single Unit, Detached | 416 | 94.8% |
| Single Unit, Attached | 0 | 0.0% |
| 2 Unit Apartments | 16 | 3.6% |
| 3 or 4 Unit Apartments | 0 | 0.0% |
| 5 to 9 Unit Apartments | 0 | 0.0% |
| 10 or more Apartments | 0 | 0.0% |
| Mobile Home / Other | 7 | 1.6% |
| Total | 439 | 100.0% |
Housing Structures by Occupancy in Faith
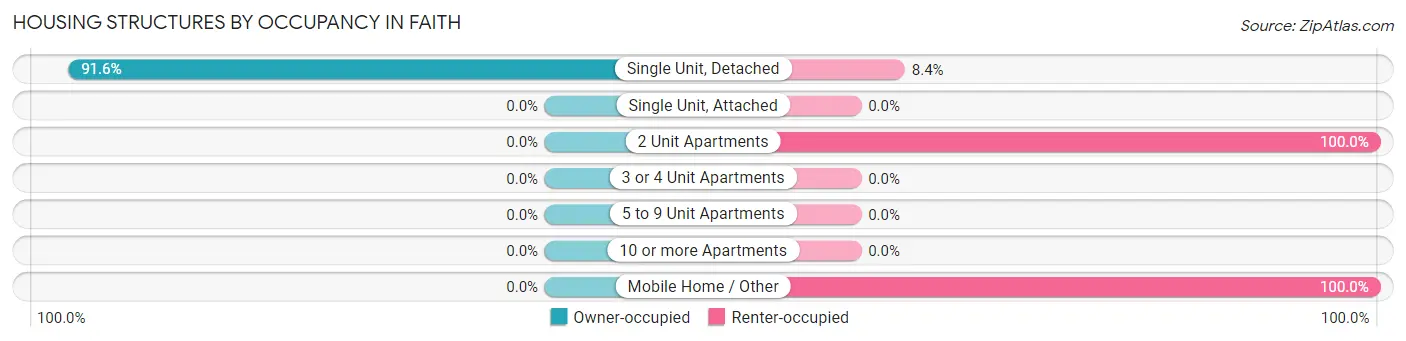
| Structure Type | Owner-occupied | Renter-occupied |
| Single Unit, Detached | 381 (91.6%) | 35 (8.4%) |
| Single Unit, Attached | 0 (0.0%) | 0 (0.0%) |
| 2 Unit Apartments | 0 (0.0%) | 16 (100.0%) |
| 3 or 4 Unit Apartments | 0 (0.0%) | 0 (0.0%) |
| 5 to 9 Unit Apartments | 0 (0.0%) | 0 (0.0%) |
| 10 or more Apartments | 0 (0.0%) | 0 (0.0%) |
| Mobile Home / Other | 0 (0.0%) | 7 (100.0%) |
| Total | 381 (86.8%) | 58 (13.2%) |
Housing Structures by Number of Rooms in Faith
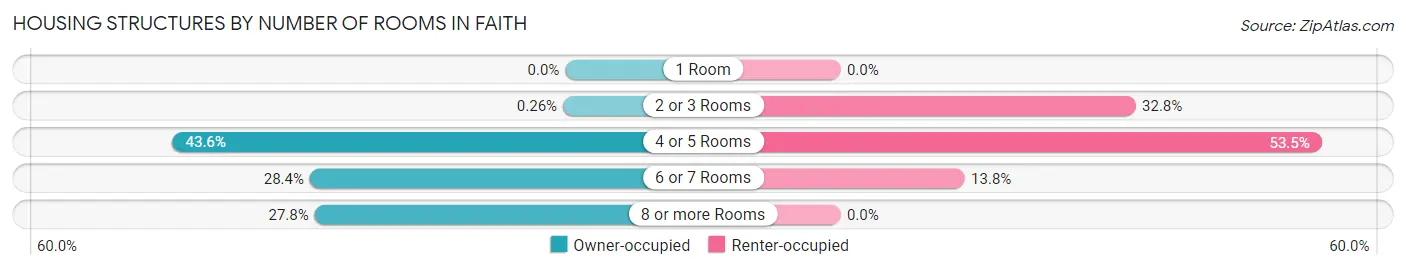
| Number of Rooms | Owner-occupied | Renter-occupied |
| 1 Room | 0 (0.0%) | 0 (0.0%) |
| 2 or 3 Rooms | 1 (0.3%) | 19 (32.8%) |
| 4 or 5 Rooms | 166 (43.6%) | 31 (53.4%) |
| 6 or 7 Rooms | 108 (28.3%) | 8 (13.8%) |
| 8 or more Rooms | 106 (27.8%) | 0 (0.0%) |
| Total | 381 (100.0%) | 58 (100.0%) |
Housing Structure by Heating Type in Faith
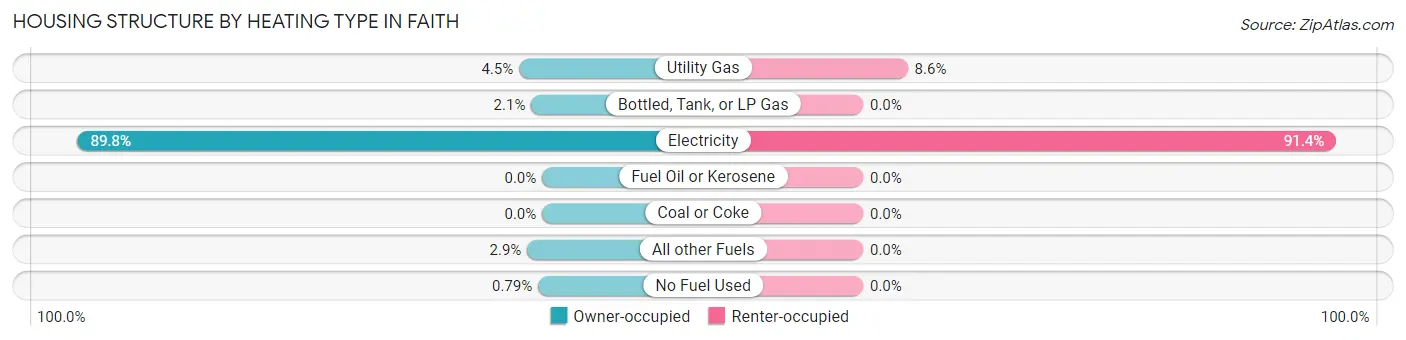
| Heating Type | Owner-occupied | Renter-occupied |
| Utility Gas | 17 (4.5%) | 5 (8.6%) |
| Bottled, Tank, or LP Gas | 8 (2.1%) | 0 (0.0%) |
| Electricity | 342 (89.8%) | 53 (91.4%) |
| Fuel Oil or Kerosene | 0 (0.0%) | 0 (0.0%) |
| Coal or Coke | 0 (0.0%) | 0 (0.0%) |
| All other Fuels | 11 (2.9%) | 0 (0.0%) |
| No Fuel Used | 3 (0.8%) | 0 (0.0%) |
| Total | 381 (100.0%) | 58 (100.0%) |
Household Vehicle Usage in Faith
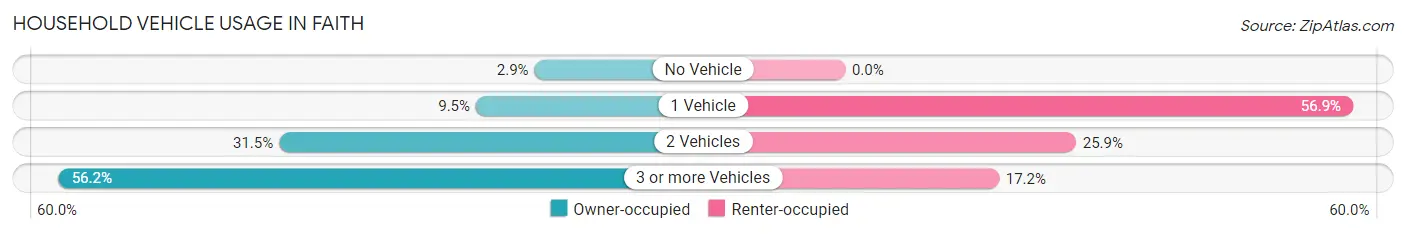
| Vehicles per Household | Owner-occupied | Renter-occupied |
| No Vehicle | 11 (2.9%) | 0 (0.0%) |
| 1 Vehicle | 36 (9.5%) | 33 (56.9%) |
| 2 Vehicles | 120 (31.5%) | 15 (25.9%) |
| 3 or more Vehicles | 214 (56.2%) | 10 (17.2%) |
| Total | 381 (100.0%) | 58 (100.0%) |
Real Estate & Mortgages in Faith
Real Estate and Mortgage Overview in Faith
| Characteristic | Without Mortgage | With Mortgage |
| Housing Units | 71 | 310 |
| Median Property Value | $278,400 | $240,000 |
| Median Household Income | $92,344 | $173 |
| Monthly Housing Costs | $556 | $0 |
| Real Estate Taxes | $2,708 | $0 |
Property Value by Mortgage Status in Faith
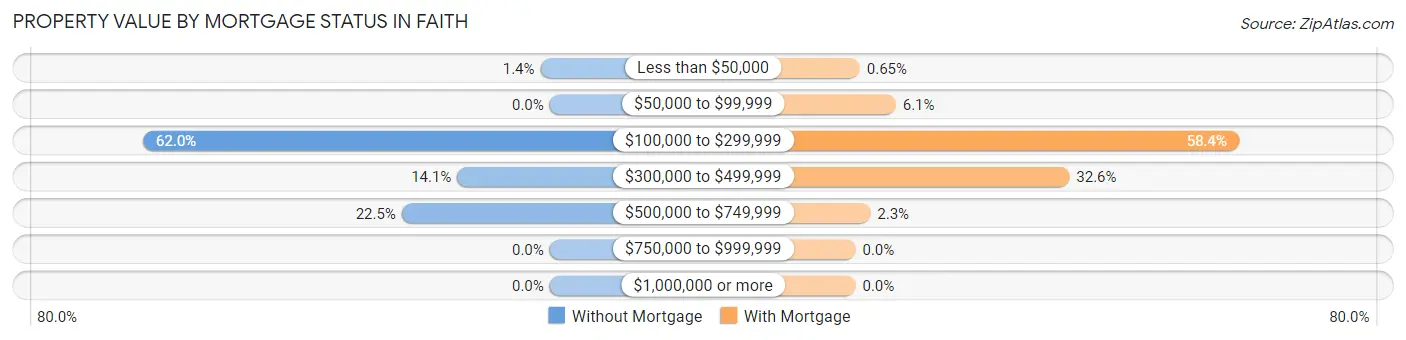
| Property Value | Without Mortgage | With Mortgage |
| Less than $50,000 | 1 (1.4%) | 2 (0.6%) |
| $50,000 to $99,999 | 0 (0.0%) | 19 (6.1%) |
| $100,000 to $299,999 | 44 (62.0%) | 181 (58.4%) |
| $300,000 to $499,999 | 10 (14.1%) | 101 (32.6%) |
| $500,000 to $749,999 | 16 (22.5%) | 7 (2.3%) |
| $750,000 to $999,999 | 0 (0.0%) | 0 (0.0%) |
| $1,000,000 or more | 0 (0.0%) | 0 (0.0%) |
| Total | 71 (100.0%) | 310 (100.0%) |
Household Income by Mortgage Status in Faith
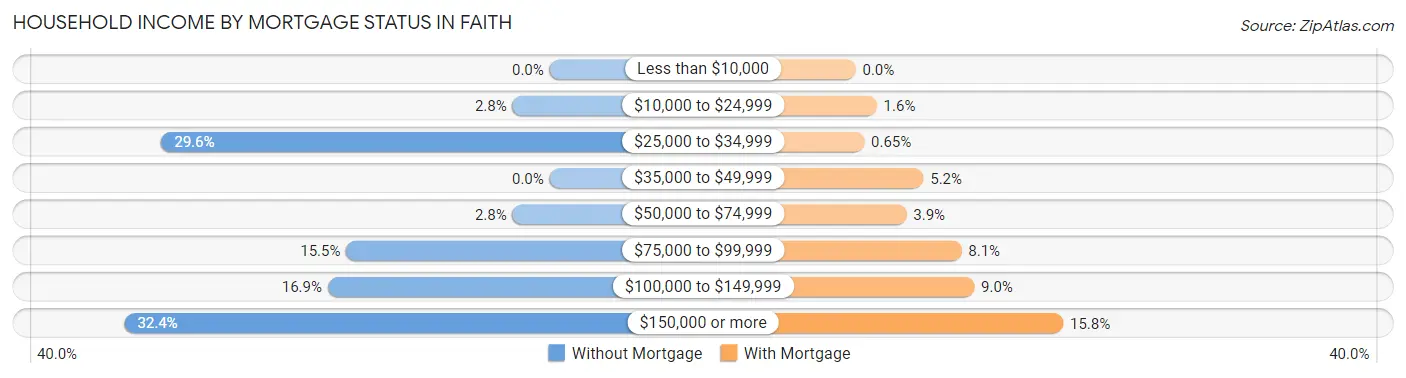
| Household Income | Without Mortgage | With Mortgage |
| Less than $10,000 | 0 (0.0%) | 0 (0.0%) |
| $10,000 to $24,999 | 2 (2.8%) | 5 (1.6%) |
| $25,000 to $34,999 | 21 (29.6%) | 2 (0.6%) |
| $35,000 to $49,999 | 0 (0.0%) | 16 (5.2%) |
| $50,000 to $74,999 | 2 (2.8%) | 12 (3.9%) |
| $75,000 to $99,999 | 11 (15.5%) | 25 (8.1%) |
| $100,000 to $149,999 | 12 (16.9%) | 28 (9.0%) |
| $150,000 or more | 23 (32.4%) | 49 (15.8%) |
| Total | 71 (100.0%) | 310 (100.0%) |
Property Value to Household Income Ratio in Faith
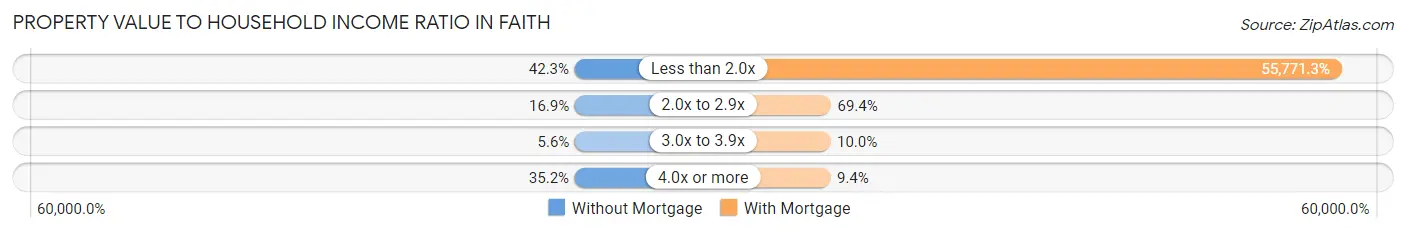
| Value-to-Income Ratio | Without Mortgage | With Mortgage |
| Less than 2.0x | 30 (42.2%) | 172,891 (55,771.3%) |
| 2.0x to 2.9x | 12 (16.9%) | 215 (69.4%) |
| 3.0x to 3.9x | 4 (5.6%) | 31 (10.0%) |
| 4.0x or more | 25 (35.2%) | 29 (9.3%) |
| Total | 71 (100.0%) | 310 (100.0%) |
Real Estate Taxes by Mortgage Status in Faith
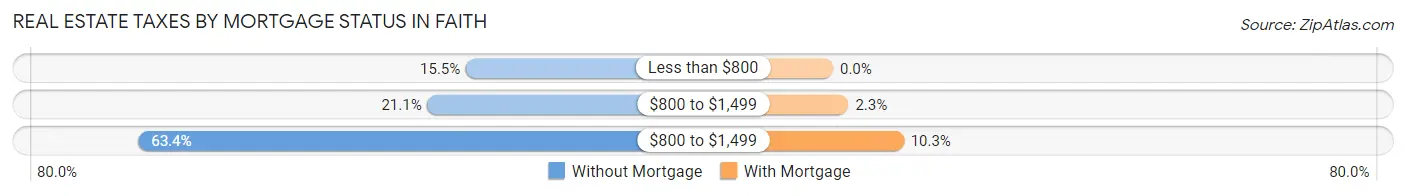
| Property Taxes | Without Mortgage | With Mortgage |
| Less than $800 | 11 (15.5%) | 0 (0.0%) |
| $800 to $1,499 | 15 (21.1%) | 7 (2.3%) |
| $800 to $1,499 | 45 (63.4%) | 32 (10.3%) |
| Total | 71 (100.0%) | 310 (100.0%) |
Health & Disability in Faith
Health Insurance Coverage by Age in Faith
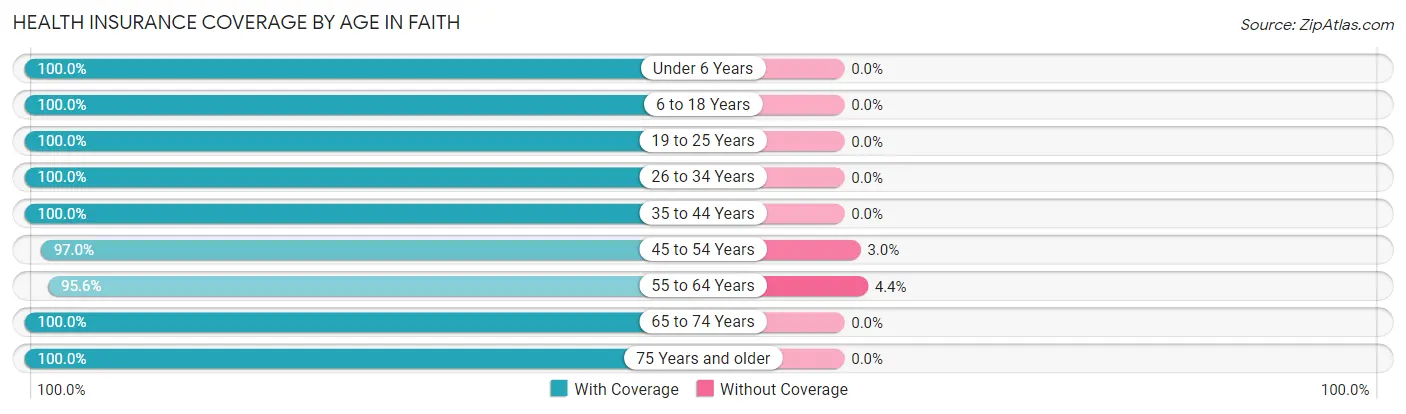
| Age Bracket | With Coverage | Without Coverage |
| Under 6 Years | 90 (100.0%) | 0 (0.0%) |
| 6 to 18 Years | 159 (100.0%) | 0 (0.0%) |
| 19 to 25 Years | 68 (100.0%) | 0 (0.0%) |
| 26 to 34 Years | 64 (100.0%) | 0 (0.0%) |
| 35 to 44 Years | 194 (100.0%) | 0 (0.0%) |
| 45 to 54 Years | 258 (97.0%) | 8 (3.0%) |
| 55 to 64 Years | 131 (95.6%) | 6 (4.4%) |
| 65 to 74 Years | 89 (100.0%) | 0 (0.0%) |
| 75 Years and older | 29 (100.0%) | 0 (0.0%) |
| Total | 1,082 (98.7%) | 14 (1.3%) |
Health Insurance Coverage by Citizenship Status in Faith
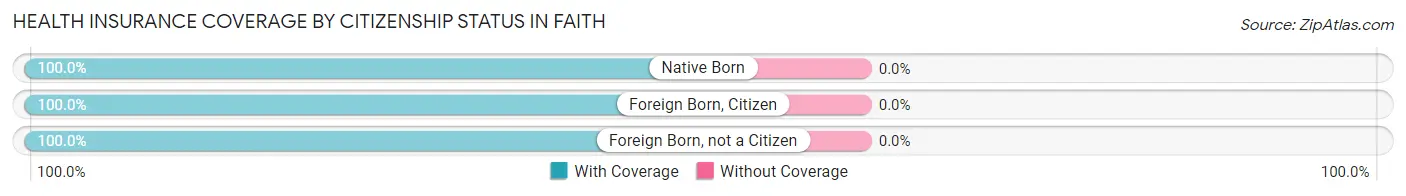
| Citizenship Status | With Coverage | Without Coverage |
| Native Born | 90 (100.0%) | 0 (0.0%) |
| Foreign Born, Citizen | 159 (100.0%) | 0 (0.0%) |
| Foreign Born, not a Citizen | 68 (100.0%) | 0 (0.0%) |
Health Insurance Coverage by Household Income in Faith
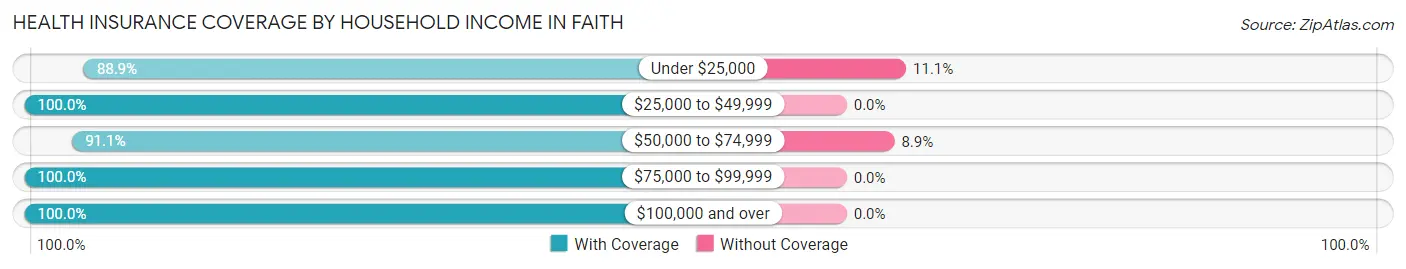
| Household Income | With Coverage | Without Coverage |
| Under $25,000 | 32 (88.9%) | 4 (11.1%) |
| $25,000 to $49,999 | 115 (100.0%) | 0 (0.0%) |
| $50,000 to $74,999 | 102 (91.1%) | 10 (8.9%) |
| $75,000 to $99,999 | 118 (100.0%) | 0 (0.0%) |
| $100,000 and over | 715 (100.0%) | 0 (0.0%) |
Public vs Private Health Insurance Coverage by Age in Faith
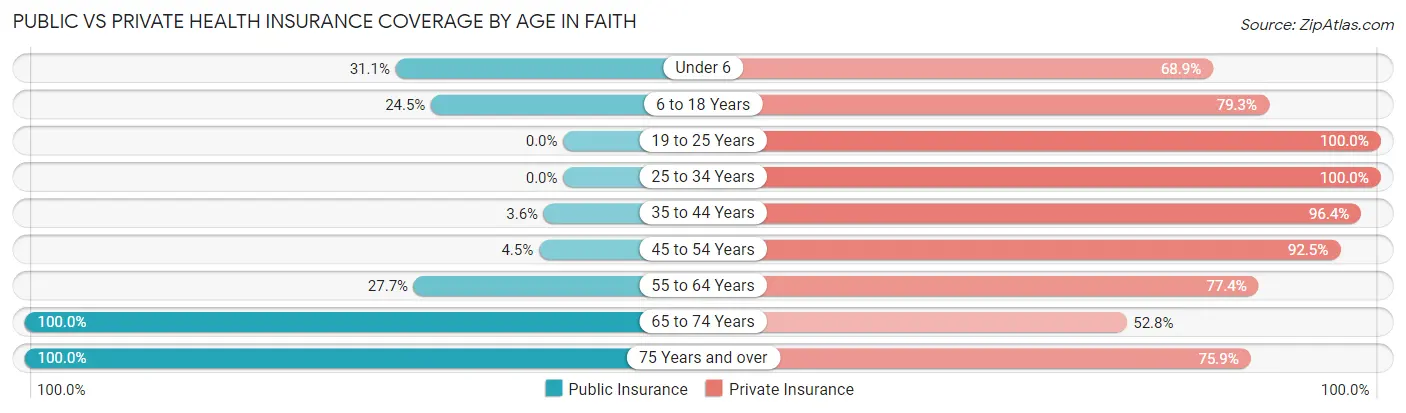
| Age Bracket | Public Insurance | Private Insurance |
| Under 6 | 28 (31.1%) | 62 (68.9%) |
| 6 to 18 Years | 39 (24.5%) | 126 (79.2%) |
| 19 to 25 Years | 0 (0.0%) | 68 (100.0%) |
| 25 to 34 Years | 0 (0.0%) | 64 (100.0%) |
| 35 to 44 Years | 7 (3.6%) | 187 (96.4%) |
| 45 to 54 Years | 12 (4.5%) | 246 (92.5%) |
| 55 to 64 Years | 38 (27.7%) | 106 (77.4%) |
| 65 to 74 Years | 89 (100.0%) | 47 (52.8%) |
| 75 Years and over | 29 (100.0%) | 22 (75.9%) |
| Total | 242 (22.1%) | 928 (84.7%) |
Disability Status by Sex by Age in Faith
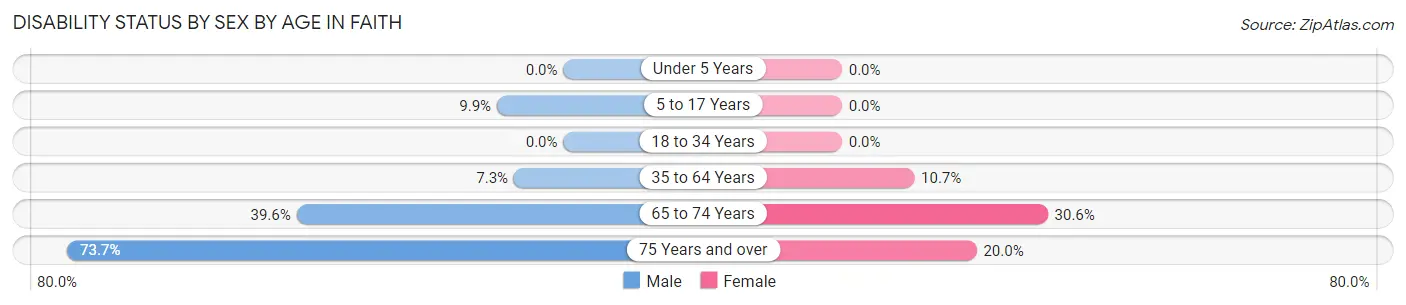
| Age Bracket | Male | Female |
| Under 5 Years | 0 (0.0%) | 0 (0.0%) |
| 5 to 17 Years | 7 (9.9%) | 0 (0.0%) |
| 18 to 34 Years | 0 (0.0%) | 0 (0.0%) |
| 35 to 64 Years | 24 (7.3%) | 29 (10.7%) |
| 65 to 74 Years | 21 (39.6%) | 11 (30.6%) |
| 75 Years and over | 14 (73.7%) | 2 (20.0%) |
Disability Class by Sex by Age in Faith
Disability Class: Hearing Difficulty
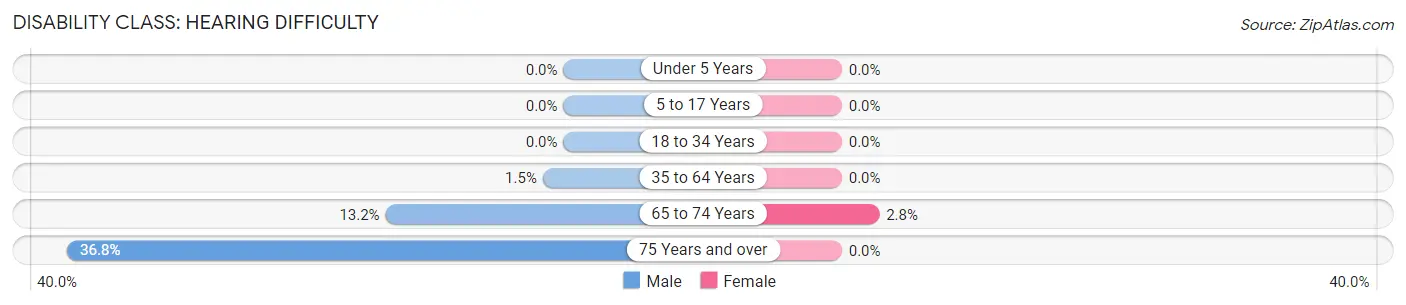
| Age Bracket | Male | Female |
| Under 5 Years | 0 (0.0%) | 0 (0.0%) |
| 5 to 17 Years | 0 (0.0%) | 0 (0.0%) |
| 18 to 34 Years | 0 (0.0%) | 0 (0.0%) |
| 35 to 64 Years | 5 (1.5%) | 0 (0.0%) |
| 65 to 74 Years | 7 (13.2%) | 1 (2.8%) |
| 75 Years and over | 7 (36.8%) | 0 (0.0%) |
Disability Class: Vision Difficulty
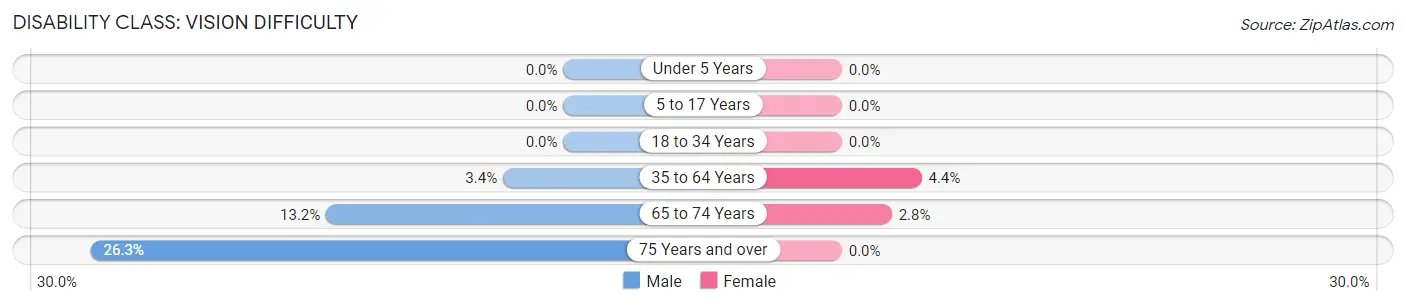
| Age Bracket | Male | Female |
| Under 5 Years | 0 (0.0%) | 0 (0.0%) |
| 5 to 17 Years | 0 (0.0%) | 0 (0.0%) |
| 18 to 34 Years | 0 (0.0%) | 0 (0.0%) |
| 35 to 64 Years | 11 (3.4%) | 12 (4.4%) |
| 65 to 74 Years | 7 (13.2%) | 1 (2.8%) |
| 75 Years and over | 5 (26.3%) | 0 (0.0%) |
Disability Class: Cognitive Difficulty
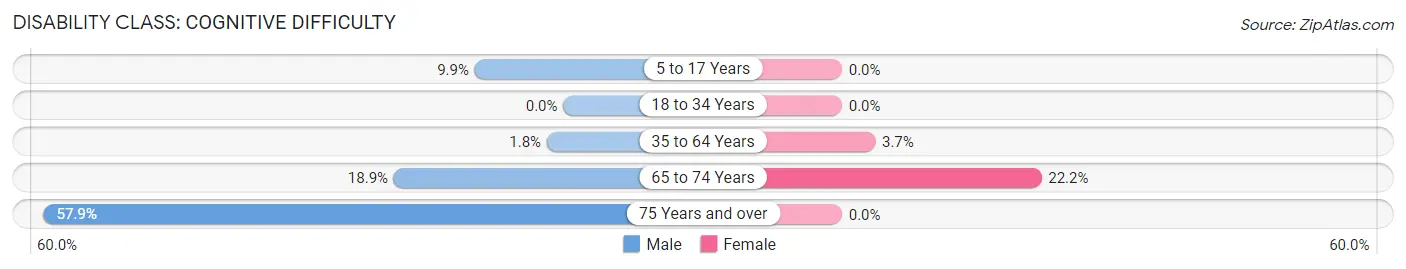
| Age Bracket | Male | Female |
| 5 to 17 Years | 7 (9.9%) | 0 (0.0%) |
| 18 to 34 Years | 0 (0.0%) | 0 (0.0%) |
| 35 to 64 Years | 6 (1.8%) | 10 (3.7%) |
| 65 to 74 Years | 10 (18.9%) | 8 (22.2%) |
| 75 Years and over | 11 (57.9%) | 0 (0.0%) |
Disability Class: Ambulatory Difficulty
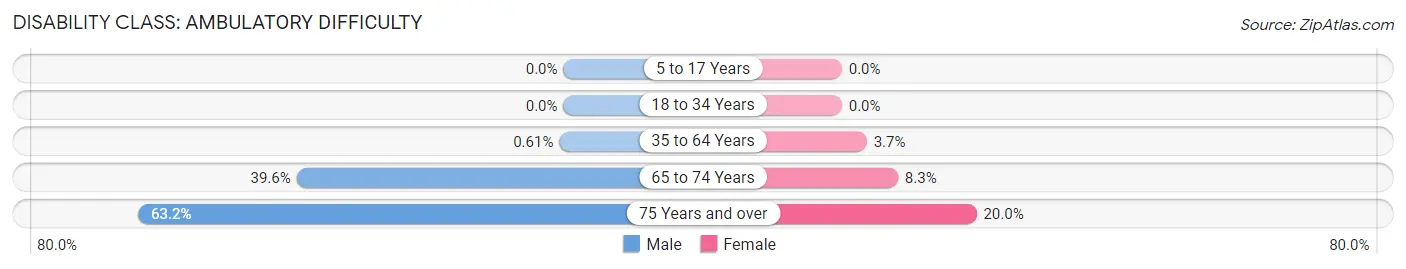
| Age Bracket | Male | Female |
| 5 to 17 Years | 0 (0.0%) | 0 (0.0%) |
| 18 to 34 Years | 0 (0.0%) | 0 (0.0%) |
| 35 to 64 Years | 2 (0.6%) | 10 (3.7%) |
| 65 to 74 Years | 21 (39.6%) | 3 (8.3%) |
| 75 Years and over | 12 (63.2%) | 2 (20.0%) |
Disability Class: Self-Care Difficulty
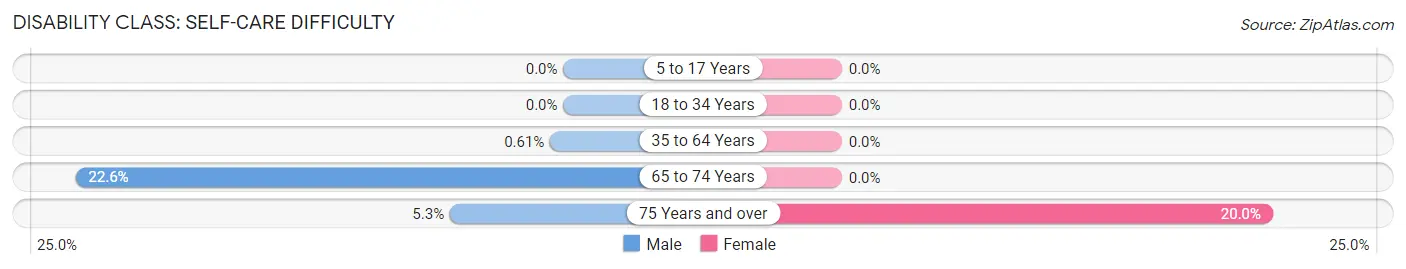
| Age Bracket | Male | Female |
| 5 to 17 Years | 0 (0.0%) | 0 (0.0%) |
| 18 to 34 Years | 0 (0.0%) | 0 (0.0%) |
| 35 to 64 Years | 2 (0.6%) | 0 (0.0%) |
| 65 to 74 Years | 12 (22.6%) | 0 (0.0%) |
| 75 Years and over | 1 (5.3%) | 2 (20.0%) |
Technology Access in Faith
Computing Device Access in Faith
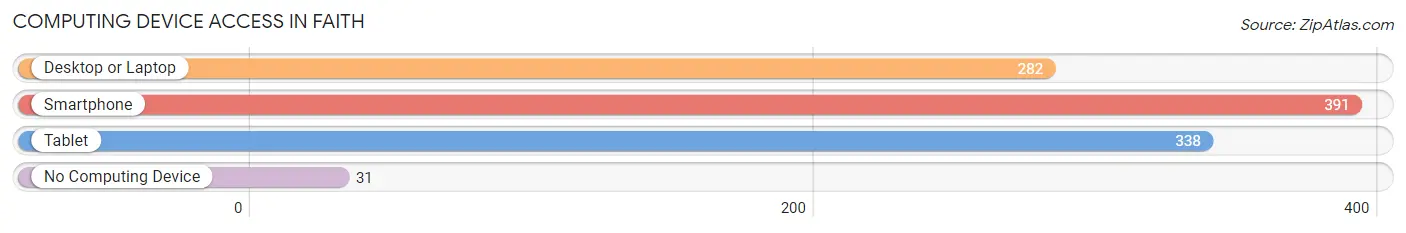
| Device Type | # Households | % Households |
| Desktop or Laptop | 282 | 64.2% |
| Smartphone | 391 | 89.1% |
| Tablet | 338 | 77.0% |
| No Computing Device | 31 | 7.1% |
| Total | 439 | 100.0% |
Internet Access in Faith
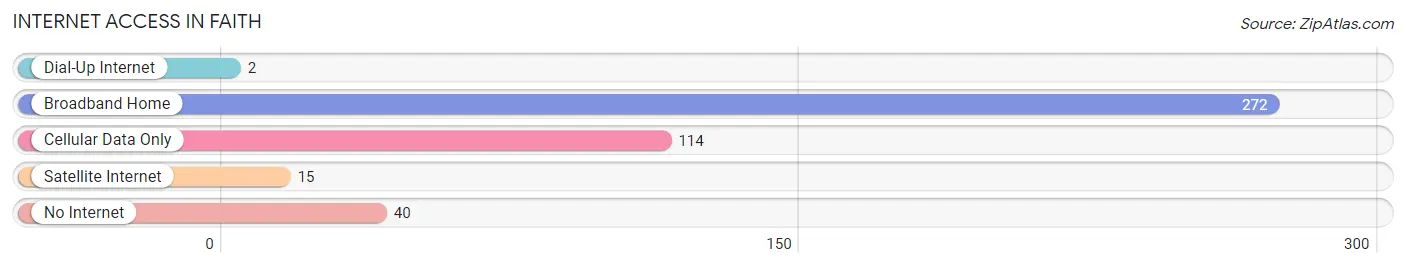
| Internet Type | # Households | % Households |
| Dial-Up Internet | 2 | 0.5% |
| Broadband Home | 272 | 62.0% |
| Cellular Data Only | 114 | 26.0% |
| Satellite Internet | 15 | 3.4% |
| No Internet | 40 | 9.1% |
| Total | 439 | 100.0% |
Faith Summary
Faith, North Carolina is a small town located in the heart of North Carolina’s Piedmont region. It is situated in the foothills of the Blue Ridge Mountains, and is part of the larger Winston-Salem metropolitan area. The town has a population of approximately 1,500 people, and is known for its rural charm and close-knit community.
Geography
Faith is located in the Piedmont region of North Carolina, which is characterized by rolling hills and valleys. The town is situated in the foothills of the Blue Ridge Mountains, and is surrounded by the Yadkin River and its tributaries. The town is located approximately 30 miles north of Winston-Salem, and is accessible via US Highway 421.
Economy
The economy of Faith is largely based on agriculture and manufacturing. The town is home to several small businesses, including a feed mill, a sawmill, and a furniture factory. The town also has a number of retail stores, including a grocery store, a hardware store, and a pharmacy.
Demographics
As of the 2010 census, the population of Faith was 1,500. The racial makeup of the town was 95.2% White, 2.7% African American, 0.2% Native American, 0.2% Asian, 0.2% from other races, and 1.7% from two or more races. The median household income was $35,000, and the median family income was $41,000.
History
The town of Faith was founded in 1845 by a group of settlers from Pennsylvania. The town was named after the faith of the settlers, who were members of the German Reformed Church. The town grew slowly over the years, and by the early 1900s, it had become a thriving agricultural community. The town was also home to several small businesses, including a sawmill, a feed mill, and a furniture factory.
In the late 20th century, the town began to experience a decline in population as many of its residents moved away in search of better economic opportunities. However, the town has seen a resurgence in recent years, as many of its former residents have returned to the area. Today, Faith is a vibrant community with a strong sense of community and a commitment to preserving its rural charm.
Common Questions
What is Per Capita Income in Faith?
Per Capita income in Faith is $47,933.
What is the Median Family Income in Faith?
Median Family Income in Faith is $172,656.
What is the Median Household income in Faith?
Median Household Income in Faith is $123,456.
What is Income or Wage Gap in Faith?
Income or Wage Gap in Faith is 38.4%.
Women in Faith earn 61.6 cents for every dollar earned by a man.
What is Inequality or Gini Index in Faith?
Inequality or Gini Index in Faith is 0.32.
What is the Total Population of Faith?
Total Population of Faith is 1,096.
What is the Total Male Population of Faith?
Total Male Population of Faith is 604.
What is the Total Female Population of Faith?
Total Female Population of Faith is 492.
What is the Ratio of Males per 100 Females in Faith?
There are 122.76 Males per 100 Females in Faith.
What is the Ratio of Females per 100 Males in Faith?
There are 81.46 Females per 100 Males in Faith.
What is the Median Population Age in Faith?
Median Population Age in Faith is 41.8 Years.
What is the Average Family Size in Faith
Average Family Size in Faith is 2.9 People.
What is the Average Household Size in Faith
Average Household Size in Faith is 2.5 People.
How Large is the Labor Force in Faith?
There are 678 People in the Labor Forcein in Faith.
What is the Percentage of People in the Labor Force in Faith?
78.6% of People are in the Labor Force in Faith.