Zip Codes with the Highest Percentage of Families with Income Above $100,000 in North Carolina
RELATED REPORTS & OPTIONS
Family Income | $100k+
North Carolina
Compare Zip Codes
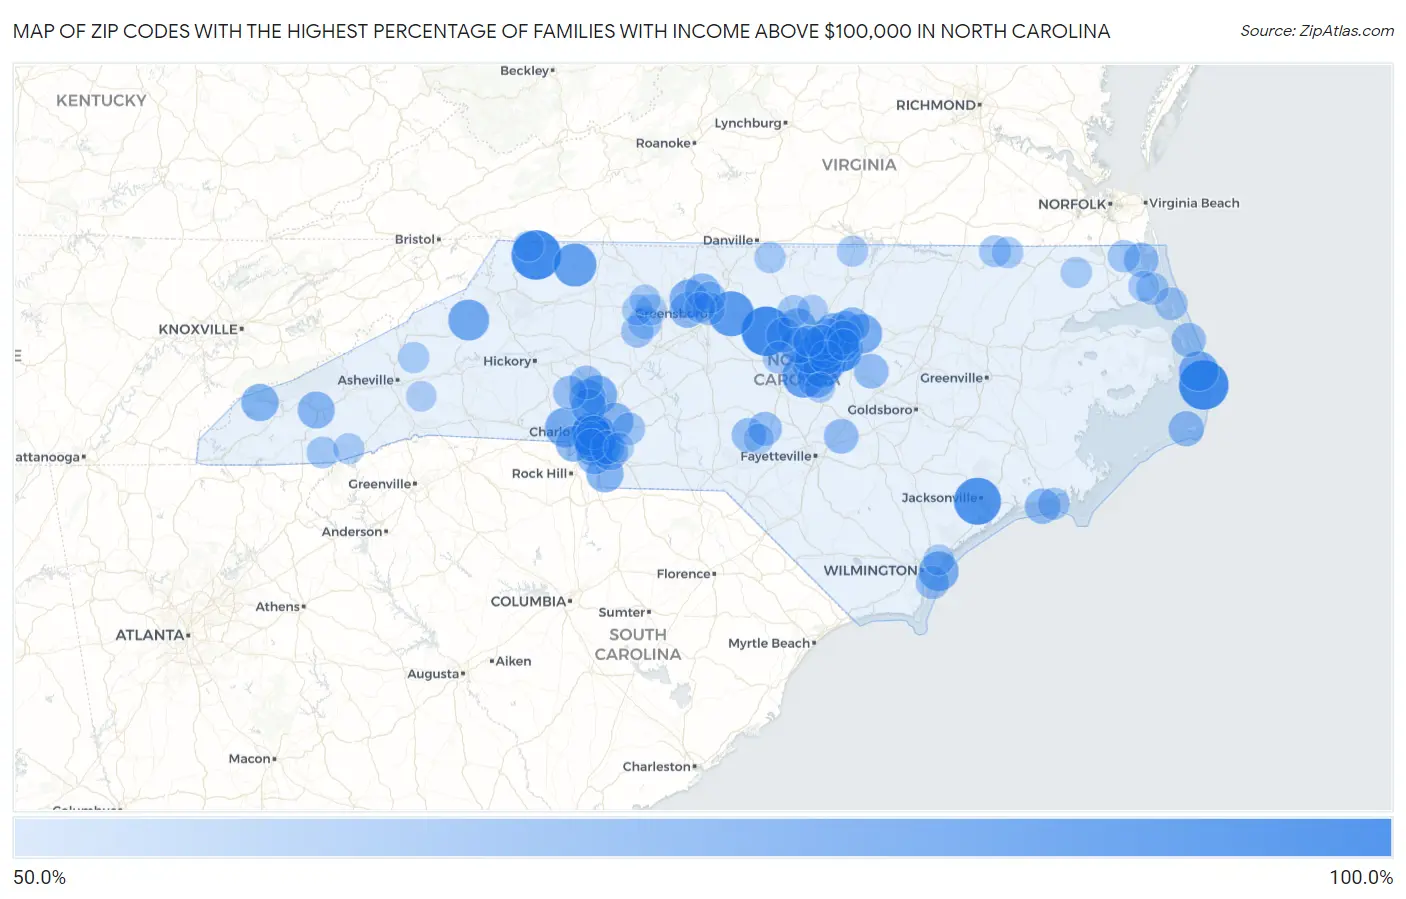
Map of Zip Codes with the Highest Percentage of Families with Income Above $100,000 in North Carolina
50.0%
100.0%
Zip Codes with the Highest Percentage of Families with Income Above $100,000 in North Carolina
| Zip Code | Families with Income > $100k | vs State | vs National | |
| 1. | 28672 | 100.0% | 40.4%(+59.6)#1 | 46.1%(+53.9)#65 |
| 2. | 27982 | 100.0% | 40.4%(+59.6)#2 | 46.1%(+53.9)#100 |
| 3. | 27340 | 100.0% | 40.4%(+59.6)#3 | 46.1%(+53.9)#207 |
| 4. | 28542 | 94.0% | 40.4%(+53.6)#4 | 46.1%(+47.9)#298 |
| 5. | 27342 | 89.3% | 40.4%(+48.9)#5 | 46.1%(+43.2)#386 |
| 6. | 28207 | 87.8% | 40.4%(+47.4)#6 | 46.1%(+41.7)#437 |
| 7. | 28668 | 84.2% | 40.4%(+43.8)#7 | 46.1%(+38.1)#655 |
| 8. | 27562 | 84.1% | 40.4%(+43.7)#8 | 46.1%(+38.0)#662 |
| 9. | 27608 | 84.0% | 40.4%(+43.6)#9 | 46.1%(+37.9)#669 |
| 10. | 28616 | 79.2% | 40.4%(+38.8)#10 | 46.1%(+33.1)#1,123 |
| 11. | 27519 | 76.8% | 40.4%(+36.4)#11 | 46.1%(+30.7)#1,425 |
| 12. | 27968 | 76.7% | 40.4%(+36.3)#12 | 46.1%(+30.6)#1,464 |
| 13. | 28101 | 76.6% | 40.4%(+36.2)#13 | 46.1%(+30.5)#1,472 |
| 14. | 28480 | 76.3% | 40.4%(+35.9)#14 | 46.1%(+30.2)#1,512 |
| 15. | 28036 | 75.5% | 40.4%(+35.1)#15 | 46.1%(+29.4)#1,620 |
| 16. | 27571 | 75.3% | 40.4%(+34.9)#16 | 46.1%(+29.2)#1,665 |
| 17. | 28203 | 74.3% | 40.4%(+33.9)#17 | 46.1%(+28.2)#1,820 |
| 18. | 27605 | 74.1% | 40.4%(+33.7)#18 | 46.1%(+28.0)#1,863 |
| 19. | 27502 | 73.8% | 40.4%(+33.4)#19 | 46.1%(+27.7)#1,903 |
| 20. | 27613 | 73.2% | 40.4%(+32.8)#20 | 46.1%(+27.1)#2,002 |
| 21. | 27540 | 73.1% | 40.4%(+32.7)#21 | 46.1%(+27.0)#2,017 |
| 22. | 27518 | 72.9% | 40.4%(+32.5)#22 | 46.1%(+26.8)#2,056 |
| 23. | 27310 | 72.9% | 40.4%(+32.5)#23 | 46.1%(+26.8)#2,060 |
| 24. | 27539 | 72.6% | 40.4%(+32.2)#24 | 46.1%(+26.5)#2,115 |
| 25. | 27514 | 72.5% | 40.4%(+32.1)#25 | 46.1%(+26.4)#2,133 |
| 26. | 28202 | 72.4% | 40.4%(+32.0)#26 | 46.1%(+26.3)#2,157 |
| 27. | 27614 | 71.7% | 40.4%(+31.3)#27 | 46.1%(+25.6)#2,273 |
| 28. | 28173 | 70.7% | 40.4%(+30.3)#28 | 46.1%(+24.6)#2,453 |
| 29. | 28733 | 70.6% | 40.4%(+30.2)#29 | 46.1%(+24.5)#2,499 |
| 30. | 28226 | 70.3% | 40.4%(+29.9)#30 | 46.1%(+24.2)#2,536 |
| 31. | 28211 | 70.3% | 40.4%(+29.9)#31 | 46.1%(+24.2)#2,538 |
| 32. | 27523 | 70.3% | 40.4%(+29.9)#32 | 46.1%(+24.2)#2,543 |
| 33. | 27517 | 70.0% | 40.4%(+29.6)#33 | 46.1%(+23.9)#2,594 |
| 34. | 28725 | 70.0% | 40.4%(+29.6)#34 | 46.1%(+23.9)#2,608 |
| 35. | 28270 | 69.9% | 40.4%(+29.5)#35 | 46.1%(+23.8)#2,618 |
| 36. | 28075 | 69.8% | 40.4%(+29.4)#36 | 46.1%(+23.7)#2,642 |
| 37. | 27607 | 69.5% | 40.4%(+29.1)#37 | 46.1%(+23.4)#2,714 |
| 38. | 28031 | 68.8% | 40.4%(+28.4)#38 | 46.1%(+22.7)#2,853 |
| 39. | 28277 | 68.3% | 40.4%(+27.9)#39 | 46.1%(+22.2)#2,952 |
| 40. | 27513 | 67.7% | 40.4%(+27.3)#40 | 46.1%(+21.6)#3,084 |
| 41. | 27612 | 67.7% | 40.4%(+27.3)#41 | 46.1%(+21.6)#3,087 |
| 42. | 27617 | 67.6% | 40.4%(+27.2)#42 | 46.1%(+21.5)#3,120 |
| 43. | 28278 | 67.4% | 40.4%(+27.0)#43 | 46.1%(+21.3)#3,160 |
| 44. | 27235 | 67.1% | 40.4%(+26.7)#44 | 46.1%(+21.0)#3,230 |
| 45. | 28104 | 66.8% | 40.4%(+26.4)#45 | 46.1%(+20.7)#3,281 |
| 46. | 27358 | 66.8% | 40.4%(+26.4)#46 | 46.1%(+20.7)#3,285 |
| 47. | 27560 | 66.4% | 40.4%(+26.0)#47 | 46.1%(+20.3)#3,384 |
| 48. | 28575 | 66.1% | 40.4%(+25.7)#48 | 46.1%(+20.0)#3,485 |
| 49. | 27587 | 65.9% | 40.4%(+25.5)#49 | 46.1%(+19.8)#3,511 |
| 50. | 27936 | 65.8% | 40.4%(+25.4)#50 | 46.1%(+19.7)#3,546 |
| 51. | 28078 | 65.3% | 40.4%(+24.9)#51 | 46.1%(+19.2)#3,654 |
| 52. | 27516 | 65.3% | 40.4%(+24.9)#52 | 46.1%(+19.2)#3,657 |
| 53. | 28342 | 64.7% | 40.4%(+24.3)#53 | 46.1%(+18.6)#3,839 |
| 54. | 27527 | 64.6% | 40.4%(+24.2)#54 | 46.1%(+18.5)#3,846 |
| 55. | 27929 | 64.2% | 40.4%(+23.8)#55 | 46.1%(+18.1)#3,959 |
| 56. | 28209 | 63.8% | 40.4%(+23.4)#56 | 46.1%(+17.7)#4,065 |
| 57. | 27959 | 63.7% | 40.4%(+23.3)#57 | 46.1%(+17.6)#4,103 |
| 58. | 28374 | 63.5% | 40.4%(+23.1)#58 | 46.1%(+17.4)#4,141 |
| 59. | 27615 | 63.1% | 40.4%(+22.7)#59 | 46.1%(+17.0)#4,248 |
| 60. | 27511 | 63.1% | 40.4%(+22.7)#60 | 46.1%(+17.0)#4,251 |
| 61. | 28350 | 62.7% | 40.4%(+22.3)#61 | 46.1%(+16.6)#4,374 |
| 62. | 28204 | 62.5% | 40.4%(+22.1)#62 | 46.1%(+16.4)#4,419 |
| 63. | 28117 | 62.3% | 40.4%(+21.9)#63 | 46.1%(+16.2)#4,463 |
| 64. | 28105 | 62.3% | 40.4%(+21.9)#64 | 46.1%(+16.2)#4,464 |
| 65. | 28037 | 62.3% | 40.4%(+21.9)#65 | 46.1%(+16.2)#4,468 |
| 66. | 28409 | 61.4% | 40.4%(+21.0)#66 | 46.1%(+15.3)#4,716 |
| 67. | 27012 | 60.6% | 40.4%(+20.2)#67 | 46.1%(+14.5)#4,967 |
| 68. | 27408 | 60.2% | 40.4%(+19.8)#68 | 46.1%(+14.1)#5,073 |
| 69. | 27949 | 60.2% | 40.4%(+19.8)#69 | 46.1%(+14.1)#5,076 |
| 70. | 28107 | 59.6% | 40.4%(+19.2)#70 | 46.1%(+13.5)#5,259 |
| 71. | 27006 | 59.5% | 40.4%(+19.1)#71 | 46.1%(+13.4)#5,295 |
| 72. | 28210 | 59.4% | 40.4%(+19.0)#72 | 46.1%(+13.3)#5,313 |
| 73. | 27965 | 59.3% | 40.4%(+18.9)#73 | 46.1%(+13.2)#5,372 |
| 74. | 27958 | 59.2% | 40.4%(+18.8)#74 | 46.1%(+13.1)#5,390 |
| 75. | 27278 | 58.5% | 40.4%(+18.1)#75 | 46.1%(+12.4)#5,606 |
| 76. | 27312 | 58.5% | 40.4%(+18.1)#76 | 46.1%(+12.4)#5,608 |
| 77. | 28512 | 58.5% | 40.4%(+18.1)#77 | 46.1%(+12.4)#5,624 |
| 78. | 27455 | 58.1% | 40.4%(+17.7)#78 | 46.1%(+12.0)#5,727 |
| 79. | 27609 | 57.9% | 40.4%(+17.5)#79 | 46.1%(+11.8)#5,792 |
| 80. | 27853 | 57.8% | 40.4%(+17.4)#80 | 46.1%(+11.7)#5,863 |
| 81. | 28741 | 57.5% | 40.4%(+17.1)#81 | 46.1%(+11.4)#5,956 |
| 82. | 27862 | 57.4% | 40.4%(+17.0)#82 | 46.1%(+11.3)#5,997 |
| 83. | 27713 | 57.2% | 40.4%(+16.8)#83 | 46.1%(+11.1)#6,023 |
| 84. | 27212 | 56.7% | 40.4%(+16.3)#84 | 46.1%(+10.6)#6,199 |
| 85. | 27946 | 56.4% | 40.4%(+16.0)#85 | 46.1%(+10.3)#6,292 |
| 86. | 28774 | 56.3% | 40.4%(+15.9)#86 | 46.1%(+10.2)#6,338 |
| 87. | 27104 | 56.2% | 40.4%(+15.8)#87 | 46.1%(+10.1)#6,362 |
| 88. | 28411 | 56.0% | 40.4%(+15.6)#88 | 46.1%(+9.90)#6,423 |
| 89. | 28709 | 56.0% | 40.4%(+15.6)#89 | 46.1%(+9.90)#6,447 |
| 90. | 27507 | 55.9% | 40.4%(+15.5)#90 | 46.1%(+9.80)#6,488 |
| 91. | 27410 | 55.8% | 40.4%(+15.4)#91 | 46.1%(+9.70)#6,502 |
| 92. | 27023 | 55.7% | 40.4%(+15.3)#92 | 46.1%(+9.60)#6,549 |
| 93. | 27040 | 55.7% | 40.4%(+15.3)#93 | 46.1%(+9.60)#6,551 |
| 94. | 27974 | 55.7% | 40.4%(+15.3)#94 | 46.1%(+9.60)#6,569 |
| 95. | 28631 | 55.3% | 40.4%(+14.9)#95 | 46.1%(+9.20)#6,709 |
| 96. | 28387 | 54.8% | 40.4%(+14.4)#96 | 46.1%(+8.70)#6,878 |
| 97. | 28735 | 54.7% | 40.4%(+14.3)#97 | 46.1%(+8.60)#6,929 |
| 98. | 27526 | 54.6% | 40.4%(+14.2)#98 | 46.1%(+8.50)#6,932 |
| 99. | 28079 | 54.3% | 40.4%(+13.9)#99 | 46.1%(+8.20)#7,048 |
| 100. | 27712 | 54.3% | 40.4%(+13.9)#100 | 46.1%(+8.20)#7,059 |
Common Questions
What are the Top 10 Zip Codes with the Highest Percentage of Families with Income Above $100,000 in North Carolina?
Top 10 Zip Codes with the Highest Percentage of Families with Income Above $100,000 in North Carolina are:
What zip code has the Highest Percentage of Families with Income Above $100,000 in North Carolina?
28672 has the Highest Percentage of Families with Income Above $100,000 in North Carolina with 100.0%.
What is the Percentage of Families with Income Above $100,000 in the State of North Carolina?
Percentage of Families with Income Above $100,000 in North Carolina is 40.4%.
What is the Percentage of Families with Income Above $100,000 in the United States?
Percentage of Families with Income Above $100,000 in the United States is 46.1%.