Cornelius, NC Map & Demographics
Cornelius Map
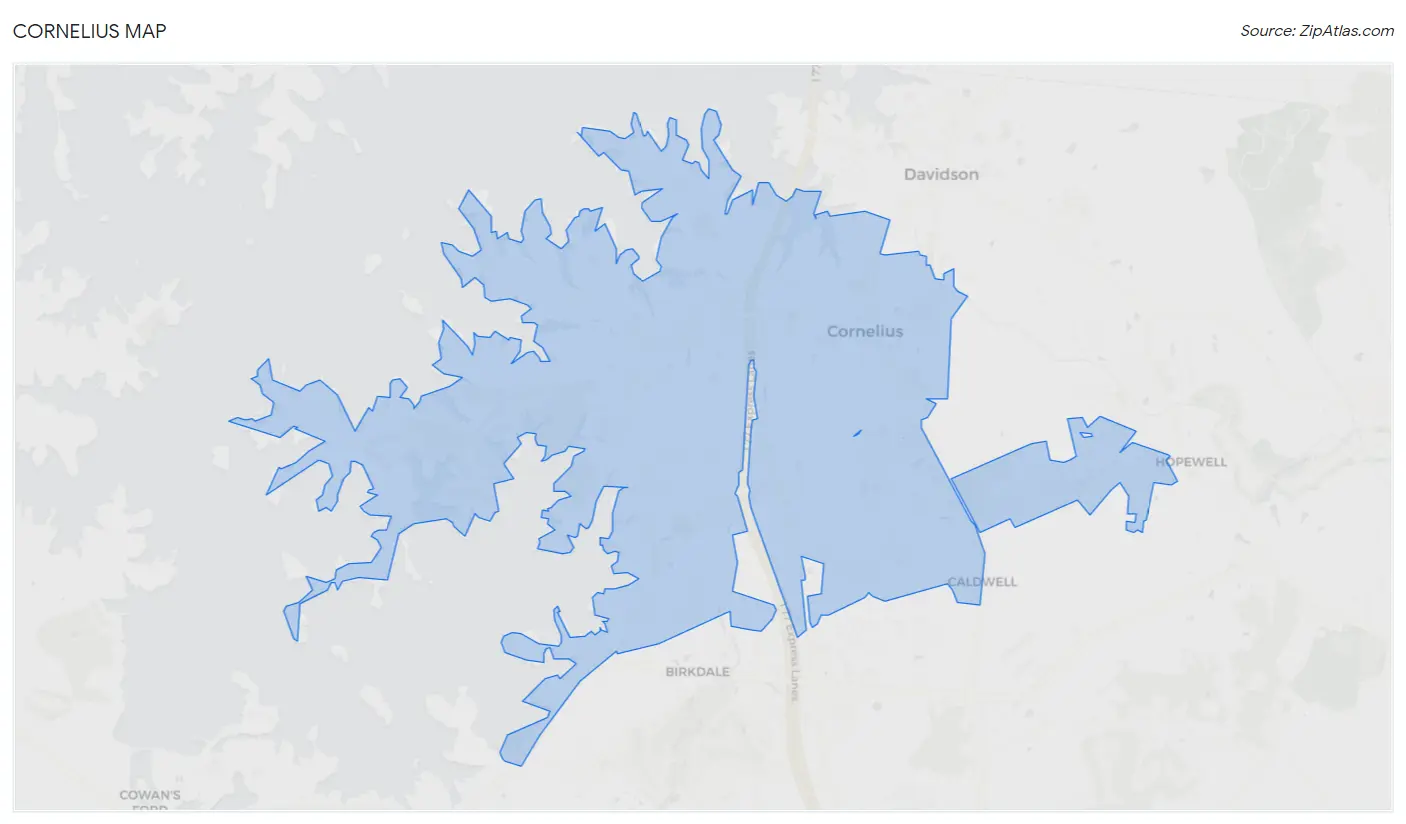
Cornelius Overview
$75,101
PER CAPITA INCOME
$151,619
AVG FAMILY INCOME
$107,969
AVG HOUSEHOLD INCOME
45.4%
WAGE / INCOME GAP [ % ]
54.6¢/ $1
WAGE / INCOME GAP [ $ ]
$7,596
FAMILY INCOME DEFICIT
0.52
INEQUALITY / GINI INDEX
31,396
TOTAL POPULATION
14,793
MALE POPULATION
16,603
FEMALE POPULATION
89.10
MALES / 100 FEMALES
112.24
FEMALES / 100 MALES
44.3
MEDIAN AGE
2.9
AVG FAMILY SIZE
2.4
AVG HOUSEHOLD SIZE
16,684
LABOR FORCE [ PEOPLE ]
65.5%
PERCENT IN LABOR FORCE
3.4%
UNEMPLOYMENT RATE
Cornelius Zip Codes
Cornelius Area Codes
Income in Cornelius
Income Overview in Cornelius
Per Capita Income in Cornelius is $75,101, while median incomes of families and households are $151,619 and $107,969 respectively.
| Characteristic | Number | Measure |
| Per Capita Income | 31,396 | $75,101 |
| Median Family Income | 8,859 | $151,619 |
| Mean Family Income | 8,859 | $212,054 |
| Median Household Income | 13,352 | $107,969 |
| Mean Household Income | 13,352 | $173,729 |
| Income Deficit | 8,859 | $7,596 |
| Wage / Income Gap (%) | 31,396 | 45.37% |
| Wage / Income Gap ($) | 31,396 | 54.63¢ per $1 |
| Gini / Inequality Index | 31,396 | 0.52 |
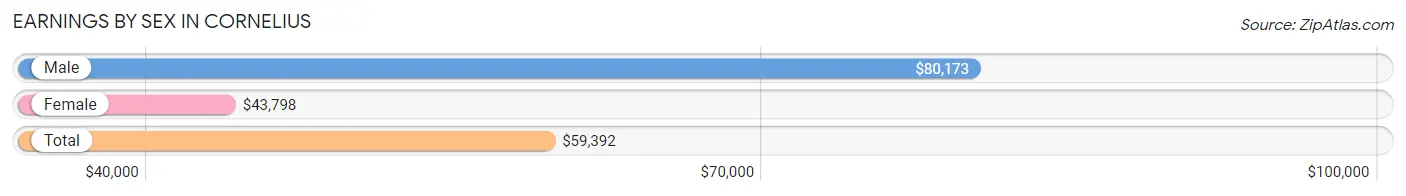
Earnings by Sex in Cornelius
Average Earnings in Cornelius are $59,392, $80,173 for men and $43,798 for women, a difference of 45.4%.
| Sex | Number | Average Earnings |
| Male | 9,145 (52.2%) | $80,173 |
| Female | 8,379 (47.8%) | $43,798 |
| Total | 17,524 (100.0%) | $59,392 |
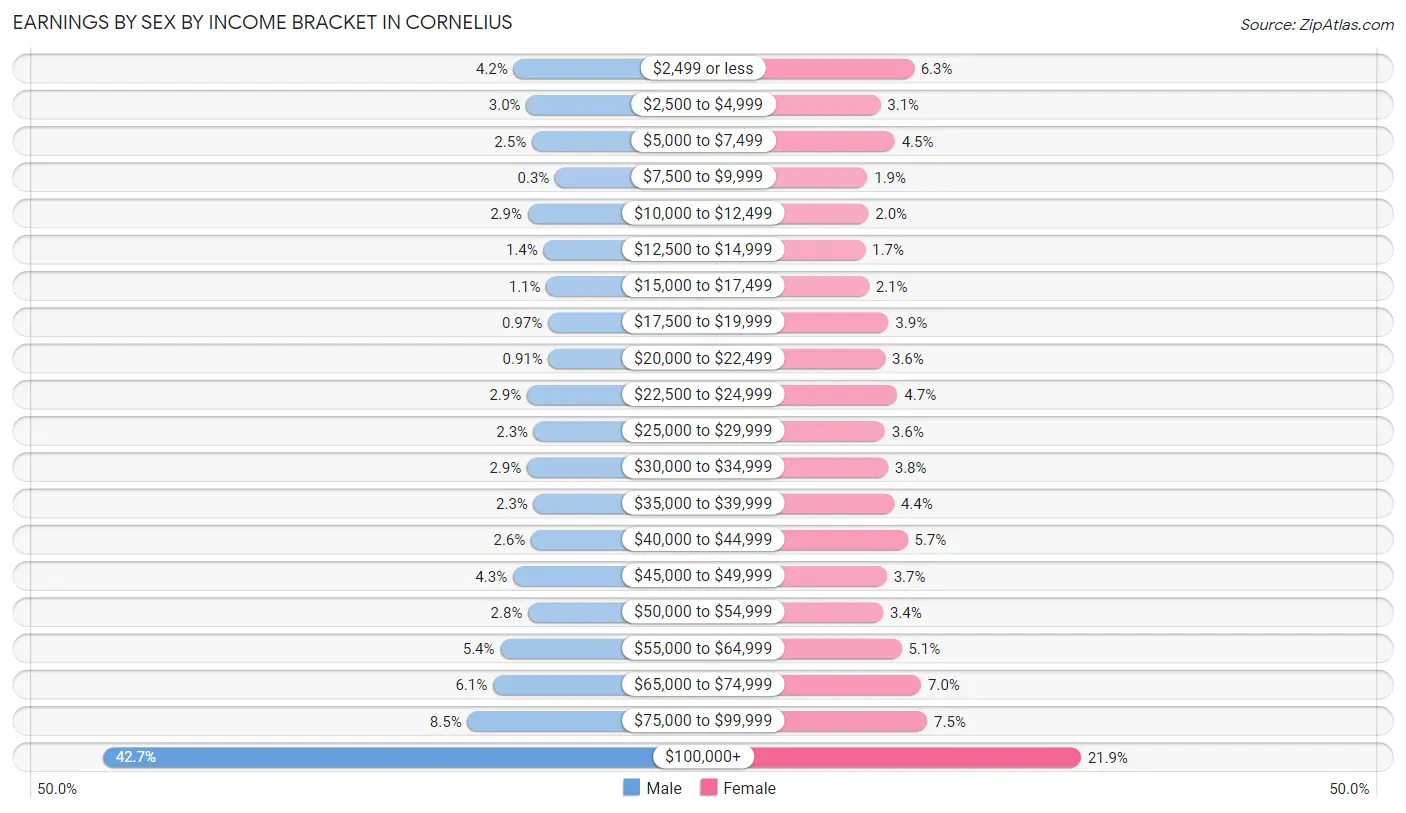
Earnings by Sex by Income Bracket in Cornelius
The most common earnings brackets in Cornelius are $100,000+ for men (3,903 | 42.7%) and $100,000+ for women (1,836 | 21.9%).
| Income | Male | Female |
| $2,499 or less | 383 (4.2%) | 525 (6.3%) |
| $2,500 to $4,999 | 273 (3.0%) | 263 (3.1%) |
| $5,000 to $7,499 | 226 (2.5%) | 376 (4.5%) |
| $7,500 to $9,999 | 27 (0.3%) | 161 (1.9%) |
| $10,000 to $12,499 | 262 (2.9%) | 169 (2.0%) |
| $12,500 to $14,999 | 126 (1.4%) | 144 (1.7%) |
| $15,000 to $17,499 | 102 (1.1%) | 173 (2.1%) |
| $17,500 to $19,999 | 89 (1.0%) | 327 (3.9%) |
| $20,000 to $22,499 | 83 (0.9%) | 300 (3.6%) |
| $22,500 to $24,999 | 268 (2.9%) | 397 (4.7%) |
| $25,000 to $29,999 | 209 (2.3%) | 299 (3.6%) |
| $30,000 to $34,999 | 268 (2.9%) | 322 (3.8%) |
| $35,000 to $39,999 | 211 (2.3%) | 370 (4.4%) |
| $40,000 to $44,999 | 233 (2.5%) | 477 (5.7%) |
| $45,000 to $49,999 | 389 (4.3%) | 313 (3.7%) |
| $50,000 to $54,999 | 258 (2.8%) | 284 (3.4%) |
| $55,000 to $64,999 | 497 (5.4%) | 429 (5.1%) |
| $65,000 to $74,999 | 560 (6.1%) | 583 (7.0%) |
| $75,000 to $99,999 | 778 (8.5%) | 631 (7.5%) |
| $100,000+ | 3,903 (42.7%) | 1,836 (21.9%) |
| Total | 9,145 (100.0%) | 8,379 (100.0%) |
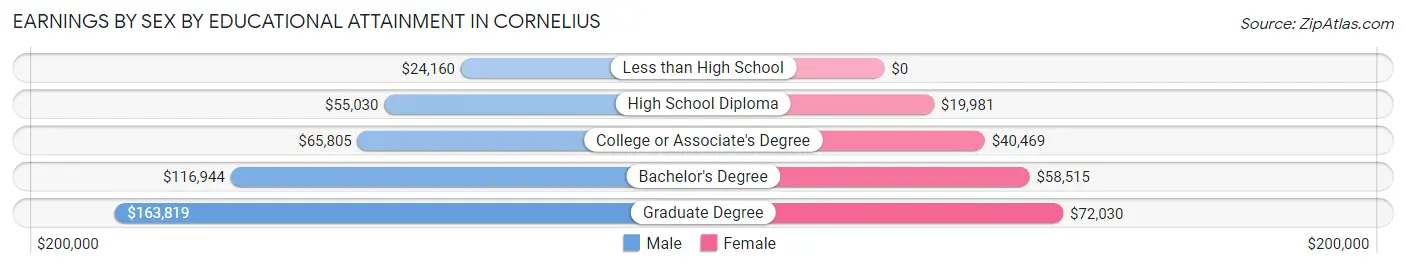
Earnings by Sex by Educational Attainment in Cornelius
Average earnings in Cornelius are $93,494 for men and $50,591 for women, a difference of 45.9%. Men with an educational attainment of graduate degree enjoy the highest average annual earnings of $163,819, while those with less than high school education earn the least with $24,160. Women with an educational attainment of graduate degree earn the most with the average annual earnings of $72,030, while those with high school diploma education have the smallest earnings of $19,981.
| Educational Attainment | Male Income | Female Income |
| Less than High School | $24,160 | $0 |
| High School Diploma | $55,030 | $19,981 |
| College or Associate's Degree | $65,805 | $40,469 |
| Bachelor's Degree | $116,944 | $58,515 |
| Graduate Degree | $163,819 | $72,030 |
| Total | $93,494 | $50,591 |
Family Income in Cornelius
Family Income Brackets in Cornelius
According to the Cornelius family income data, there are 2,968 families falling into the $200,000+ income range, which is the most common income bracket and makes up 33.5% of all families. Conversely, the $10,000 to $14,999 income bracket is the least frequent group with only 9 families (0.1%) belonging to this category.
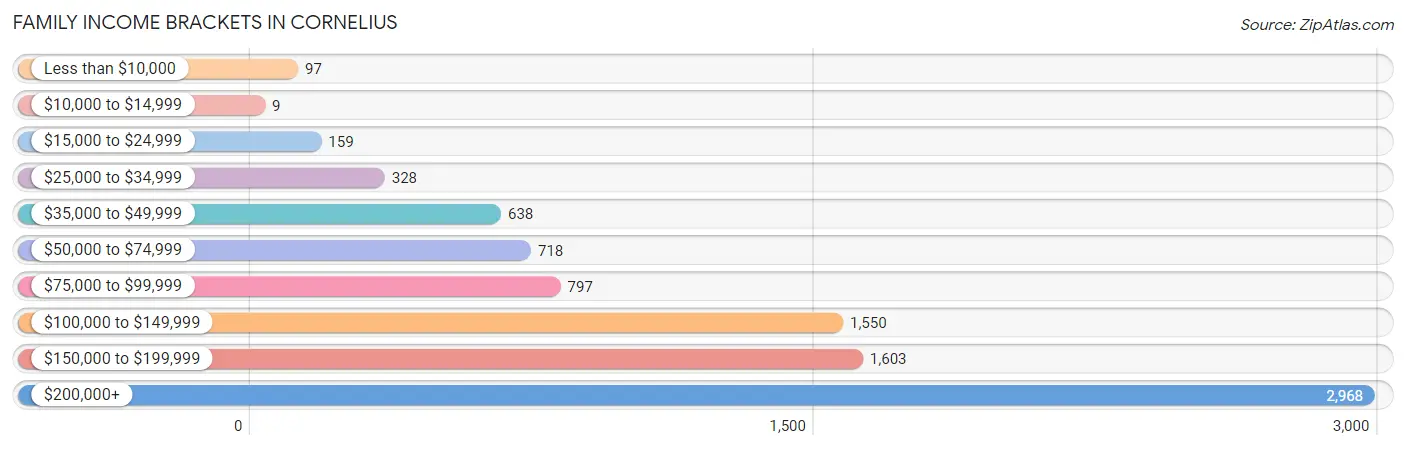
| Income Bracket | # Families | % Families |
| Less than $10,000 | 97 | 1.1% |
| $10,000 to $14,999 | 9 | 0.1% |
| $15,000 to $24,999 | 159 | 1.8% |
| $25,000 to $34,999 | 328 | 3.7% |
| $35,000 to $49,999 | 638 | 7.2% |
| $50,000 to $74,999 | 718 | 8.1% |
| $75,000 to $99,999 | 797 | 9.0% |
| $100,000 to $149,999 | 1,550 | 17.5% |
| $150,000 to $199,999 | 1,603 | 18.1% |
| $200,000+ | 2,968 | 33.5% |
Family Income by Famaliy Size in Cornelius
4-person families (1,624 | 18.3%) account for the highest median family income in Cornelius with $213,333 per family, while 2-person families (4,670 | 52.7%) have the highest median income of $68,026 per family member.
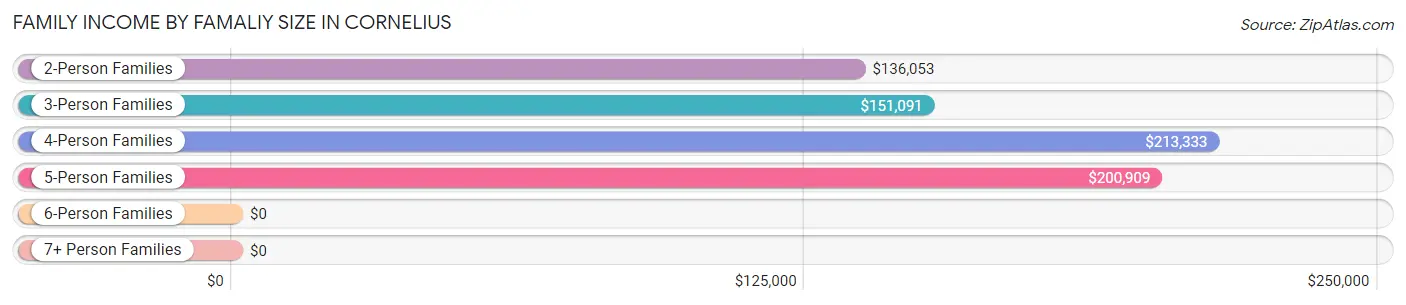
| Income Bracket | # Families | Median Income |
| 2-Person Families | 4,670 (52.7%) | $136,053 |
| 3-Person Families | 1,853 (20.9%) | $151,091 |
| 4-Person Families | 1,624 (18.3%) | $213,333 |
| 5-Person Families | 550 (6.2%) | $200,909 |
| 6-Person Families | 162 (1.8%) | $0 |
| 7+ Person Families | 0 (0.0%) | $0 |
| Total | 8,859 (100.0%) | $151,619 |
Family Income by Number of Earners in Cornelius
The median family income in Cornelius is $151,619, with families comprising 3+ earners (757) having the highest median family income of $198,281, while families with no earners (1,460) have the lowest median family income of $84,722, accounting for 8.5% and 16.5% of families, respectively.
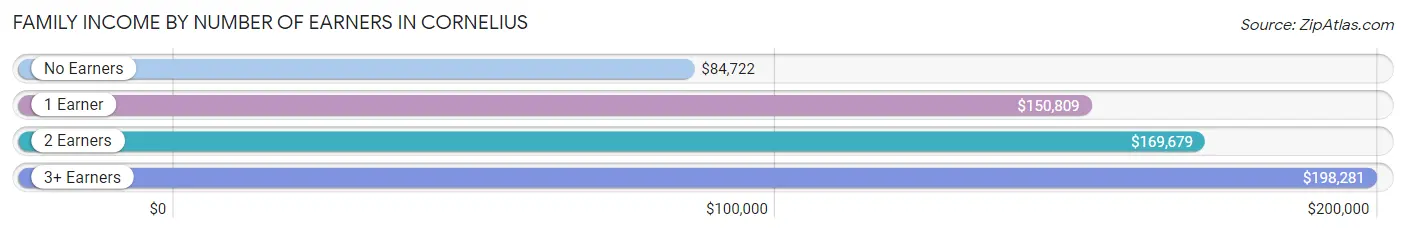
| Number of Earners | # Families | Median Income |
| No Earners | 1,460 (16.5%) | $84,722 |
| 1 Earner | 2,781 (31.4%) | $150,809 |
| 2 Earners | 3,861 (43.6%) | $169,679 |
| 3+ Earners | 757 (8.5%) | $198,281 |
| Total | 8,859 (100.0%) | $151,619 |
Household Income in Cornelius
Household Income Brackets in Cornelius
With 3,338 households falling in the category, the $200,000+ income range is the most frequent in Cornelius, accounting for 25.0% of all households. In contrast, only 134 households (1.0%) fall into the $10,000 to $14,999 income bracket, making it the least populous group.
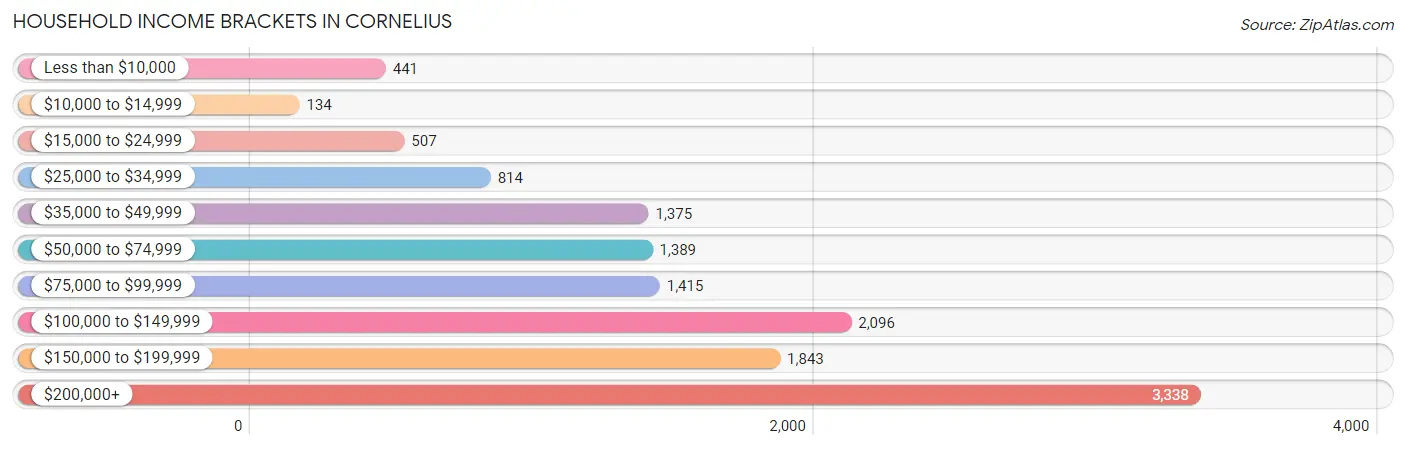
| Income Bracket | # Households | % Households |
| Less than $10,000 | 441 | 3.3% |
| $10,000 to $14,999 | 134 | 1.0% |
| $15,000 to $24,999 | 507 | 3.8% |
| $25,000 to $34,999 | 814 | 6.1% |
| $35,000 to $49,999 | 1,375 | 10.3% |
| $50,000 to $74,999 | 1,389 | 10.4% |
| $75,000 to $99,999 | 1,415 | 10.6% |
| $100,000 to $149,999 | 2,096 | 15.7% |
| $150,000 to $199,999 | 1,843 | 13.8% |
| $200,000+ | 3,338 | 25.0% |
Household Income by Householder Age in Cornelius
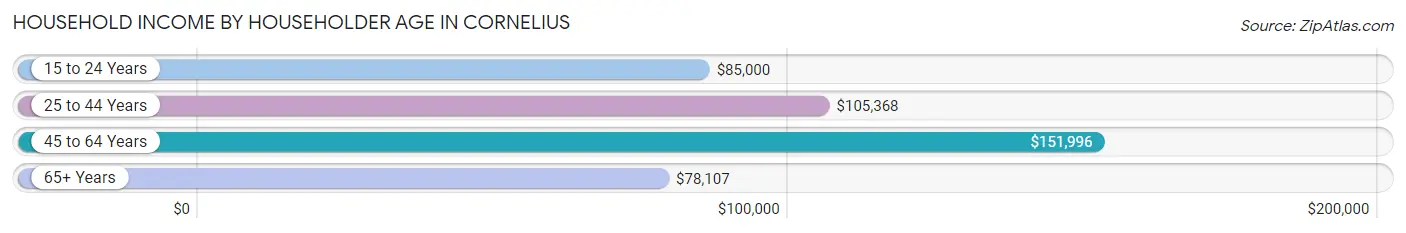
The median household income in Cornelius is $107,969, with the highest median household income of $151,996 found in the 45 to 64 years age bracket for the primary householder. A total of 5,788 households (43.3%) fall into this category. Meanwhile, the 65+ years age bracket for the primary householder has the lowest median household income of $78,107, with 3,597 households (26.9%) in this group.
| Income Bracket | # Households | Median Income |
| 15 to 24 Years | 340 (2.5%) | $85,000 |
| 25 to 44 Years | 3,627 (27.2%) | $105,368 |
| 45 to 64 Years | 5,788 (43.3%) | $151,996 |
| 65+ Years | 3,597 (26.9%) | $78,107 |
| Total | 13,352 (100.0%) | $107,969 |
Poverty in Cornelius
Income Below Poverty by Sex and Age in Cornelius
With 3.8% poverty level for males and 6.4% for females among the residents of Cornelius, 5 year old males and 5 year old females are the most vulnerable to poverty, with 34 males (37.4%) and 52 females (18.7%) in their respective age groups living below the poverty level.
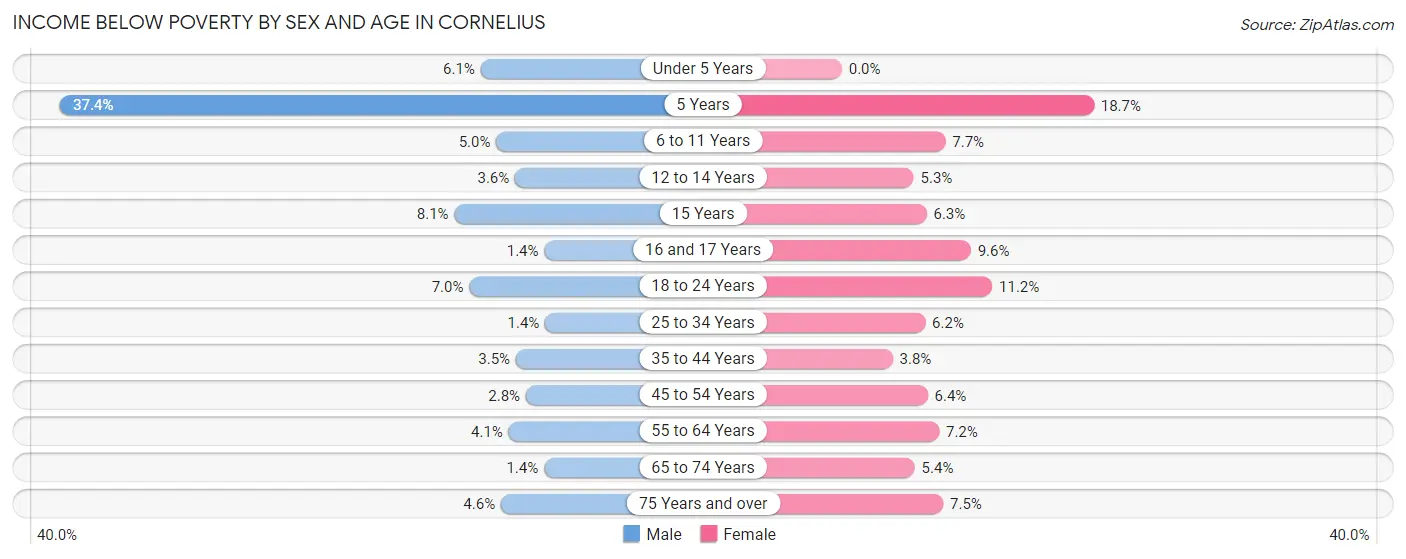
| Age Bracket | Male | Female |
| Under 5 Years | 35 (6.1%) | 0 (0.0%) |
| 5 Years | 34 (37.4%) | 52 (18.7%) |
| 6 to 11 Years | 55 (5.0%) | 82 (7.7%) |
| 12 to 14 Years | 24 (3.6%) | 45 (5.3%) |
| 15 Years | 22 (8.1%) | 22 (6.3%) |
| 16 and 17 Years | 7 (1.4%) | 44 (9.6%) |
| 18 to 24 Years | 75 (7.0%) | 100 (11.2%) |
| 25 to 34 Years | 22 (1.3%) | 90 (6.2%) |
| 35 to 44 Years | 61 (3.5%) | 91 (3.8%) |
| 45 to 54 Years | 70 (2.8%) | 150 (6.4%) |
| 55 to 64 Years | 84 (4.1%) | 180 (7.2%) |
| 65 to 74 Years | 22 (1.4%) | 111 (5.4%) |
| 75 Years and over | 47 (4.6%) | 96 (7.5%) |
| Total | 558 (3.8%) | 1,063 (6.4%) |
Income Above Poverty by Sex and Age in Cornelius
According to the poverty statistics in Cornelius, males aged 25 to 34 years and females aged under 5 years are the age groups that are most secure financially, with 98.7% of males and 100.0% of females in these age groups living above the poverty line.
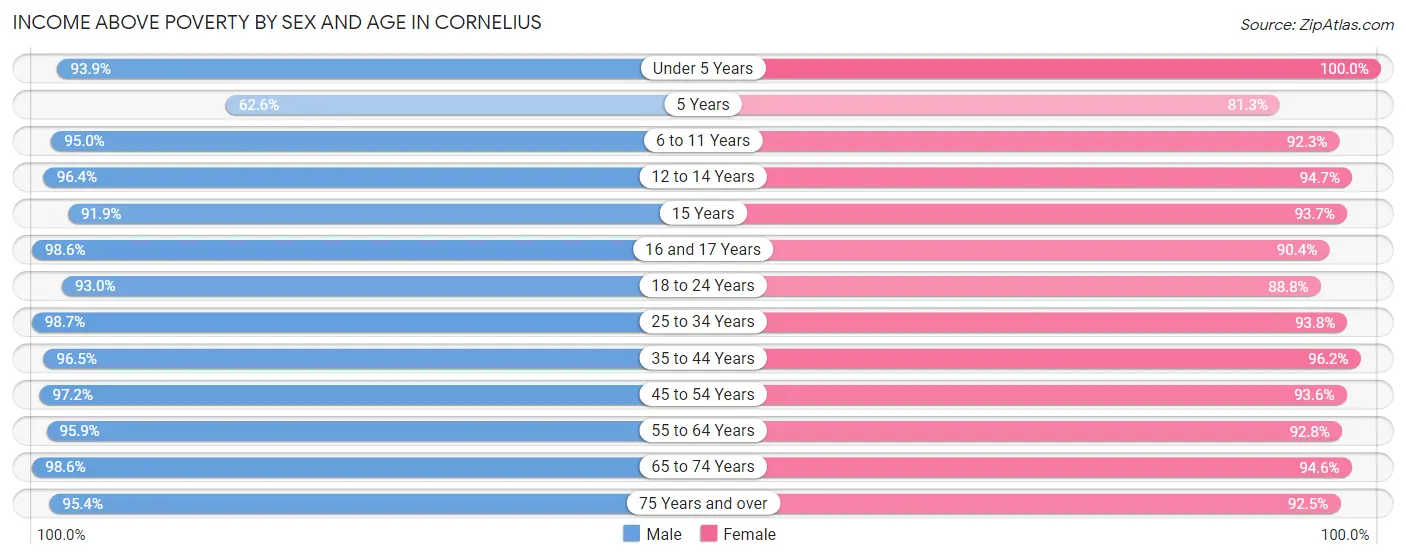
| Age Bracket | Male | Female |
| Under 5 Years | 535 (93.9%) | 667 (100.0%) |
| 5 Years | 57 (62.6%) | 226 (81.3%) |
| 6 to 11 Years | 1,050 (95.0%) | 985 (92.3%) |
| 12 to 14 Years | 647 (96.4%) | 799 (94.7%) |
| 15 Years | 250 (91.9%) | 328 (93.7%) |
| 16 and 17 Years | 491 (98.6%) | 416 (90.4%) |
| 18 to 24 Years | 999 (93.0%) | 796 (88.8%) |
| 25 to 34 Years | 1,609 (98.7%) | 1,364 (93.8%) |
| 35 to 44 Years | 1,672 (96.5%) | 2,320 (96.2%) |
| 45 to 54 Years | 2,450 (97.2%) | 2,204 (93.6%) |
| 55 to 64 Years | 1,984 (95.9%) | 2,313 (92.8%) |
| 65 to 74 Years | 1,513 (98.6%) | 1,941 (94.6%) |
| 75 Years and over | 968 (95.4%) | 1,181 (92.5%) |
| Total | 14,225 (96.2%) | 15,540 (93.6%) |
Income Below Poverty Among Married-Couple Families in Cornelius
The poverty statistics for married-couple families in Cornelius show that 1.6% or 120 of the total 7,508 families live below the poverty line. Families with 3 or 4 children have the highest poverty rate of 4.0%, comprising of 21 families. On the other hand, families with 1 or 2 children have the lowest poverty rate of 1.0%, which includes 23 families.
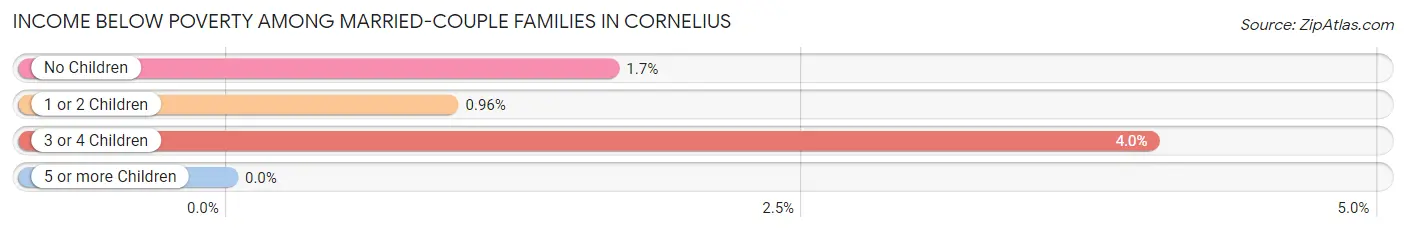
| Children | Above Poverty | Below Poverty |
| No Children | 4,500 (98.3%) | 76 (1.7%) |
| 1 or 2 Children | 2,385 (99.0%) | 23 (1.0%) |
| 3 or 4 Children | 503 (96.0%) | 21 (4.0%) |
| 5 or more Children | 0 (0.0%) | 0 (0.0%) |
| Total | 7,388 (98.4%) | 120 (1.6%) |
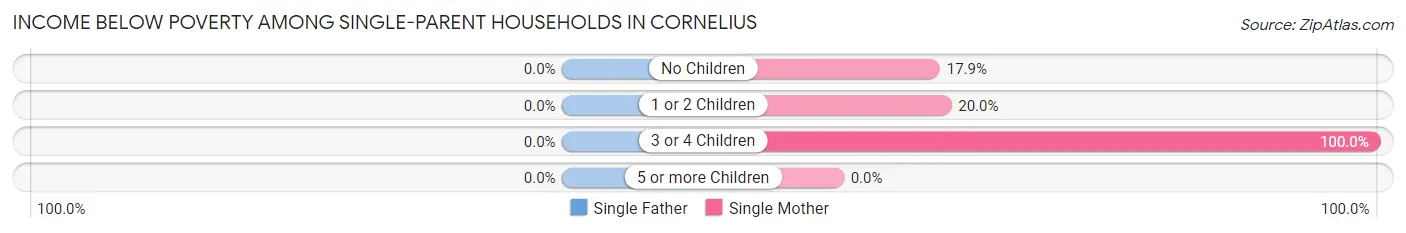
Income Below Poverty Among Single-Parent Households in Cornelius
| Children | Single Father | Single Mother |
| No Children | 0 (0.0%) | 75 (17.9%) |
| 1 or 2 Children | 0 (0.0%) | 109 (20.0%) |
| 3 or 4 Children | 0 (0.0%) | 23 (100.0%) |
| 5 or more Children | 0 (0.0%) | 0 (0.0%) |
| Total | 0 (0.0%) | 207 (21.0%) |
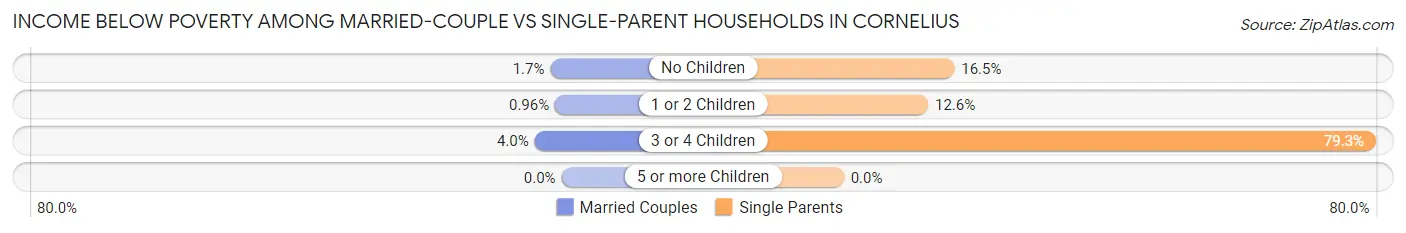
Income Below Poverty Among Married-Couple vs Single-Parent Households in Cornelius
The poverty data for Cornelius shows that 120 of the married-couple family households (1.6%) and 207 of the single-parent households (15.3%) are living below the poverty level. Within the married-couple family households, those with 3 or 4 children have the highest poverty rate, with 21 households (4.0%) falling below the poverty line. Among the single-parent households, those with 3 or 4 children have the highest poverty rate, with 23 household (79.3%) living below poverty.
| Children | Married-Couple Families | Single-Parent Households |
| No Children | 76 (1.7%) | 75 (16.5%) |
| 1 or 2 Children | 23 (1.0%) | 109 (12.6%) |
| 3 or 4 Children | 21 (4.0%) | 23 (79.3%) |
| 5 or more Children | 0 (0.0%) | 0 (0.0%) |
| Total | 120 (1.6%) | 207 (15.3%) |
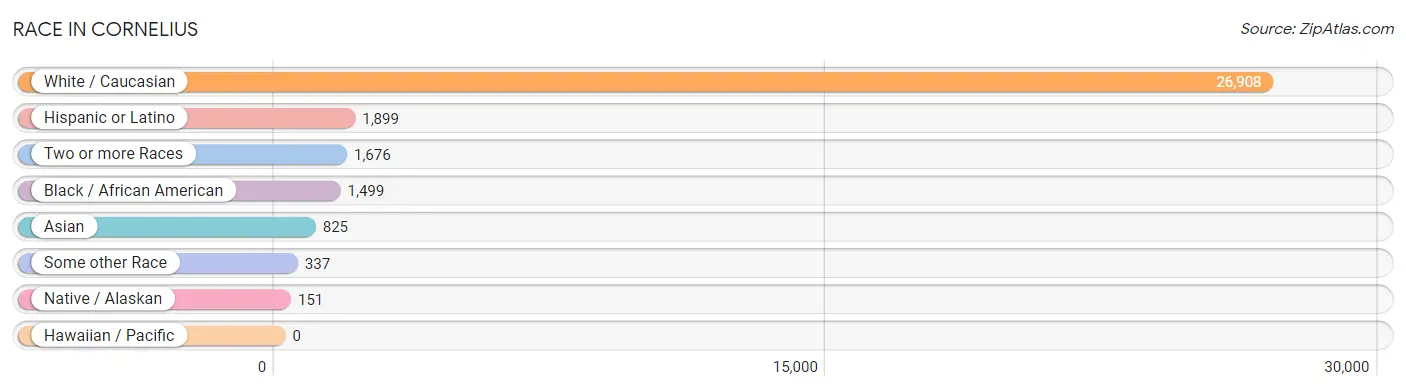
Race in Cornelius
The most populous races in Cornelius are White / Caucasian (26,908 | 85.7%), Hispanic or Latino (1,899 | 6.0%), and Two or more Races (1,676 | 5.3%).
| Race | # Population | % Population |
| Asian | 825 | 2.6% |
| Black / African American | 1,499 | 4.8% |
| Hawaiian / Pacific | 0 | 0.0% |
| Hispanic or Latino | 1,899 | 6.0% |
| Native / Alaskan | 151 | 0.5% |
| White / Caucasian | 26,908 | 85.7% |
| Two or more Races | 1,676 | 5.3% |
| Some other Race | 337 | 1.1% |
| Total | 31,396 | 100.0% |
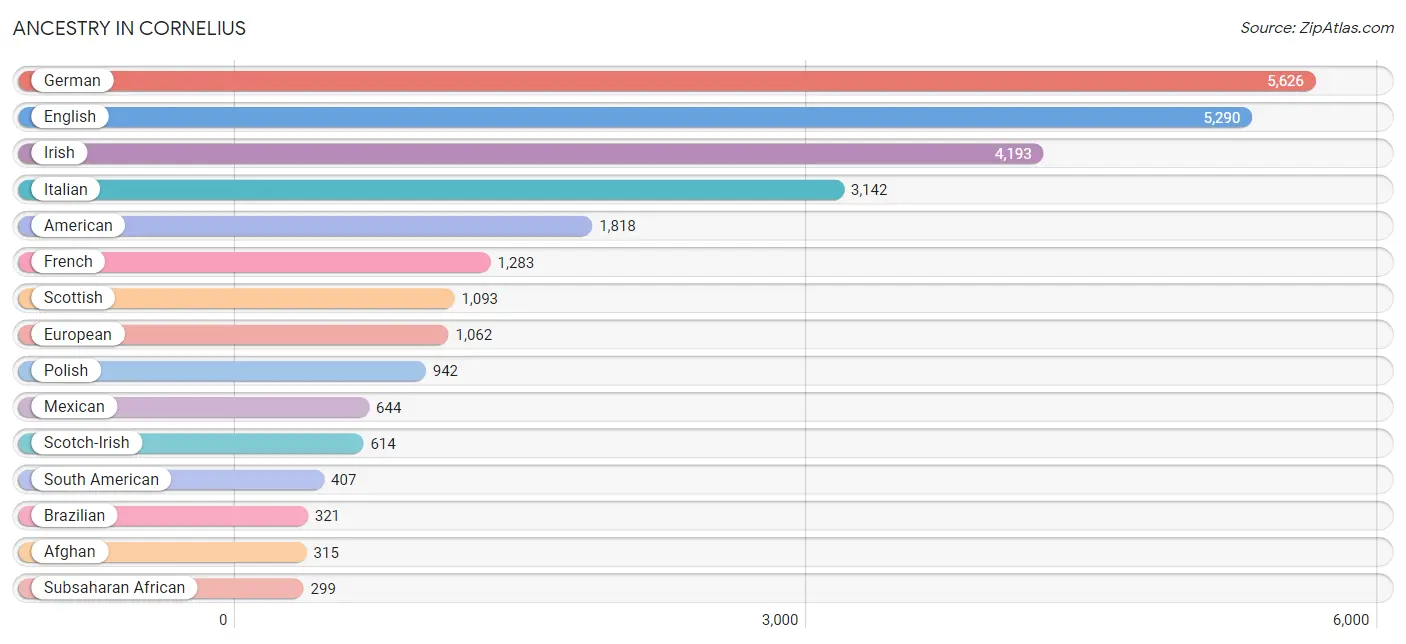
Ancestry in Cornelius
The most populous ancestries reported in Cornelius are German (5,626 | 17.9%), English (5,290 | 16.9%), Irish (4,193 | 13.4%), Italian (3,142 | 10.0%), and American (1,818 | 5.8%), together accounting for 63.9% of all Cornelius residents.
| Ancestry | # Population | % Population |
| Afghan | 315 | 1.0% |
| African | 93 | 0.3% |
| Albanian | 57 | 0.2% |
| American | 1,818 | 5.8% |
| Arab | 275 | 0.9% |
| Armenian | 17 | 0.1% |
| Austrian | 81 | 0.3% |
| Bhutanese | 33 | 0.1% |
| Brazilian | 321 | 1.0% |
| British | 234 | 0.7% |
| Canadian | 98 | 0.3% |
| Celtic | 19 | 0.1% |
| Central American | 266 | 0.9% |
| Central American Indian | 151 | 0.5% |
| Cherokee | 30 | 0.1% |
| Choctaw | 14 | 0.0% |
| Colombian | 148 | 0.5% |
| Croatian | 23 | 0.1% |
| Cuban | 141 | 0.4% |
| Czech | 82 | 0.3% |
| Czechoslovakian | 43 | 0.1% |
| Danish | 173 | 0.5% |
| Dominican | 85 | 0.3% |
| Dutch | 268 | 0.9% |
| Eastern European | 157 | 0.5% |
| Ecuadorian | 69 | 0.2% |
| English | 5,290 | 16.9% |
| Ethiopian | 122 | 0.4% |
| European | 1,062 | 3.4% |
| Finnish | 38 | 0.1% |
| French | 1,283 | 4.1% |
| French Canadian | 84 | 0.3% |
| German | 5,626 | 17.9% |
| Ghanaian | 7 | 0.0% |
| Greek | 189 | 0.6% |
| Guatemalan | 171 | 0.5% |
| Hungarian | 58 | 0.2% |
| Indian (Asian) | 102 | 0.3% |
| Irish | 4,193 | 13.4% |
| Israeli | 49 | 0.2% |
| Italian | 3,142 | 10.0% |
| Korean | 146 | 0.5% |
| Laotian | 23 | 0.1% |
| Lebanese | 101 | 0.3% |
| Lithuanian | 54 | 0.2% |
| Lumbee | 39 | 0.1% |
| Macedonian | 29 | 0.1% |
| Mexican | 644 | 2.1% |
| Mexican American Indian | 17 | 0.1% |
| Moroccan | 10 | 0.0% |
| Native Hawaiian | 16 | 0.1% |
| Navajo | 2 | 0.0% |
| Nicaraguan | 10 | 0.0% |
| Northern European | 60 | 0.2% |
| Norwegian | 240 | 0.8% |
| Pakistani | 33 | 0.1% |
| Palestinian | 102 | 0.3% |
| Panamanian | 85 | 0.3% |
| Paraguayan | 9 | 0.0% |
| Peruvian | 141 | 0.4% |
| Polish | 942 | 3.0% |
| Portuguese | 69 | 0.2% |
| Puerto Rican | 167 | 0.5% |
| Romanian | 122 | 0.4% |
| Russian | 182 | 0.6% |
| Scandinavian | 23 | 0.1% |
| Scotch-Irish | 614 | 2.0% |
| Scottish | 1,093 | 3.5% |
| Serbian | 6 | 0.0% |
| Slovak | 91 | 0.3% |
| Slovene | 11 | 0.0% |
| South African | 13 | 0.0% |
| South American | 407 | 1.3% |
| Spaniard | 90 | 0.3% |
| Spanish | 99 | 0.3% |
| Sri Lankan | 56 | 0.2% |
| Subsaharan African | 299 | 0.9% |
| Swedish | 233 | 0.7% |
| Swiss | 65 | 0.2% |
| Syrian | 20 | 0.1% |
| Thai | 243 | 0.8% |
| Turkish | 24 | 0.1% |
| Ukrainian | 93 | 0.3% |
| Venezuelan | 40 | 0.1% |
| Welsh | 145 | 0.5% |
| Yugoslavian | 16 | 0.1% | View All 86 Rows |
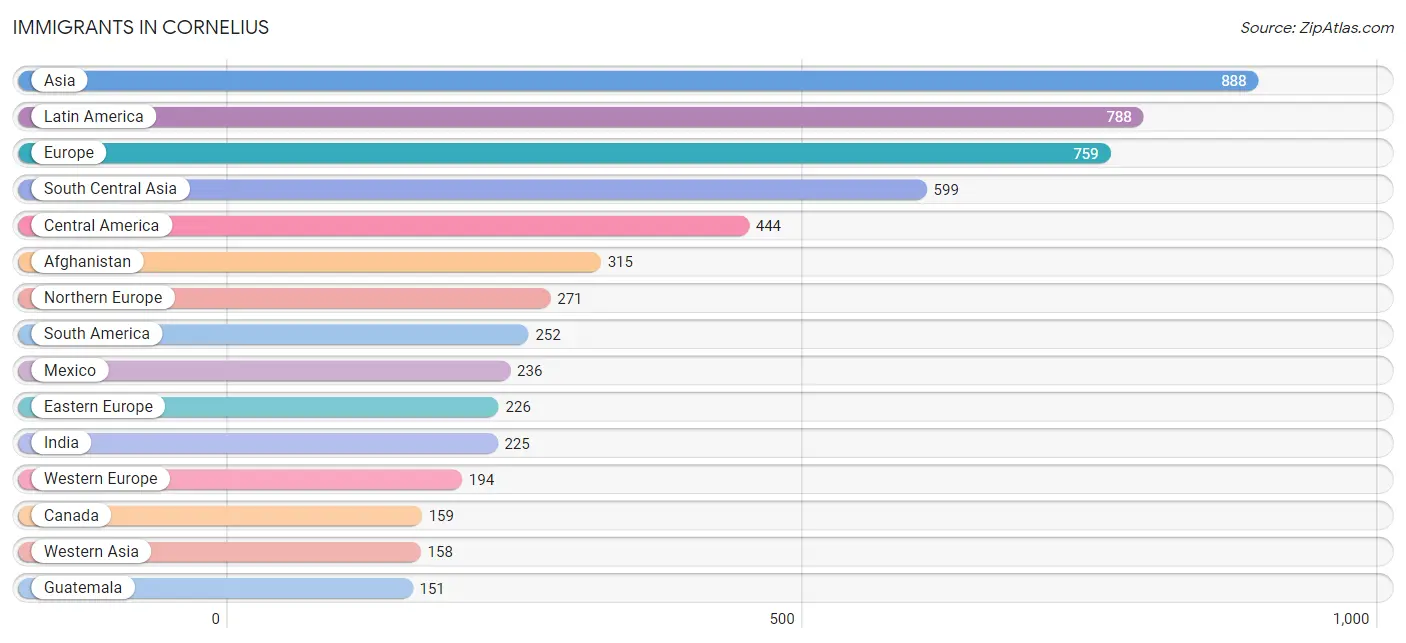
Immigrants in Cornelius
The most numerous immigrant groups reported in Cornelius came from Asia (888 | 2.8%), Latin America (788 | 2.5%), Europe (759 | 2.4%), South Central Asia (599 | 1.9%), and Central America (444 | 1.4%), together accounting for 11.1% of all Cornelius residents.
| Immigration Origin | # Population | % Population |
| Afghanistan | 315 | 1.0% |
| Africa | 112 | 0.4% |
| Argentina | 38 | 0.1% |
| Asia | 888 | 2.8% |
| Australia | 17 | 0.1% |
| Austria | 18 | 0.1% |
| Bahamas | 27 | 0.1% |
| Bangladesh | 28 | 0.1% |
| Belgium | 15 | 0.1% |
| Belize | 10 | 0.0% |
| Brazil | 17 | 0.1% |
| Canada | 159 | 0.5% |
| Caribbean | 92 | 0.3% |
| Central America | 444 | 1.4% |
| China | 42 | 0.1% |
| Colombia | 108 | 0.3% |
| Croatia | 9 | 0.0% |
| Cuba | 21 | 0.1% |
| Czechoslovakia | 20 | 0.1% |
| Dominican Republic | 44 | 0.1% |
| Eastern Africa | 76 | 0.2% |
| Eastern Asia | 42 | 0.1% |
| Eastern Europe | 226 | 0.7% |
| Ecuador | 69 | 0.2% |
| England | 112 | 0.4% |
| Ethiopia | 76 | 0.2% |
| Europe | 759 | 2.4% |
| France | 66 | 0.2% |
| Germany | 58 | 0.2% |
| Guatemala | 151 | 0.5% |
| Hong Kong | 17 | 0.1% |
| India | 225 | 0.7% |
| Indonesia | 23 | 0.1% |
| Iran | 17 | 0.1% |
| Israel | 49 | 0.2% |
| Italy | 6 | 0.0% |
| Kuwait | 69 | 0.2% |
| Latin America | 788 | 2.5% |
| Lebanon | 27 | 0.1% |
| Mexico | 236 | 0.7% |
| Netherlands | 37 | 0.1% |
| Nicaragua | 10 | 0.0% |
| North Macedonia | 29 | 0.1% |
| Northern Europe | 271 | 0.9% |
| Oceania | 17 | 0.1% |
| Panama | 37 | 0.1% |
| Philippines | 53 | 0.2% |
| Poland | 22 | 0.1% |
| Russia | 87 | 0.3% |
| South Africa | 36 | 0.1% |
| South America | 252 | 0.8% |
| South Central Asia | 599 | 1.9% |
| South Eastern Asia | 89 | 0.3% |
| Southern Europe | 68 | 0.2% |
| Spain | 62 | 0.2% |
| Sweden | 11 | 0.0% |
| Taiwan | 15 | 0.1% |
| Turkey | 13 | 0.0% |
| Ukraine | 15 | 0.1% |
| Venezuela | 20 | 0.1% |
| Vietnam | 13 | 0.0% |
| Western Asia | 158 | 0.5% |
| Western Europe | 194 | 0.6% | View All 63 Rows |
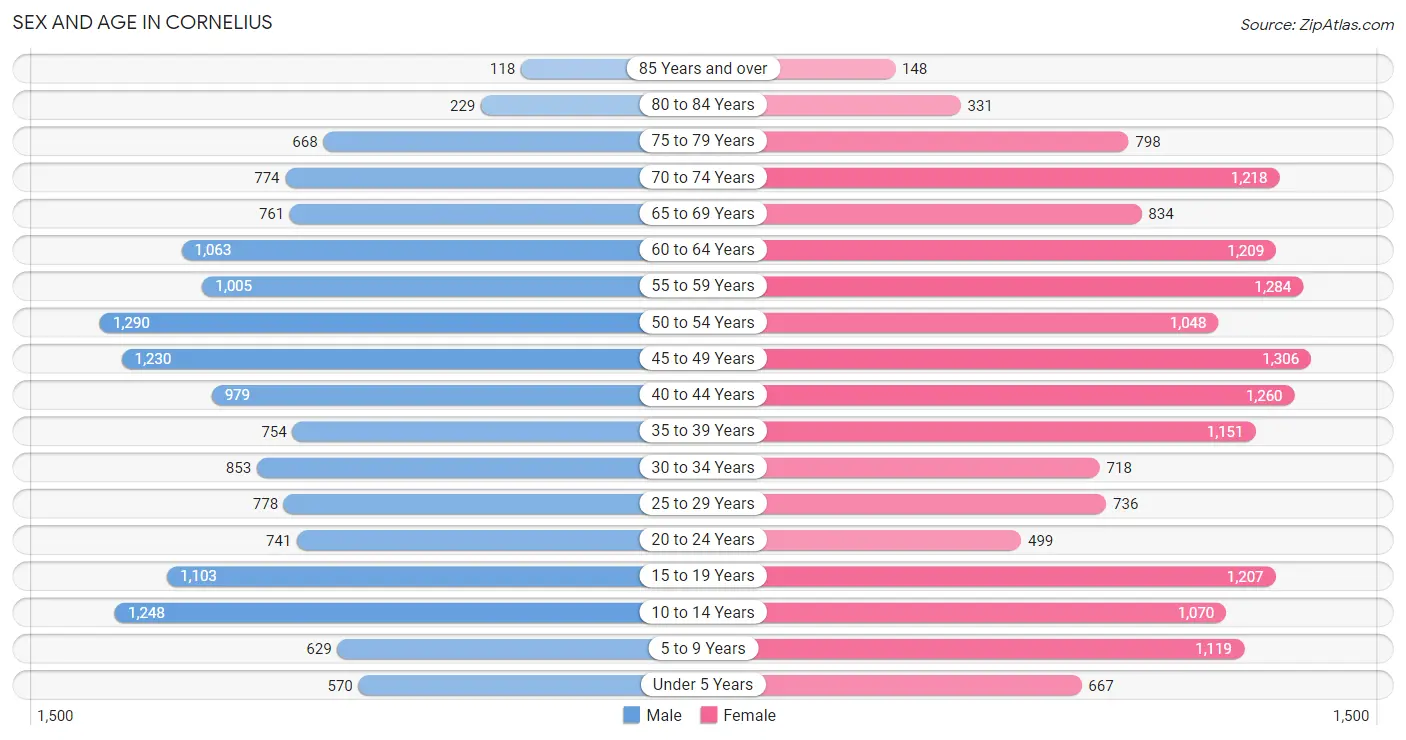
Sex and Age in Cornelius
Sex and Age in Cornelius
The most populous age groups in Cornelius are 50 to 54 Years (1,290 | 8.7%) for men and 45 to 49 Years (1,306 | 7.9%) for women.
| Age Bracket | Male | Female |
| Under 5 Years | 570 (3.8%) | 667 (4.0%) |
| 5 to 9 Years | 629 (4.3%) | 1,119 (6.7%) |
| 10 to 14 Years | 1,248 (8.4%) | 1,070 (6.4%) |
| 15 to 19 Years | 1,103 (7.5%) | 1,207 (7.3%) |
| 20 to 24 Years | 741 (5.0%) | 499 (3.0%) |
| 25 to 29 Years | 778 (5.3%) | 736 (4.4%) |
| 30 to 34 Years | 853 (5.8%) | 718 (4.3%) |
| 35 to 39 Years | 754 (5.1%) | 1,151 (6.9%) |
| 40 to 44 Years | 979 (6.6%) | 1,260 (7.6%) |
| 45 to 49 Years | 1,230 (8.3%) | 1,306 (7.9%) |
| 50 to 54 Years | 1,290 (8.7%) | 1,048 (6.3%) |
| 55 to 59 Years | 1,005 (6.8%) | 1,284 (7.7%) |
| 60 to 64 Years | 1,063 (7.2%) | 1,209 (7.3%) |
| 65 to 69 Years | 761 (5.1%) | 834 (5.0%) |
| 70 to 74 Years | 774 (5.2%) | 1,218 (7.3%) |
| 75 to 79 Years | 668 (4.5%) | 798 (4.8%) |
| 80 to 84 Years | 229 (1.5%) | 331 (2.0%) |
| 85 Years and over | 118 (0.8%) | 148 (0.9%) |
| Total | 14,793 (100.0%) | 16,603 (100.0%) |
Families and Households in Cornelius
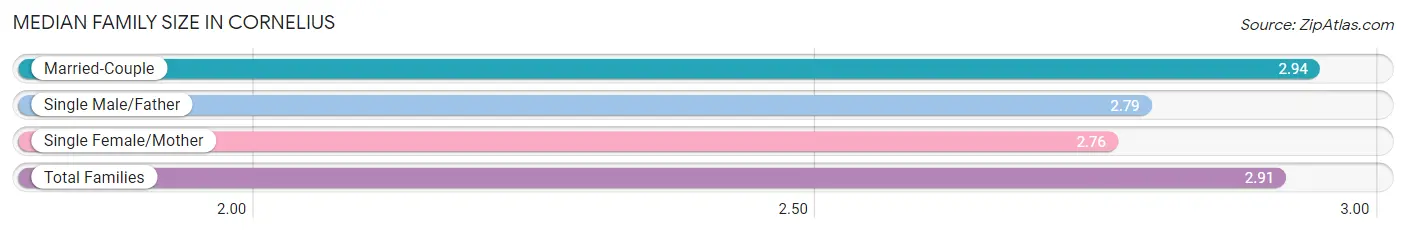
Median Family Size in Cornelius
The median family size in Cornelius is 2.91 persons per family, with married-couple families (7,508 | 84.8%) accounting for the largest median family size of 2.94 persons per family. On the other hand, single female/mother families (986 | 11.1%) represent the smallest median family size with 2.76 persons per family.
| Family Type | # Families | Family Size |
| Married-Couple | 7,508 (84.8%) | 2.94 |
| Single Male/Father | 365 (4.1%) | 2.79 |
| Single Female/Mother | 986 (11.1%) | 2.76 |
| Total Families | 8,859 (100.0%) | 2.91 |
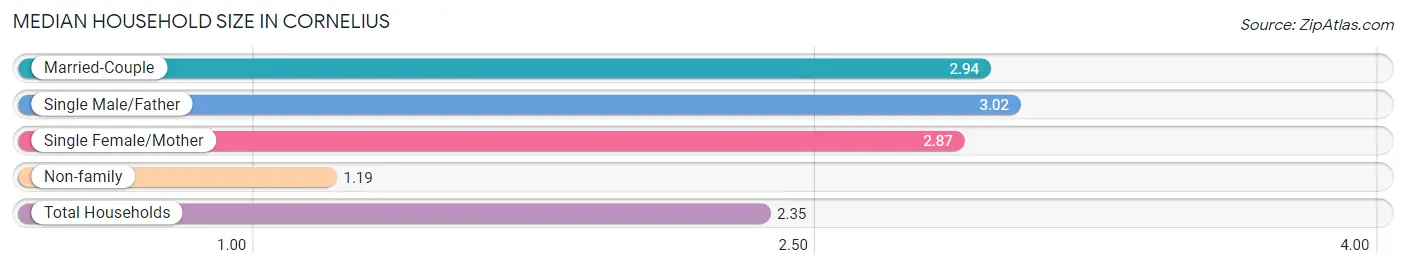
Median Household Size in Cornelius
The median household size in Cornelius is 2.35 persons per household, with single male/father households (365 | 2.7%) accounting for the largest median household size of 3.02 persons per household. non-family households (4,493 | 33.7%) represent the smallest median household size with 1.19 persons per household.
| Household Type | # Households | Household Size |
| Married-Couple | 7,508 (56.2%) | 2.94 |
| Single Male/Father | 365 (2.7%) | 3.02 |
| Single Female/Mother | 986 (7.4%) | 2.87 |
| Non-family | 4,493 (33.7%) | 1.19 |
| Total Households | 13,352 (100.0%) | 2.35 |
Household Size by Marriage Status in Cornelius
Out of a total of 13,352 households in Cornelius, 8,859 (66.3%) are family households, while 4,493 (33.7%) are nonfamily households. The most numerous type of family households are 2-person households, comprising 4,574, and the most common type of nonfamily households are 1-person households, comprising 3,794.
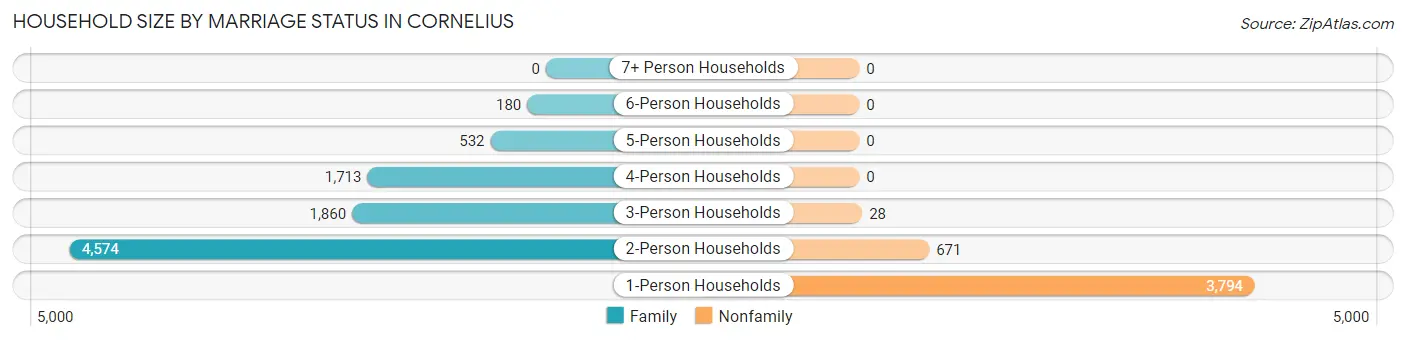
| Household Size | Family Households | Nonfamily Households |
| 1-Person Households | - | 3,794 (28.4%) |
| 2-Person Households | 4,574 (34.3%) | 671 (5.0%) |
| 3-Person Households | 1,860 (13.9%) | 28 (0.2%) |
| 4-Person Households | 1,713 (12.8%) | 0 (0.0%) |
| 5-Person Households | 532 (4.0%) | 0 (0.0%) |
| 6-Person Households | 180 (1.3%) | 0 (0.0%) |
| 7+ Person Households | 0 (0.0%) | 0 (0.0%) |
| Total | 8,859 (66.3%) | 4,493 (33.7%) |
Female Fertility in Cornelius
Fertility by Age in Cornelius
Average fertility rate in Cornelius is 33.0 births per 1,000 women. Women in the age bracket of 20 to 34 years have the highest fertility rate with 71.0 births per 1,000 women. Women in the age bracket of 20 to 34 years acount for 59.5% of all women with births.
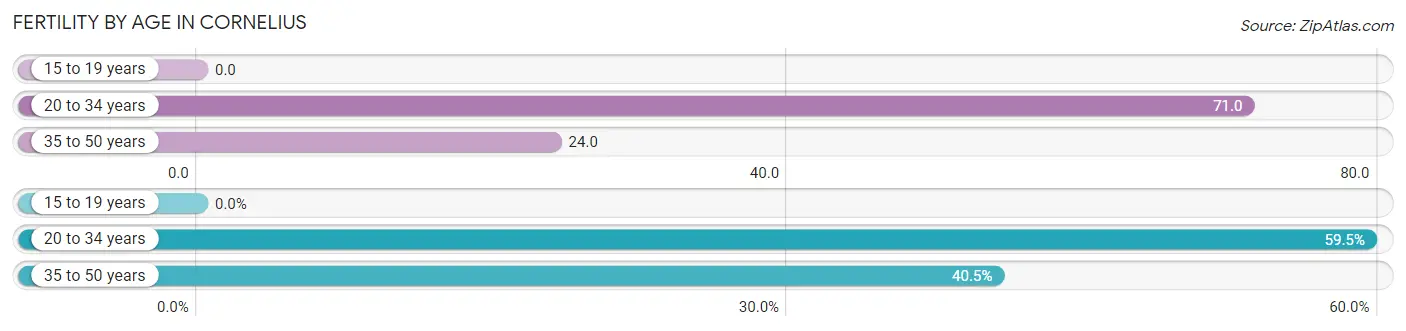
| Age Bracket | Women with Births | Births / 1,000 Women |
| 15 to 19 years | 0 (0.0%) | 0.0 |
| 20 to 34 years | 138 (59.5%) | 71.0 |
| 35 to 50 years | 94 (40.5%) | 24.0 |
| Total | 232 (100.0%) | 33.0 |
Fertility by Age by Marriage Status in Cornelius
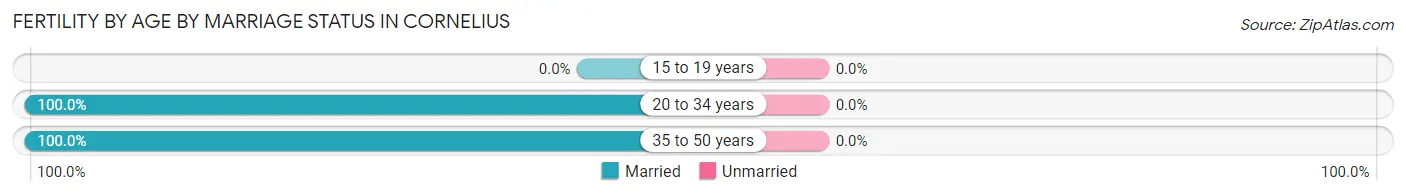
| Age Bracket | Married | Unmarried |
| 15 to 19 years | 0 (0.0%) | 0 (0.0%) |
| 20 to 34 years | 138 (100.0%) | 0 (0.0%) |
| 35 to 50 years | 94 (100.0%) | 0 (0.0%) |
| Total | 232 (100.0%) | 0 (0.0%) |
Fertility by Education in Cornelius
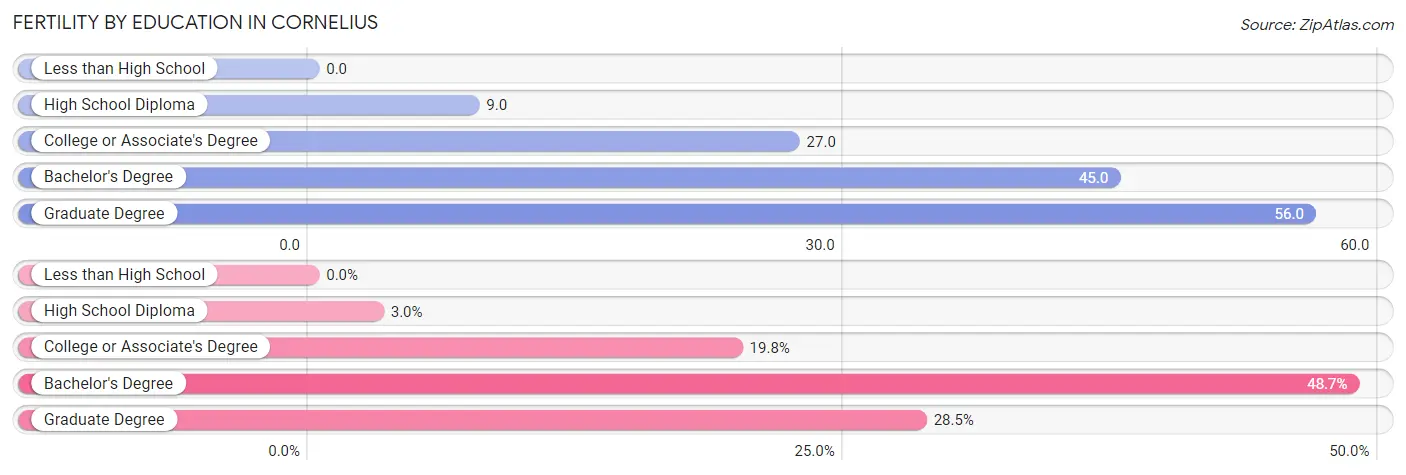
| Educational Attainment | Women with Births | Births / 1,000 Women |
| Less than High School | 0 (0.0%) | 0.0 |
| High School Diploma | 7 (3.0%) | 9.0 |
| College or Associate's Degree | 46 (19.8%) | 27.0 |
| Bachelor's Degree | 113 (48.7%) | 45.0 |
| Graduate Degree | 66 (28.4%) | 56.0 |
| Total | 232 (100.0%) | 33.0 |
Fertility by Education by Marriage Status in Cornelius
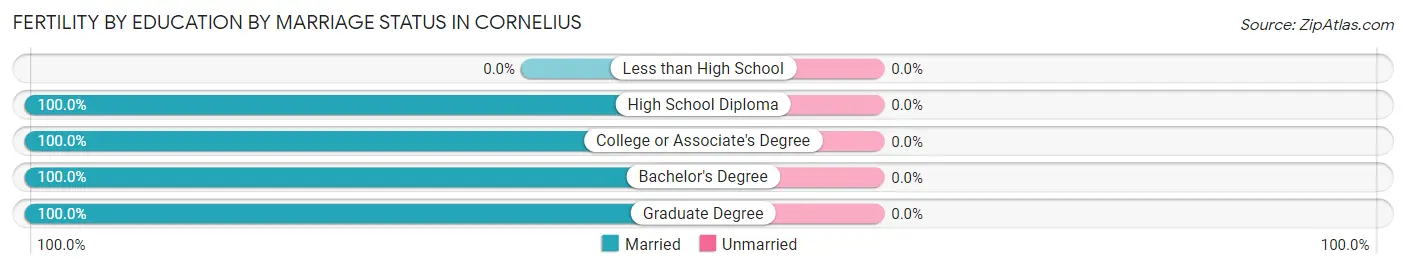
| Educational Attainment | Married | Unmarried |
| Less than High School | 0 (0.0%) | 0 (0.0%) |
| High School Diploma | 7 (100.0%) | 0 (0.0%) |
| College or Associate's Degree | 46 (100.0%) | 0 (0.0%) |
| Bachelor's Degree | 113 (100.0%) | 0 (0.0%) |
| Graduate Degree | 66 (100.0%) | 0 (0.0%) |
| Total | 232 (100.0%) | 0 (0.0%) |
Employment Characteristics in Cornelius
Employment by Class of Employer in Cornelius
Among the 15,817 employed individuals in Cornelius, private company employees (11,229 | 71.0%), not-for-profit organizations (1,478 | 9.3%), and self-employed (incorporated) (1,223 | 7.7%) make up the most common classes of employment.
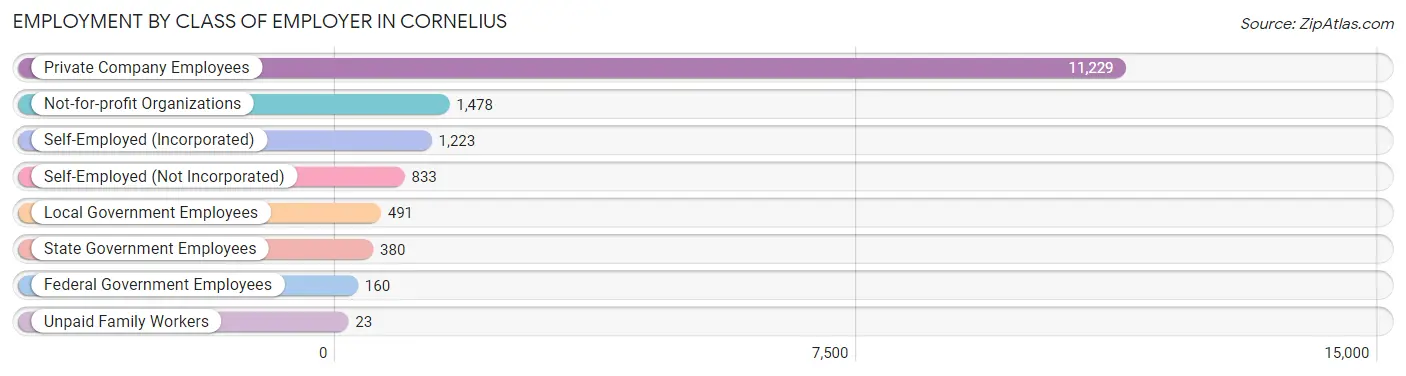
| Employer Class | # Employees | % Employees |
| Private Company Employees | 11,229 | 71.0% |
| Self-Employed (Incorporated) | 1,223 | 7.7% |
| Self-Employed (Not Incorporated) | 833 | 5.3% |
| Not-for-profit Organizations | 1,478 | 9.3% |
| Local Government Employees | 491 | 3.1% |
| State Government Employees | 380 | 2.4% |
| Federal Government Employees | 160 | 1.0% |
| Unpaid Family Workers | 23 | 0.2% |
| Total | 15,817 | 100.0% |
Employment Status by Age in Cornelius
According to the labor force statistics for Cornelius, out of the total population over 16 years of age (25,471), 65.5% or 16,684 individuals are in the labor force, with 3.4% or 567 of them unemployed. The age group with the highest labor force participation rate is 25 to 29 years, with 94.5% or 1,431 individuals in the labor force. Within the labor force, the 16 to 19 years age range has the highest percentage of unemployed individuals, with 20.3% or 146 of them being unemployed.
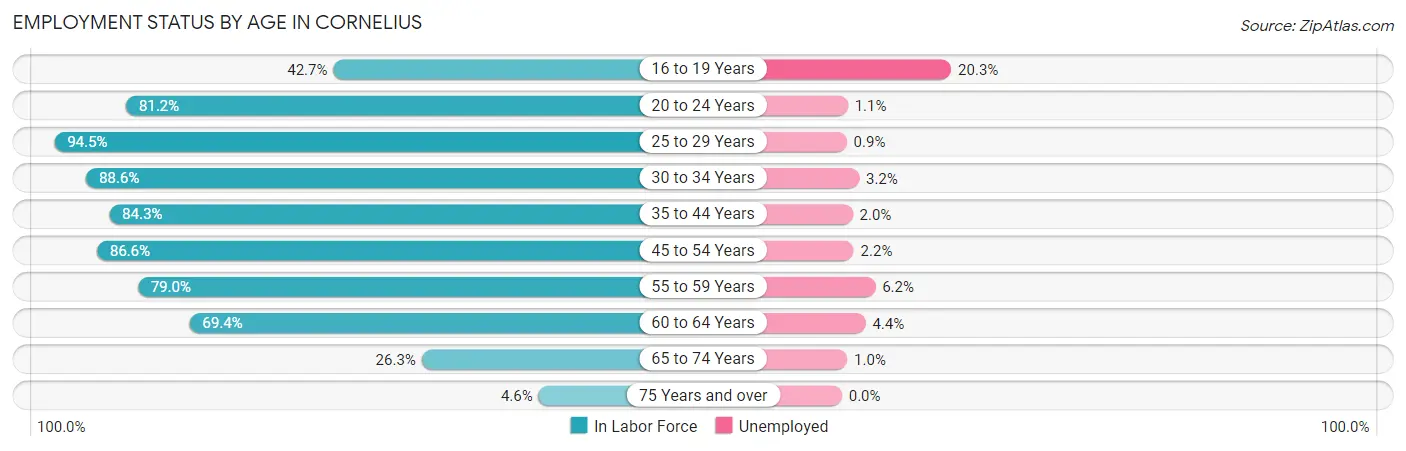
| Age Bracket | In Labor Force | Unemployed |
| 16 to 19 Years | 721 (42.7%) | 146 (20.3%) |
| 20 to 24 Years | 1,007 (81.2%) | 11 (1.1%) |
| 25 to 29 Years | 1,431 (94.5%) | 13 (0.9%) |
| 30 to 34 Years | 1,392 (88.6%) | 45 (3.2%) |
| 35 to 44 Years | 3,493 (84.3%) | 70 (2.0%) |
| 45 to 54 Years | 4,221 (86.6%) | 93 (2.2%) |
| 55 to 59 Years | 1,808 (79.0%) | 112 (6.2%) |
| 60 to 64 Years | 1,577 (69.4%) | 69 (4.4%) |
| 65 to 74 Years | 943 (26.3%) | 9 (1.0%) |
| 75 Years and over | 105 (4.6%) | 0 (0.0%) |
| Total | 16,684 (65.5%) | 567 (3.4%) |
Employment Status by Educational Attainment in Cornelius
According to labor force statistics for Cornelius, 83.5% of individuals (13,914) out of the total population between 25 and 64 years of age (16,664) are in the labor force, with 2.9% or 404 of them being unemployed. The group with the highest labor force participation rate are those with the educational attainment of less than high school, with 98.4% or 499 individuals in the labor force. Within the labor force, individuals with less than high school education have the highest percentage of unemployment, with 14.0% or 70 of them being unemployed.
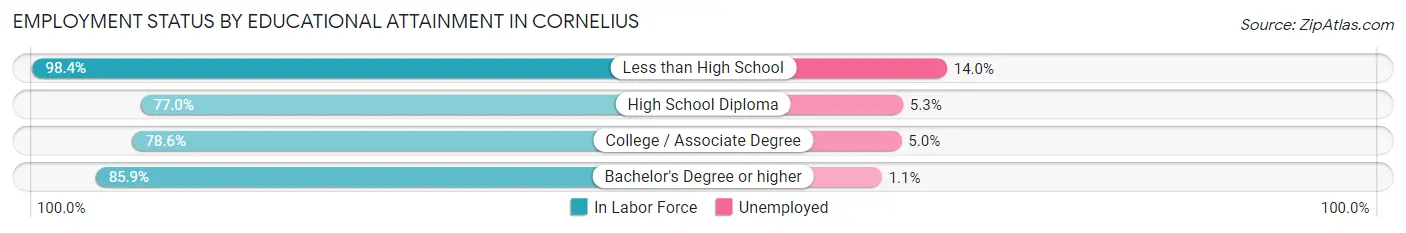
| Educational Attainment | In Labor Force | Unemployed |
| Less than High School | 499 (98.4%) | 71 (14.0%) |
| High School Diploma | 1,100 (77.0%) | 76 (5.3%) |
| College / Associate Degree | 3,510 (78.6%) | 223 (5.0%) |
| Bachelor's Degree or higher | 8,816 (85.9%) | 113 (1.1%) |
| Total | 13,914 (83.5%) | 483 (2.9%) |
Employment Occupations by Sex in Cornelius
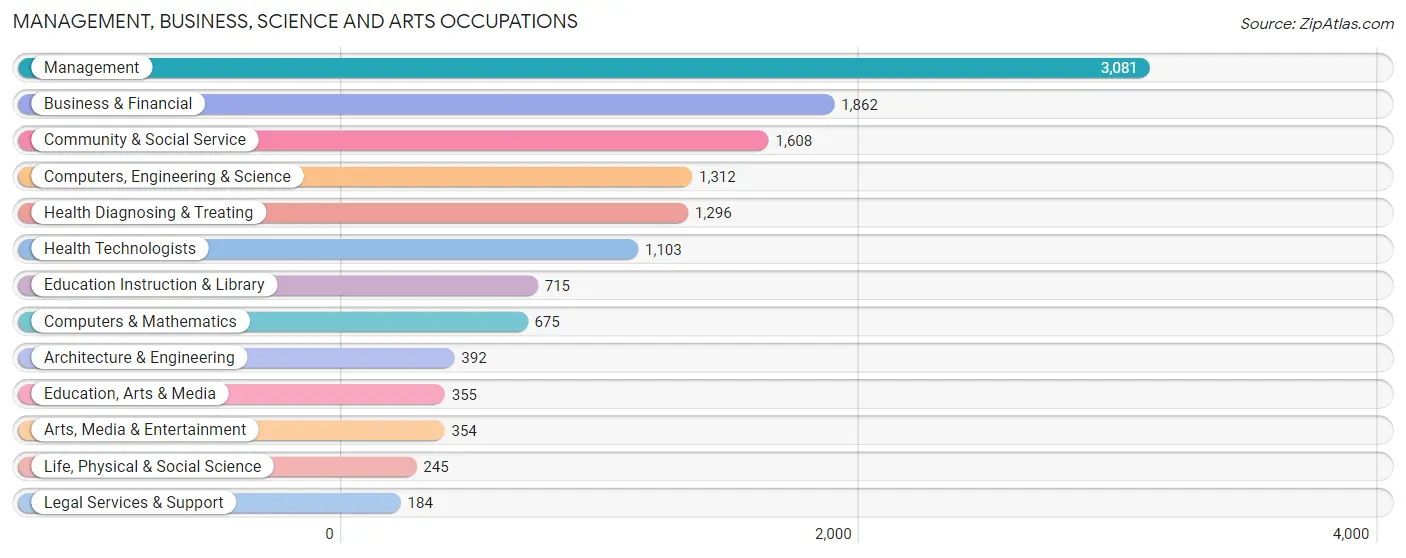
Management, Business, Science and Arts Occupations
The most common Management, Business, Science and Arts occupations in Cornelius are Management (3,081 | 19.1%), Business & Financial (1,862 | 11.6%), Community & Social Service (1,608 | 10.0%), Computers, Engineering & Science (1,312 | 8.1%), and Health Diagnosing & Treating (1,296 | 8.0%).
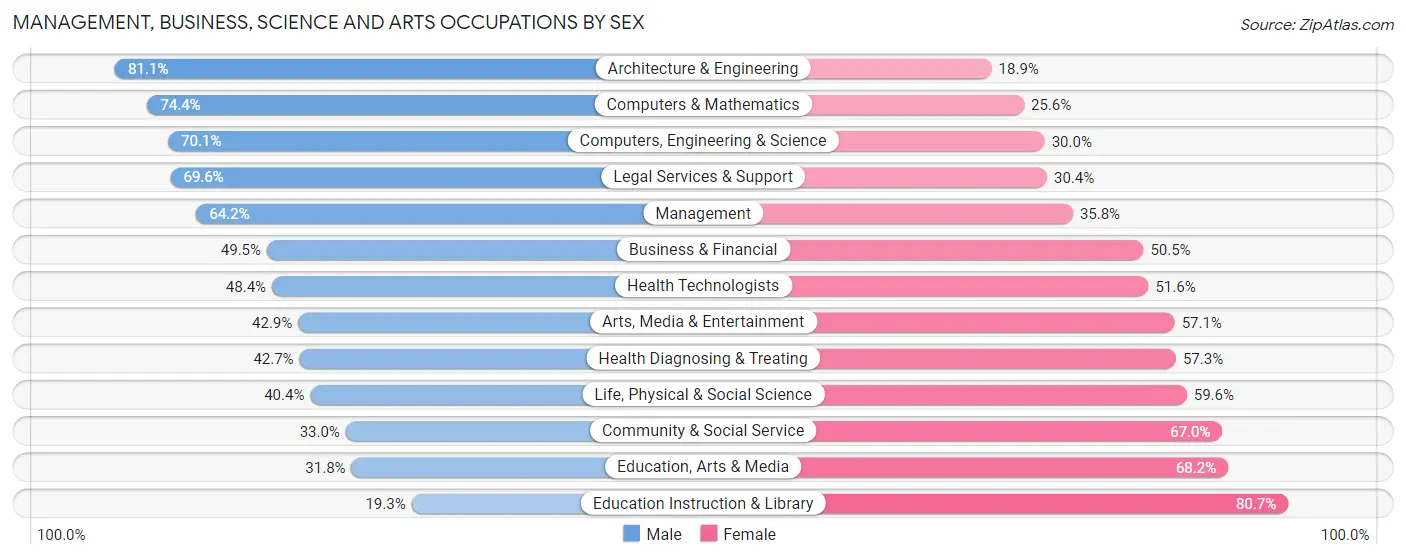
Management, Business, Science and Arts Occupations by Sex
Within the Management, Business, Science and Arts occupations in Cornelius, the most male-oriented occupations are Architecture & Engineering (81.1%), Computers & Mathematics (74.4%), and Computers, Engineering & Science (70.1%), while the most female-oriented occupations are Education Instruction & Library (80.7%), Education, Arts & Media (68.2%), and Community & Social Service (67.0%).
| Occupation | Male | Female |
| Management | 1,977 (64.2%) | 1,104 (35.8%) |
| Business & Financial | 921 (49.5%) | 941 (50.5%) |
| Computers, Engineering & Science | 919 (70.1%) | 393 (29.9%) |
| Computers & Mathematics | 502 (74.4%) | 173 (25.6%) |
| Architecture & Engineering | 318 (81.1%) | 74 (18.9%) |
| Life, Physical & Social Science | 99 (40.4%) | 146 (59.6%) |
| Community & Social Service | 531 (33.0%) | 1,077 (67.0%) |
| Education, Arts & Media | 113 (31.8%) | 242 (68.2%) |
| Legal Services & Support | 128 (69.6%) | 56 (30.4%) |
| Education Instruction & Library | 138 (19.3%) | 577 (80.7%) |
| Arts, Media & Entertainment | 152 (42.9%) | 202 (57.1%) |
| Health Diagnosing & Treating | 553 (42.7%) | 743 (57.3%) |
| Health Technologists | 534 (48.4%) | 569 (51.6%) |
| Total (Category) | 4,901 (53.5%) | 4,258 (46.5%) |
| Total (Overall) | 8,625 (53.5%) | 7,502 (46.5%) |
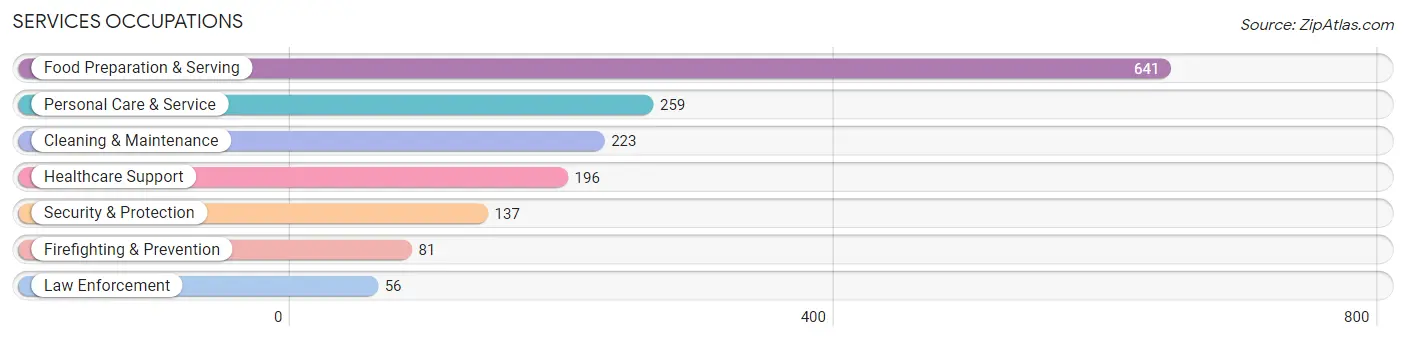
Services Occupations
The most common Services occupations in Cornelius are Food Preparation & Serving (641 | 4.0%), Personal Care & Service (259 | 1.6%), Cleaning & Maintenance (223 | 1.4%), Healthcare Support (196 | 1.2%), and Security & Protection (137 | 0.9%).
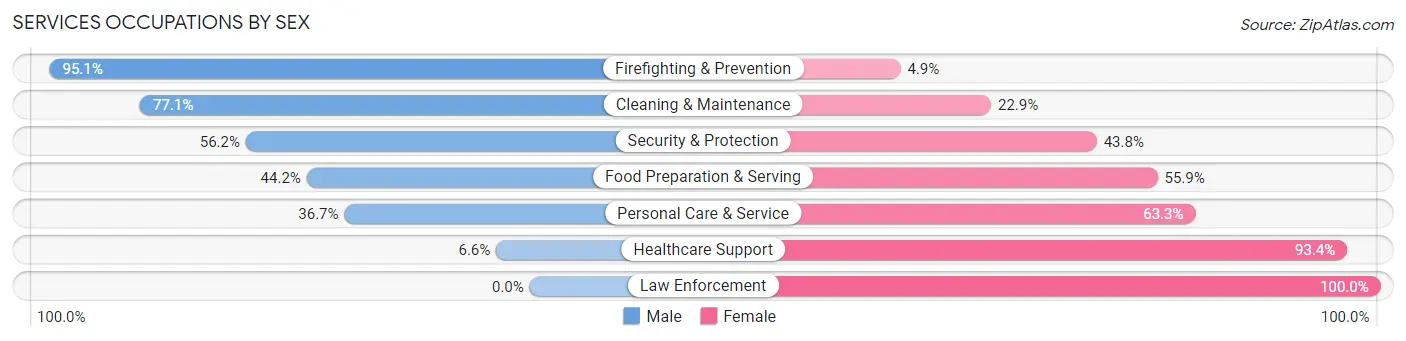
Services Occupations by Sex
Within the Services occupations in Cornelius, the most male-oriented occupations are Firefighting & Prevention (95.1%), Cleaning & Maintenance (77.1%), and Security & Protection (56.2%), while the most female-oriented occupations are Law Enforcement (100.0%), Healthcare Support (93.4%), and Personal Care & Service (63.3%).
| Occupation | Male | Female |
| Healthcare Support | 13 (6.6%) | 183 (93.4%) |
| Security & Protection | 77 (56.2%) | 60 (43.8%) |
| Firefighting & Prevention | 77 (95.1%) | 4 (4.9%) |
| Law Enforcement | 0 (0.0%) | 56 (100.0%) |
| Food Preparation & Serving | 283 (44.2%) | 358 (55.8%) |
| Cleaning & Maintenance | 172 (77.1%) | 51 (22.9%) |
| Personal Care & Service | 95 (36.7%) | 164 (63.3%) |
| Total (Category) | 640 (44.0%) | 816 (56.0%) |
| Total (Overall) | 8,625 (53.5%) | 7,502 (46.5%) |
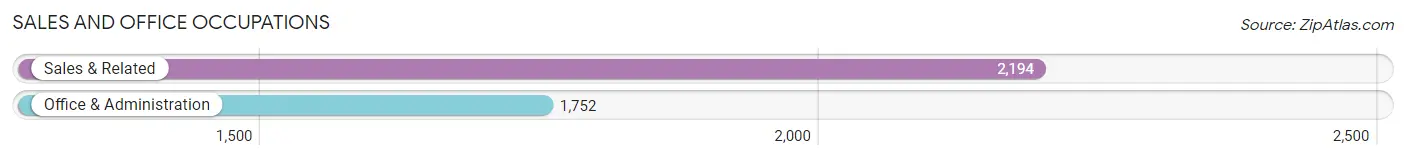
Sales and Office Occupations
The most common Sales and Office occupations in Cornelius are Sales & Related (2,194 | 13.6%), and Office & Administration (1,752 | 10.9%).
Sales and Office Occupations by Sex
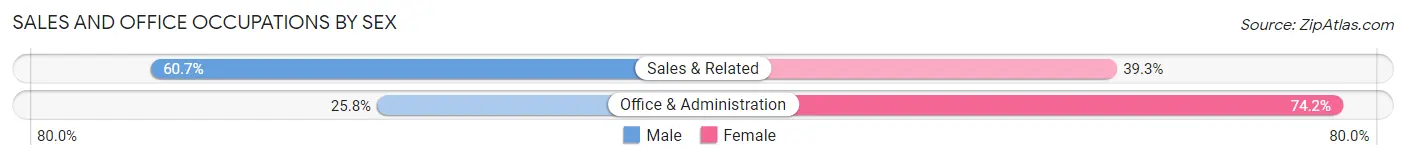
| Occupation | Male | Female |
| Sales & Related | 1,331 (60.7%) | 863 (39.3%) |
| Office & Administration | 452 (25.8%) | 1,300 (74.2%) |
| Total (Category) | 1,783 (45.2%) | 2,163 (54.8%) |
| Total (Overall) | 8,625 (53.5%) | 7,502 (46.5%) |
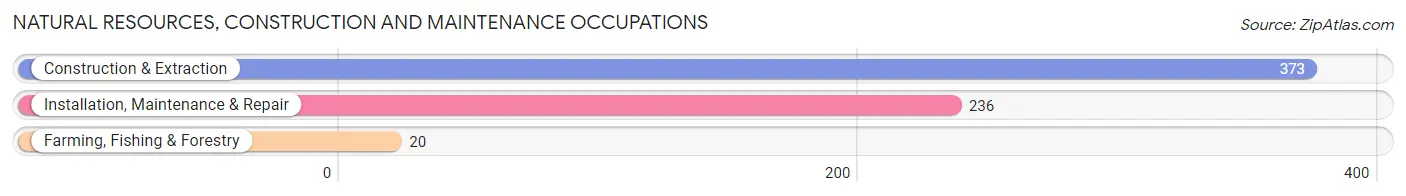
Natural Resources, Construction and Maintenance Occupations
The most common Natural Resources, Construction and Maintenance occupations in Cornelius are Construction & Extraction (373 | 2.3%), Installation, Maintenance & Repair (236 | 1.5%), and Farming, Fishing & Forestry (20 | 0.1%).
Natural Resources, Construction and Maintenance Occupations by Sex
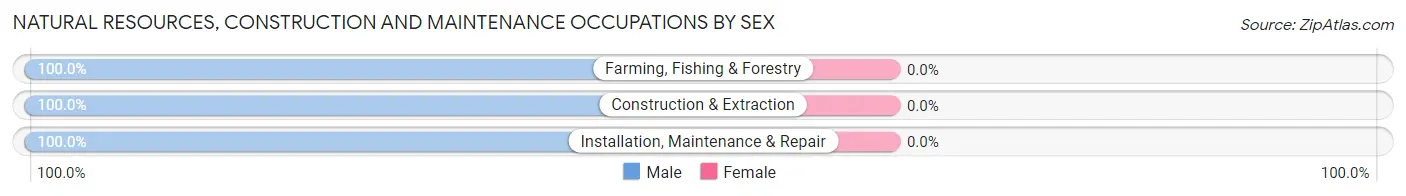
| Occupation | Male | Female |
| Farming, Fishing & Forestry | 20 (100.0%) | 0 (0.0%) |
| Construction & Extraction | 373 (100.0%) | 0 (0.0%) |
| Installation, Maintenance & Repair | 236 (100.0%) | 0 (0.0%) |
| Total (Category) | 629 (100.0%) | 0 (0.0%) |
| Total (Overall) | 8,625 (53.5%) | 7,502 (46.5%) |
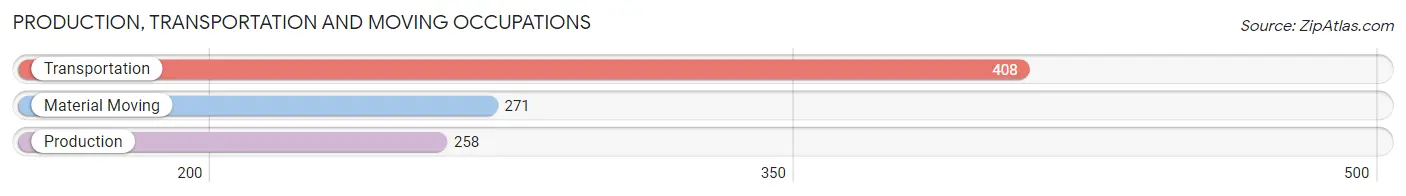
Production, Transportation and Moving Occupations
The most common Production, Transportation and Moving occupations in Cornelius are Transportation (408 | 2.5%), Material Moving (271 | 1.7%), and Production (258 | 1.6%).
Production, Transportation and Moving Occupations by Sex
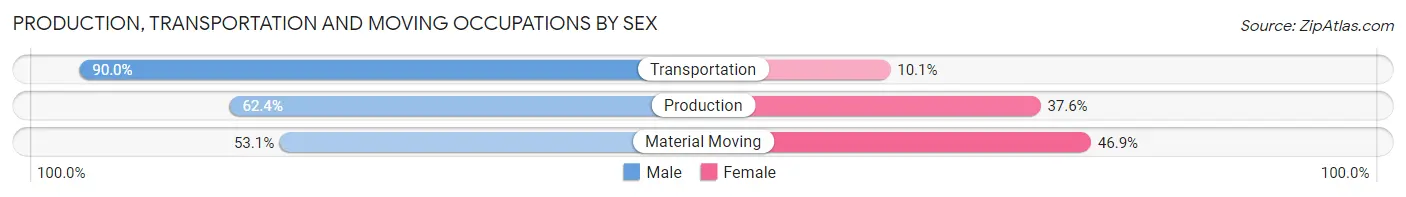
| Occupation | Male | Female |
| Production | 161 (62.4%) | 97 (37.6%) |
| Transportation | 367 (89.9%) | 41 (10.1%) |
| Material Moving | 144 (53.1%) | 127 (46.9%) |
| Total (Category) | 672 (71.7%) | 265 (28.3%) |
| Total (Overall) | 8,625 (53.5%) | 7,502 (46.5%) |
Employment Industries by Sex in Cornelius
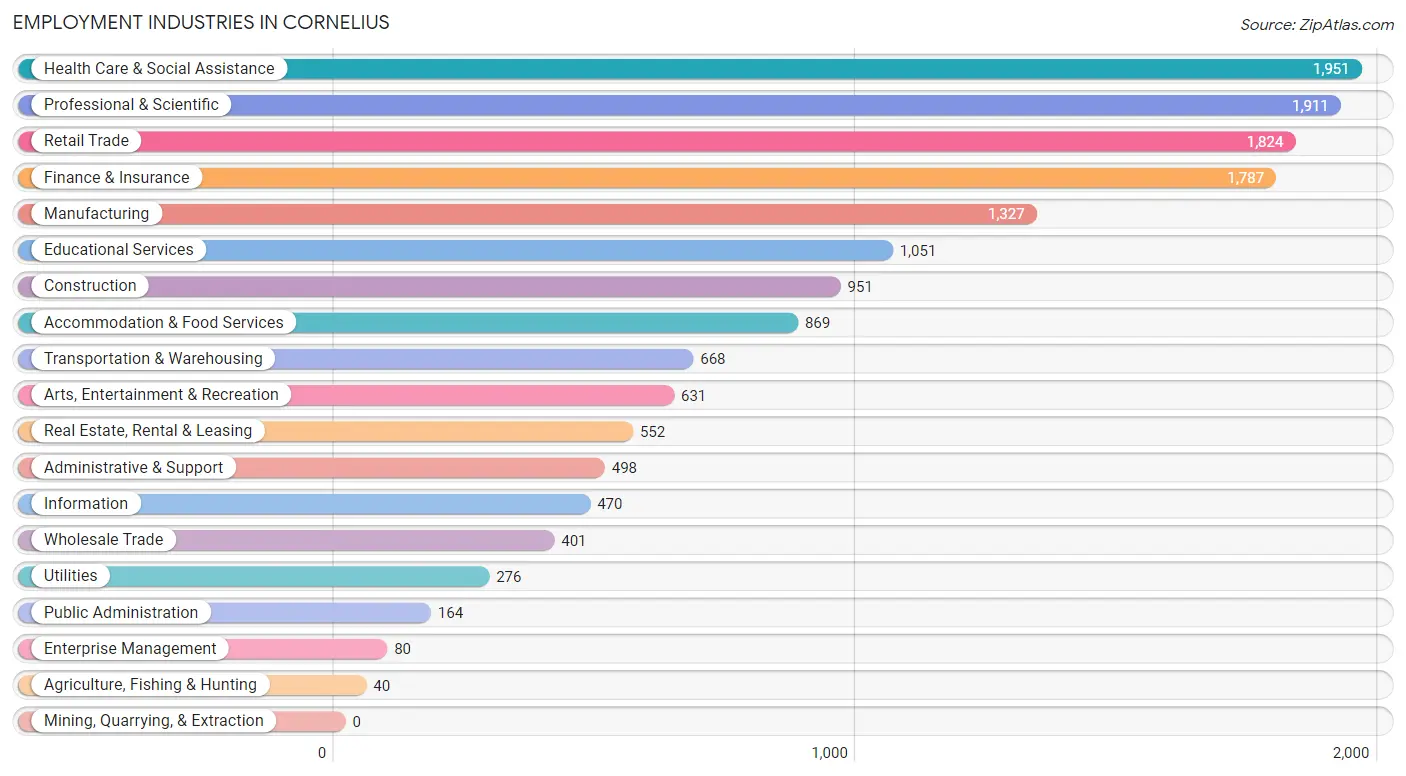
Employment Industries in Cornelius
The major employment industries in Cornelius include Health Care & Social Assistance (1,951 | 12.1%), Professional & Scientific (1,911 | 11.8%), Retail Trade (1,824 | 11.3%), Finance & Insurance (1,787 | 11.1%), and Manufacturing (1,327 | 8.2%).
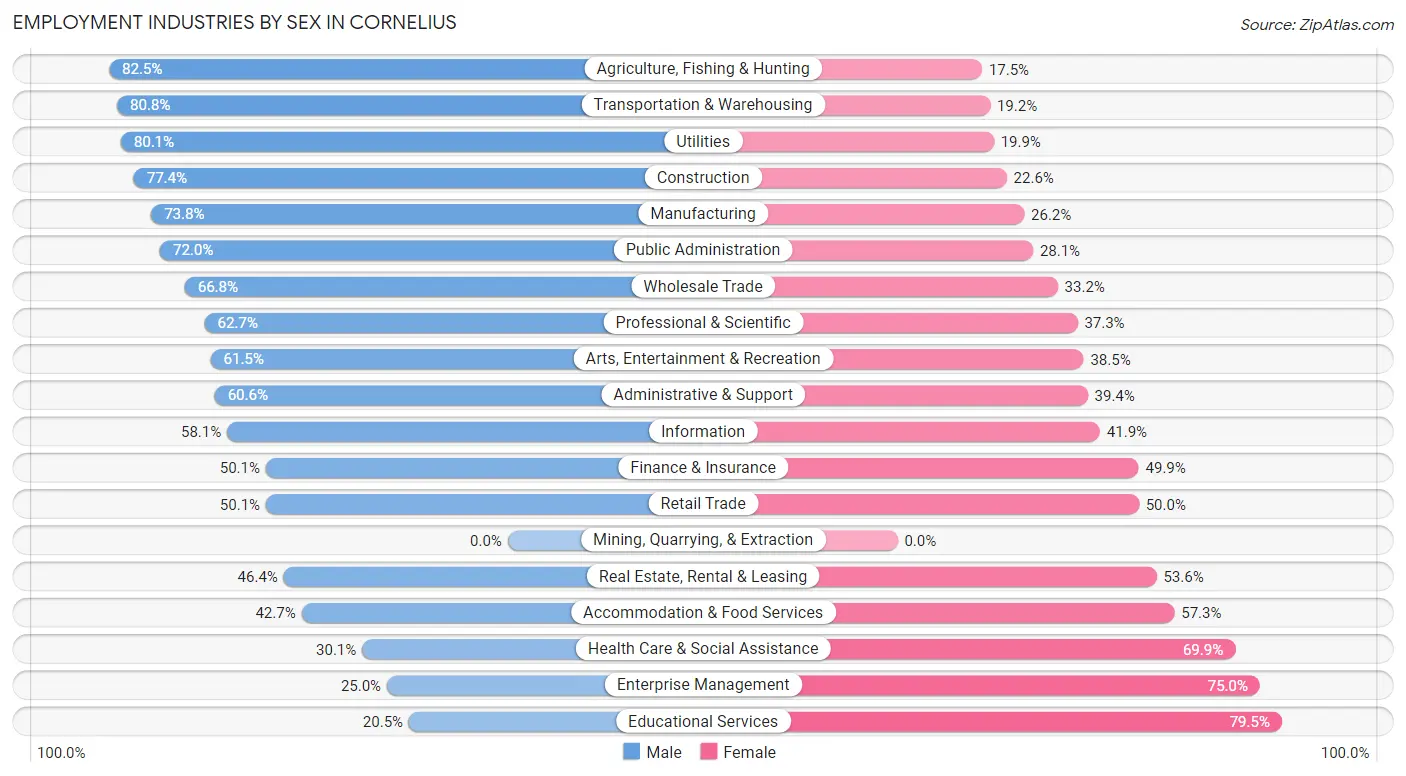
Employment Industries by Sex in Cornelius
The Cornelius industries that see more men than women are Agriculture, Fishing & Hunting (82.5%), Transportation & Warehousing (80.8%), and Utilities (80.1%), whereas the industries that tend to have a higher number of women are Educational Services (79.5%), Enterprise Management (75.0%), and Health Care & Social Assistance (69.9%).
| Industry | Male | Female |
| Agriculture, Fishing & Hunting | 33 (82.5%) | 7 (17.5%) |
| Mining, Quarrying, & Extraction | 0 (0.0%) | 0 (0.0%) |
| Construction | 736 (77.4%) | 215 (22.6%) |
| Manufacturing | 979 (73.8%) | 348 (26.2%) |
| Wholesale Trade | 268 (66.8%) | 133 (33.2%) |
| Retail Trade | 913 (50.0%) | 911 (49.9%) |
| Transportation & Warehousing | 540 (80.8%) | 128 (19.2%) |
| Utilities | 221 (80.1%) | 55 (19.9%) |
| Information | 273 (58.1%) | 197 (41.9%) |
| Finance & Insurance | 895 (50.1%) | 892 (49.9%) |
| Real Estate, Rental & Leasing | 256 (46.4%) | 296 (53.6%) |
| Professional & Scientific | 1,199 (62.7%) | 712 (37.3%) |
| Enterprise Management | 20 (25.0%) | 60 (75.0%) |
| Administrative & Support | 302 (60.6%) | 196 (39.4%) |
| Educational Services | 215 (20.5%) | 836 (79.5%) |
| Health Care & Social Assistance | 588 (30.1%) | 1,363 (69.9%) |
| Arts, Entertainment & Recreation | 388 (61.5%) | 243 (38.5%) |
| Accommodation & Food Services | 371 (42.7%) | 498 (57.3%) |
| Public Administration | 118 (72.0%) | 46 (28.1%) |
| Total | 8,625 (53.5%) | 7,502 (46.5%) |
Education in Cornelius
School Enrollment in Cornelius
The most common levels of schooling among the 7,808 students in Cornelius are high school (1,989 | 25.5%), middle school (1,764 | 22.6%), and elementary school (1,557 | 19.9%).
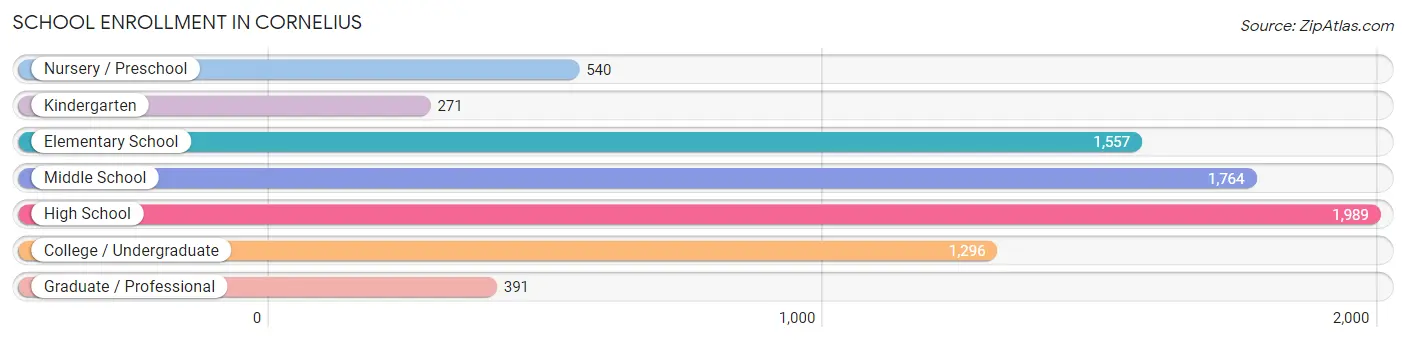
| School Level | # Students | % Students |
| Nursery / Preschool | 540 | 6.9% |
| Kindergarten | 271 | 3.5% |
| Elementary School | 1,557 | 19.9% |
| Middle School | 1,764 | 22.6% |
| High School | 1,989 | 25.5% |
| College / Undergraduate | 1,296 | 16.6% |
| Graduate / Professional | 391 | 5.0% |
| Total | 7,808 | 100.0% |
School Enrollment by Age by Funding Source in Cornelius
Out of a total of 7,808 students who are enrolled in schools in Cornelius, 1,804 (23.1%) attend a private institution, while the remaining 6,004 (76.9%) are enrolled in public schools. The age group of 3 to 4 year olds has the highest likelihood of being enrolled in private schools, with 295 (86.5% in the age bracket) enrolled. Conversely, the age group of 25 to 34 year olds has the lowest likelihood of being enrolled in a private school, with 374 (89.5% in the age bracket) attending a public institution.
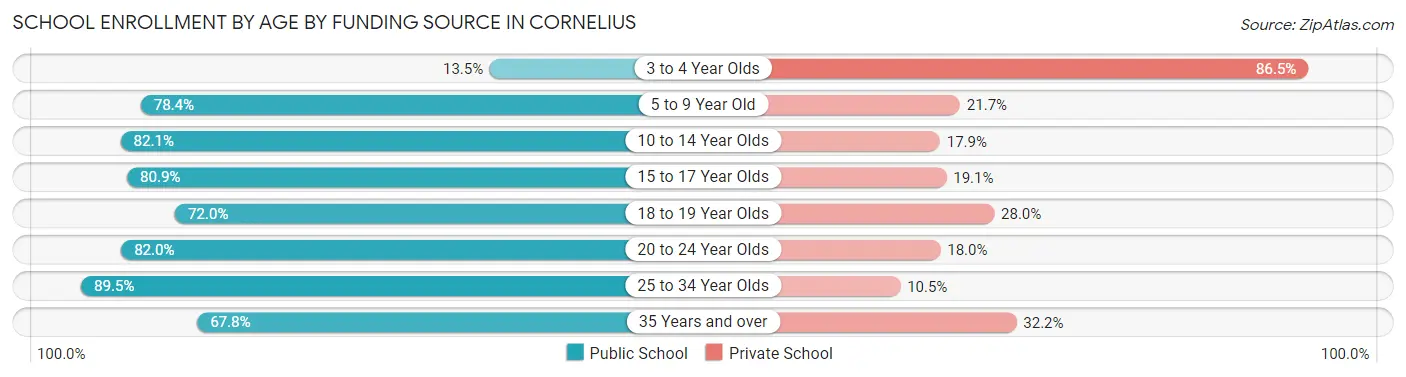
| Age Bracket | Public School | Private School |
| 3 to 4 Year Olds | 46 (13.5%) | 295 (86.5%) |
| 5 to 9 Year Old | 1,310 (78.3%) | 362 (21.6%) |
| 10 to 14 Year Olds | 1,903 (82.1%) | 415 (17.9%) |
| 15 to 17 Year Olds | 1,278 (80.9%) | 302 (19.1%) |
| 18 to 19 Year Olds | 370 (72.0%) | 144 (28.0%) |
| 20 to 24 Year Olds | 419 (82.0%) | 92 (18.0%) |
| 25 to 34 Year Olds | 374 (89.5%) | 44 (10.5%) |
| 35 Years and over | 308 (67.8%) | 146 (32.2%) |
| Total | 6,004 (76.9%) | 1,804 (23.1%) |
Educational Attainment by Field of Study in Cornelius
Business (4,008 | 28.2%), education (1,624 | 11.4%), science & technology (1,106 | 7.8%), social sciences (1,026 | 7.2%), and communications (944 | 6.7%) are the most common fields of study among 14,192 individuals in Cornelius who have obtained a bachelor's degree or higher.
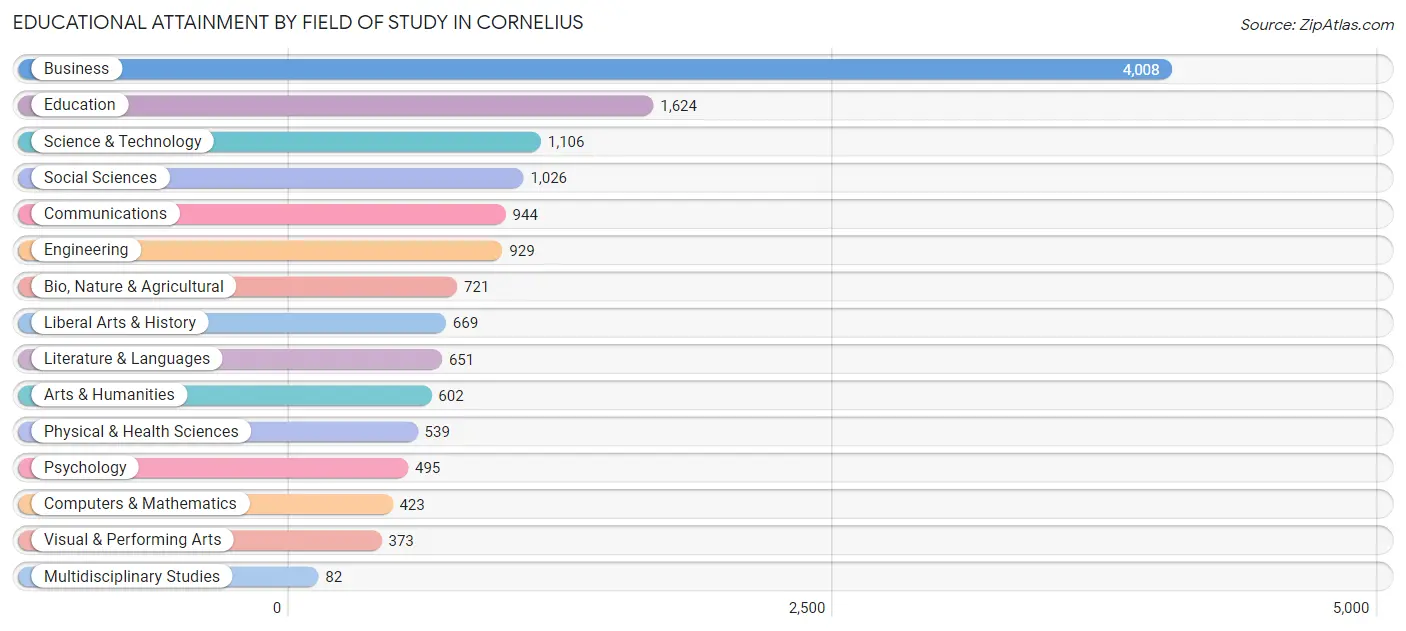
| Field of Study | # Graduates | % Graduates |
| Computers & Mathematics | 423 | 3.0% |
| Bio, Nature & Agricultural | 721 | 5.1% |
| Physical & Health Sciences | 539 | 3.8% |
| Psychology | 495 | 3.5% |
| Social Sciences | 1,026 | 7.2% |
| Engineering | 929 | 6.6% |
| Multidisciplinary Studies | 82 | 0.6% |
| Science & Technology | 1,106 | 7.8% |
| Business | 4,008 | 28.2% |
| Education | 1,624 | 11.4% |
| Literature & Languages | 651 | 4.6% |
| Liberal Arts & History | 669 | 4.7% |
| Visual & Performing Arts | 373 | 2.6% |
| Communications | 944 | 6.7% |
| Arts & Humanities | 602 | 4.2% |
| Total | 14,192 | 100.0% |
Transportation & Commute in Cornelius
Vehicle Availability by Sex in Cornelius
The most prevalent vehicle ownership categories in Cornelius are males with 2 vehicles (3,924, accounting for 45.9%) and females with 2 vehicles (3,245, making up 54.0%).
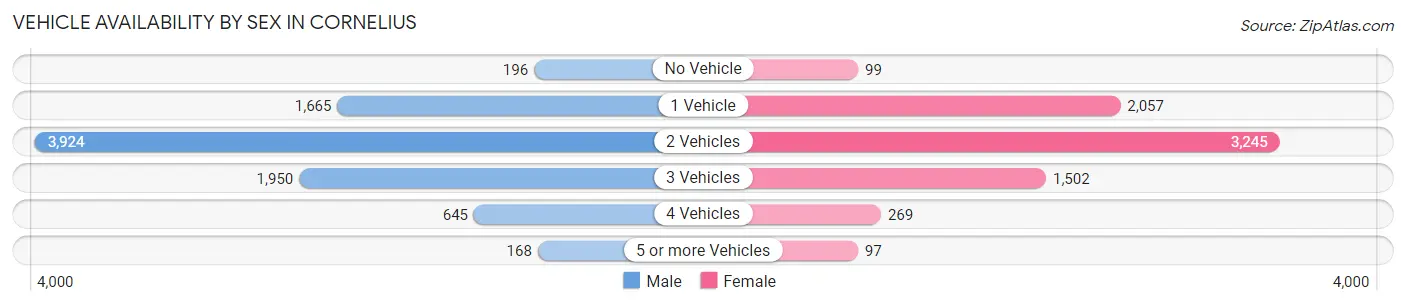
| Vehicles Available | Male | Female |
| No Vehicle | 196 (2.3%) | 99 (1.4%) |
| 1 Vehicle | 1,665 (19.5%) | 2,057 (28.3%) |
| 2 Vehicles | 3,924 (45.9%) | 3,245 (44.6%) |
| 3 Vehicles | 1,950 (22.8%) | 1,502 (20.7%) |
| 4 Vehicles | 645 (7.5%) | 269 (3.7%) |
| 5 or more Vehicles | 168 (2.0%) | 97 (1.3%) |
| Total | 8,548 (100.0%) | 7,269 (100.0%) |
Commute Time in Cornelius
The most frequently occuring commute durations in Cornelius are 10 to 14 minutes (1,692 commuters, 13.9%), 30 to 34 minutes (1,675 commuters, 13.8%), and 5 to 9 minutes (1,612 commuters, 13.3%).
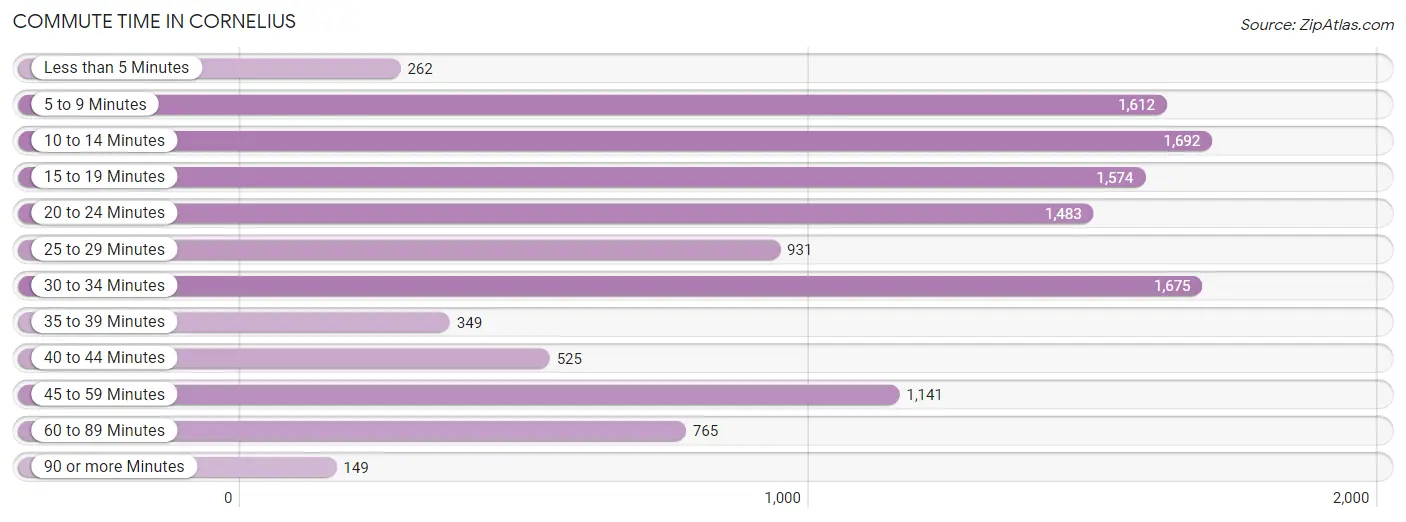
| Commute Time | # Commuters | % Commuters |
| Less than 5 Minutes | 262 | 2.1% |
| 5 to 9 Minutes | 1,612 | 13.3% |
| 10 to 14 Minutes | 1,692 | 13.9% |
| 15 to 19 Minutes | 1,574 | 13.0% |
| 20 to 24 Minutes | 1,483 | 12.2% |
| 25 to 29 Minutes | 931 | 7.7% |
| 30 to 34 Minutes | 1,675 | 13.8% |
| 35 to 39 Minutes | 349 | 2.9% |
| 40 to 44 Minutes | 525 | 4.3% |
| 45 to 59 Minutes | 1,141 | 9.4% |
| 60 to 89 Minutes | 765 | 6.3% |
| 90 or more Minutes | 149 | 1.2% |
Commute Time by Sex in Cornelius
The most common commute times in Cornelius are 30 to 34 minutes (1,002 commuters, 15.6%) for males and 10 to 14 minutes (836 commuters, 14.6%) for females.
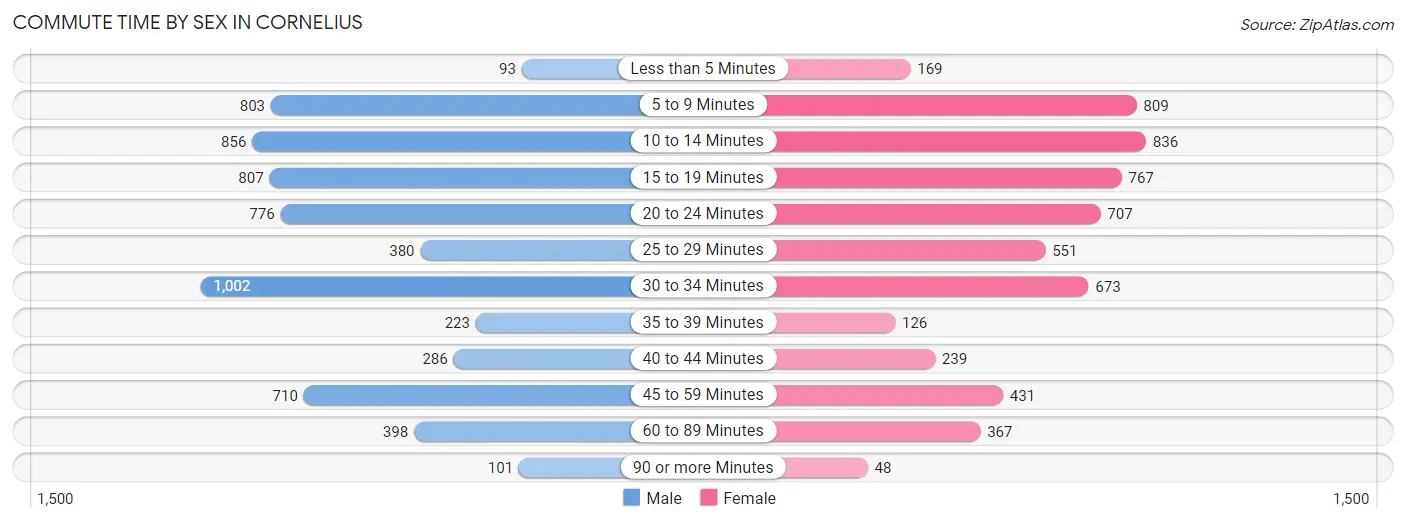
| Commute Time | Male | Female |
| Less than 5 Minutes | 93 (1.5%) | 169 (2.9%) |
| 5 to 9 Minutes | 803 (12.5%) | 809 (14.1%) |
| 10 to 14 Minutes | 856 (13.3%) | 836 (14.6%) |
| 15 to 19 Minutes | 807 (12.5%) | 767 (13.4%) |
| 20 to 24 Minutes | 776 (12.1%) | 707 (12.3%) |
| 25 to 29 Minutes | 380 (5.9%) | 551 (9.6%) |
| 30 to 34 Minutes | 1,002 (15.6%) | 673 (11.8%) |
| 35 to 39 Minutes | 223 (3.5%) | 126 (2.2%) |
| 40 to 44 Minutes | 286 (4.4%) | 239 (4.2%) |
| 45 to 59 Minutes | 710 (11.0%) | 431 (7.5%) |
| 60 to 89 Minutes | 398 (6.2%) | 367 (6.4%) |
| 90 or more Minutes | 101 (1.6%) | 48 (0.8%) |
Time of Departure to Work by Sex in Cornelius
The most frequent times of departure to work in Cornelius are 8:00 AM to 8:29 AM (1,002, 15.6%) for males and 7:30 AM to 7:59 AM (830, 14.5%) for females.
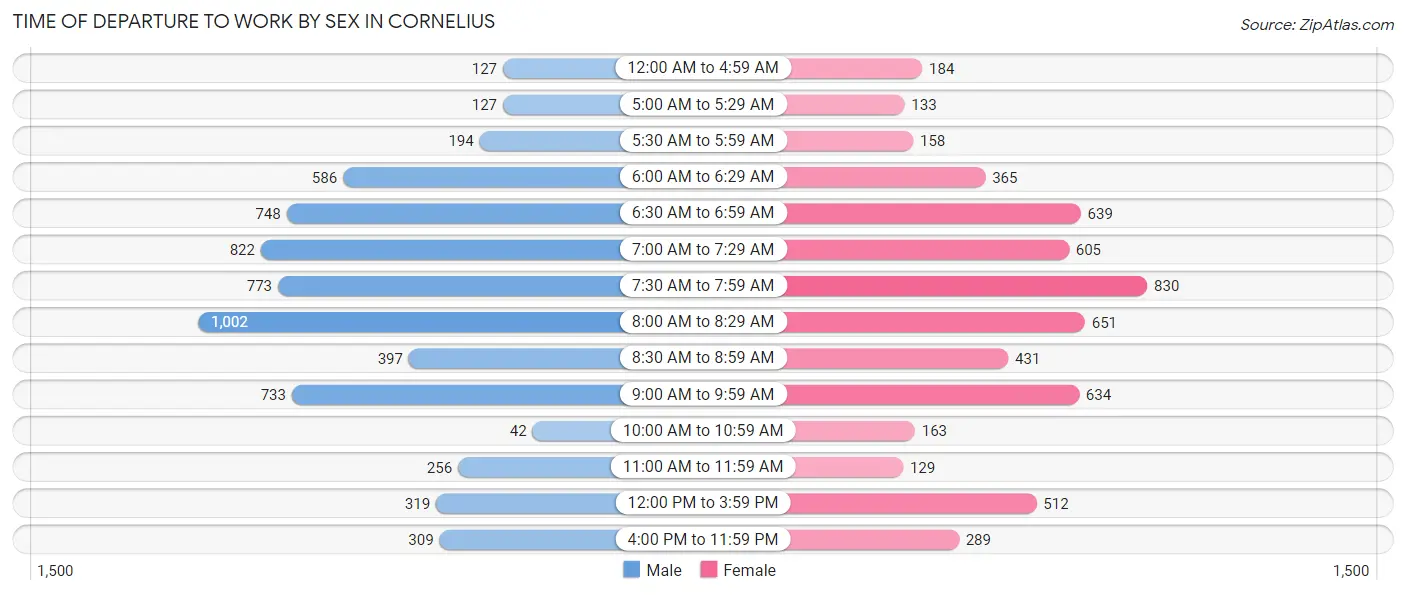
| Time of Departure | Male | Female |
| 12:00 AM to 4:59 AM | 127 (2.0%) | 184 (3.2%) |
| 5:00 AM to 5:29 AM | 127 (2.0%) | 133 (2.3%) |
| 5:30 AM to 5:59 AM | 194 (3.0%) | 158 (2.8%) |
| 6:00 AM to 6:29 AM | 586 (9.1%) | 365 (6.4%) |
| 6:30 AM to 6:59 AM | 748 (11.6%) | 639 (11.2%) |
| 7:00 AM to 7:29 AM | 822 (12.8%) | 605 (10.6%) |
| 7:30 AM to 7:59 AM | 773 (12.0%) | 830 (14.5%) |
| 8:00 AM to 8:29 AM | 1,002 (15.6%) | 651 (11.4%) |
| 8:30 AM to 8:59 AM | 397 (6.2%) | 431 (7.5%) |
| 9:00 AM to 9:59 AM | 733 (11.4%) | 634 (11.1%) |
| 10:00 AM to 10:59 AM | 42 (0.6%) | 163 (2.9%) |
| 11:00 AM to 11:59 AM | 256 (4.0%) | 129 (2.2%) |
| 12:00 PM to 3:59 PM | 319 (5.0%) | 512 (8.9%) |
| 4:00 PM to 11:59 PM | 309 (4.8%) | 289 (5.1%) |
| Total | 6,435 (100.0%) | 5,723 (100.0%) |
Housing Occupancy in Cornelius
Occupancy by Ownership in Cornelius
Of the total 13,352 dwellings in Cornelius, owner-occupied units account for 9,310 (69.7%), while renter-occupied units make up 4,042 (30.3%).
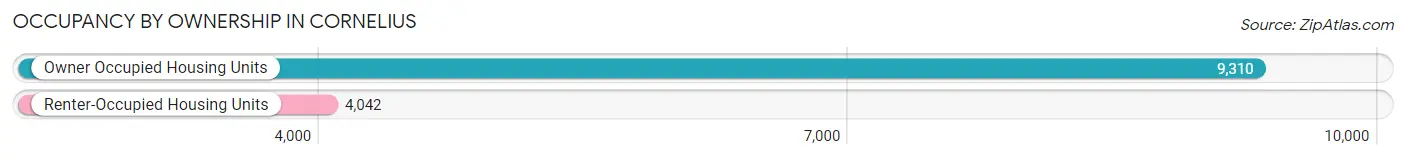
| Occupancy | # Housing Units | % Housing Units |
| Owner Occupied Housing Units | 9,310 | 69.7% |
| Renter-Occupied Housing Units | 4,042 | 30.3% |
| Total Occupied Housing Units | 13,352 | 100.0% |
Occupancy by Household Size in Cornelius
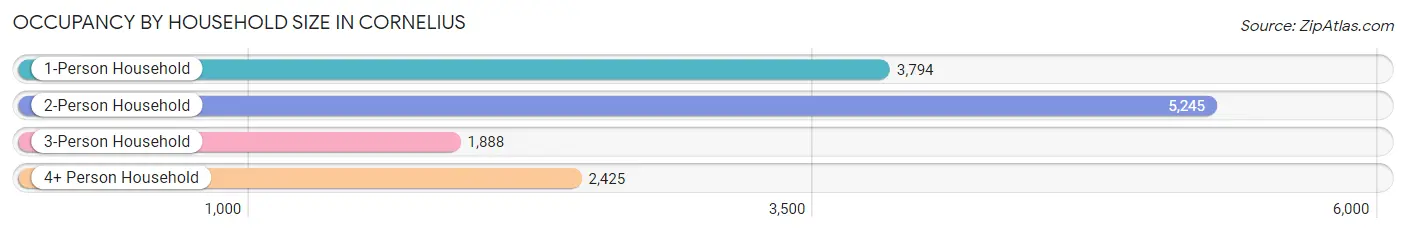
| Household Size | # Housing Units | % Housing Units |
| 1-Person Household | 3,794 | 28.4% |
| 2-Person Household | 5,245 | 39.3% |
| 3-Person Household | 1,888 | 14.1% |
| 4+ Person Household | 2,425 | 18.2% |
| Total Housing Units | 13,352 | 100.0% |
Occupancy by Ownership by Household Size in Cornelius
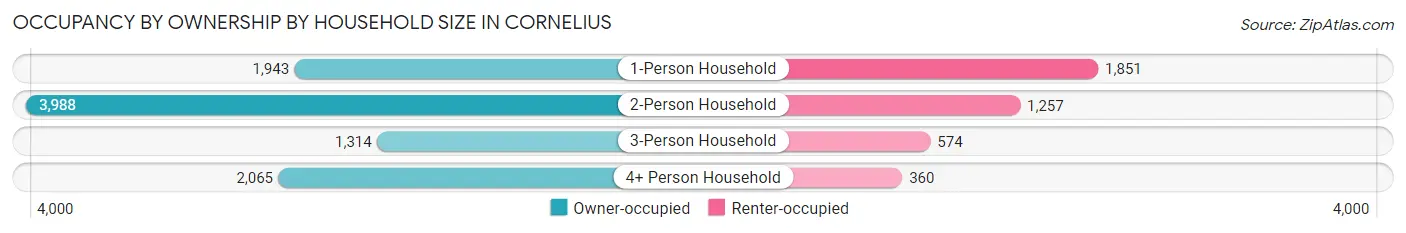
| Household Size | Owner-occupied | Renter-occupied |
| 1-Person Household | 1,943 (51.2%) | 1,851 (48.8%) |
| 2-Person Household | 3,988 (76.0%) | 1,257 (24.0%) |
| 3-Person Household | 1,314 (69.6%) | 574 (30.4%) |
| 4+ Person Household | 2,065 (85.2%) | 360 (14.8%) |
| Total Housing Units | 9,310 (69.7%) | 4,042 (30.3%) |
Occupancy by Educational Attainment in Cornelius
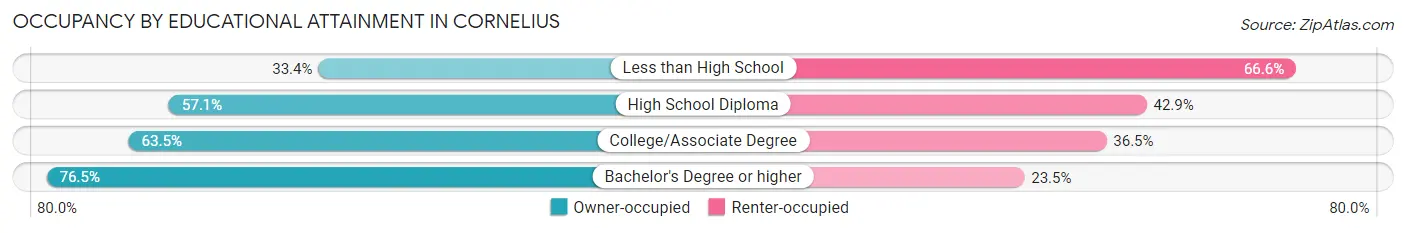
| Household Size | Owner-occupied | Renter-occupied |
| Less than High School | 126 (33.4%) | 251 (66.6%) |
| High School Diploma | 655 (57.1%) | 492 (42.9%) |
| College/Associate Degree | 2,537 (63.5%) | 1,459 (36.5%) |
| Bachelor's Degree or higher | 5,992 (76.5%) | 1,840 (23.5%) |
Occupancy by Age of Householder in Cornelius
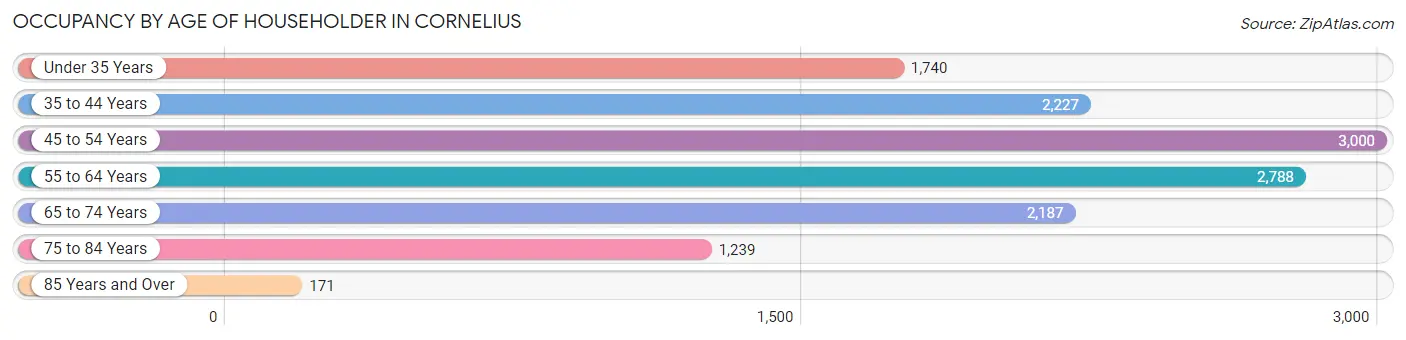
| Age Bracket | # Households | % Households |
| Under 35 Years | 1,740 | 13.0% |
| 35 to 44 Years | 2,227 | 16.7% |
| 45 to 54 Years | 3,000 | 22.5% |
| 55 to 64 Years | 2,788 | 20.9% |
| 65 to 74 Years | 2,187 | 16.4% |
| 75 to 84 Years | 1,239 | 9.3% |
| 85 Years and Over | 171 | 1.3% |
| Total | 13,352 | 100.0% |
Housing Finances in Cornelius
Median Income by Occupancy in Cornelius
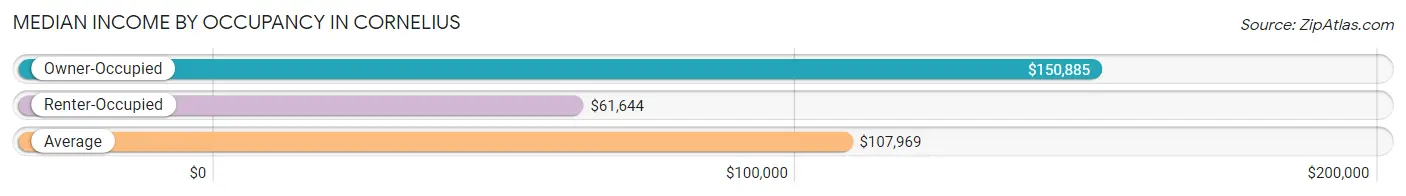
| Occupancy Type | # Households | Median Income |
| Owner-Occupied | 9,310 (69.7%) | $150,885 |
| Renter-Occupied | 4,042 (30.3%) | $61,644 |
| Average | 13,352 (100.0%) | $107,969 |
Occupancy by Householder Income Bracket in Cornelius
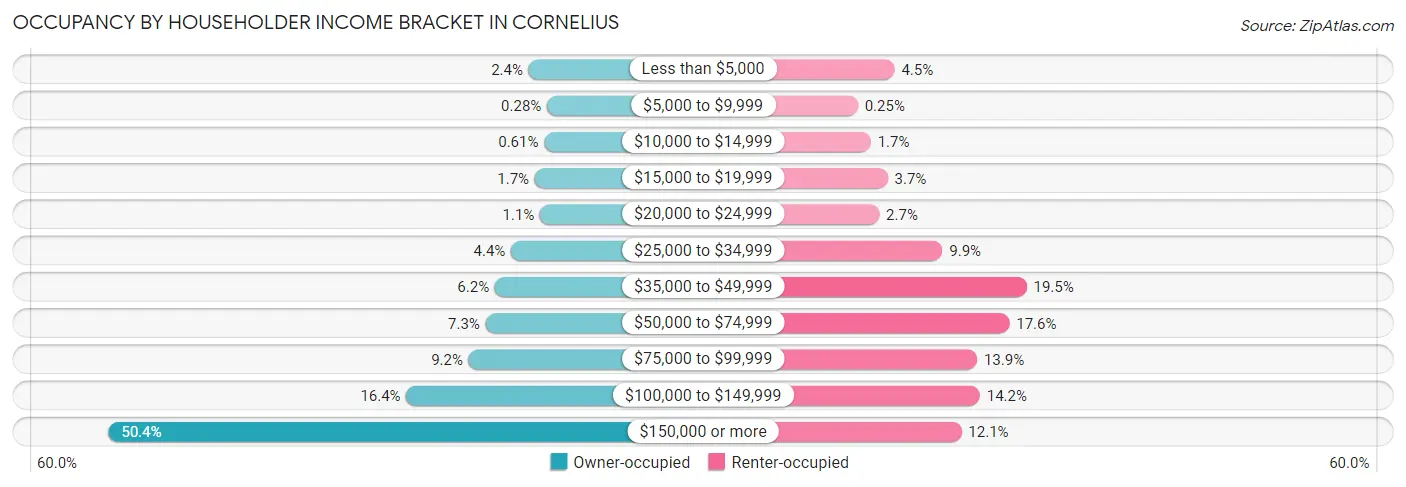
| Income Bracket | Owner-occupied | Renter-occupied |
| Less than $5,000 | 222 (2.4%) | 180 (4.4%) |
| $5,000 to $9,999 | 26 (0.3%) | 10 (0.3%) |
| $10,000 to $14,999 | 57 (0.6%) | 70 (1.7%) |
| $15,000 to $19,999 | 156 (1.7%) | 148 (3.7%) |
| $20,000 to $24,999 | 101 (1.1%) | 109 (2.7%) |
| $25,000 to $34,999 | 409 (4.4%) | 401 (9.9%) |
| $35,000 to $49,999 | 581 (6.2%) | 790 (19.5%) |
| $50,000 to $74,999 | 681 (7.3%) | 710 (17.6%) |
| $75,000 to $99,999 | 859 (9.2%) | 561 (13.9%) |
| $100,000 to $149,999 | 1,523 (16.4%) | 574 (14.2%) |
| $150,000 or more | 4,695 (50.4%) | 489 (12.1%) |
| Total | 9,310 (100.0%) | 4,042 (100.0%) |
Monthly Housing Cost Tiers in Cornelius
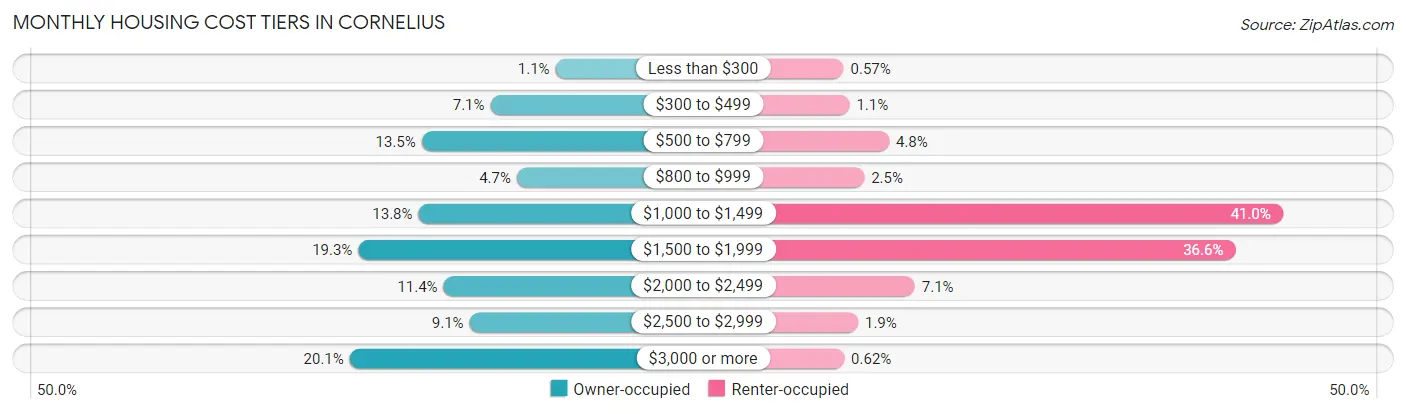
| Monthly Cost | Owner-occupied | Renter-occupied |
| Less than $300 | 105 (1.1%) | 23 (0.6%) |
| $300 to $499 | 663 (7.1%) | 45 (1.1%) |
| $500 to $799 | 1,252 (13.5%) | 192 (4.8%) |
| $800 to $999 | 437 (4.7%) | 100 (2.5%) |
| $1,000 to $1,499 | 1,280 (13.8%) | 1,657 (41.0%) |
| $1,500 to $1,999 | 1,796 (19.3%) | 1,480 (36.6%) |
| $2,000 to $2,499 | 1,065 (11.4%) | 288 (7.1%) |
| $2,500 to $2,999 | 843 (9.0%) | 77 (1.9%) |
| $3,000 or more | 1,869 (20.1%) | 25 (0.6%) |
| Total | 9,310 (100.0%) | 4,042 (100.0%) |
Physical Housing Characteristics in Cornelius
Housing Structures in Cornelius
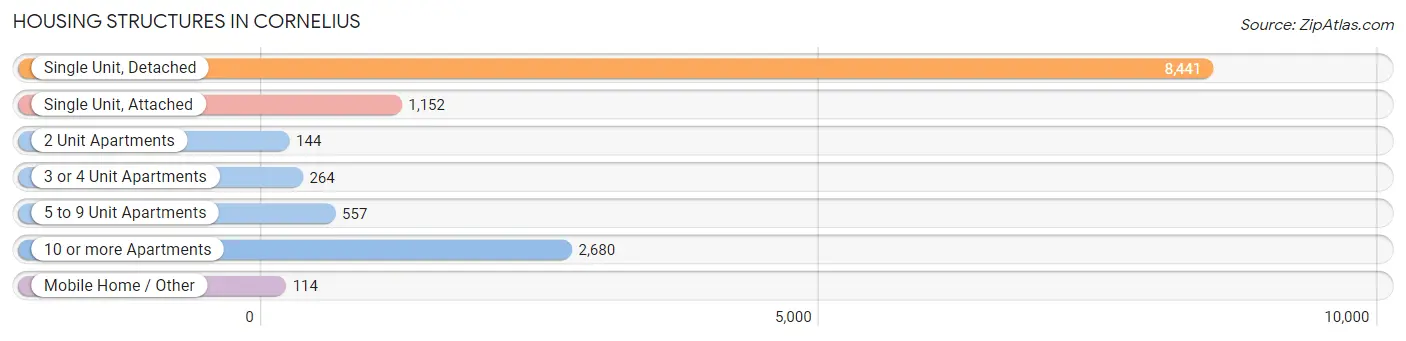
| Structure Type | # Housing Units | % Housing Units |
| Single Unit, Detached | 8,441 | 63.2% |
| Single Unit, Attached | 1,152 | 8.6% |
| 2 Unit Apartments | 144 | 1.1% |
| 3 or 4 Unit Apartments | 264 | 2.0% |
| 5 to 9 Unit Apartments | 557 | 4.2% |
| 10 or more Apartments | 2,680 | 20.1% |
| Mobile Home / Other | 114 | 0.9% |
| Total | 13,352 | 100.0% |
Housing Structures by Occupancy in Cornelius
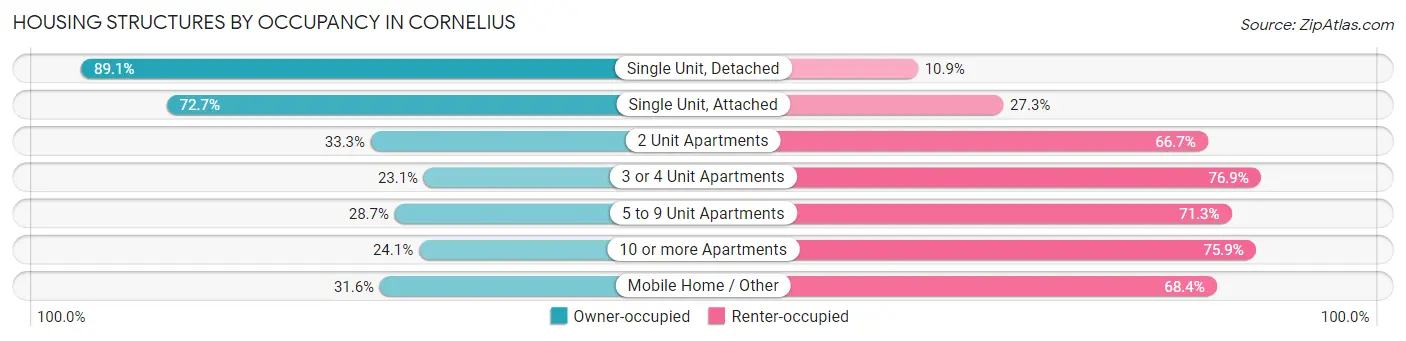
| Structure Type | Owner-occupied | Renter-occupied |
| Single Unit, Detached | 7,523 (89.1%) | 918 (10.9%) |
| Single Unit, Attached | 837 (72.7%) | 315 (27.3%) |
| 2 Unit Apartments | 48 (33.3%) | 96 (66.7%) |
| 3 or 4 Unit Apartments | 61 (23.1%) | 203 (76.9%) |
| 5 to 9 Unit Apartments | 160 (28.7%) | 397 (71.3%) |
| 10 or more Apartments | 645 (24.1%) | 2,035 (75.9%) |
| Mobile Home / Other | 36 (31.6%) | 78 (68.4%) |
| Total | 9,310 (69.7%) | 4,042 (30.3%) |
Housing Structures by Number of Rooms in Cornelius
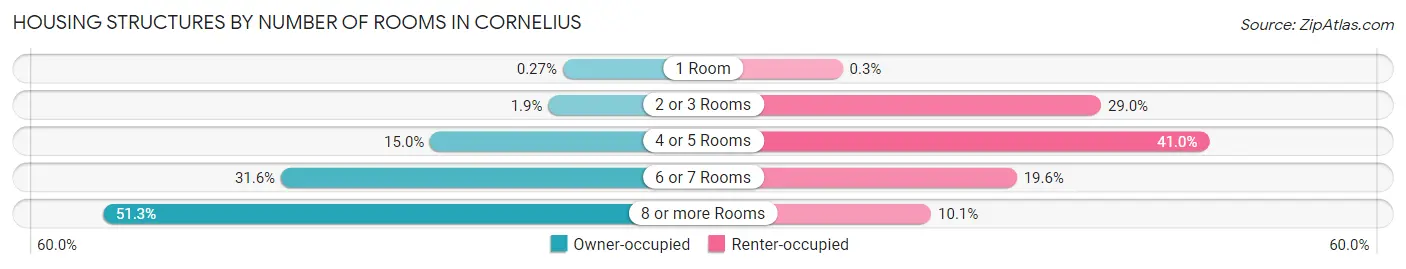
| Number of Rooms | Owner-occupied | Renter-occupied |
| 1 Room | 25 (0.3%) | 12 (0.3%) |
| 2 or 3 Rooms | 175 (1.9%) | 1,171 (29.0%) |
| 4 or 5 Rooms | 1,396 (15.0%) | 1,657 (41.0%) |
| 6 or 7 Rooms | 2,937 (31.6%) | 793 (19.6%) |
| 8 or more Rooms | 4,777 (51.3%) | 409 (10.1%) |
| Total | 9,310 (100.0%) | 4,042 (100.0%) |
Housing Structure by Heating Type in Cornelius
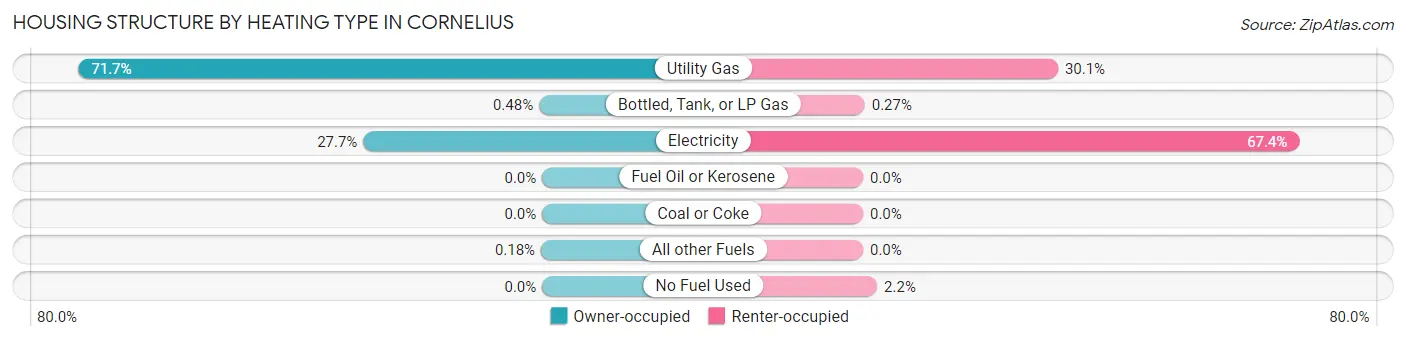
| Heating Type | Owner-occupied | Renter-occupied |
| Utility Gas | 6,673 (71.7%) | 1,218 (30.1%) |
| Bottled, Tank, or LP Gas | 45 (0.5%) | 11 (0.3%) |
| Electricity | 2,575 (27.7%) | 2,725 (67.4%) |
| Fuel Oil or Kerosene | 0 (0.0%) | 0 (0.0%) |
| Coal or Coke | 0 (0.0%) | 0 (0.0%) |
| All other Fuels | 17 (0.2%) | 0 (0.0%) |
| No Fuel Used | 0 (0.0%) | 88 (2.2%) |
| Total | 9,310 (100.0%) | 4,042 (100.0%) |
Household Vehicle Usage in Cornelius
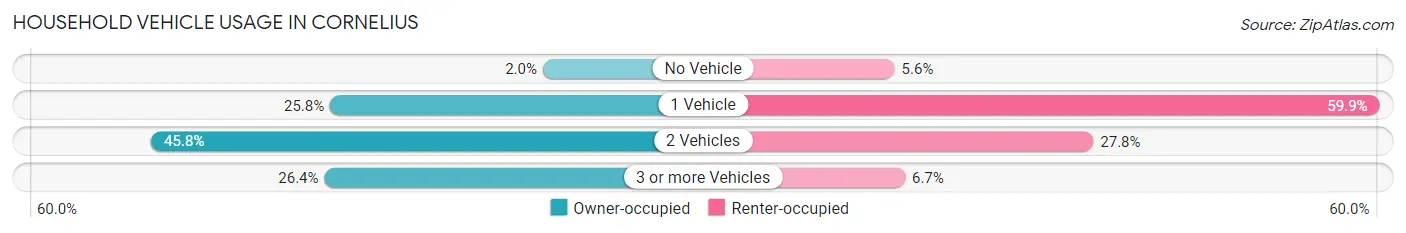
| Vehicles per Household | Owner-occupied | Renter-occupied |
| No Vehicle | 182 (1.9%) | 225 (5.6%) |
| 1 Vehicle | 2,400 (25.8%) | 2,420 (59.9%) |
| 2 Vehicles | 4,268 (45.8%) | 1,125 (27.8%) |
| 3 or more Vehicles | 2,460 (26.4%) | 272 (6.7%) |
| Total | 9,310 (100.0%) | 4,042 (100.0%) |
Real Estate & Mortgages in Cornelius
Real Estate and Mortgage Overview in Cornelius
| Characteristic | Without Mortgage | With Mortgage |
| Housing Units | 2,693 | 6,617 |
| Median Property Value | $438,600 | $455,400 |
| Median Household Income | $114,338 | $3,784 |
| Monthly Housing Costs | $659 | $1,741 |
| Real Estate Taxes | $3,417 | $44 |
Property Value by Mortgage Status in Cornelius
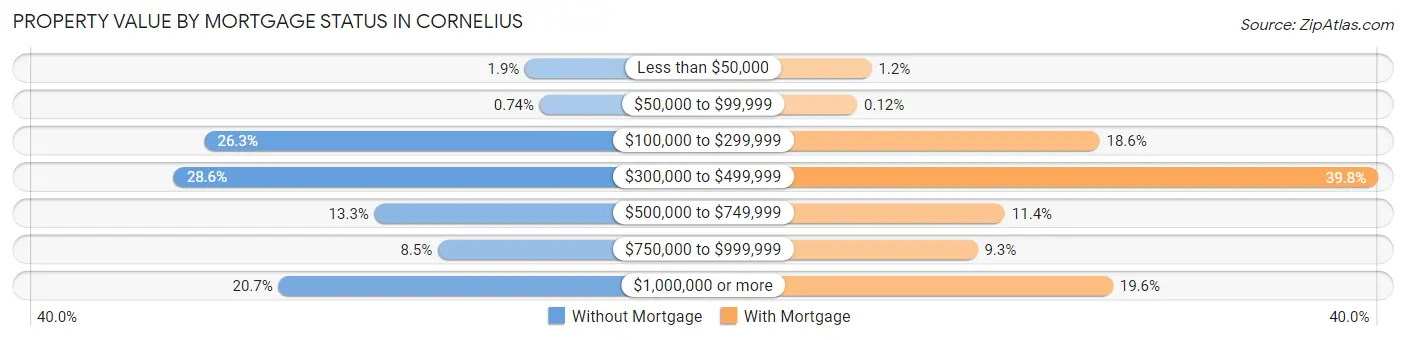
| Property Value | Without Mortgage | With Mortgage |
| Less than $50,000 | 50 (1.9%) | 80 (1.2%) |
| $50,000 to $99,999 | 20 (0.7%) | 8 (0.1%) |
| $100,000 to $299,999 | 708 (26.3%) | 1,230 (18.6%) |
| $300,000 to $499,999 | 771 (28.6%) | 2,634 (39.8%) |
| $500,000 to $749,999 | 359 (13.3%) | 753 (11.4%) |
| $750,000 to $999,999 | 229 (8.5%) | 615 (9.3%) |
| $1,000,000 or more | 556 (20.6%) | 1,297 (19.6%) |
| Total | 2,693 (100.0%) | 6,617 (100.0%) |
Household Income by Mortgage Status in Cornelius
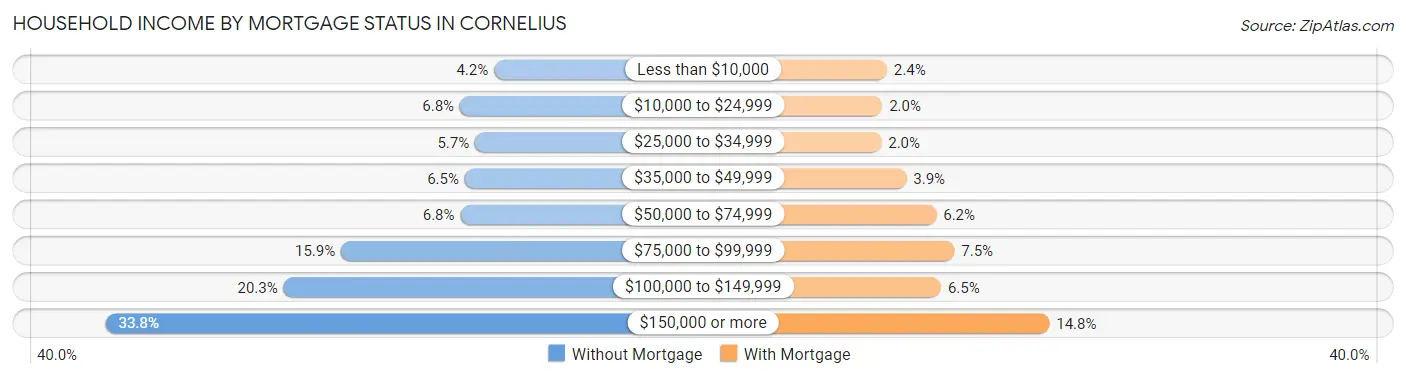
| Household Income | Without Mortgage | With Mortgage |
| Less than $10,000 | 114 (4.2%) | 158 (2.4%) |
| $10,000 to $24,999 | 184 (6.8%) | 134 (2.0%) |
| $25,000 to $34,999 | 153 (5.7%) | 130 (2.0%) |
| $35,000 to $49,999 | 174 (6.5%) | 256 (3.9%) |
| $50,000 to $74,999 | 183 (6.8%) | 407 (6.1%) |
| $75,000 to $99,999 | 428 (15.9%) | 498 (7.5%) |
| $100,000 to $149,999 | 546 (20.3%) | 431 (6.5%) |
| $150,000 or more | 911 (33.8%) | 977 (14.8%) |
| Total | 2,693 (100.0%) | 6,617 (100.0%) |
Property Value to Household Income Ratio in Cornelius
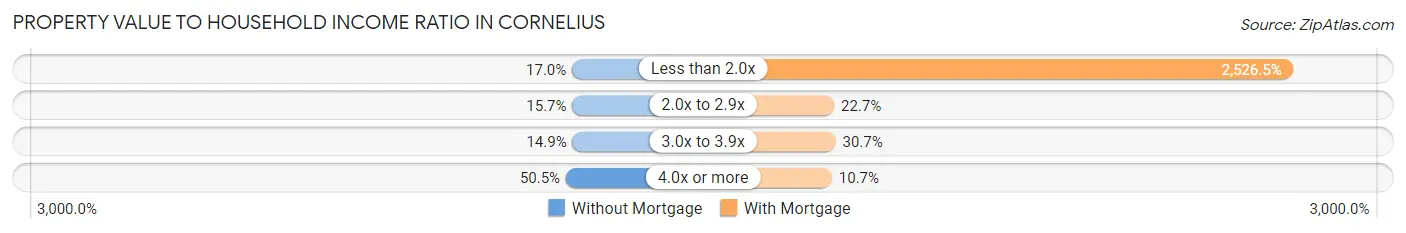
| Value-to-Income Ratio | Without Mortgage | With Mortgage |
| Less than 2.0x | 458 (17.0%) | 167,176 (2,526.5%) |
| 2.0x to 2.9x | 424 (15.7%) | 1,499 (22.7%) |
| 3.0x to 3.9x | 400 (14.8%) | 2,029 (30.7%) |
| 4.0x or more | 1,361 (50.5%) | 710 (10.7%) |
| Total | 2,693 (100.0%) | 6,617 (100.0%) |
Real Estate Taxes by Mortgage Status in Cornelius
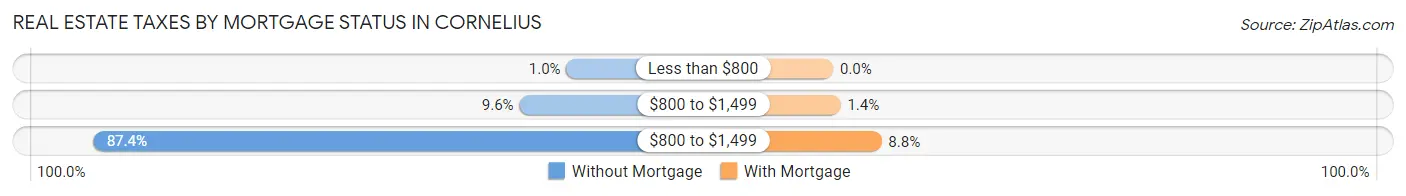
| Property Taxes | Without Mortgage | With Mortgage |
| Less than $800 | 28 (1.0%) | 0 (0.0%) |
| $800 to $1,499 | 259 (9.6%) | 89 (1.3%) |
| $800 to $1,499 | 2,353 (87.4%) | 584 (8.8%) |
| Total | 2,693 (100.0%) | 6,617 (100.0%) |
Health & Disability in Cornelius
Health Insurance Coverage by Age in Cornelius
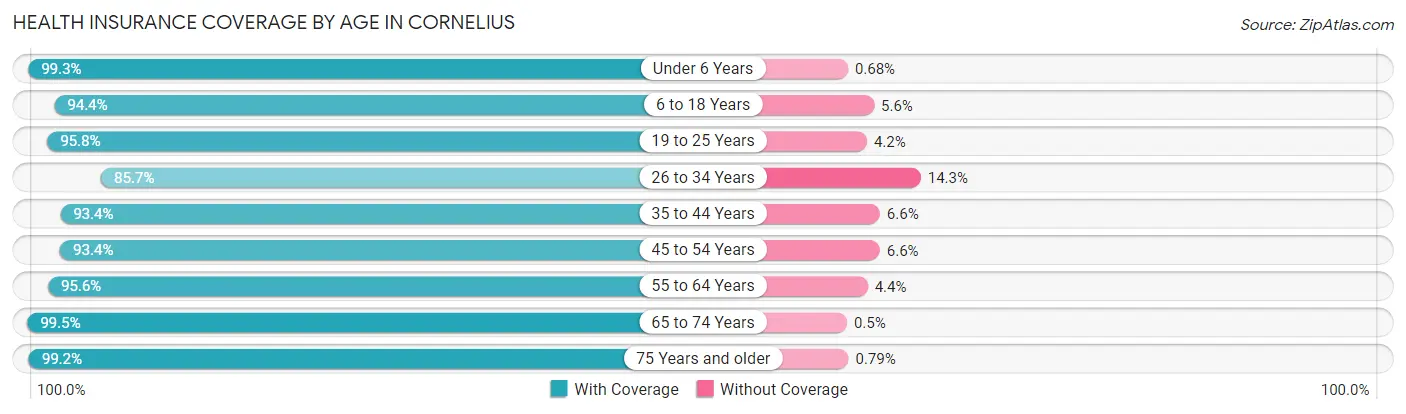
| Age Bracket | With Coverage | Without Coverage |
| Under 6 Years | 1,595 (99.3%) | 11 (0.7%) |
| 6 to 18 Years | 5,279 (94.4%) | 311 (5.6%) |
| 19 to 25 Years | 1,855 (95.8%) | 82 (4.2%) |
| 26 to 34 Years | 2,405 (85.7%) | 400 (14.3%) |
| 35 to 44 Years | 3,869 (93.4%) | 275 (6.6%) |
| 45 to 54 Years | 4,551 (93.4%) | 323 (6.6%) |
| 55 to 64 Years | 4,362 (95.6%) | 199 (4.4%) |
| 65 to 74 Years | 3,569 (99.5%) | 18 (0.5%) |
| 75 Years and older | 2,274 (99.2%) | 18 (0.8%) |
| Total | 29,759 (94.8%) | 1,637 (5.2%) |
Health Insurance Coverage by Citizenship Status in Cornelius
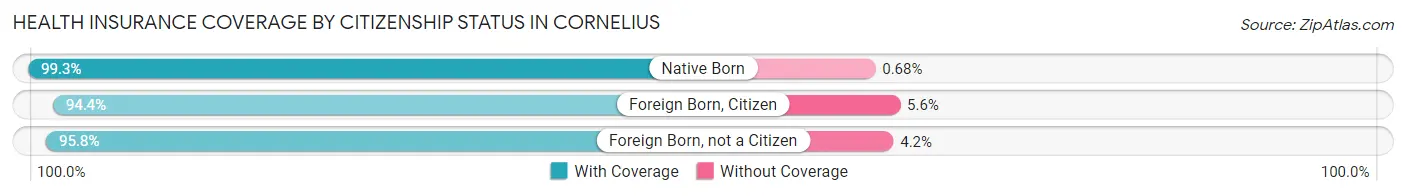
| Citizenship Status | With Coverage | Without Coverage |
| Native Born | 1,595 (99.3%) | 11 (0.7%) |
| Foreign Born, Citizen | 5,279 (94.4%) | 311 (5.6%) |
| Foreign Born, not a Citizen | 1,855 (95.8%) | 82 (4.2%) |
Health Insurance Coverage by Household Income in Cornelius
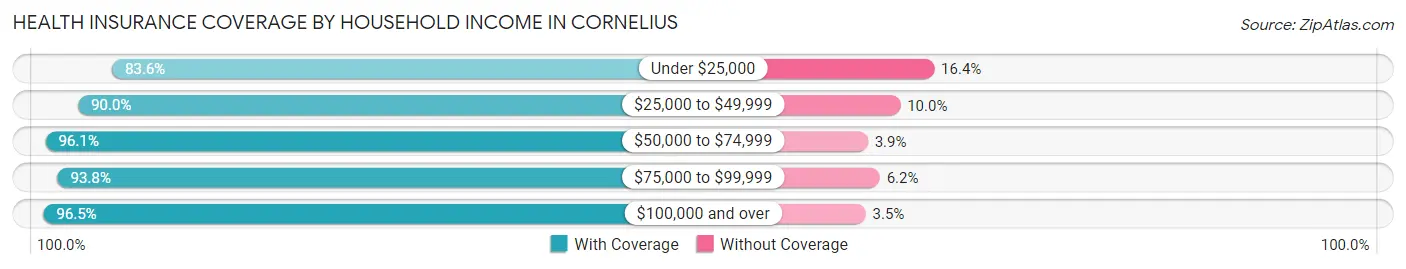
| Household Income | With Coverage | Without Coverage |
| Under $25,000 | 1,267 (83.6%) | 248 (16.4%) |
| $25,000 to $49,999 | 3,409 (90.0%) | 379 (10.0%) |
| $50,000 to $74,999 | 2,896 (96.1%) | 118 (3.9%) |
| $75,000 to $99,999 | 2,724 (93.8%) | 179 (6.2%) |
| $100,000 and over | 19,459 (96.5%) | 713 (3.5%) |
Public vs Private Health Insurance Coverage by Age in Cornelius
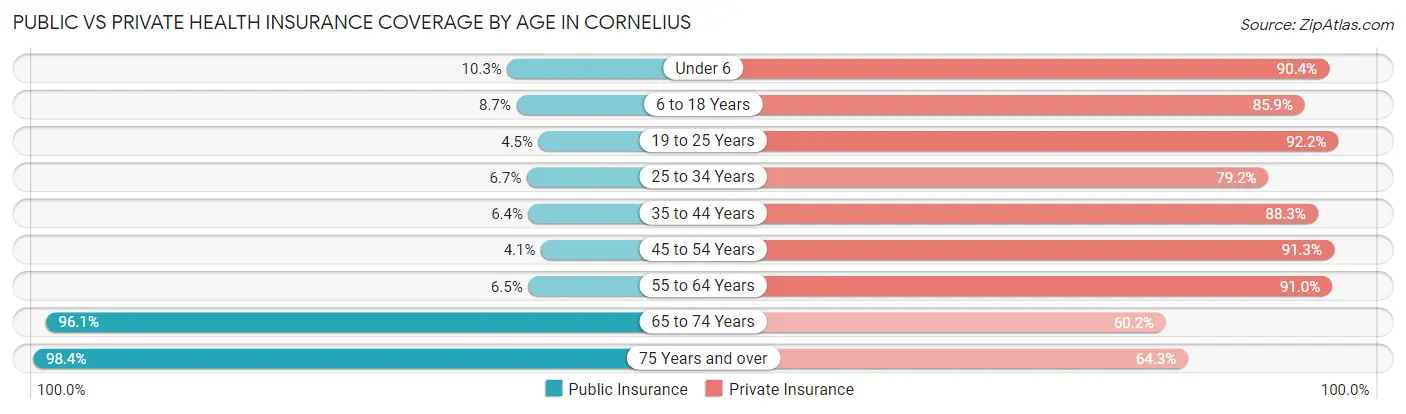
| Age Bracket | Public Insurance | Private Insurance |
| Under 6 | 166 (10.3%) | 1,452 (90.4%) |
| 6 to 18 Years | 486 (8.7%) | 4,804 (85.9%) |
| 19 to 25 Years | 88 (4.5%) | 1,785 (92.1%) |
| 25 to 34 Years | 188 (6.7%) | 2,221 (79.2%) |
| 35 to 44 Years | 266 (6.4%) | 3,660 (88.3%) |
| 45 to 54 Years | 200 (4.1%) | 4,451 (91.3%) |
| 55 to 64 Years | 295 (6.5%) | 4,150 (91.0%) |
| 65 to 74 Years | 3,447 (96.1%) | 2,158 (60.2%) |
| 75 Years and over | 2,256 (98.4%) | 1,473 (64.3%) |
| Total | 7,392 (23.5%) | 26,154 (83.3%) |
Disability Status by Sex by Age in Cornelius
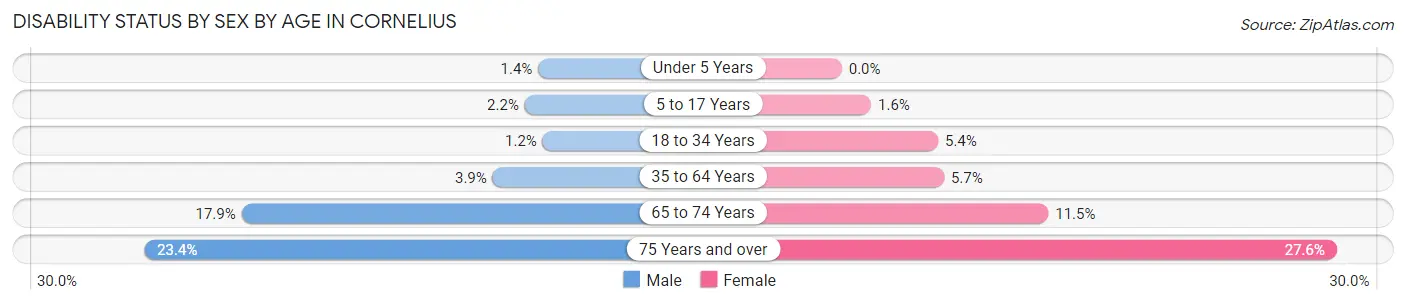
| Age Bracket | Male | Female |
| Under 5 Years | 8 (1.4%) | 0 (0.0%) |
| 5 to 17 Years | 57 (2.1%) | 49 (1.6%) |
| 18 to 34 Years | 31 (1.1%) | 126 (5.4%) |
| 35 to 64 Years | 249 (3.9%) | 413 (5.7%) |
| 65 to 74 Years | 275 (17.9%) | 236 (11.5%) |
| 75 Years and over | 237 (23.4%) | 352 (27.6%) |
Disability Class by Sex by Age in Cornelius
Disability Class: Hearing Difficulty
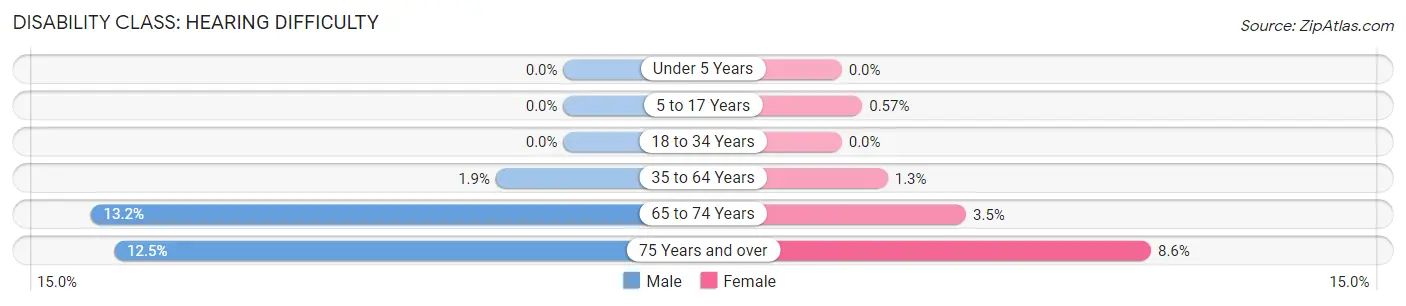
| Age Bracket | Male | Female |
| Under 5 Years | 0 (0.0%) | 0 (0.0%) |
| 5 to 17 Years | 0 (0.0%) | 17 (0.6%) |
| 18 to 34 Years | 0 (0.0%) | 0 (0.0%) |
| 35 to 64 Years | 119 (1.9%) | 93 (1.3%) |
| 65 to 74 Years | 202 (13.2%) | 71 (3.5%) |
| 75 Years and over | 127 (12.5%) | 110 (8.6%) |
Disability Class: Vision Difficulty
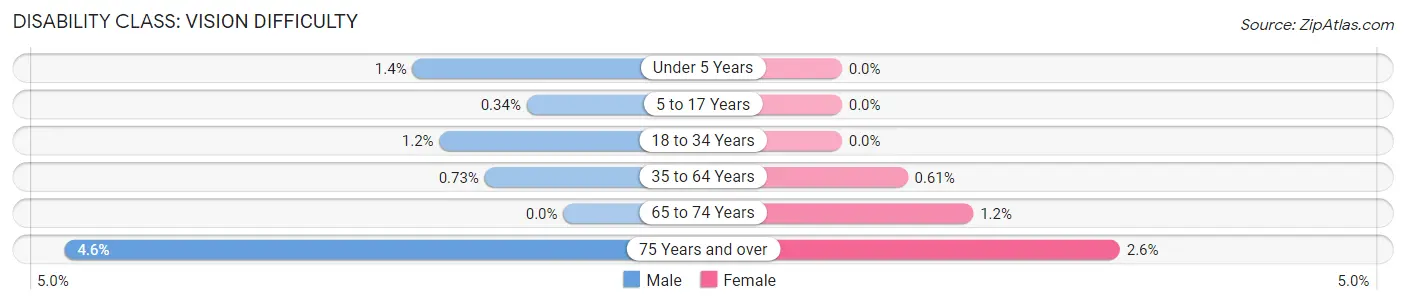
| Age Bracket | Male | Female |
| Under 5 Years | 8 (1.4%) | 0 (0.0%) |
| 5 to 17 Years | 9 (0.3%) | 0 (0.0%) |
| 18 to 34 Years | 31 (1.1%) | 0 (0.0%) |
| 35 to 64 Years | 46 (0.7%) | 44 (0.6%) |
| 65 to 74 Years | 0 (0.0%) | 25 (1.2%) |
| 75 Years and over | 47 (4.6%) | 33 (2.6%) |
Disability Class: Cognitive Difficulty
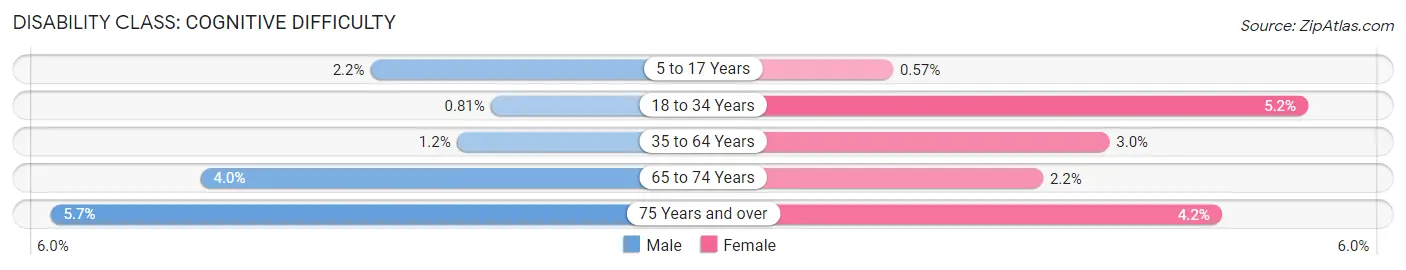
| Age Bracket | Male | Female |
| 5 to 17 Years | 57 (2.1%) | 17 (0.6%) |
| 18 to 34 Years | 22 (0.8%) | 122 (5.2%) |
| 35 to 64 Years | 75 (1.2%) | 216 (3.0%) |
| 65 to 74 Years | 62 (4.0%) | 46 (2.2%) |
| 75 Years and over | 58 (5.7%) | 54 (4.2%) |
Disability Class: Ambulatory Difficulty
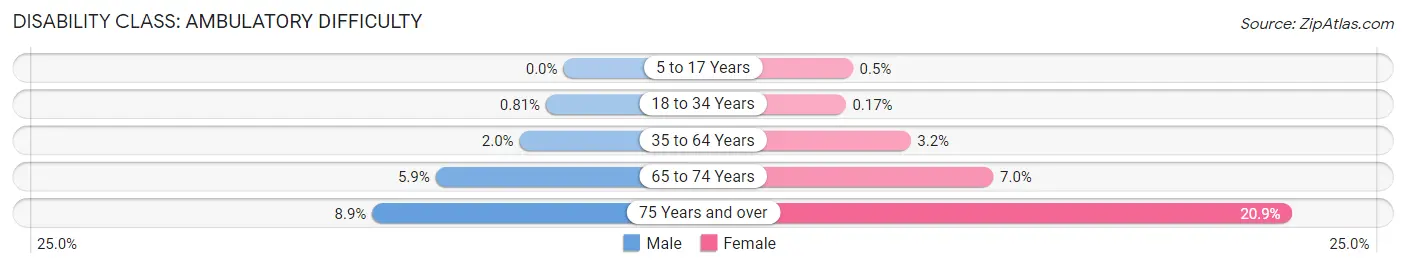
| Age Bracket | Male | Female |
| 5 to 17 Years | 0 (0.0%) | 15 (0.5%) |
| 18 to 34 Years | 22 (0.8%) | 4 (0.2%) |
| 35 to 64 Years | 129 (2.0%) | 231 (3.2%) |
| 65 to 74 Years | 91 (5.9%) | 144 (7.0%) |
| 75 Years and over | 90 (8.9%) | 267 (20.9%) |
Disability Class: Self-Care Difficulty
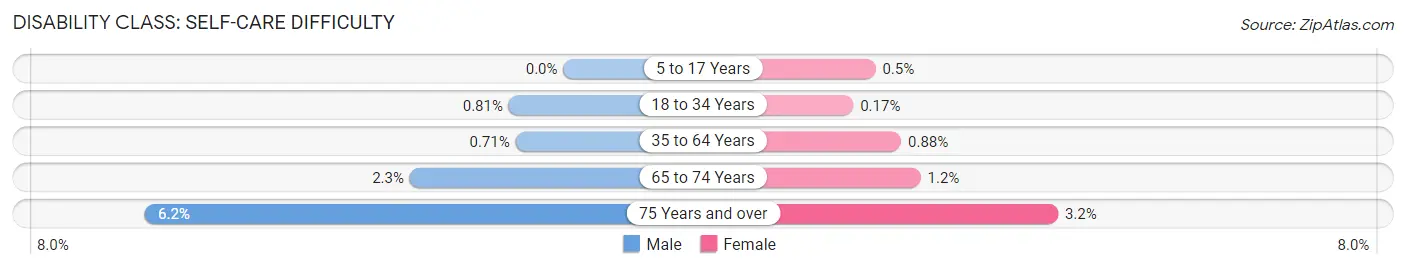
| Age Bracket | Male | Female |
| 5 to 17 Years | 0 (0.0%) | 15 (0.5%) |
| 18 to 34 Years | 22 (0.8%) | 4 (0.2%) |
| 35 to 64 Years | 45 (0.7%) | 64 (0.9%) |
| 65 to 74 Years | 35 (2.3%) | 24 (1.2%) |
| 75 Years and over | 63 (6.2%) | 41 (3.2%) |
Technology Access in Cornelius
Computing Device Access in Cornelius
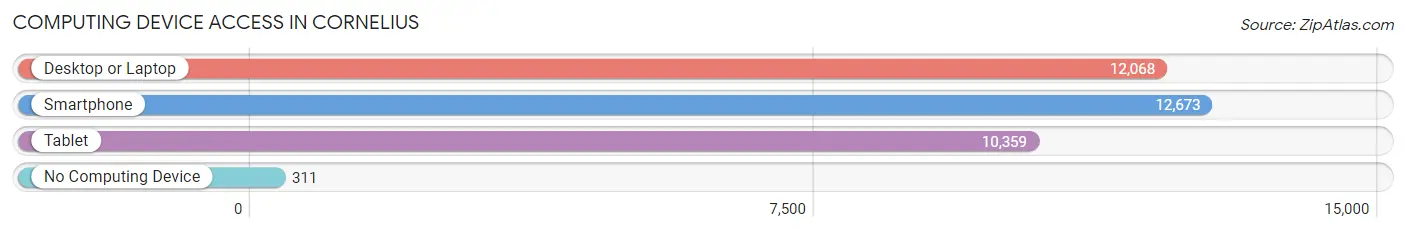
| Device Type | # Households | % Households |
| Desktop or Laptop | 12,068 | 90.4% |
| Smartphone | 12,673 | 94.9% |
| Tablet | 10,359 | 77.6% |
| No Computing Device | 311 | 2.3% |
| Total | 13,352 | 100.0% |
Internet Access in Cornelius
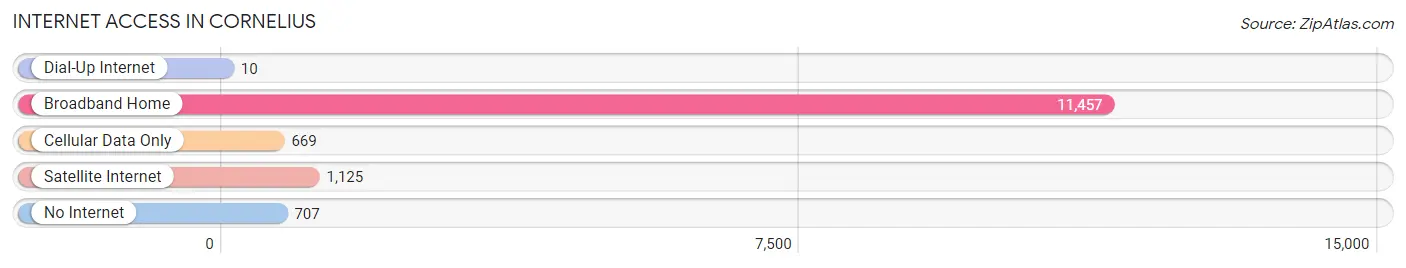
| Internet Type | # Households | % Households |
| Dial-Up Internet | 10 | 0.1% |
| Broadband Home | 11,457 | 85.8% |
| Cellular Data Only | 669 | 5.0% |
| Satellite Internet | 1,125 | 8.4% |
| No Internet | 707 | 5.3% |
| Total | 13,352 | 100.0% |
Cornelius Summary
Cornelius, NC is a small town located in Mecklenburg County, North Carolina. It is situated on the west side of Lake Norman, a large man-made lake created in the 1960s. The town was incorporated in 1905 and has a population of approximately 25,000 people.
Geography
Cornelius is located in the Piedmont region of North Carolina, approximately 20 miles north of Charlotte. The town is situated on the west side of Lake Norman, a large man-made lake created in the 1960s. The lake is the largest body of water in the state and is a popular destination for fishing, boating, and other recreational activities. The town is bordered by Huntersville to the north, Davidson to the east, and Charlotte to the south.
Economy
Cornelius is a small town with a diverse economy. The town is home to a variety of businesses, including retail stores, restaurants, and professional services. The town is also home to several large employers, including Lowe’s Home Improvement, Novant Health, and Duke Energy. The town is also home to several small businesses, including craft breweries, wineries, and distilleries.
Demographics
As of the 2010 census, the population of Cornelius was 25,000. The town is predominantly white, with a population that is approximately 75% white and 25% African American. The median household income is $68,000, and the median age is 38. The town is also home to a large Hispanic population, with approximately 10% of the population identifying as Hispanic or Latino.
History
Cornelius was first settled in the late 1700s by German and Scots-Irish immigrants. The town was originally known as “Little Cedar” and was renamed in honor of a local Revolutionary War hero, Colonel William Cornelius. The town was officially incorporated in 1905 and has since grown to become a thriving community.
In the 1960s, the construction of Lake Norman transformed the area and brought new economic opportunities to the town. The lake is now a popular destination for fishing, boating, and other recreational activities. In recent years, the town has seen an influx of new businesses and residents, making it a desirable place to live and work.
Conclusion
Cornelius, NC is a small town located in Mecklenburg County, North Carolina. It is situated on the west side of Lake Norman, a large man-made lake created in the 1960s. The town was incorporated in 1905 and has a population of approximately 25,000 people. The town is predominantly white, with a population that is approximately 75% white and 25% African American. The town is home to a variety of businesses, including retail stores, restaurants, and professional services. The town is also home to several large employers, including Lowe’s Home Improvement, Novant Health, and Duke Energy. The town is also home to several small businesses, including craft breweries, wineries, and distilleries. Cornelius is a thriving community with a diverse economy and a rich history.
Common Questions
What is Per Capita Income in Cornelius?
Per Capita income in Cornelius is $75,101.
What is the Median Family Income in Cornelius?
Median Family Income in Cornelius is $151,619.
What is the Median Household income in Cornelius?
Median Household Income in Cornelius is $107,969.
What is Income or Wage Gap in Cornelius?
Income or Wage Gap in Cornelius is 45.4%.
Women in Cornelius earn 54.6 cents for every dollar earned by a man.
What is Family Income Deficit in Cornelius?
Family Income Deficit in Cornelius is $7,596.
Families that are below poverty line in Cornelius earn $7,596 less on average than the poverty threshold level.
What is Inequality or Gini Index in Cornelius?
Inequality or Gini Index in Cornelius is 0.52.
What is the Total Population of Cornelius?
Total Population of Cornelius is 31,396.
What is the Total Male Population of Cornelius?
Total Male Population of Cornelius is 14,793.
What is the Total Female Population of Cornelius?
Total Female Population of Cornelius is 16,603.
What is the Ratio of Males per 100 Females in Cornelius?
There are 89.10 Males per 100 Females in Cornelius.
What is the Ratio of Females per 100 Males in Cornelius?
There are 112.24 Females per 100 Males in Cornelius.
What is the Median Population Age in Cornelius?
Median Population Age in Cornelius is 44.3 Years.
What is the Average Family Size in Cornelius
Average Family Size in Cornelius is 2.9 People.
What is the Average Household Size in Cornelius
Average Household Size in Cornelius is 2.4 People.
How Large is the Labor Force in Cornelius?
There are 16,684 People in the Labor Forcein in Cornelius.
What is the Percentage of People in the Labor Force in Cornelius?
65.5% of People are in the Labor Force in Cornelius.
What is the Unemployment Rate in Cornelius?
Unemployment Rate in Cornelius is 3.4%.