Grandview, MO Map & Demographics
Grandview Map
Grandview Overview
$28,151
PER CAPITA INCOME
$61,456
AVG FAMILY INCOME
$51,048
AVG HOUSEHOLD INCOME
17.0%
WAGE / INCOME GAP [ % ]
83.0¢/ $1
WAGE / INCOME GAP [ $ ]
$11,336
FAMILY INCOME DEFICIT
0.42
INEQUALITY / GINI INDEX
25,921
TOTAL POPULATION
12,452
MALE POPULATION
13,469
FEMALE POPULATION
92.45
MALES / 100 FEMALES
108.17
FEMALES / 100 MALES
35.9
MEDIAN AGE
3.1
AVG FAMILY SIZE
2.3
AVG HOUSEHOLD SIZE
13,806
LABOR FORCE [ PEOPLE ]
67.2%
PERCENT IN LABOR FORCE
6.4%
UNEMPLOYMENT RATE
Grandview Zip Codes
Grandview Area Codes
Income in Grandview
Income Overview in Grandview
Per Capita Income in Grandview is $28,151, while median incomes of families and households are $61,456 and $51,048 respectively.
| Characteristic | Number | Measure |
| Per Capita Income | 25,921 | $28,151 |
| Median Family Income | 5,891 | $61,456 |
| Mean Family Income | 5,891 | $74,674 |
| Median Household Income | 11,159 | $51,048 |
| Mean Household Income | 11,159 | $64,483 |
| Income Deficit | 5,891 | $11,336 |
| Wage / Income Gap (%) | 25,921 | 16.96% |
| Wage / Income Gap ($) | 25,921 | 83.04¢ per $1 |
| Gini / Inequality Index | 25,921 | 0.42 |
Earnings by Sex in Grandview
Average Earnings in Grandview are $34,600, $38,352 for men and $31,846 for women, a difference of 17.0%.
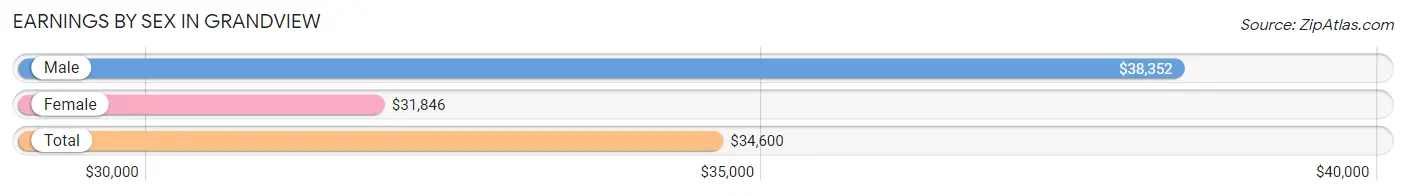
| Sex | Number | Average Earnings |
| Male | 7,258 (51.0%) | $38,352 |
| Female | 6,960 (48.9%) | $31,846 |
| Total | 14,218 (100.0%) | $34,600 |
Earnings by Sex by Income Bracket in Grandview
The most common earnings brackets in Grandview are $55,000 to $64,999 for men (672 | 9.3%) and $30,000 to $34,999 for women (716 | 10.3%).
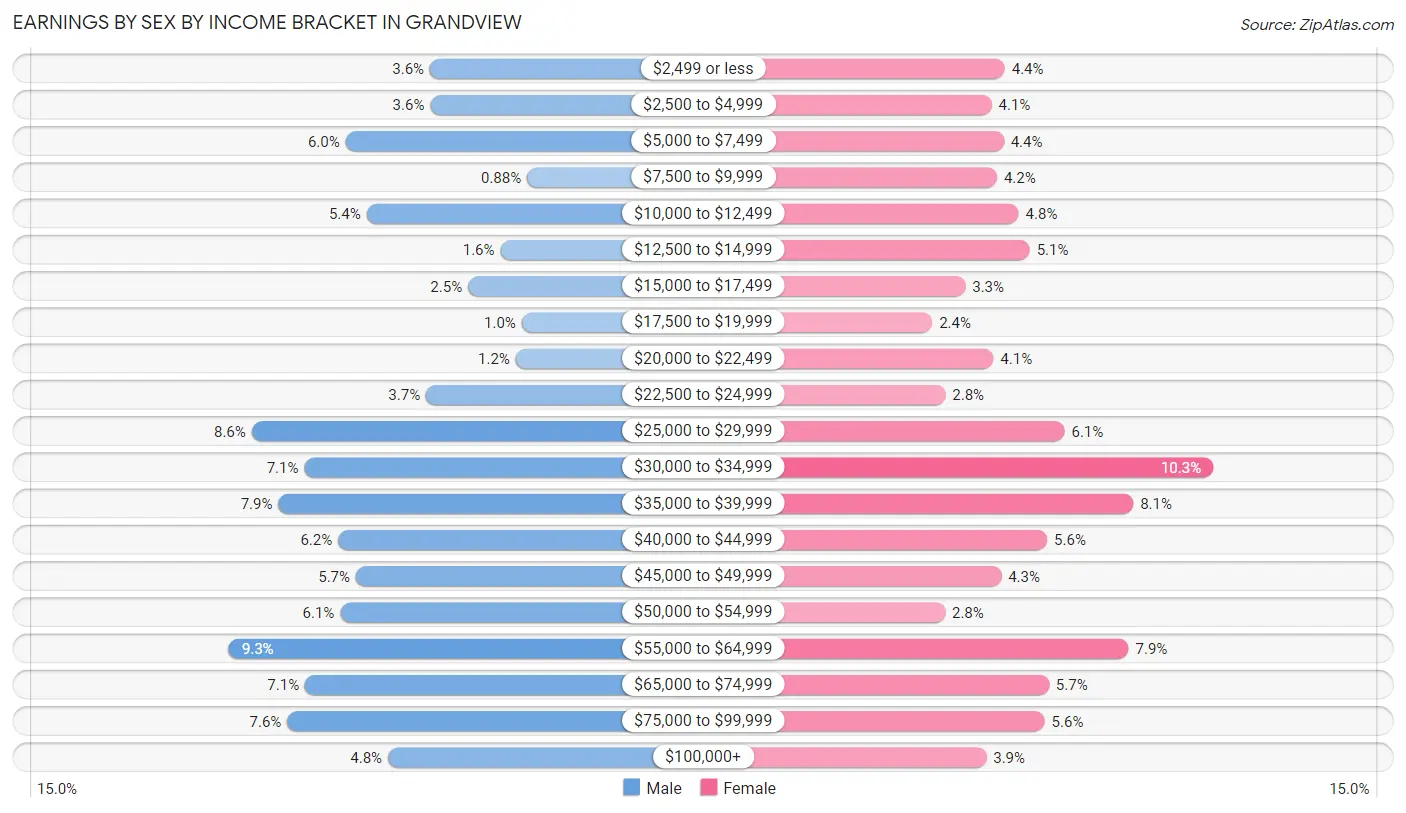
| Income | Male | Female |
| $2,499 or less | 262 (3.6%) | 309 (4.4%) |
| $2,500 to $4,999 | 261 (3.6%) | 283 (4.1%) |
| $5,000 to $7,499 | 434 (6.0%) | 307 (4.4%) |
| $7,500 to $9,999 | 64 (0.9%) | 294 (4.2%) |
| $10,000 to $12,499 | 391 (5.4%) | 336 (4.8%) |
| $12,500 to $14,999 | 118 (1.6%) | 358 (5.1%) |
| $15,000 to $17,499 | 184 (2.5%) | 232 (3.3%) |
| $17,500 to $19,999 | 75 (1.0%) | 167 (2.4%) |
| $20,000 to $22,499 | 87 (1.2%) | 287 (4.1%) |
| $22,500 to $24,999 | 270 (3.7%) | 193 (2.8%) |
| $25,000 to $29,999 | 626 (8.6%) | 426 (6.1%) |
| $30,000 to $34,999 | 518 (7.1%) | 716 (10.3%) |
| $35,000 to $39,999 | 571 (7.9%) | 560 (8.1%) |
| $40,000 to $44,999 | 449 (6.2%) | 392 (5.6%) |
| $45,000 to $49,999 | 413 (5.7%) | 302 (4.3%) |
| $50,000 to $54,999 | 445 (6.1%) | 192 (2.8%) |
| $55,000 to $64,999 | 672 (9.3%) | 551 (7.9%) |
| $65,000 to $74,999 | 517 (7.1%) | 395 (5.7%) |
| $75,000 to $99,999 | 553 (7.6%) | 387 (5.6%) |
| $100,000+ | 348 (4.8%) | 273 (3.9%) |
| Total | 7,258 (100.0%) | 6,960 (100.0%) |
Earnings by Sex by Educational Attainment in Grandview
Average earnings in Grandview are $43,051 for men and $34,586 for women, a difference of 19.7%. Men with an educational attainment of bachelor's degree enjoy the highest average annual earnings of $60,328, while those with less than high school education earn the least with $33,872. Women with an educational attainment of graduate degree earn the most with the average annual earnings of $65,819, while those with college or associate's degree education have the smallest earnings of $30,014.
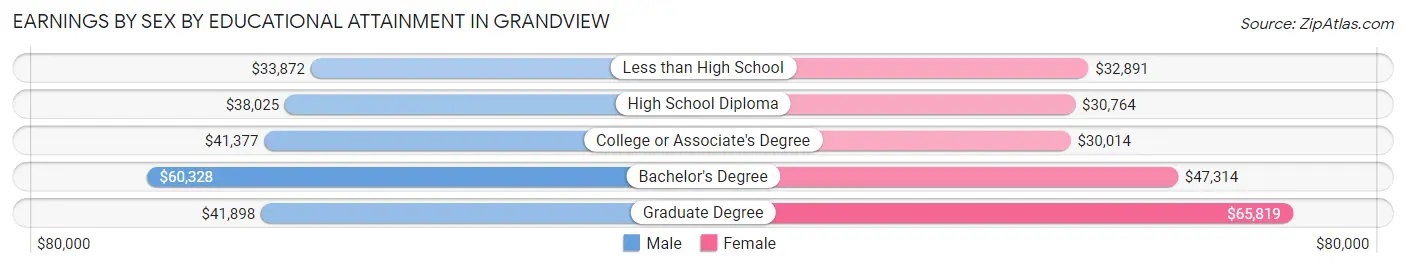
| Educational Attainment | Male Income | Female Income |
| Less than High School | $33,872 | $32,891 |
| High School Diploma | $38,025 | $30,764 |
| College or Associate's Degree | $41,377 | $30,014 |
| Bachelor's Degree | $60,328 | $47,314 |
| Graduate Degree | $41,898 | $65,819 |
| Total | $43,051 | $34,586 |
Family Income in Grandview
Family Income Brackets in Grandview
According to the Grandview family income data, there are 1,496 families falling into the $50,000 to $74,999 income range, which is the most common income bracket and makes up 25.4% of all families. Conversely, the $10,000 to $14,999 income bracket is the least frequent group with only 112 families (1.9%) belonging to this category.
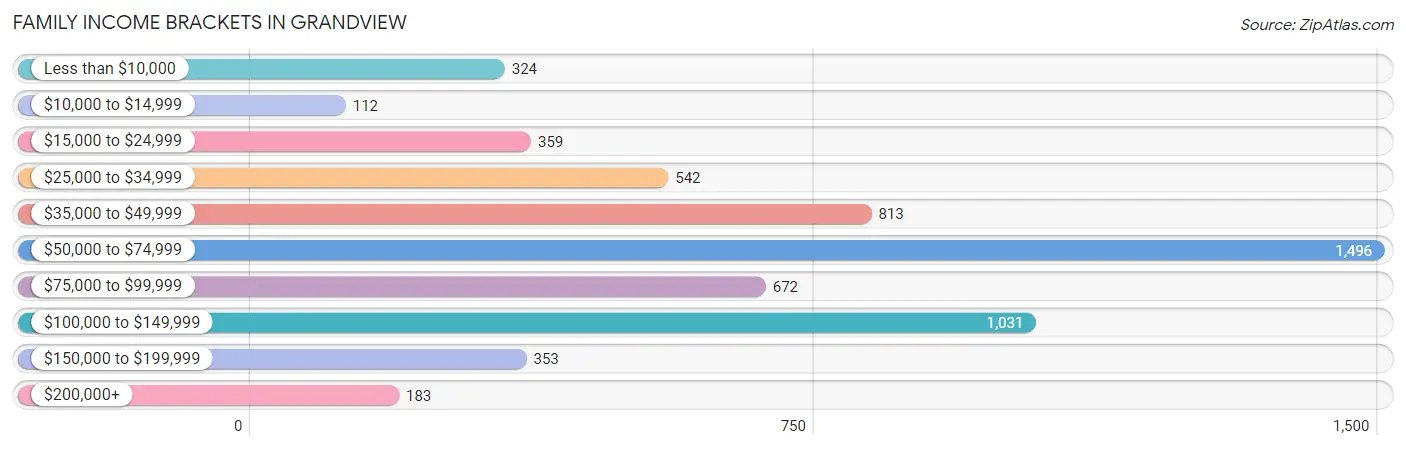
| Income Bracket | # Families | % Families |
| Less than $10,000 | 324 | 5.5% |
| $10,000 to $14,999 | 112 | 1.9% |
| $15,000 to $24,999 | 359 | 6.1% |
| $25,000 to $34,999 | 542 | 9.2% |
| $35,000 to $49,999 | 813 | 13.8% |
| $50,000 to $74,999 | 1,496 | 25.4% |
| $75,000 to $99,999 | 672 | 11.4% |
| $100,000 to $149,999 | 1,031 | 17.5% |
| $150,000 to $199,999 | 353 | 6.0% |
| $200,000+ | 183 | 3.1% |
Family Income by Famaliy Size in Grandview
7+ person families (118 | 2.0%) account for the highest median family income in Grandview with $135,143 per family, while 2-person families (2,989 | 50.7%) have the highest median income of $26,072 per family member.
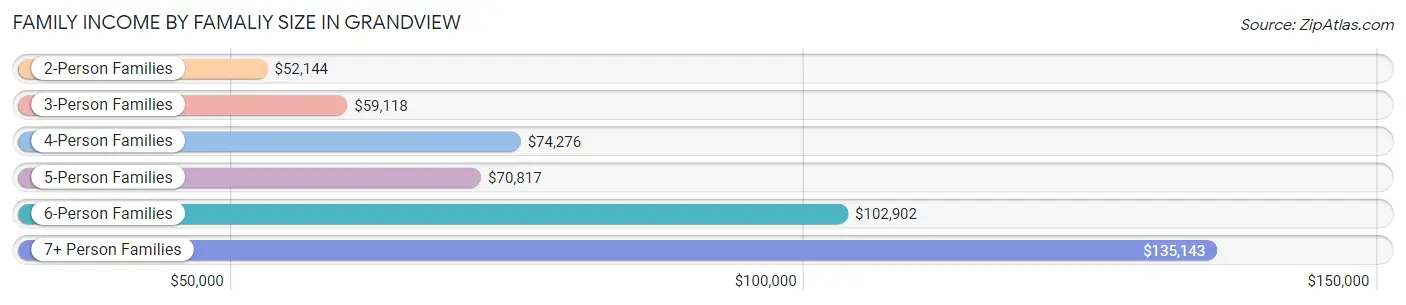
| Income Bracket | # Families | Median Income |
| 2-Person Families | 2,989 (50.7%) | $52,144 |
| 3-Person Families | 1,316 (22.3%) | $59,118 |
| 4-Person Families | 900 (15.3%) | $74,276 |
| 5-Person Families | 357 (6.1%) | $70,817 |
| 6-Person Families | 211 (3.6%) | $102,902 |
| 7+ Person Families | 118 (2.0%) | $135,143 |
| Total | 5,891 (100.0%) | $61,456 |
Family Income by Number of Earners in Grandview
The median family income in Grandview is $61,456, with families comprising 3+ earners (447) having the highest median family income of $128,208, while families with 1 earner (2,048) have the lowest median family income of $40,211, accounting for 7.6% and 34.8% of families, respectively.
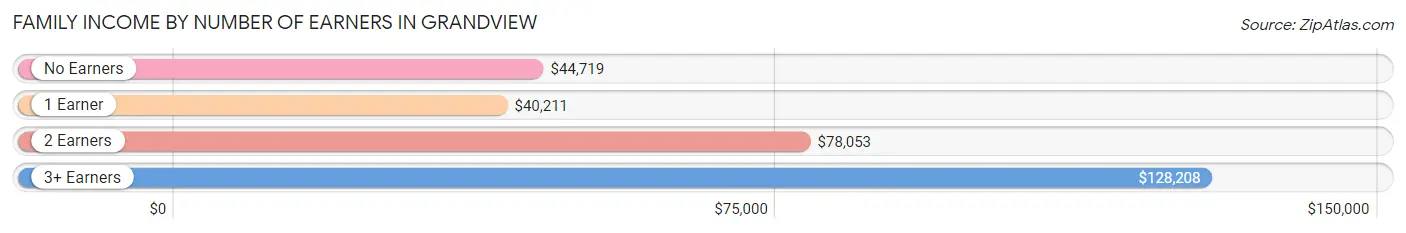
| Number of Earners | # Families | Median Income |
| No Earners | 859 (14.6%) | $44,719 |
| 1 Earner | 2,048 (34.8%) | $40,211 |
| 2 Earners | 2,537 (43.1%) | $78,053 |
| 3+ Earners | 447 (7.6%) | $128,208 |
| Total | 5,891 (100.0%) | $61,456 |
Household Income in Grandview
Household Income Brackets in Grandview
With 2,444 households falling in the category, the $50,000 to $74,999 income range is the most frequent in Grandview, accounting for 21.9% of all households. In contrast, only 312 households (2.8%) fall into the $200,000+ income bracket, making it the least populous group.
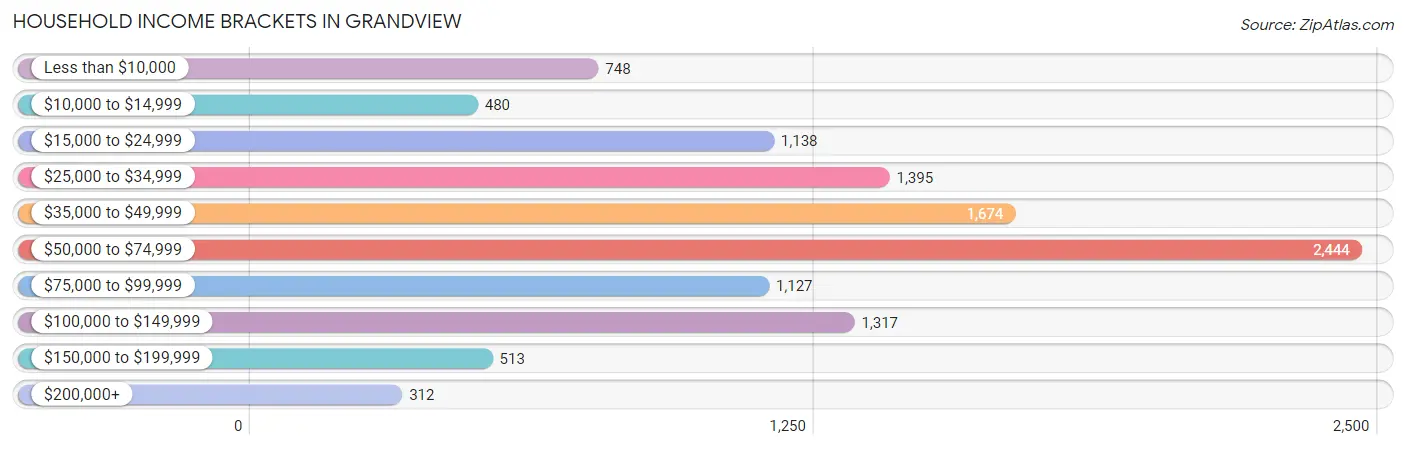
| Income Bracket | # Households | % Households |
| Less than $10,000 | 748 | 6.7% |
| $10,000 to $14,999 | 480 | 4.3% |
| $15,000 to $24,999 | 1,138 | 10.2% |
| $25,000 to $34,999 | 1,395 | 12.5% |
| $35,000 to $49,999 | 1,674 | 15.0% |
| $50,000 to $74,999 | 2,444 | 21.9% |
| $75,000 to $99,999 | 1,127 | 10.1% |
| $100,000 to $149,999 | 1,317 | 11.8% |
| $150,000 to $199,999 | 513 | 4.6% |
| $200,000+ | 312 | 2.8% |
Household Income by Householder Age in Grandview
The median household income in Grandview is $51,048, with the highest median household income of $60,343 found in the 25 to 44 years age bracket for the primary householder. A total of 4,142 households (37.1%) fall into this category. Meanwhile, the 15 to 24 years age bracket for the primary householder has the lowest median household income of $35,637, with 500 households (4.5%) in this group.
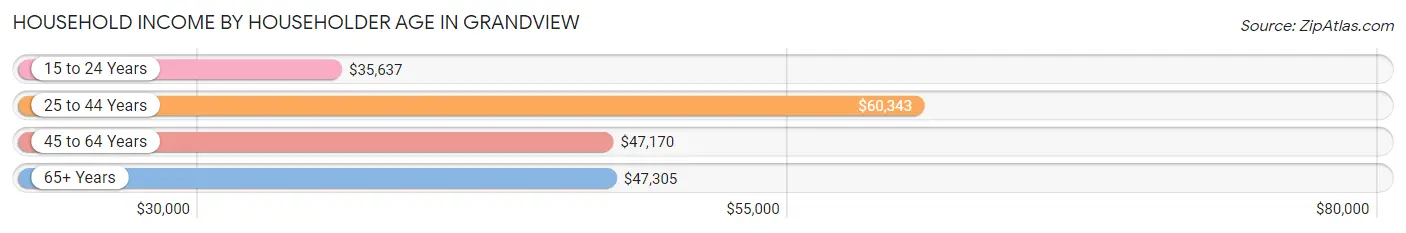
| Income Bracket | # Households | Median Income |
| 15 to 24 Years | 500 (4.5%) | $35,637 |
| 25 to 44 Years | 4,142 (37.1%) | $60,343 |
| 45 to 64 Years | 3,843 (34.4%) | $47,170 |
| 65+ Years | 2,674 (24.0%) | $47,305 |
| Total | 11,159 (100.0%) | $51,048 |
Poverty in Grandview
Income Below Poverty by Sex and Age in Grandview
With 13.7% poverty level for males and 16.7% for females among the residents of Grandview, 15 year old males and 18 to 24 year old females are the most vulnerable to poverty, with 33 males (34.7%) and 249 females (28.1%) in their respective age groups living below the poverty level.
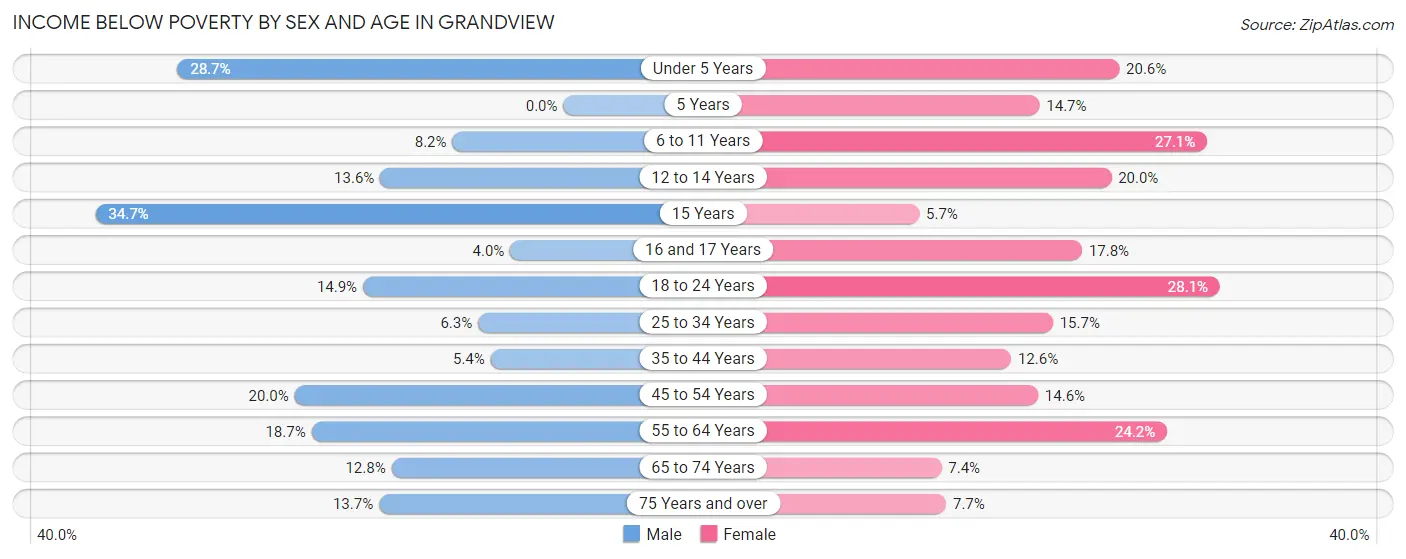
| Age Bracket | Male | Female |
| Under 5 Years | 333 (28.7%) | 146 (20.6%) |
| 5 Years | 0 (0.0%) | 22 (14.7%) |
| 6 to 11 Years | 85 (8.2%) | 262 (27.1%) |
| 12 to 14 Years | 57 (13.6%) | 110 (20.0%) |
| 15 Years | 33 (34.7%) | 7 (5.7%) |
| 16 and 17 Years | 10 (4.0%) | 69 (17.8%) |
| 18 to 24 Years | 201 (14.9%) | 249 (28.1%) |
| 25 to 34 Years | 131 (6.3%) | 379 (15.7%) |
| 35 to 44 Years | 78 (5.4%) | 244 (12.6%) |
| 45 to 54 Years | 280 (20.0%) | 206 (14.6%) |
| 55 to 64 Years | 300 (18.7%) | 350 (24.1%) |
| 65 to 74 Years | 116 (12.8%) | 106 (7.4%) |
| 75 Years and over | 79 (13.7%) | 69 (7.7%) |
| Total | 1,703 (13.7%) | 2,219 (16.7%) |
Income Above Poverty by Sex and Age in Grandview
According to the poverty statistics in Grandview, males aged 5 years and females aged 15 years are the age groups that are most secure financially, with 100.0% of males and 94.3% of females in these age groups living above the poverty line.
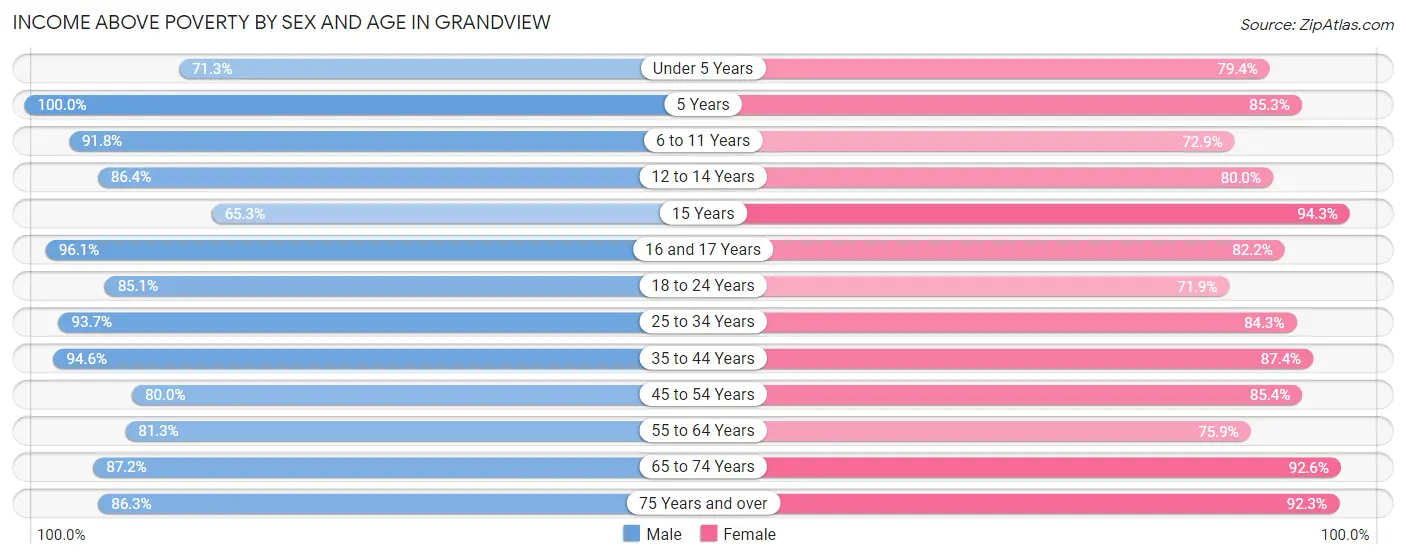
| Age Bracket | Male | Female |
| Under 5 Years | 829 (71.3%) | 563 (79.4%) |
| 5 Years | 95 (100.0%) | 128 (85.3%) |
| 6 to 11 Years | 947 (91.8%) | 704 (72.9%) |
| 12 to 14 Years | 362 (86.4%) | 440 (80.0%) |
| 15 Years | 62 (65.3%) | 115 (94.3%) |
| 16 and 17 Years | 243 (96.1%) | 318 (82.2%) |
| 18 to 24 Years | 1,150 (85.1%) | 638 (71.9%) |
| 25 to 34 Years | 1,938 (93.7%) | 2,041 (84.3%) |
| 35 to 44 Years | 1,367 (94.6%) | 1,698 (87.4%) |
| 45 to 54 Years | 1,123 (80.0%) | 1,209 (85.4%) |
| 55 to 64 Years | 1,304 (81.3%) | 1,099 (75.8%) |
| 65 to 74 Years | 793 (87.2%) | 1,328 (92.6%) |
| 75 Years and over | 498 (86.3%) | 822 (92.3%) |
| Total | 10,711 (86.3%) | 11,103 (83.3%) |
Income Below Poverty Among Married-Couple Families in Grandview
The poverty statistics for married-couple families in Grandview show that 4.8% or 171 of the total 3,557 families live below the poverty line. Families with 5 or more children have the highest poverty rate of 35.3%, comprising of 18 families. On the other hand, families with no children have the lowest poverty rate of 2.6%, which includes 55 families.
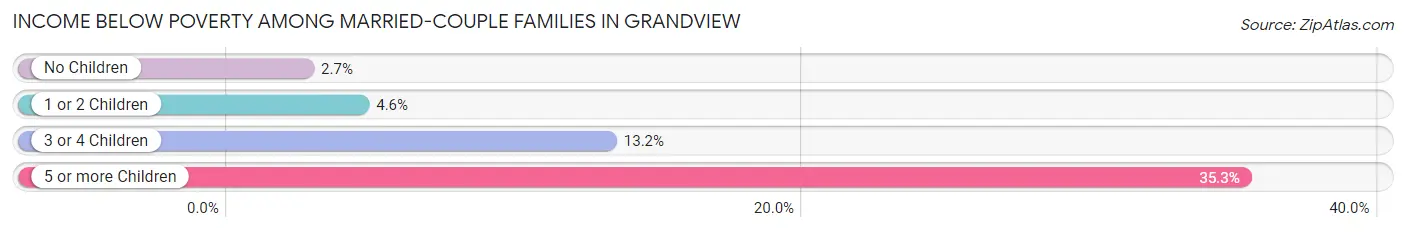
| Children | Above Poverty | Below Poverty |
| No Children | 2,021 (97.4%) | 55 (2.6%) |
| 1 or 2 Children | 1,003 (95.4%) | 48 (4.6%) |
| 3 or 4 Children | 329 (86.8%) | 50 (13.2%) |
| 5 or more Children | 33 (64.7%) | 18 (35.3%) |
| Total | 3,386 (95.2%) | 171 (4.8%) |
Income Below Poverty Among Single-Parent Households in Grandview
According to the poverty data in Grandview, 38.7% or 269 single-father households and 16.2% or 266 single-mother households are living below the poverty line. Among single-father households, those with 3 or 4 children have the highest poverty rate, with 28 households (96.6%) experiencing poverty. Likewise, among single-mother households, those with 1 or 2 children have the highest poverty rate, with 209 households (27.7%) falling below the poverty line.
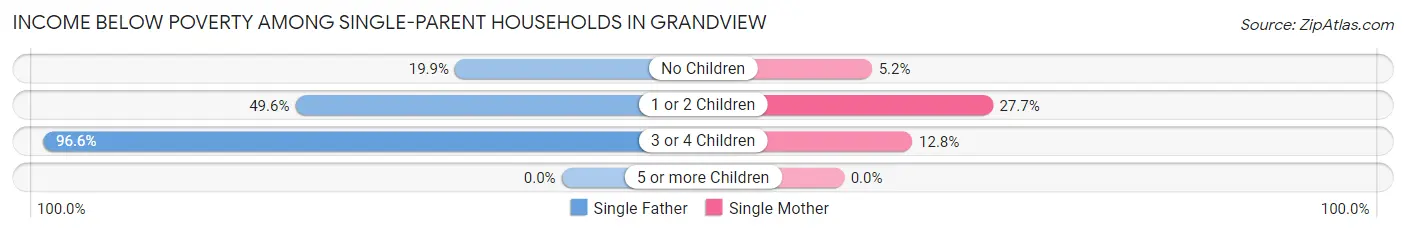
| Children | Single Father | Single Mother |
| No Children | 60 (19.9%) | 38 (5.2%) |
| 1 or 2 Children | 181 (49.6%) | 209 (27.7%) |
| 3 or 4 Children | 28 (96.6%) | 19 (12.8%) |
| 5 or more Children | 0 (0.0%) | 0 (0.0%) |
| Total | 269 (38.7%) | 266 (16.2%) |
Income Below Poverty Among Married-Couple vs Single-Parent Households in Grandview
The poverty data for Grandview shows that 171 of the married-couple family households (4.8%) and 535 of the single-parent households (22.9%) are living below the poverty level. Within the married-couple family households, those with 5 or more children have the highest poverty rate, with 18 households (35.3%) falling below the poverty line. Among the single-parent households, those with 1 or 2 children have the highest poverty rate, with 390 household (34.8%) living below poverty.
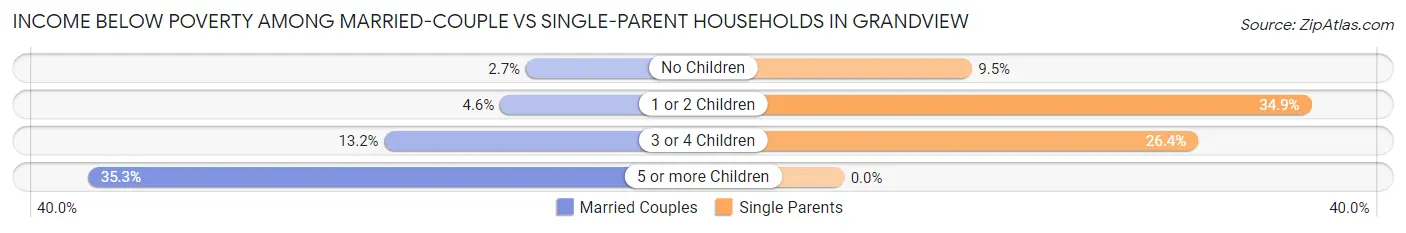
| Children | Married-Couple Families | Single-Parent Households |
| No Children | 55 (2.6%) | 98 (9.5%) |
| 1 or 2 Children | 48 (4.6%) | 390 (34.8%) |
| 3 or 4 Children | 50 (13.2%) | 47 (26.4%) |
| 5 or more Children | 18 (35.3%) | 0 (0.0%) |
| Total | 171 (4.8%) | 535 (22.9%) |
Race in Grandview
The most populous races in Grandview are White / Caucasian (12,700 | 49.0%), Black / African American (8,598 | 33.2%), and Hispanic or Latino (3,940 | 15.2%).
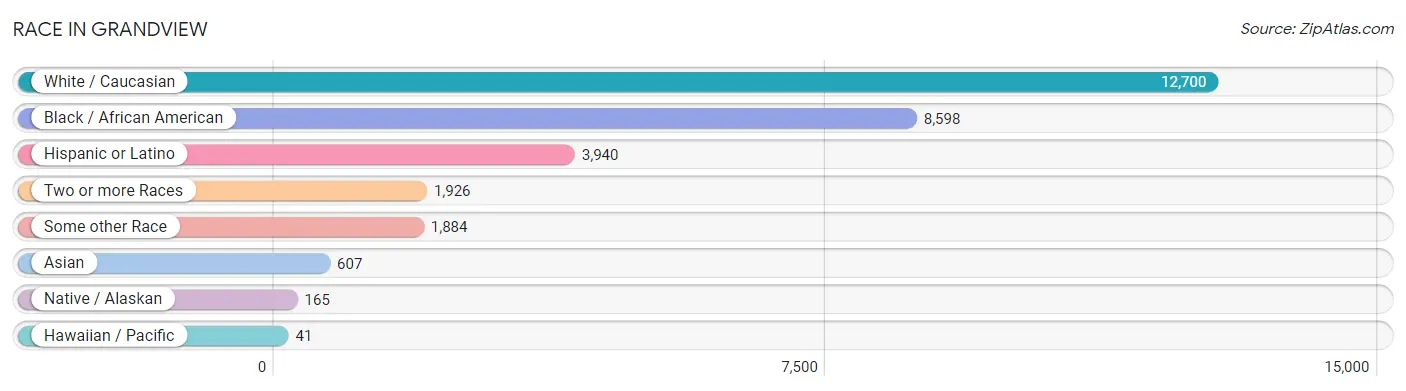
| Race | # Population | % Population |
| Asian | 607 | 2.3% |
| Black / African American | 8,598 | 33.2% |
| Hawaiian / Pacific | 41 | 0.2% |
| Hispanic or Latino | 3,940 | 15.2% |
| Native / Alaskan | 165 | 0.6% |
| White / Caucasian | 12,700 | 49.0% |
| Two or more Races | 1,926 | 7.4% |
| Some other Race | 1,884 | 7.3% |
| Total | 25,921 | 100.0% |
Ancestry in Grandview
The most populous ancestries reported in Grandview are German (2,700 | 10.4%), Mexican (2,368 | 9.1%), Irish (2,297 | 8.9%), English (1,584 | 6.1%), and Central American (1,087 | 4.2%), together accounting for 38.7% of all Grandview residents.
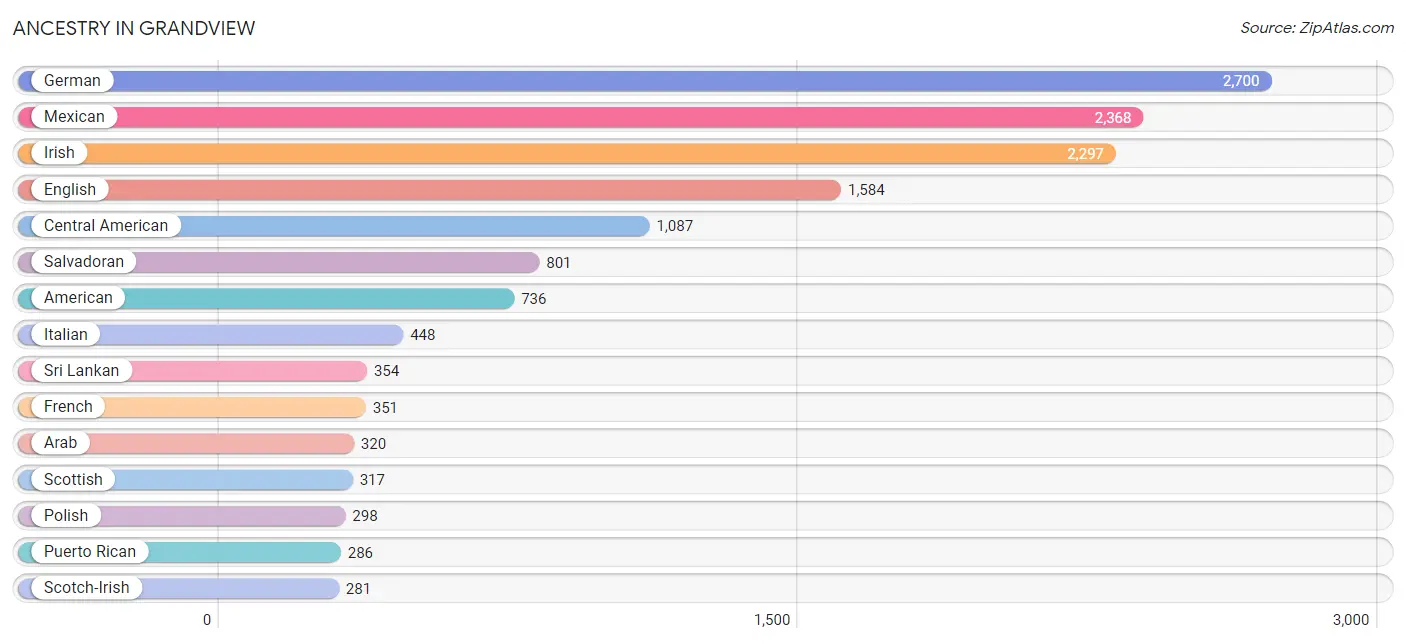
| Ancestry | # Population | % Population |
| African | 136 | 0.5% |
| American | 736 | 2.8% |
| Arab | 320 | 1.2% |
| Argentinean | 4 | 0.0% |
| Austrian | 20 | 0.1% |
| Bhutanese | 58 | 0.2% |
| Blackfeet | 11 | 0.0% |
| British | 118 | 0.5% |
| Burmese | 186 | 0.7% |
| Central American | 1,087 | 4.2% |
| Central American Indian | 119 | 0.5% |
| Cherokee | 80 | 0.3% |
| Cheyenne | 5 | 0.0% |
| Choctaw | 2 | 0.0% |
| Colombian | 19 | 0.1% |
| Creek | 5 | 0.0% |
| Crow | 25 | 0.1% |
| Cuban | 43 | 0.2% |
| Cypriot | 2 | 0.0% |
| Czech | 19 | 0.1% |
| Czechoslovakian | 57 | 0.2% |
| Danish | 22 | 0.1% |
| Delaware | 41 | 0.2% |
| Dutch | 150 | 0.6% |
| Eastern European | 13 | 0.1% |
| Ecuadorian | 5 | 0.0% |
| Egyptian | 7 | 0.0% |
| English | 1,584 | 6.1% |
| European | 139 | 0.5% |
| Finnish | 34 | 0.1% |
| French | 351 | 1.3% |
| French Canadian | 59 | 0.2% |
| German | 2,700 | 10.4% |
| Greek | 155 | 0.6% |
| Guatemalan | 202 | 0.8% |
| Haitian | 11 | 0.0% |
| Honduran | 66 | 0.3% |
| Hungarian | 24 | 0.1% |
| Indian (Asian) | 166 | 0.6% |
| Iranian | 13 | 0.1% |
| Irish | 2,297 | 8.9% |
| Iroquois | 6 | 0.0% |
| Italian | 448 | 1.7% |
| Jamaican | 39 | 0.2% |
| Korean | 112 | 0.4% |
| Mexican | 2,368 | 9.1% |
| Mongolian | 7 | 0.0% |
| Moroccan | 74 | 0.3% |
| Native Hawaiian | 41 | 0.2% |
| Nigerian | 13 | 0.1% |
| Northern European | 76 | 0.3% |
| Norwegian | 150 | 0.6% |
| Pakistani | 53 | 0.2% |
| Palestinian | 239 | 0.9% |
| Panamanian | 18 | 0.1% |
| Polish | 298 | 1.1% |
| Portuguese | 32 | 0.1% |
| Potawatomi | 42 | 0.2% |
| Puerto Rican | 286 | 1.1% |
| Romanian | 20 | 0.1% |
| Russian | 57 | 0.2% |
| Salvadoran | 801 | 3.1% |
| Scandinavian | 73 | 0.3% |
| Scotch-Irish | 281 | 1.1% |
| Scottish | 317 | 1.2% |
| Seminole | 8 | 0.0% |
| Sioux | 24 | 0.1% |
| Slovene | 7 | 0.0% |
| South American | 28 | 0.1% |
| Spanish | 14 | 0.1% |
| Sri Lankan | 354 | 1.4% |
| Subsaharan African | 149 | 0.6% |
| Swedish | 217 | 0.8% |
| Swiss | 82 | 0.3% |
| Thai | 12 | 0.1% |
| Ukrainian | 14 | 0.1% |
| Welsh | 148 | 0.6% |
| Yugoslavian | 11 | 0.0% | View All 78 Rows |
Immigrants in Grandview
The most numerous immigrant groups reported in Grandview came from Latin America (1,232 | 4.8%), Central America (1,134 | 4.4%), Mexico (703 | 2.7%), Asia (332 | 1.3%), and El Salvador (260 | 1.0%), together accounting for 14.1% of all Grandview residents.
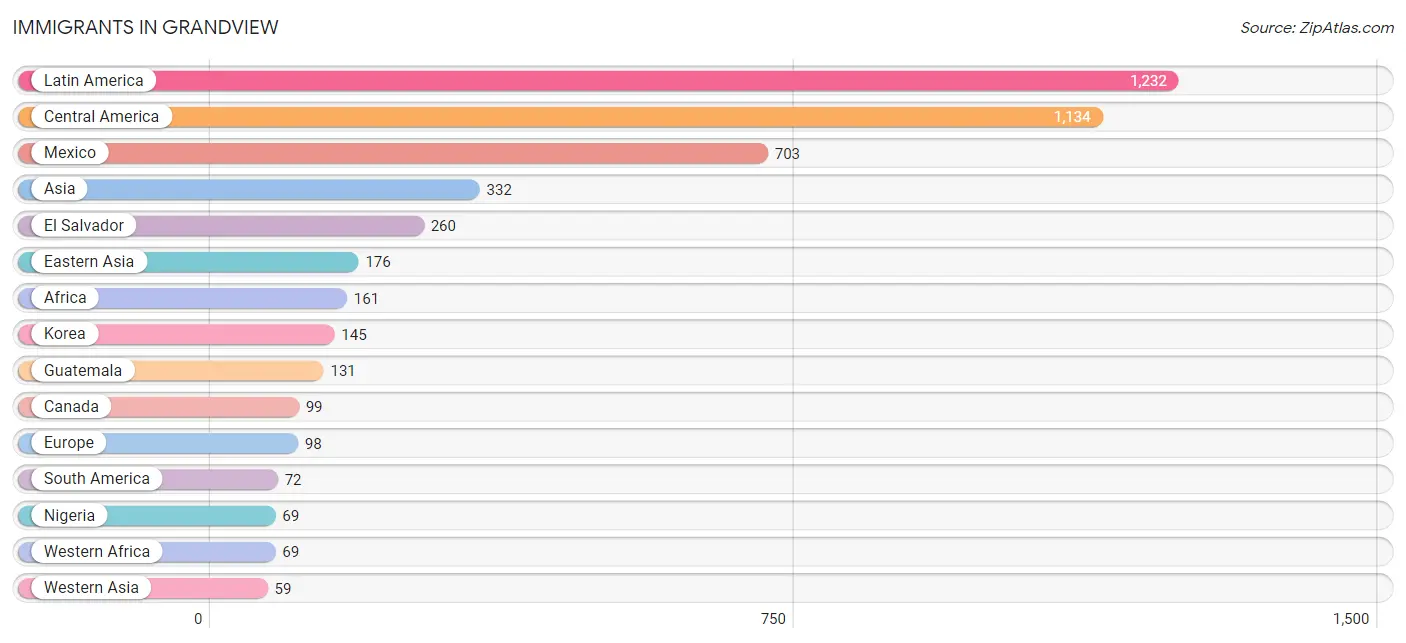
| Immigration Origin | # Population | % Population |
| Africa | 161 | 0.6% |
| Asia | 332 | 1.3% |
| Austria | 20 | 0.1% |
| Cameroon | 21 | 0.1% |
| Canada | 99 | 0.4% |
| Caribbean | 26 | 0.1% |
| Central America | 1,134 | 4.4% |
| China | 31 | 0.1% |
| Colombia | 35 | 0.1% |
| Cuba | 26 | 0.1% |
| Eastern Africa | 29 | 0.1% |
| Eastern Asia | 176 | 0.7% |
| Eastern Europe | 6 | 0.0% |
| Ecuador | 5 | 0.0% |
| Egypt | 7 | 0.0% |
| El Salvador | 260 | 1.0% |
| England | 22 | 0.1% |
| Europe | 98 | 0.4% |
| Germany | 29 | 0.1% |
| Guatemala | 131 | 0.5% |
| Guyana | 32 | 0.1% |
| Honduras | 28 | 0.1% |
| Hong Kong | 9 | 0.0% |
| India | 12 | 0.1% |
| Ireland | 21 | 0.1% |
| Kenya | 29 | 0.1% |
| Korea | 145 | 0.6% |
| Latin America | 1,232 | 4.8% |
| Mexico | 703 | 2.7% |
| Middle Africa | 21 | 0.1% |
| Morocco | 19 | 0.1% |
| Nigeria | 69 | 0.3% |
| Northern Africa | 26 | 0.1% |
| Northern Europe | 43 | 0.2% |
| Philippines | 40 | 0.2% |
| Saudi Arabia | 51 | 0.2% |
| South America | 72 | 0.3% |
| South Central Asia | 12 | 0.1% |
| South Eastern Asia | 55 | 0.2% |
| Taiwan | 15 | 0.1% |
| Ukraine | 6 | 0.0% |
| Vietnam | 15 | 0.1% |
| Western Africa | 69 | 0.3% |
| Western Asia | 59 | 0.2% |
| Western Europe | 49 | 0.2% | View All 45 Rows |
Sex and Age in Grandview
Sex and Age in Grandview
The most populous age groups in Grandview are Under 5 Years (1,176 | 9.4%) for men and 25 to 29 Years (1,477 | 11.0%) for women.
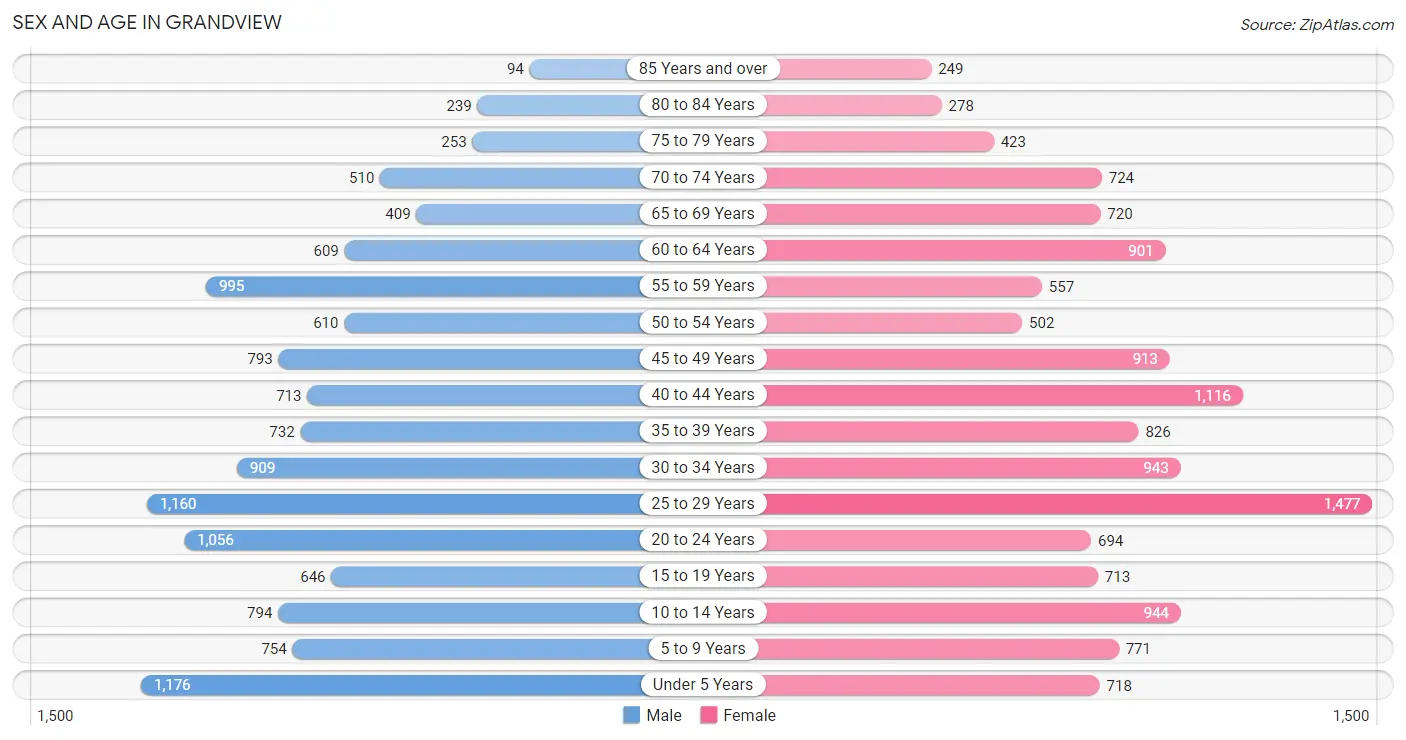
| Age Bracket | Male | Female |
| Under 5 Years | 1,176 (9.4%) | 718 (5.3%) |
| 5 to 9 Years | 754 (6.1%) | 771 (5.7%) |
| 10 to 14 Years | 794 (6.4%) | 944 (7.0%) |
| 15 to 19 Years | 646 (5.2%) | 713 (5.3%) |
| 20 to 24 Years | 1,056 (8.5%) | 694 (5.1%) |
| 25 to 29 Years | 1,160 (9.3%) | 1,477 (11.0%) |
| 30 to 34 Years | 909 (7.3%) | 943 (7.0%) |
| 35 to 39 Years | 732 (5.9%) | 826 (6.1%) |
| 40 to 44 Years | 713 (5.7%) | 1,116 (8.3%) |
| 45 to 49 Years | 793 (6.4%) | 913 (6.8%) |
| 50 to 54 Years | 610 (4.9%) | 502 (3.7%) |
| 55 to 59 Years | 995 (8.0%) | 557 (4.1%) |
| 60 to 64 Years | 609 (4.9%) | 901 (6.7%) |
| 65 to 69 Years | 409 (3.3%) | 720 (5.3%) |
| 70 to 74 Years | 510 (4.1%) | 724 (5.4%) |
| 75 to 79 Years | 253 (2.0%) | 423 (3.1%) |
| 80 to 84 Years | 239 (1.9%) | 278 (2.1%) |
| 85 Years and over | 94 (0.7%) | 249 (1.8%) |
| Total | 12,452 (100.0%) | 13,469 (100.0%) |
Families and Households in Grandview
Median Family Size in Grandview
The median family size in Grandview is 3.13 persons per family, with married-couple families (3,557 | 60.4%) accounting for the largest median family size of 3.27 persons per family. On the other hand, single male/father families (696 | 11.8%) represent the smallest median family size with 2.62 persons per family.
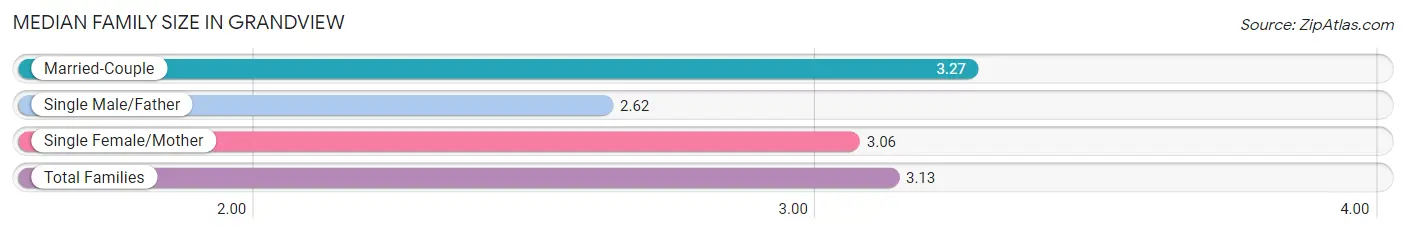
| Family Type | # Families | Family Size |
| Married-Couple | 3,557 (60.4%) | 3.27 |
| Single Male/Father | 696 (11.8%) | 2.62 |
| Single Female/Mother | 1,638 (27.8%) | 3.06 |
| Total Families | 5,891 (100.0%) | 3.13 |
Median Household Size in Grandview
The median household size in Grandview is 2.31 persons per household, with married-couple households (3,557 | 31.9%) accounting for the largest median household size of 3.3 persons per household. non-family households (5,268 | 47.2%) represent the smallest median household size with 1.24 persons per household.
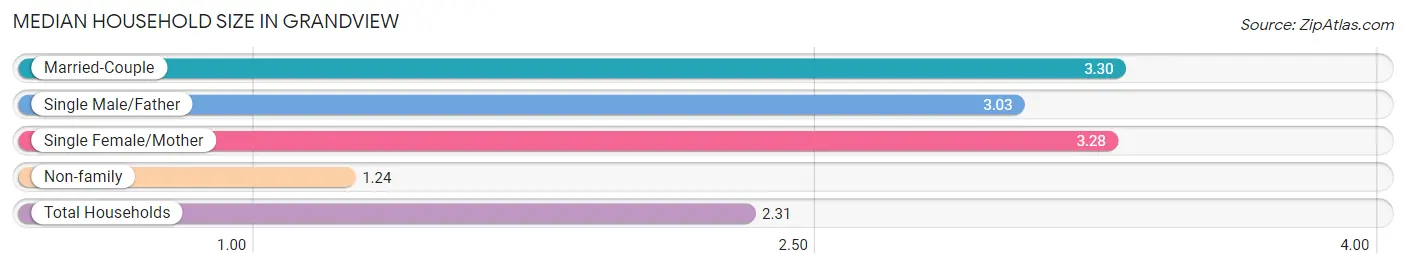
| Household Type | # Households | Household Size |
| Married-Couple | 3,557 (31.9%) | 3.30 |
| Single Male/Father | 696 (6.2%) | 3.03 |
| Single Female/Mother | 1,638 (14.7%) | 3.28 |
| Non-family | 5,268 (47.2%) | 1.24 |
| Total Households | 11,159 (100.0%) | 2.31 |
Household Size by Marriage Status in Grandview
Out of a total of 11,159 households in Grandview, 5,891 (52.8%) are family households, while 5,268 (47.2%) are nonfamily households. The most numerous type of family households are 2-person households, comprising 2,609, and the most common type of nonfamily households are 1-person households, comprising 4,354.
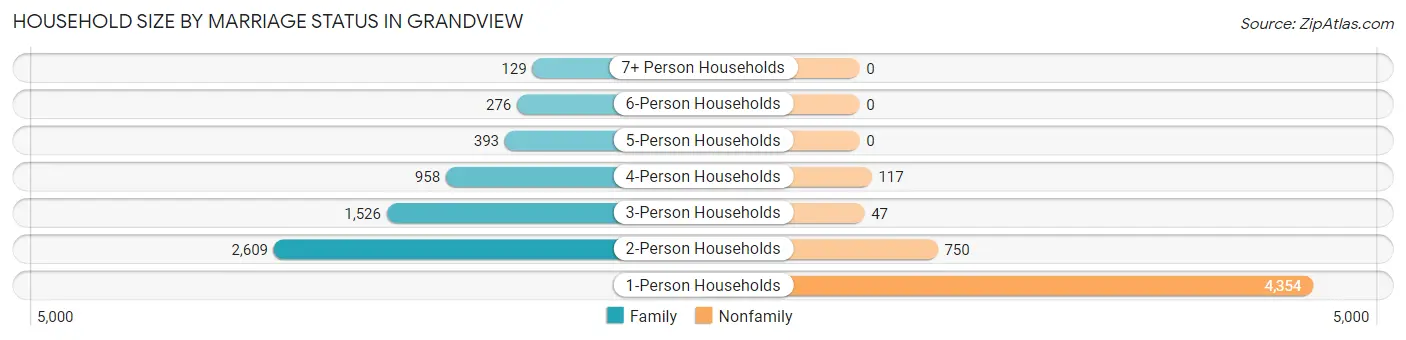
| Household Size | Family Households | Nonfamily Households |
| 1-Person Households | - | 4,354 (39.0%) |
| 2-Person Households | 2,609 (23.4%) | 750 (6.7%) |
| 3-Person Households | 1,526 (13.7%) | 47 (0.4%) |
| 4-Person Households | 958 (8.6%) | 117 (1.1%) |
| 5-Person Households | 393 (3.5%) | 0 (0.0%) |
| 6-Person Households | 276 (2.5%) | 0 (0.0%) |
| 7+ Person Households | 129 (1.2%) | 0 (0.0%) |
| Total | 5,891 (52.8%) | 5,268 (47.2%) |
Female Fertility in Grandview
Fertility by Age in Grandview
Average fertility rate in Grandview is 47.0 births per 1,000 women. Women in the age bracket of 20 to 34 years have the highest fertility rate with 91.0 births per 1,000 women. Women in the age bracket of 20 to 34 years acount for 88.7% of all women with births.
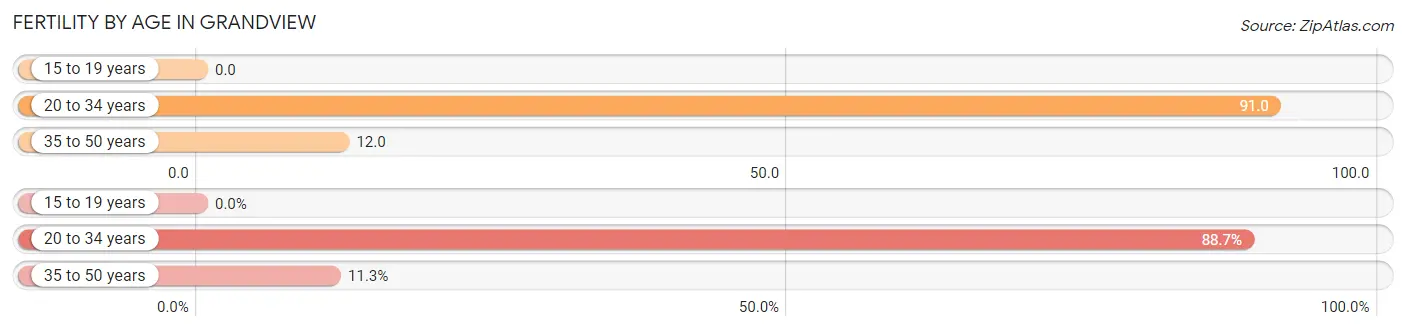
| Age Bracket | Women with Births | Births / 1,000 Women |
| 15 to 19 years | 0 (0.0%) | 0.0 |
| 20 to 34 years | 283 (88.7%) | 91.0 |
| 35 to 50 years | 36 (11.3%) | 12.0 |
| Total | 319 (100.0%) | 47.0 |
Fertility by Age by Marriage Status in Grandview
74.0% of women with births (319) in Grandview are married. The highest percentage of unmarried women with births falls into 35 to 50 years age bracket with 33.3% of them unmarried at the time of birth, while the lowest percentage of unmarried women with births belong to 20 to 34 years age bracket with 25.1% of them unmarried.
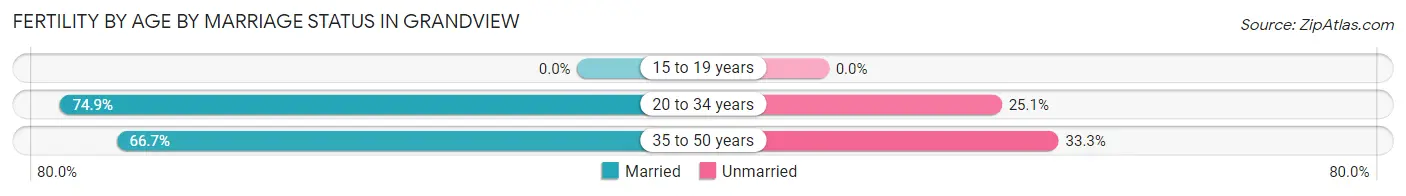
| Age Bracket | Married | Unmarried |
| 15 to 19 years | 0 (0.0%) | 0 (0.0%) |
| 20 to 34 years | 212 (74.9%) | 71 (25.1%) |
| 35 to 50 years | 24 (66.7%) | 12 (33.3%) |
| Total | 236 (74.0%) | 83 (26.0%) |
Fertility by Education in Grandview
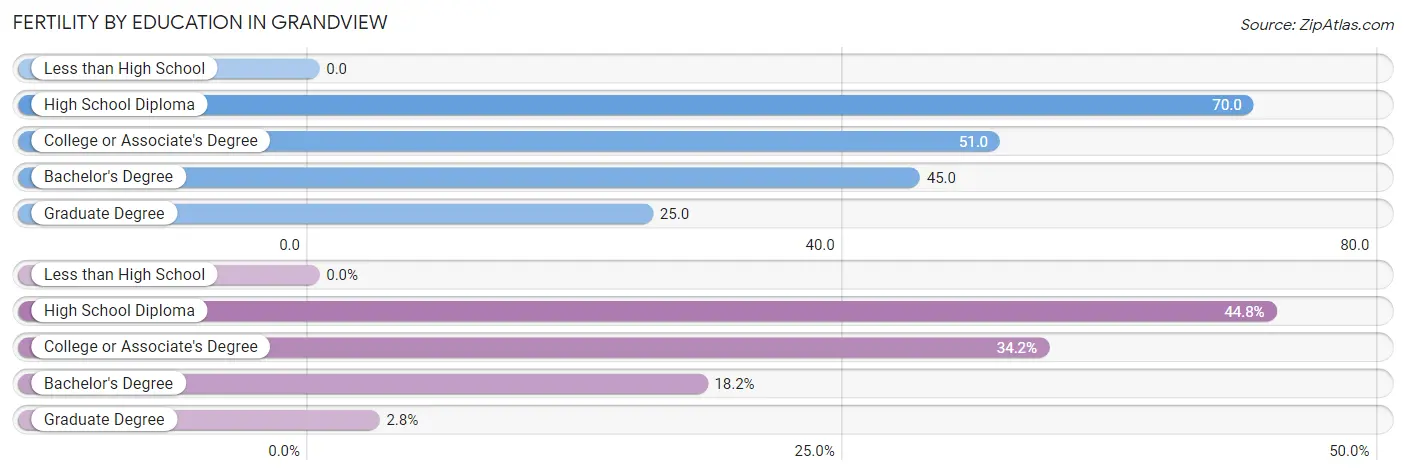
| Educational Attainment | Women with Births | Births / 1,000 Women |
| Less than High School | 0 (0.0%) | 0.0 |
| High School Diploma | 143 (44.8%) | 70.0 |
| College or Associate's Degree | 109 (34.2%) | 51.0 |
| Bachelor's Degree | 58 (18.2%) | 45.0 |
| Graduate Degree | 9 (2.8%) | 25.0 |
| Total | 319 (100.0%) | 47.0 |
Fertility by Education by Marriage Status in Grandview
26.0% of women with births in Grandview are unmarried. Women with the educational attainment of bachelor's degree are most likely to be married with 100.0% of them married at childbirth, while women with the educational attainment of high school diploma are least likely to be married with 49.6% of them unmarried at childbirth.
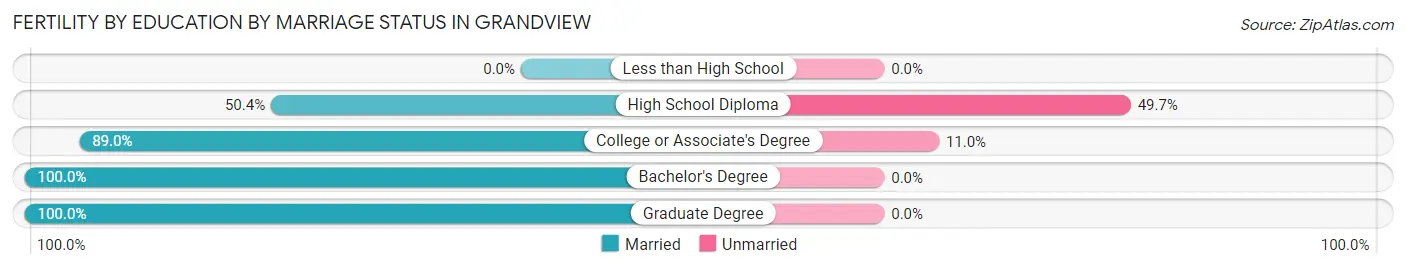
| Educational Attainment | Married | Unmarried |
| Less than High School | 0 (0.0%) | 0 (0.0%) |
| High School Diploma | 72 (50.3%) | 71 (49.6%) |
| College or Associate's Degree | 97 (89.0%) | 12 (11.0%) |
| Bachelor's Degree | 58 (100.0%) | 0 (0.0%) |
| Graduate Degree | 9 (100.0%) | 0 (0.0%) |
| Total | 236 (74.0%) | 83 (26.0%) |
Employment Characteristics in Grandview
Employment by Class of Employer in Grandview
Among the 12,640 employed individuals in Grandview, private company employees (9,104 | 72.0%), not-for-profit organizations (1,313 | 10.4%), and local government employees (657 | 5.2%) make up the most common classes of employment.
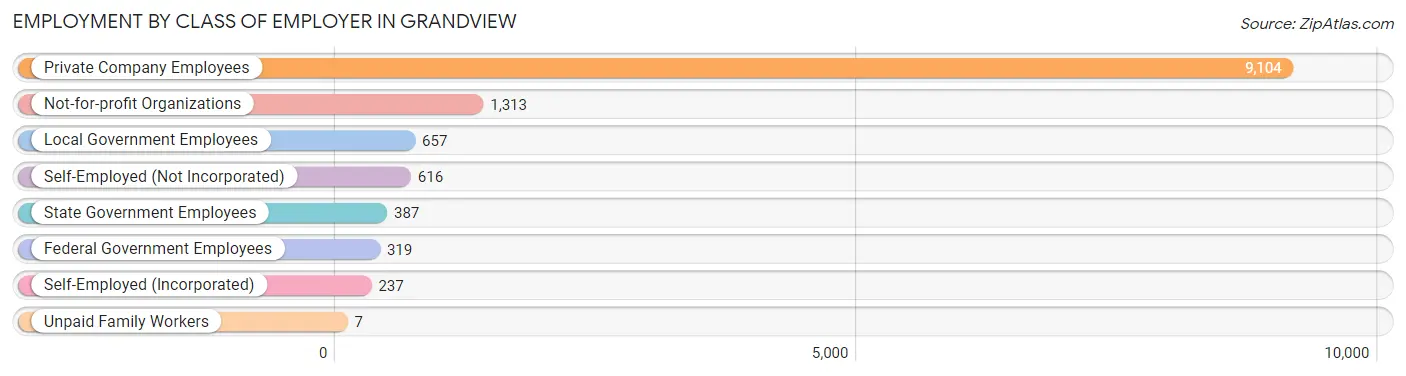
| Employer Class | # Employees | % Employees |
| Private Company Employees | 9,104 | 72.0% |
| Self-Employed (Incorporated) | 237 | 1.9% |
| Self-Employed (Not Incorporated) | 616 | 4.9% |
| Not-for-profit Organizations | 1,313 | 10.4% |
| Local Government Employees | 657 | 5.2% |
| State Government Employees | 387 | 3.1% |
| Federal Government Employees | 319 | 2.5% |
| Unpaid Family Workers | 7 | 0.1% |
| Total | 12,640 | 100.0% |
Employment Status by Age in Grandview
According to the labor force statistics for Grandview, out of the total population over 16 years of age (20,544), 67.2% or 13,806 individuals are in the labor force, with 6.4% or 884 of them unemployed. The age group with the highest labor force participation rate is 30 to 34 years, with 91.4% or 1,693 individuals in the labor force. Within the labor force, the 65 to 74 years age range has the highest percentage of unemployed individuals, with 18.0% or 129 of them being unemployed.
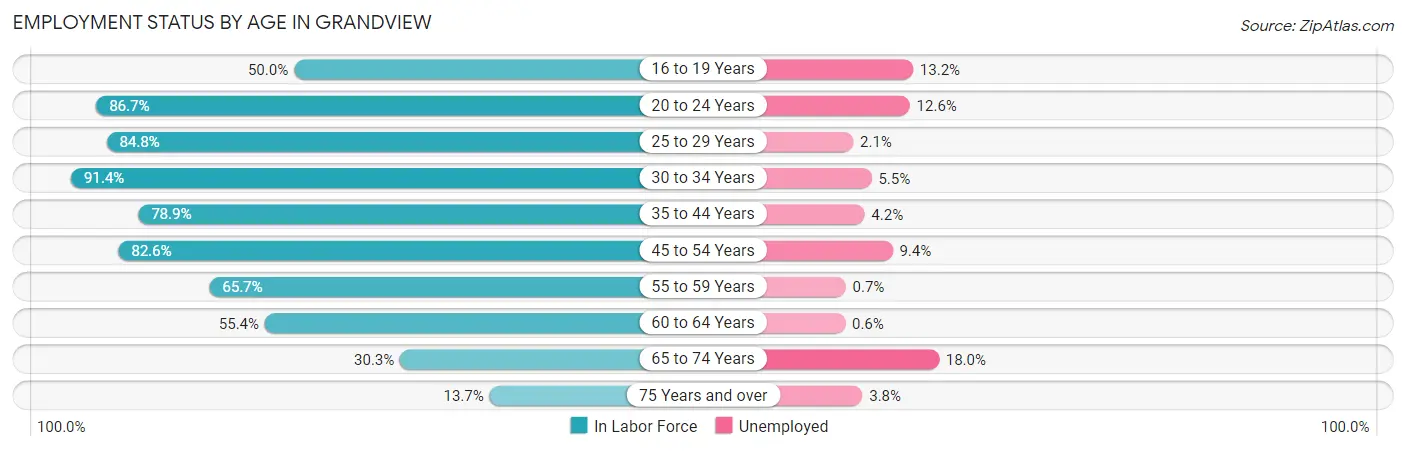
| Age Bracket | In Labor Force | Unemployed |
| 16 to 19 Years | 570 (50.0%) | 75 (13.2%) |
| 20 to 24 Years | 1,517 (86.7%) | 191 (12.6%) |
| 25 to 29 Years | 2,236 (84.8%) | 47 (2.1%) |
| 30 to 34 Years | 1,693 (91.4%) | 93 (5.5%) |
| 35 to 44 Years | 2,672 (78.9%) | 112 (4.2%) |
| 45 to 54 Years | 2,328 (82.6%) | 219 (9.4%) |
| 55 to 59 Years | 1,020 (65.7%) | 7 (0.7%) |
| 60 to 64 Years | 837 (55.4%) | 5 (0.6%) |
| 65 to 74 Years | 716 (30.3%) | 129 (18.0%) |
| 75 Years and over | 210 (13.7%) | 8 (3.8%) |
| Total | 13,806 (67.2%) | 884 (6.4%) |
Employment Status by Educational Attainment in Grandview
According to labor force statistics for Grandview, 78.4% of individuals (10,785) out of the total population between 25 and 64 years of age (13,756) are in the labor force, with 4.5% or 485 of them being unemployed. The group with the highest labor force participation rate are those with the educational attainment of bachelor's degree or higher, with 86.3% or 2,788 individuals in the labor force. Within the labor force, individuals with high school diploma education have the highest percentage of unemployment, with 8.3% or 274 of them being unemployed.
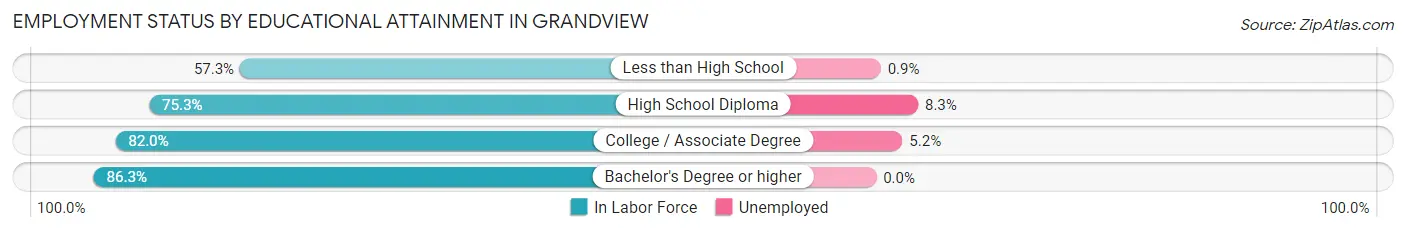
| Educational Attainment | In Labor Force | Unemployed |
| Less than High School | 772 (57.3%) | 12 (0.9%) |
| High School Diploma | 3,302 (75.3%) | 364 (8.3%) |
| College / Associate Degree | 3,930 (82.0%) | 249 (5.2%) |
| Bachelor's Degree or higher | 2,788 (86.3%) | 0 (0.0%) |
| Total | 10,785 (78.4%) | 619 (4.5%) |
Employment Occupations by Sex in Grandview
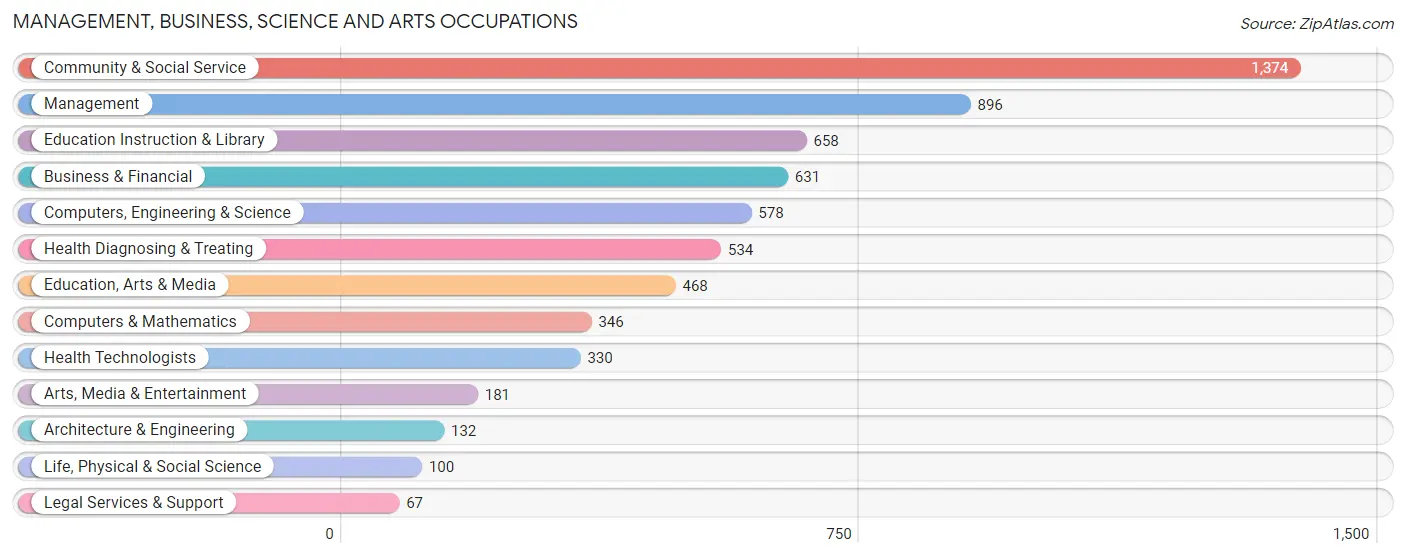
Management, Business, Science and Arts Occupations
The most common Management, Business, Science and Arts occupations in Grandview are Community & Social Service (1,374 | 10.7%), Management (896 | 7.0%), Education Instruction & Library (658 | 5.1%), Business & Financial (631 | 4.9%), and Computers, Engineering & Science (578 | 4.5%).
Management, Business, Science and Arts Occupations by Sex
Within the Management, Business, Science and Arts occupations in Grandview, the most male-oriented occupations are Architecture & Engineering (100.0%), Life, Physical & Social Science (98.0%), and Computers, Engineering & Science (87.2%), while the most female-oriented occupations are Legal Services & Support (100.0%), Education Instruction & Library (91.2%), and Health Technologists (90.3%).
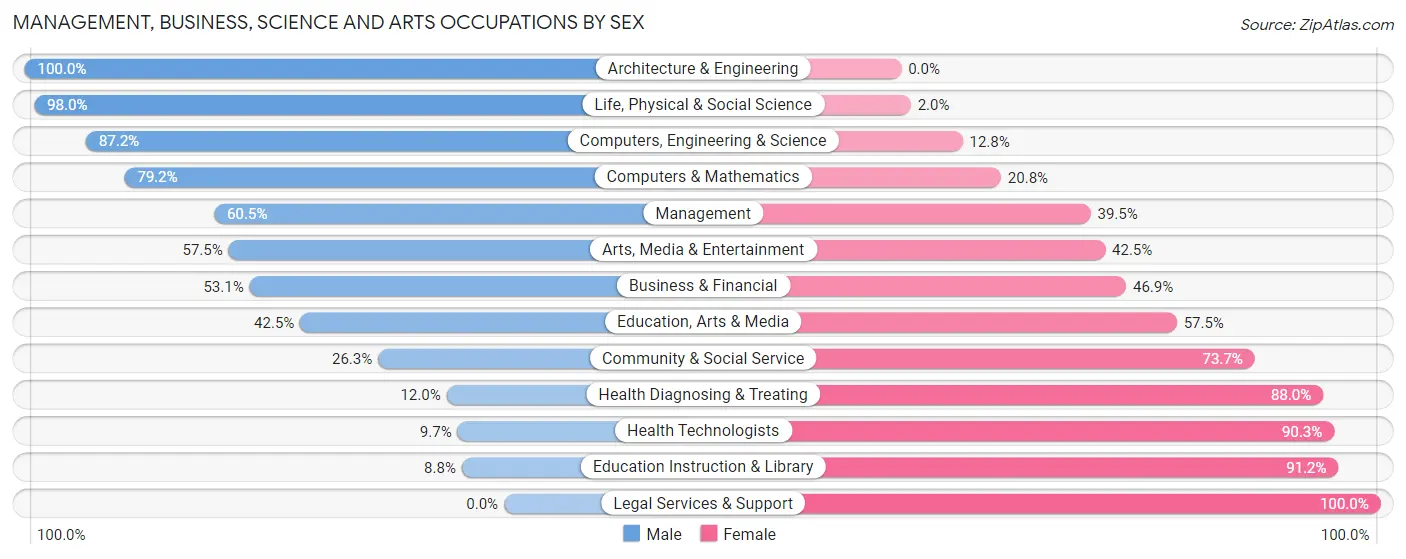
| Occupation | Male | Female |
| Management | 542 (60.5%) | 354 (39.5%) |
| Business & Financial | 335 (53.1%) | 296 (46.9%) |
| Computers, Engineering & Science | 504 (87.2%) | 74 (12.8%) |
| Computers & Mathematics | 274 (79.2%) | 72 (20.8%) |
| Architecture & Engineering | 132 (100.0%) | 0 (0.0%) |
| Life, Physical & Social Science | 98 (98.0%) | 2 (2.0%) |
| Community & Social Service | 361 (26.3%) | 1,013 (73.7%) |
| Education, Arts & Media | 199 (42.5%) | 269 (57.5%) |
| Legal Services & Support | 0 (0.0%) | 67 (100.0%) |
| Education Instruction & Library | 58 (8.8%) | 600 (91.2%) |
| Arts, Media & Entertainment | 104 (57.5%) | 77 (42.5%) |
| Health Diagnosing & Treating | 64 (12.0%) | 470 (88.0%) |
| Health Technologists | 32 (9.7%) | 298 (90.3%) |
| Total (Category) | 1,806 (45.0%) | 2,207 (55.0%) |
| Total (Overall) | 6,499 (50.5%) | 6,363 (49.5%) |
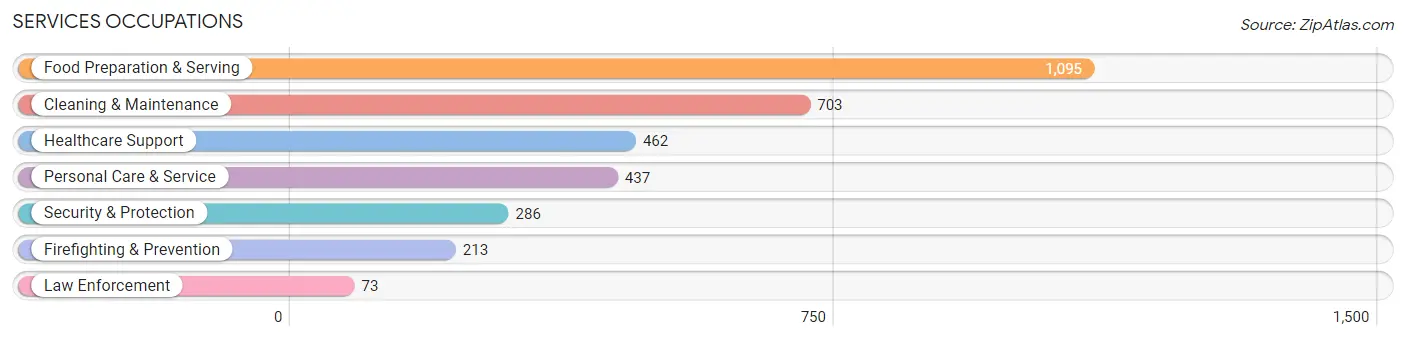
Services Occupations
The most common Services occupations in Grandview are Food Preparation & Serving (1,095 | 8.5%), Cleaning & Maintenance (703 | 5.5%), Healthcare Support (462 | 3.6%), Personal Care & Service (437 | 3.4%), and Security & Protection (286 | 2.2%).
Services Occupations by Sex
Within the Services occupations in Grandview, the most male-oriented occupations are Law Enforcement (82.2%), Cleaning & Maintenance (81.8%), and Security & Protection (72.0%), while the most female-oriented occupations are Personal Care & Service (89.9%), Healthcare Support (84.6%), and Food Preparation & Serving (64.0%).
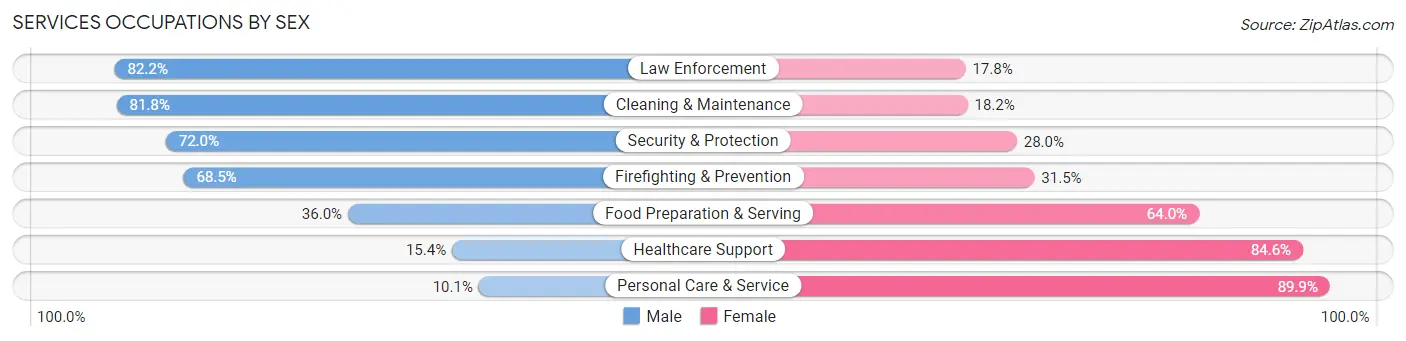
| Occupation | Male | Female |
| Healthcare Support | 71 (15.4%) | 391 (84.6%) |
| Security & Protection | 206 (72.0%) | 80 (28.0%) |
| Firefighting & Prevention | 146 (68.5%) | 67 (31.5%) |
| Law Enforcement | 60 (82.2%) | 13 (17.8%) |
| Food Preparation & Serving | 394 (36.0%) | 701 (64.0%) |
| Cleaning & Maintenance | 575 (81.8%) | 128 (18.2%) |
| Personal Care & Service | 44 (10.1%) | 393 (89.9%) |
| Total (Category) | 1,290 (43.2%) | 1,693 (56.8%) |
| Total (Overall) | 6,499 (50.5%) | 6,363 (49.5%) |
Sales and Office Occupations
The most common Sales and Office occupations in Grandview are Office & Administration (1,660 | 12.9%), and Sales & Related (1,034 | 8.0%).

Sales and Office Occupations by Sex
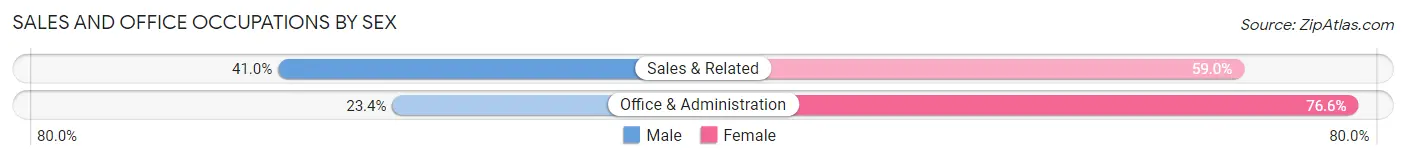
| Occupation | Male | Female |
| Sales & Related | 424 (41.0%) | 610 (59.0%) |
| Office & Administration | 389 (23.4%) | 1,271 (76.6%) |
| Total (Category) | 813 (30.2%) | 1,881 (69.8%) |
| Total (Overall) | 6,499 (50.5%) | 6,363 (49.5%) |
Natural Resources, Construction and Maintenance Occupations
The most common Natural Resources, Construction and Maintenance occupations in Grandview are Construction & Extraction (630 | 4.9%), and Installation, Maintenance & Repair (355 | 2.8%).

Natural Resources, Construction and Maintenance Occupations by Sex

| Occupation | Male | Female |
| Farming, Fishing & Forestry | 0 (0.0%) | 0 (0.0%) |
| Construction & Extraction | 600 (95.2%) | 30 (4.8%) |
| Installation, Maintenance & Repair | 355 (100.0%) | 0 (0.0%) |
| Total (Category) | 955 (97.0%) | 30 (3.0%) |
| Total (Overall) | 6,499 (50.5%) | 6,363 (49.5%) |
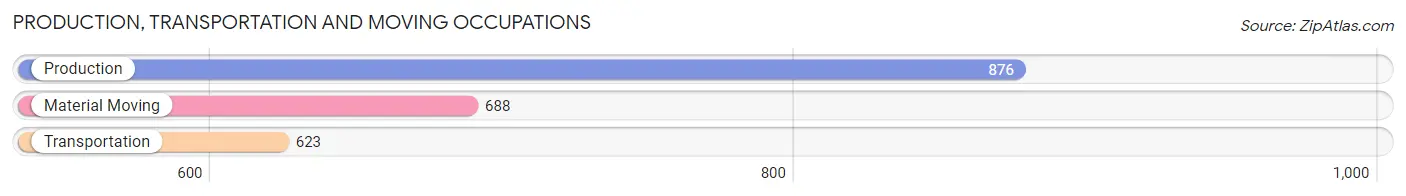
Production, Transportation and Moving Occupations
The most common Production, Transportation and Moving occupations in Grandview are Production (876 | 6.8%), Material Moving (688 | 5.3%), and Transportation (623 | 4.8%).
Production, Transportation and Moving Occupations by Sex
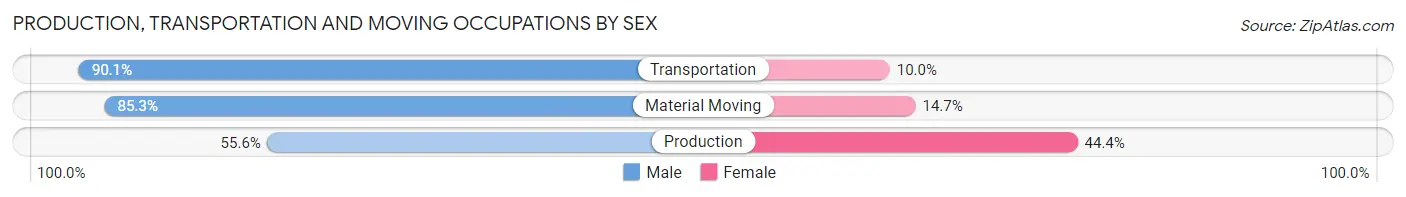
| Occupation | Male | Female |
| Production | 487 (55.6%) | 389 (44.4%) |
| Transportation | 561 (90.0%) | 62 (10.0%) |
| Material Moving | 587 (85.3%) | 101 (14.7%) |
| Total (Category) | 1,635 (74.8%) | 552 (25.2%) |
| Total (Overall) | 6,499 (50.5%) | 6,363 (49.5%) |
Employment Industries by Sex in Grandview
Employment Industries in Grandview
The major employment industries in Grandview include Health Care & Social Assistance (1,977 | 15.4%), Retail Trade (1,496 | 11.6%), Manufacturing (1,391 | 10.8%), Accommodation & Food Services (1,168 | 9.1%), and Educational Services (1,034 | 8.0%).
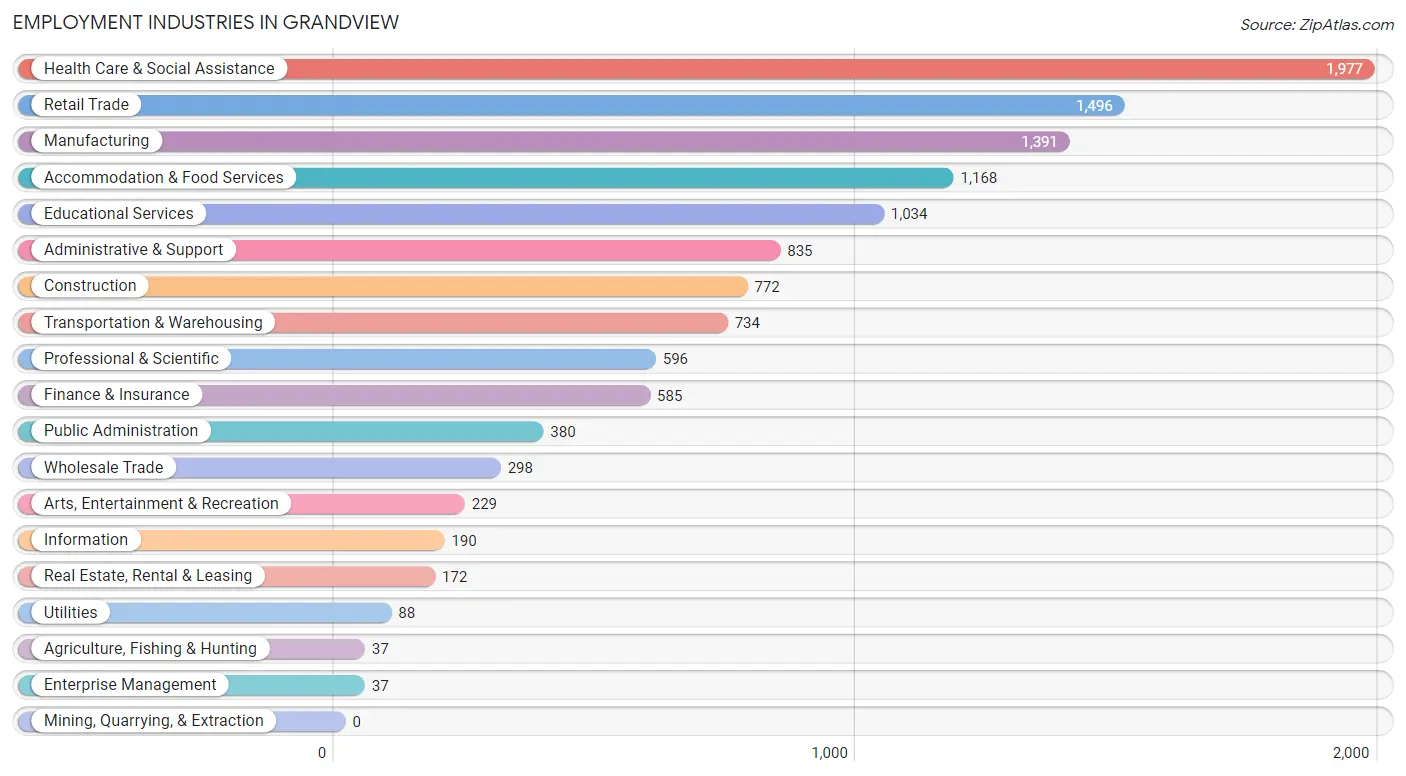
Employment Industries by Sex in Grandview
The Grandview industries that see more men than women are Agriculture, Fishing & Hunting (100.0%), Enterprise Management (100.0%), and Construction (90.2%), whereas the industries that tend to have a higher number of women are Educational Services (86.0%), Health Care & Social Assistance (82.0%), and Finance & Insurance (66.1%).
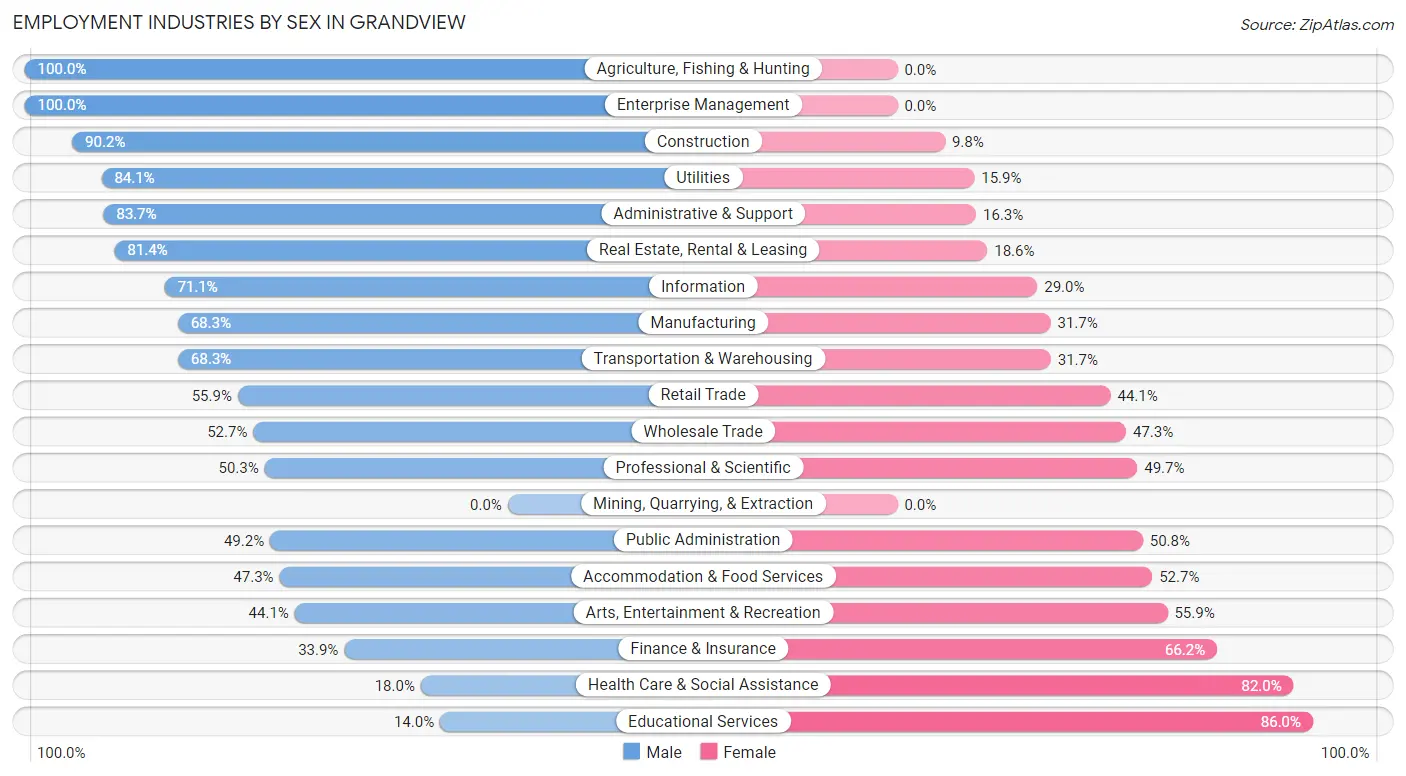
| Industry | Male | Female |
| Agriculture, Fishing & Hunting | 37 (100.0%) | 0 (0.0%) |
| Mining, Quarrying, & Extraction | 0 (0.0%) | 0 (0.0%) |
| Construction | 696 (90.2%) | 76 (9.8%) |
| Manufacturing | 950 (68.3%) | 441 (31.7%) |
| Wholesale Trade | 157 (52.7%) | 141 (47.3%) |
| Retail Trade | 836 (55.9%) | 660 (44.1%) |
| Transportation & Warehousing | 501 (68.3%) | 233 (31.7%) |
| Utilities | 74 (84.1%) | 14 (15.9%) |
| Information | 135 (71.1%) | 55 (28.9%) |
| Finance & Insurance | 198 (33.9%) | 387 (66.1%) |
| Real Estate, Rental & Leasing | 140 (81.4%) | 32 (18.6%) |
| Professional & Scientific | 300 (50.3%) | 296 (49.7%) |
| Enterprise Management | 37 (100.0%) | 0 (0.0%) |
| Administrative & Support | 699 (83.7%) | 136 (16.3%) |
| Educational Services | 145 (14.0%) | 889 (86.0%) |
| Health Care & Social Assistance | 356 (18.0%) | 1,621 (82.0%) |
| Arts, Entertainment & Recreation | 101 (44.1%) | 128 (55.9%) |
| Accommodation & Food Services | 552 (47.3%) | 616 (52.7%) |
| Public Administration | 187 (49.2%) | 193 (50.8%) |
| Total | 6,499 (50.5%) | 6,363 (49.5%) |
Education in Grandview
School Enrollment in Grandview
The most common levels of schooling among the 5,558 students in Grandview are middle school (1,460 | 26.3%), elementary school (1,146 | 20.6%), and high school (1,027 | 18.5%).
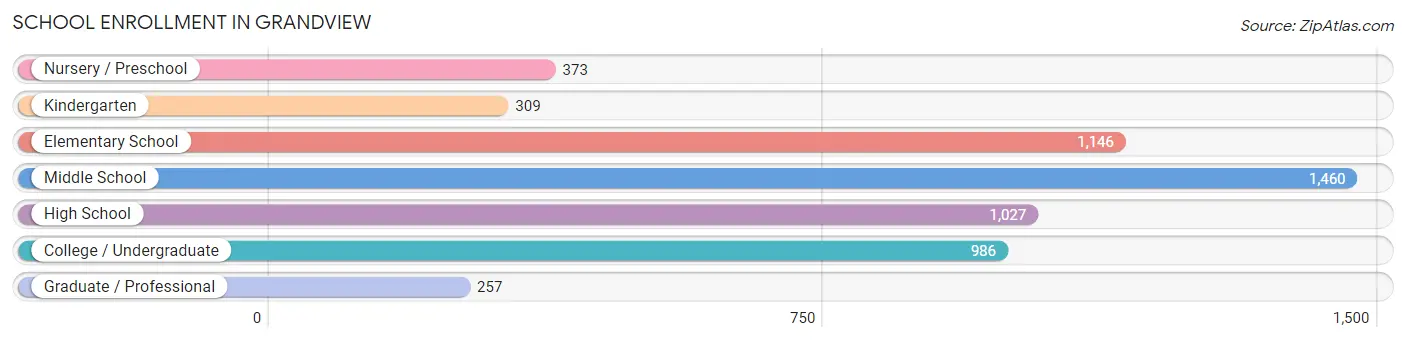
| School Level | # Students | % Students |
| Nursery / Preschool | 373 | 6.7% |
| Kindergarten | 309 | 5.6% |
| Elementary School | 1,146 | 20.6% |
| Middle School | 1,460 | 26.3% |
| High School | 1,027 | 18.5% |
| College / Undergraduate | 986 | 17.7% |
| Graduate / Professional | 257 | 4.6% |
| Total | 5,558 | 100.0% |
School Enrollment by Age by Funding Source in Grandview
Out of a total of 5,558 students who are enrolled in schools in Grandview, 1,328 (23.9%) attend a private institution, while the remaining 4,230 (76.1%) are enrolled in public schools. The age group of 3 to 4 year olds has the highest likelihood of being enrolled in private schools, with 190 (65.1% in the age bracket) enrolled. Conversely, the age group of 18 to 19 year olds has the lowest likelihood of being enrolled in a private school, with 217 (89.3% in the age bracket) attending a public institution.
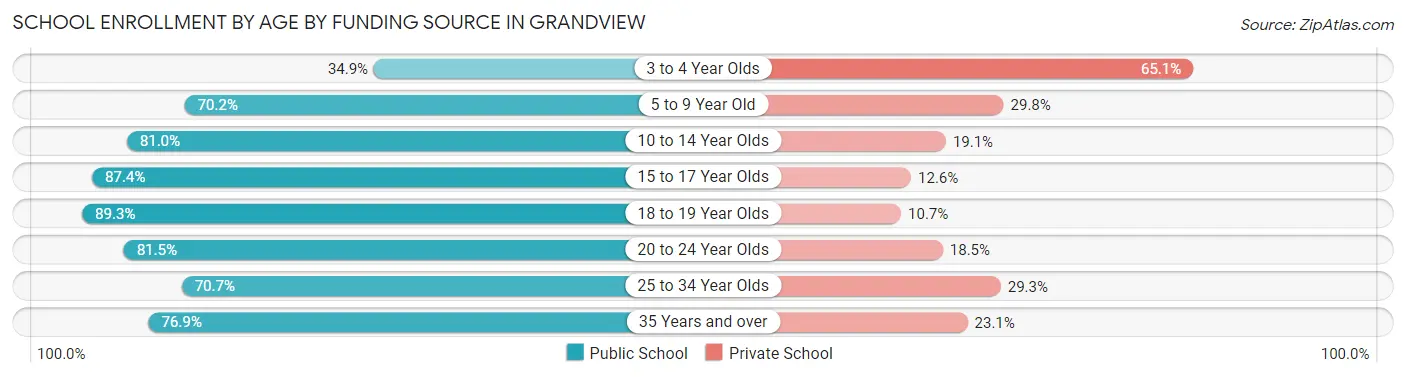
| Age Bracket | Public School | Private School |
| 3 to 4 Year Olds | 102 (34.9%) | 190 (65.1%) |
| 5 to 9 Year Old | 983 (70.2%) | 417 (29.8%) |
| 10 to 14 Year Olds | 1,385 (80.9%) | 326 (19.1%) |
| 15 to 17 Year Olds | 738 (87.4%) | 106 (12.6%) |
| 18 to 19 Year Olds | 217 (89.3%) | 26 (10.7%) |
| 20 to 24 Year Olds | 256 (81.5%) | 58 (18.5%) |
| 25 to 34 Year Olds | 331 (70.7%) | 137 (29.3%) |
| 35 Years and over | 220 (76.9%) | 66 (23.1%) |
| Total | 4,230 (76.1%) | 1,328 (23.9%) |
Educational Attainment by Field of Study in Grandview
Business (1,035 | 22.1%), liberal arts & history (666 | 14.2%), education (537 | 11.5%), bio, nature & agricultural (389 | 8.3%), and visual & performing arts (357 | 7.6%) are the most common fields of study among 4,684 individuals in Grandview who have obtained a bachelor's degree or higher.
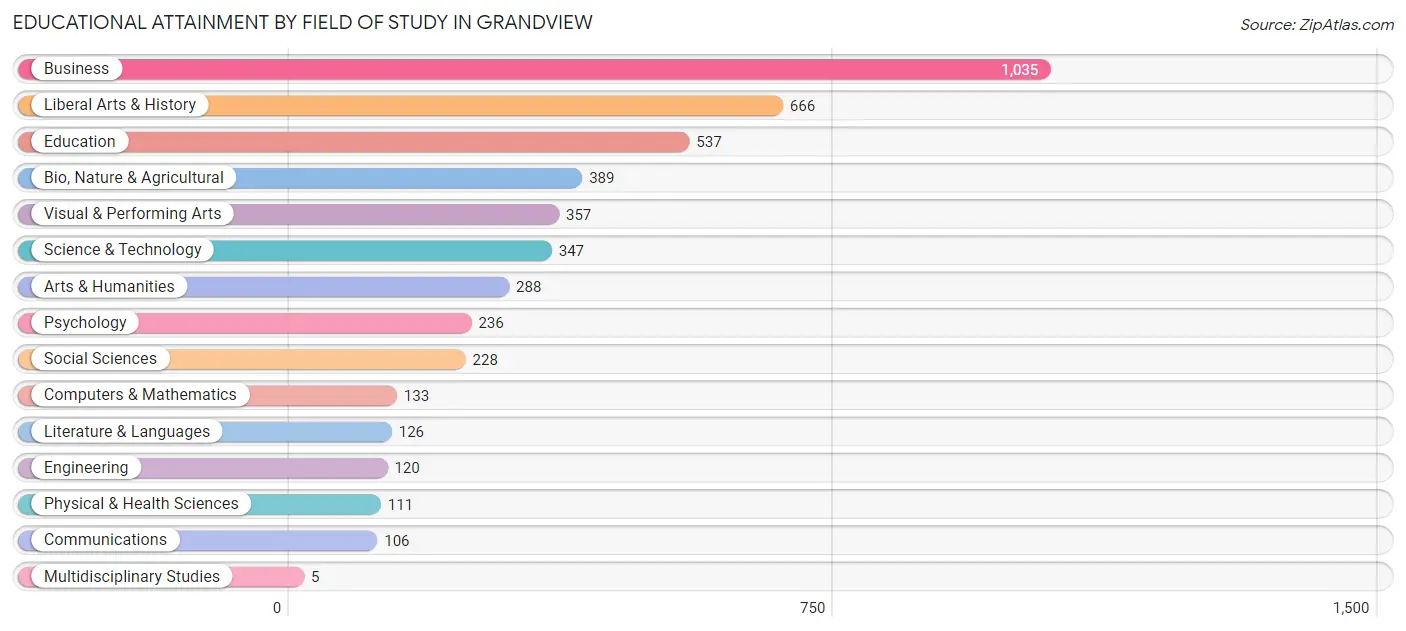
| Field of Study | # Graduates | % Graduates |
| Computers & Mathematics | 133 | 2.8% |
| Bio, Nature & Agricultural | 389 | 8.3% |
| Physical & Health Sciences | 111 | 2.4% |
| Psychology | 236 | 5.0% |
| Social Sciences | 228 | 4.9% |
| Engineering | 120 | 2.6% |
| Multidisciplinary Studies | 5 | 0.1% |
| Science & Technology | 347 | 7.4% |
| Business | 1,035 | 22.1% |
| Education | 537 | 11.5% |
| Literature & Languages | 126 | 2.7% |
| Liberal Arts & History | 666 | 14.2% |
| Visual & Performing Arts | 357 | 7.6% |
| Communications | 106 | 2.3% |
| Arts & Humanities | 288 | 6.1% |
| Total | 4,684 | 100.0% |
Transportation & Commute in Grandview
Vehicle Availability by Sex in Grandview
The most prevalent vehicle ownership categories in Grandview are males with 2 vehicles (2,401, accounting for 37.5%) and females with 2 vehicles (2,249, making up 38.5%).
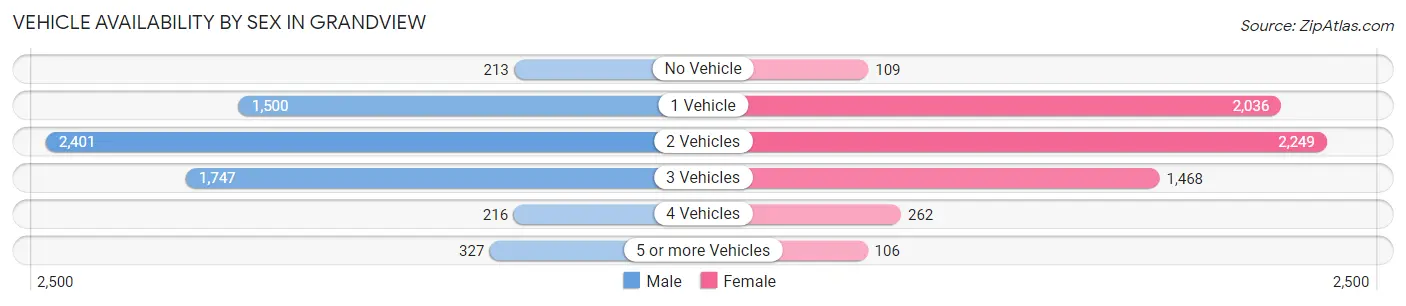
| Vehicles Available | Male | Female |
| No Vehicle | 213 (3.3%) | 109 (1.8%) |
| 1 Vehicle | 1,500 (23.4%) | 2,036 (32.7%) |
| 2 Vehicles | 2,401 (37.5%) | 2,249 (36.1%) |
| 3 Vehicles | 1,747 (27.3%) | 1,468 (23.6%) |
| 4 Vehicles | 216 (3.4%) | 262 (4.2%) |
| 5 or more Vehicles | 327 (5.1%) | 106 (1.7%) |
| Total | 6,404 (100.0%) | 6,230 (100.0%) |
Commute Time in Grandview
The most frequently occuring commute durations in Grandview are 30 to 34 minutes (2,175 commuters, 19.3%), 20 to 24 minutes (2,051 commuters, 18.2%), and 15 to 19 minutes (1,579 commuters, 14.0%).
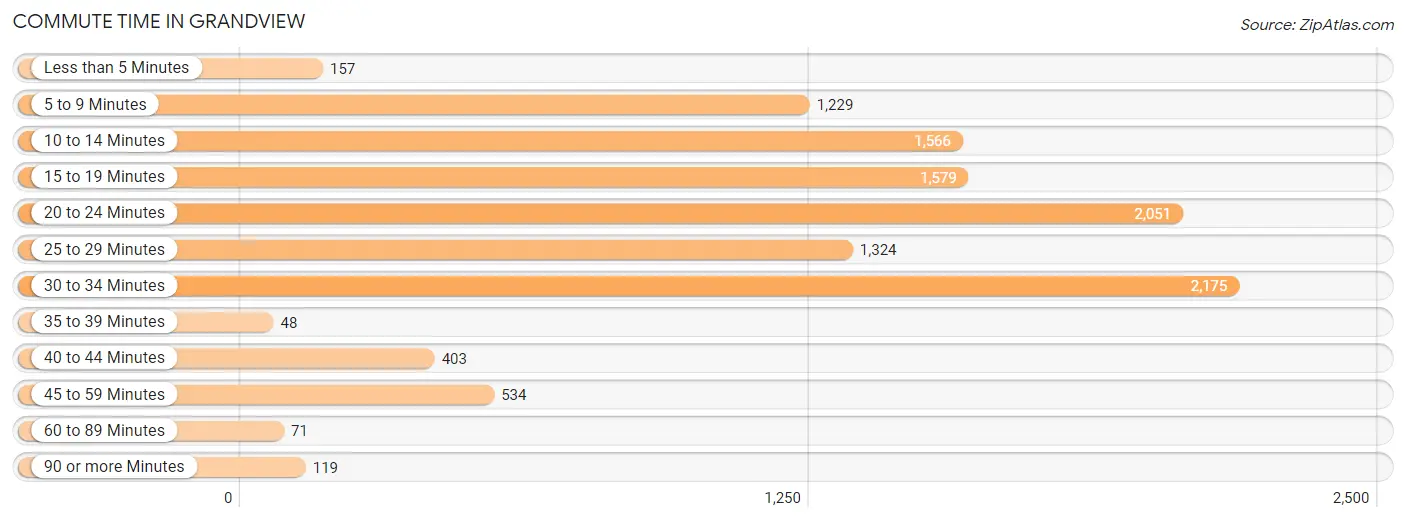
| Commute Time | # Commuters | % Commuters |
| Less than 5 Minutes | 157 | 1.4% |
| 5 to 9 Minutes | 1,229 | 10.9% |
| 10 to 14 Minutes | 1,566 | 13.9% |
| 15 to 19 Minutes | 1,579 | 14.0% |
| 20 to 24 Minutes | 2,051 | 18.2% |
| 25 to 29 Minutes | 1,324 | 11.8% |
| 30 to 34 Minutes | 2,175 | 19.3% |
| 35 to 39 Minutes | 48 | 0.4% |
| 40 to 44 Minutes | 403 | 3.6% |
| 45 to 59 Minutes | 534 | 4.7% |
| 60 to 89 Minutes | 71 | 0.6% |
| 90 or more Minutes | 119 | 1.1% |
Commute Time by Sex in Grandview
The most common commute times in Grandview are 20 to 24 minutes (1,219 commuters, 20.8%) for males and 30 to 34 minutes (1,102 commuters, 20.5%) for females.
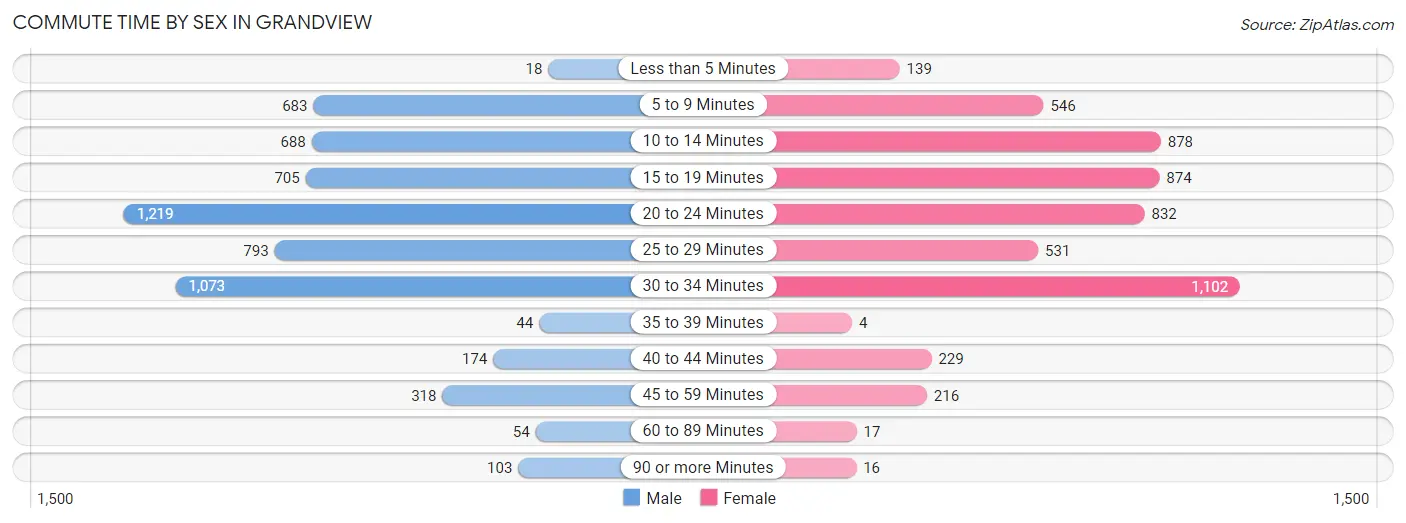
| Commute Time | Male | Female |
| Less than 5 Minutes | 18 (0.3%) | 139 (2.6%) |
| 5 to 9 Minutes | 683 (11.6%) | 546 (10.1%) |
| 10 to 14 Minutes | 688 (11.7%) | 878 (16.3%) |
| 15 to 19 Minutes | 705 (12.0%) | 874 (16.2%) |
| 20 to 24 Minutes | 1,219 (20.8%) | 832 (15.4%) |
| 25 to 29 Minutes | 793 (13.5%) | 531 (9.9%) |
| 30 to 34 Minutes | 1,073 (18.3%) | 1,102 (20.5%) |
| 35 to 39 Minutes | 44 (0.7%) | 4 (0.1%) |
| 40 to 44 Minutes | 174 (3.0%) | 229 (4.3%) |
| 45 to 59 Minutes | 318 (5.4%) | 216 (4.0%) |
| 60 to 89 Minutes | 54 (0.9%) | 17 (0.3%) |
| 90 or more Minutes | 103 (1.8%) | 16 (0.3%) |
Time of Departure to Work by Sex in Grandview
The most frequent times of departure to work in Grandview are 7:30 AM to 7:59 AM (690, 11.7%) for males and 7:00 AM to 7:29 AM (862, 16.0%) for females.
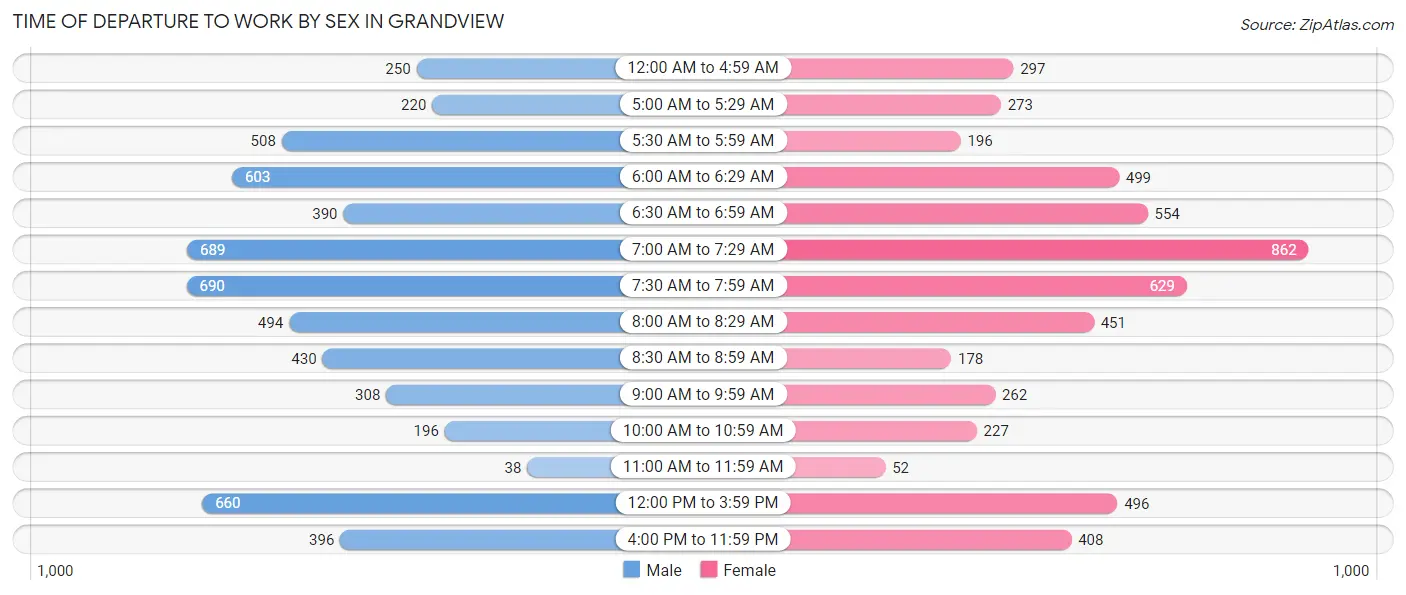
| Time of Departure | Male | Female |
| 12:00 AM to 4:59 AM | 250 (4.3%) | 297 (5.5%) |
| 5:00 AM to 5:29 AM | 220 (3.7%) | 273 (5.1%) |
| 5:30 AM to 5:59 AM | 508 (8.6%) | 196 (3.6%) |
| 6:00 AM to 6:29 AM | 603 (10.3%) | 499 (9.3%) |
| 6:30 AM to 6:59 AM | 390 (6.6%) | 554 (10.3%) |
| 7:00 AM to 7:29 AM | 689 (11.7%) | 862 (16.0%) |
| 7:30 AM to 7:59 AM | 690 (11.7%) | 629 (11.7%) |
| 8:00 AM to 8:29 AM | 494 (8.4%) | 451 (8.4%) |
| 8:30 AM to 8:59 AM | 430 (7.3%) | 178 (3.3%) |
| 9:00 AM to 9:59 AM | 308 (5.2%) | 262 (4.9%) |
| 10:00 AM to 10:59 AM | 196 (3.3%) | 227 (4.2%) |
| 11:00 AM to 11:59 AM | 38 (0.6%) | 52 (1.0%) |
| 12:00 PM to 3:59 PM | 660 (11.2%) | 496 (9.2%) |
| 4:00 PM to 11:59 PM | 396 (6.7%) | 408 (7.6%) |
| Total | 5,872 (100.0%) | 5,384 (100.0%) |
Housing Occupancy in Grandview
Occupancy by Ownership in Grandview
Of the total 11,159 dwellings in Grandview, owner-occupied units account for 5,574 (49.9%), while renter-occupied units make up 5,585 (50.0%).
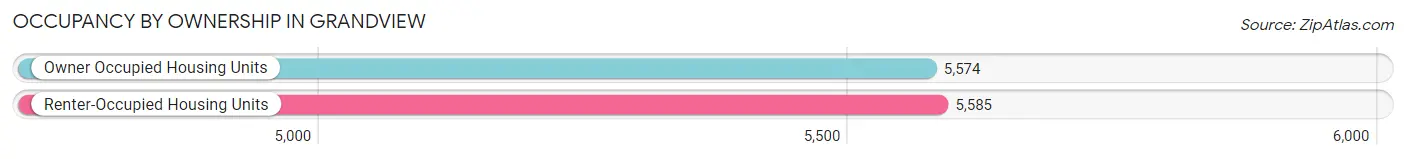
| Occupancy | # Housing Units | % Housing Units |
| Owner Occupied Housing Units | 5,574 | 49.9% |
| Renter-Occupied Housing Units | 5,585 | 50.0% |
| Total Occupied Housing Units | 11,159 | 100.0% |
Occupancy by Household Size in Grandview
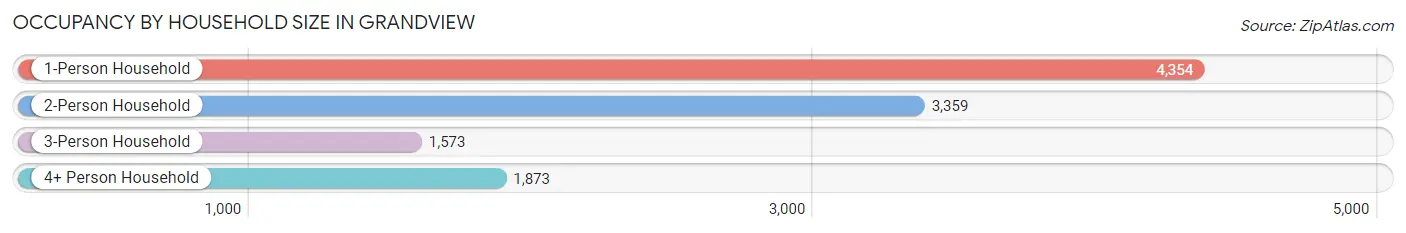
| Household Size | # Housing Units | % Housing Units |
| 1-Person Household | 4,354 | 39.0% |
| 2-Person Household | 3,359 | 30.1% |
| 3-Person Household | 1,573 | 14.1% |
| 4+ Person Household | 1,873 | 16.8% |
| Total Housing Units | 11,159 | 100.0% |
Occupancy by Ownership by Household Size in Grandview
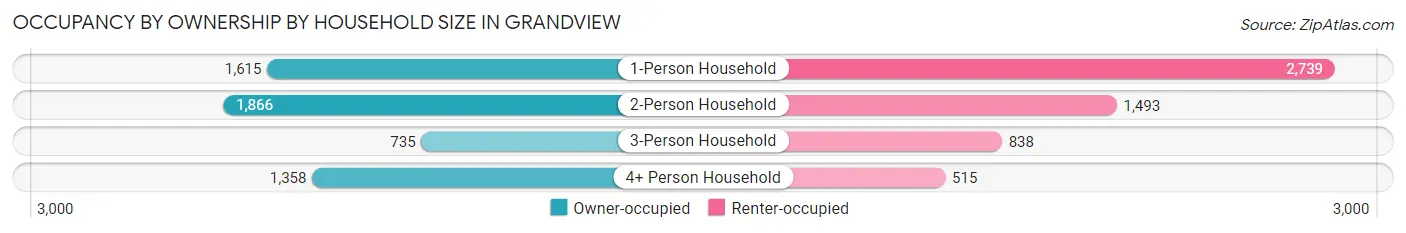
| Household Size | Owner-occupied | Renter-occupied |
| 1-Person Household | 1,615 (37.1%) | 2,739 (62.9%) |
| 2-Person Household | 1,866 (55.5%) | 1,493 (44.5%) |
| 3-Person Household | 735 (46.7%) | 838 (53.3%) |
| 4+ Person Household | 1,358 (72.5%) | 515 (27.5%) |
| Total Housing Units | 5,574 (49.9%) | 5,585 (50.0%) |
Occupancy by Educational Attainment in Grandview
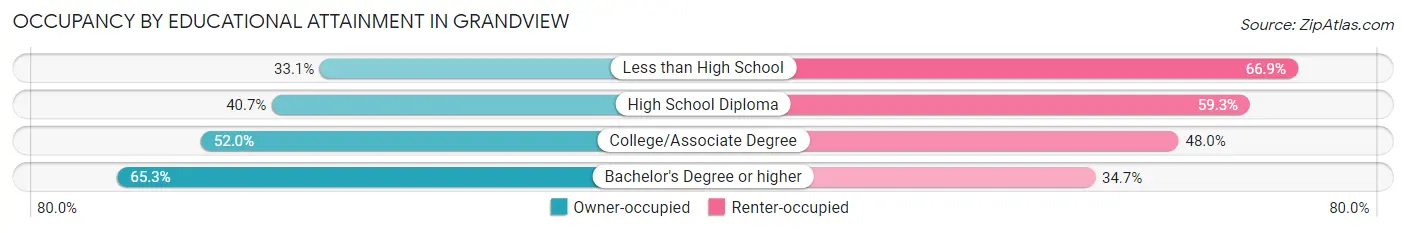
| Household Size | Owner-occupied | Renter-occupied |
| Less than High School | 328 (33.1%) | 662 (66.9%) |
| High School Diploma | 1,461 (40.7%) | 2,126 (59.3%) |
| College/Associate Degree | 2,012 (52.0%) | 1,854 (48.0%) |
| Bachelor's Degree or higher | 1,773 (65.3%) | 943 (34.7%) |
Occupancy by Age of Householder in Grandview
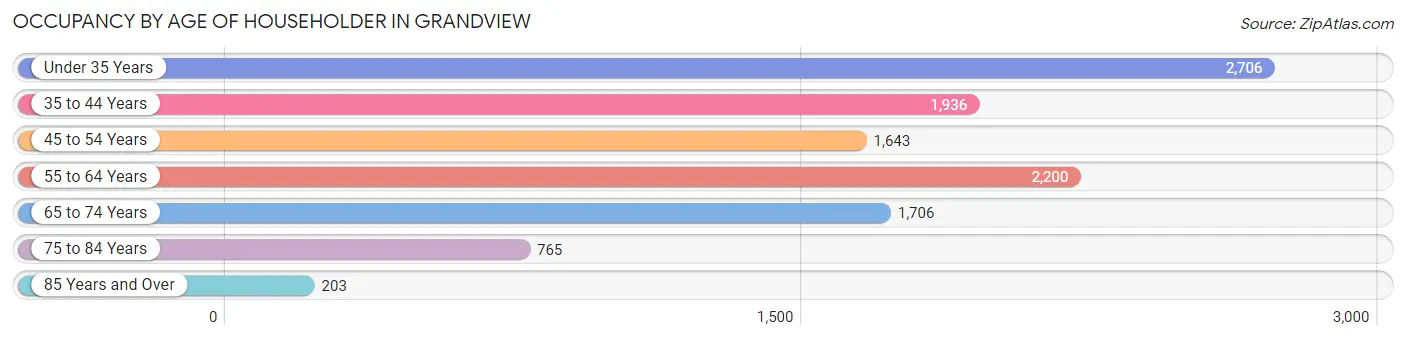
| Age Bracket | # Households | % Households |
| Under 35 Years | 2,706 | 24.2% |
| 35 to 44 Years | 1,936 | 17.3% |
| 45 to 54 Years | 1,643 | 14.7% |
| 55 to 64 Years | 2,200 | 19.7% |
| 65 to 74 Years | 1,706 | 15.3% |
| 75 to 84 Years | 765 | 6.9% |
| 85 Years and Over | 203 | 1.8% |
| Total | 11,159 | 100.0% |
Housing Finances in Grandview
Median Income by Occupancy in Grandview
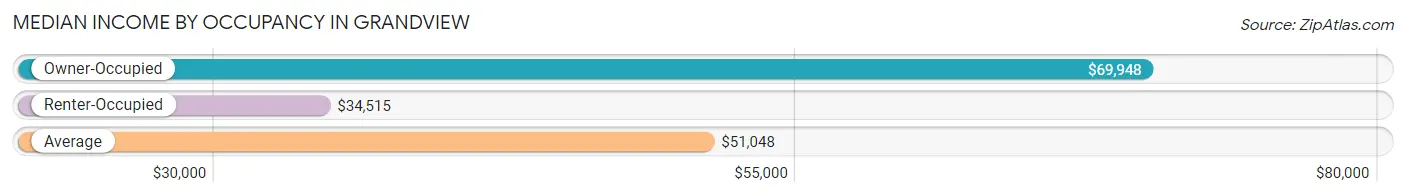
| Occupancy Type | # Households | Median Income |
| Owner-Occupied | 5,574 (49.9%) | $69,948 |
| Renter-Occupied | 5,585 (50.0%) | $34,515 |
| Average | 11,159 (100.0%) | $51,048 |
Occupancy by Householder Income Bracket in Grandview
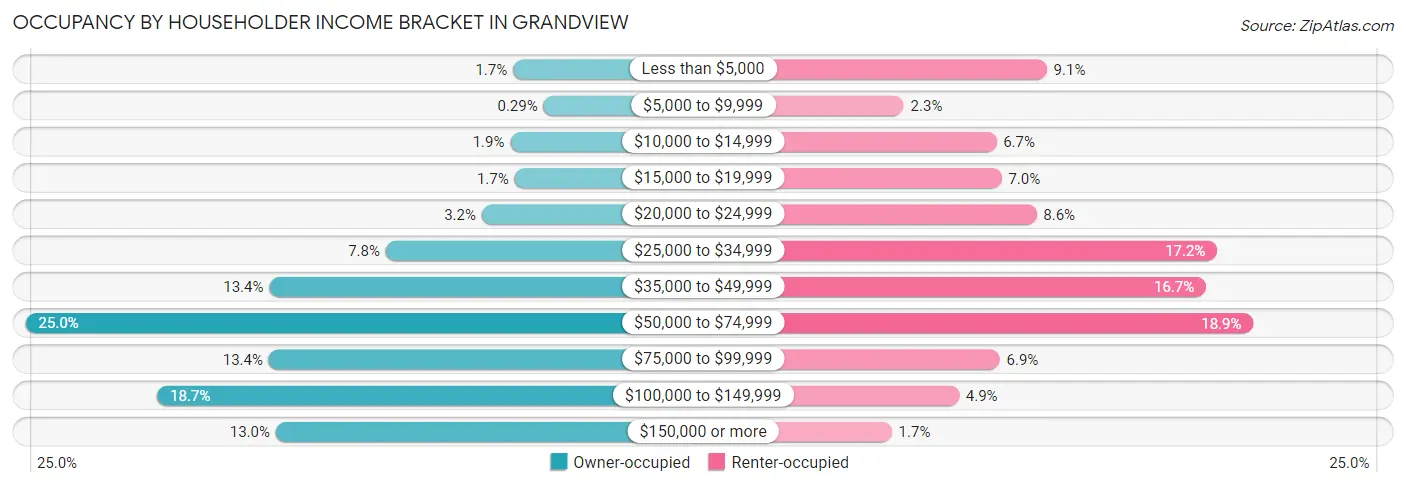
| Income Bracket | Owner-occupied | Renter-occupied |
| Less than $5,000 | 97 (1.7%) | 508 (9.1%) |
| $5,000 to $9,999 | 16 (0.3%) | 128 (2.3%) |
| $10,000 to $14,999 | 104 (1.9%) | 374 (6.7%) |
| $15,000 to $19,999 | 93 (1.7%) | 388 (7.0%) |
| $20,000 to $24,999 | 180 (3.2%) | 481 (8.6%) |
| $25,000 to $34,999 | 435 (7.8%) | 962 (17.2%) |
| $35,000 to $49,999 | 744 (13.4%) | 932 (16.7%) |
| $50,000 to $74,999 | 1,391 (25.0%) | 1,058 (18.9%) |
| $75,000 to $99,999 | 745 (13.4%) | 383 (6.9%) |
| $100,000 to $149,999 | 1,042 (18.7%) | 275 (4.9%) |
| $150,000 or more | 727 (13.0%) | 96 (1.7%) |
| Total | 5,574 (100.0%) | 5,585 (100.0%) |
Monthly Housing Cost Tiers in Grandview
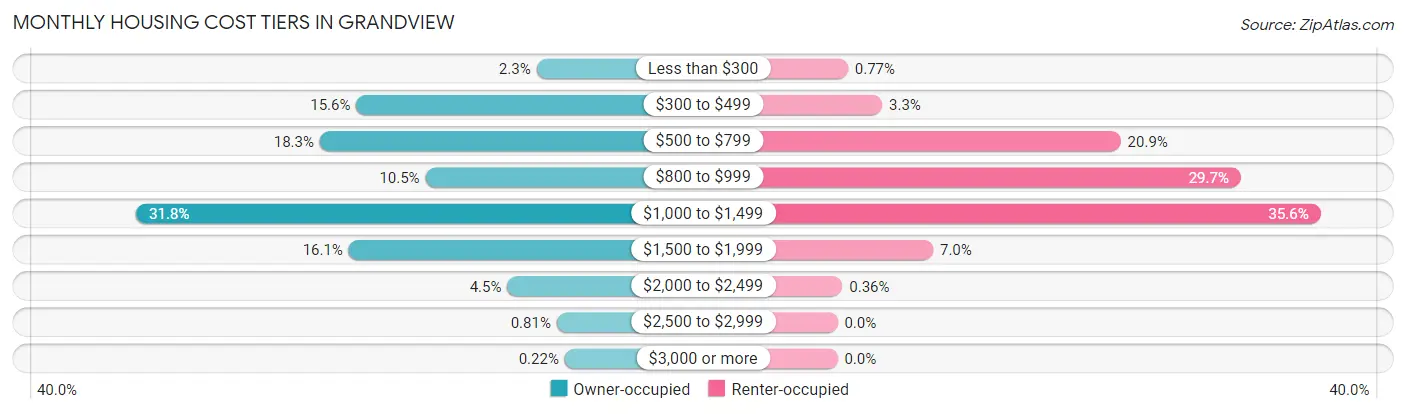
| Monthly Cost | Owner-occupied | Renter-occupied |
| Less than $300 | 128 (2.3%) | 43 (0.8%) |
| $300 to $499 | 868 (15.6%) | 184 (3.3%) |
| $500 to $799 | 1,018 (18.3%) | 1,165 (20.9%) |
| $800 to $999 | 584 (10.5%) | 1,659 (29.7%) |
| $1,000 to $1,499 | 1,772 (31.8%) | 1,987 (35.6%) |
| $1,500 to $1,999 | 899 (16.1%) | 393 (7.0%) |
| $2,000 to $2,499 | 248 (4.4%) | 20 (0.4%) |
| $2,500 to $2,999 | 45 (0.8%) | 0 (0.0%) |
| $3,000 or more | 12 (0.2%) | 0 (0.0%) |
| Total | 5,574 (100.0%) | 5,585 (100.0%) |
Physical Housing Characteristics in Grandview
Housing Structures in Grandview
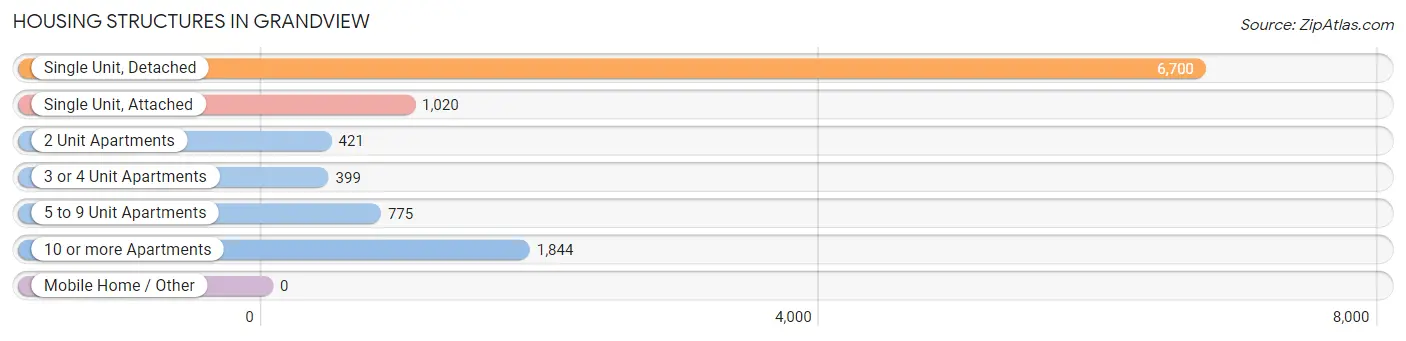
| Structure Type | # Housing Units | % Housing Units |
| Single Unit, Detached | 6,700 | 60.0% |
| Single Unit, Attached | 1,020 | 9.1% |
| 2 Unit Apartments | 421 | 3.8% |
| 3 or 4 Unit Apartments | 399 | 3.6% |
| 5 to 9 Unit Apartments | 775 | 7.0% |
| 10 or more Apartments | 1,844 | 16.5% |
| Mobile Home / Other | 0 | 0.0% |
| Total | 11,159 | 100.0% |
Housing Structures by Occupancy in Grandview
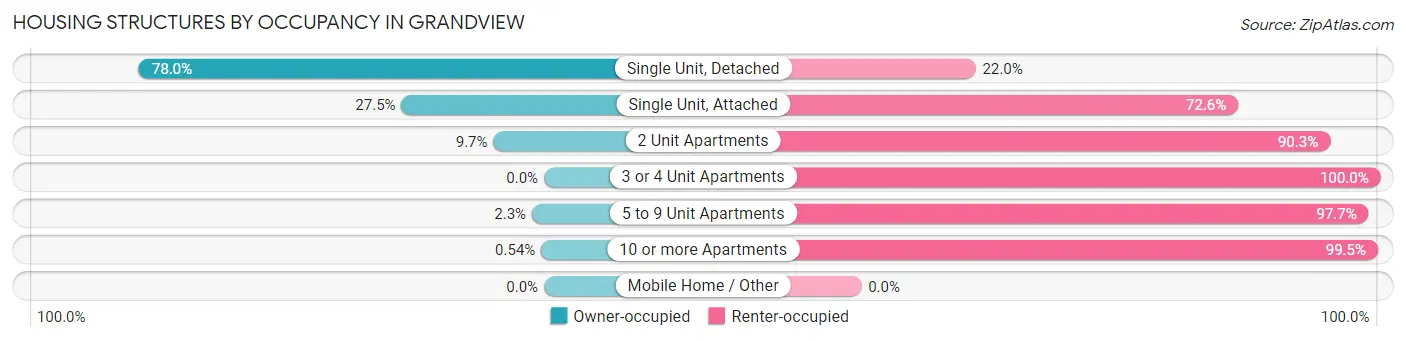
| Structure Type | Owner-occupied | Renter-occupied |
| Single Unit, Detached | 5,225 (78.0%) | 1,475 (22.0%) |
| Single Unit, Attached | 280 (27.5%) | 740 (72.6%) |
| 2 Unit Apartments | 41 (9.7%) | 380 (90.3%) |
| 3 or 4 Unit Apartments | 0 (0.0%) | 399 (100.0%) |
| 5 to 9 Unit Apartments | 18 (2.3%) | 757 (97.7%) |
| 10 or more Apartments | 10 (0.5%) | 1,834 (99.5%) |
| Mobile Home / Other | 0 (0.0%) | 0 (0.0%) |
| Total | 5,574 (49.9%) | 5,585 (50.0%) |
Housing Structures by Number of Rooms in Grandview
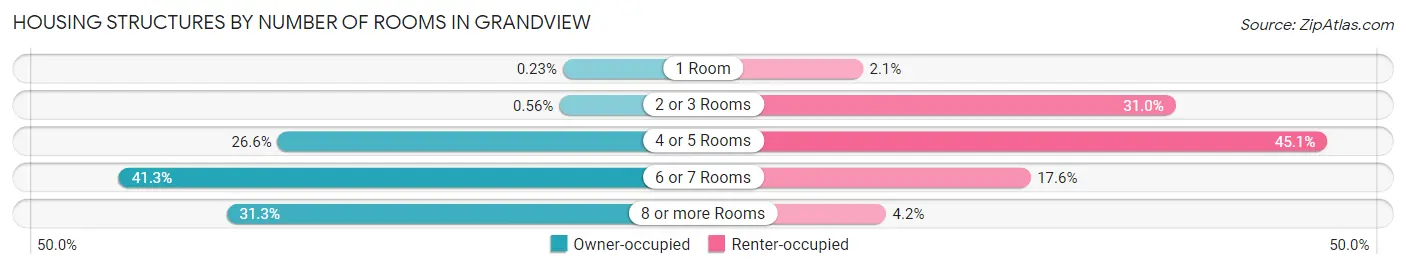
| Number of Rooms | Owner-occupied | Renter-occupied |
| 1 Room | 13 (0.2%) | 117 (2.1%) |
| 2 or 3 Rooms | 31 (0.6%) | 1,733 (31.0%) |
| 4 or 5 Rooms | 1,483 (26.6%) | 2,516 (45.1%) |
| 6 or 7 Rooms | 2,301 (41.3%) | 983 (17.6%) |
| 8 or more Rooms | 1,746 (31.3%) | 236 (4.2%) |
| Total | 5,574 (100.0%) | 5,585 (100.0%) |
Housing Structure by Heating Type in Grandview
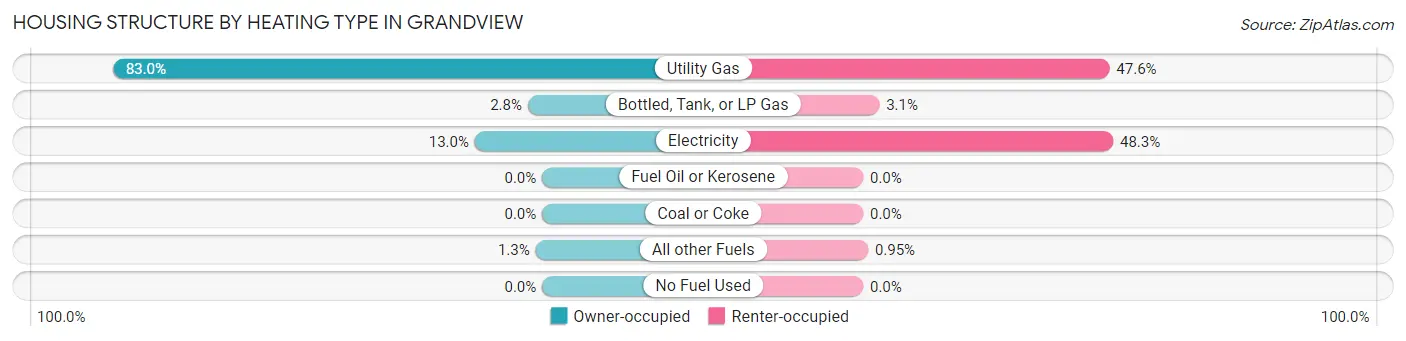
| Heating Type | Owner-occupied | Renter-occupied |
| Utility Gas | 4,624 (83.0%) | 2,659 (47.6%) |
| Bottled, Tank, or LP Gas | 154 (2.8%) | 175 (3.1%) |
| Electricity | 725 (13.0%) | 2,698 (48.3%) |
| Fuel Oil or Kerosene | 0 (0.0%) | 0 (0.0%) |
| Coal or Coke | 0 (0.0%) | 0 (0.0%) |
| All other Fuels | 71 (1.3%) | 53 (0.9%) |
| No Fuel Used | 0 (0.0%) | 0 (0.0%) |
| Total | 5,574 (100.0%) | 5,585 (100.0%) |
Household Vehicle Usage in Grandview
| Vehicles per Household | Owner-occupied | Renter-occupied |
| No Vehicle | 46 (0.8%) | 676 (12.1%) |
| 1 Vehicle | 1,457 (26.1%) | 3,254 (58.3%) |
| 2 Vehicles | 2,075 (37.2%) | 1,378 (24.7%) |
| 3 or more Vehicles | 1,996 (35.8%) | 277 (5.0%) |
| Total | 5,574 (100.0%) | 5,585 (100.0%) |
Real Estate & Mortgages in Grandview
Real Estate and Mortgage Overview in Grandview
| Characteristic | Without Mortgage | With Mortgage |
| Housing Units | 1,901 | 3,673 |
| Median Property Value | $132,100 | $169,900 |
| Median Household Income | $61,817 | $559 |
| Monthly Housing Costs | $497 | $12 |
| Real Estate Taxes | $1,785 | $78 |
Property Value by Mortgage Status in Grandview
| Property Value | Without Mortgage | With Mortgage |
| Less than $50,000 | 81 (4.3%) | 39 (1.1%) |
| $50,000 to $99,999 | 440 (23.2%) | 489 (13.3%) |
| $100,000 to $299,999 | 1,283 (67.5%) | 2,999 (81.7%) |
| $300,000 to $499,999 | 37 (1.9%) | 116 (3.2%) |
| $500,000 to $749,999 | 41 (2.2%) | 6 (0.2%) |
| $750,000 to $999,999 | 18 (0.9%) | 0 (0.0%) |
| $1,000,000 or more | 1 (0.1%) | 24 (0.6%) |
| Total | 1,901 (100.0%) | 3,673 (100.0%) |
Household Income by Mortgage Status in Grandview
| Household Income | Without Mortgage | With Mortgage |
| Less than $10,000 | 69 (3.6%) | 4 (0.1%) |
| $10,000 to $24,999 | 207 (10.9%) | 44 (1.2%) |
| $25,000 to $34,999 | 177 (9.3%) | 170 (4.6%) |
| $35,000 to $49,999 | 234 (12.3%) | 258 (7.0%) |
| $50,000 to $74,999 | 501 (26.4%) | 510 (13.9%) |
| $75,000 to $99,999 | 276 (14.5%) | 890 (24.2%) |
| $100,000 to $149,999 | 269 (14.1%) | 469 (12.8%) |
| $150,000 or more | 168 (8.8%) | 773 (21.0%) |
| Total | 1,901 (100.0%) | 3,673 (100.0%) |
Property Value to Household Income Ratio in Grandview
| Value-to-Income Ratio | Without Mortgage | With Mortgage |
| Less than 2.0x | 797 (41.9%) | 74,396 (2,025.5%) |
| 2.0x to 2.9x | 421 (22.2%) | 1,756 (47.8%) |
| 3.0x to 3.9x | 211 (11.1%) | 1,084 (29.5%) |
| 4.0x or more | 450 (23.7%) | 276 (7.5%) |
| Total | 1,901 (100.0%) | 3,673 (100.0%) |
Real Estate Taxes by Mortgage Status in Grandview
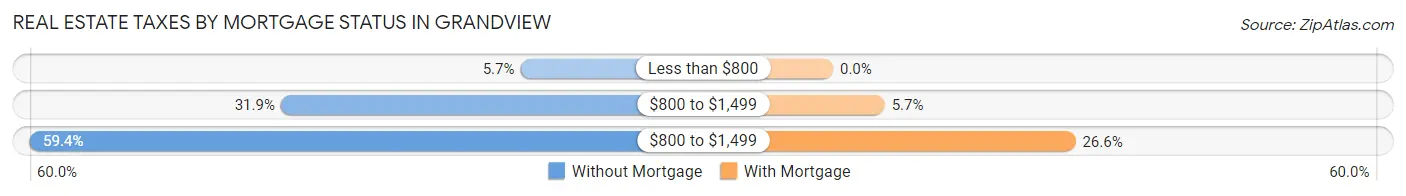
| Property Taxes | Without Mortgage | With Mortgage |
| Less than $800 | 108 (5.7%) | 0 (0.0%) |
| $800 to $1,499 | 607 (31.9%) | 208 (5.7%) |
| $800 to $1,499 | 1,129 (59.4%) | 976 (26.6%) |
| Total | 1,901 (100.0%) | 3,673 (100.0%) |
Health & Disability in Grandview
Health Insurance Coverage by Age in Grandview
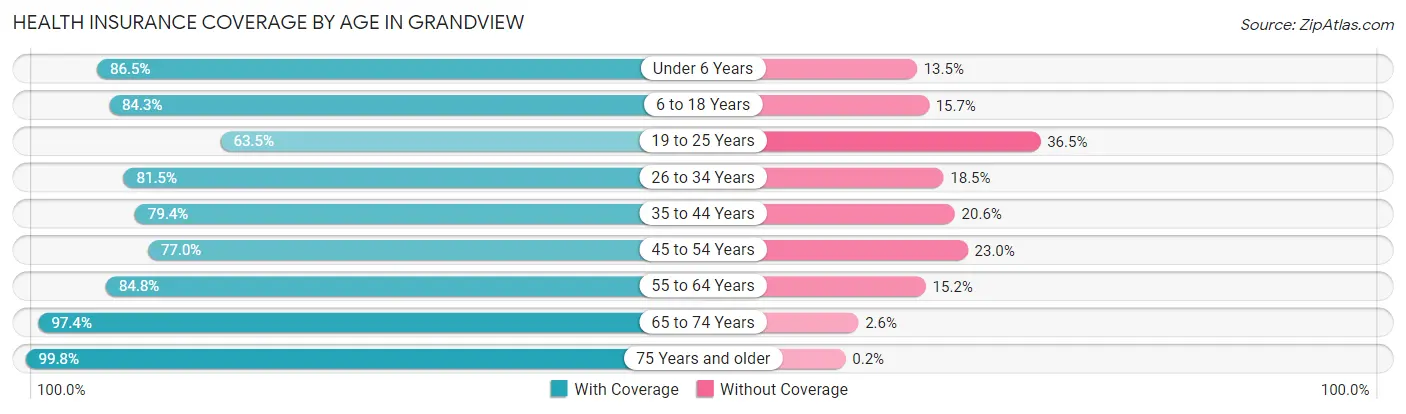
| Age Bracket | With Coverage | Without Coverage |
| Under 6 Years | 1,857 (86.5%) | 290 (13.5%) |
| 6 to 18 Years | 3,409 (84.3%) | 637 (15.7%) |
| 19 to 25 Years | 1,643 (63.5%) | 946 (36.5%) |
| 26 to 34 Years | 3,186 (81.5%) | 722 (18.5%) |
| 35 to 44 Years | 2,678 (79.4%) | 694 (20.6%) |
| 45 to 54 Years | 2,170 (77.0%) | 648 (23.0%) |
| 55 to 64 Years | 2,590 (84.8%) | 463 (15.2%) |
| 65 to 74 Years | 2,282 (97.4%) | 61 (2.6%) |
| 75 Years and older | 1,465 (99.8%) | 3 (0.2%) |
| Total | 21,280 (82.7%) | 4,464 (17.3%) |
Health Insurance Coverage by Citizenship Status in Grandview

| Citizenship Status | With Coverage | Without Coverage |
| Native Born | 1,857 (86.5%) | 290 (13.5%) |
| Foreign Born, Citizen | 3,409 (84.3%) | 637 (15.7%) |
| Foreign Born, not a Citizen | 1,643 (63.5%) | 946 (36.5%) |
Health Insurance Coverage by Household Income in Grandview
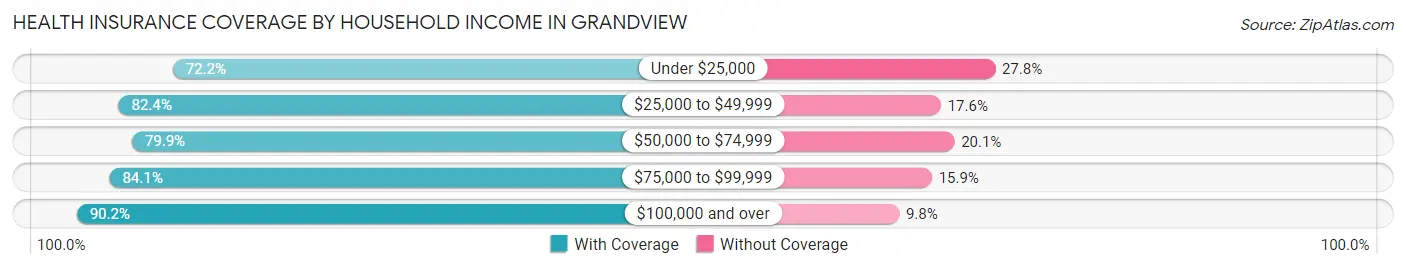
| Household Income | With Coverage | Without Coverage |
| Under $25,000 | 2,738 (72.2%) | 1,052 (27.8%) |
| $25,000 to $49,999 | 4,827 (82.4%) | 1,031 (17.6%) |
| $50,000 to $74,999 | 4,815 (79.9%) | 1,213 (20.1%) |
| $75,000 to $99,999 | 2,563 (84.1%) | 485 (15.9%) |
| $100,000 and over | 6,288 (90.2%) | 681 (9.8%) |
Public vs Private Health Insurance Coverage by Age in Grandview
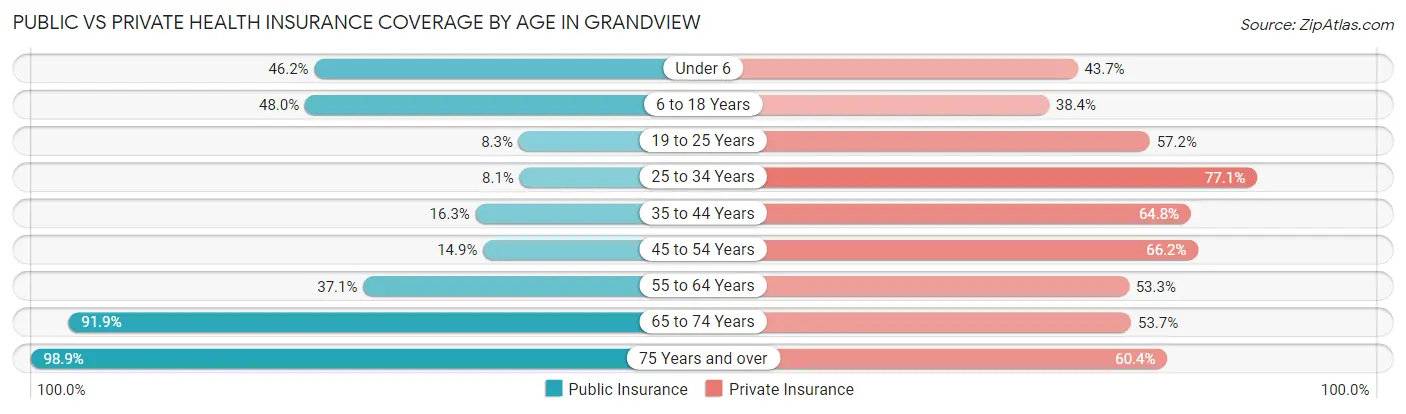
| Age Bracket | Public Insurance | Private Insurance |
| Under 6 | 992 (46.2%) | 939 (43.7%) |
| 6 to 18 Years | 1,940 (47.9%) | 1,555 (38.4%) |
| 19 to 25 Years | 214 (8.3%) | 1,480 (57.2%) |
| 25 to 34 Years | 317 (8.1%) | 3,012 (77.1%) |
| 35 to 44 Years | 549 (16.3%) | 2,185 (64.8%) |
| 45 to 54 Years | 419 (14.9%) | 1,865 (66.2%) |
| 55 to 64 Years | 1,134 (37.1%) | 1,626 (53.3%) |
| 65 to 74 Years | 2,153 (91.9%) | 1,258 (53.7%) |
| 75 Years and over | 1,452 (98.9%) | 887 (60.4%) |
| Total | 9,170 (35.6%) | 14,807 (57.5%) |
Disability Status by Sex by Age in Grandview
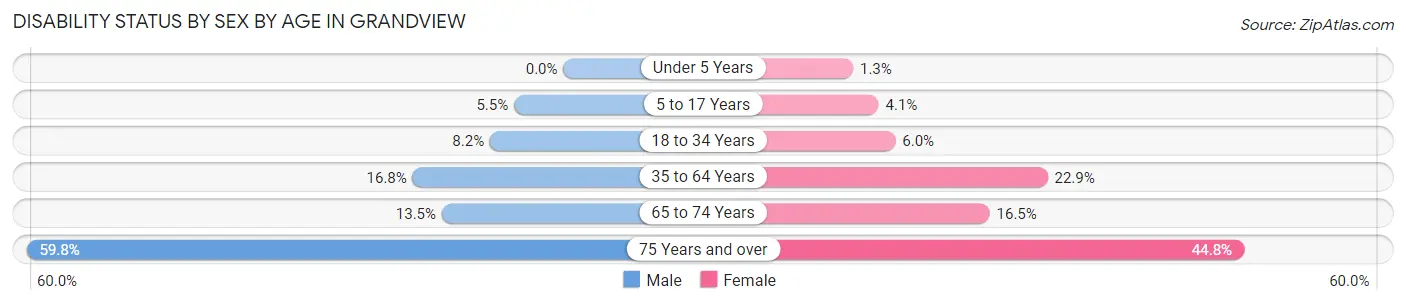
| Age Bracket | Male | Female |
| Under 5 Years | 0 (0.0%) | 9 (1.3%) |
| 5 to 17 Years | 104 (5.5%) | 91 (4.1%) |
| 18 to 34 Years | 276 (8.2%) | 197 (6.0%) |
| 35 to 64 Years | 745 (16.8%) | 1,101 (22.9%) |
| 65 to 74 Years | 123 (13.5%) | 236 (16.5%) |
| 75 Years and over | 345 (59.8%) | 399 (44.8%) |
Disability Class by Sex by Age in Grandview
Disability Class: Hearing Difficulty
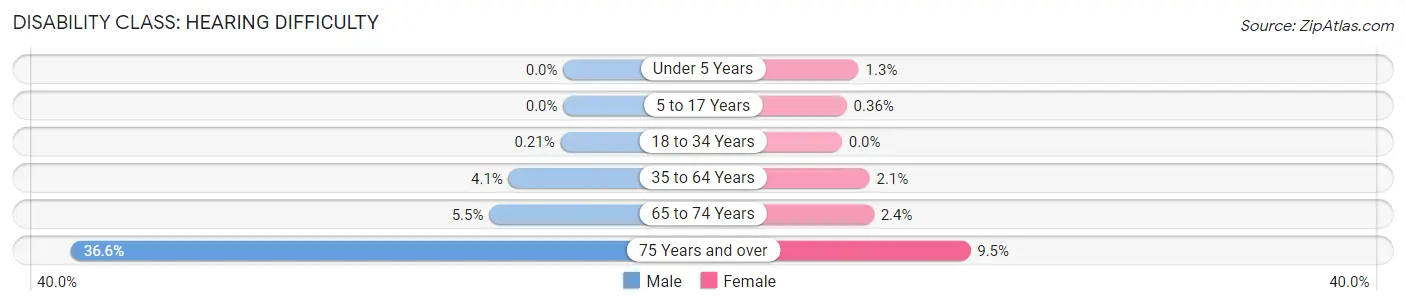
| Age Bracket | Male | Female |
| Under 5 Years | 0 (0.0%) | 9 (1.3%) |
| 5 to 17 Years | 0 (0.0%) | 8 (0.4%) |
| 18 to 34 Years | 7 (0.2%) | 0 (0.0%) |
| 35 to 64 Years | 180 (4.1%) | 99 (2.1%) |
| 65 to 74 Years | 50 (5.5%) | 34 (2.4%) |
| 75 Years and over | 211 (36.6%) | 85 (9.5%) |
Disability Class: Vision Difficulty
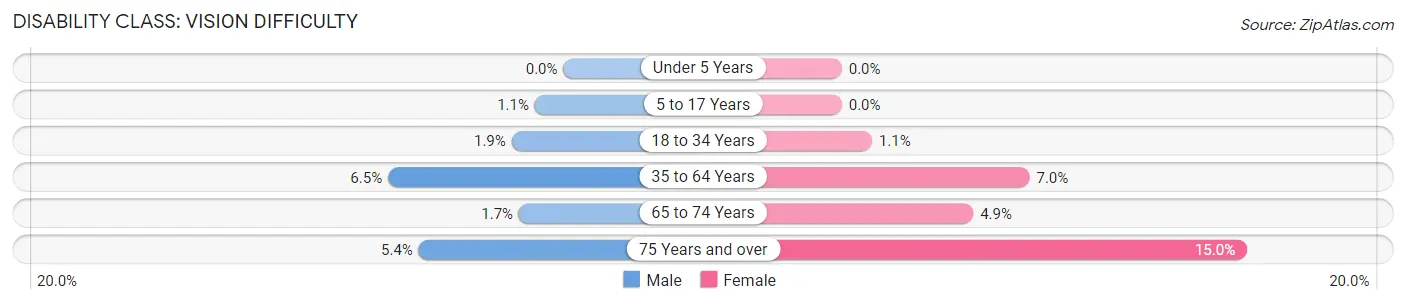
| Age Bracket | Male | Female |
| Under 5 Years | 0 (0.0%) | 0 (0.0%) |
| 5 to 17 Years | 20 (1.1%) | 0 (0.0%) |
| 18 to 34 Years | 65 (1.9%) | 37 (1.1%) |
| 35 to 64 Years | 289 (6.5%) | 335 (7.0%) |
| 65 to 74 Years | 15 (1.7%) | 70 (4.9%) |
| 75 Years and over | 31 (5.4%) | 134 (15.0%) |
Disability Class: Cognitive Difficulty
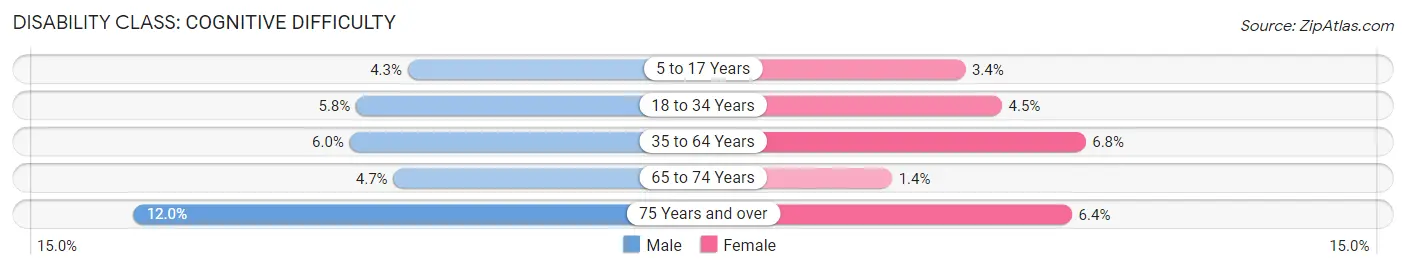
| Age Bracket | Male | Female |
| 5 to 17 Years | 82 (4.3%) | 76 (3.4%) |
| 18 to 34 Years | 195 (5.8%) | 147 (4.4%) |
| 35 to 64 Years | 264 (5.9%) | 326 (6.8%) |
| 65 to 74 Years | 43 (4.7%) | 20 (1.4%) |
| 75 Years and over | 69 (12.0%) | 57 (6.4%) |
Disability Class: Ambulatory Difficulty
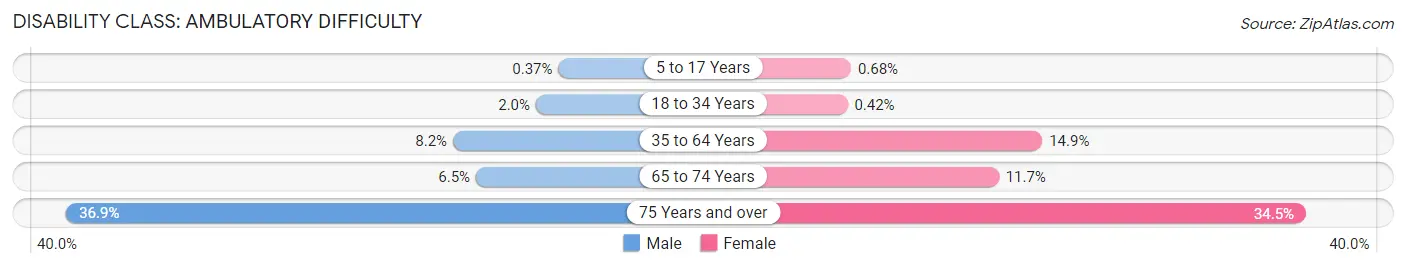
| Age Bracket | Male | Female |
| 5 to 17 Years | 7 (0.4%) | 15 (0.7%) |
| 18 to 34 Years | 69 (2.0%) | 14 (0.4%) |
| 35 to 64 Years | 364 (8.2%) | 715 (14.9%) |
| 65 to 74 Years | 59 (6.5%) | 167 (11.7%) |
| 75 Years and over | 213 (36.9%) | 307 (34.5%) |
Disability Class: Self-Care Difficulty
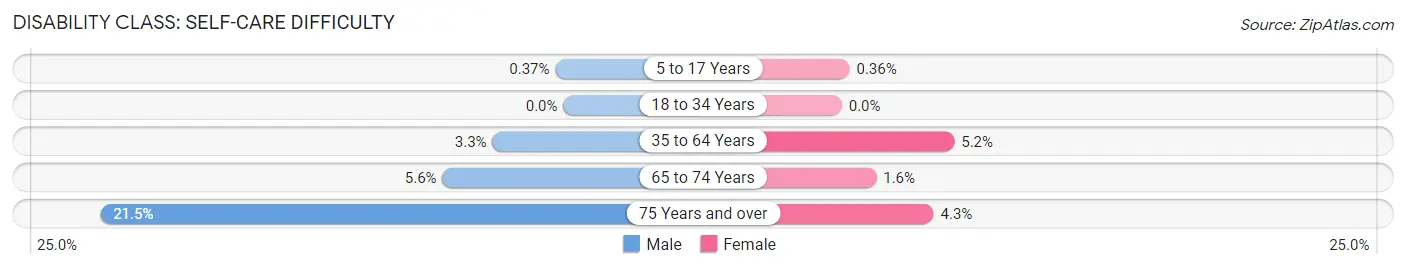
| Age Bracket | Male | Female |
| 5 to 17 Years | 7 (0.4%) | 8 (0.4%) |
| 18 to 34 Years | 0 (0.0%) | 0 (0.0%) |
| 35 to 64 Years | 146 (3.3%) | 251 (5.2%) |
| 65 to 74 Years | 51 (5.6%) | 23 (1.6%) |
| 75 Years and over | 124 (21.5%) | 38 (4.3%) |
Technology Access in Grandview
Computing Device Access in Grandview
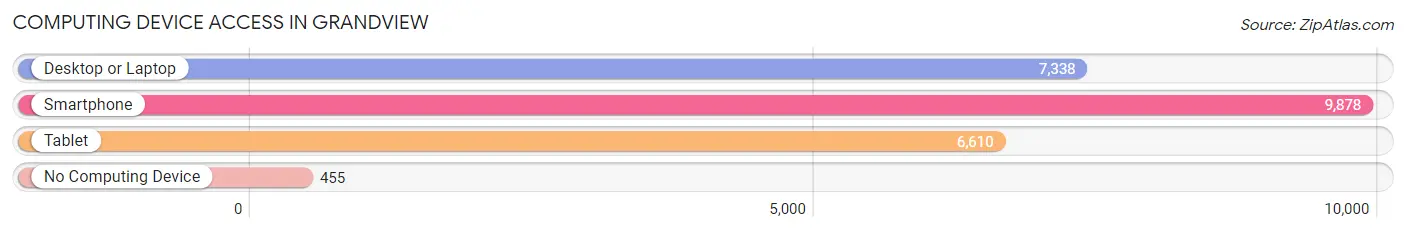
| Device Type | # Households | % Households |
| Desktop or Laptop | 7,338 | 65.8% |
| Smartphone | 9,878 | 88.5% |
| Tablet | 6,610 | 59.2% |
| No Computing Device | 455 | 4.1% |
| Total | 11,159 | 100.0% |
Internet Access in Grandview
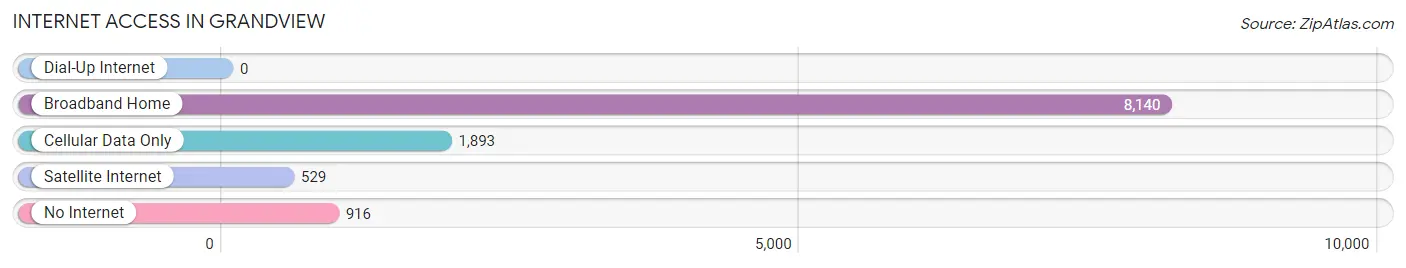
| Internet Type | # Households | % Households |
| Dial-Up Internet | 0 | 0.0% |
| Broadband Home | 8,140 | 73.0% |
| Cellular Data Only | 1,893 | 17.0% |
| Satellite Internet | 529 | 4.7% |
| No Internet | 916 | 8.2% |
| Total | 11,159 | 100.0% |
Grandview Summary
Geography
Grandview, Missouri is located in the southwestern corner of Jackson County, just south of Kansas City. The city is situated on the Missouri River, and is bordered by the cities of Kansas City, Raytown, and Belton. Grandview is located at the intersection of Interstate 49 and U.S. Highway 71. The city covers an area of 8.3 square miles, and has a population of 24,475 as of the 2010 census.
History
Grandview was founded in 1887 by a group of settlers from the nearby town of Grandview, Iowa. The town was originally known as Grandview Station, and was a stop on the Kansas City, Fort Scott, and Gulf Railroad. The town was officially incorporated in 1906, and the name was changed to Grandview in 1908.
The city experienced rapid growth in the early 20th century, and by the 1950s, Grandview had become a major industrial center. The city was home to several large factories, including a Ford Motor Company plant, a General Motors plant, and a Chrysler plant.
In the late 20th century, Grandview experienced a decline in its industrial base, and the city began to focus on developing its commercial and residential sectors. The city has since become a popular suburb of Kansas City, and is home to several large shopping centers and residential developments.
Economy
Grandview’s economy is largely based on retail and services. The city is home to several large shopping centers, including the Grandview Plaza Shopping Center, the Grandview Crossing Shopping Center, and the Grandview Commons Shopping Center. The city is also home to several large employers, including the Ford Motor Company, the General Motors plant, and the Chrysler plant.
The city’s largest employer is the Grandview School District, which employs over 1,000 people. Other major employers in the city include the Grandview Medical Center, the Grandview Regional Medical Center, and the Grandview Public Library.
Demographics
As of the 2010 census, Grandview had a population of 24,475. The racial makeup of the city was 79.3% White, 13.2% African American, 0.7% Native American, 1.3% Asian, 0.1% Pacific Islander, 2.2% from other races, and 3.2% from two or more races. Hispanic or Latino of any race were 5.2% of the population.
The median income for a household in the city was $45,945, and the median income for a family was $54,945. The per capita income for the city was $21,945. About 8.3% of families and 10.2% of the population were below the poverty line, including 14.2% of those under age 18 and 6.2% of those age 65 or over.
Common Questions
What is Per Capita Income in Grandview?
Per Capita income in Grandview is $28,151.
What is the Median Family Income in Grandview?
Median Family Income in Grandview is $61,456.
What is the Median Household income in Grandview?
Median Household Income in Grandview is $51,048.
What is Income or Wage Gap in Grandview?
Income or Wage Gap in Grandview is 17.0%.
Women in Grandview earn 83.0 cents for every dollar earned by a man.
What is Family Income Deficit in Grandview?
Family Income Deficit in Grandview is $11,336.
Families that are below poverty line in Grandview earn $11,336 less on average than the poverty threshold level.
What is Inequality or Gini Index in Grandview?
Inequality or Gini Index in Grandview is 0.42.
What is the Total Population of Grandview?
Total Population of Grandview is 25,921.
What is the Total Male Population of Grandview?
Total Male Population of Grandview is 12,452.
What is the Total Female Population of Grandview?
Total Female Population of Grandview is 13,469.
What is the Ratio of Males per 100 Females in Grandview?
There are 92.45 Males per 100 Females in Grandview.
What is the Ratio of Females per 100 Males in Grandview?
There are 108.17 Females per 100 Males in Grandview.
What is the Median Population Age in Grandview?
Median Population Age in Grandview is 35.9 Years.
What is the Average Family Size in Grandview
Average Family Size in Grandview is 3.1 People.
What is the Average Household Size in Grandview
Average Household Size in Grandview is 2.3 People.
How Large is the Labor Force in Grandview?
There are 13,806 People in the Labor Forcein in Grandview.
What is the Percentage of People in the Labor Force in Grandview?
67.2% of People are in the Labor Force in Grandview.
What is the Unemployment Rate in Grandview?
Unemployment Rate in Grandview is 6.4%.