St Joseph, MO Map & Demographics
St Joseph Map
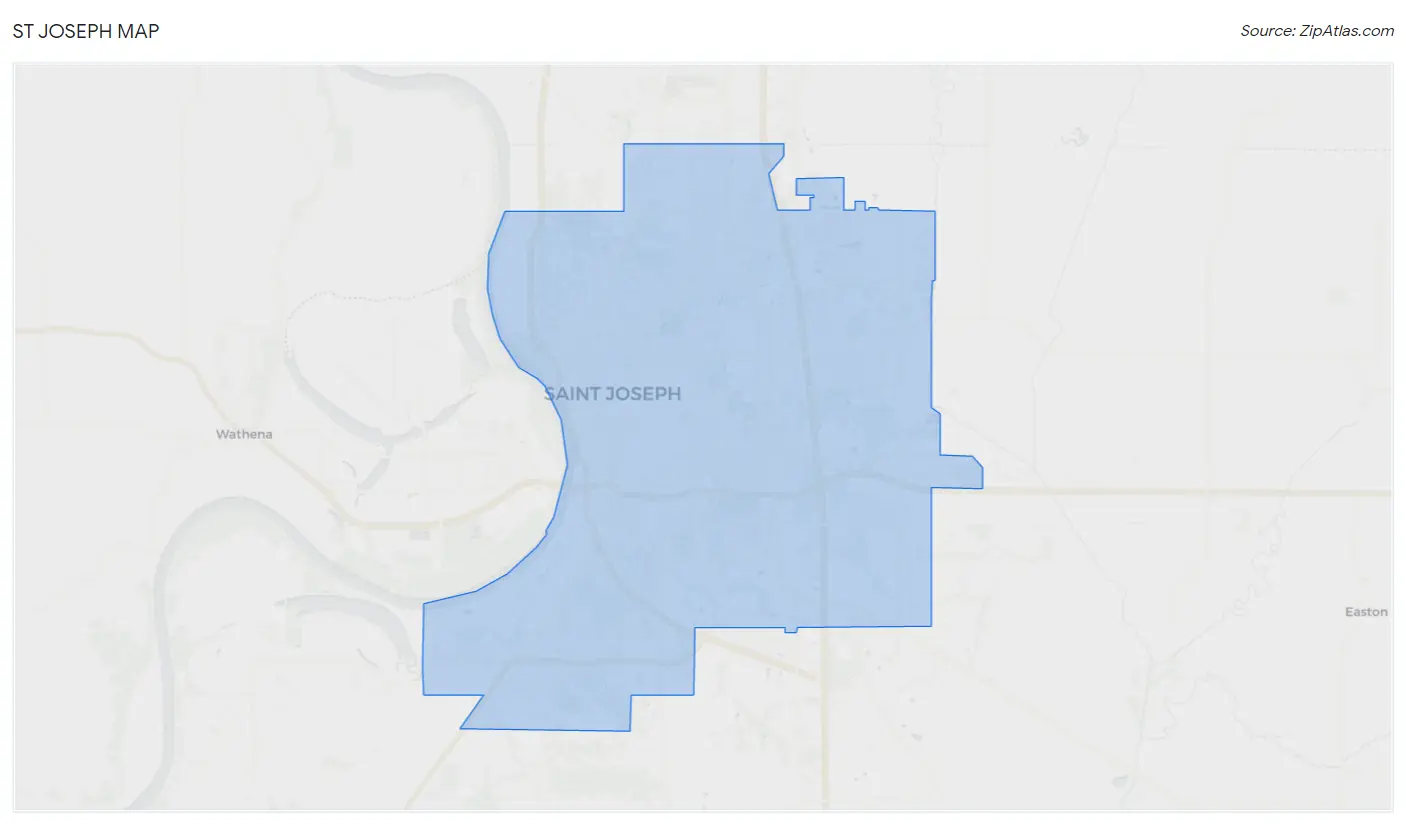
St Joseph Overview
$30,667
PER CAPITA INCOME
$68,146
AVG FAMILY INCOME
$54,515
AVG HOUSEHOLD INCOME
24.6%
WAGE / INCOME GAP [ % ]
75.4¢/ $1
WAGE / INCOME GAP [ $ ]
$11,840
FAMILY INCOME DEFICIT
0.48
INEQUALITY / GINI INDEX
72,198
TOTAL POPULATION
36,378
MALE POPULATION
35,820
FEMALE POPULATION
101.56
MALES / 100 FEMALES
98.47
FEMALES / 100 MALES
37.9
MEDIAN AGE
3.1
AVG FAMILY SIZE
2.4
AVG HOUSEHOLD SIZE
34,612
LABOR FORCE [ PEOPLE ]
59.6%
PERCENT IN LABOR FORCE
5.1%
UNEMPLOYMENT RATE
Income in St Joseph
Income Overview in St Joseph
Per Capita Income in St Joseph is $30,667, while median incomes of families and households are $68,146 and $54,515 respectively.
| Characteristic | Number | Measure |
| Per Capita Income | 72,198 | $30,667 |
| Median Family Income | 16,337 | $68,146 |
| Mean Family Income | 16,337 | $89,767 |
| Median Household Income | 28,633 | $54,515 |
| Mean Household Income | 28,633 | $74,564 |
| Income Deficit | 16,337 | $11,840 |
| Wage / Income Gap (%) | 72,198 | 24.57% |
| Wage / Income Gap ($) | 72,198 | 75.43¢ per $1 |
| Gini / Inequality Index | 72,198 | 0.48 |
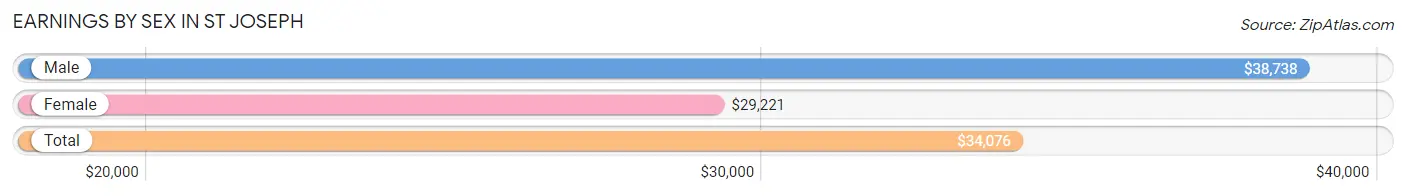
Earnings by Sex in St Joseph
Average Earnings in St Joseph are $34,076, $38,738 for men and $29,221 for women, a difference of 24.6%.
| Sex | Number | Average Earnings |
| Male | 20,208 (54.0%) | $38,738 |
| Female | 17,200 (46.0%) | $29,221 |
| Total | 37,408 (100.0%) | $34,076 |
Earnings by Sex by Income Bracket in St Joseph
The most common earnings brackets in St Joseph are $75,000 to $99,999 for men (1,837 | 9.1%) and $25,000 to $29,999 for women (1,397 | 8.1%).
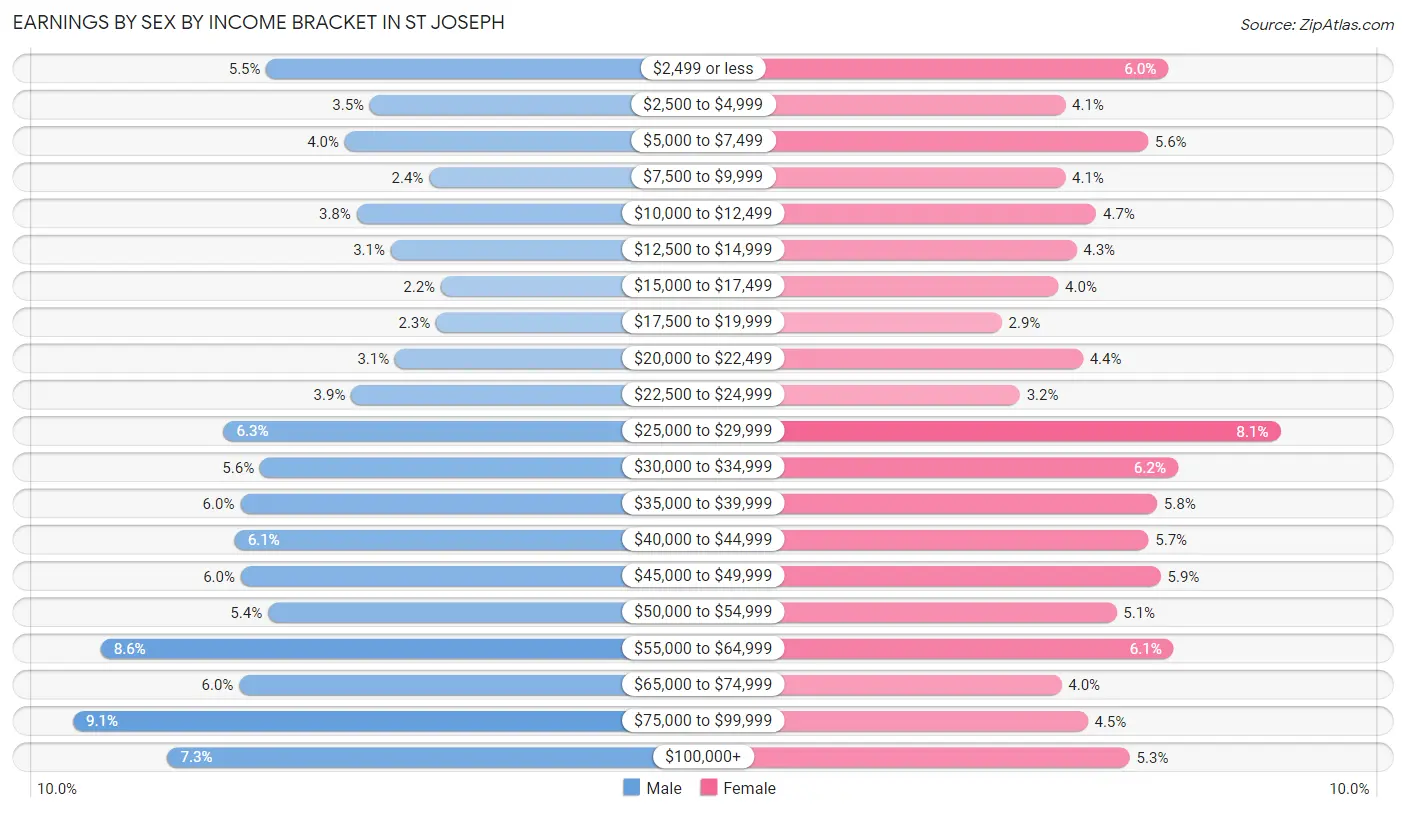
| Income | Male | Female |
| $2,499 or less | 1,105 (5.5%) | 1,036 (6.0%) |
| $2,500 to $4,999 | 714 (3.5%) | 704 (4.1%) |
| $5,000 to $7,499 | 808 (4.0%) | 970 (5.6%) |
| $7,500 to $9,999 | 489 (2.4%) | 704 (4.1%) |
| $10,000 to $12,499 | 763 (3.8%) | 803 (4.7%) |
| $12,500 to $14,999 | 635 (3.1%) | 739 (4.3%) |
| $15,000 to $17,499 | 444 (2.2%) | 681 (4.0%) |
| $17,500 to $19,999 | 463 (2.3%) | 499 (2.9%) |
| $20,000 to $22,499 | 618 (3.1%) | 760 (4.4%) |
| $22,500 to $24,999 | 784 (3.9%) | 557 (3.2%) |
| $25,000 to $29,999 | 1,267 (6.3%) | 1,397 (8.1%) |
| $30,000 to $34,999 | 1,130 (5.6%) | 1,066 (6.2%) |
| $35,000 to $39,999 | 1,205 (6.0%) | 1,000 (5.8%) |
| $40,000 to $44,999 | 1,224 (6.1%) | 972 (5.7%) |
| $45,000 to $49,999 | 1,203 (5.9%) | 1,012 (5.9%) |
| $50,000 to $54,999 | 1,099 (5.4%) | 868 (5.1%) |
| $55,000 to $64,999 | 1,732 (8.6%) | 1,053 (6.1%) |
| $65,000 to $74,999 | 1,209 (6.0%) | 692 (4.0%) |
| $75,000 to $99,999 | 1,837 (9.1%) | 775 (4.5%) |
| $100,000+ | 1,479 (7.3%) | 912 (5.3%) |
| Total | 20,208 (100.0%) | 17,200 (100.0%) |
Earnings by Sex by Educational Attainment in St Joseph
Average earnings in St Joseph are $44,573 for men and $34,926 for women, a difference of 21.6%. Men with an educational attainment of graduate degree enjoy the highest average annual earnings of $80,833, while those with less than high school education earn the least with $27,591. Women with an educational attainment of graduate degree earn the most with the average annual earnings of $65,324, while those with less than high school education have the smallest earnings of $26,509.
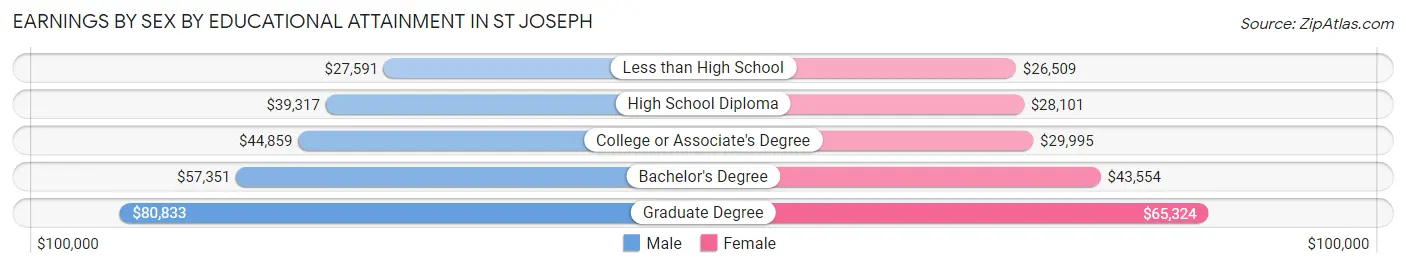
| Educational Attainment | Male Income | Female Income |
| Less than High School | $27,591 | $26,509 |
| High School Diploma | $39,317 | $28,101 |
| College or Associate's Degree | $44,859 | $29,995 |
| Bachelor's Degree | $57,351 | $43,554 |
| Graduate Degree | $80,833 | $65,324 |
| Total | $44,573 | $34,926 |
Family Income in St Joseph
Family Income Brackets in St Joseph
According to the St Joseph family income data, there are 3,104 families falling into the $50,000 to $74,999 income range, which is the most common income bracket and makes up 19.0% of all families. Conversely, the $10,000 to $14,999 income bracket is the least frequent group with only 539 families (3.3%) belonging to this category.
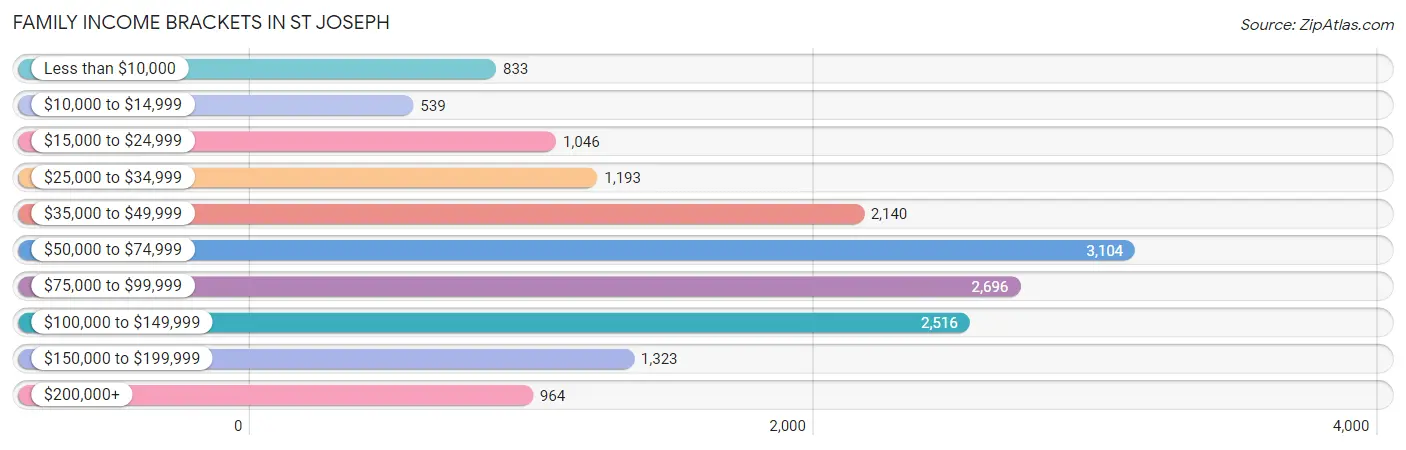
| Income Bracket | # Families | % Families |
| Less than $10,000 | 833 | 5.1% |
| $10,000 to $14,999 | 539 | 3.3% |
| $15,000 to $24,999 | 1,046 | 6.4% |
| $25,000 to $34,999 | 1,193 | 7.3% |
| $35,000 to $49,999 | 2,140 | 13.1% |
| $50,000 to $74,999 | 3,104 | 19.0% |
| $75,000 to $99,999 | 2,696 | 16.5% |
| $100,000 to $149,999 | 2,516 | 15.4% |
| $150,000 to $199,999 | 1,323 | 8.1% |
| $200,000+ | 964 | 5.9% |
Family Income by Famaliy Size in St Joseph
7+ person families (337 | 2.1%) account for the highest median family income in St Joseph with $118,586 per family, while 2-person families (8,155 | 49.9%) have the highest median income of $30,141 per family member.
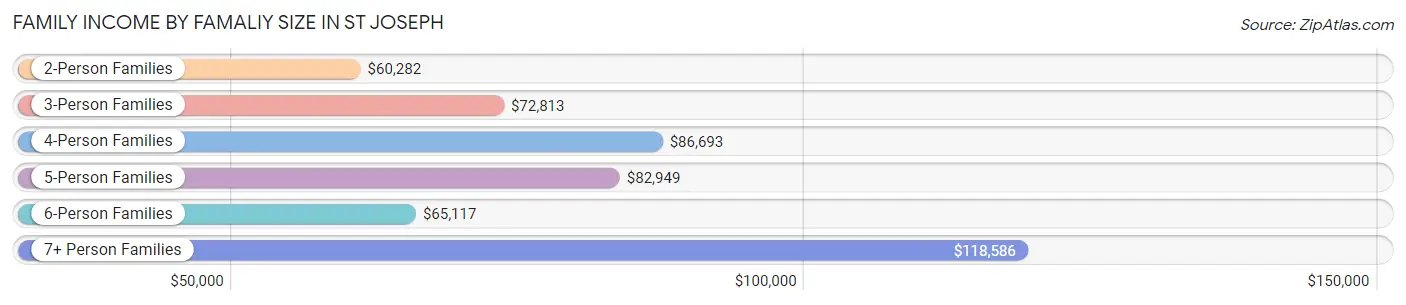
| Income Bracket | # Families | Median Income |
| 2-Person Families | 8,155 (49.9%) | $60,282 |
| 3-Person Families | 3,639 (22.3%) | $72,813 |
| 4-Person Families | 2,695 (16.5%) | $86,693 |
| 5-Person Families | 1,032 (6.3%) | $82,949 |
| 6-Person Families | 479 (2.9%) | $65,117 |
| 7+ Person Families | 337 (2.1%) | $118,586 |
| Total | 16,337 (100.0%) | $68,146 |
Family Income by Number of Earners in St Joseph
The median family income in St Joseph is $68,146, with families comprising 3+ earners (1,845) having the highest median family income of $131,354, while families with no earners (2,519) have the lowest median family income of $40,929, accounting for 11.3% and 15.4% of families, respectively.
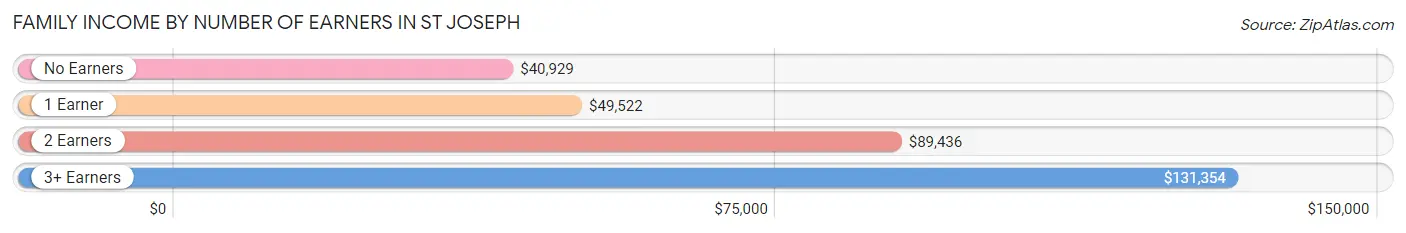
| Number of Earners | # Families | Median Income |
| No Earners | 2,519 (15.4%) | $40,929 |
| 1 Earner | 6,212 (38.0%) | $49,522 |
| 2 Earners | 5,761 (35.3%) | $89,436 |
| 3+ Earners | 1,845 (11.3%) | $131,354 |
| Total | 16,337 (100.0%) | $68,146 |
Household Income in St Joseph
Household Income Brackets in St Joseph
With 4,896 households falling in the category, the $50,000 to $74,999 income range is the most frequent in St Joseph, accounting for 17.1% of all households. In contrast, only 1,317 households (4.6%) fall into the $200,000+ income bracket, making it the least populous group.
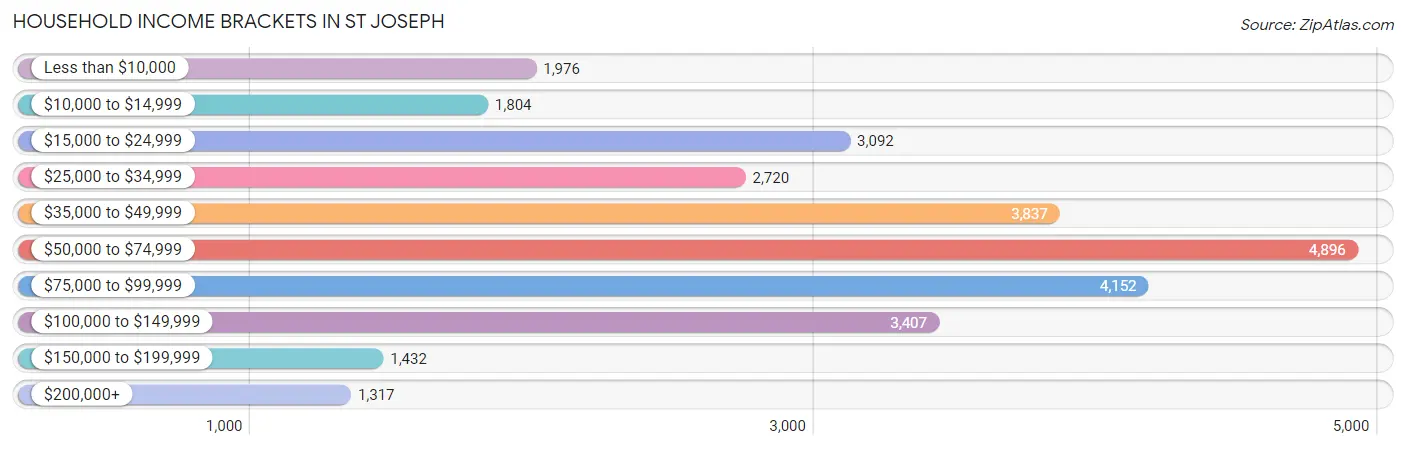
| Income Bracket | # Households | % Households |
| Less than $10,000 | 1,976 | 6.9% |
| $10,000 to $14,999 | 1,804 | 6.3% |
| $15,000 to $24,999 | 3,092 | 10.8% |
| $25,000 to $34,999 | 2,720 | 9.5% |
| $35,000 to $49,999 | 3,837 | 13.4% |
| $50,000 to $74,999 | 4,896 | 17.1% |
| $75,000 to $99,999 | 4,152 | 14.5% |
| $100,000 to $149,999 | 3,407 | 11.9% |
| $150,000 to $199,999 | 1,432 | 5.0% |
| $200,000+ | 1,317 | 4.6% |
Household Income by Householder Age in St Joseph
The median household income in St Joseph is $54,515, with the highest median household income of $62,917 found in the 45 to 64 years age bracket for the primary householder. A total of 9,996 households (34.9%) fall into this category. Meanwhile, the 15 to 24 years age bracket for the primary householder has the lowest median household income of $35,286, with 1,885 households (6.6%) in this group.
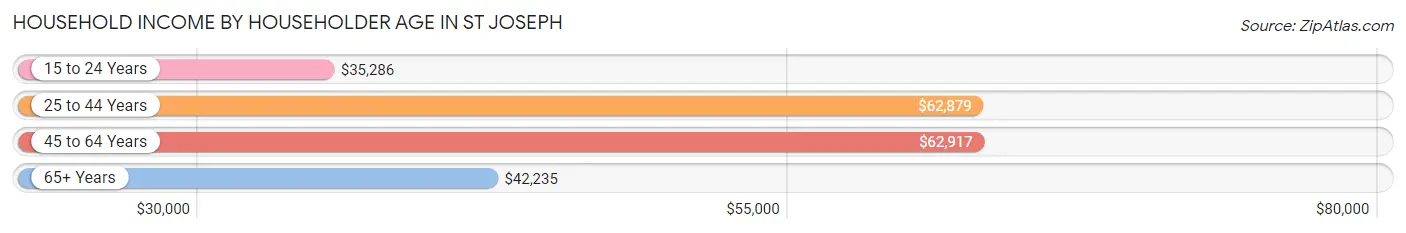
| Income Bracket | # Households | Median Income |
| 15 to 24 Years | 1,885 (6.6%) | $35,286 |
| 25 to 44 Years | 8,997 (31.4%) | $62,879 |
| 45 to 64 Years | 9,996 (34.9%) | $62,917 |
| 65+ Years | 7,755 (27.1%) | $42,235 |
| Total | 28,633 (100.0%) | $54,515 |
Poverty in St Joseph
Income Below Poverty by Sex and Age in St Joseph
With 16.0% poverty level for males and 20.1% for females among the residents of St Joseph, 15 year old males and under 5 year old females are the most vulnerable to poverty, with 99 males (36.0%) and 697 females (33.7%) in their respective age groups living below the poverty level.
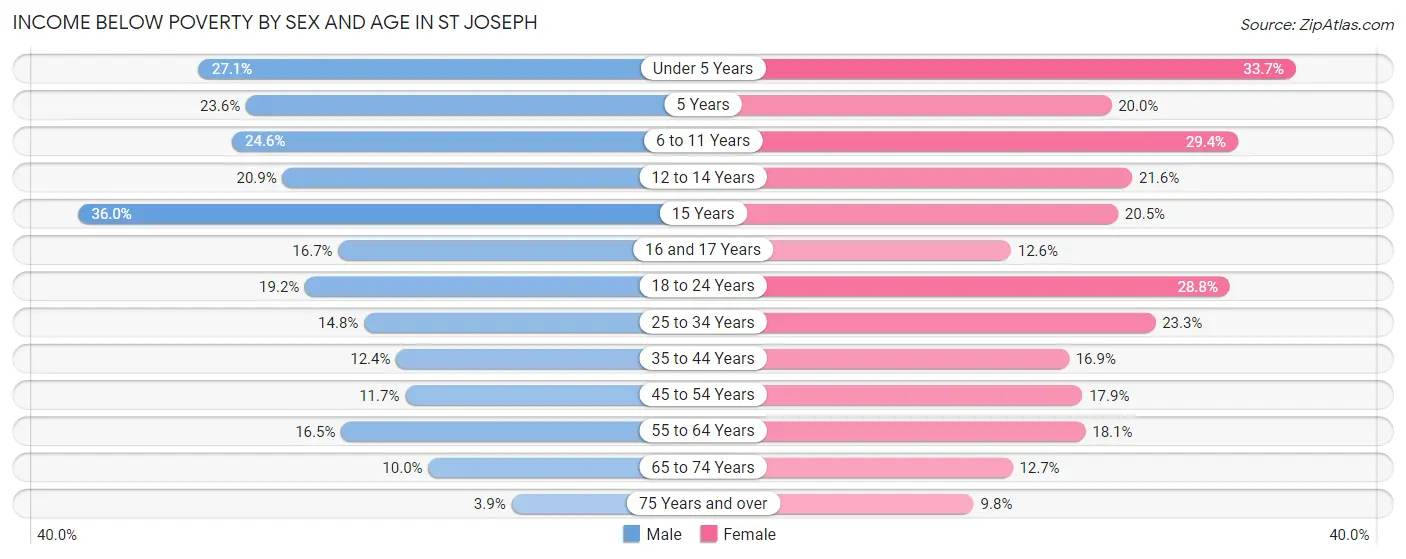
| Age Bracket | Male | Female |
| Under 5 Years | 615 (27.1%) | 697 (33.7%) |
| 5 Years | 78 (23.6%) | 82 (20.0%) |
| 6 to 11 Years | 672 (24.6%) | 722 (29.4%) |
| 12 to 14 Years | 289 (20.8%) | 326 (21.5%) |
| 15 Years | 99 (36.0%) | 66 (20.5%) |
| 16 and 17 Years | 156 (16.7%) | 124 (12.6%) |
| 18 to 24 Years | 652 (19.2%) | 900 (28.8%) |
| 25 to 34 Years | 679 (14.8%) | 1,089 (23.3%) |
| 35 to 44 Years | 561 (12.4%) | 697 (16.9%) |
| 45 to 54 Years | 469 (11.7%) | 714 (17.8%) |
| 55 to 64 Years | 743 (16.5%) | 832 (18.1%) |
| 65 to 74 Years | 310 (10.0%) | 458 (12.7%) |
| 75 Years and over | 66 (3.8%) | 284 (9.8%) |
| Total | 5,389 (16.0%) | 6,991 (20.1%) |
Income Above Poverty by Sex and Age in St Joseph
According to the poverty statistics in St Joseph, males aged 75 years and over and females aged 75 years and over are the age groups that are most secure financially, with 96.2% of males and 90.2% of females in these age groups living above the poverty line.
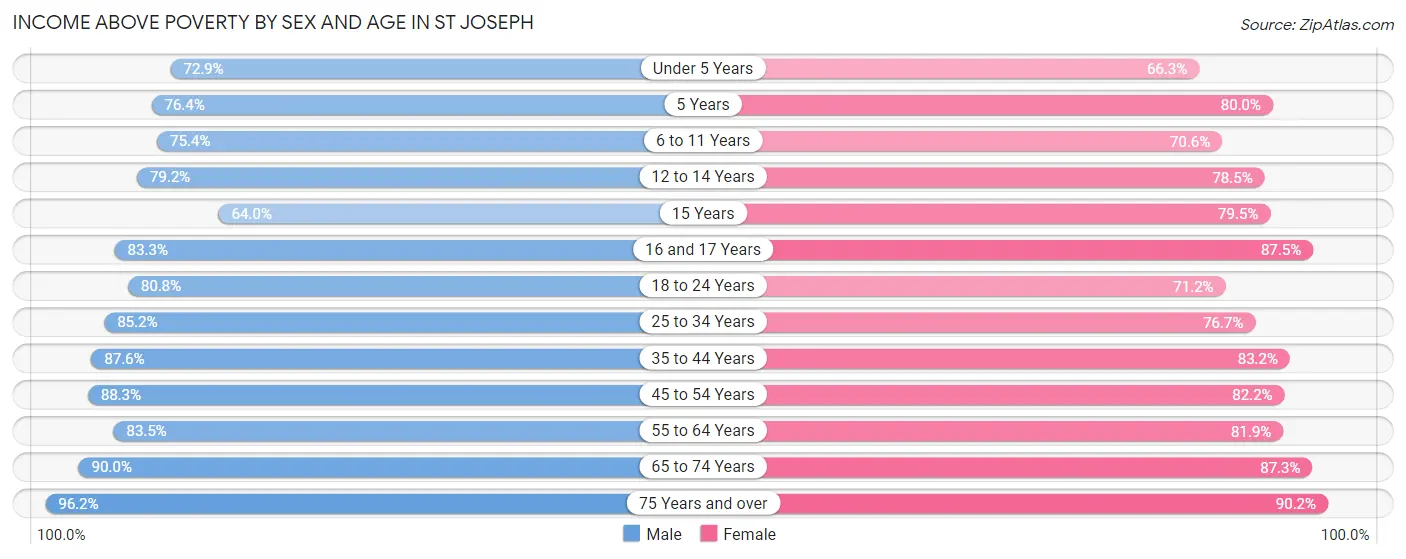
| Age Bracket | Male | Female |
| Under 5 Years | 1,658 (72.9%) | 1,372 (66.3%) |
| 5 Years | 253 (76.4%) | 328 (80.0%) |
| 6 to 11 Years | 2,061 (75.4%) | 1,733 (70.6%) |
| 12 to 14 Years | 1,097 (79.1%) | 1,187 (78.4%) |
| 15 Years | 176 (64.0%) | 256 (79.5%) |
| 16 and 17 Years | 778 (83.3%) | 864 (87.5%) |
| 18 to 24 Years | 2,750 (80.8%) | 2,225 (71.2%) |
| 25 to 34 Years | 3,912 (85.2%) | 3,591 (76.7%) |
| 35 to 44 Years | 3,963 (87.6%) | 3,439 (83.2%) |
| 45 to 54 Years | 3,525 (88.3%) | 3,287 (82.2%) |
| 55 to 64 Years | 3,764 (83.5%) | 3,770 (81.9%) |
| 65 to 74 Years | 2,783 (90.0%) | 3,158 (87.3%) |
| 75 Years and over | 1,647 (96.2%) | 2,616 (90.2%) |
| Total | 28,367 (84.0%) | 27,826 (79.9%) |
Income Below Poverty Among Married-Couple Families in St Joseph
The poverty statistics for married-couple families in St Joseph show that 5.9% or 640 of the total 10,878 families live below the poverty line. Families with 5 or more children have the highest poverty rate of 16.8%, comprising of 22 families. On the other hand, families with no children have the lowest poverty rate of 4.5%, which includes 307 families.
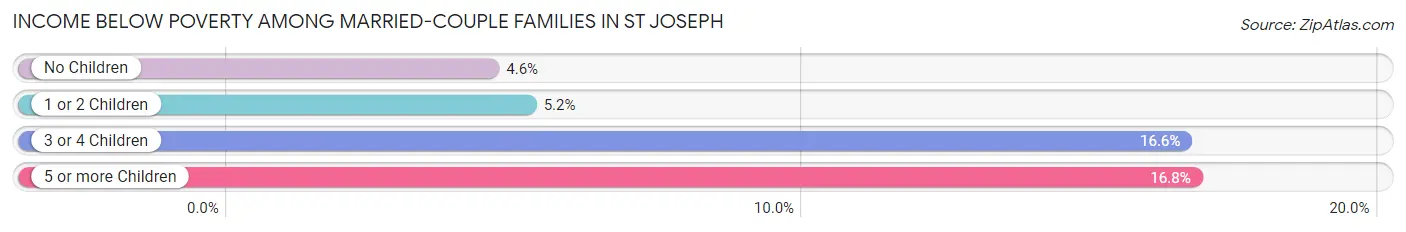
| Children | Above Poverty | Below Poverty |
| No Children | 6,441 (95.5%) | 307 (4.5%) |
| 1 or 2 Children | 2,935 (94.8%) | 161 (5.2%) |
| 3 or 4 Children | 753 (83.4%) | 150 (16.6%) |
| 5 or more Children | 109 (83.2%) | 22 (16.8%) |
| Total | 10,238 (94.1%) | 640 (5.9%) |
Income Below Poverty Among Single-Parent Households in St Joseph
According to the poverty data in St Joseph, 13.3% or 197 single-father households and 31.6% or 1,258 single-mother households are living below the poverty line. Among single-father households, those with 5 or more children have the highest poverty rate, with 73 households (100.0%) experiencing poverty. Likewise, among single-mother households, those with 5 or more children have the highest poverty rate, with 44 households (86.3%) falling below the poverty line.
| Children | Single Father | Single Mother |
| No Children | 39 (7.1%) | 190 (17.0%) |
| 1 or 2 Children | 85 (10.2%) | 810 (34.8%) |
| 3 or 4 Children | 0 (0.0%) | 214 (44.1%) |
| 5 or more Children | 73 (100.0%) | 44 (86.3%) |
| Total | 197 (13.3%) | 1,258 (31.6%) |
Income Below Poverty Among Married-Couple vs Single-Parent Households in St Joseph
The poverty data for St Joseph shows that 640 of the married-couple family households (5.9%) and 1,455 of the single-parent households (26.7%) are living below the poverty level. Within the married-couple family households, those with 5 or more children have the highest poverty rate, with 22 households (16.8%) falling below the poverty line. Among the single-parent households, those with 5 or more children have the highest poverty rate, with 117 household (94.4%) living below poverty.
| Children | Married-Couple Families | Single-Parent Households |
| No Children | 307 (4.5%) | 229 (13.7%) |
| 1 or 2 Children | 161 (5.2%) | 895 (28.4%) |
| 3 or 4 Children | 150 (16.6%) | 214 (42.3%) |
| 5 or more Children | 22 (16.8%) | 117 (94.4%) |
| Total | 640 (5.9%) | 1,455 (26.7%) |
Race in St Joseph
The most populous races in St Joseph are White / Caucasian (58,730 | 81.4%), Hispanic or Latino (5,611 | 7.8%), and Black / African American (4,928 | 6.8%).
| Race | # Population | % Population |
| Asian | 1,105 | 1.5% |
| Black / African American | 4,928 | 6.8% |
| Hawaiian / Pacific | 277 | 0.4% |
| Hispanic or Latino | 5,611 | 7.8% |
| Native / Alaskan | 342 | 0.5% |
| White / Caucasian | 58,730 | 81.4% |
| Two or more Races | 4,699 | 6.5% |
| Some other Race | 2,117 | 2.9% |
| Total | 72,198 | 100.0% |
Ancestry in St Joseph
The most populous ancestries reported in St Joseph are German (15,799 | 21.9%), Irish (8,985 | 12.4%), English (7,522 | 10.4%), American (4,492 | 6.2%), and Mexican (3,242 | 4.5%), together accounting for 55.5% of all St Joseph residents.
| Ancestry | # Population | % Population |
| African | 185 | 0.3% |
| Alaska Native | 10 | 0.0% |
| Alsatian | 7 | 0.0% |
| American | 4,492 | 6.2% |
| Apache | 22 | 0.0% |
| Arab | 89 | 0.1% |
| Armenian | 11 | 0.0% |
| Australian | 14 | 0.0% |
| Austrian | 86 | 0.1% |
| Belgian | 64 | 0.1% |
| Bhutanese | 269 | 0.4% |
| Blackfeet | 151 | 0.2% |
| Brazilian | 48 | 0.1% |
| British | 301 | 0.4% |
| Burmese | 79 | 0.1% |
| Canadian | 20 | 0.0% |
| Central American | 791 | 1.1% |
| Central American Indian | 15 | 0.0% |
| Cherokee | 318 | 0.4% |
| Chickasaw | 31 | 0.0% |
| Choctaw | 11 | 0.0% |
| Croatian | 106 | 0.2% |
| Crow | 124 | 0.2% |
| Cuban | 432 | 0.6% |
| Czech | 142 | 0.2% |
| Czechoslovakian | 52 | 0.1% |
| Danish | 187 | 0.3% |
| Dutch | 876 | 1.2% |
| Eastern European | 6 | 0.0% |
| English | 7,522 | 10.4% |
| Ethiopian | 223 | 0.3% |
| European | 897 | 1.2% |
| French | 1,446 | 2.0% |
| French American Indian | 14 | 0.0% |
| French Canadian | 137 | 0.2% |
| German | 15,799 | 21.9% |
| Ghanaian | 11 | 0.0% |
| Greek | 30 | 0.0% |
| Guamanian / Chamorro | 69 | 0.1% |
| Guatemalan | 138 | 0.2% |
| Haitian | 108 | 0.2% |
| Honduran | 11 | 0.0% |
| Hungarian | 55 | 0.1% |
| Indian (Asian) | 378 | 0.5% |
| Indonesian | 113 | 0.2% |
| Irish | 8,985 | 12.4% |
| Italian | 1,399 | 1.9% |
| Jamaican | 78 | 0.1% |
| Japanese | 9 | 0.0% |
| Korean | 234 | 0.3% |
| Lebanese | 24 | 0.0% |
| Lithuanian | 62 | 0.1% |
| Mexican | 3,242 | 4.5% |
| Mexican American Indian | 40 | 0.1% |
| Moroccan | 46 | 0.1% |
| Native Hawaiian | 324 | 0.4% |
| Navajo | 71 | 0.1% |
| Nicaraguan | 6 | 0.0% |
| Nigerian | 5 | 0.0% |
| Northern European | 38 | 0.1% |
| Norwegian | 741 | 1.0% |
| Paiute | 110 | 0.2% |
| Pakistani | 47 | 0.1% |
| Panamanian | 44 | 0.1% |
| Pima | 6 | 0.0% |
| Polish | 1,743 | 2.4% |
| Portuguese | 42 | 0.1% |
| Potawatomi | 47 | 0.1% |
| Pueblo | 8 | 0.0% |
| Puerto Rican | 520 | 0.7% |
| Romanian | 48 | 0.1% |
| Russian | 200 | 0.3% |
| Salvadoran | 592 | 0.8% |
| Samoan | 10 | 0.0% |
| Scandinavian | 236 | 0.3% |
| Scotch-Irish | 709 | 1.0% |
| Scottish | 1,173 | 1.6% |
| Sioux | 24 | 0.0% |
| Slavic | 32 | 0.0% |
| South African | 6 | 0.0% |
| South American | 18 | 0.0% |
| Spaniard | 69 | 0.1% |
| Spanish | 44 | 0.1% |
| Sri Lankan | 257 | 0.4% |
| Subsaharan African | 471 | 0.6% |
| Sudanese | 25 | 0.0% |
| Swedish | 630 | 0.9% |
| Swiss | 389 | 0.5% |
| Syrian | 14 | 0.0% |
| Thai | 223 | 0.3% |
| Ukrainian | 165 | 0.2% |
| Venezuelan | 18 | 0.0% |
| Vietnamese | 46 | 0.1% |
| Welsh | 327 | 0.4% |
| West Indian | 14 | 0.0% |
| Yugoslavian | 67 | 0.1% | View All 96 Rows |
Immigrants in St Joseph
The most numerous immigrant groups reported in St Joseph came from Latin America (1,746 | 2.4%), Central America (1,245 | 1.7%), Asia (937 | 1.3%), Mexico (837 | 1.2%), and Caribbean (486 | 0.7%), together accounting for 7.3% of all St Joseph residents.
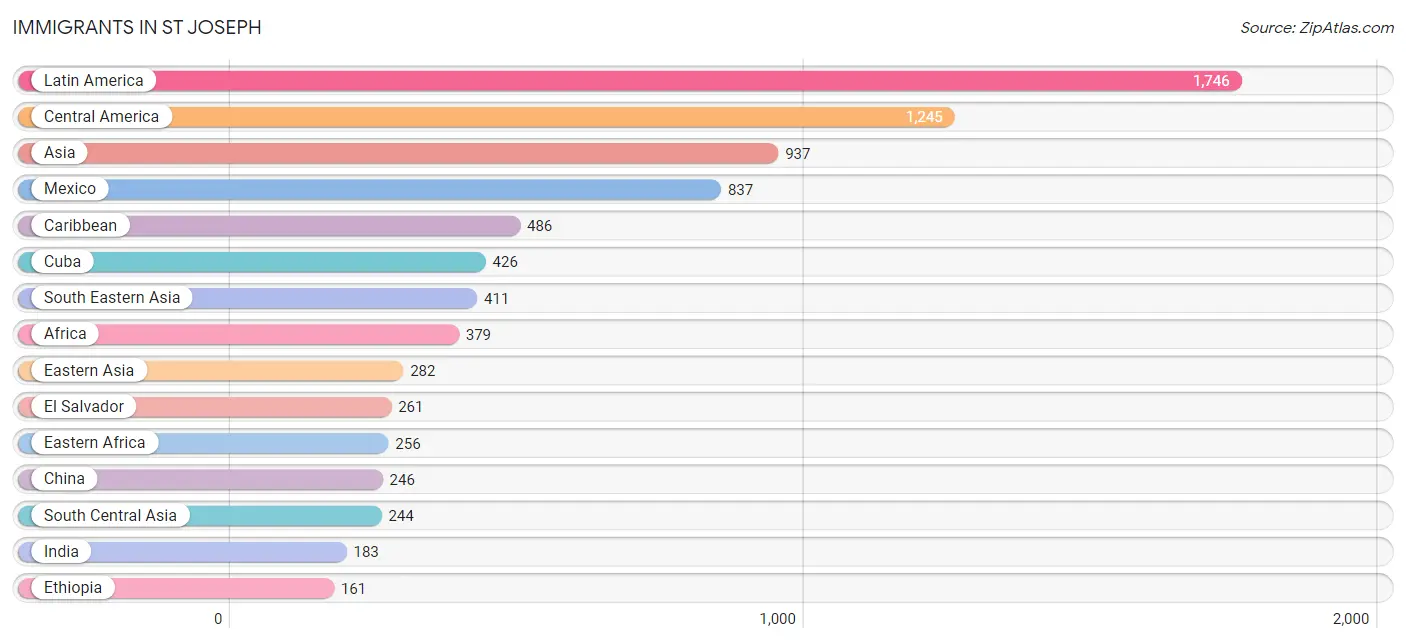
| Immigration Origin | # Population | % Population |
| Africa | 379 | 0.5% |
| Asia | 937 | 1.3% |
| Bangladesh | 46 | 0.1% |
| Bosnia and Herzegovina | 14 | 0.0% |
| Canada | 10 | 0.0% |
| Caribbean | 486 | 0.7% |
| Central America | 1,245 | 1.7% |
| China | 246 | 0.3% |
| Colombia | 15 | 0.0% |
| Congo | 23 | 0.0% |
| Cuba | 426 | 0.6% |
| Eastern Africa | 256 | 0.4% |
| Eastern Asia | 282 | 0.4% |
| Eastern Europe | 23 | 0.0% |
| El Salvador | 261 | 0.4% |
| Eritrea | 62 | 0.1% |
| Ethiopia | 161 | 0.2% |
| Europe | 66 | 0.1% |
| France | 9 | 0.0% |
| Germany | 31 | 0.0% |
| Ghana | 11 | 0.0% |
| Guatemala | 140 | 0.2% |
| Haiti | 46 | 0.1% |
| Honduras | 3 | 0.0% |
| Hong Kong | 78 | 0.1% |
| India | 183 | 0.3% |
| Japan | 22 | 0.0% |
| Kenya | 6 | 0.0% |
| Korea | 14 | 0.0% |
| Latin America | 1,746 | 2.4% |
| Malaysia | 59 | 0.1% |
| Mexico | 837 | 1.2% |
| Micronesia | 14 | 0.0% |
| Middle Africa | 23 | 0.0% |
| Morocco | 19 | 0.0% |
| Netherlands | 3 | 0.0% |
| Nigeria | 5 | 0.0% |
| Northern Africa | 78 | 0.1% |
| Oceania | 20 | 0.0% |
| Philippines | 119 | 0.2% |
| Russia | 9 | 0.0% |
| South Africa | 6 | 0.0% |
| South America | 15 | 0.0% |
| South Central Asia | 244 | 0.3% |
| South Eastern Asia | 411 | 0.6% |
| Sudan | 25 | 0.0% |
| Trinidad and Tobago | 14 | 0.0% |
| Vietnam | 148 | 0.2% |
| Western Africa | 16 | 0.0% |
| Western Europe | 43 | 0.1% | View All 50 Rows |
Sex and Age in St Joseph
Sex and Age in St Joseph
The most populous age groups in St Joseph are 20 to 24 Years (3,030 | 8.3%) for men and 20 to 24 Years (2,463 | 6.9%) for women.
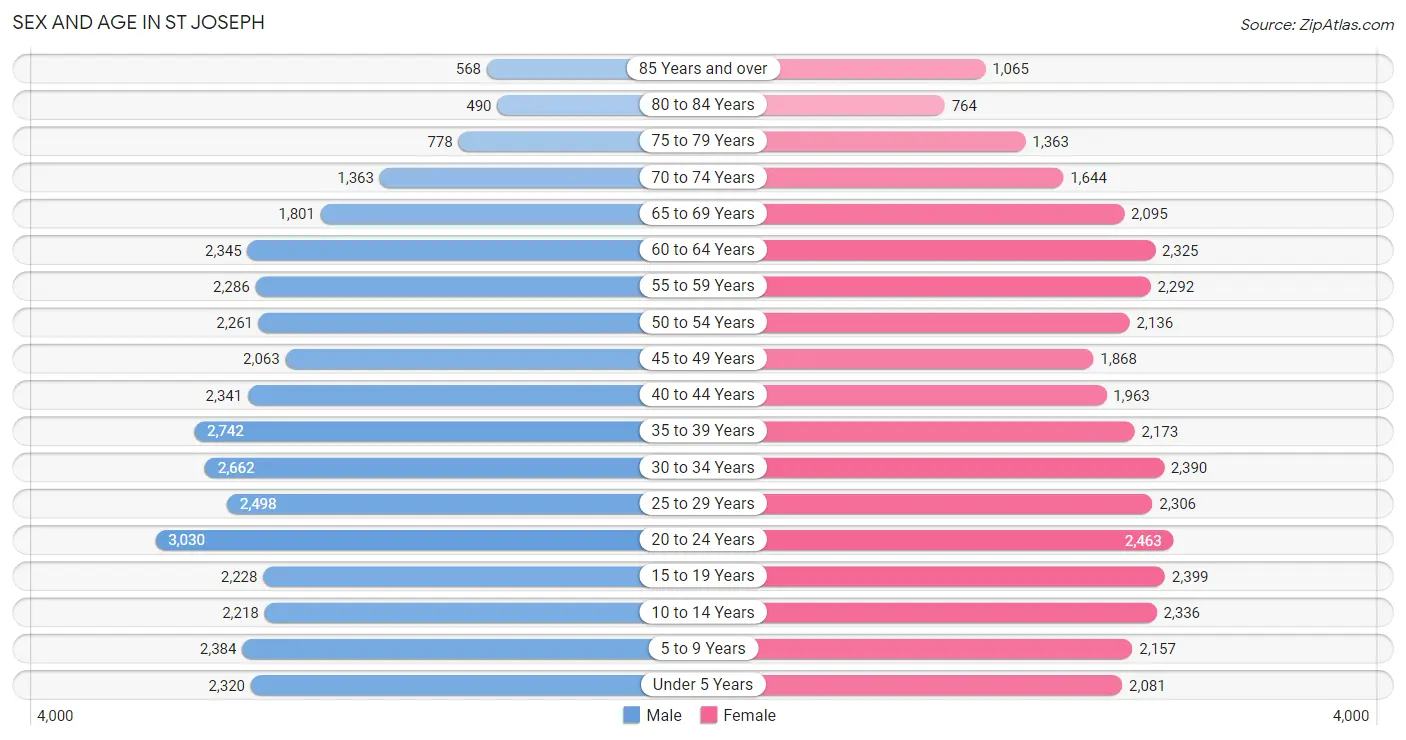
| Age Bracket | Male | Female |
| Under 5 Years | 2,320 (6.4%) | 2,081 (5.8%) |
| 5 to 9 Years | 2,384 (6.6%) | 2,157 (6.0%) |
| 10 to 14 Years | 2,218 (6.1%) | 2,336 (6.5%) |
| 15 to 19 Years | 2,228 (6.1%) | 2,399 (6.7%) |
| 20 to 24 Years | 3,030 (8.3%) | 2,463 (6.9%) |
| 25 to 29 Years | 2,498 (6.9%) | 2,306 (6.4%) |
| 30 to 34 Years | 2,662 (7.3%) | 2,390 (6.7%) |
| 35 to 39 Years | 2,742 (7.5%) | 2,173 (6.1%) |
| 40 to 44 Years | 2,341 (6.4%) | 1,963 (5.5%) |
| 45 to 49 Years | 2,063 (5.7%) | 1,868 (5.2%) |
| 50 to 54 Years | 2,261 (6.2%) | 2,136 (6.0%) |
| 55 to 59 Years | 2,286 (6.3%) | 2,292 (6.4%) |
| 60 to 64 Years | 2,345 (6.5%) | 2,325 (6.5%) |
| 65 to 69 Years | 1,801 (5.0%) | 2,095 (5.9%) |
| 70 to 74 Years | 1,363 (3.7%) | 1,644 (4.6%) |
| 75 to 79 Years | 778 (2.1%) | 1,363 (3.8%) |
| 80 to 84 Years | 490 (1.3%) | 764 (2.1%) |
| 85 Years and over | 568 (1.6%) | 1,065 (3.0%) |
| Total | 36,378 (100.0%) | 35,820 (100.0%) |
Families and Households in St Joseph
Median Family Size in St Joseph
The median family size in St Joseph is 3.09 persons per family, with married-couple families (10,878 | 66.6%) accounting for the largest median family size of 3.17 persons per family. On the other hand, single male/father families (1,477 | 9.0%) represent the smallest median family size with 2.84 persons per family.
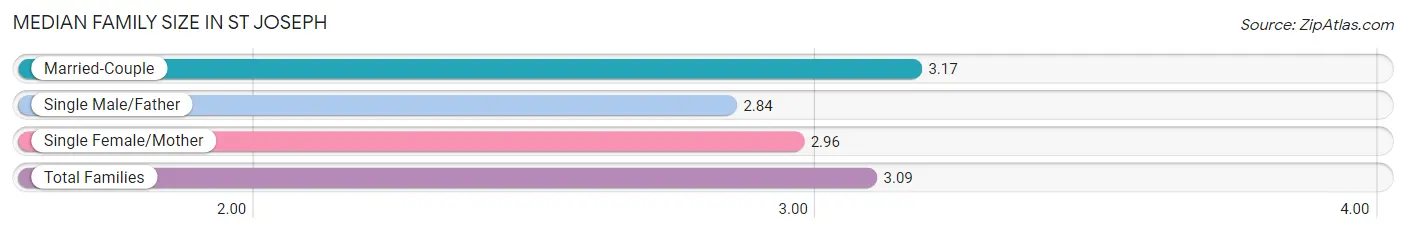
| Family Type | # Families | Family Size |
| Married-Couple | 10,878 (66.6%) | 3.17 |
| Single Male/Father | 1,477 (9.0%) | 2.84 |
| Single Female/Mother | 3,982 (24.4%) | 2.96 |
| Total Families | 16,337 (100.0%) | 3.09 |
Median Household Size in St Joseph
The median household size in St Joseph is 2.40 persons per household, with single male/father households (1,477 | 5.2%) accounting for the largest median household size of 3.35 persons per household. non-family households (12,296 | 42.9%) represent the smallest median household size with 1.26 persons per household.
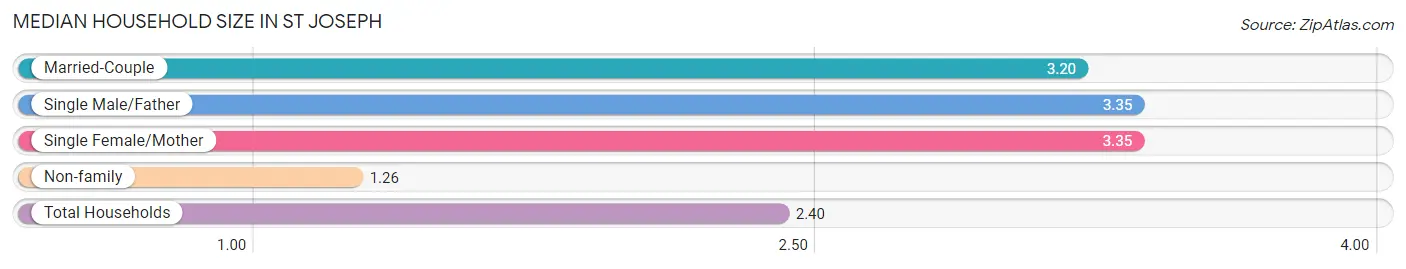
| Household Type | # Households | Household Size |
| Married-Couple | 10,878 (38.0%) | 3.20 |
| Single Male/Father | 1,477 (5.2%) | 3.35 |
| Single Female/Mother | 3,982 (13.9%) | 3.35 |
| Non-family | 12,296 (42.9%) | 1.26 |
| Total Households | 28,633 (100.0%) | 2.40 |
Household Size by Marriage Status in St Joseph
Out of a total of 28,633 households in St Joseph, 16,337 (57.1%) are family households, while 12,296 (42.9%) are nonfamily households. The most numerous type of family households are 2-person households, comprising 7,280, and the most common type of nonfamily households are 1-person households, comprising 9,860.
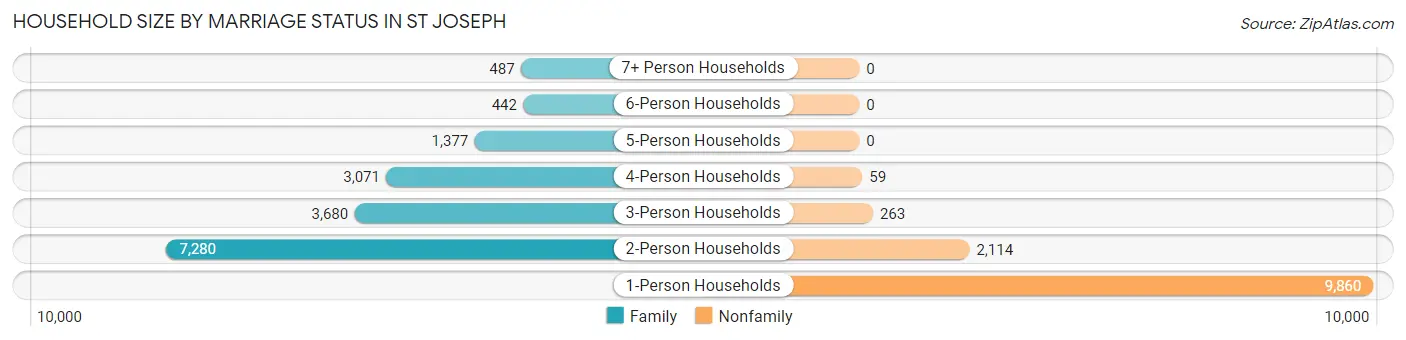
| Household Size | Family Households | Nonfamily Households |
| 1-Person Households | - | 9,860 (34.4%) |
| 2-Person Households | 7,280 (25.4%) | 2,114 (7.4%) |
| 3-Person Households | 3,680 (12.9%) | 263 (0.9%) |
| 4-Person Households | 3,071 (10.7%) | 59 (0.2%) |
| 5-Person Households | 1,377 (4.8%) | 0 (0.0%) |
| 6-Person Households | 442 (1.5%) | 0 (0.0%) |
| 7+ Person Households | 487 (1.7%) | 0 (0.0%) |
| Total | 16,337 (57.1%) | 12,296 (42.9%) |
Female Fertility in St Joseph
Fertility by Age in St Joseph
Average fertility rate in St Joseph is 63.0 births per 1,000 women. Women in the age bracket of 20 to 34 years have the highest fertility rate with 123.0 births per 1,000 women. Women in the age bracket of 20 to 34 years acount for 88.3% of all women with births.
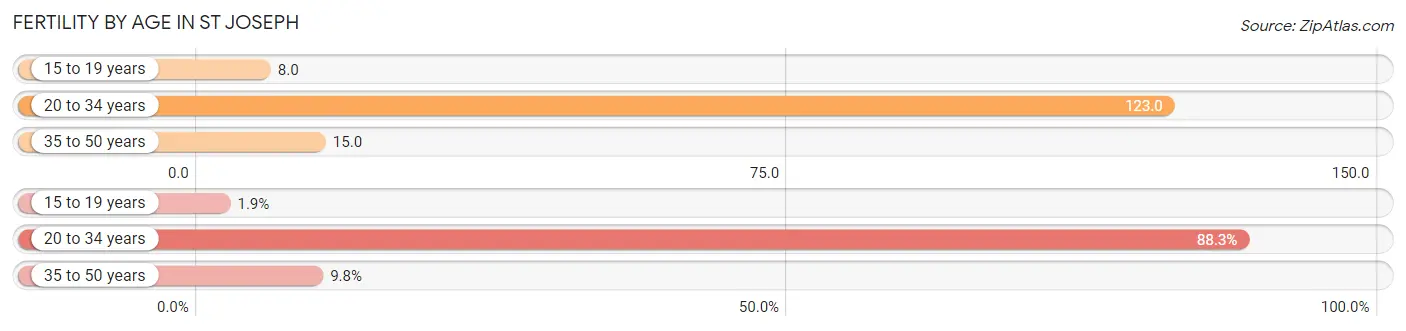
| Age Bracket | Women with Births | Births / 1,000 Women |
| 15 to 19 years | 19 (1.9%) | 8.0 |
| 20 to 34 years | 877 (88.3%) | 123.0 |
| 35 to 50 years | 97 (9.8%) | 15.0 |
| Total | 993 (100.0%) | 63.0 |
Fertility by Age by Marriage Status in St Joseph
46.0% of women with births (993) in St Joseph are married. The highest percentage of unmarried women with births falls into 15 to 19 years age bracket with 100.0% of them unmarried at the time of birth, while the lowest percentage of unmarried women with births belong to 35 to 50 years age bracket with 35.1% of them unmarried.
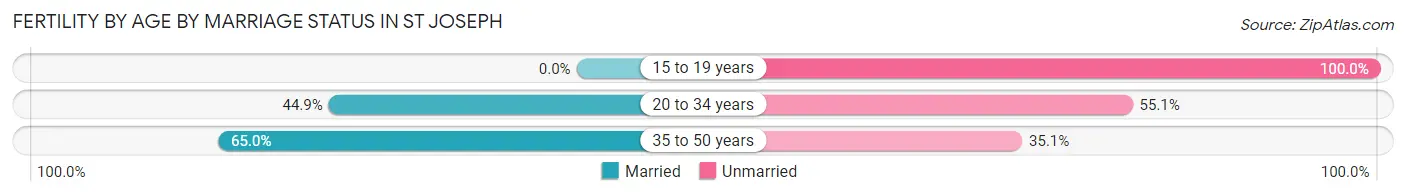
| Age Bracket | Married | Unmarried |
| 15 to 19 years | 0 (0.0%) | 19 (100.0%) |
| 20 to 34 years | 394 (44.9%) | 483 (55.1%) |
| 35 to 50 years | 63 (64.9%) | 34 (35.0%) |
| Total | 457 (46.0%) | 536 (54.0%) |
Fertility by Education in St Joseph
Average fertility rate in St Joseph is 63.0 births per 1,000 women. Women with the education attainment of college or associate's degree have the highest fertility rate of 92.0 births per 1,000 women, while women with the education attainment of less than high school have the lowest fertility at 16.0 births per 1,000 women. Women with the education attainment of college or associate's degree represent 53.9% of all women with births.
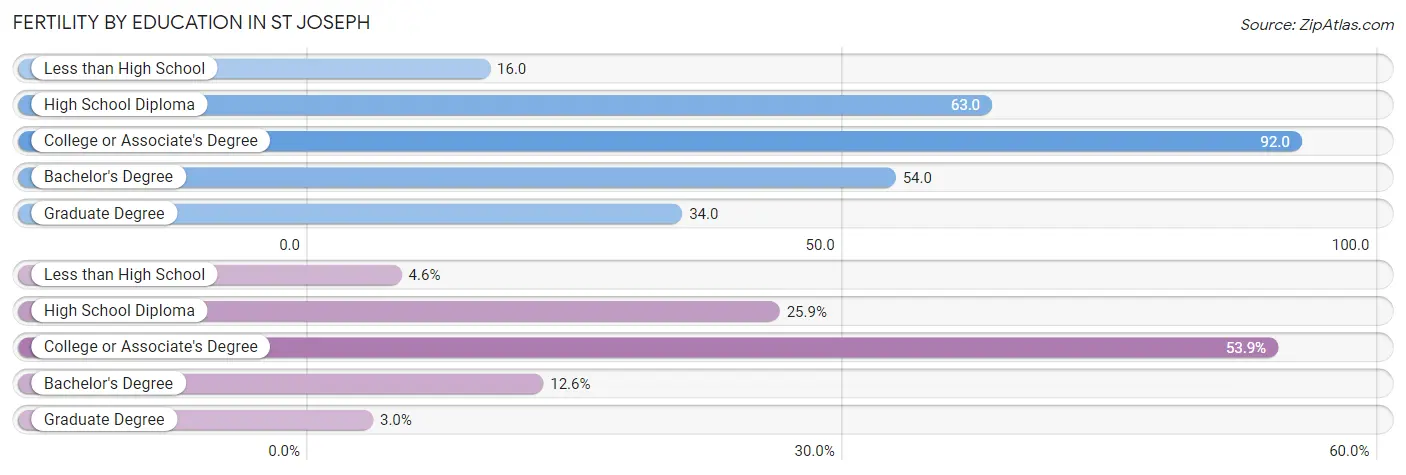
| Educational Attainment | Women with Births | Births / 1,000 Women |
| Less than High School | 46 (4.6%) | 16.0 |
| High School Diploma | 257 (25.9%) | 63.0 |
| College or Associate's Degree | 535 (53.9%) | 92.0 |
| Bachelor's Degree | 125 (12.6%) | 54.0 |
| Graduate Degree | 30 (3.0%) | 34.0 |
| Total | 993 (100.0%) | 63.0 |
Fertility by Education by Marriage Status in St Joseph
54.0% of women with births in St Joseph are unmarried. Women with the educational attainment of bachelor's degree are most likely to be married with 80.0% of them married at childbirth, while women with the educational attainment of college or associate's degree are least likely to be married with 64.3% of them unmarried at childbirth.
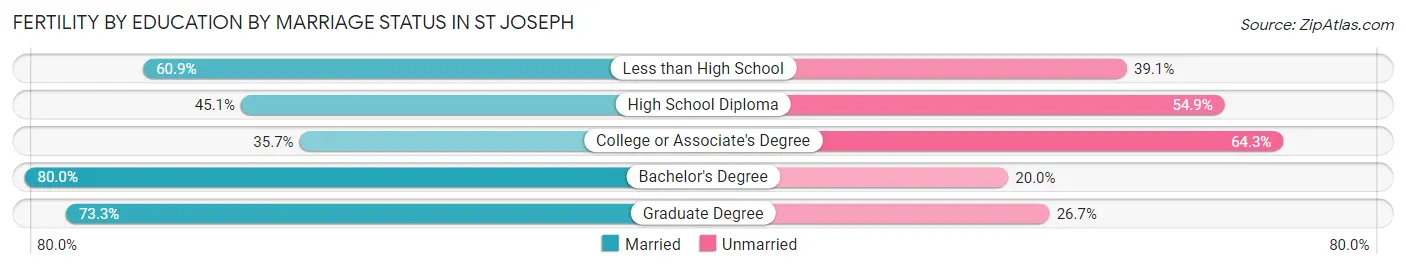
| Educational Attainment | Married | Unmarried |
| Less than High School | 28 (60.9%) | 18 (39.1%) |
| High School Diploma | 116 (45.1%) | 141 (54.9%) |
| College or Associate's Degree | 191 (35.7%) | 344 (64.3%) |
| Bachelor's Degree | 100 (80.0%) | 25 (20.0%) |
| Graduate Degree | 22 (73.3%) | 8 (26.7%) |
| Total | 457 (46.0%) | 536 (54.0%) |
Employment Characteristics in St Joseph
Employment by Class of Employer in St Joseph
Among the 32,140 employed individuals in St Joseph, private company employees (22,922 | 71.3%), not-for-profit organizations (3,028 | 9.4%), and local government employees (1,805 | 5.6%) make up the most common classes of employment.
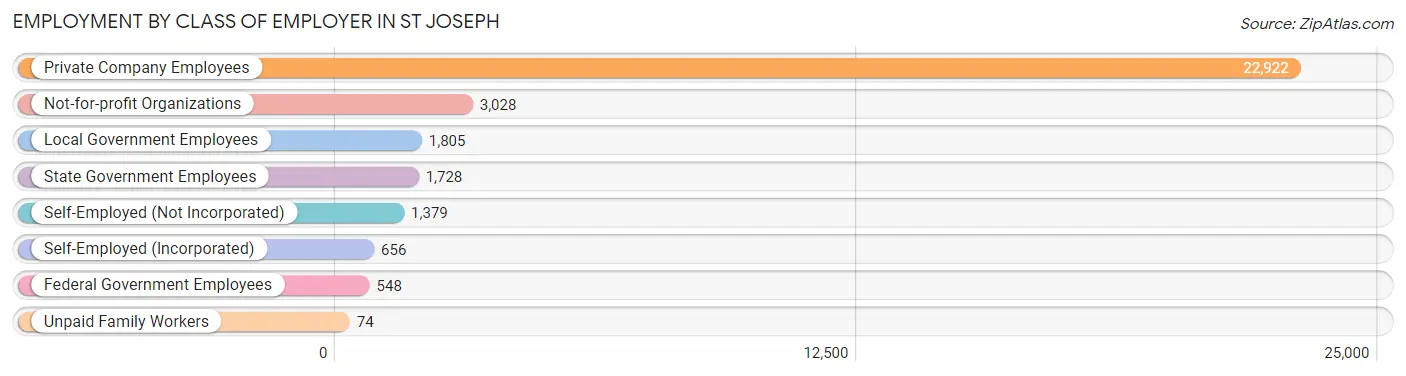
| Employer Class | # Employees | % Employees |
| Private Company Employees | 22,922 | 71.3% |
| Self-Employed (Incorporated) | 656 | 2.0% |
| Self-Employed (Not Incorporated) | 1,379 | 4.3% |
| Not-for-profit Organizations | 3,028 | 9.4% |
| Local Government Employees | 1,805 | 5.6% |
| State Government Employees | 1,728 | 5.4% |
| Federal Government Employees | 548 | 1.7% |
| Unpaid Family Workers | 74 | 0.2% |
| Total | 32,140 | 100.0% |
Employment Status by Age in St Joseph
According to the labor force statistics for St Joseph, out of the total population over 16 years of age (58,074), 59.6% or 34,612 individuals are in the labor force, with 5.1% or 1,765 of them unemployed. The age group with the highest labor force participation rate is 30 to 34 years, with 78.2% or 3,951 individuals in the labor force. Within the labor force, the 16 to 19 years age range has the highest percentage of unemployed individuals, with 10.8% or 188 of them being unemployed.
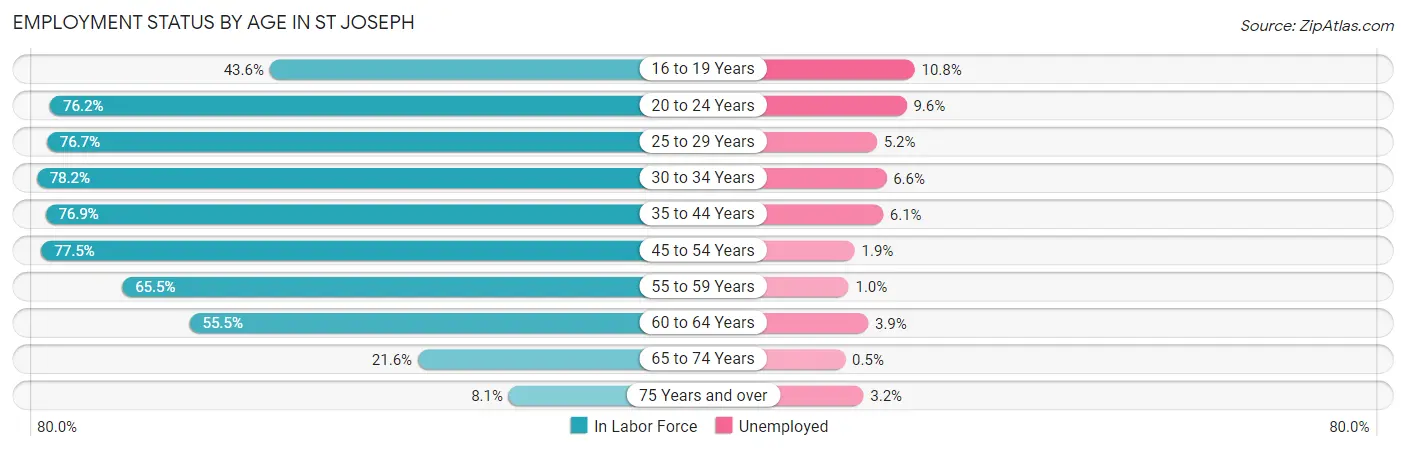
| Age Bracket | In Labor Force | Unemployed |
| 16 to 19 Years | 1,744 (43.6%) | 188 (10.8%) |
| 20 to 24 Years | 4,186 (76.2%) | 402 (9.6%) |
| 25 to 29 Years | 3,685 (76.7%) | 192 (5.2%) |
| 30 to 34 Years | 3,951 (78.2%) | 261 (6.6%) |
| 35 to 44 Years | 7,089 (76.9%) | 432 (6.1%) |
| 45 to 54 Years | 6,454 (77.5%) | 123 (1.9%) |
| 55 to 59 Years | 2,999 (65.5%) | 30 (1.0%) |
| 60 to 64 Years | 2,592 (55.5%) | 101 (3.9%) |
| 65 to 74 Years | 1,491 (21.6%) | 7 (0.5%) |
| 75 Years and over | 407 (8.1%) | 13 (3.2%) |
| Total | 34,612 (59.6%) | 1,765 (5.1%) |
Employment Status by Educational Attainment in St Joseph
According to labor force statistics for St Joseph, 73.1% of individuals (26,792) out of the total population between 25 and 64 years of age (36,651) are in the labor force, with 4.3% or 1,152 of them being unemployed. The group with the highest labor force participation rate are those with the educational attainment of bachelor's degree or higher, with 88.5% or 7,422 individuals in the labor force. Within the labor force, individuals with less than high school education have the highest percentage of unemployment, with 6.3% or 135 of them being unemployed.
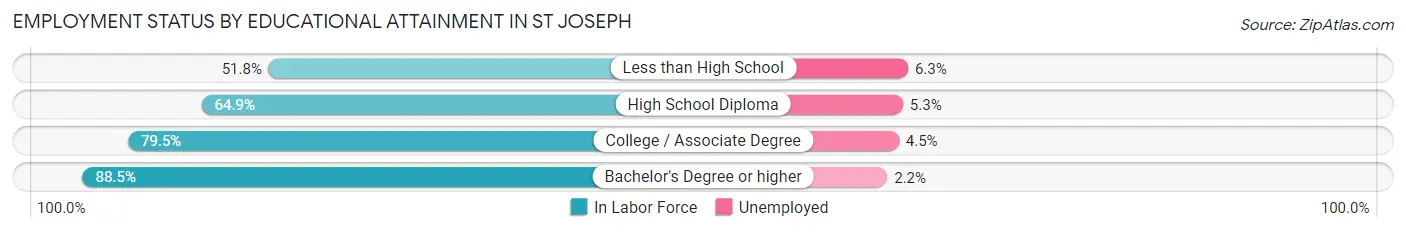
| Educational Attainment | In Labor Force | Unemployed |
| Less than High School | 2,150 (51.8%) | 262 (6.3%) |
| High School Diploma | 8,705 (64.9%) | 711 (5.3%) |
| College / Associate Degree | 8,507 (79.5%) | 482 (4.5%) |
| Bachelor's Degree or higher | 7,422 (88.5%) | 184 (2.2%) |
| Total | 26,792 (73.1%) | 1,576 (4.3%) |
Employment Occupations by Sex in St Joseph
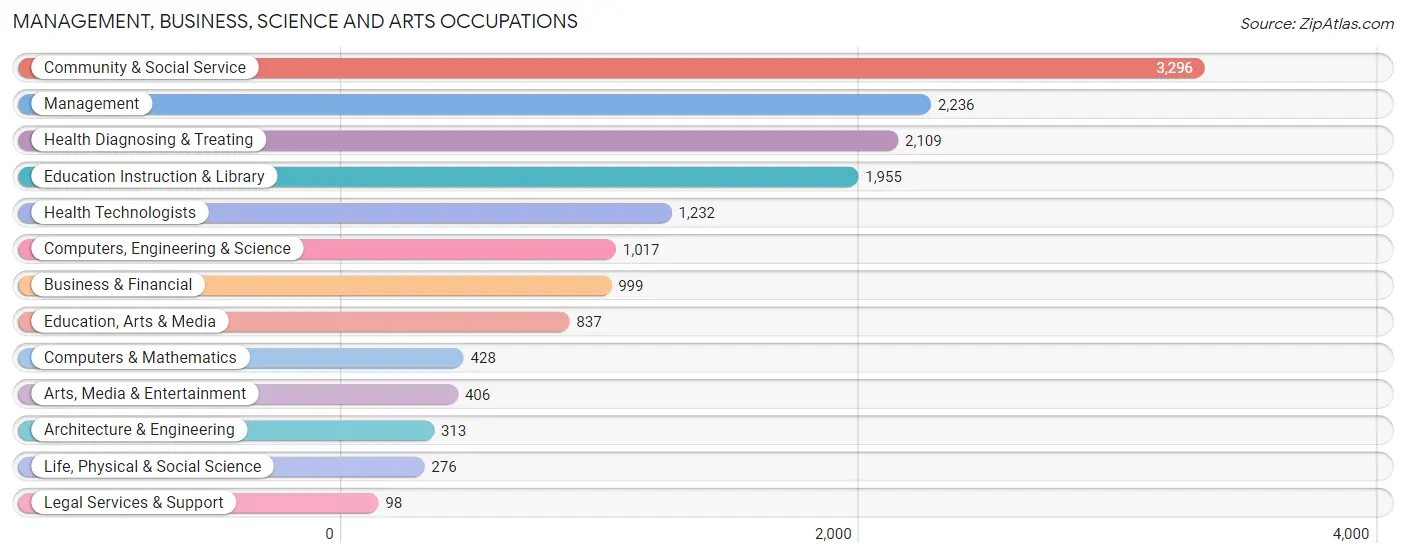
Management, Business, Science and Arts Occupations
The most common Management, Business, Science and Arts occupations in St Joseph are Community & Social Service (3,296 | 10.1%), Management (2,236 | 6.9%), Health Diagnosing & Treating (2,109 | 6.5%), Education Instruction & Library (1,955 | 6.0%), and Health Technologists (1,232 | 3.8%).
Management, Business, Science and Arts Occupations by Sex
Within the Management, Business, Science and Arts occupations in St Joseph, the most male-oriented occupations are Architecture & Engineering (81.1%), Computers, Engineering & Science (67.2%), and Computers & Mathematics (64.9%), while the most female-oriented occupations are Legal Services & Support (83.7%), Education, Arts & Media (76.8%), and Health Diagnosing & Treating (76.4%).
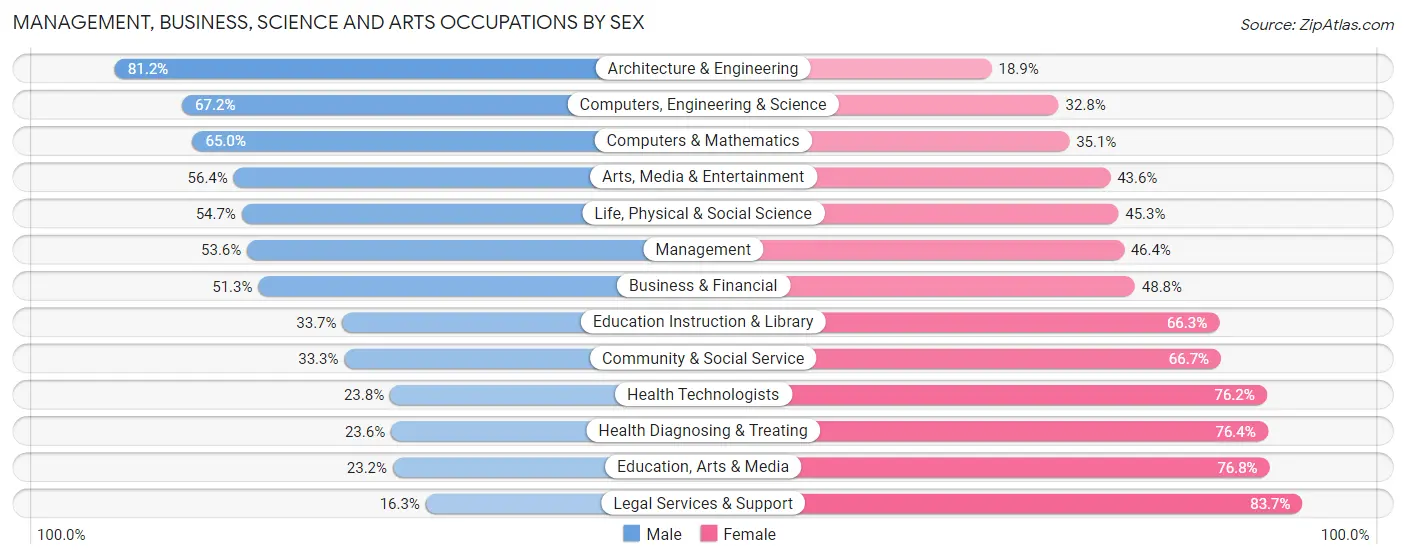
| Occupation | Male | Female |
| Management | 1,198 (53.6%) | 1,038 (46.4%) |
| Business & Financial | 512 (51.2%) | 487 (48.7%) |
| Computers, Engineering & Science | 683 (67.2%) | 334 (32.8%) |
| Computers & Mathematics | 278 (64.9%) | 150 (35.0%) |
| Architecture & Engineering | 254 (81.1%) | 59 (18.9%) |
| Life, Physical & Social Science | 151 (54.7%) | 125 (45.3%) |
| Community & Social Service | 1,098 (33.3%) | 2,198 (66.7%) |
| Education, Arts & Media | 194 (23.2%) | 643 (76.8%) |
| Legal Services & Support | 16 (16.3%) | 82 (83.7%) |
| Education Instruction & Library | 659 (33.7%) | 1,296 (66.3%) |
| Arts, Media & Entertainment | 229 (56.4%) | 177 (43.6%) |
| Health Diagnosing & Treating | 497 (23.6%) | 1,612 (76.4%) |
| Health Technologists | 293 (23.8%) | 939 (76.2%) |
| Total (Category) | 3,988 (41.3%) | 5,669 (58.7%) |
| Total (Overall) | 17,555 (53.7%) | 15,103 (46.3%) |
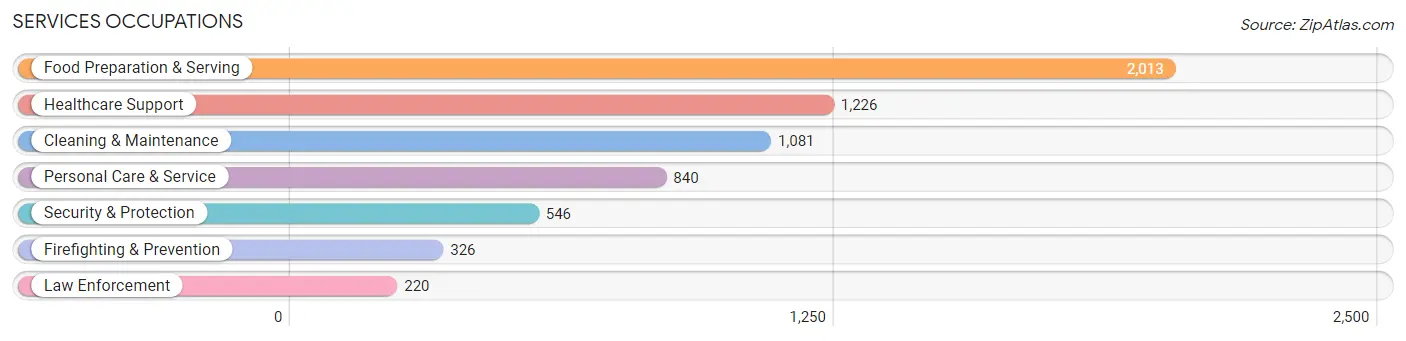
Services Occupations
The most common Services occupations in St Joseph are Food Preparation & Serving (2,013 | 6.2%), Healthcare Support (1,226 | 3.7%), Cleaning & Maintenance (1,081 | 3.3%), Personal Care & Service (840 | 2.6%), and Security & Protection (546 | 1.7%).
Services Occupations by Sex
Within the Services occupations in St Joseph, the most male-oriented occupations are Law Enforcement (78.6%), Security & Protection (76.4%), and Firefighting & Prevention (74.9%), while the most female-oriented occupations are Healthcare Support (89.6%), Personal Care & Service (68.4%), and Food Preparation & Serving (54.8%).
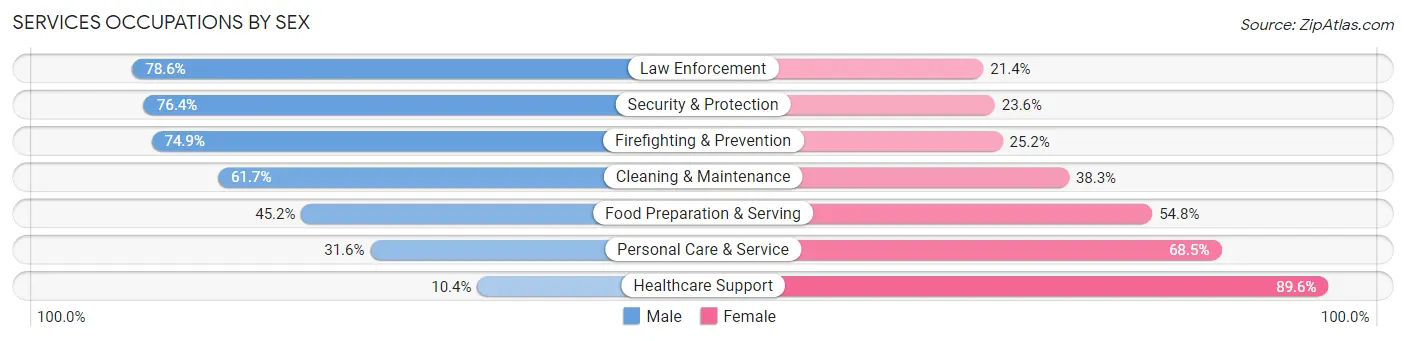
| Occupation | Male | Female |
| Healthcare Support | 127 (10.4%) | 1,099 (89.6%) |
| Security & Protection | 417 (76.4%) | 129 (23.6%) |
| Firefighting & Prevention | 244 (74.9%) | 82 (25.2%) |
| Law Enforcement | 173 (78.6%) | 47 (21.4%) |
| Food Preparation & Serving | 910 (45.2%) | 1,103 (54.8%) |
| Cleaning & Maintenance | 667 (61.7%) | 414 (38.3%) |
| Personal Care & Service | 265 (31.6%) | 575 (68.4%) |
| Total (Category) | 2,386 (41.8%) | 3,320 (58.2%) |
| Total (Overall) | 17,555 (53.7%) | 15,103 (46.3%) |
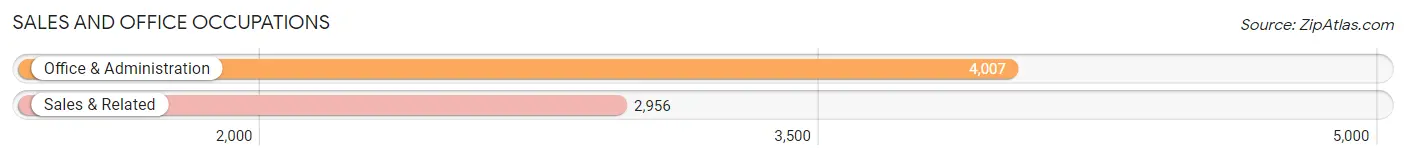
Sales and Office Occupations
The most common Sales and Office occupations in St Joseph are Office & Administration (4,007 | 12.3%), and Sales & Related (2,956 | 9.0%).
Sales and Office Occupations by Sex
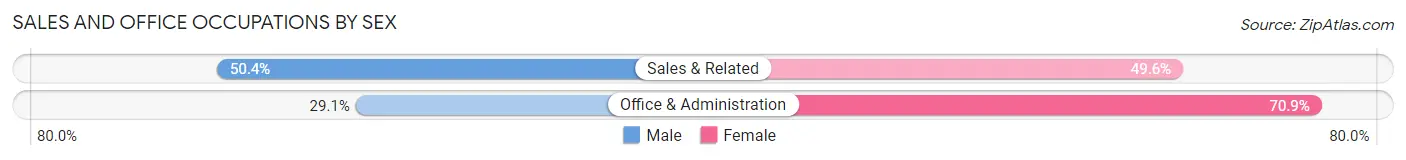
| Occupation | Male | Female |
| Sales & Related | 1,490 (50.4%) | 1,466 (49.6%) |
| Office & Administration | 1,165 (29.1%) | 2,842 (70.9%) |
| Total (Category) | 2,655 (38.1%) | 4,308 (61.9%) |
| Total (Overall) | 17,555 (53.7%) | 15,103 (46.3%) |
Natural Resources, Construction and Maintenance Occupations
The most common Natural Resources, Construction and Maintenance occupations in St Joseph are Construction & Extraction (1,261 | 3.9%), Installation, Maintenance & Repair (1,174 | 3.6%), and Farming, Fishing & Forestry (118 | 0.4%).
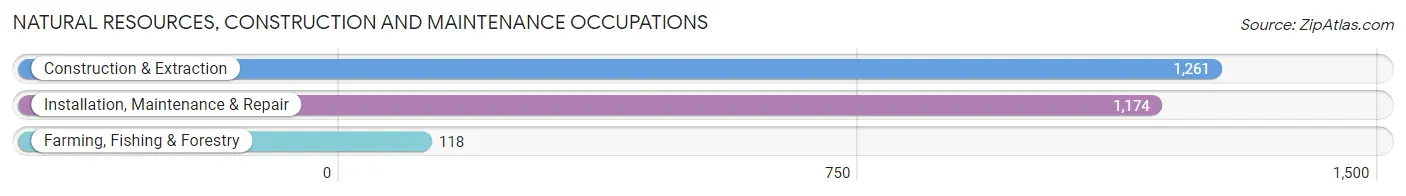
Natural Resources, Construction and Maintenance Occupations by Sex
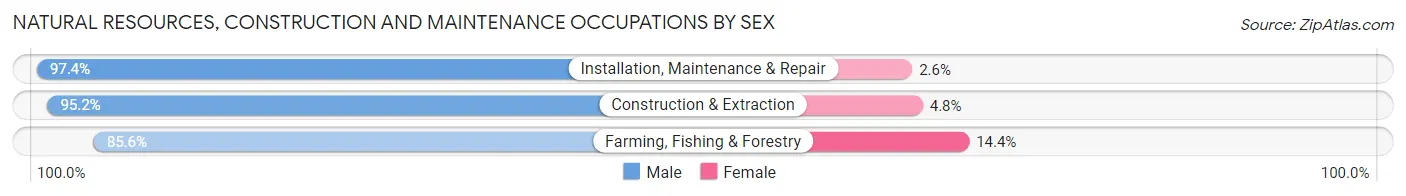
| Occupation | Male | Female |
| Farming, Fishing & Forestry | 101 (85.6%) | 17 (14.4%) |
| Construction & Extraction | 1,201 (95.2%) | 60 (4.8%) |
| Installation, Maintenance & Repair | 1,144 (97.4%) | 30 (2.6%) |
| Total (Category) | 2,446 (95.8%) | 107 (4.2%) |
| Total (Overall) | 17,555 (53.7%) | 15,103 (46.3%) |
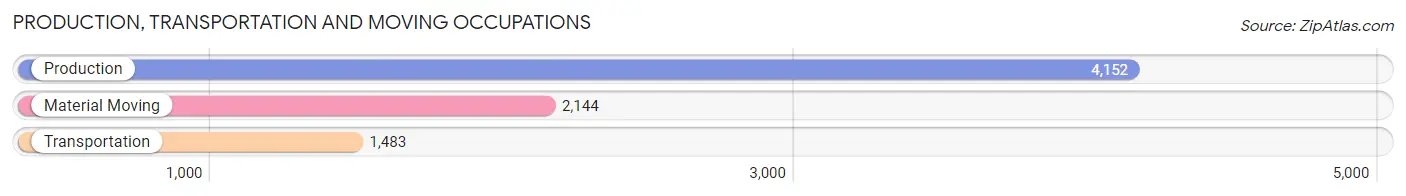
Production, Transportation and Moving Occupations
The most common Production, Transportation and Moving occupations in St Joseph are Production (4,152 | 12.7%), Material Moving (2,144 | 6.6%), and Transportation (1,483 | 4.5%).
Production, Transportation and Moving Occupations by Sex
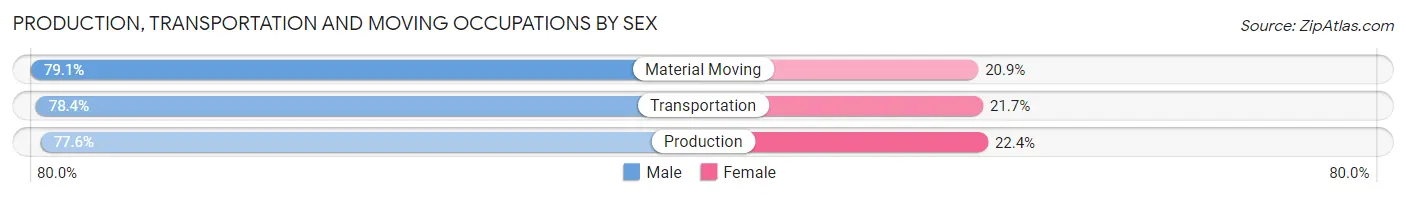
| Occupation | Male | Female |
| Production | 3,223 (77.6%) | 929 (22.4%) |
| Transportation | 1,162 (78.3%) | 321 (21.6%) |
| Material Moving | 1,695 (79.1%) | 449 (20.9%) |
| Total (Category) | 6,080 (78.2%) | 1,699 (21.8%) |
| Total (Overall) | 17,555 (53.7%) | 15,103 (46.3%) |
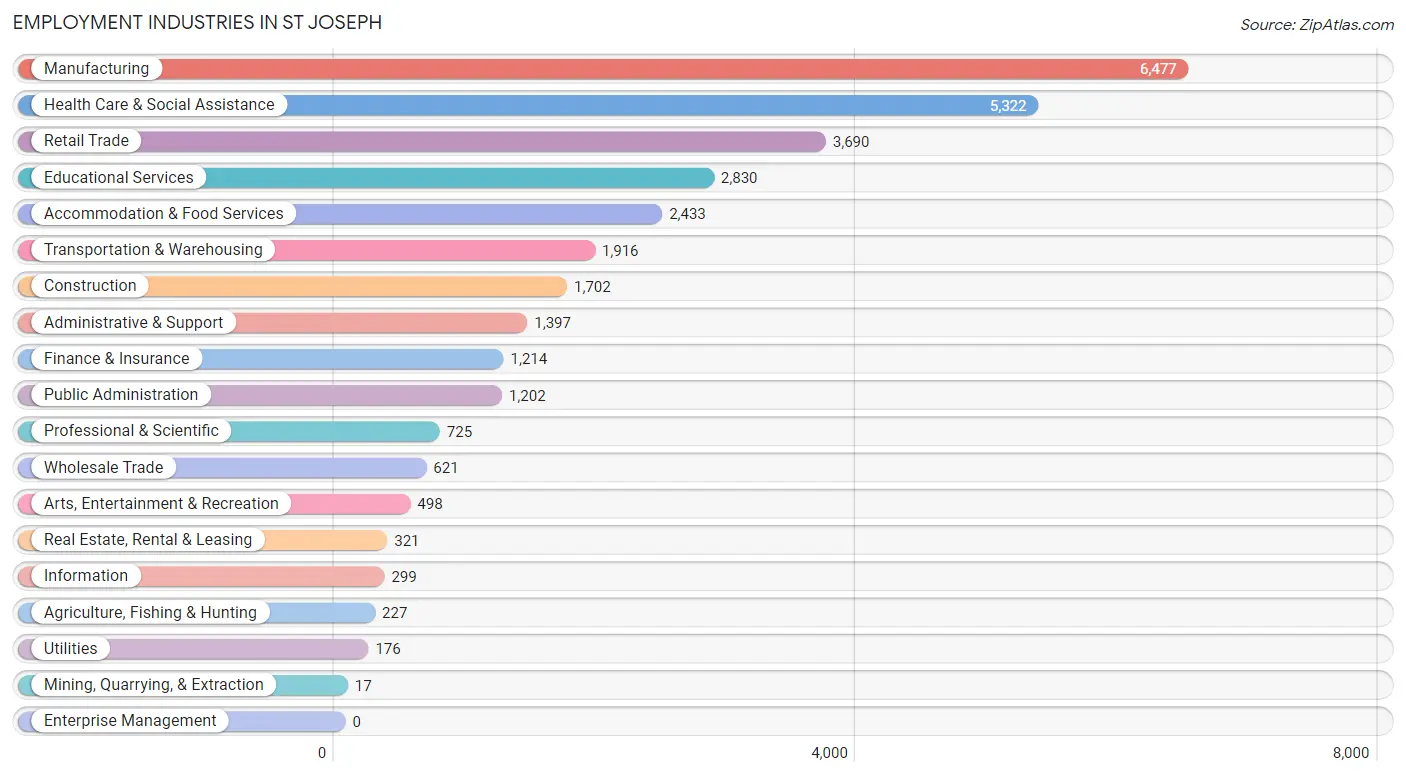
Employment Industries by Sex in St Joseph
Employment Industries in St Joseph
The major employment industries in St Joseph include Manufacturing (6,477 | 19.8%), Health Care & Social Assistance (5,322 | 16.3%), Retail Trade (3,690 | 11.3%), Educational Services (2,830 | 8.7%), and Accommodation & Food Services (2,433 | 7.4%).
Employment Industries by Sex in St Joseph
The St Joseph industries that see more men than women are Mining, Quarrying, & Extraction (100.0%), Construction (90.1%), and Wholesale Trade (79.9%), whereas the industries that tend to have a higher number of women are Health Care & Social Assistance (80.1%), Educational Services (66.8%), and Professional & Scientific (65.2%).
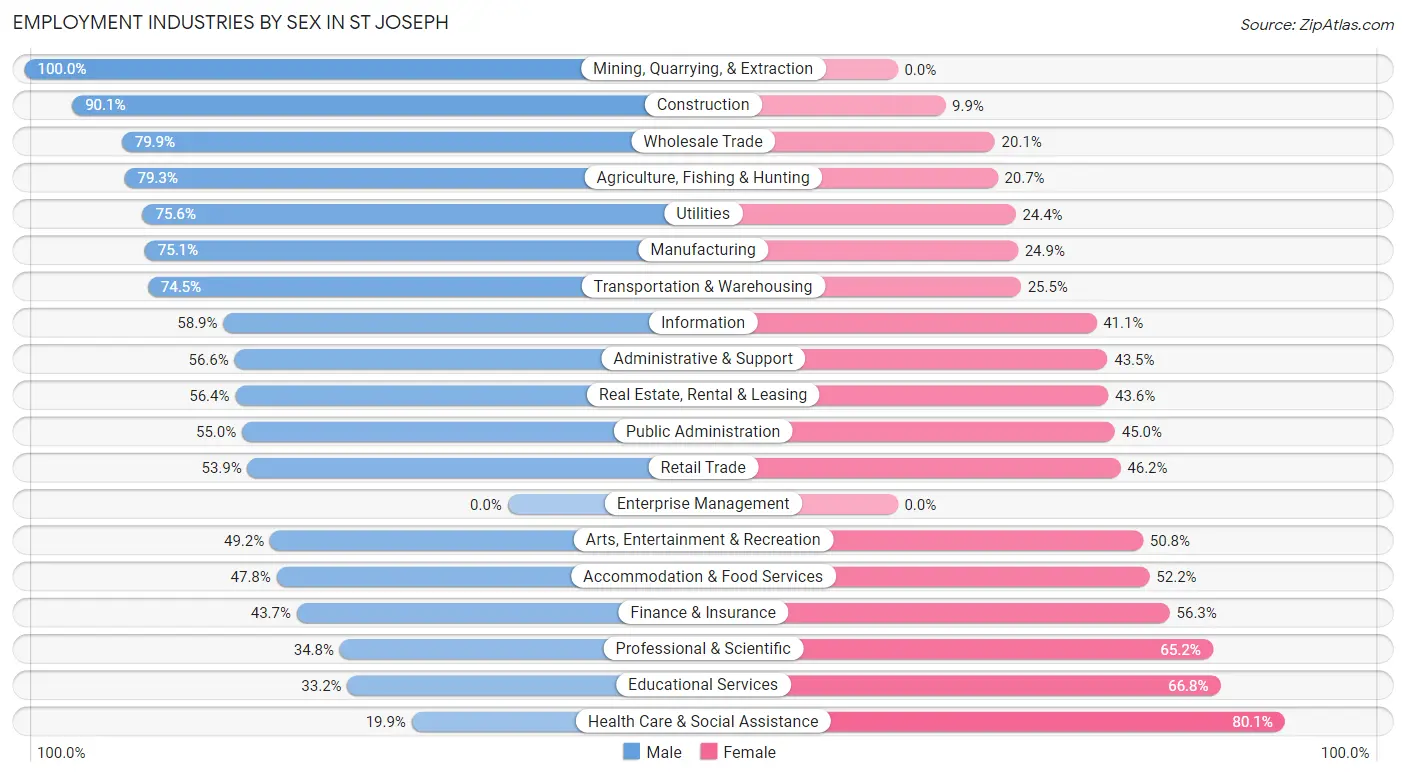
| Industry | Male | Female |
| Agriculture, Fishing & Hunting | 180 (79.3%) | 47 (20.7%) |
| Mining, Quarrying, & Extraction | 17 (100.0%) | 0 (0.0%) |
| Construction | 1,534 (90.1%) | 168 (9.9%) |
| Manufacturing | 4,864 (75.1%) | 1,613 (24.9%) |
| Wholesale Trade | 496 (79.9%) | 125 (20.1%) |
| Retail Trade | 1,987 (53.8%) | 1,703 (46.2%) |
| Transportation & Warehousing | 1,427 (74.5%) | 489 (25.5%) |
| Utilities | 133 (75.6%) | 43 (24.4%) |
| Information | 176 (58.9%) | 123 (41.1%) |
| Finance & Insurance | 530 (43.7%) | 684 (56.3%) |
| Real Estate, Rental & Leasing | 181 (56.4%) | 140 (43.6%) |
| Professional & Scientific | 252 (34.8%) | 473 (65.2%) |
| Enterprise Management | 0 (0.0%) | 0 (0.0%) |
| Administrative & Support | 790 (56.6%) | 607 (43.4%) |
| Educational Services | 939 (33.2%) | 1,891 (66.8%) |
| Health Care & Social Assistance | 1,058 (19.9%) | 4,264 (80.1%) |
| Arts, Entertainment & Recreation | 245 (49.2%) | 253 (50.8%) |
| Accommodation & Food Services | 1,164 (47.8%) | 1,269 (52.2%) |
| Public Administration | 661 (55.0%) | 541 (45.0%) |
| Total | 17,555 (53.7%) | 15,103 (46.3%) |
Education in St Joseph
School Enrollment in St Joseph
The most common levels of schooling among the 16,517 students in St Joseph are middle school (3,848 | 23.3%), college / undergraduate (3,587 | 21.7%), and elementary school (3,377 | 20.4%).
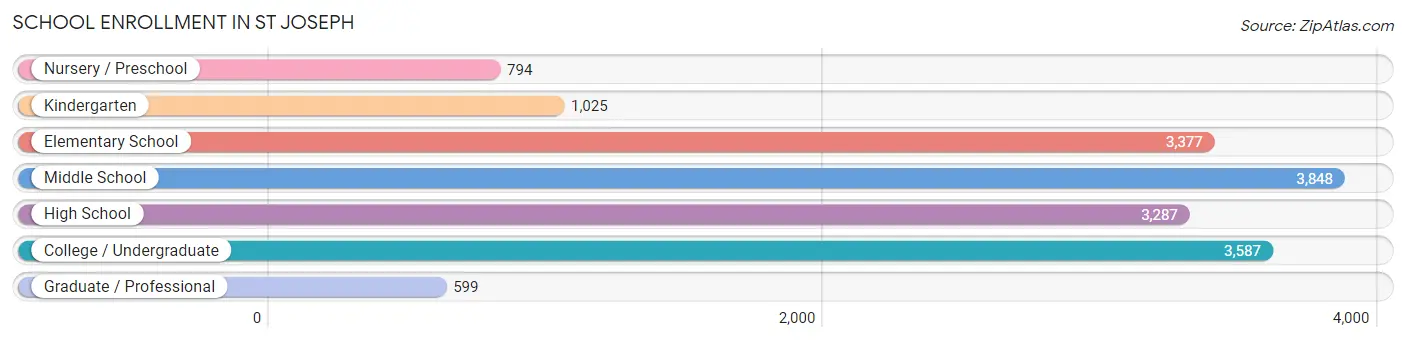
| School Level | # Students | % Students |
| Nursery / Preschool | 794 | 4.8% |
| Kindergarten | 1,025 | 6.2% |
| Elementary School | 3,377 | 20.4% |
| Middle School | 3,848 | 23.3% |
| High School | 3,287 | 19.9% |
| College / Undergraduate | 3,587 | 21.7% |
| Graduate / Professional | 599 | 3.6% |
| Total | 16,517 | 100.0% |
School Enrollment by Age by Funding Source in St Joseph
Out of a total of 16,517 students who are enrolled in schools in St Joseph, 2,131 (12.9%) attend a private institution, while the remaining 14,386 (87.1%) are enrolled in public schools. The age group of 3 to 4 year olds has the highest likelihood of being enrolled in private schools, with 322 (45.8% in the age bracket) enrolled. Conversely, the age group of 18 to 19 year olds has the lowest likelihood of being enrolled in a private school, with 1,073 (95.4% in the age bracket) attending a public institution.
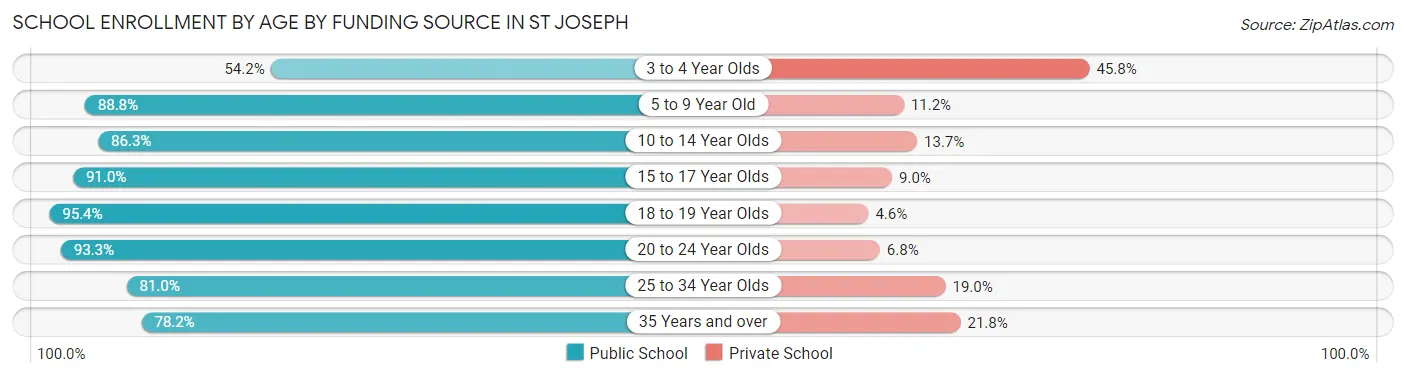
| Age Bracket | Public School | Private School |
| 3 to 4 Year Olds | 381 (54.2%) | 322 (45.8%) |
| 5 to 9 Year Old | 3,636 (88.8%) | 460 (11.2%) |
| 10 to 14 Year Olds | 3,843 (86.3%) | 609 (13.7%) |
| 15 to 17 Year Olds | 2,168 (91.0%) | 215 (9.0%) |
| 18 to 19 Year Olds | 1,073 (95.4%) | 52 (4.6%) |
| 20 to 24 Year Olds | 2,044 (93.2%) | 148 (6.8%) |
| 25 to 34 Year Olds | 636 (81.0%) | 149 (19.0%) |
| 35 Years and over | 611 (78.2%) | 170 (21.8%) |
| Total | 14,386 (87.1%) | 2,131 (12.9%) |
Educational Attainment by Field of Study in St Joseph
Business (2,351 | 19.3%), education (2,103 | 17.3%), science & technology (1,422 | 11.7%), arts & humanities (1,218 | 10.0%), and psychology (753 | 6.2%) are the most common fields of study among 12,183 individuals in St Joseph who have obtained a bachelor's degree or higher.
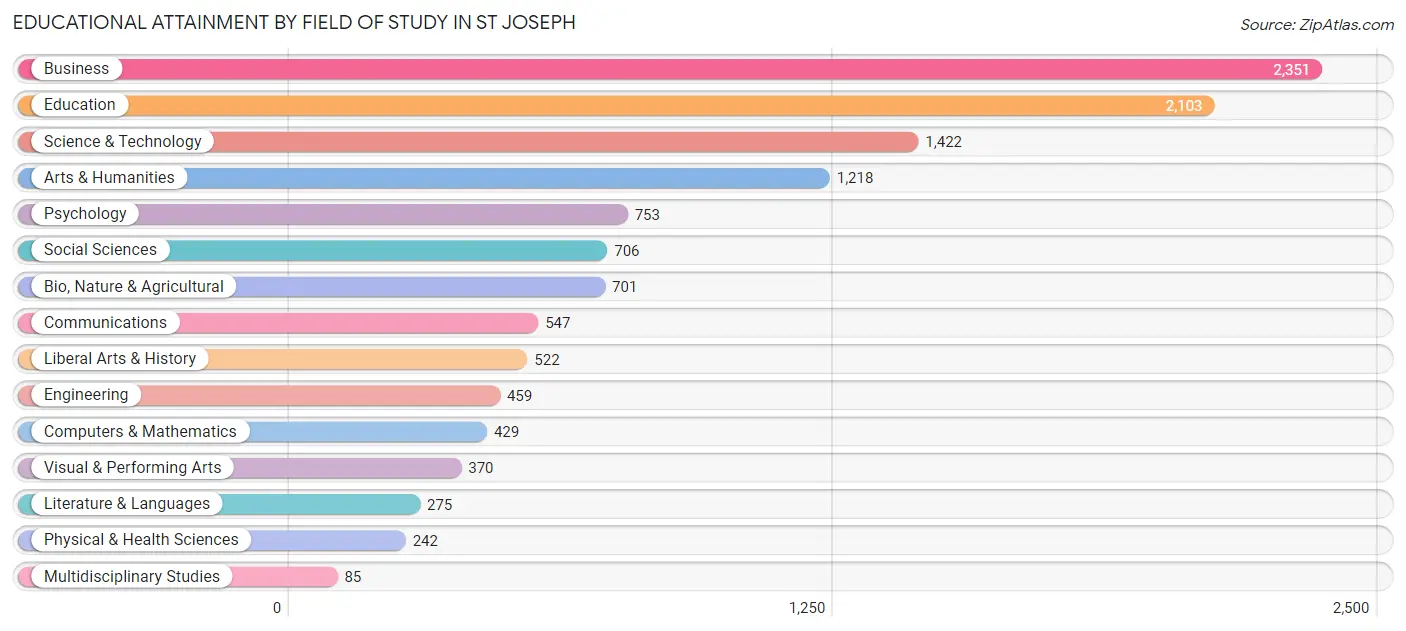
| Field of Study | # Graduates | % Graduates |
| Computers & Mathematics | 429 | 3.5% |
| Bio, Nature & Agricultural | 701 | 5.8% |
| Physical & Health Sciences | 242 | 2.0% |
| Psychology | 753 | 6.2% |
| Social Sciences | 706 | 5.8% |
| Engineering | 459 | 3.8% |
| Multidisciplinary Studies | 85 | 0.7% |
| Science & Technology | 1,422 | 11.7% |
| Business | 2,351 | 19.3% |
| Education | 2,103 | 17.3% |
| Literature & Languages | 275 | 2.3% |
| Liberal Arts & History | 522 | 4.3% |
| Visual & Performing Arts | 370 | 3.0% |
| Communications | 547 | 4.5% |
| Arts & Humanities | 1,218 | 10.0% |
| Total | 12,183 | 100.0% |
Transportation & Commute in St Joseph
Vehicle Availability by Sex in St Joseph
The most prevalent vehicle ownership categories in St Joseph are males with 2 vehicles (7,169, accounting for 42.0%) and females with 2 vehicles (5,221, making up 48.9%).
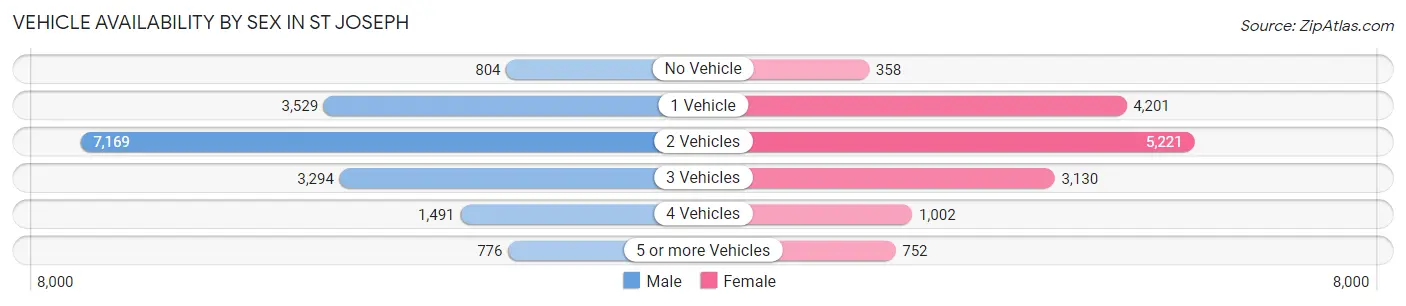
| Vehicles Available | Male | Female |
| No Vehicle | 804 (4.7%) | 358 (2.4%) |
| 1 Vehicle | 3,529 (20.7%) | 4,201 (28.6%) |
| 2 Vehicles | 7,169 (42.0%) | 5,221 (35.6%) |
| 3 Vehicles | 3,294 (19.3%) | 3,130 (21.3%) |
| 4 Vehicles | 1,491 (8.7%) | 1,002 (6.8%) |
| 5 or more Vehicles | 776 (4.5%) | 752 (5.1%) |
| Total | 17,063 (100.0%) | 14,664 (100.0%) |
Commute Time in St Joseph
The most frequently occuring commute durations in St Joseph are 10 to 14 minutes (9,227 commuters, 30.5%), 5 to 9 minutes (7,064 commuters, 23.3%), and 15 to 19 minutes (6,326 commuters, 20.9%).
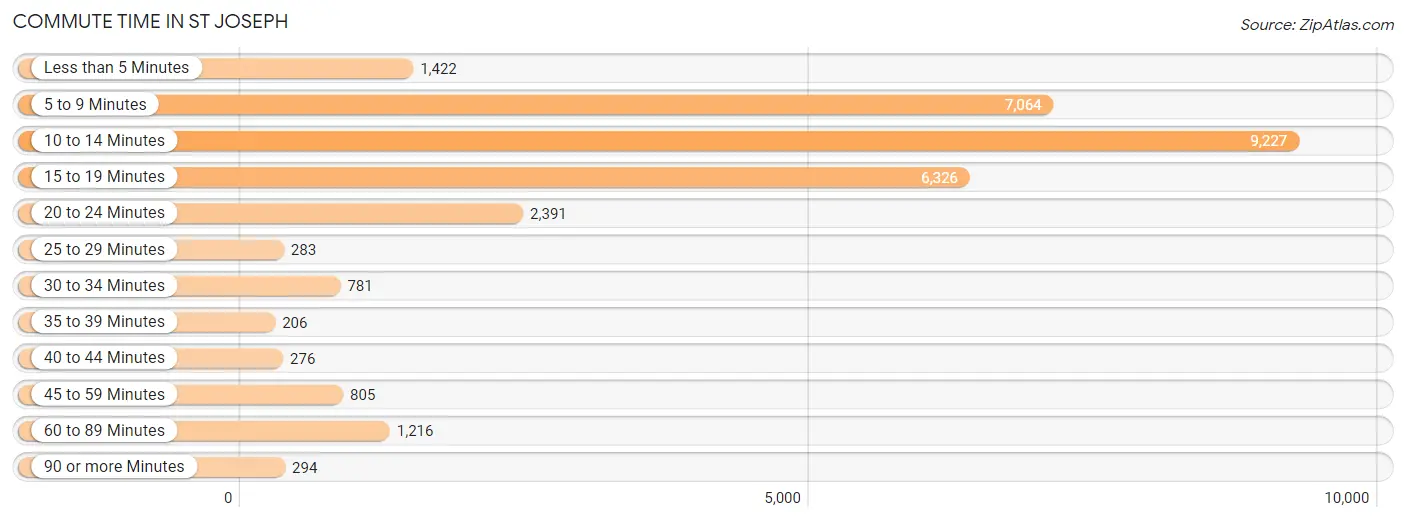
| Commute Time | # Commuters | % Commuters |
| Less than 5 Minutes | 1,422 | 4.7% |
| 5 to 9 Minutes | 7,064 | 23.3% |
| 10 to 14 Minutes | 9,227 | 30.5% |
| 15 to 19 Minutes | 6,326 | 20.9% |
| 20 to 24 Minutes | 2,391 | 7.9% |
| 25 to 29 Minutes | 283 | 0.9% |
| 30 to 34 Minutes | 781 | 2.6% |
| 35 to 39 Minutes | 206 | 0.7% |
| 40 to 44 Minutes | 276 | 0.9% |
| 45 to 59 Minutes | 805 | 2.7% |
| 60 to 89 Minutes | 1,216 | 4.0% |
| 90 or more Minutes | 294 | 1.0% |
Commute Time by Sex in St Joseph
The most common commute times in St Joseph are 10 to 14 minutes (4,784 commuters, 29.2%) for males and 10 to 14 minutes (4,443 commuters, 31.9%) for females.
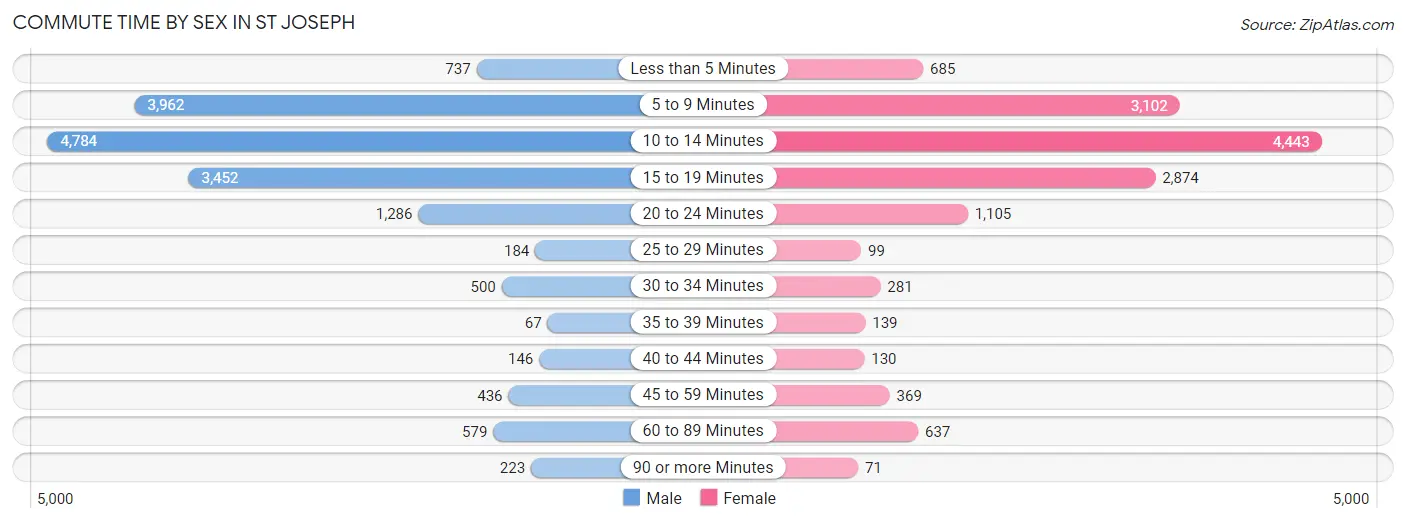
| Commute Time | Male | Female |
| Less than 5 Minutes | 737 (4.5%) | 685 (4.9%) |
| 5 to 9 Minutes | 3,962 (24.2%) | 3,102 (22.3%) |
| 10 to 14 Minutes | 4,784 (29.2%) | 4,443 (31.9%) |
| 15 to 19 Minutes | 3,452 (21.1%) | 2,874 (20.6%) |
| 20 to 24 Minutes | 1,286 (7.9%) | 1,105 (7.9%) |
| 25 to 29 Minutes | 184 (1.1%) | 99 (0.7%) |
| 30 to 34 Minutes | 500 (3.1%) | 281 (2.0%) |
| 35 to 39 Minutes | 67 (0.4%) | 139 (1.0%) |
| 40 to 44 Minutes | 146 (0.9%) | 130 (0.9%) |
| 45 to 59 Minutes | 436 (2.7%) | 369 (2.6%) |
| 60 to 89 Minutes | 579 (3.5%) | 637 (4.6%) |
| 90 or more Minutes | 223 (1.4%) | 71 (0.5%) |
Time of Departure to Work by Sex in St Joseph
The most frequent times of departure to work in St Joseph are 4:00 PM to 11:59 PM (2,249, 13.8%) for males and 7:30 AM to 7:59 AM (2,388, 17.1%) for females.
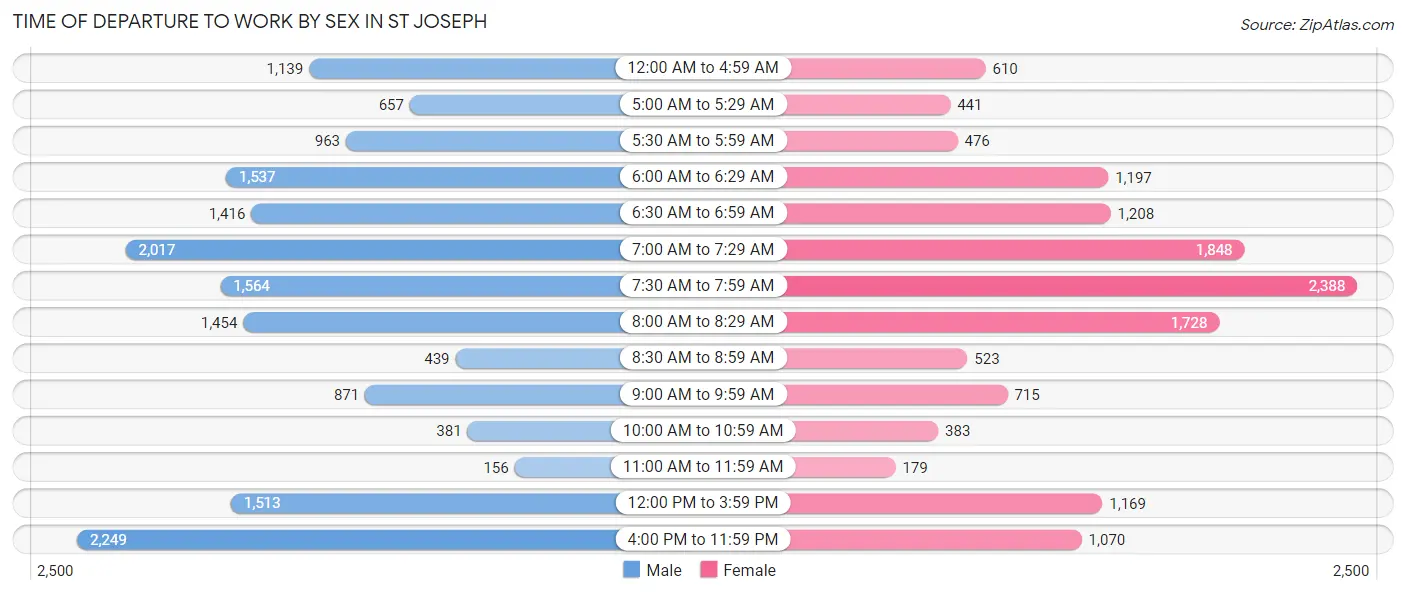
| Time of Departure | Male | Female |
| 12:00 AM to 4:59 AM | 1,139 (7.0%) | 610 (4.4%) |
| 5:00 AM to 5:29 AM | 657 (4.0%) | 441 (3.2%) |
| 5:30 AM to 5:59 AM | 963 (5.9%) | 476 (3.4%) |
| 6:00 AM to 6:29 AM | 1,537 (9.4%) | 1,197 (8.6%) |
| 6:30 AM to 6:59 AM | 1,416 (8.7%) | 1,208 (8.7%) |
| 7:00 AM to 7:29 AM | 2,017 (12.3%) | 1,848 (13.3%) |
| 7:30 AM to 7:59 AM | 1,564 (9.6%) | 2,388 (17.1%) |
| 8:00 AM to 8:29 AM | 1,454 (8.9%) | 1,728 (12.4%) |
| 8:30 AM to 8:59 AM | 439 (2.7%) | 523 (3.7%) |
| 9:00 AM to 9:59 AM | 871 (5.3%) | 715 (5.1%) |
| 10:00 AM to 10:59 AM | 381 (2.3%) | 383 (2.8%) |
| 11:00 AM to 11:59 AM | 156 (0.9%) | 179 (1.3%) |
| 12:00 PM to 3:59 PM | 1,513 (9.2%) | 1,169 (8.4%) |
| 4:00 PM to 11:59 PM | 2,249 (13.8%) | 1,070 (7.7%) |
| Total | 16,356 (100.0%) | 13,935 (100.0%) |
Housing Occupancy in St Joseph
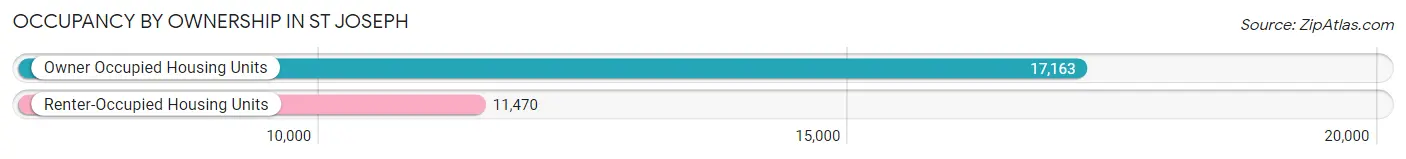
Occupancy by Ownership in St Joseph
Of the total 28,633 dwellings in St Joseph, owner-occupied units account for 17,163 (59.9%), while renter-occupied units make up 11,470 (40.1%).
| Occupancy | # Housing Units | % Housing Units |
| Owner Occupied Housing Units | 17,163 | 59.9% |
| Renter-Occupied Housing Units | 11,470 | 40.1% |
| Total Occupied Housing Units | 28,633 | 100.0% |
Occupancy by Household Size in St Joseph
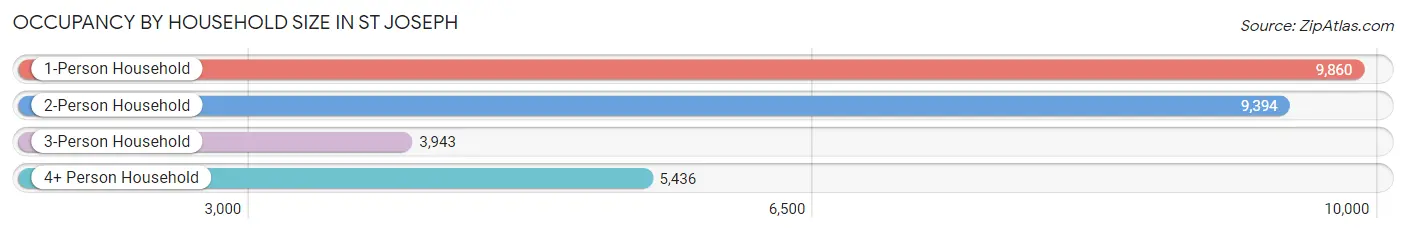
| Household Size | # Housing Units | % Housing Units |
| 1-Person Household | 9,860 | 34.4% |
| 2-Person Household | 9,394 | 32.8% |
| 3-Person Household | 3,943 | 13.8% |
| 4+ Person Household | 5,436 | 19.0% |
| Total Housing Units | 28,633 | 100.0% |
Occupancy by Ownership by Household Size in St Joseph
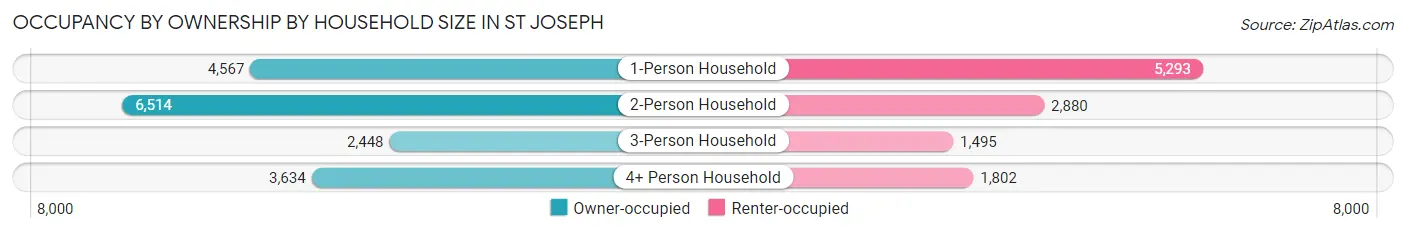
| Household Size | Owner-occupied | Renter-occupied |
| 1-Person Household | 4,567 (46.3%) | 5,293 (53.7%) |
| 2-Person Household | 6,514 (69.3%) | 2,880 (30.7%) |
| 3-Person Household | 2,448 (62.1%) | 1,495 (37.9%) |
| 4+ Person Household | 3,634 (66.8%) | 1,802 (33.2%) |
| Total Housing Units | 17,163 (59.9%) | 11,470 (40.1%) |
Occupancy by Educational Attainment in St Joseph
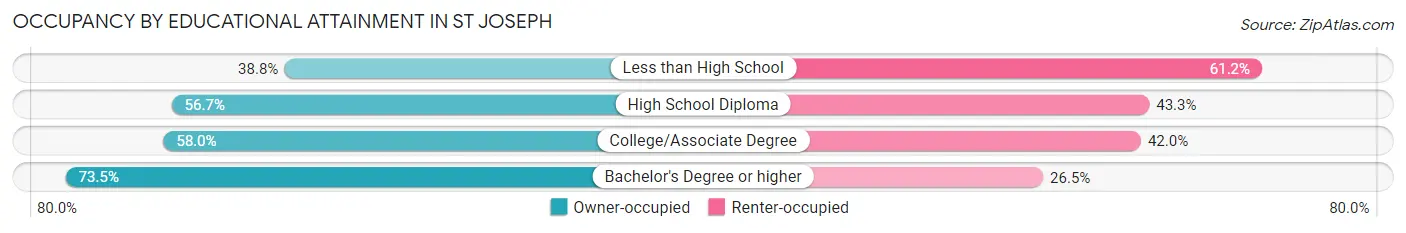
| Household Size | Owner-occupied | Renter-occupied |
| Less than High School | 883 (38.8%) | 1,391 (61.2%) |
| High School Diploma | 5,612 (56.7%) | 4,289 (43.3%) |
| College/Associate Degree | 5,350 (58.0%) | 3,874 (42.0%) |
| Bachelor's Degree or higher | 5,318 (73.5%) | 1,916 (26.5%) |
Occupancy by Age of Householder in St Joseph
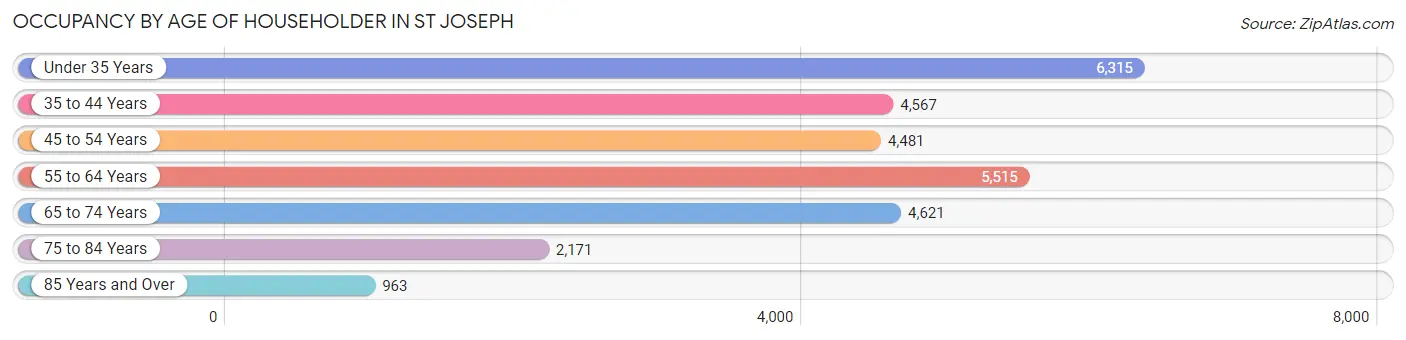
| Age Bracket | # Households | % Households |
| Under 35 Years | 6,315 | 22.1% |
| 35 to 44 Years | 4,567 | 16.0% |
| 45 to 54 Years | 4,481 | 15.7% |
| 55 to 64 Years | 5,515 | 19.3% |
| 65 to 74 Years | 4,621 | 16.1% |
| 75 to 84 Years | 2,171 | 7.6% |
| 85 Years and Over | 963 | 3.4% |
| Total | 28,633 | 100.0% |
Housing Finances in St Joseph
Median Income by Occupancy in St Joseph

| Occupancy Type | # Households | Median Income |
| Owner-Occupied | 17,163 (59.9%) | $69,900 |
| Renter-Occupied | 11,470 (40.1%) | $32,835 |
| Average | 28,633 (100.0%) | $54,515 |
Occupancy by Householder Income Bracket in St Joseph
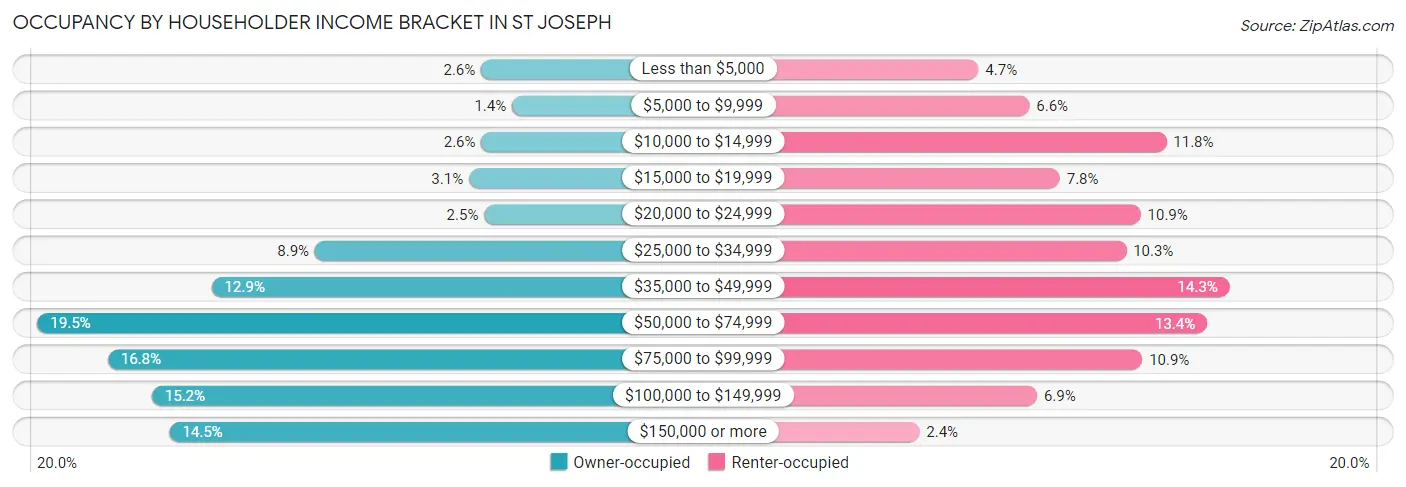
| Income Bracket | Owner-occupied | Renter-occupied |
| Less than $5,000 | 448 (2.6%) | 537 (4.7%) |
| $5,000 to $9,999 | 245 (1.4%) | 759 (6.6%) |
| $10,000 to $14,999 | 446 (2.6%) | 1,358 (11.8%) |
| $15,000 to $19,999 | 527 (3.1%) | 892 (7.8%) |
| $20,000 to $24,999 | 428 (2.5%) | 1,246 (10.9%) |
| $25,000 to $34,999 | 1,535 (8.9%) | 1,182 (10.3%) |
| $35,000 to $49,999 | 2,211 (12.9%) | 1,635 (14.2%) |
| $50,000 to $74,999 | 3,348 (19.5%) | 1,536 (13.4%) |
| $75,000 to $99,999 | 2,888 (16.8%) | 1,253 (10.9%) |
| $100,000 to $149,999 | 2,601 (15.1%) | 793 (6.9%) |
| $150,000 or more | 2,486 (14.5%) | 279 (2.4%) |
| Total | 17,163 (100.0%) | 11,470 (100.0%) |
Monthly Housing Cost Tiers in St Joseph
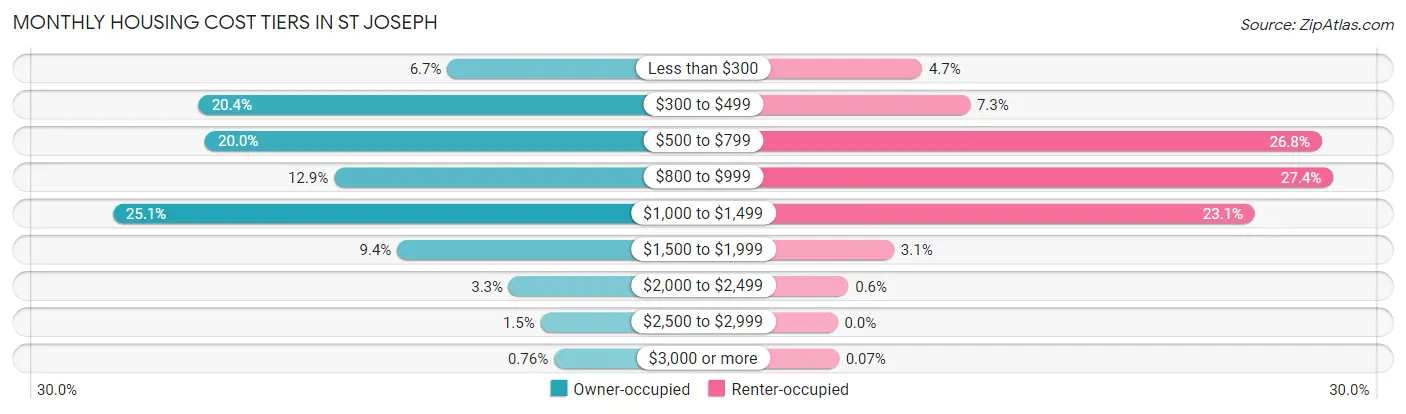
| Monthly Cost | Owner-occupied | Renter-occupied |
| Less than $300 | 1,141 (6.7%) | 536 (4.7%) |
| $300 to $499 | 3,497 (20.4%) | 840 (7.3%) |
| $500 to $799 | 3,438 (20.0%) | 3,068 (26.8%) |
| $800 to $999 | 2,215 (12.9%) | 3,140 (27.4%) |
| $1,000 to $1,499 | 4,311 (25.1%) | 2,645 (23.1%) |
| $1,500 to $1,999 | 1,616 (9.4%) | 358 (3.1%) |
| $2,000 to $2,499 | 558 (3.3%) | 69 (0.6%) |
| $2,500 to $2,999 | 257 (1.5%) | 0 (0.0%) |
| $3,000 or more | 130 (0.8%) | 8 (0.1%) |
| Total | 17,163 (100.0%) | 11,470 (100.0%) |
Physical Housing Characteristics in St Joseph
Housing Structures in St Joseph
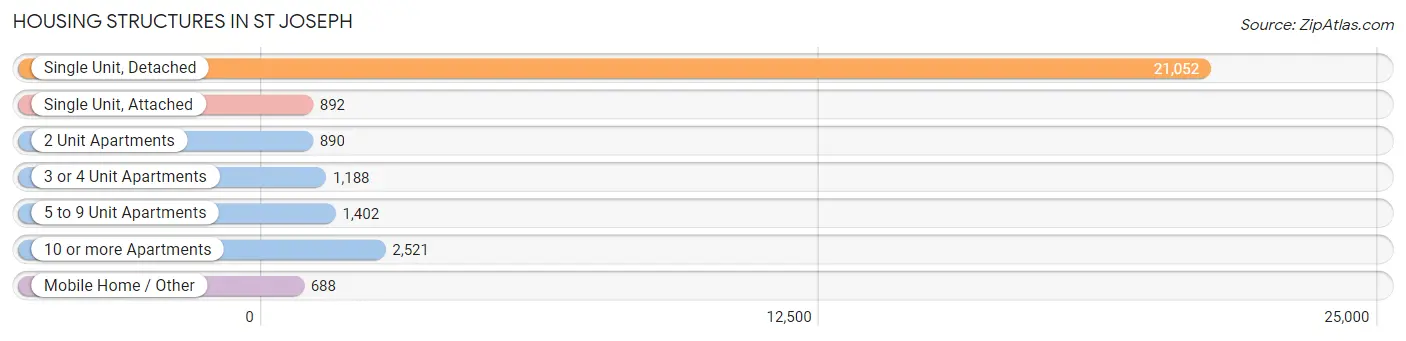
| Structure Type | # Housing Units | % Housing Units |
| Single Unit, Detached | 21,052 | 73.5% |
| Single Unit, Attached | 892 | 3.1% |
| 2 Unit Apartments | 890 | 3.1% |
| 3 or 4 Unit Apartments | 1,188 | 4.2% |
| 5 to 9 Unit Apartments | 1,402 | 4.9% |
| 10 or more Apartments | 2,521 | 8.8% |
| Mobile Home / Other | 688 | 2.4% |
| Total | 28,633 | 100.0% |
Housing Structures by Occupancy in St Joseph
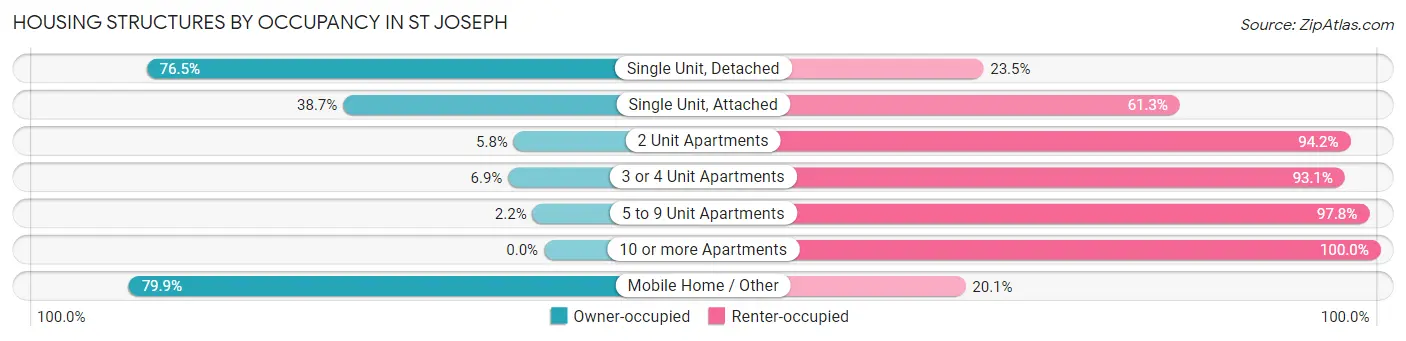
| Structure Type | Owner-occupied | Renter-occupied |
| Single Unit, Detached | 16,103 (76.5%) | 4,949 (23.5%) |
| Single Unit, Attached | 345 (38.7%) | 547 (61.3%) |
| 2 Unit Apartments | 52 (5.8%) | 838 (94.2%) |
| 3 or 4 Unit Apartments | 82 (6.9%) | 1,106 (93.1%) |
| 5 to 9 Unit Apartments | 31 (2.2%) | 1,371 (97.8%) |
| 10 or more Apartments | 0 (0.0%) | 2,521 (100.0%) |
| Mobile Home / Other | 550 (79.9%) | 138 (20.1%) |
| Total | 17,163 (59.9%) | 11,470 (40.1%) |
Housing Structures by Number of Rooms in St Joseph
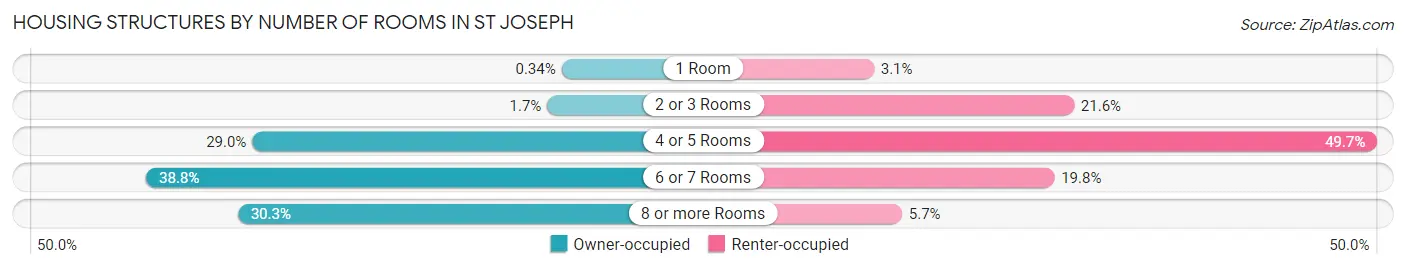
| Number of Rooms | Owner-occupied | Renter-occupied |
| 1 Room | 58 (0.3%) | 359 (3.1%) |
| 2 or 3 Rooms | 286 (1.7%) | 2,482 (21.6%) |
| 4 or 5 Rooms | 4,968 (28.9%) | 5,699 (49.7%) |
| 6 or 7 Rooms | 6,652 (38.8%) | 2,273 (19.8%) |
| 8 or more Rooms | 5,199 (30.3%) | 657 (5.7%) |
| Total | 17,163 (100.0%) | 11,470 (100.0%) |
Housing Structure by Heating Type in St Joseph
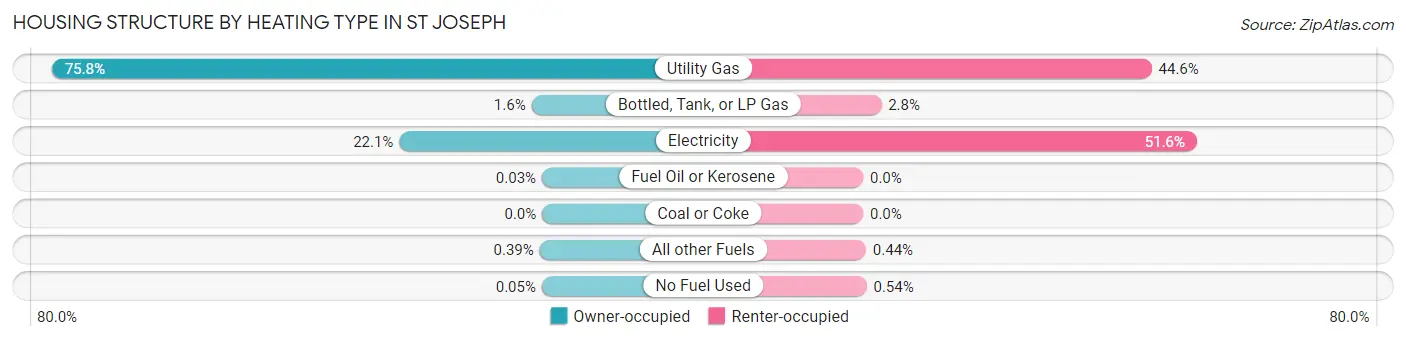
| Heating Type | Owner-occupied | Renter-occupied |
| Utility Gas | 13,009 (75.8%) | 5,117 (44.6%) |
| Bottled, Tank, or LP Gas | 281 (1.6%) | 322 (2.8%) |
| Electricity | 3,791 (22.1%) | 5,918 (51.6%) |
| Fuel Oil or Kerosene | 6 (0.0%) | 0 (0.0%) |
| Coal or Coke | 0 (0.0%) | 0 (0.0%) |
| All other Fuels | 67 (0.4%) | 51 (0.4%) |
| No Fuel Used | 9 (0.1%) | 62 (0.5%) |
| Total | 17,163 (100.0%) | 11,470 (100.0%) |
Household Vehicle Usage in St Joseph
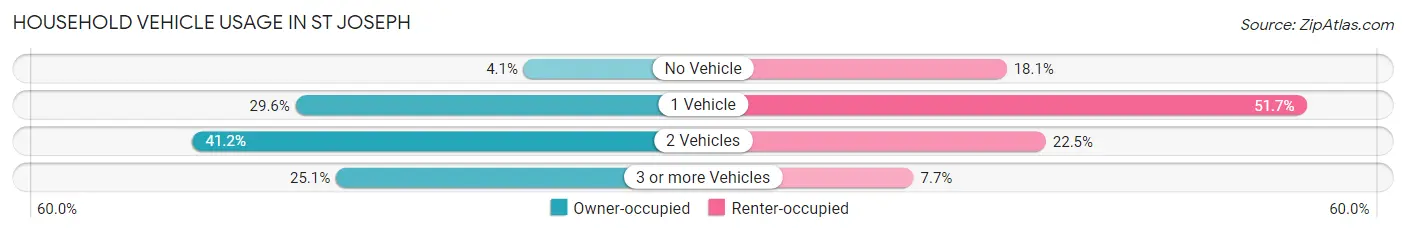
| Vehicles per Household | Owner-occupied | Renter-occupied |
| No Vehicle | 700 (4.1%) | 2,078 (18.1%) |
| 1 Vehicle | 5,087 (29.6%) | 5,928 (51.7%) |
| 2 Vehicles | 7,067 (41.2%) | 2,582 (22.5%) |
| 3 or more Vehicles | 4,309 (25.1%) | 882 (7.7%) |
| Total | 17,163 (100.0%) | 11,470 (100.0%) |
Real Estate & Mortgages in St Joseph
Real Estate and Mortgage Overview in St Joseph
| Characteristic | Without Mortgage | With Mortgage |
| Housing Units | 7,295 | 9,868 |
| Median Property Value | $129,500 | $143,300 |
| Median Household Income | $51,412 | $1,757 |
| Monthly Housing Costs | $451 | $130 |
| Real Estate Taxes | $1,058 | $84 |
Property Value by Mortgage Status in St Joseph
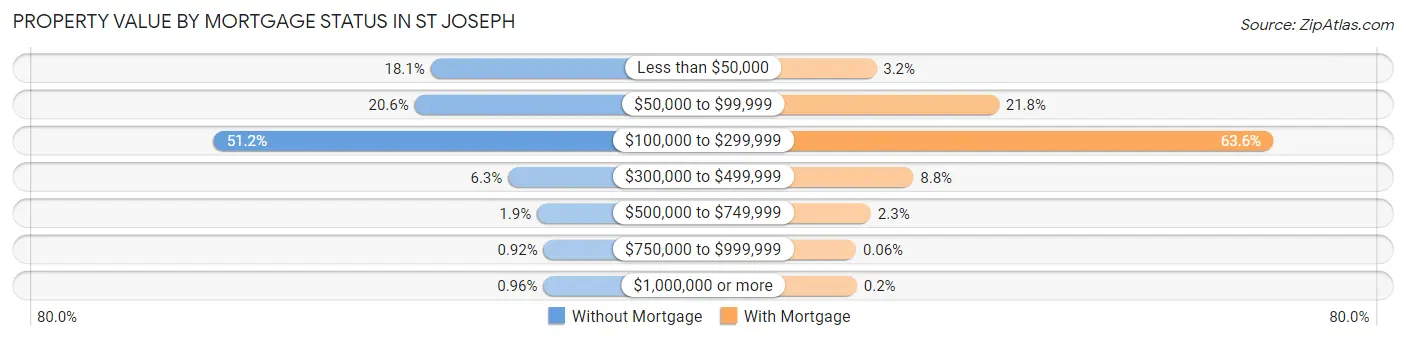
| Property Value | Without Mortgage | With Mortgage |
| Less than $50,000 | 1,323 (18.1%) | 312 (3.2%) |
| $50,000 to $99,999 | 1,501 (20.6%) | 2,154 (21.8%) |
| $100,000 to $299,999 | 3,733 (51.2%) | 6,276 (63.6%) |
| $300,000 to $499,999 | 461 (6.3%) | 869 (8.8%) |
| $500,000 to $749,999 | 140 (1.9%) | 231 (2.3%) |
| $750,000 to $999,999 | 67 (0.9%) | 6 (0.1%) |
| $1,000,000 or more | 70 (1.0%) | 20 (0.2%) |
| Total | 7,295 (100.0%) | 9,868 (100.0%) |
Household Income by Mortgage Status in St Joseph
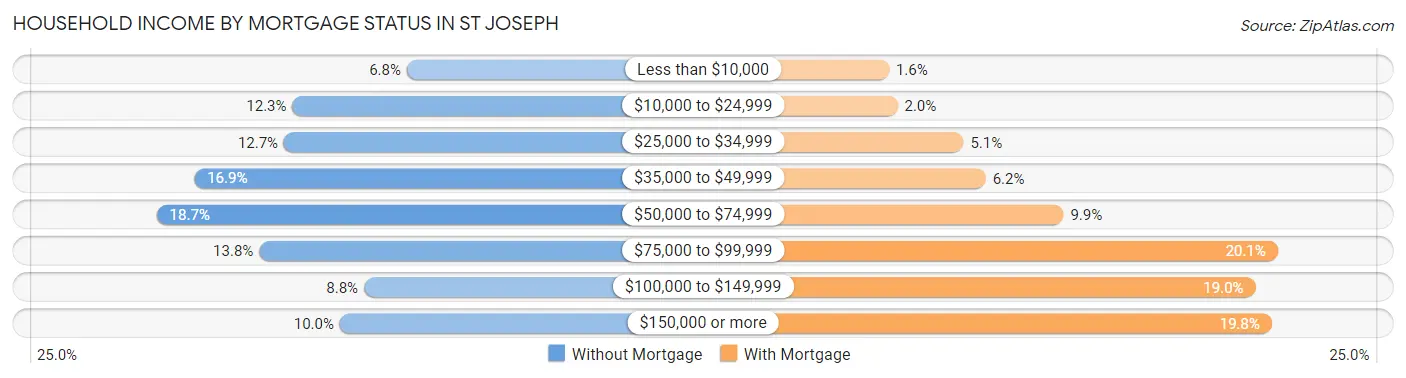
| Household Income | Without Mortgage | With Mortgage |
| Less than $10,000 | 496 (6.8%) | 157 (1.6%) |
| $10,000 to $24,999 | 894 (12.2%) | 197 (2.0%) |
| $25,000 to $34,999 | 923 (12.7%) | 507 (5.1%) |
| $35,000 to $49,999 | 1,234 (16.9%) | 612 (6.2%) |
| $50,000 to $74,999 | 1,365 (18.7%) | 977 (9.9%) |
| $75,000 to $99,999 | 1,009 (13.8%) | 1,983 (20.1%) |
| $100,000 to $149,999 | 645 (8.8%) | 1,879 (19.0%) |
| $150,000 or more | 729 (10.0%) | 1,956 (19.8%) |
| Total | 7,295 (100.0%) | 9,868 (100.0%) |
Property Value to Household Income Ratio in St Joseph
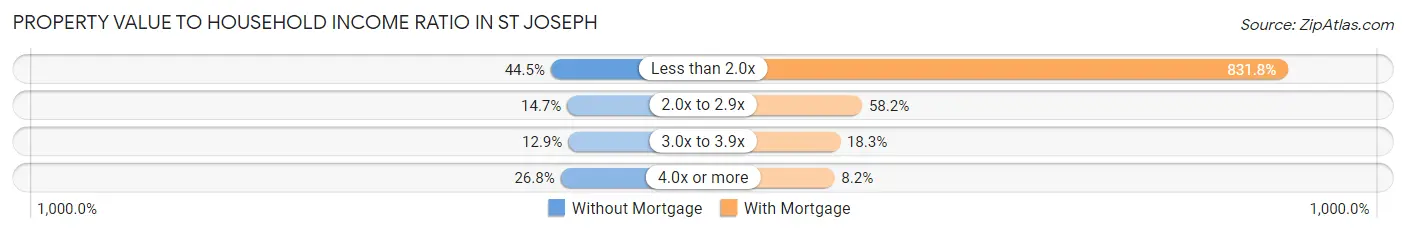
| Value-to-Income Ratio | Without Mortgage | With Mortgage |
| Less than 2.0x | 3,246 (44.5%) | 82,083 (831.8%) |
| 2.0x to 2.9x | 1,072 (14.7%) | 5,744 (58.2%) |
| 3.0x to 3.9x | 942 (12.9%) | 1,804 (18.3%) |
| 4.0x or more | 1,954 (26.8%) | 806 (8.2%) |
| Total | 7,295 (100.0%) | 9,868 (100.0%) |
Real Estate Taxes by Mortgage Status in St Joseph
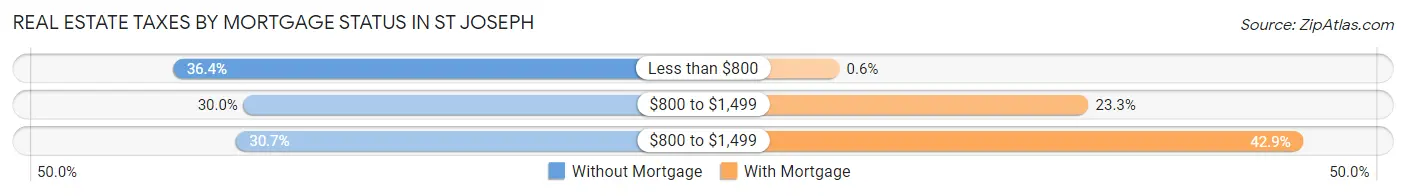
| Property Taxes | Without Mortgage | With Mortgage |
| Less than $800 | 2,654 (36.4%) | 59 (0.6%) |
| $800 to $1,499 | 2,188 (30.0%) | 2,303 (23.3%) |
| $800 to $1,499 | 2,237 (30.7%) | 4,230 (42.9%) |
| Total | 7,295 (100.0%) | 9,868 (100.0%) |
Health & Disability in St Joseph
Health Insurance Coverage by Age in St Joseph
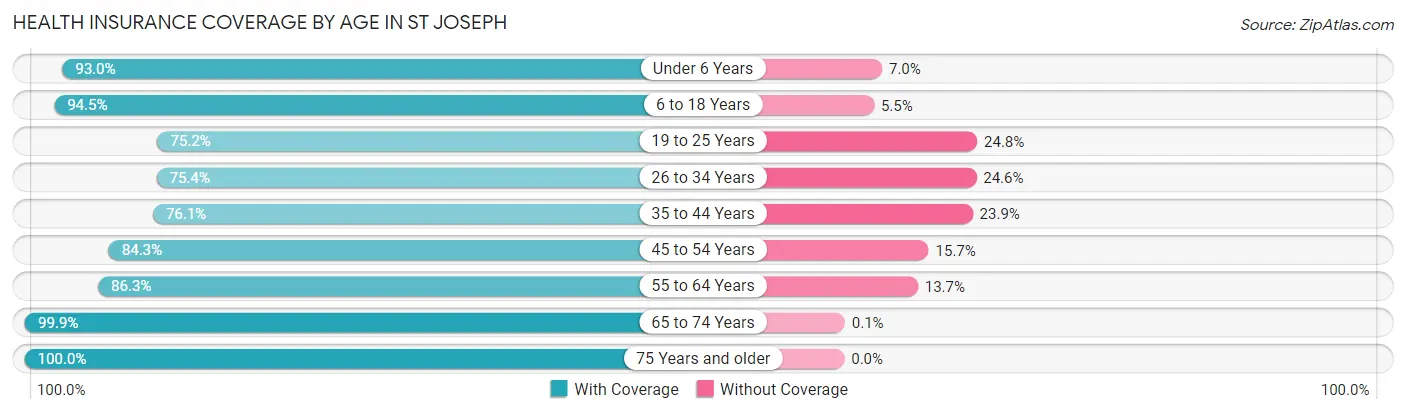
| Age Bracket | With Coverage | Without Coverage |
| Under 6 Years | 4,796 (93.0%) | 363 (7.0%) |
| 6 to 18 Years | 11,083 (94.5%) | 649 (5.5%) |
| 19 to 25 Years | 5,501 (75.2%) | 1,811 (24.8%) |
| 26 to 34 Years | 6,253 (75.4%) | 2,041 (24.6%) |
| 35 to 44 Years | 6,587 (76.1%) | 2,073 (23.9%) |
| 45 to 54 Years | 6,724 (84.3%) | 1,254 (15.7%) |
| 55 to 64 Years | 7,860 (86.3%) | 1,249 (13.7%) |
| 65 to 74 Years | 6,702 (99.9%) | 7 (0.1%) |
| 75 Years and older | 4,613 (100.0%) | 0 (0.0%) |
| Total | 60,119 (86.4%) | 9,447 (13.6%) |
Health Insurance Coverage by Citizenship Status in St Joseph
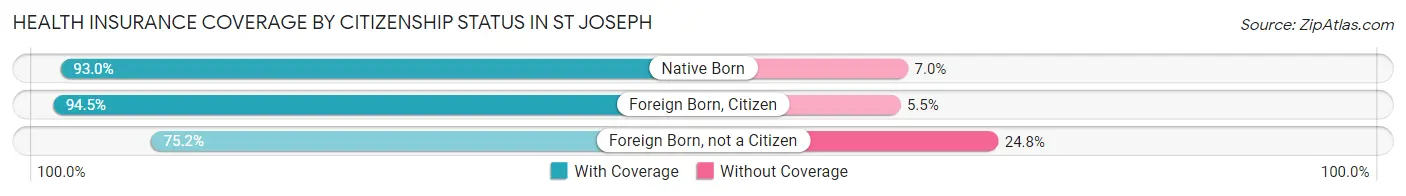
| Citizenship Status | With Coverage | Without Coverage |
| Native Born | 4,796 (93.0%) | 363 (7.0%) |
| Foreign Born, Citizen | 11,083 (94.5%) | 649 (5.5%) |
| Foreign Born, not a Citizen | 5,501 (75.2%) | 1,811 (24.8%) |
Health Insurance Coverage by Household Income in St Joseph
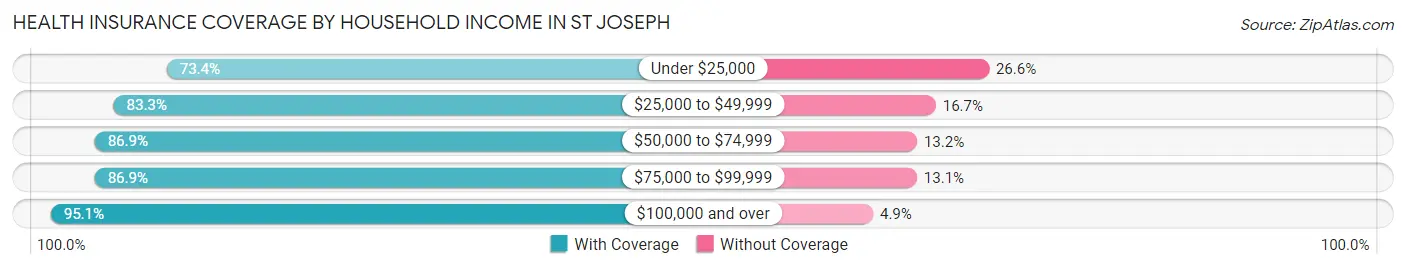
| Household Income | With Coverage | Without Coverage |
| Under $25,000 | 8,386 (73.4%) | 3,045 (26.6%) |
| $25,000 to $49,999 | 11,541 (83.3%) | 2,311 (16.7%) |
| $50,000 to $74,999 | 10,022 (86.9%) | 1,518 (13.2%) |
| $75,000 to $99,999 | 9,982 (86.9%) | 1,510 (13.1%) |
| $100,000 and over | 19,069 (95.1%) | 986 (4.9%) |
Public vs Private Health Insurance Coverage by Age in St Joseph
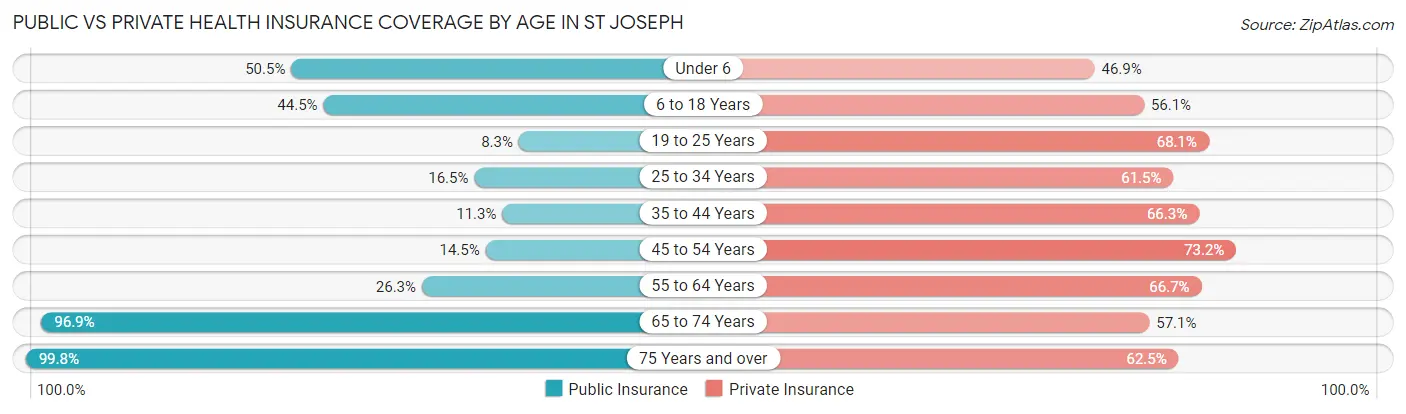
| Age Bracket | Public Insurance | Private Insurance |
| Under 6 | 2,606 (50.5%) | 2,420 (46.9%) |
| 6 to 18 Years | 5,225 (44.5%) | 6,579 (56.1%) |
| 19 to 25 Years | 605 (8.3%) | 4,980 (68.1%) |
| 25 to 34 Years | 1,371 (16.5%) | 5,103 (61.5%) |
| 35 to 44 Years | 981 (11.3%) | 5,741 (66.3%) |
| 45 to 54 Years | 1,153 (14.4%) | 5,840 (73.2%) |
| 55 to 64 Years | 2,392 (26.3%) | 6,079 (66.7%) |
| 65 to 74 Years | 6,500 (96.9%) | 3,829 (57.1%) |
| 75 Years and over | 4,603 (99.8%) | 2,883 (62.5%) |
| Total | 25,436 (36.6%) | 43,454 (62.5%) |
Disability Status by Sex by Age in St Joseph
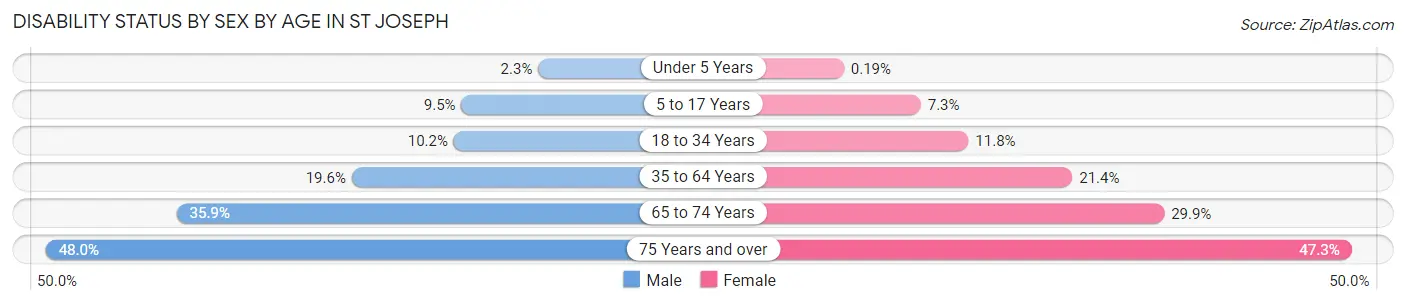
| Age Bracket | Male | Female |
| Under 5 Years | 54 (2.3%) | 4 (0.2%) |
| 5 to 17 Years | 548 (9.5%) | 426 (7.3%) |
| 18 to 34 Years | 844 (10.2%) | 963 (11.7%) |
| 35 to 64 Years | 2,555 (19.6%) | 2,725 (21.4%) |
| 65 to 74 Years | 1,110 (35.9%) | 1,082 (29.9%) |
| 75 Years and over | 823 (48.0%) | 1,372 (47.3%) |
Disability Class by Sex by Age in St Joseph
Disability Class: Hearing Difficulty
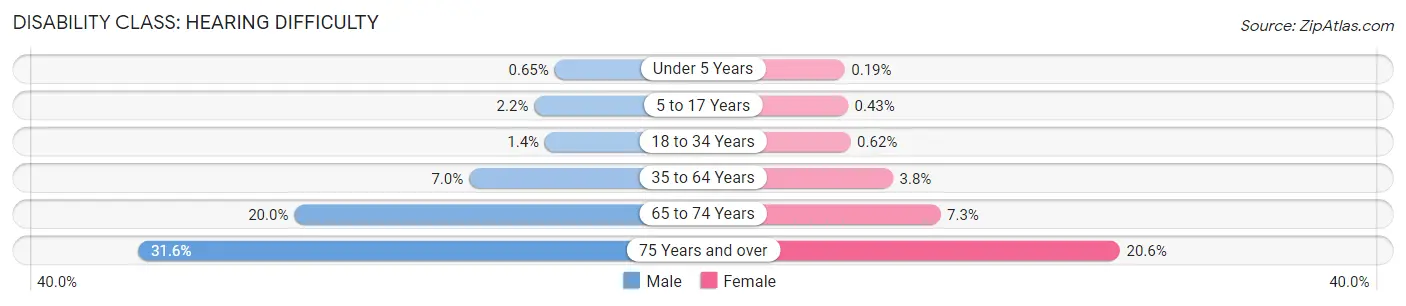
| Age Bracket | Male | Female |
| Under 5 Years | 15 (0.6%) | 4 (0.2%) |
| 5 to 17 Years | 125 (2.2%) | 25 (0.4%) |
| 18 to 34 Years | 114 (1.4%) | 51 (0.6%) |
| 35 to 64 Years | 911 (7.0%) | 480 (3.8%) |
| 65 to 74 Years | 618 (20.0%) | 264 (7.3%) |
| 75 Years and over | 541 (31.6%) | 598 (20.6%) |
Disability Class: Vision Difficulty
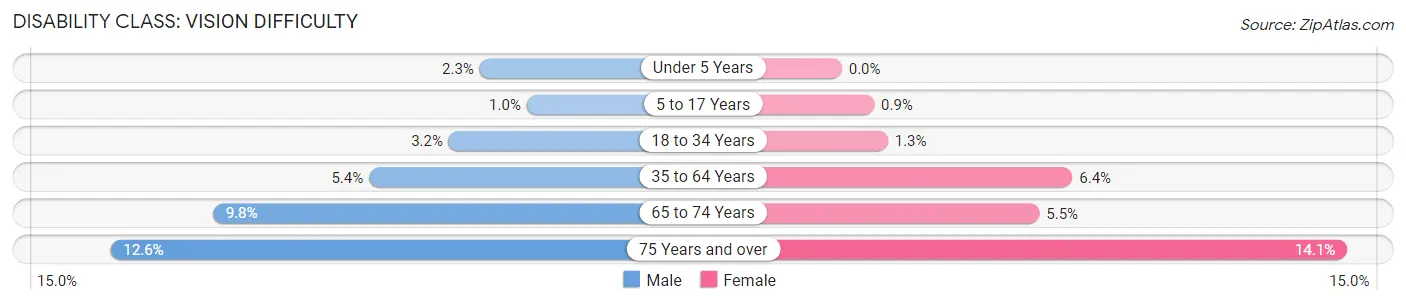
| Age Bracket | Male | Female |
| Under 5 Years | 54 (2.3%) | 0 (0.0%) |
| 5 to 17 Years | 59 (1.0%) | 52 (0.9%) |
| 18 to 34 Years | 265 (3.2%) | 105 (1.3%) |
| 35 to 64 Years | 704 (5.4%) | 818 (6.4%) |
| 65 to 74 Years | 302 (9.8%) | 199 (5.5%) |
| 75 Years and over | 216 (12.6%) | 408 (14.1%) |
Disability Class: Cognitive Difficulty
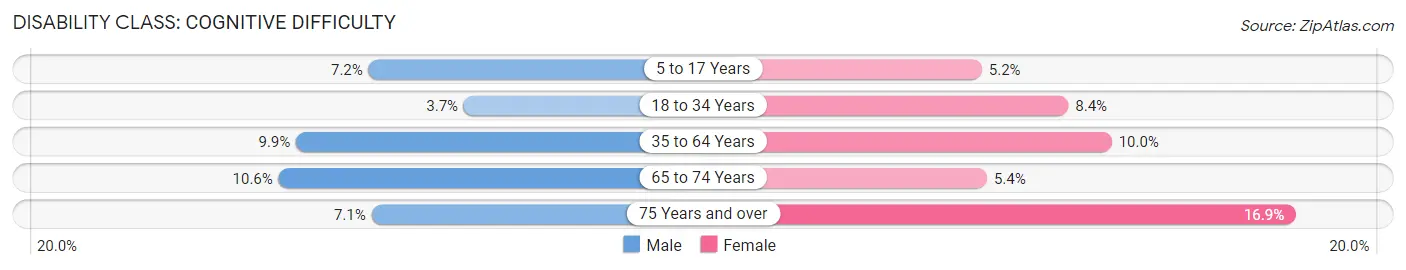
| Age Bracket | Male | Female |
| 5 to 17 Years | 419 (7.2%) | 302 (5.2%) |
| 18 to 34 Years | 306 (3.7%) | 689 (8.4%) |
| 35 to 64 Years | 1,291 (9.9%) | 1,277 (10.0%) |
| 65 to 74 Years | 327 (10.6%) | 195 (5.4%) |
| 75 Years and over | 122 (7.1%) | 489 (16.9%) |
Disability Class: Ambulatory Difficulty
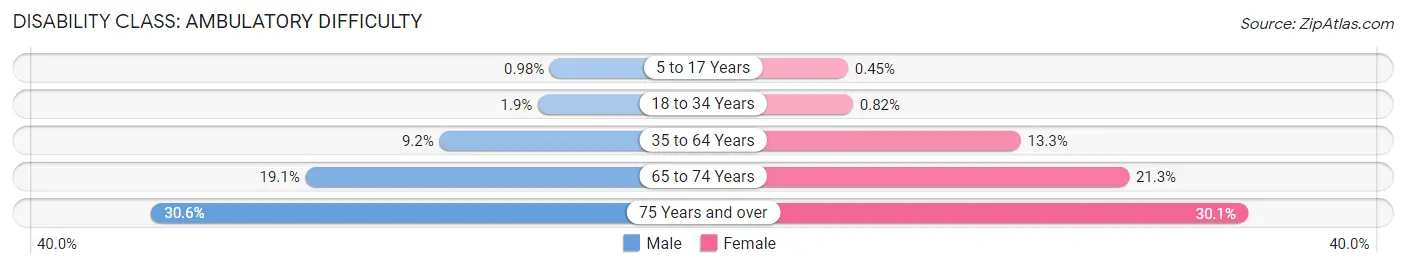
| Age Bracket | Male | Female |
| 5 to 17 Years | 57 (1.0%) | 26 (0.4%) |
| 18 to 34 Years | 155 (1.9%) | 67 (0.8%) |
| 35 to 64 Years | 1,196 (9.2%) | 1,690 (13.3%) |
| 65 to 74 Years | 592 (19.1%) | 771 (21.3%) |
| 75 Years and over | 524 (30.6%) | 874 (30.1%) |
Disability Class: Self-Care Difficulty
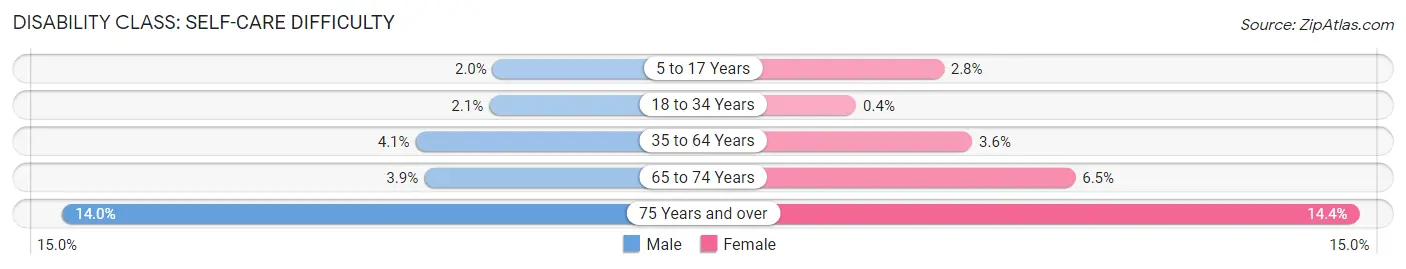
| Age Bracket | Male | Female |
| 5 to 17 Years | 114 (2.0%) | 165 (2.8%) |
| 18 to 34 Years | 172 (2.1%) | 33 (0.4%) |
| 35 to 64 Years | 536 (4.1%) | 462 (3.6%) |
| 65 to 74 Years | 120 (3.9%) | 235 (6.5%) |
| 75 Years and over | 239 (14.0%) | 418 (14.4%) |
Technology Access in St Joseph
Computing Device Access in St Joseph
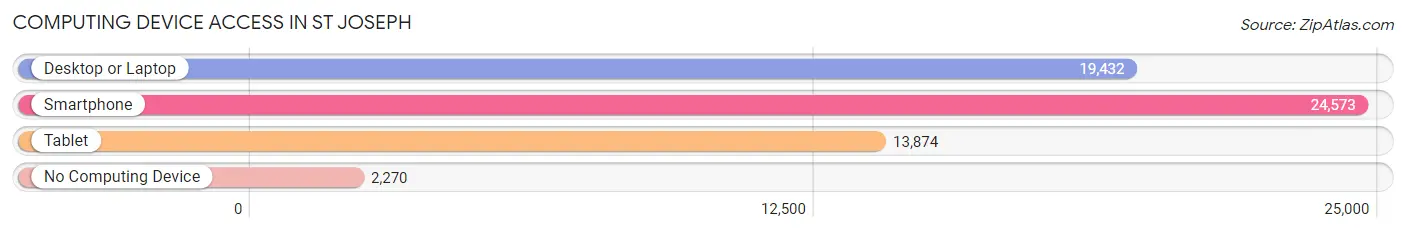
| Device Type | # Households | % Households |
| Desktop or Laptop | 19,432 | 67.9% |
| Smartphone | 24,573 | 85.8% |
| Tablet | 13,874 | 48.4% |
| No Computing Device | 2,270 | 7.9% |
| Total | 28,633 | 100.0% |
Internet Access in St Joseph
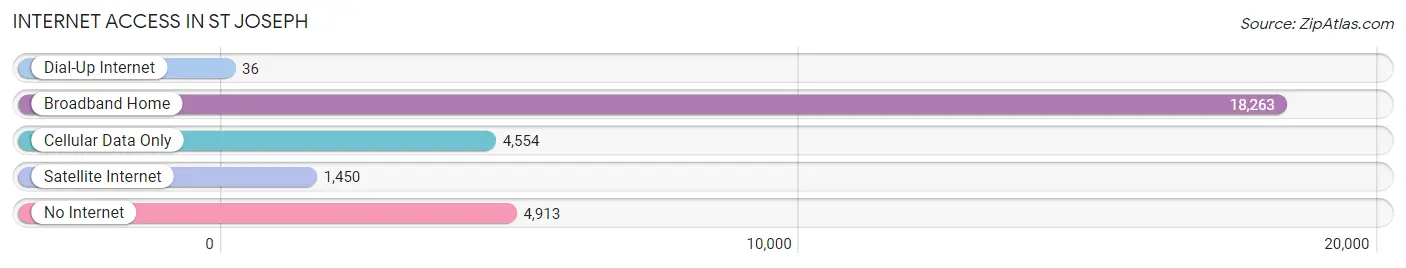
| Internet Type | # Households | % Households |
| Dial-Up Internet | 36 | 0.1% |
| Broadband Home | 18,263 | 63.8% |
| Cellular Data Only | 4,554 | 15.9% |
| Satellite Internet | 1,450 | 5.1% |
| No Internet | 4,913 | 17.2% |
| Total | 28,633 | 100.0% |
St Joseph Summary
St. Joseph, Missouri is a city located in the northwestern corner of the state, in Buchanan County. It is the county seat and the largest city in the county. The city is situated on the Missouri River, and is the principal city of the St. Joseph Metropolitan Statistical Area, which includes Buchanan, Andrew, and DeKalb counties. The population of St. Joseph was 76,780 as of the 2010 census, making it the eighth-largest city in the state.
History
St. Joseph was founded in 1843 by Joseph Robidoux, a French-Canadian fur trader. The city was named after him, and was incorporated in 1845. The city quickly grew, and by the time of the Civil War, it was the second-largest city in Missouri. During the war, St. Joseph was a major supply center for the Union Army, and was the starting point for the Pony Express.
After the war, St. Joseph continued to grow, and by the late 19th century, it was a major transportation hub, with the Missouri Pacific Railroad, the Chicago, Rock Island and Pacific Railroad, and the St. Joseph and Grand Island Railroad all running through the city. The city also became a major center for the meatpacking industry, with several large packing plants located in the city.
Geography
St. Joseph is located in northwestern Missouri, in Buchanan County. It is situated on the Missouri River, and is about 45 miles north of Kansas City. The city has a total area of 28.2 square miles, of which 27.9 square miles is land and 0.3 square miles is water.
Climate
St. Joseph has a humid continental climate, with hot, humid summers and cold, dry winters. The average annual temperature is 54.2°F, and the average annual precipitation is 37.3 inches.
Economy
St. Joseph is a major economic center in the region. The city is home to several large companies, including Mosaic Life Care, a major health care provider, and Triumph Foods, a major pork processor. The city is also home to several manufacturing companies, including Altec Industries, a manufacturer of aerial devices, and St. Joseph Lead, a lead smelting plant.
Demographics
As of the 2010 census, the population of St. Joseph was 76,780. The racial makeup of the city was 79.2% White, 13.3% African American, 0.7% Native American, 1.2% Asian, 0.1% Pacific Islander, 2.7% from other races, and 2.9% from two or more races. Hispanic or Latino of any race were 6.3% of the population.
The median income for a household in St. Joseph was $37,945, and the median income for a family was $45,945. The per capita income for the city was $20,945. About 15.2% of the population was below the poverty line.
Common Questions
What is Per Capita Income in St Joseph?
Per Capita income in St Joseph is $30,667.
What is the Median Family Income in St Joseph?
Median Family Income in St Joseph is $68,146.
What is the Median Household income in St Joseph?
Median Household Income in St Joseph is $54,515.
What is Income or Wage Gap in St Joseph?
Income or Wage Gap in St Joseph is 24.6%.
Women in St Joseph earn 75.4 cents for every dollar earned by a man.
What is Family Income Deficit in St Joseph?
Family Income Deficit in St Joseph is $11,840.
Families that are below poverty line in St Joseph earn $11,840 less on average than the poverty threshold level.
What is Inequality or Gini Index in St Joseph?
Inequality or Gini Index in St Joseph is 0.48.
What is the Total Population of St Joseph?
Total Population of St Joseph is 72,198.
What is the Total Male Population of St Joseph?
Total Male Population of St Joseph is 36,378.
What is the Total Female Population of St Joseph?
Total Female Population of St Joseph is 35,820.
What is the Ratio of Males per 100 Females in St Joseph?
There are 101.56 Males per 100 Females in St Joseph.
What is the Ratio of Females per 100 Males in St Joseph?
There are 98.47 Females per 100 Males in St Joseph.
What is the Median Population Age in St Joseph?
Median Population Age in St Joseph is 37.9 Years.
What is the Average Family Size in St Joseph
Average Family Size in St Joseph is 3.1 People.
What is the Average Household Size in St Joseph
Average Household Size in St Joseph is 2.4 People.
How Large is the Labor Force in St Joseph?
There are 34,612 People in the Labor Forcein in St Joseph.
What is the Percentage of People in the Labor Force in St Joseph?
59.6% of People are in the Labor Force in St Joseph.
What is the Unemployment Rate in St Joseph?
Unemployment Rate in St Joseph is 5.1%.