Pine Lawn, MO Map & Demographics
Pine Lawn Map
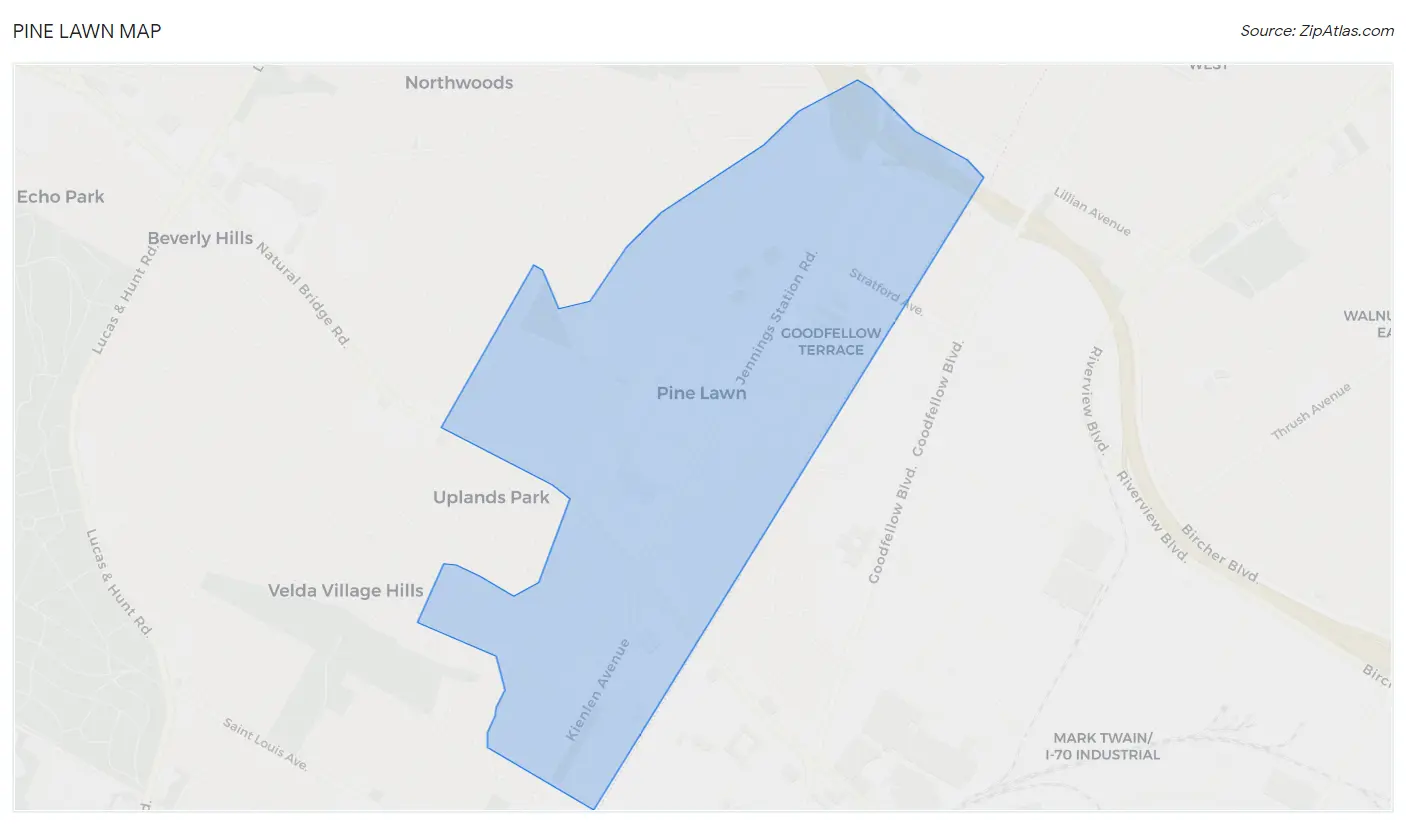
Pine Lawn Overview
$11,805
PER CAPITA INCOME
$26,572
AVG FAMILY INCOME
$25,164
AVG HOUSEHOLD INCOME
17.8%
WAGE / INCOME GAP [ % ]
82.2¢/ $1
WAGE / INCOME GAP [ $ ]
0.42
INEQUALITY / GINI INDEX
2,772
TOTAL POPULATION
1,249
MALE POPULATION
1,523
FEMALE POPULATION
82.01
MALES / 100 FEMALES
121.94
FEMALES / 100 MALES
25.9
MEDIAN AGE
3.7
AVG FAMILY SIZE
2.6
AVG HOUSEHOLD SIZE
973
LABOR FORCE [ PEOPLE ]
60.3%
PERCENT IN LABOR FORCE
16.2%
UNEMPLOYMENT RATE
Income in Pine Lawn
Income Overview in Pine Lawn
Per Capita Income in Pine Lawn is $11,805, while median incomes of families and households are $26,572 and $25,164 respectively.
| Characteristic | Number | Measure |
| Per Capita Income | 2,772 | $11,805 |
| Median Family Income | 591 | $26,572 |
| Mean Family Income | 591 | $38,275 |
| Median Household Income | 1,056 | $25,164 |
| Mean Household Income | 1,056 | $29,932 |
| Income Deficit | 591 | $0 |
| Wage / Income Gap (%) | 2,772 | 17.83% |
| Wage / Income Gap ($) | 2,772 | 82.17¢ per $1 |
| Gini / Inequality Index | 2,772 | 0.42 |
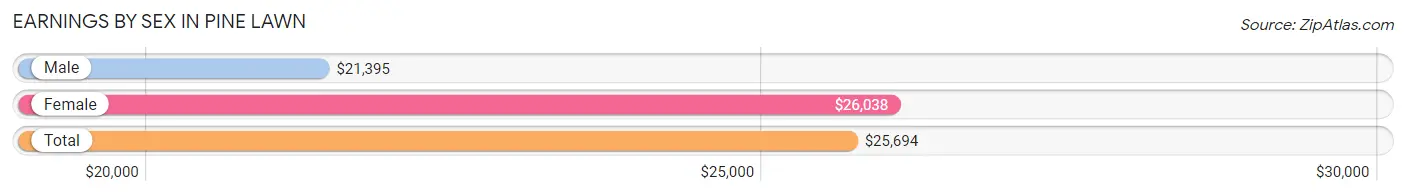
Earnings by Sex in Pine Lawn
Average Earnings in Pine Lawn are $25,694, $21,395 for men and $26,038 for women, a difference of 17.8%.
| Sex | Number | Average Earnings |
| Male | 260 (30.7%) | $21,395 |
| Female | 586 (69.3%) | $26,038 |
| Total | 846 (100.0%) | $25,694 |
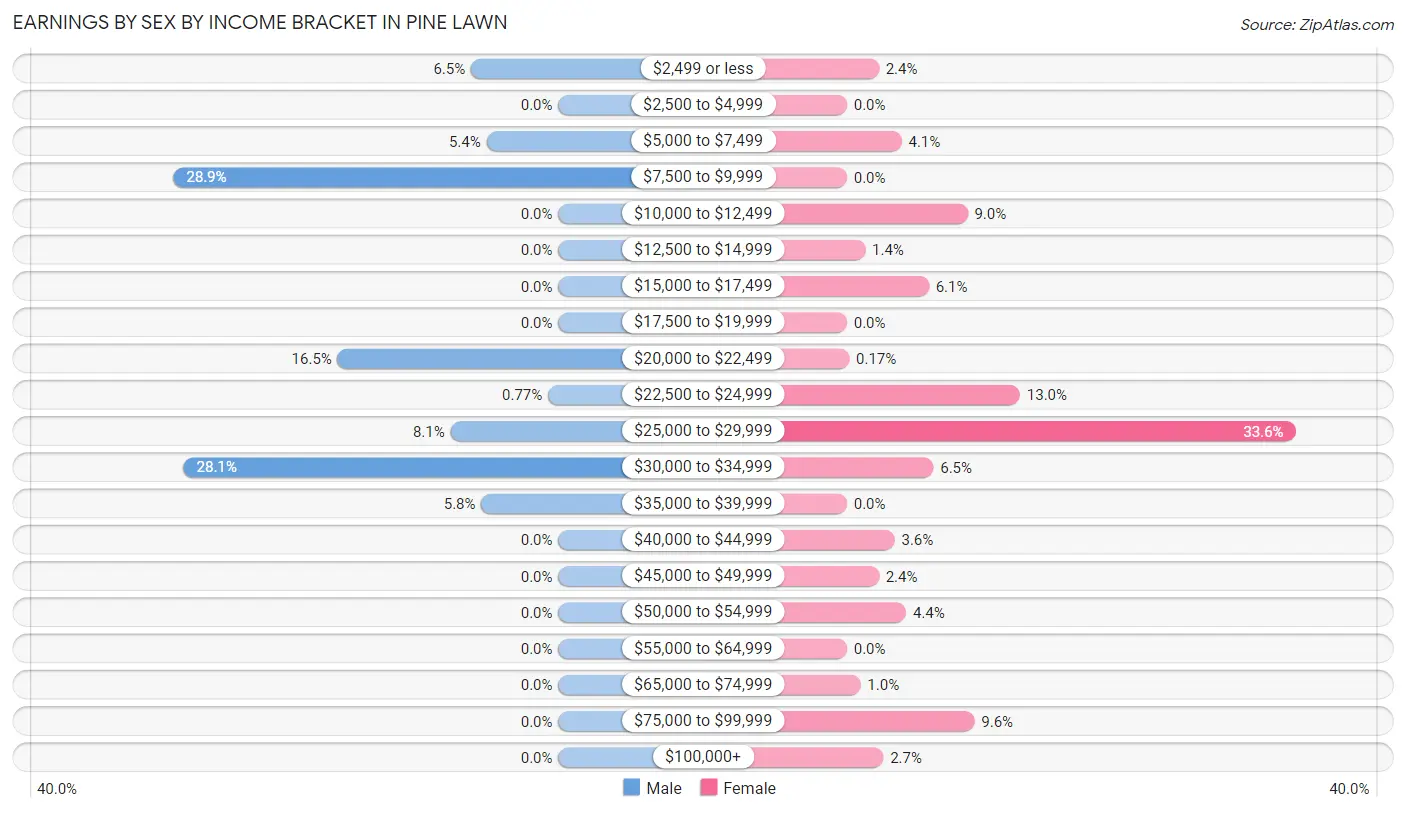
Earnings by Sex by Income Bracket in Pine Lawn
The most common earnings brackets in Pine Lawn are $7,500 to $9,999 for men (75 | 28.8%) and $25,000 to $29,999 for women (197 | 33.6%).
| Income | Male | Female |
| $2,499 or less | 17 (6.5%) | 14 (2.4%) |
| $2,500 to $4,999 | 0 (0.0%) | 0 (0.0%) |
| $5,000 to $7,499 | 14 (5.4%) | 24 (4.1%) |
| $7,500 to $9,999 | 75 (28.8%) | 0 (0.0%) |
| $10,000 to $12,499 | 0 (0.0%) | 53 (9.0%) |
| $12,500 to $14,999 | 0 (0.0%) | 8 (1.4%) |
| $15,000 to $17,499 | 0 (0.0%) | 36 (6.1%) |
| $17,500 to $19,999 | 0 (0.0%) | 0 (0.0%) |
| $20,000 to $22,499 | 43 (16.5%) | 1 (0.2%) |
| $22,500 to $24,999 | 2 (0.8%) | 76 (13.0%) |
| $25,000 to $29,999 | 21 (8.1%) | 197 (33.6%) |
| $30,000 to $34,999 | 73 (28.1%) | 38 (6.5%) |
| $35,000 to $39,999 | 15 (5.8%) | 0 (0.0%) |
| $40,000 to $44,999 | 0 (0.0%) | 21 (3.6%) |
| $45,000 to $49,999 | 0 (0.0%) | 14 (2.4%) |
| $50,000 to $54,999 | 0 (0.0%) | 26 (4.4%) |
| $55,000 to $64,999 | 0 (0.0%) | 0 (0.0%) |
| $65,000 to $74,999 | 0 (0.0%) | 6 (1.0%) |
| $75,000 to $99,999 | 0 (0.0%) | 56 (9.6%) |
| $100,000+ | 0 (0.0%) | 16 (2.7%) |
| Total | 260 (100.0%) | 586 (100.0%) |
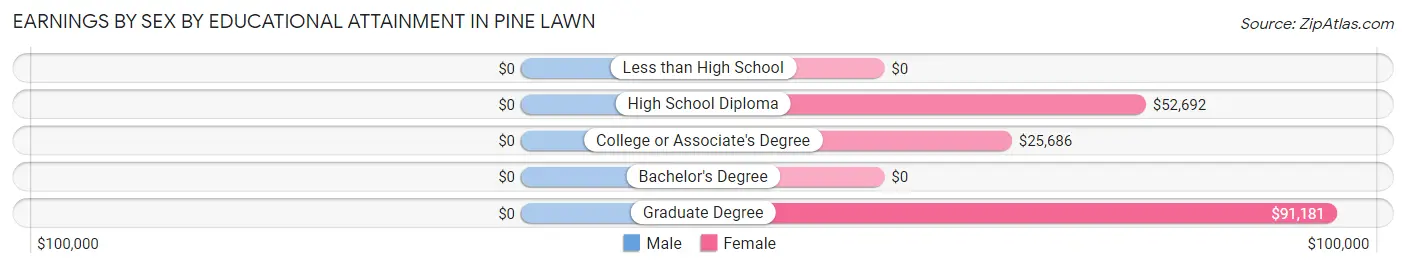
Earnings by Sex by Educational Attainment in Pine Lawn
| Educational Attainment | Male Income | Female Income |
| Less than High School | - | - |
| High School Diploma | - | - |
| College or Associate's Degree | - | - |
| Bachelor's Degree | - | - |
| Graduate Degree | - | - |
| Total | - | - |
Family Income in Pine Lawn
Family Income Brackets in Pine Lawn
According to the Pine Lawn family income data, there are 233 families falling into the $25,000 to $34,999 income range, which is the most common income bracket and makes up 39.4% of all families.
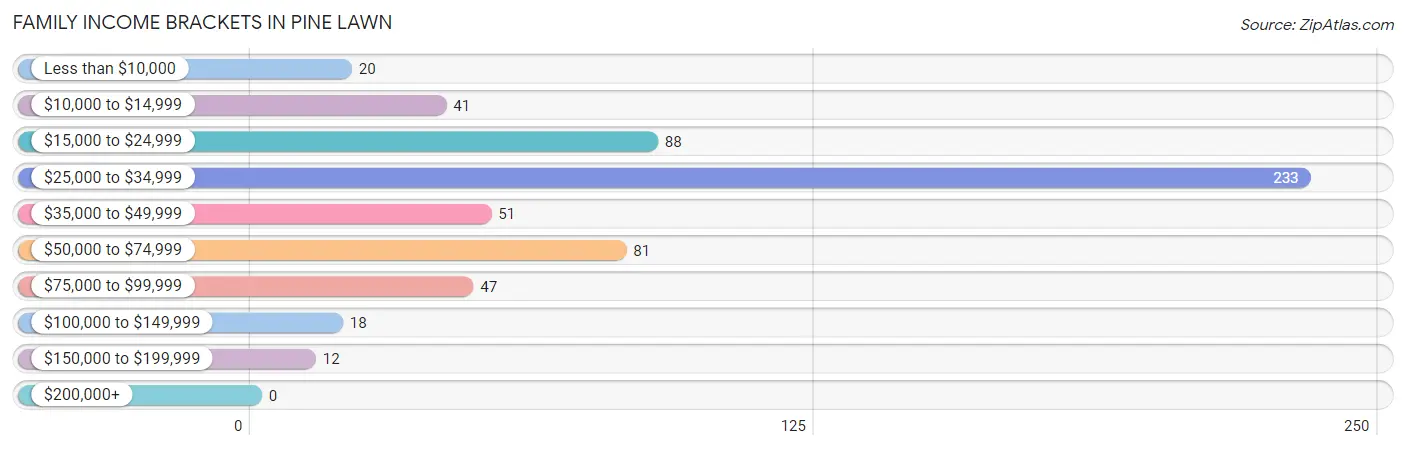
| Income Bracket | # Families | % Families |
| Less than $10,000 | 20 | 3.4% |
| $10,000 to $14,999 | 41 | 6.9% |
| $15,000 to $24,999 | 88 | 14.9% |
| $25,000 to $34,999 | 233 | 39.4% |
| $35,000 to $49,999 | 51 | 8.6% |
| $50,000 to $74,999 | 81 | 13.7% |
| $75,000 to $99,999 | 47 | 8.0% |
| $100,000 to $149,999 | 18 | 3.0% |
| $150,000 to $199,999 | 12 | 2.0% |
| $200,000+ | 0 | 0.0% |
Family Income by Famaliy Size in Pine Lawn
2-person families (173 | 29.3%) account for the highest median family income in Pine Lawn with $61,587 per family, while 2-person families (173 | 29.3%) have the highest median income of $30,794 per family member.
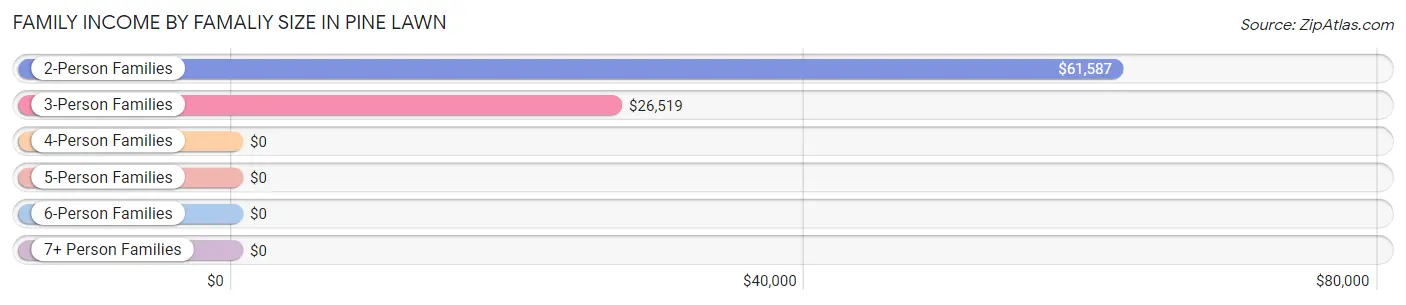
| Income Bracket | # Families | Median Income |
| 2-Person Families | 173 (29.3%) | $61,587 |
| 3-Person Families | 294 (49.7%) | $26,519 |
| 4-Person Families | 24 (4.1%) | $0 |
| 5-Person Families | 43 (7.3%) | $0 |
| 6-Person Families | 12 (2.0%) | $0 |
| 7+ Person Families | 45 (7.6%) | $0 |
| Total | 591 (100.0%) | $26,572 |
Family Income by Number of Earners in Pine Lawn
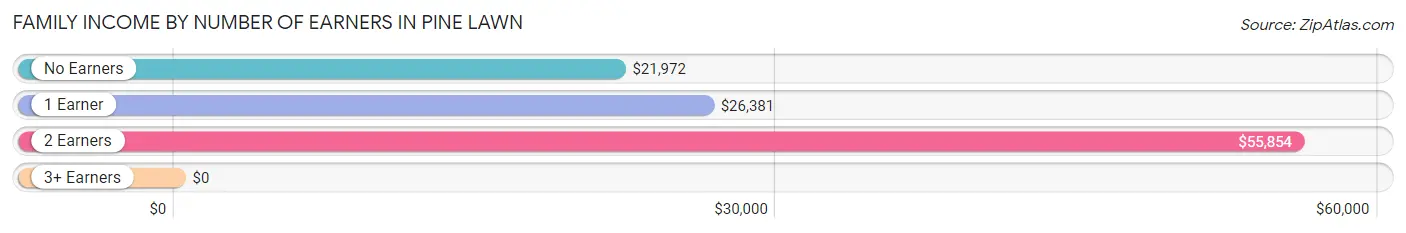
| Number of Earners | # Families | Median Income |
| No Earners | 111 (18.8%) | $21,972 |
| 1 Earner | 392 (66.3%) | $26,381 |
| 2 Earners | 76 (12.9%) | $55,854 |
| 3+ Earners | 12 (2.0%) | $0 |
| Total | 591 (100.0%) | $26,572 |
Household Income in Pine Lawn
Household Income Brackets in Pine Lawn
With 267 households falling in the category, the $25,000 to $34,999 income range is the most frequent in Pine Lawn, accounting for 25.3% of all households.
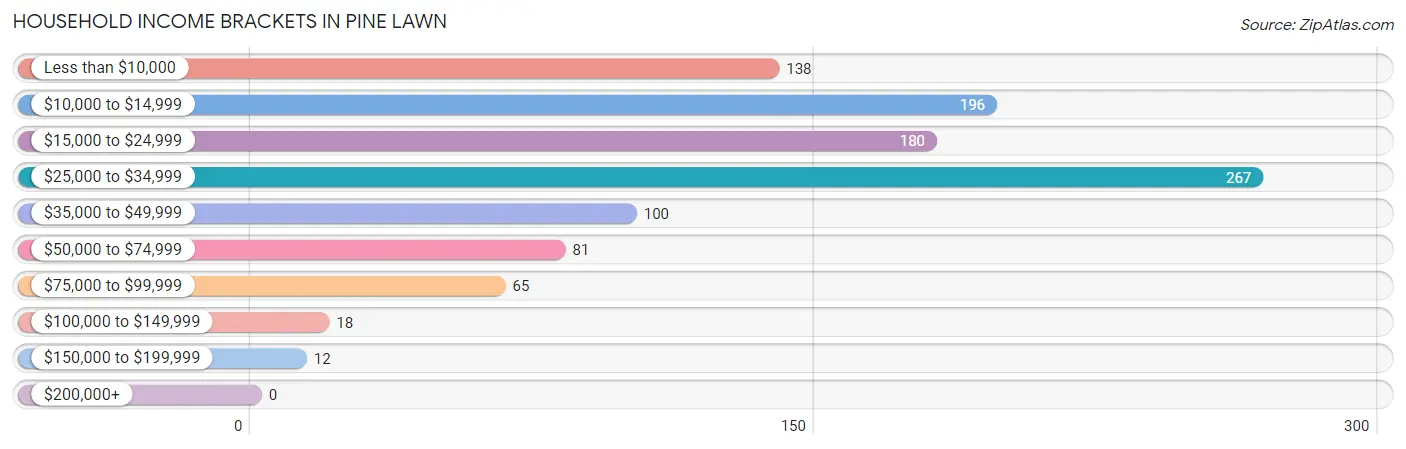
| Income Bracket | # Households | % Households |
| Less than $10,000 | 138 | 13.1% |
| $10,000 to $14,999 | 196 | 18.6% |
| $15,000 to $24,999 | 180 | 17.0% |
| $25,000 to $34,999 | 267 | 25.3% |
| $35,000 to $49,999 | 100 | 9.5% |
| $50,000 to $74,999 | 81 | 7.7% |
| $75,000 to $99,999 | 65 | 6.2% |
| $100,000 to $149,999 | 18 | 1.7% |
| $150,000 to $199,999 | 12 | 1.1% |
| $200,000+ | 0 | 0.0% |
Household Income by Householder Age in Pine Lawn
The median household income in Pine Lawn is $25,164, with the highest median household income of $26,122 found in the 25 to 44 years age bracket for the primary householder. A total of 365 households (34.6%) fall into this category. Meanwhile, the 15 to 24 years age bracket for the primary householder has the lowest median household income of $0, with 42 households (4.0%) in this group.
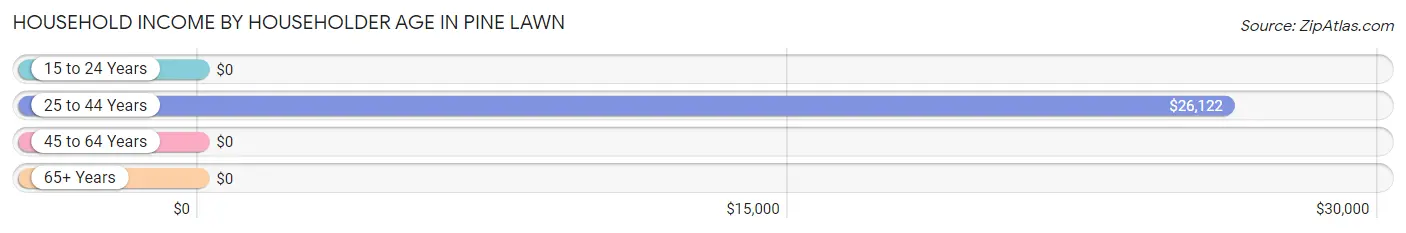
| Income Bracket | # Households | Median Income |
| 15 to 24 Years | 42 (4.0%) | $0 |
| 25 to 44 Years | 365 (34.6%) | $26,122 |
| 45 to 64 Years | 465 (44.0%) | $0 |
| 65+ Years | 184 (17.4%) | $0 |
| Total | 1,056 (100.0%) | $25,164 |
Poverty in Pine Lawn
Income Below Poverty by Sex and Age in Pine Lawn
With 50.9% poverty level for males and 31.1% for females among the residents of Pine Lawn, under 5 year old males and 6 to 11 year old females are the most vulnerable to poverty, with 65 males (100.0%) and 34 females (100.0%) in their respective age groups living below the poverty level.
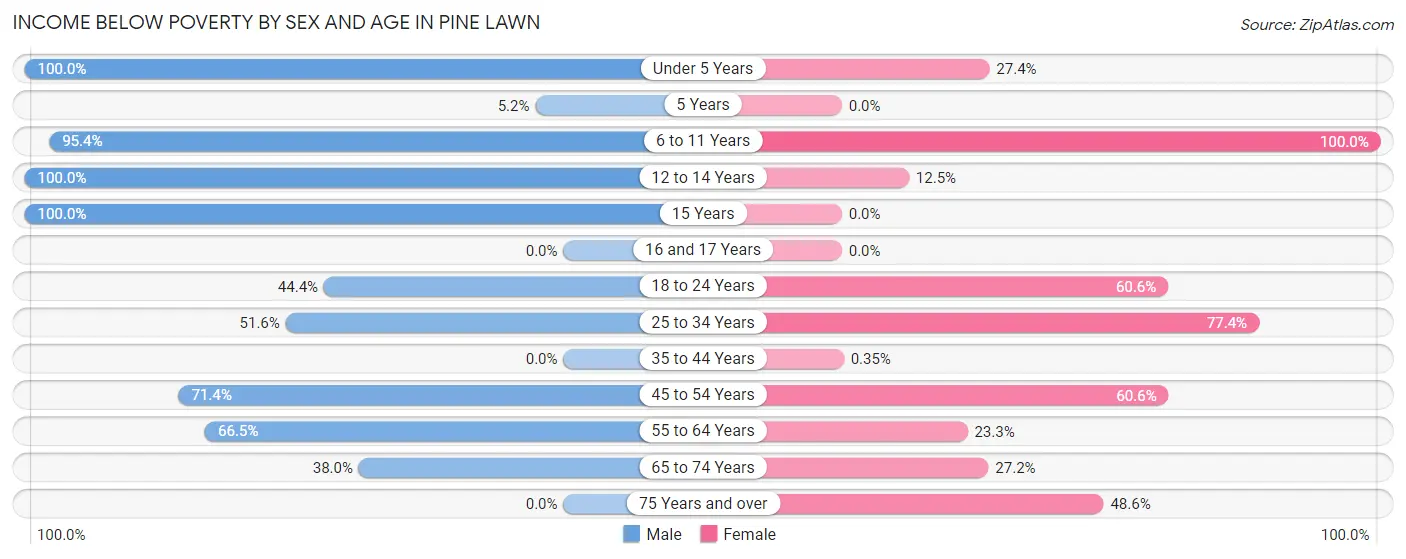
| Age Bracket | Male | Female |
| Under 5 Years | 65 (100.0%) | 40 (27.4%) |
| 5 Years | 18 (5.2%) | 0 (0.0%) |
| 6 to 11 Years | 146 (95.4%) | 34 (100.0%) |
| 12 to 14 Years | 35 (100.0%) | 38 (12.5%) |
| 15 Years | 38 (100.0%) | 0 (0.0%) |
| 16 and 17 Years | 0 (0.0%) | 0 (0.0%) |
| 18 to 24 Years | 56 (44.4%) | 43 (60.6%) |
| 25 to 34 Years | 50 (51.5%) | 120 (77.4%) |
| 35 to 44 Years | 0 (0.0%) | 1 (0.4%) |
| 45 to 54 Years | 75 (71.4%) | 77 (60.6%) |
| 55 to 64 Years | 123 (66.5%) | 35 (23.3%) |
| 65 to 74 Years | 30 (38.0%) | 40 (27.2%) |
| 75 Years and over | 0 (0.0%) | 34 (48.6%) |
| Total | 636 (50.9%) | 462 (31.1%) |
Income Above Poverty by Sex and Age in Pine Lawn
According to the poverty statistics in Pine Lawn, males aged 35 to 44 years and females aged 35 to 44 years are the age groups that are most secure financially, with 100.0% of males and 99.7% of females in these age groups living above the poverty line.
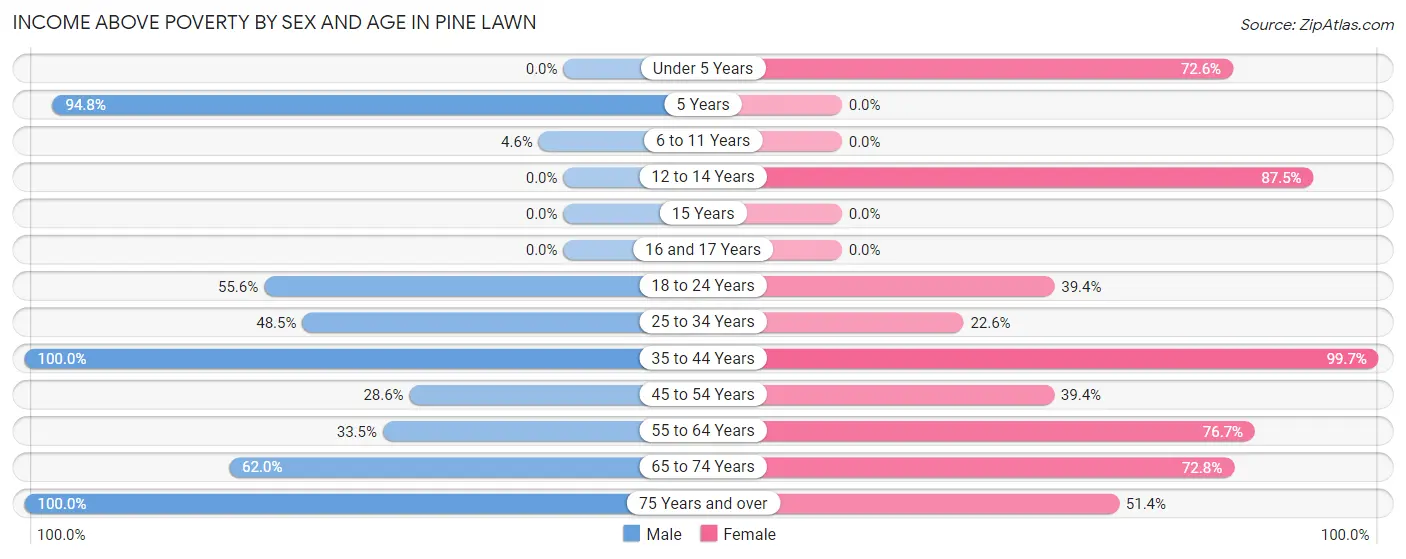
| Age Bracket | Male | Female |
| Under 5 Years | 0 (0.0%) | 106 (72.6%) |
| 5 Years | 328 (94.8%) | 0 (0.0%) |
| 6 to 11 Years | 7 (4.6%) | 0 (0.0%) |
| 12 to 14 Years | 0 (0.0%) | 267 (87.5%) |
| 15 Years | 0 (0.0%) | 0 (0.0%) |
| 16 and 17 Years | 0 (0.0%) | 0 (0.0%) |
| 18 to 24 Years | 70 (55.6%) | 28 (39.4%) |
| 25 to 34 Years | 47 (48.4%) | 35 (22.6%) |
| 35 to 44 Years | 19 (100.0%) | 281 (99.7%) |
| 45 to 54 Years | 30 (28.6%) | 50 (39.4%) |
| 55 to 64 Years | 62 (33.5%) | 115 (76.7%) |
| 65 to 74 Years | 49 (62.0%) | 107 (72.8%) |
| 75 Years and over | 1 (100.0%) | 36 (51.4%) |
| Total | 613 (49.1%) | 1,025 (68.9%) |
Income Below Poverty Among Married-Couple Families in Pine Lawn
The poverty statistics for married-couple families in Pine Lawn show that 39.1% or 45 of the total 115 families live below the poverty line. Families with 3 or 4 children have the highest poverty rate of 100.0%, comprising of 45 families. On the other hand, families with no children have the lowest poverty rate of 0.0%, which includes 0 families.
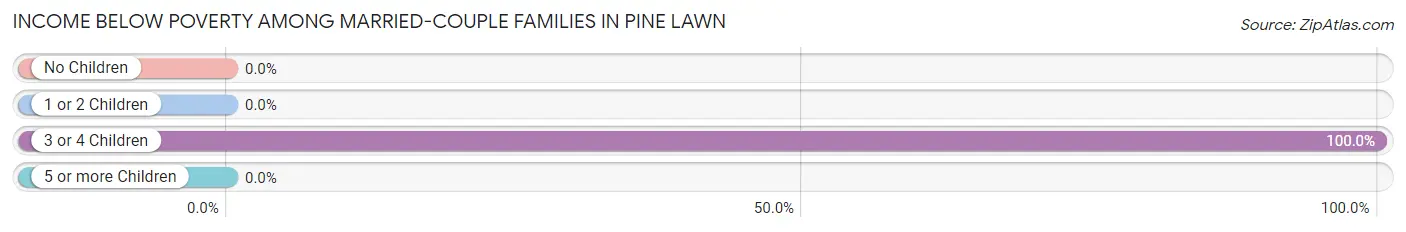
| Children | Above Poverty | Below Poverty |
| No Children | 70 (100.0%) | 0 (0.0%) |
| 1 or 2 Children | 0 (0.0%) | 0 (0.0%) |
| 3 or 4 Children | 0 (0.0%) | 45 (100.0%) |
| 5 or more Children | 0 (0.0%) | 0 (0.0%) |
| Total | 70 (60.9%) | 45 (39.1%) |
Income Below Poverty Among Single-Parent Households in Pine Lawn
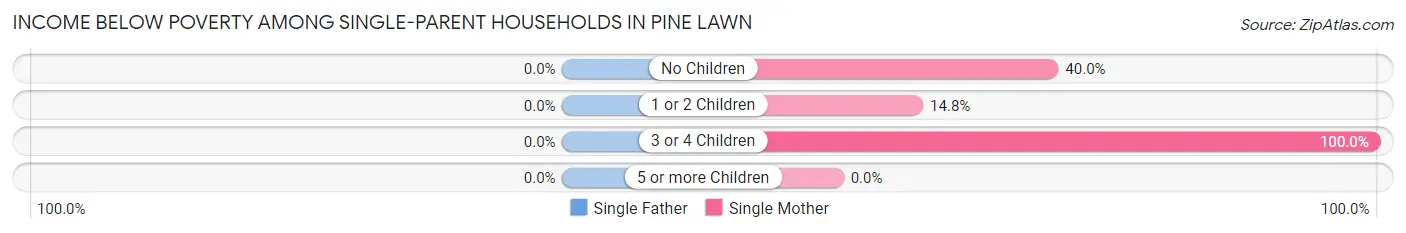
| Children | Single Father | Single Mother |
| No Children | 0 (0.0%) | 34 (40.0%) |
| 1 or 2 Children | 0 (0.0%) | 44 (14.8%) |
| 3 or 4 Children | 0 (0.0%) | 41 (100.0%) |
| 5 or more Children | 0 (0.0%) | 0 (0.0%) |
| Total | 0 (0.0%) | 119 (28.1%) |
Income Below Poverty Among Married-Couple vs Single-Parent Households in Pine Lawn
The poverty data for Pine Lawn shows that 45 of the married-couple family households (39.1%) and 119 of the single-parent households (25.0%) are living below the poverty level. Within the married-couple family households, those with 3 or 4 children have the highest poverty rate, with 45 households (100.0%) falling below the poverty line. Among the single-parent households, those with 3 or 4 children have the highest poverty rate, with 41 household (100.0%) living below poverty.
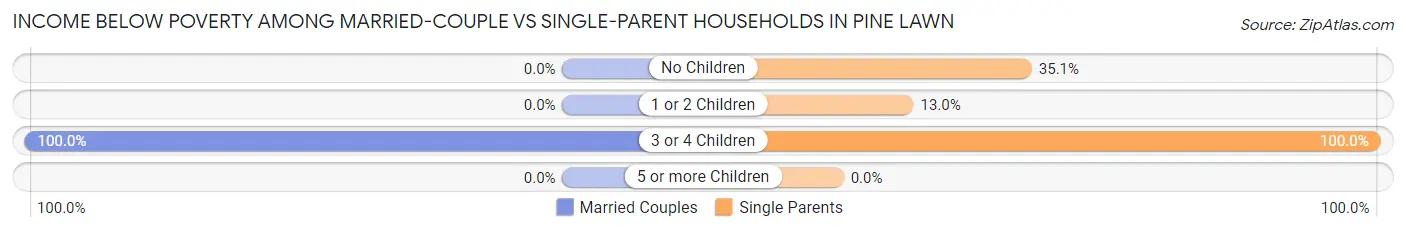
| Children | Married-Couple Families | Single-Parent Households |
| No Children | 0 (0.0%) | 34 (35.0%) |
| 1 or 2 Children | 0 (0.0%) | 44 (13.0%) |
| 3 or 4 Children | 45 (100.0%) | 41 (100.0%) |
| 5 or more Children | 0 (0.0%) | 0 (0.0%) |
| Total | 45 (39.1%) | 119 (25.0%) |
Race in Pine Lawn
The most populous races in Pine Lawn are Black / African American (2,647 | 95.5%), White / Caucasian (64 | 2.3%), and Two or more Races (61 | 2.2%).
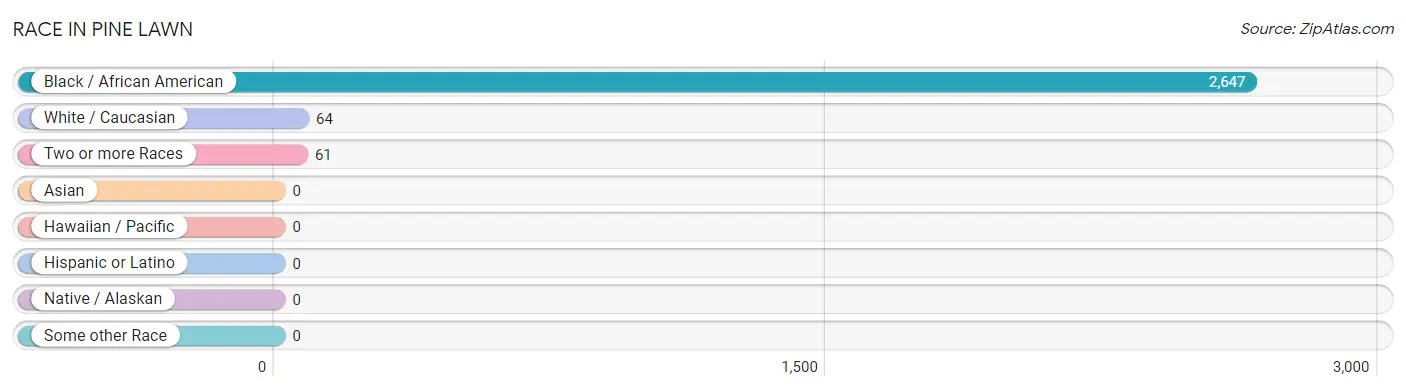
| Race | # Population | % Population |
| Asian | 0 | 0.0% |
| Black / African American | 2,647 | 95.5% |
| Hawaiian / Pacific | 0 | 0.0% |
| Hispanic or Latino | 0 | 0.0% |
| Native / Alaskan | 0 | 0.0% |
| White / Caucasian | 64 | 2.3% |
| Two or more Races | 61 | 2.2% |
| Some other Race | 0 | 0.0% |
| Total | 2,772 | 100.0% |
Ancestry in Pine Lawn
The most populous ancestries reported in Pine Lawn are American (240 | 8.7%), German (38 | 1.4%), Canadian (32 | 1.1%), Italian (20 | 0.7%), and Jamaican (12 | 0.4%), together accounting for 12.3% of all Pine Lawn residents.
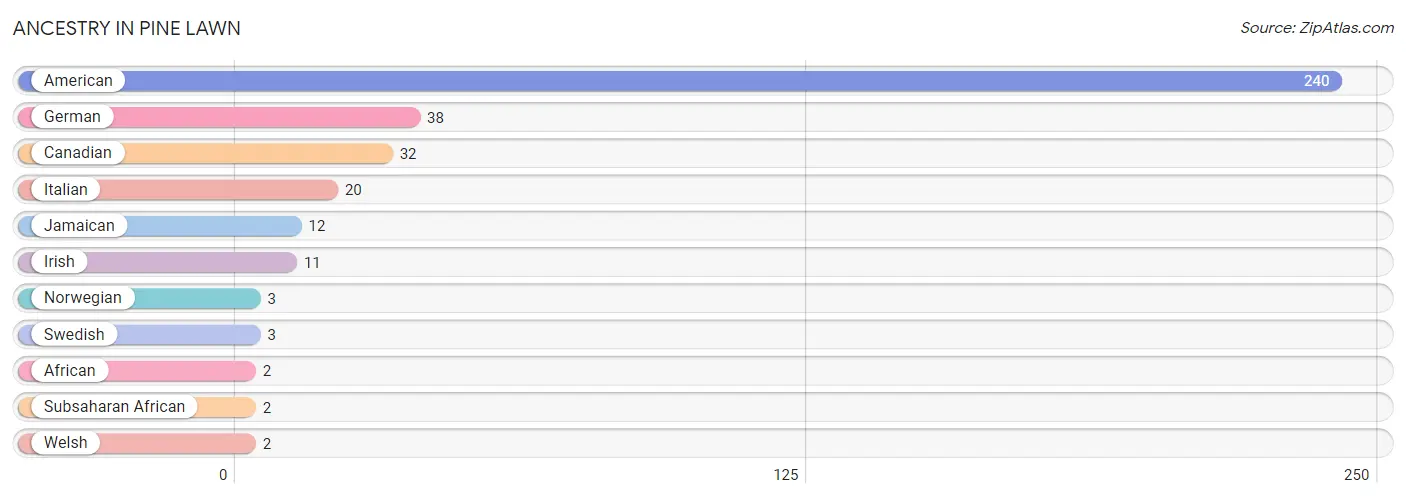
| Ancestry | # Population | % Population |
| African | 2 | 0.1% |
| American | 240 | 8.7% |
| Canadian | 32 | 1.1% |
| German | 38 | 1.4% |
| Irish | 11 | 0.4% |
| Italian | 20 | 0.7% |
| Jamaican | 12 | 0.4% |
| Norwegian | 3 | 0.1% |
| Subsaharan African | 2 | 0.1% |
| Swedish | 3 | 0.1% |
| Welsh | 2 | 0.1% | View All 11 Rows |
Immigrants in Pine Lawn
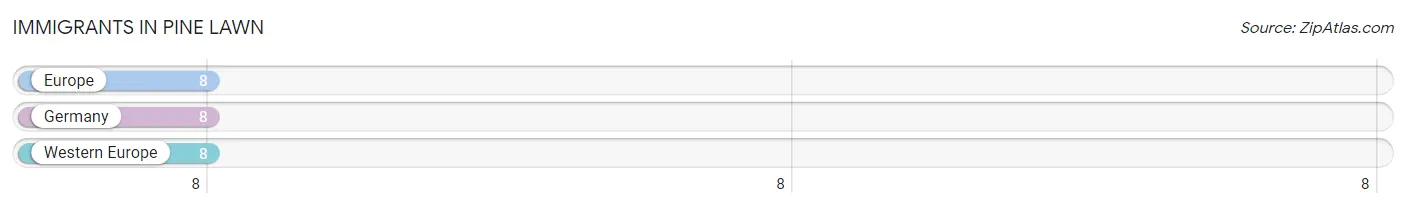
The most numerous immigrant groups reported in Pine Lawn came from Europe (8 | 0.3%), Germany (8 | 0.3%), and Western Europe (8 | 0.3%), together accounting for 0.9% of all Pine Lawn residents.
| Immigration Origin | # Population | % Population |
| Europe | 8 | 0.3% |
| Germany | 8 | 0.3% |
| Western Europe | 8 | 0.3% | View All 3 Rows |
Sex and Age in Pine Lawn
Sex and Age in Pine Lawn
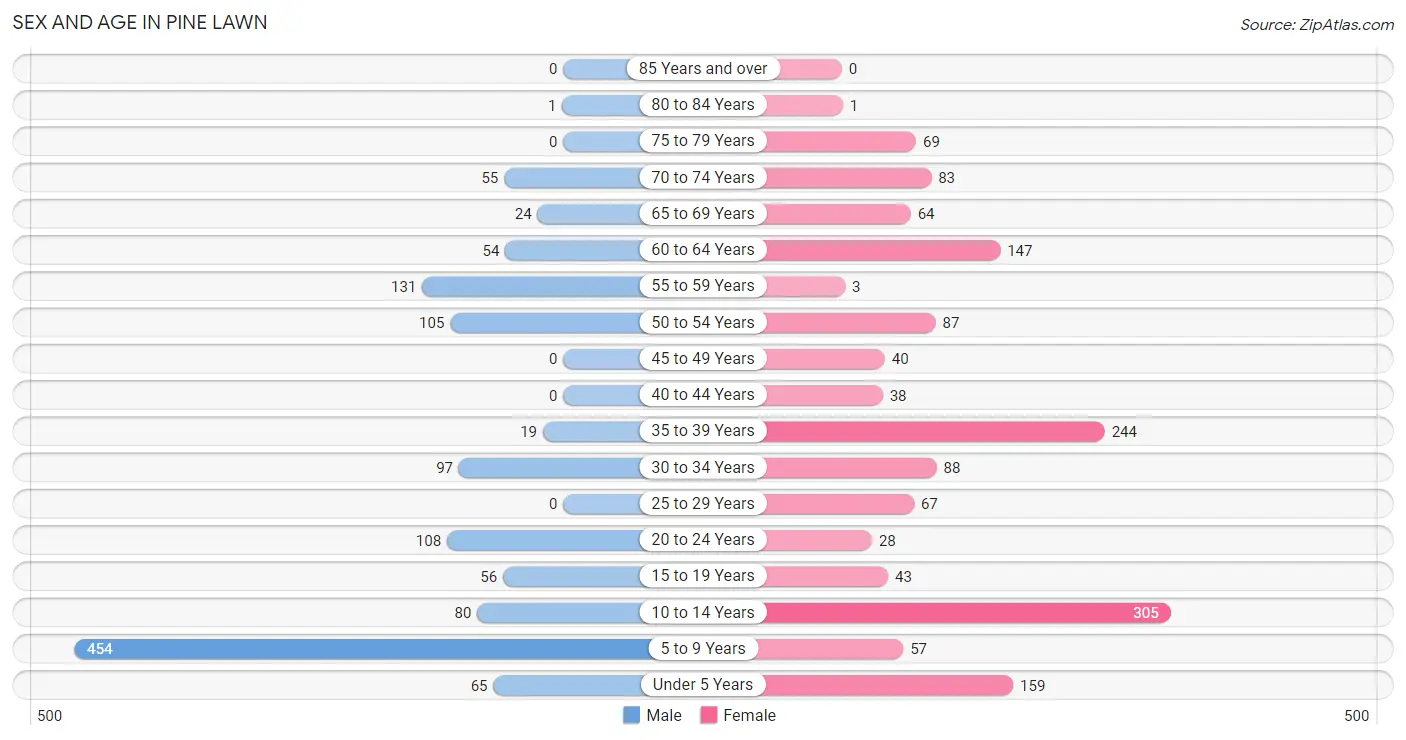
The most populous age groups in Pine Lawn are 5 to 9 Years (454 | 36.3%) for men and 10 to 14 Years (305 | 20.0%) for women.
| Age Bracket | Male | Female |
| Under 5 Years | 65 (5.2%) | 159 (10.4%) |
| 5 to 9 Years | 454 (36.3%) | 57 (3.7%) |
| 10 to 14 Years | 80 (6.4%) | 305 (20.0%) |
| 15 to 19 Years | 56 (4.5%) | 43 (2.8%) |
| 20 to 24 Years | 108 (8.6%) | 28 (1.8%) |
| 25 to 29 Years | 0 (0.0%) | 67 (4.4%) |
| 30 to 34 Years | 97 (7.8%) | 88 (5.8%) |
| 35 to 39 Years | 19 (1.5%) | 244 (16.0%) |
| 40 to 44 Years | 0 (0.0%) | 38 (2.5%) |
| 45 to 49 Years | 0 (0.0%) | 40 (2.6%) |
| 50 to 54 Years | 105 (8.4%) | 87 (5.7%) |
| 55 to 59 Years | 131 (10.5%) | 3 (0.2%) |
| 60 to 64 Years | 54 (4.3%) | 147 (9.7%) |
| 65 to 69 Years | 24 (1.9%) | 64 (4.2%) |
| 70 to 74 Years | 55 (4.4%) | 83 (5.4%) |
| 75 to 79 Years | 0 (0.0%) | 69 (4.5%) |
| 80 to 84 Years | 1 (0.1%) | 1 (0.1%) |
| 85 Years and over | 0 (0.0%) | 0 (0.0%) |
| Total | 1,249 (100.0%) | 1,523 (100.0%) |
Families and Households in Pine Lawn
Median Family Size in Pine Lawn
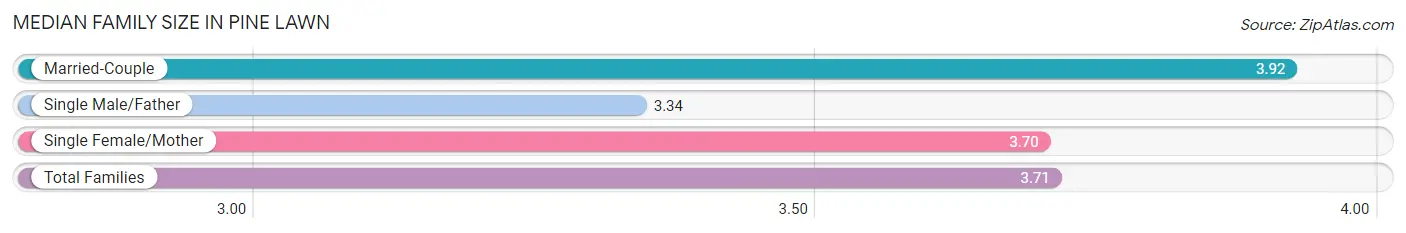
The median family size in Pine Lawn is 3.71 persons per family, with married-couple families (115 | 19.5%) accounting for the largest median family size of 3.92 persons per family. On the other hand, single male/father families (53 | 9.0%) represent the smallest median family size with 3.34 persons per family.
| Family Type | # Families | Family Size |
| Married-Couple | 115 (19.5%) | 3.92 |
| Single Male/Father | 53 (9.0%) | 3.34 |
| Single Female/Mother | 423 (71.6%) | 3.70 |
| Total Families | 591 (100.0%) | 3.71 |
Median Household Size in Pine Lawn
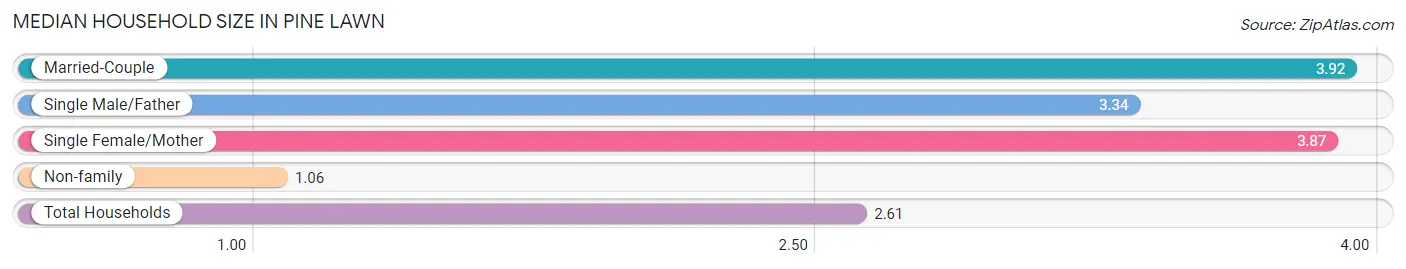
The median household size in Pine Lawn is 2.61 persons per household, with married-couple households (115 | 10.9%) accounting for the largest median household size of 3.92 persons per household. non-family households (465 | 44.0%) represent the smallest median household size with 1.06 persons per household.
| Household Type | # Households | Household Size |
| Married-Couple | 115 (10.9%) | 3.92 |
| Single Male/Father | 53 (5.0%) | 3.34 |
| Single Female/Mother | 423 (40.1%) | 3.87 |
| Non-family | 465 (44.0%) | 1.06 |
| Total Households | 1,056 (100.0%) | 2.61 |
Household Size by Marriage Status in Pine Lawn
Out of a total of 1,056 households in Pine Lawn, 591 (56.0%) are family households, while 465 (44.0%) are nonfamily households. The most numerous type of family households are 3-person households, comprising 274, and the most common type of nonfamily households are 1-person households, comprising 451.
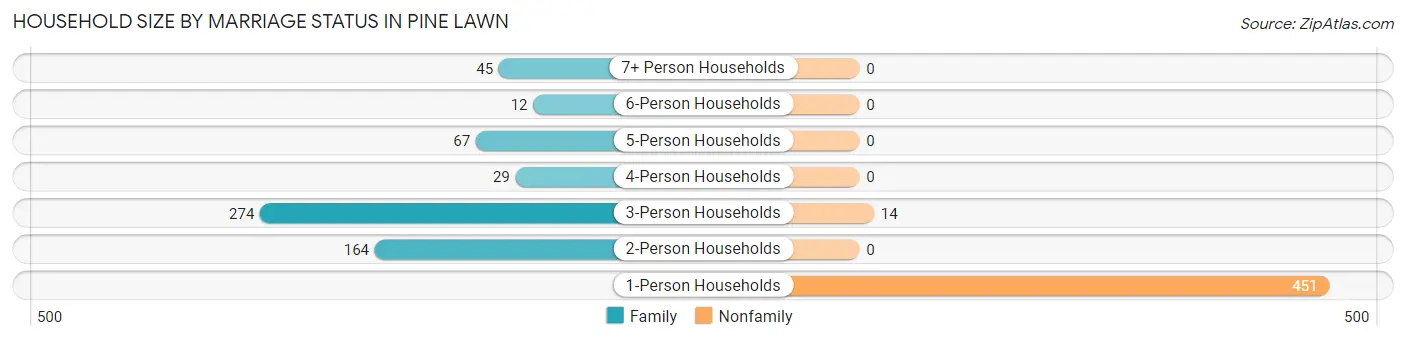
| Household Size | Family Households | Nonfamily Households |
| 1-Person Households | - | 451 (42.7%) |
| 2-Person Households | 164 (15.5%) | 0 (0.0%) |
| 3-Person Households | 274 (26.0%) | 14 (1.3%) |
| 4-Person Households | 29 (2.8%) | 0 (0.0%) |
| 5-Person Households | 67 (6.3%) | 0 (0.0%) |
| 6-Person Households | 12 (1.1%) | 0 (0.0%) |
| 7+ Person Households | 45 (4.3%) | 0 (0.0%) |
| Total | 591 (56.0%) | 465 (44.0%) |
Female Fertility in Pine Lawn
Fertility by Age in Pine Lawn
Average fertility rate in Pine Lawn is 37.0 births per 1,000 women. Women in the age bracket of 20 to 34 years have the highest fertility rate with 109.0 births per 1,000 women. Women in the age bracket of 20 to 34 years acount for 90.9% of all women with births.
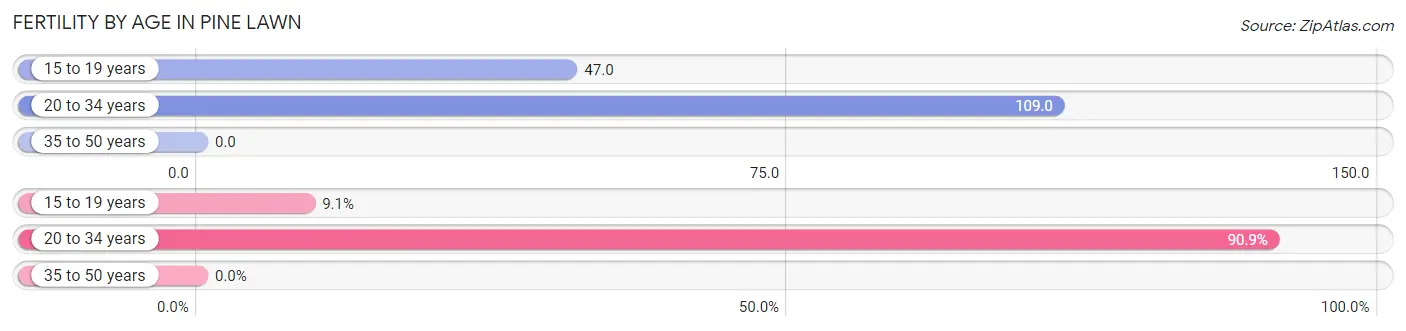
| Age Bracket | Women with Births | Births / 1,000 Women |
| 15 to 19 years | 2 (9.1%) | 47.0 |
| 20 to 34 years | 20 (90.9%) | 109.0 |
| 35 to 50 years | 0 (0.0%) | 0.0 |
| Total | 22 (100.0%) | 37.0 |
Fertility by Age by Marriage Status in Pine Lawn
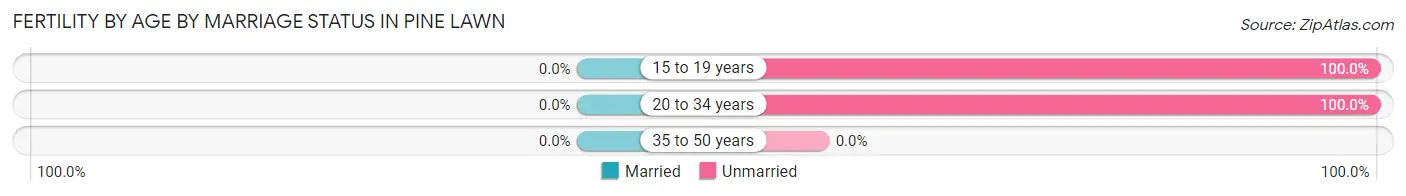
| Age Bracket | Married | Unmarried |
| 15 to 19 years | 0 (0.0%) | 2 (100.0%) |
| 20 to 34 years | 0 (0.0%) | 20 (100.0%) |
| 35 to 50 years | 0 (0.0%) | 0 (0.0%) |
| Total | 0 (0.0%) | 22 (100.0%) |
Fertility by Education in Pine Lawn
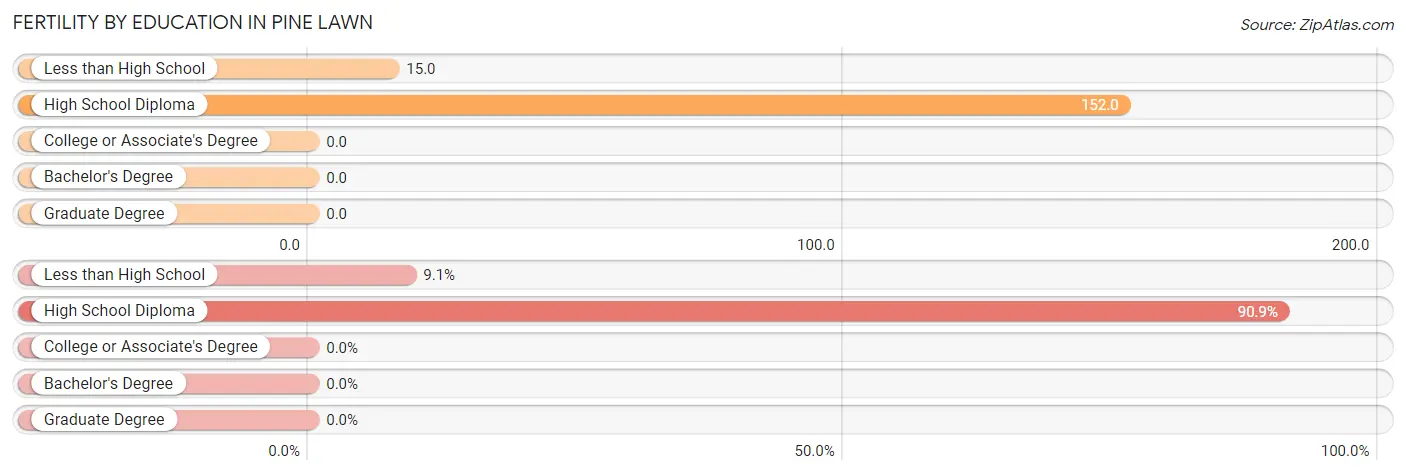
| Educational Attainment | Women with Births | Births / 1,000 Women |
| Less than High School | 2 (9.1%) | 15.0 |
| High School Diploma | 20 (90.9%) | 152.0 |
| College or Associate's Degree | 0 (0.0%) | 0.0 |
| Bachelor's Degree | 0 (0.0%) | 0.0 |
| Graduate Degree | 0 (0.0%) | 0.0 |
| Total | 22 (100.0%) | 37.0 |
Fertility by Education by Marriage Status in Pine Lawn
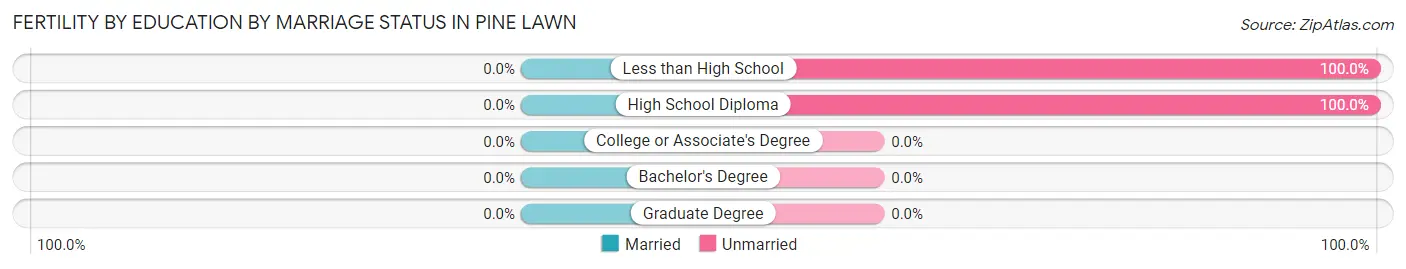
| Educational Attainment | Married | Unmarried |
| Less than High School | 0 (0.0%) | 2 (100.0%) |
| High School Diploma | 0 (0.0%) | 20 (100.0%) |
| College or Associate's Degree | 0 (0.0%) | 0 (0.0%) |
| Bachelor's Degree | 0 (0.0%) | 0 (0.0%) |
| Graduate Degree | 0 (0.0%) | 0 (0.0%) |
| Total | 0 (0.0%) | 22 (100.0%) |
Employment Characteristics in Pine Lawn
Employment by Class of Employer in Pine Lawn
Among the 801 employed individuals in Pine Lawn, private company employees (598 | 74.7%), self-employed (incorporated) (75 | 9.4%), and not-for-profit organizations (66 | 8.2%) make up the most common classes of employment.
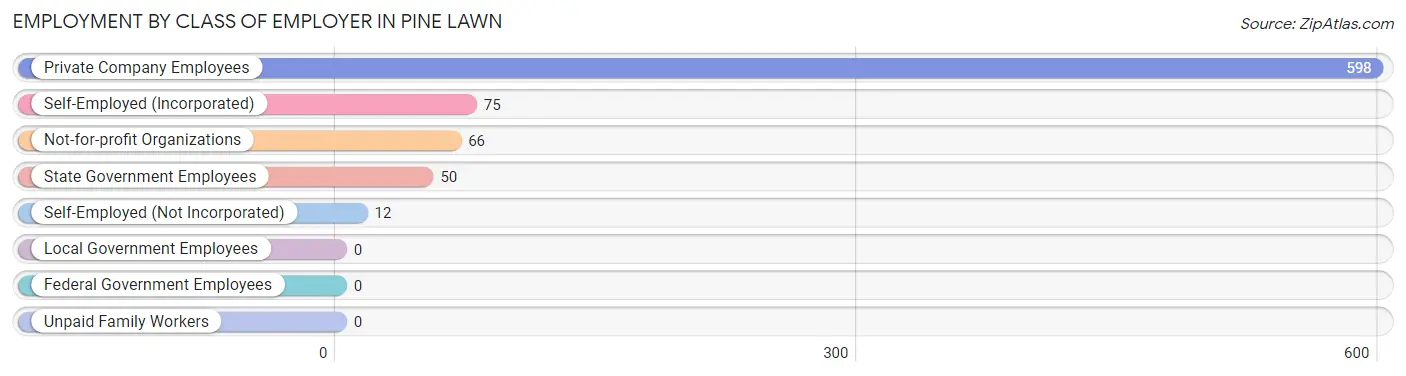
| Employer Class | # Employees | % Employees |
| Private Company Employees | 598 | 74.7% |
| Self-Employed (Incorporated) | 75 | 9.4% |
| Self-Employed (Not Incorporated) | 12 | 1.5% |
| Not-for-profit Organizations | 66 | 8.2% |
| Local Government Employees | 0 | 0.0% |
| State Government Employees | 50 | 6.2% |
| Federal Government Employees | 0 | 0.0% |
| Unpaid Family Workers | 0 | 0.0% |
| Total | 801 | 100.0% |
Employment Status by Age in Pine Lawn
According to the labor force statistics for Pine Lawn, out of the total population over 16 years of age (1,614), 60.3% or 973 individuals are in the labor force, with 16.2% or 158 of them unemployed. The age group with the highest labor force participation rate is 35 to 44 years, with 99.7% or 300 individuals in the labor force. Within the labor force, the 16 to 19 years age range has the highest percentage of unemployed individuals, with 69.5% or 41 of them being unemployed.
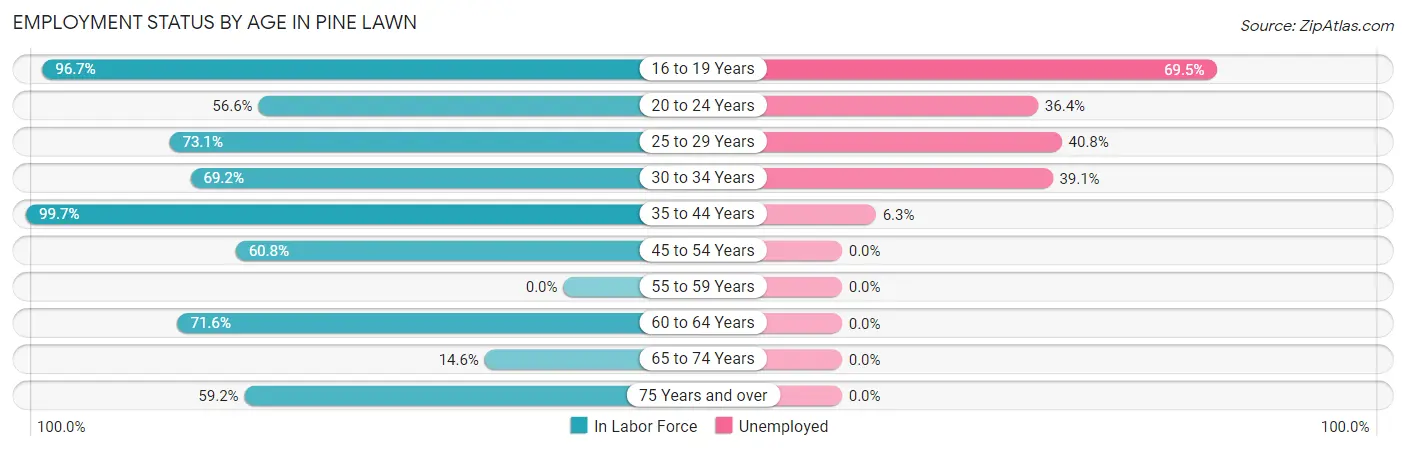
| Age Bracket | In Labor Force | Unemployed |
| 16 to 19 Years | 59 (96.7%) | 41 (69.5%) |
| 20 to 24 Years | 77 (56.6%) | 28 (36.4%) |
| 25 to 29 Years | 49 (73.1%) | 20 (40.8%) |
| 30 to 34 Years | 128 (69.2%) | 50 (39.1%) |
| 35 to 44 Years | 300 (99.7%) | 19 (6.3%) |
| 45 to 54 Years | 141 (60.8%) | 0 (0.0%) |
| 55 to 59 Years | 0 (0.0%) | 0 (0.0%) |
| 60 to 64 Years | 144 (71.6%) | 0 (0.0%) |
| 65 to 74 Years | 33 (14.6%) | 0 (0.0%) |
| 75 Years and over | 42 (59.2%) | 0 (0.0%) |
| Total | 973 (60.3%) | 158 (16.2%) |
Employment Status by Educational Attainment in Pine Lawn
According to labor force statistics for Pine Lawn, 68.0% of individuals (762) out of the total population between 25 and 64 years of age (1,120) are in the labor force, with 11.7% or 89 of them being unemployed. The group with the highest labor force participation rate are those with the educational attainment of bachelor's degree or higher, with 95.7% or 45 individuals in the labor force. Within the labor force, individuals with high school diploma education have the highest percentage of unemployment, with 34.0% or 89 of them being unemployed.
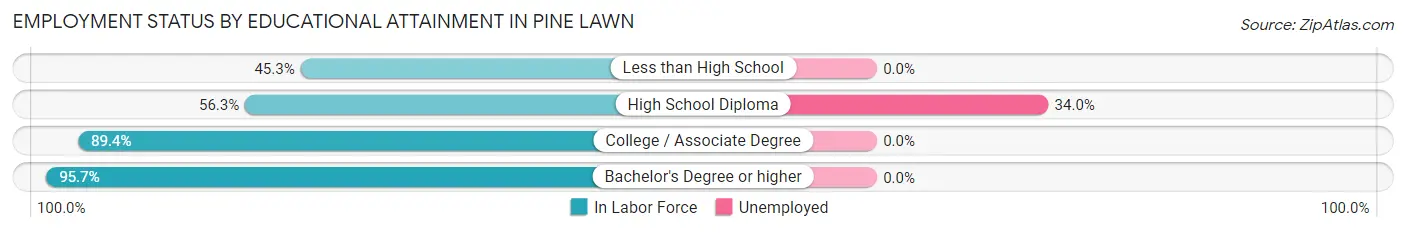
| Educational Attainment | In Labor Force | Unemployed |
| Less than High School | 91 (45.3%) | 0 (0.0%) |
| High School Diploma | 262 (56.3%) | 158 (34.0%) |
| College / Associate Degree | 364 (89.4%) | 0 (0.0%) |
| Bachelor's Degree or higher | 45 (95.7%) | 0 (0.0%) |
| Total | 762 (68.0%) | 131 (11.7%) |
Employment Occupations by Sex in Pine Lawn
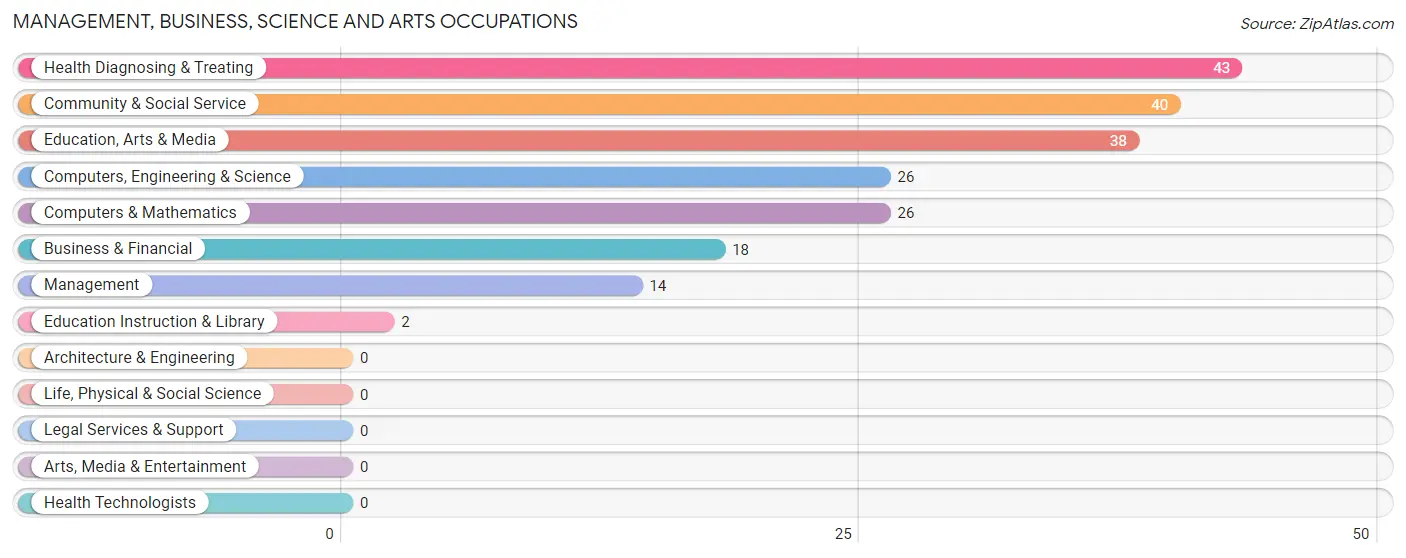
Management, Business, Science and Arts Occupations
The most common Management, Business, Science and Arts occupations in Pine Lawn are Health Diagnosing & Treating (43 | 5.3%), Community & Social Service (40 | 4.9%), Education, Arts & Media (38 | 4.7%), Computers, Engineering & Science (26 | 3.2%), and Computers & Mathematics (26 | 3.2%).
Management, Business, Science and Arts Occupations by Sex
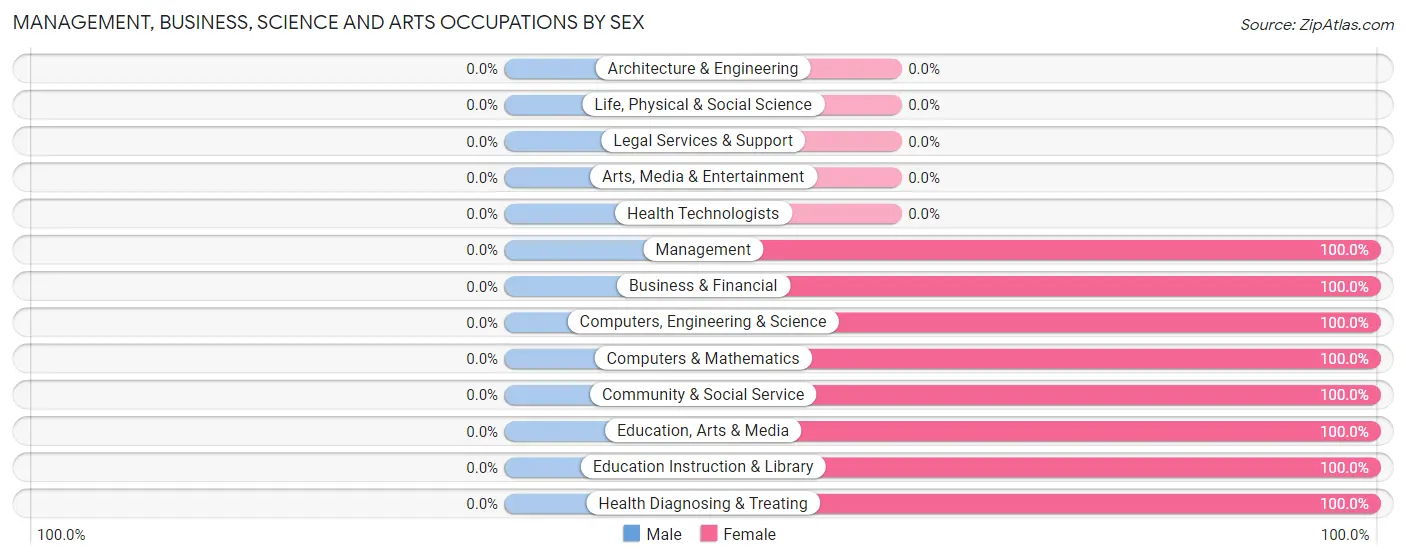
| Occupation | Male | Female |
| Management | 0 (0.0%) | 14 (100.0%) |
| Business & Financial | 0 (0.0%) | 18 (100.0%) |
| Computers, Engineering & Science | 0 (0.0%) | 26 (100.0%) |
| Computers & Mathematics | 0 (0.0%) | 26 (100.0%) |
| Architecture & Engineering | 0 (0.0%) | 0 (0.0%) |
| Life, Physical & Social Science | 0 (0.0%) | 0 (0.0%) |
| Community & Social Service | 0 (0.0%) | 40 (100.0%) |
| Education, Arts & Media | 0 (0.0%) | 38 (100.0%) |
| Legal Services & Support | 0 (0.0%) | 0 (0.0%) |
| Education Instruction & Library | 0 (0.0%) | 2 (100.0%) |
| Arts, Media & Entertainment | 0 (0.0%) | 0 (0.0%) |
| Health Diagnosing & Treating | 0 (0.0%) | 43 (100.0%) |
| Health Technologists | 0 (0.0%) | 0 (0.0%) |
| Total (Category) | 0 (0.0%) | 141 (100.0%) |
| Total (Overall) | 229 (28.1%) | 586 (71.9%) |
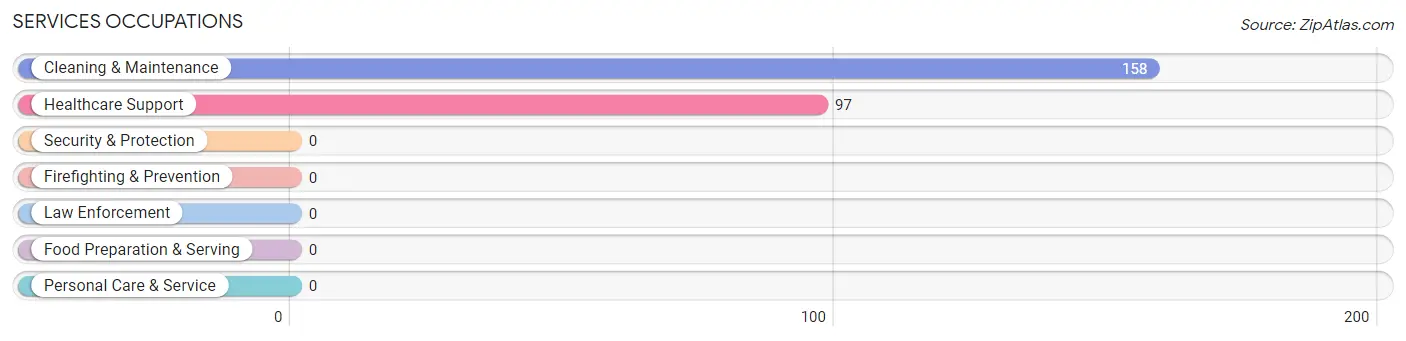
Services Occupations
The most common Services occupations in Pine Lawn are Cleaning & Maintenance (158 | 19.4%), and Healthcare Support (97 | 11.9%).
Services Occupations by Sex
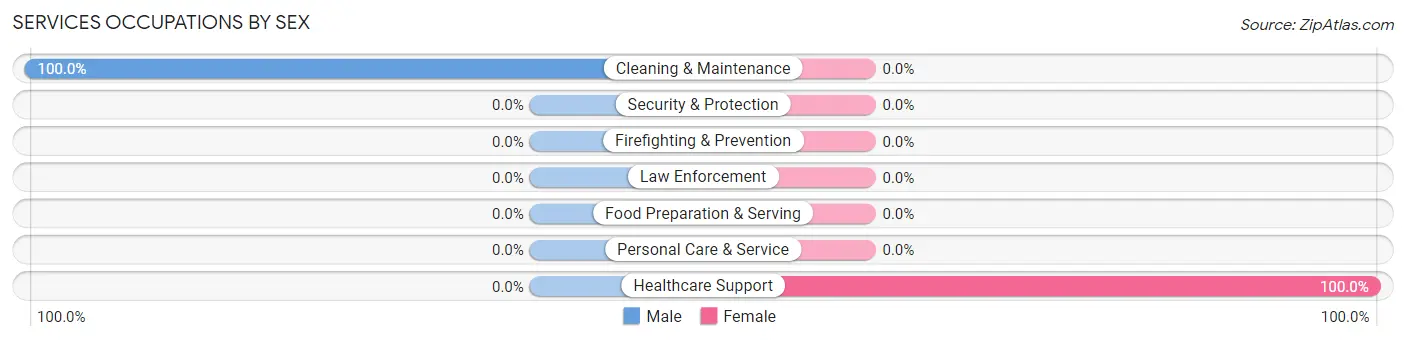
| Occupation | Male | Female |
| Healthcare Support | 0 (0.0%) | 97 (100.0%) |
| Security & Protection | 0 (0.0%) | 0 (0.0%) |
| Firefighting & Prevention | 0 (0.0%) | 0 (0.0%) |
| Law Enforcement | 0 (0.0%) | 0 (0.0%) |
| Food Preparation & Serving | 0 (0.0%) | 0 (0.0%) |
| Cleaning & Maintenance | 158 (100.0%) | 0 (0.0%) |
| Personal Care & Service | 0 (0.0%) | 0 (0.0%) |
| Total (Category) | 158 (62.0%) | 97 (38.0%) |
| Total (Overall) | 229 (28.1%) | 586 (71.9%) |
Sales and Office Occupations
The most common Sales and Office occupations in Pine Lawn are Office & Administration (64 | 7.9%), and Sales & Related (60 | 7.4%).
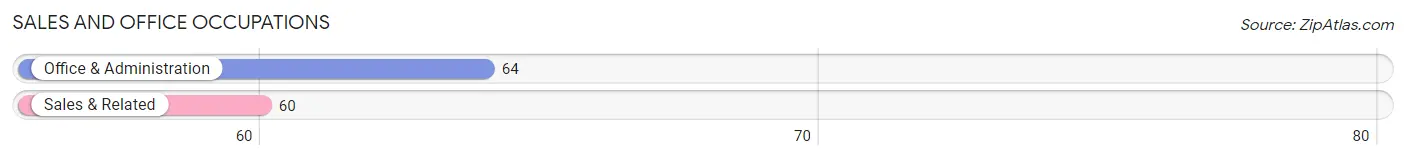
Sales and Office Occupations by Sex
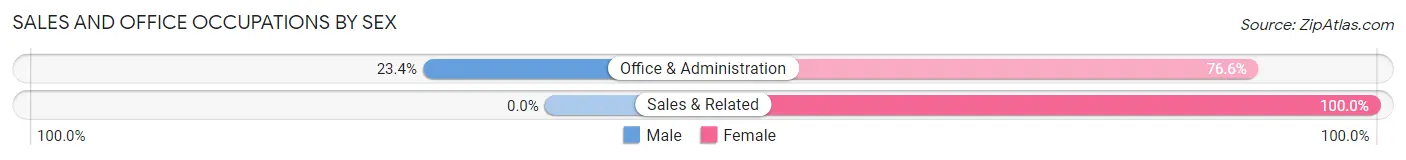
| Occupation | Male | Female |
| Sales & Related | 0 (0.0%) | 60 (100.0%) |
| Office & Administration | 15 (23.4%) | 49 (76.6%) |
| Total (Category) | 15 (12.1%) | 109 (87.9%) |
| Total (Overall) | 229 (28.1%) | 586 (71.9%) |
Natural Resources, Construction and Maintenance Occupations
The most common Natural Resources, Construction and Maintenance occupations in Pine Lawn are , and Installation, Maintenance & Repair (21 | 2.6%).
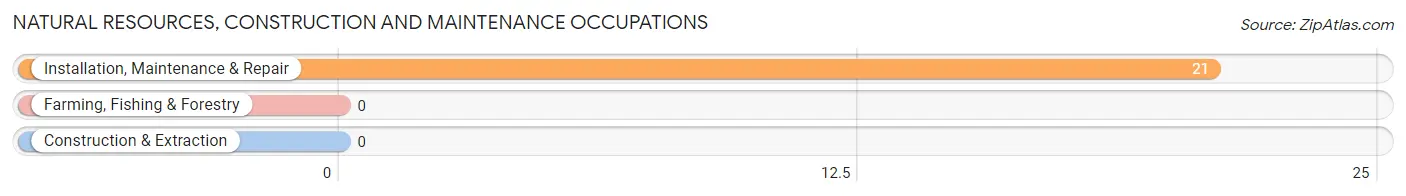
Natural Resources, Construction and Maintenance Occupations by Sex
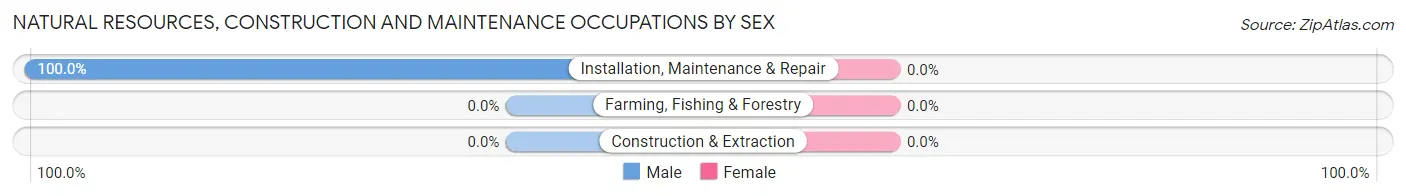
| Occupation | Male | Female |
| Farming, Fishing & Forestry | 0 (0.0%) | 0 (0.0%) |
| Construction & Extraction | 0 (0.0%) | 0 (0.0%) |
| Installation, Maintenance & Repair | 21 (100.0%) | 0 (0.0%) |
| Total (Category) | 21 (100.0%) | 0 (0.0%) |
| Total (Overall) | 229 (28.1%) | 586 (71.9%) |
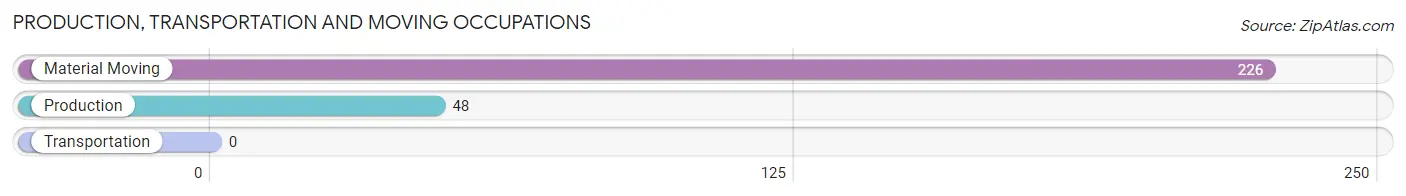
Production, Transportation and Moving Occupations
The most common Production, Transportation and Moving occupations in Pine Lawn are Material Moving (226 | 27.7%), and Production (48 | 5.9%).
Production, Transportation and Moving Occupations by Sex
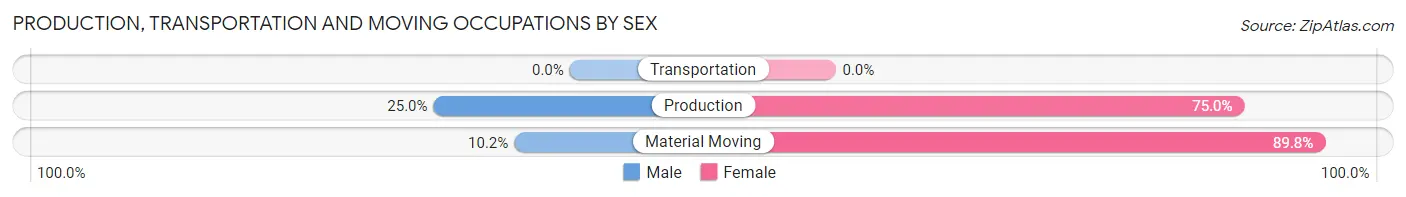
| Occupation | Male | Female |
| Production | 12 (25.0%) | 36 (75.0%) |
| Transportation | 0 (0.0%) | 0 (0.0%) |
| Material Moving | 23 (10.2%) | 203 (89.8%) |
| Total (Category) | 35 (12.8%) | 239 (87.2%) |
| Total (Overall) | 229 (28.1%) | 586 (71.9%) |
Employment Industries by Sex in Pine Lawn
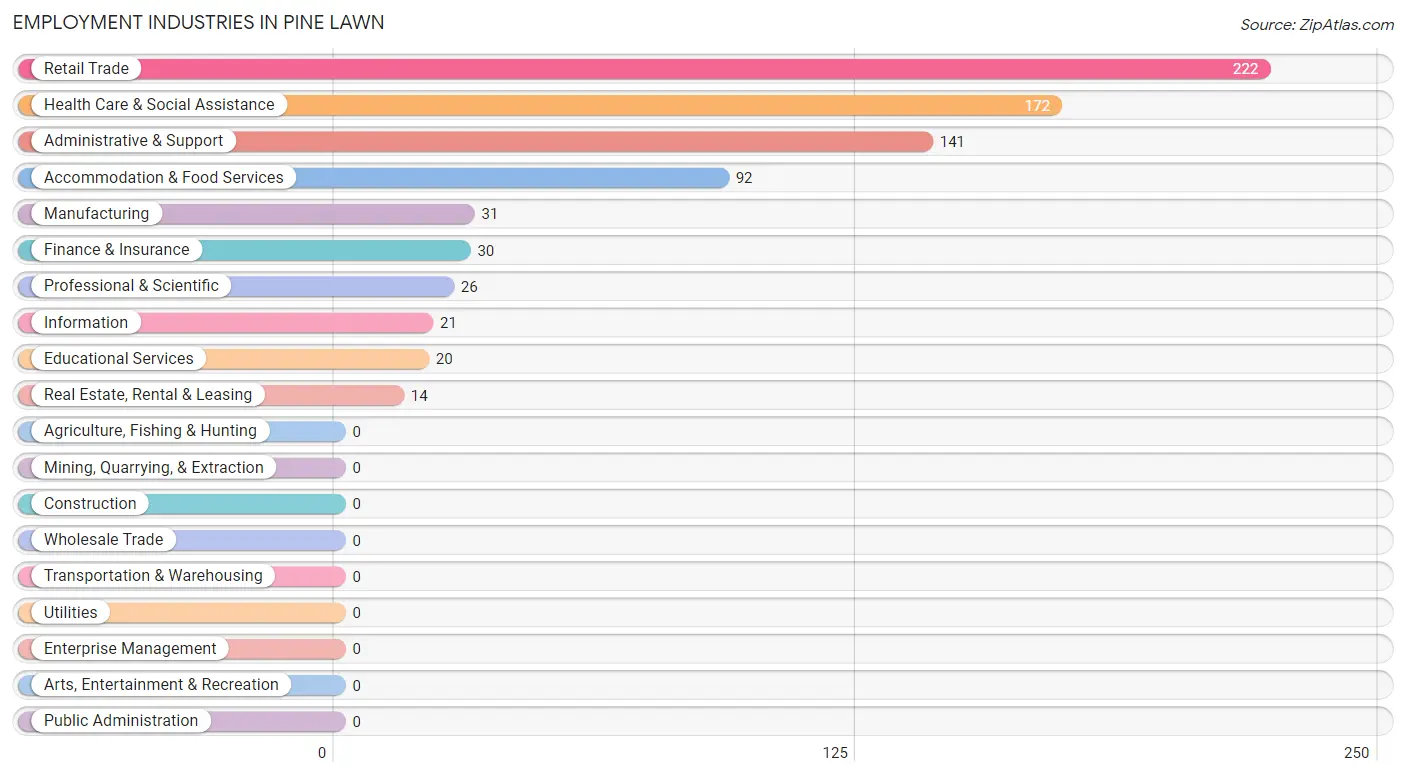
Employment Industries in Pine Lawn
The major employment industries in Pine Lawn include Retail Trade (222 | 27.2%), Health Care & Social Assistance (172 | 21.1%), Administrative & Support (141 | 17.3%), Accommodation & Food Services (92 | 11.3%), and Manufacturing (31 | 3.8%).
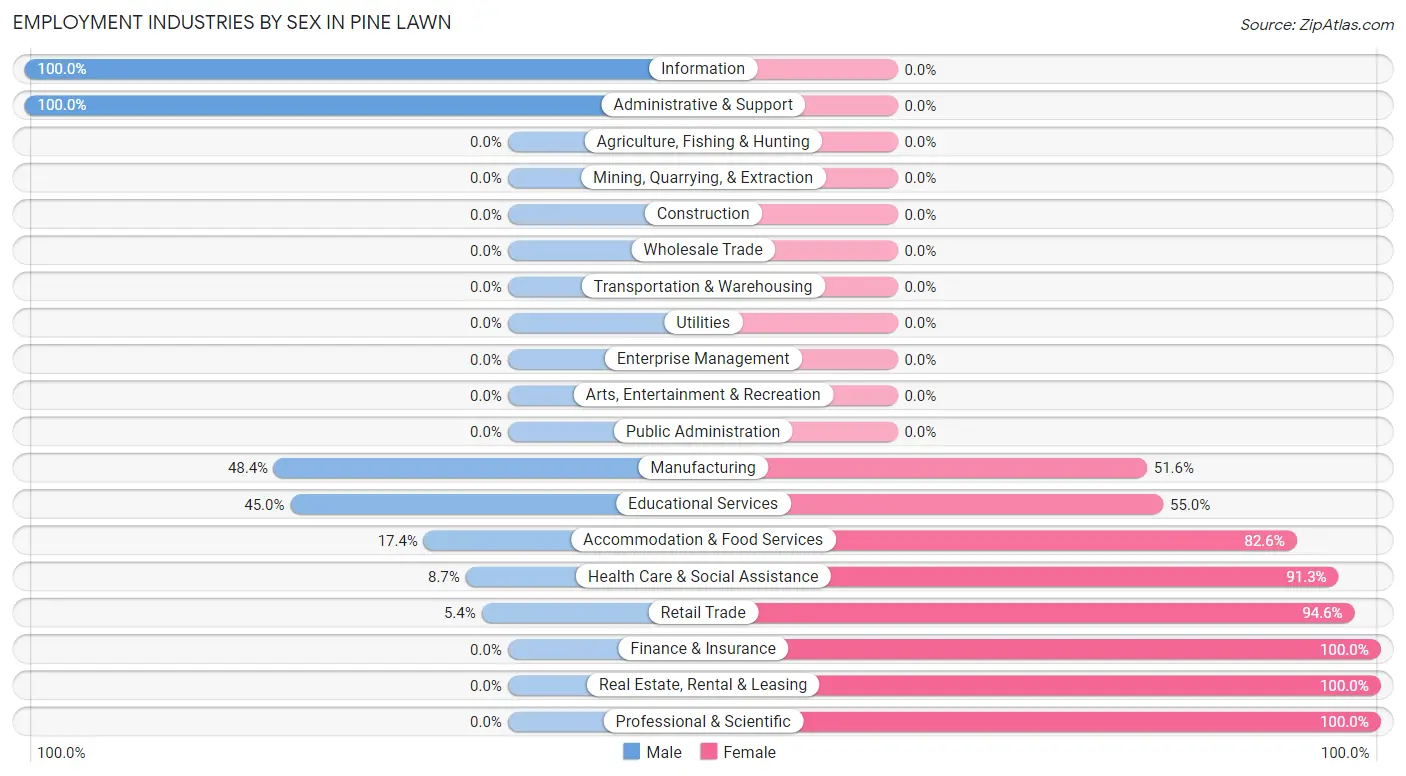
Employment Industries by Sex in Pine Lawn
The Pine Lawn industries that see more men than women are Information (100.0%), Administrative & Support (100.0%), and Manufacturing (48.4%), whereas the industries that tend to have a higher number of women are Finance & Insurance (100.0%), Real Estate, Rental & Leasing (100.0%), and Professional & Scientific (100.0%).
| Industry | Male | Female |
| Agriculture, Fishing & Hunting | 0 (0.0%) | 0 (0.0%) |
| Mining, Quarrying, & Extraction | 0 (0.0%) | 0 (0.0%) |
| Construction | 0 (0.0%) | 0 (0.0%) |
| Manufacturing | 15 (48.4%) | 16 (51.6%) |
| Wholesale Trade | 0 (0.0%) | 0 (0.0%) |
| Retail Trade | 12 (5.4%) | 210 (94.6%) |
| Transportation & Warehousing | 0 (0.0%) | 0 (0.0%) |
| Utilities | 0 (0.0%) | 0 (0.0%) |
| Information | 21 (100.0%) | 0 (0.0%) |
| Finance & Insurance | 0 (0.0%) | 30 (100.0%) |
| Real Estate, Rental & Leasing | 0 (0.0%) | 14 (100.0%) |
| Professional & Scientific | 0 (0.0%) | 26 (100.0%) |
| Enterprise Management | 0 (0.0%) | 0 (0.0%) |
| Administrative & Support | 141 (100.0%) | 0 (0.0%) |
| Educational Services | 9 (45.0%) | 11 (55.0%) |
| Health Care & Social Assistance | 15 (8.7%) | 157 (91.3%) |
| Arts, Entertainment & Recreation | 0 (0.0%) | 0 (0.0%) |
| Accommodation & Food Services | 16 (17.4%) | 76 (82.6%) |
| Public Administration | 0 (0.0%) | 0 (0.0%) |
| Total | 229 (28.1%) | 586 (71.9%) |
Education in Pine Lawn
School Enrollment in Pine Lawn
The most common levels of schooling among the 1,159 students in Pine Lawn are elementary school (460 | 39.7%), middle school (385 | 33.2%), and college / undergraduate (140 | 12.1%).
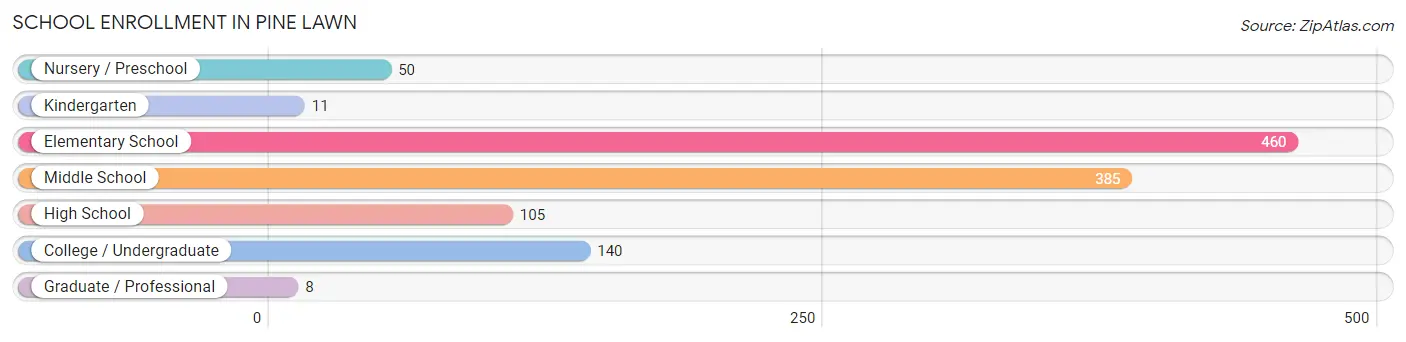
| School Level | # Students | % Students |
| Nursery / Preschool | 50 | 4.3% |
| Kindergarten | 11 | 0.9% |
| Elementary School | 460 | 39.7% |
| Middle School | 385 | 33.2% |
| High School | 105 | 9.1% |
| College / Undergraduate | 140 | 12.1% |
| Graduate / Professional | 8 | 0.7% |
| Total | 1,159 | 100.0% |
School Enrollment by Age by Funding Source in Pine Lawn
Out of a total of 1,159 students who are enrolled in schools in Pine Lawn, 330 (28.5%) attend a private institution, while the remaining 829 (71.5%) are enrolled in public schools. The age group of 5 to 9 year old has the highest likelihood of being enrolled in private schools, with 329 (69.9% in the age bracket) enrolled. Conversely, the age group of 10 to 14 year olds has the lowest likelihood of being enrolled in a private school, with 385 (100.0% in the age bracket) attending a public institution.
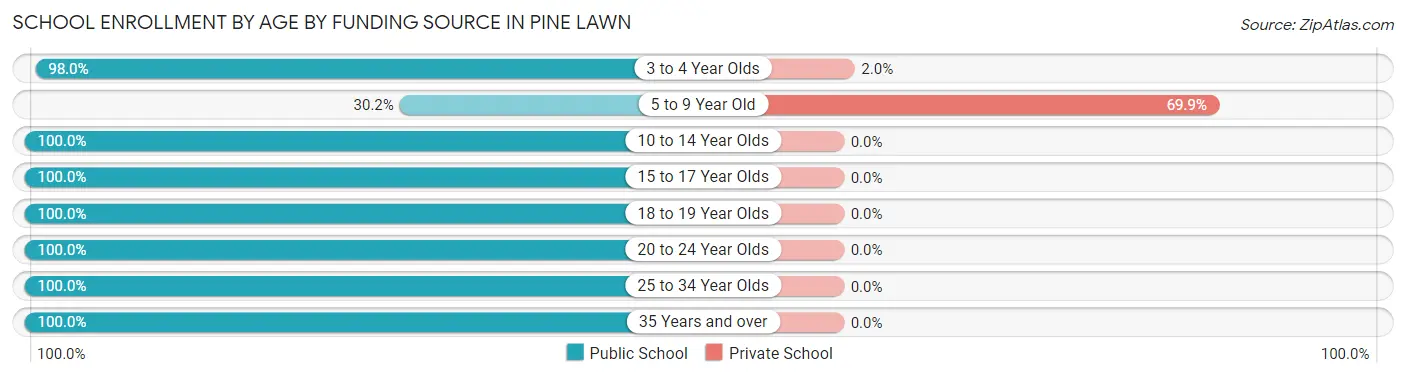
| Age Bracket | Public School | Private School |
| 3 to 4 Year Olds | 49 (98.0%) | 1 (2.0%) |
| 5 to 9 Year Old | 142 (30.1%) | 329 (69.9%) |
| 10 to 14 Year Olds | 385 (100.0%) | 0 (0.0%) |
| 15 to 17 Year Olds | 38 (100.0%) | 0 (0.0%) |
| 18 to 19 Year Olds | 43 (100.0%) | 0 (0.0%) |
| 20 to 24 Year Olds | 17 (100.0%) | 0 (0.0%) |
| 25 to 34 Year Olds | 24 (100.0%) | 0 (0.0%) |
| 35 Years and over | 131 (100.0%) | 0 (0.0%) |
| Total | 829 (71.5%) | 330 (28.5%) |
Educational Attainment by Field of Study in Pine Lawn
Business (25 | 45.5%), science & technology (20 | 36.4%), education (8 | 14.5%), and bio, nature & agricultural (2 | 3.6%) are the most common fields of study among 55 individuals in Pine Lawn who have obtained a bachelor's degree or higher.
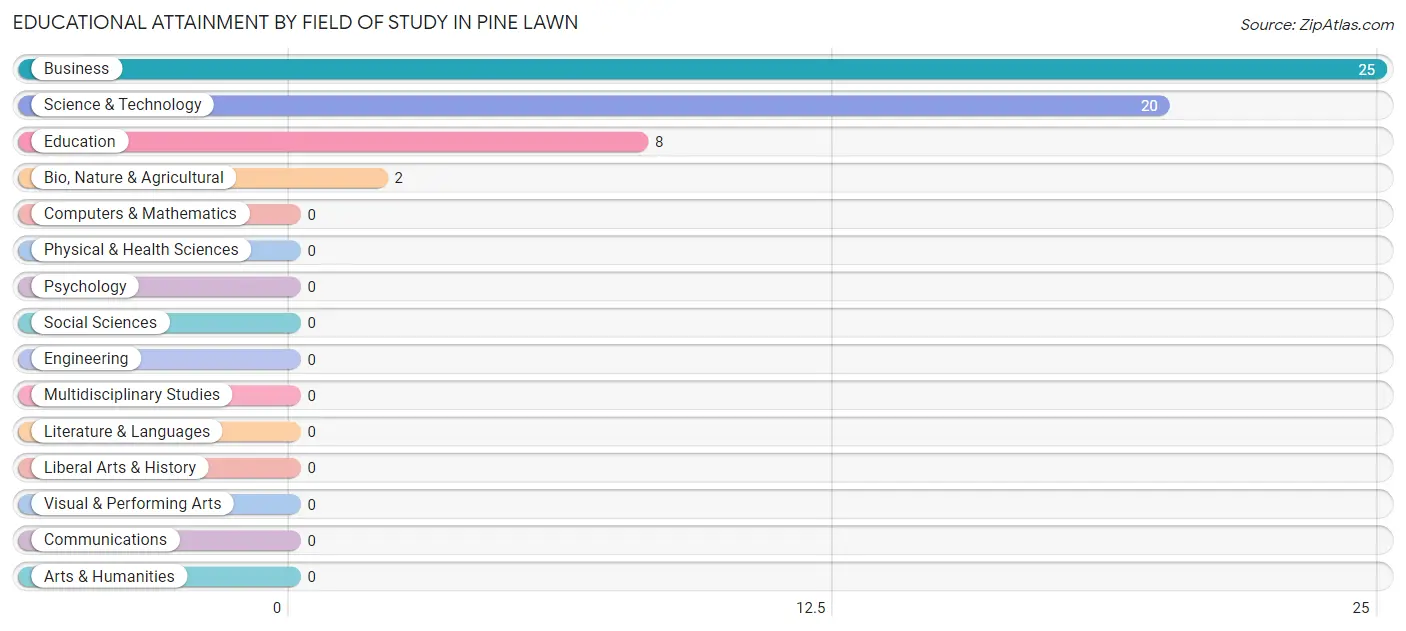
| Field of Study | # Graduates | % Graduates |
| Computers & Mathematics | 0 | 0.0% |
| Bio, Nature & Agricultural | 2 | 3.6% |
| Physical & Health Sciences | 0 | 0.0% |
| Psychology | 0 | 0.0% |
| Social Sciences | 0 | 0.0% |
| Engineering | 0 | 0.0% |
| Multidisciplinary Studies | 0 | 0.0% |
| Science & Technology | 20 | 36.4% |
| Business | 25 | 45.5% |
| Education | 8 | 14.5% |
| Literature & Languages | 0 | 0.0% |
| Liberal Arts & History | 0 | 0.0% |
| Visual & Performing Arts | 0 | 0.0% |
| Communications | 0 | 0.0% |
| Arts & Humanities | 0 | 0.0% |
| Total | 55 | 100.0% |
Transportation & Commute in Pine Lawn
Vehicle Availability by Sex in Pine Lawn
The most prevalent vehicle ownership categories in Pine Lawn are males with 4 vehicles (75, accounting for 33.0%) and females with 4 vehicles (0, making up 13.2%).
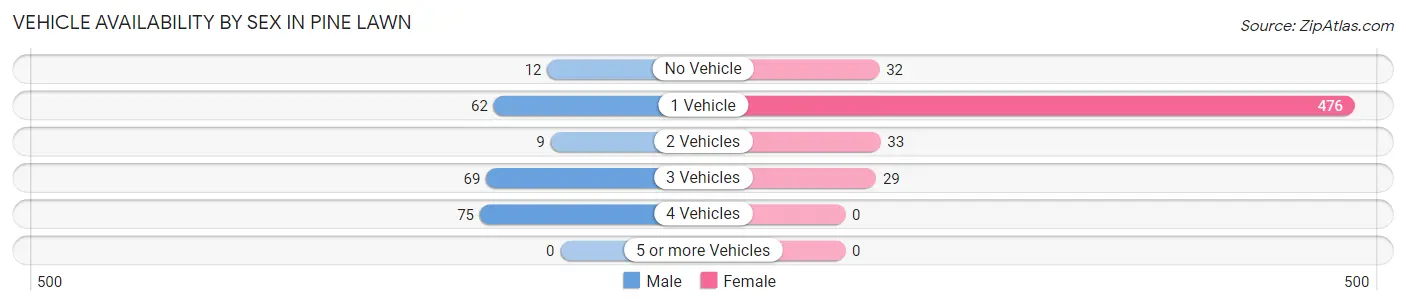
| Vehicles Available | Male | Female |
| No Vehicle | 12 (5.3%) | 32 (5.6%) |
| 1 Vehicle | 62 (27.3%) | 476 (83.5%) |
| 2 Vehicles | 9 (4.0%) | 33 (5.8%) |
| 3 Vehicles | 69 (30.4%) | 29 (5.1%) |
| 4 Vehicles | 75 (33.0%) | 0 (0.0%) |
| 5 or more Vehicles | 0 (0.0%) | 0 (0.0%) |
| Total | 227 (100.0%) | 570 (100.0%) |
Commute Time in Pine Lawn
The most frequently occuring commute durations in Pine Lawn are 20 to 24 minutes (318 commuters, 42.8%), 30 to 34 minutes (128 commuters, 17.2%), and 15 to 19 minutes (112 commuters, 15.1%).
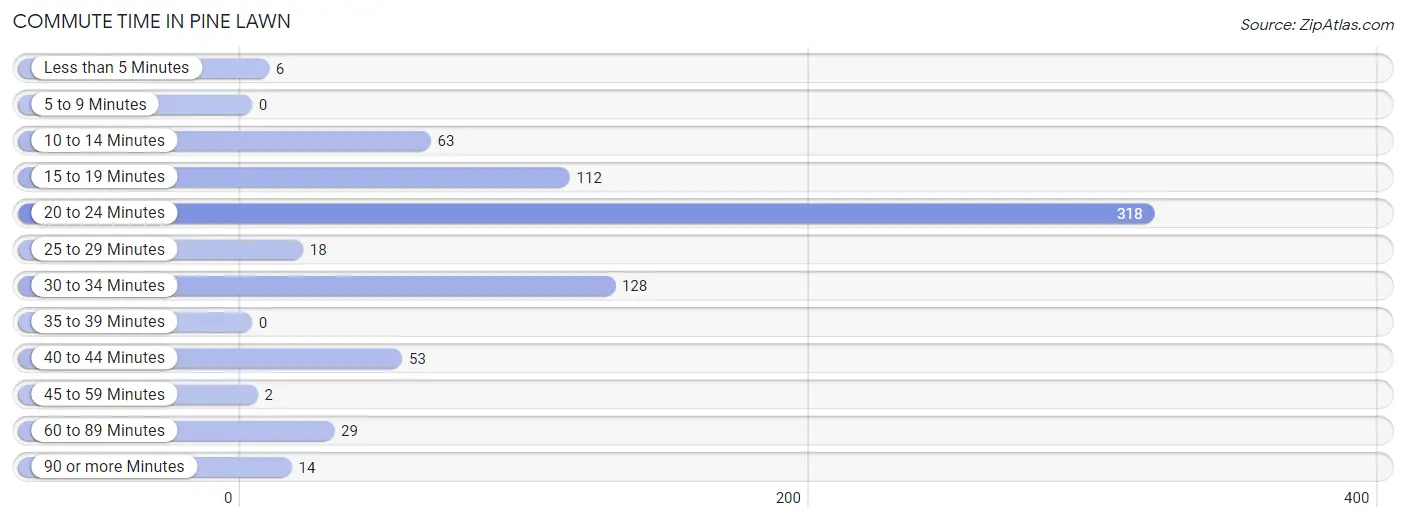
| Commute Time | # Commuters | % Commuters |
| Less than 5 Minutes | 6 | 0.8% |
| 5 to 9 Minutes | 0 | 0.0% |
| 10 to 14 Minutes | 63 | 8.5% |
| 15 to 19 Minutes | 112 | 15.1% |
| 20 to 24 Minutes | 318 | 42.8% |
| 25 to 29 Minutes | 18 | 2.4% |
| 30 to 34 Minutes | 128 | 17.2% |
| 35 to 39 Minutes | 0 | 0.0% |
| 40 to 44 Minutes | 53 | 7.1% |
| 45 to 59 Minutes | 2 | 0.3% |
| 60 to 89 Minutes | 29 | 3.9% |
| 90 or more Minutes | 14 | 1.9% |
Commute Time by Sex in Pine Lawn
The most common commute times in Pine Lawn are 30 to 34 minutes (90 commuters, 39.3%) for males and 20 to 24 minutes (302 commuters, 58.8%) for females.
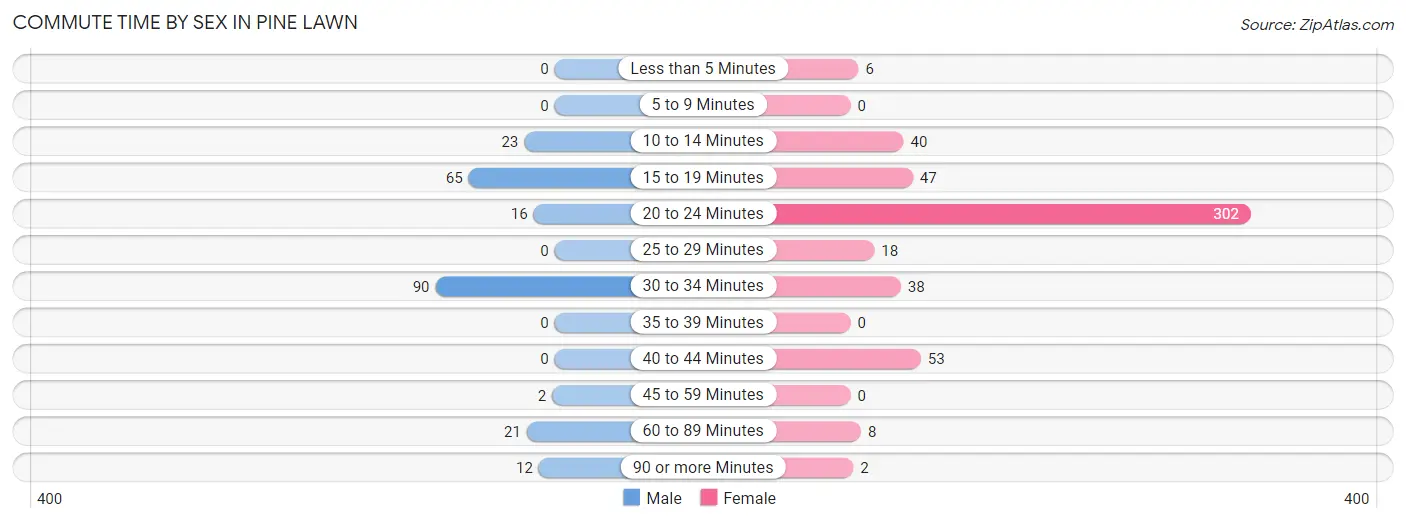
| Commute Time | Male | Female |
| Less than 5 Minutes | 0 (0.0%) | 6 (1.2%) |
| 5 to 9 Minutes | 0 (0.0%) | 0 (0.0%) |
| 10 to 14 Minutes | 23 (10.0%) | 40 (7.8%) |
| 15 to 19 Minutes | 65 (28.4%) | 47 (9.1%) |
| 20 to 24 Minutes | 16 (7.0%) | 302 (58.8%) |
| 25 to 29 Minutes | 0 (0.0%) | 18 (3.5%) |
| 30 to 34 Minutes | 90 (39.3%) | 38 (7.4%) |
| 35 to 39 Minutes | 0 (0.0%) | 0 (0.0%) |
| 40 to 44 Minutes | 0 (0.0%) | 53 (10.3%) |
| 45 to 59 Minutes | 2 (0.9%) | 0 (0.0%) |
| 60 to 89 Minutes | 21 (9.2%) | 8 (1.6%) |
| 90 or more Minutes | 12 (5.2%) | 2 (0.4%) |
Time of Departure to Work by Sex in Pine Lawn
The most frequent times of departure to work in Pine Lawn are 12:00 PM to 3:59 PM (83, 36.2%) for males and 7:30 AM to 7:59 AM (261, 50.8%) for females.
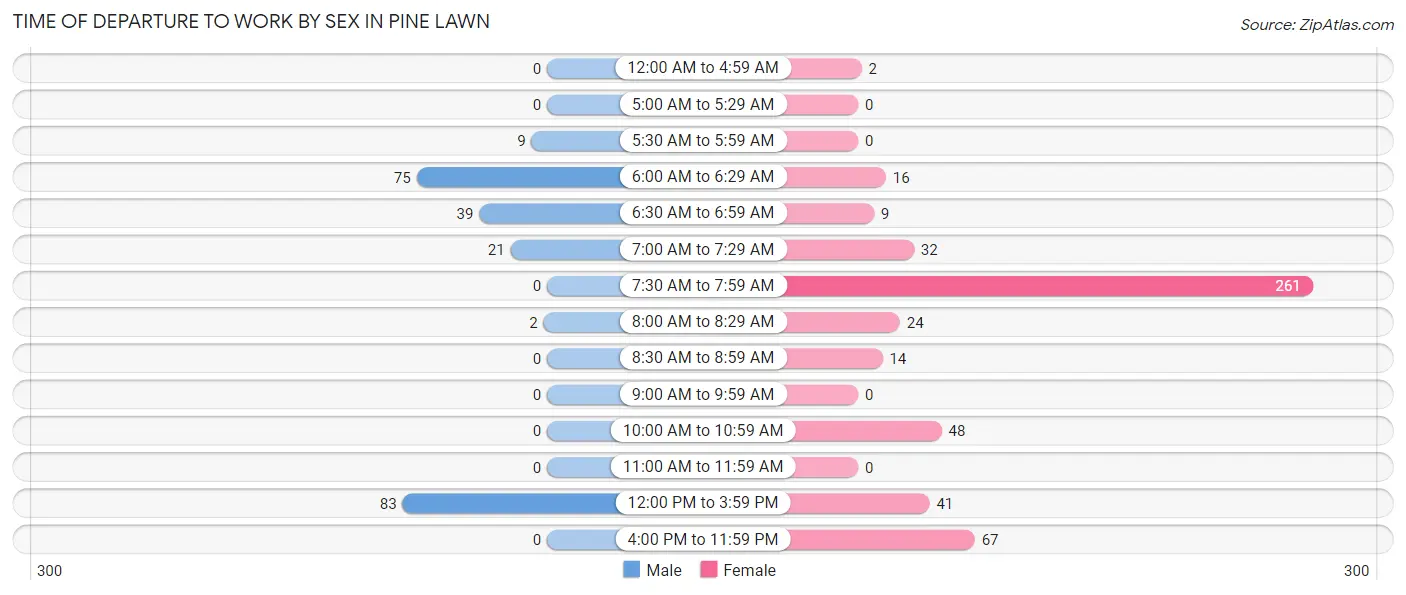
| Time of Departure | Male | Female |
| 12:00 AM to 4:59 AM | 0 (0.0%) | 2 (0.4%) |
| 5:00 AM to 5:29 AM | 0 (0.0%) | 0 (0.0%) |
| 5:30 AM to 5:59 AM | 9 (3.9%) | 0 (0.0%) |
| 6:00 AM to 6:29 AM | 75 (32.8%) | 16 (3.1%) |
| 6:30 AM to 6:59 AM | 39 (17.0%) | 9 (1.8%) |
| 7:00 AM to 7:29 AM | 21 (9.2%) | 32 (6.2%) |
| 7:30 AM to 7:59 AM | 0 (0.0%) | 261 (50.8%) |
| 8:00 AM to 8:29 AM | 2 (0.9%) | 24 (4.7%) |
| 8:30 AM to 8:59 AM | 0 (0.0%) | 14 (2.7%) |
| 9:00 AM to 9:59 AM | 0 (0.0%) | 0 (0.0%) |
| 10:00 AM to 10:59 AM | 0 (0.0%) | 48 (9.3%) |
| 11:00 AM to 11:59 AM | 0 (0.0%) | 0 (0.0%) |
| 12:00 PM to 3:59 PM | 83 (36.2%) | 41 (8.0%) |
| 4:00 PM to 11:59 PM | 0 (0.0%) | 67 (13.0%) |
| Total | 229 (100.0%) | 514 (100.0%) |
Housing Occupancy in Pine Lawn
Occupancy by Ownership in Pine Lawn
Of the total 1,056 dwellings in Pine Lawn, owner-occupied units account for 292 (27.7%), while renter-occupied units make up 764 (72.4%).
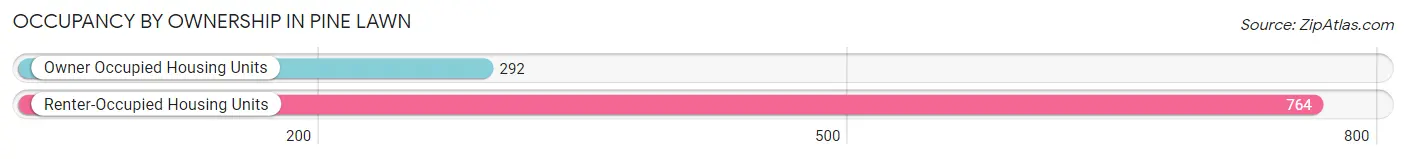
| Occupancy | # Housing Units | % Housing Units |
| Owner Occupied Housing Units | 292 | 27.7% |
| Renter-Occupied Housing Units | 764 | 72.4% |
| Total Occupied Housing Units | 1,056 | 100.0% |
Occupancy by Household Size in Pine Lawn
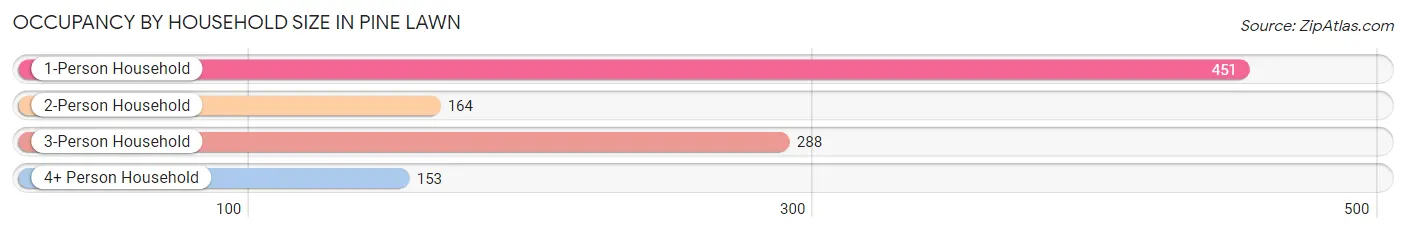
| Household Size | # Housing Units | % Housing Units |
| 1-Person Household | 451 | 42.7% |
| 2-Person Household | 164 | 15.5% |
| 3-Person Household | 288 | 27.3% |
| 4+ Person Household | 153 | 14.5% |
| Total Housing Units | 1,056 | 100.0% |
Occupancy by Ownership by Household Size in Pine Lawn
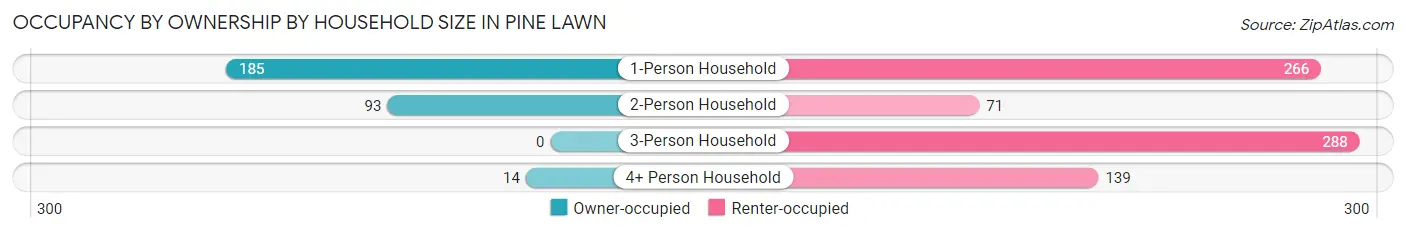
| Household Size | Owner-occupied | Renter-occupied |
| 1-Person Household | 185 (41.0%) | 266 (59.0%) |
| 2-Person Household | 93 (56.7%) | 71 (43.3%) |
| 3-Person Household | 0 (0.0%) | 288 (100.0%) |
| 4+ Person Household | 14 (9.1%) | 139 (90.8%) |
| Total Housing Units | 292 (27.7%) | 764 (72.4%) |
Occupancy by Educational Attainment in Pine Lawn
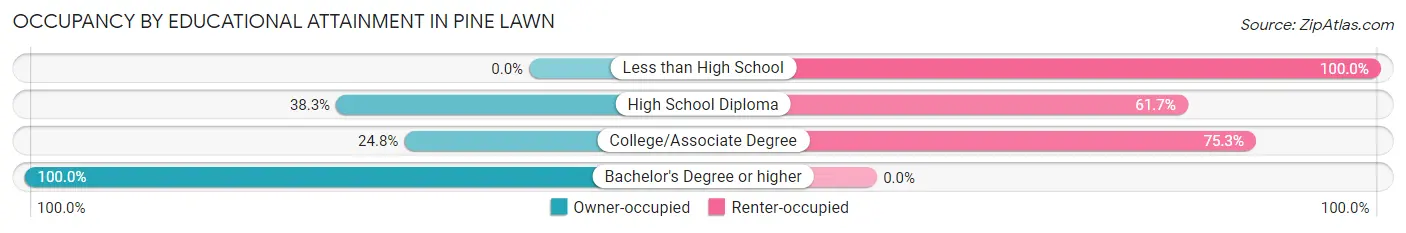
| Household Size | Owner-occupied | Renter-occupied |
| Less than High School | 0 (0.0%) | 207 (100.0%) |
| High School Diploma | 155 (38.3%) | 250 (61.7%) |
| College/Associate Degree | 101 (24.7%) | 307 (75.2%) |
| Bachelor's Degree or higher | 36 (100.0%) | 0 (0.0%) |
Occupancy by Age of Householder in Pine Lawn
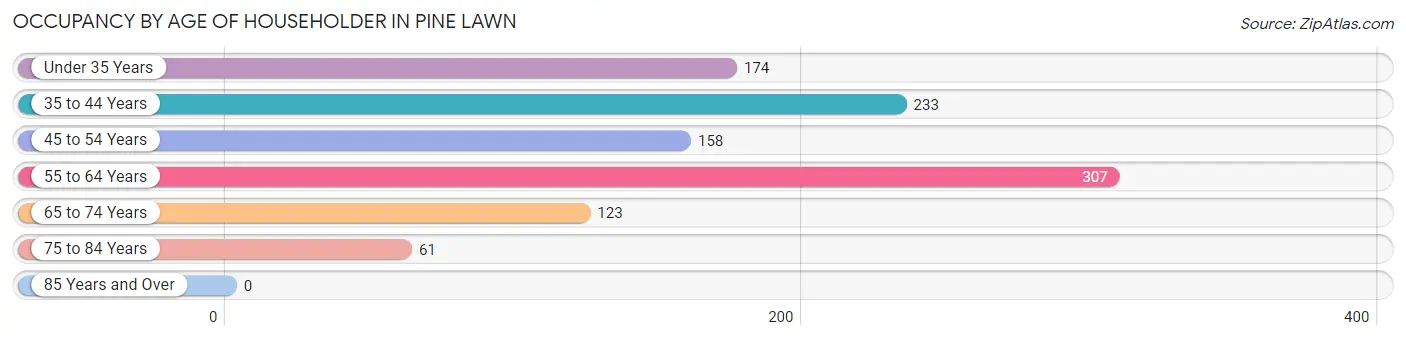
| Age Bracket | # Households | % Households |
| Under 35 Years | 174 | 16.5% |
| 35 to 44 Years | 233 | 22.1% |
| 45 to 54 Years | 158 | 15.0% |
| 55 to 64 Years | 307 | 29.1% |
| 65 to 74 Years | 123 | 11.7% |
| 75 to 84 Years | 61 | 5.8% |
| 85 Years and Over | 0 | 0.0% |
| Total | 1,056 | 100.0% |
Housing Finances in Pine Lawn
Median Income by Occupancy in Pine Lawn
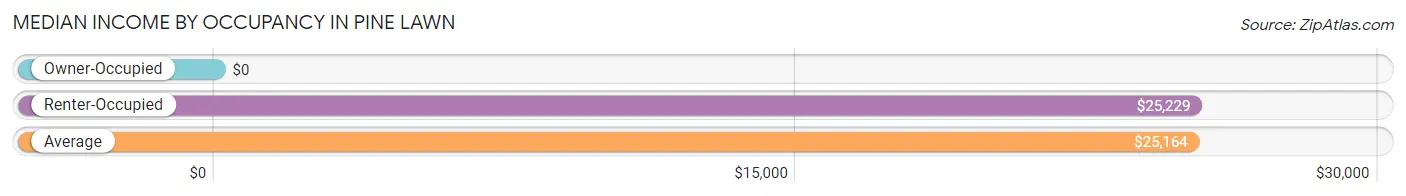
| Occupancy Type | # Households | Median Income |
| Owner-Occupied | 292 (27.7%) | $0 |
| Renter-Occupied | 764 (72.4%) | $25,229 |
| Average | 1,056 (100.0%) | $25,164 |
Occupancy by Householder Income Bracket in Pine Lawn
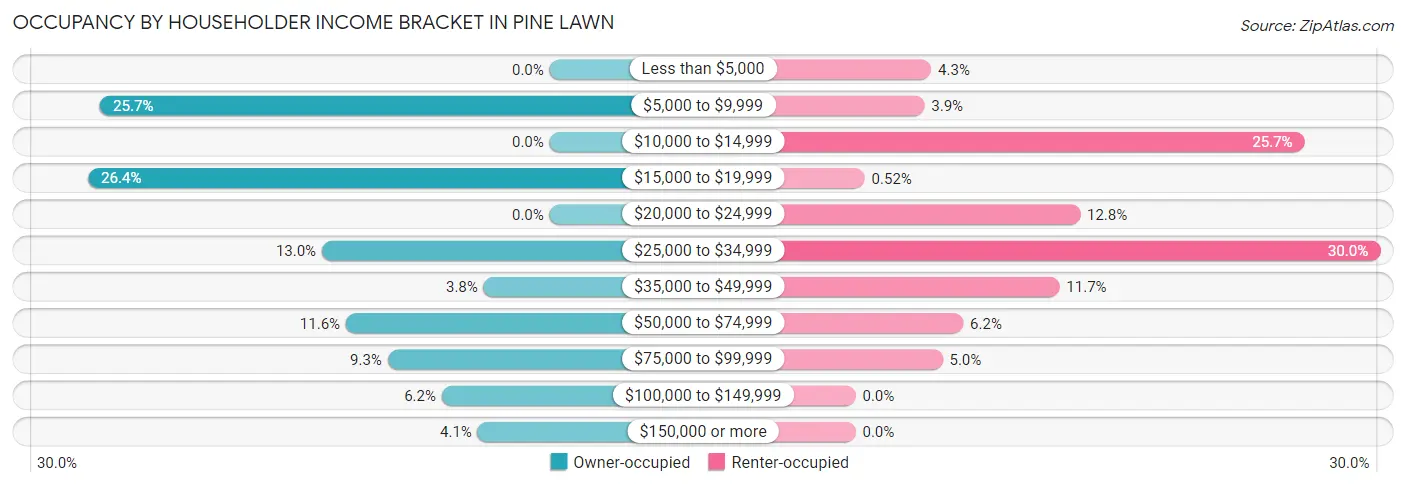
| Income Bracket | Owner-occupied | Renter-occupied |
| Less than $5,000 | 0 (0.0%) | 33 (4.3%) |
| $5,000 to $9,999 | 75 (25.7%) | 30 (3.9%) |
| $10,000 to $14,999 | 0 (0.0%) | 196 (25.7%) |
| $15,000 to $19,999 | 77 (26.4%) | 4 (0.5%) |
| $20,000 to $24,999 | 0 (0.0%) | 98 (12.8%) |
| $25,000 to $34,999 | 38 (13.0%) | 229 (30.0%) |
| $35,000 to $49,999 | 11 (3.8%) | 89 (11.7%) |
| $50,000 to $74,999 | 34 (11.6%) | 47 (6.1%) |
| $75,000 to $99,999 | 27 (9.2%) | 38 (5.0%) |
| $100,000 to $149,999 | 18 (6.2%) | 0 (0.0%) |
| $150,000 or more | 12 (4.1%) | 0 (0.0%) |
| Total | 292 (100.0%) | 764 (100.0%) |
Monthly Housing Cost Tiers in Pine Lawn
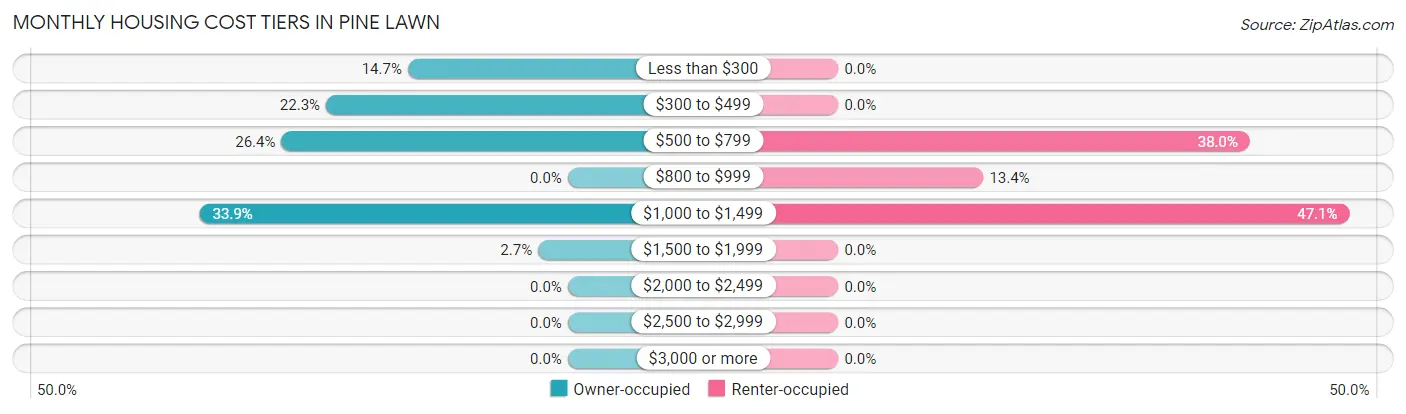
| Monthly Cost | Owner-occupied | Renter-occupied |
| Less than $300 | 43 (14.7%) | 0 (0.0%) |
| $300 to $499 | 65 (22.3%) | 0 (0.0%) |
| $500 to $799 | 77 (26.4%) | 290 (38.0%) |
| $800 to $999 | 0 (0.0%) | 102 (13.4%) |
| $1,000 to $1,499 | 99 (33.9%) | 360 (47.1%) |
| $1,500 to $1,999 | 8 (2.7%) | 0 (0.0%) |
| $2,000 to $2,499 | 0 (0.0%) | 0 (0.0%) |
| $2,500 to $2,999 | 0 (0.0%) | 0 (0.0%) |
| $3,000 or more | 0 (0.0%) | 0 (0.0%) |
| Total | 292 (100.0%) | 764 (100.0%) |
Physical Housing Characteristics in Pine Lawn
Housing Structures in Pine Lawn
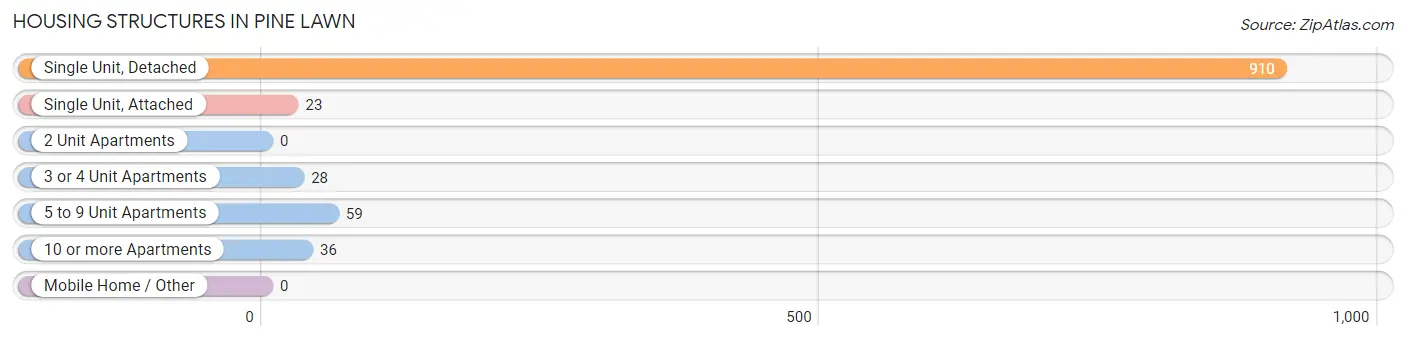
| Structure Type | # Housing Units | % Housing Units |
| Single Unit, Detached | 910 | 86.2% |
| Single Unit, Attached | 23 | 2.2% |
| 2 Unit Apartments | 0 | 0.0% |
| 3 or 4 Unit Apartments | 28 | 2.6% |
| 5 to 9 Unit Apartments | 59 | 5.6% |
| 10 or more Apartments | 36 | 3.4% |
| Mobile Home / Other | 0 | 0.0% |
| Total | 1,056 | 100.0% |
Housing Structures by Occupancy in Pine Lawn
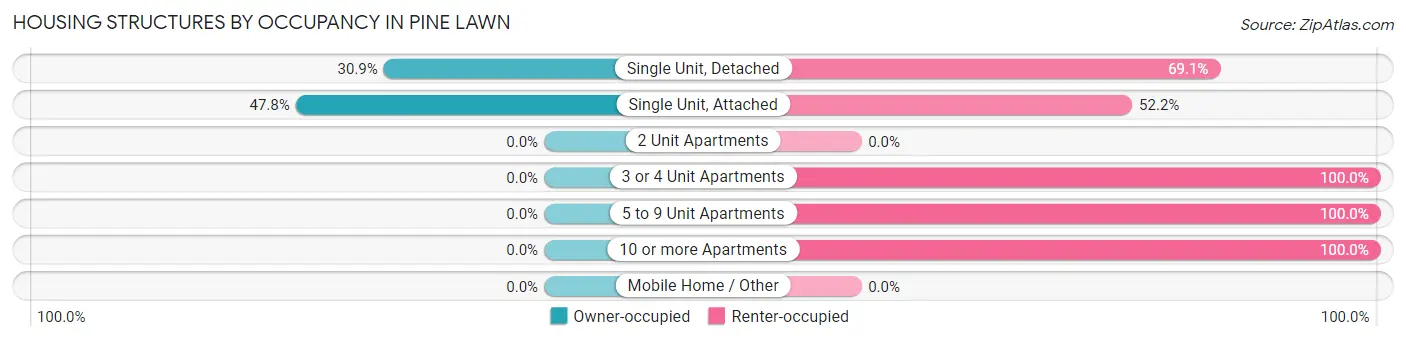
| Structure Type | Owner-occupied | Renter-occupied |
| Single Unit, Detached | 281 (30.9%) | 629 (69.1%) |
| Single Unit, Attached | 11 (47.8%) | 12 (52.2%) |
| 2 Unit Apartments | 0 (0.0%) | 0 (0.0%) |
| 3 or 4 Unit Apartments | 0 (0.0%) | 28 (100.0%) |
| 5 to 9 Unit Apartments | 0 (0.0%) | 59 (100.0%) |
| 10 or more Apartments | 0 (0.0%) | 36 (100.0%) |
| Mobile Home / Other | 0 (0.0%) | 0 (0.0%) |
| Total | 292 (27.7%) | 764 (72.4%) |
Housing Structures by Number of Rooms in Pine Lawn
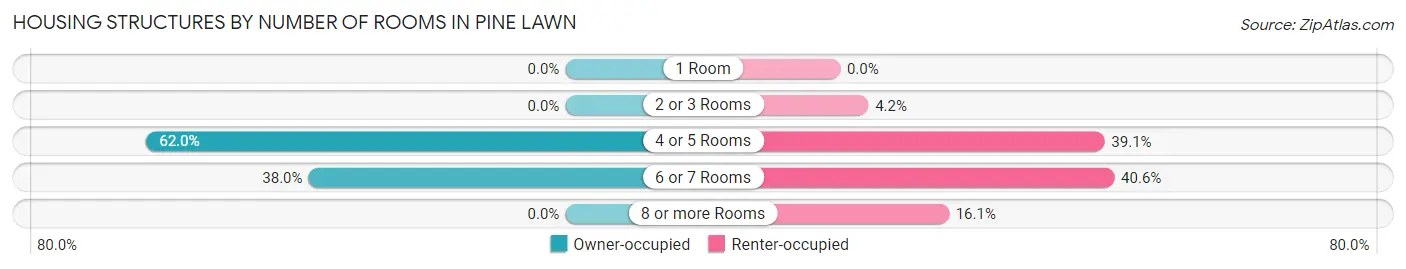
| Number of Rooms | Owner-occupied | Renter-occupied |
| 1 Room | 0 (0.0%) | 0 (0.0%) |
| 2 or 3 Rooms | 0 (0.0%) | 32 (4.2%) |
| 4 or 5 Rooms | 181 (62.0%) | 299 (39.1%) |
| 6 or 7 Rooms | 111 (38.0%) | 310 (40.6%) |
| 8 or more Rooms | 0 (0.0%) | 123 (16.1%) |
| Total | 292 (100.0%) | 764 (100.0%) |
Housing Structure by Heating Type in Pine Lawn
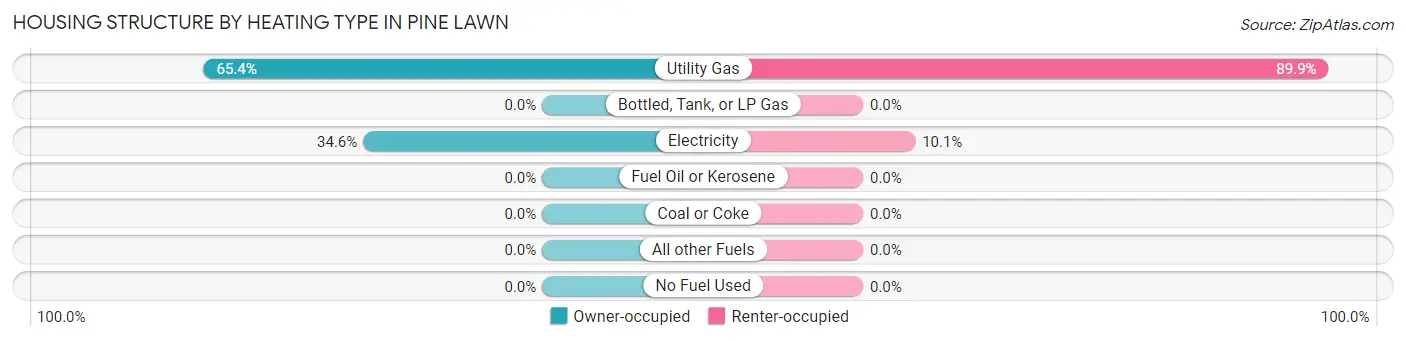
| Heating Type | Owner-occupied | Renter-occupied |
| Utility Gas | 191 (65.4%) | 687 (89.9%) |
| Bottled, Tank, or LP Gas | 0 (0.0%) | 0 (0.0%) |
| Electricity | 101 (34.6%) | 77 (10.1%) |
| Fuel Oil or Kerosene | 0 (0.0%) | 0 (0.0%) |
| Coal or Coke | 0 (0.0%) | 0 (0.0%) |
| All other Fuels | 0 (0.0%) | 0 (0.0%) |
| No Fuel Used | 0 (0.0%) | 0 (0.0%) |
| Total | 292 (100.0%) | 764 (100.0%) |
Household Vehicle Usage in Pine Lawn
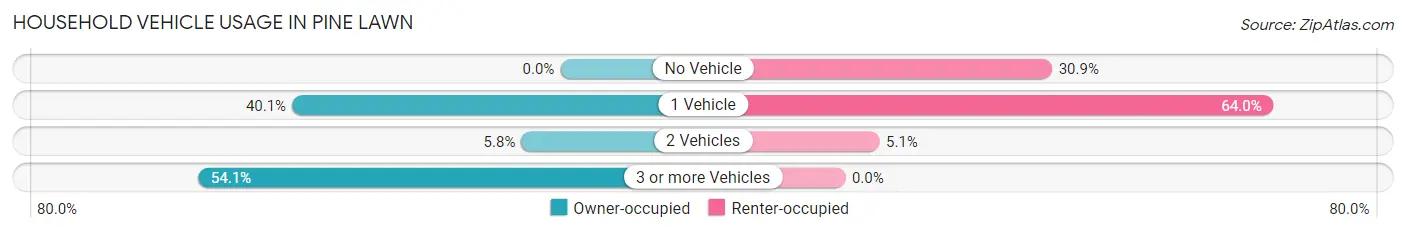
| Vehicles per Household | Owner-occupied | Renter-occupied |
| No Vehicle | 0 (0.0%) | 236 (30.9%) |
| 1 Vehicle | 117 (40.1%) | 489 (64.0%) |
| 2 Vehicles | 17 (5.8%) | 39 (5.1%) |
| 3 or more Vehicles | 158 (54.1%) | 0 (0.0%) |
| Total | 292 (100.0%) | 764 (100.0%) |
Real Estate & Mortgages in Pine Lawn
Real Estate and Mortgage Overview in Pine Lawn
| Characteristic | Without Mortgage | With Mortgage |
| Housing Units | 94 | 198 |
| Median Property Value | $41,600 | $51,000 |
| Median Household Income | $33,355 | $12 |
| Monthly Housing Costs | $355 | $0 |
| Real Estate Taxes | $993 | $0 |
Property Value by Mortgage Status in Pine Lawn
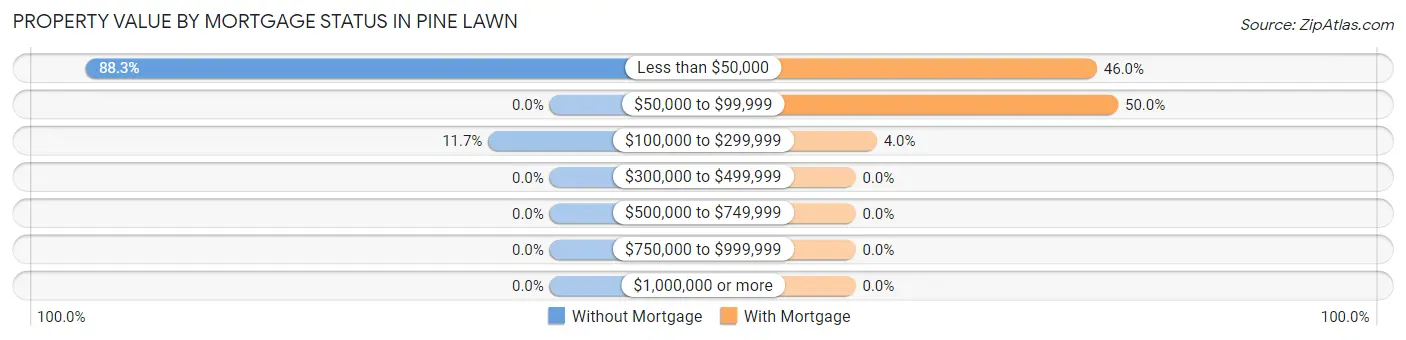
| Property Value | Without Mortgage | With Mortgage |
| Less than $50,000 | 83 (88.3%) | 91 (46.0%) |
| $50,000 to $99,999 | 0 (0.0%) | 99 (50.0%) |
| $100,000 to $299,999 | 11 (11.7%) | 8 (4.0%) |
| $300,000 to $499,999 | 0 (0.0%) | 0 (0.0%) |
| $500,000 to $749,999 | 0 (0.0%) | 0 (0.0%) |
| $750,000 to $999,999 | 0 (0.0%) | 0 (0.0%) |
| $1,000,000 or more | 0 (0.0%) | 0 (0.0%) |
| Total | 94 (100.0%) | 198 (100.0%) |
Household Income by Mortgage Status in Pine Lawn
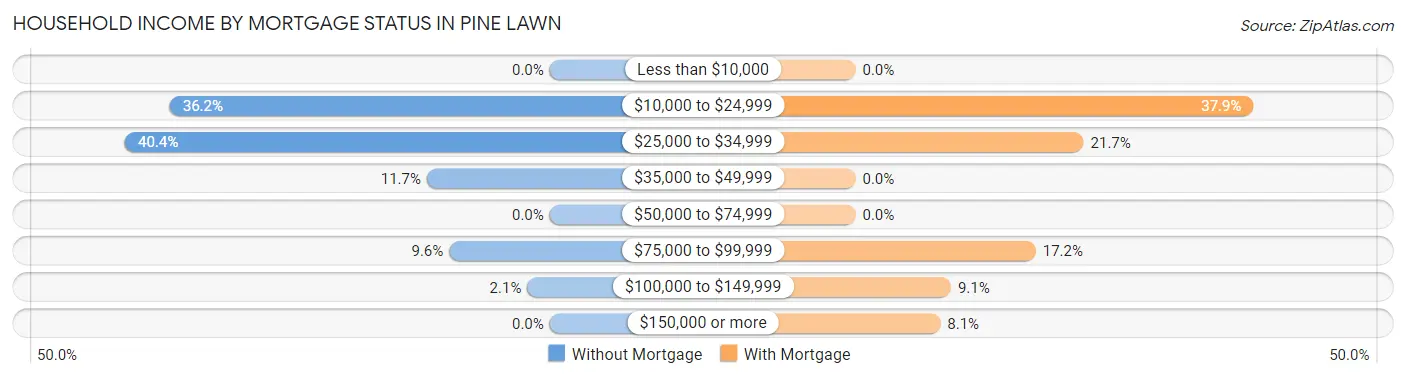
| Household Income | Without Mortgage | With Mortgage |
| Less than $10,000 | 0 (0.0%) | 0 (0.0%) |
| $10,000 to $24,999 | 34 (36.2%) | 75 (37.9%) |
| $25,000 to $34,999 | 38 (40.4%) | 43 (21.7%) |
| $35,000 to $49,999 | 11 (11.7%) | 0 (0.0%) |
| $50,000 to $74,999 | 0 (0.0%) | 0 (0.0%) |
| $75,000 to $99,999 | 9 (9.6%) | 34 (17.2%) |
| $100,000 to $149,999 | 2 (2.1%) | 18 (9.1%) |
| $150,000 or more | 0 (0.0%) | 16 (8.1%) |
| Total | 94 (100.0%) | 198 (100.0%) |
Property Value to Household Income Ratio in Pine Lawn
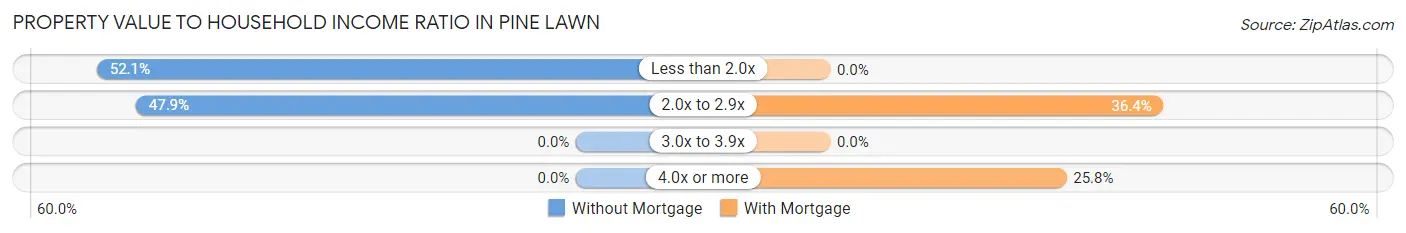
| Value-to-Income Ratio | Without Mortgage | With Mortgage |
| Less than 2.0x | 49 (52.1%) | 0 (0.0%) |
| 2.0x to 2.9x | 45 (47.9%) | 72 (36.4%) |
| 3.0x to 3.9x | 0 (0.0%) | 0 (0.0%) |
| 4.0x or more | 0 (0.0%) | 51 (25.8%) |
| Total | 94 (100.0%) | 198 (100.0%) |
Real Estate Taxes by Mortgage Status in Pine Lawn
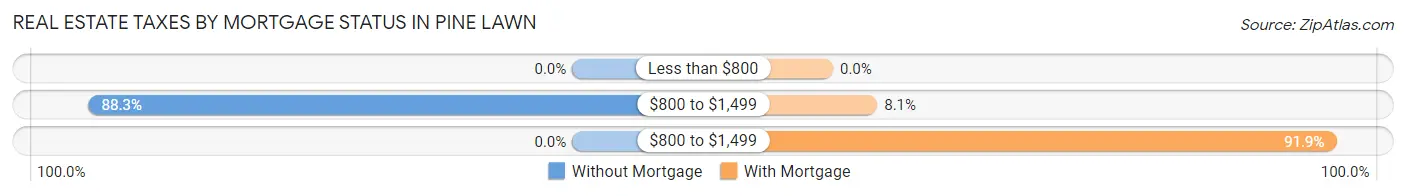
| Property Taxes | Without Mortgage | With Mortgage |
| Less than $800 | 0 (0.0%) | 0 (0.0%) |
| $800 to $1,499 | 83 (88.3%) | 16 (8.1%) |
| $800 to $1,499 | 0 (0.0%) | 182 (91.9%) |
| Total | 94 (100.0%) | 198 (100.0%) |
Health & Disability in Pine Lawn
Health Insurance Coverage by Age in Pine Lawn
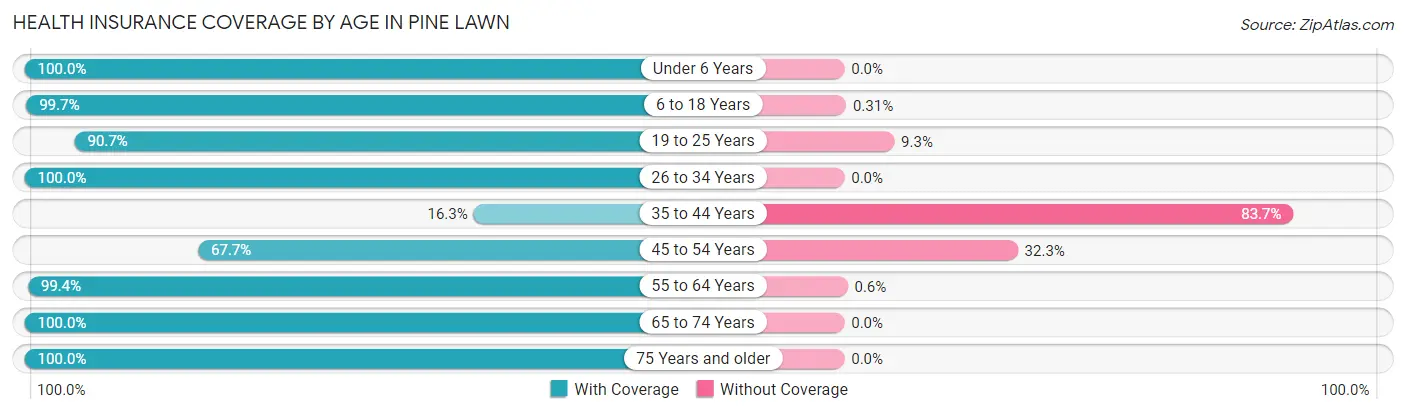
| Age Bracket | With Coverage | Without Coverage |
| Under 6 Years | 570 (100.0%) | 0 (0.0%) |
| 6 to 18 Years | 645 (99.7%) | 2 (0.3%) |
| 19 to 25 Years | 156 (90.7%) | 16 (9.3%) |
| 26 to 34 Years | 218 (100.0%) | 0 (0.0%) |
| 35 to 44 Years | 49 (16.3%) | 252 (83.7%) |
| 45 to 54 Years | 157 (67.7%) | 75 (32.3%) |
| 55 to 64 Years | 333 (99.4%) | 2 (0.6%) |
| 65 to 74 Years | 226 (100.0%) | 0 (0.0%) |
| 75 Years and older | 71 (100.0%) | 0 (0.0%) |
| Total | 2,425 (87.5%) | 347 (12.5%) |
Health Insurance Coverage by Citizenship Status in Pine Lawn
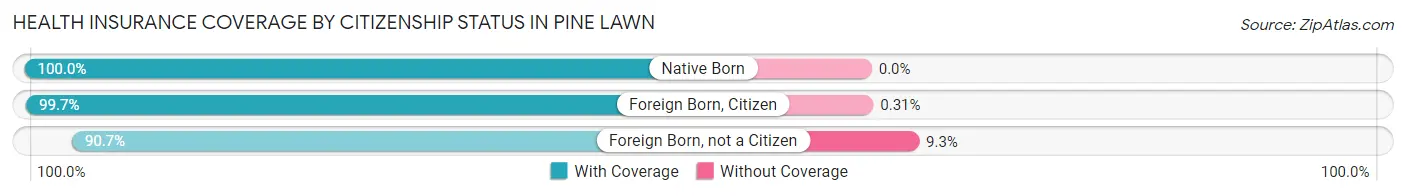
| Citizenship Status | With Coverage | Without Coverage |
| Native Born | 570 (100.0%) | 0 (0.0%) |
| Foreign Born, Citizen | 645 (99.7%) | 2 (0.3%) |
| Foreign Born, not a Citizen | 156 (90.7%) | 16 (9.3%) |
Health Insurance Coverage by Household Income in Pine Lawn
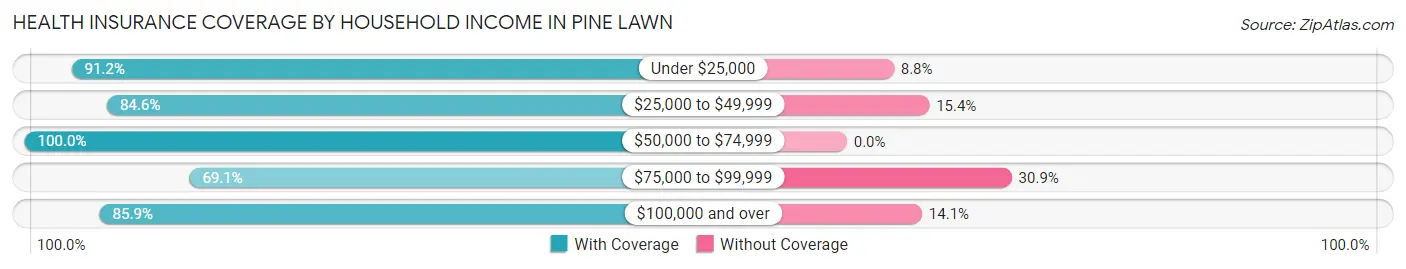
| Household Income | With Coverage | Without Coverage |
| Under $25,000 | 922 (91.2%) | 89 (8.8%) |
| $25,000 to $49,999 | 1,068 (84.6%) | 195 (15.4%) |
| $50,000 to $74,999 | 225 (100.0%) | 0 (0.0%) |
| $75,000 to $99,999 | 85 (69.1%) | 38 (30.9%) |
| $100,000 and over | 116 (85.9%) | 19 (14.1%) |
Public vs Private Health Insurance Coverage by Age in Pine Lawn
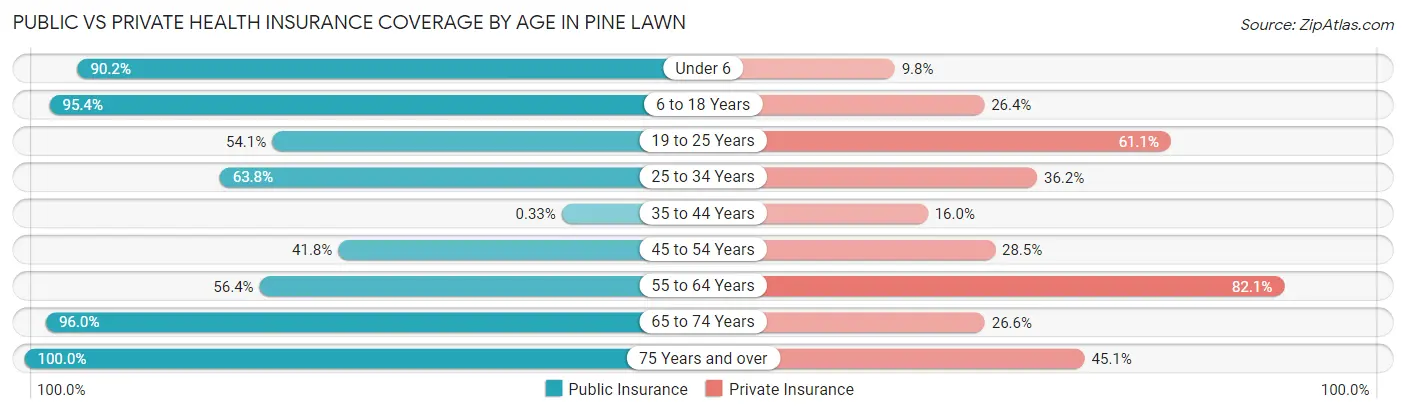
| Age Bracket | Public Insurance | Private Insurance |
| Under 6 | 514 (90.2%) | 56 (9.8%) |
| 6 to 18 Years | 617 (95.4%) | 171 (26.4%) |
| 19 to 25 Years | 93 (54.1%) | 105 (61.1%) |
| 25 to 34 Years | 139 (63.8%) | 79 (36.2%) |
| 35 to 44 Years | 1 (0.3%) | 48 (16.0%) |
| 45 to 54 Years | 97 (41.8%) | 66 (28.4%) |
| 55 to 64 Years | 189 (56.4%) | 275 (82.1%) |
| 65 to 74 Years | 217 (96.0%) | 60 (26.6%) |
| 75 Years and over | 71 (100.0%) | 32 (45.1%) |
| Total | 1,938 (69.9%) | 892 (32.2%) |
Disability Status by Sex by Age in Pine Lawn
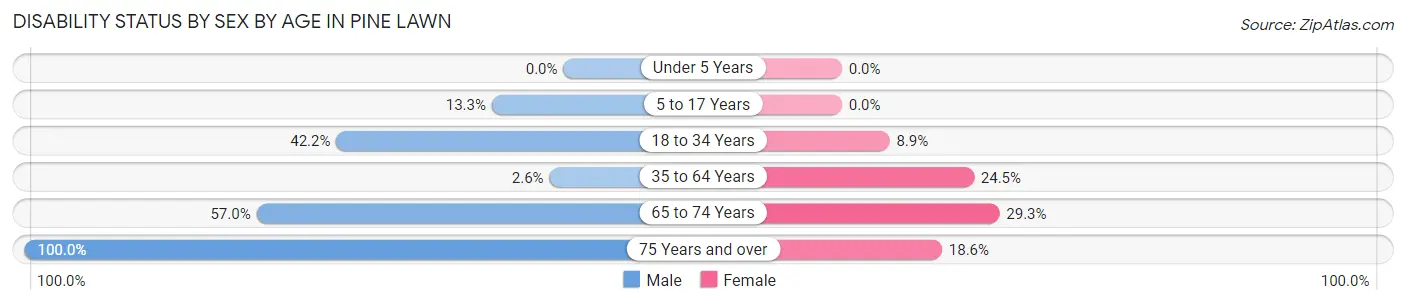
| Age Bracket | Male | Female |
| Under 5 Years | 0 (0.0%) | 0 (0.0%) |
| 5 to 17 Years | 76 (13.3%) | 0 (0.0%) |
| 18 to 34 Years | 94 (42.1%) | 20 (8.8%) |
| 35 to 64 Years | 8 (2.6%) | 137 (24.5%) |
| 65 to 74 Years | 45 (57.0%) | 43 (29.2%) |
| 75 Years and over | 1 (100.0%) | 13 (18.6%) |
Disability Class by Sex by Age in Pine Lawn
Disability Class: Hearing Difficulty
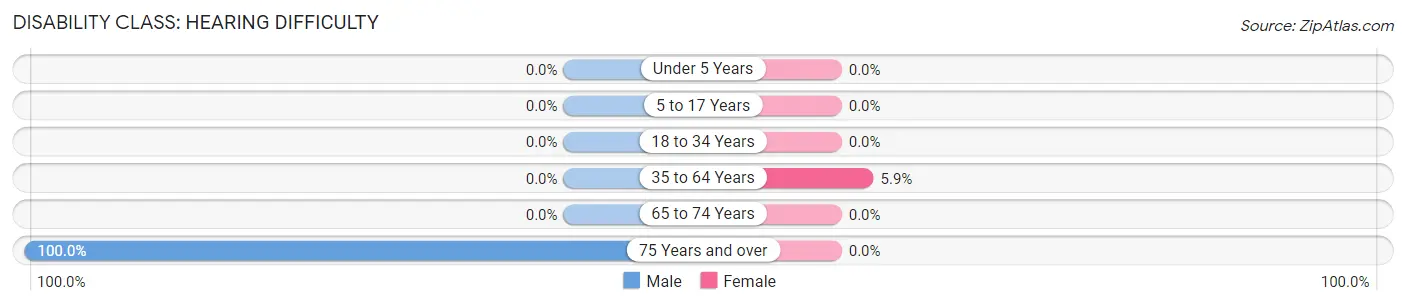
| Age Bracket | Male | Female |
| Under 5 Years | 0 (0.0%) | 0 (0.0%) |
| 5 to 17 Years | 0 (0.0%) | 0 (0.0%) |
| 18 to 34 Years | 0 (0.0%) | 0 (0.0%) |
| 35 to 64 Years | 0 (0.0%) | 33 (5.9%) |
| 65 to 74 Years | 0 (0.0%) | 0 (0.0%) |
| 75 Years and over | 1 (100.0%) | 0 (0.0%) |
Disability Class: Vision Difficulty
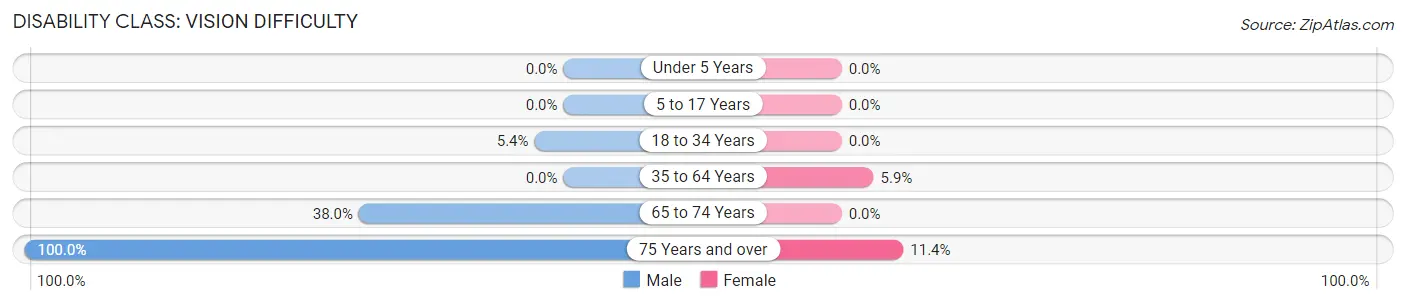
| Age Bracket | Male | Female |
| Under 5 Years | 0 (0.0%) | 0 (0.0%) |
| 5 to 17 Years | 0 (0.0%) | 0 (0.0%) |
| 18 to 34 Years | 12 (5.4%) | 0 (0.0%) |
| 35 to 64 Years | 0 (0.0%) | 33 (5.9%) |
| 65 to 74 Years | 30 (38.0%) | 0 (0.0%) |
| 75 Years and over | 1 (100.0%) | 8 (11.4%) |
Disability Class: Cognitive Difficulty
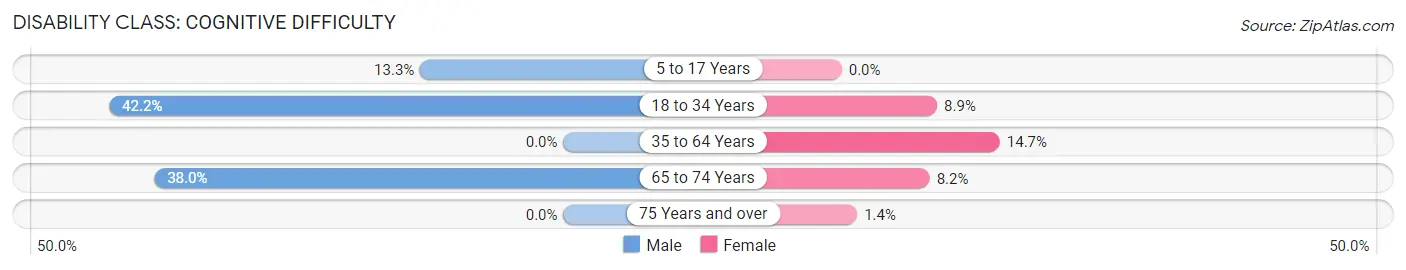
| Age Bracket | Male | Female |
| 5 to 17 Years | 76 (13.3%) | 0 (0.0%) |
| 18 to 34 Years | 94 (42.1%) | 20 (8.8%) |
| 35 to 64 Years | 0 (0.0%) | 82 (14.7%) |
| 65 to 74 Years | 30 (38.0%) | 12 (8.2%) |
| 75 Years and over | 0 (0.0%) | 1 (1.4%) |
Disability Class: Ambulatory Difficulty
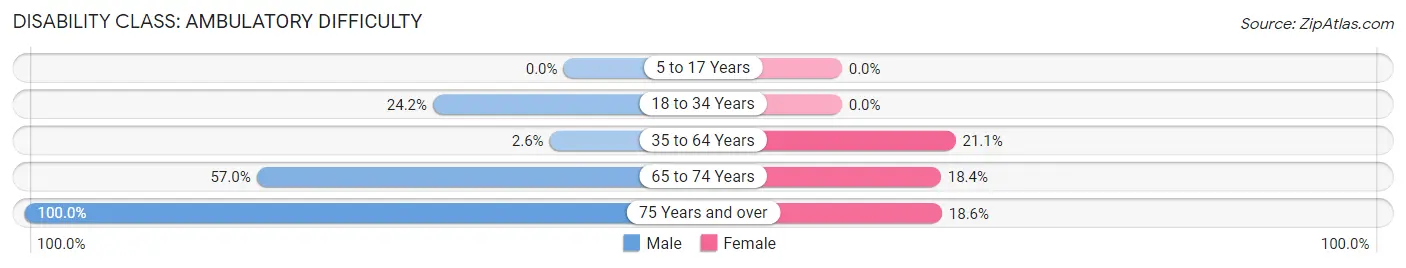
| Age Bracket | Male | Female |
| 5 to 17 Years | 0 (0.0%) | 0 (0.0%) |
| 18 to 34 Years | 54 (24.2%) | 0 (0.0%) |
| 35 to 64 Years | 8 (2.6%) | 118 (21.1%) |
| 65 to 74 Years | 45 (57.0%) | 27 (18.4%) |
| 75 Years and over | 1 (100.0%) | 13 (18.6%) |
Disability Class: Self-Care Difficulty
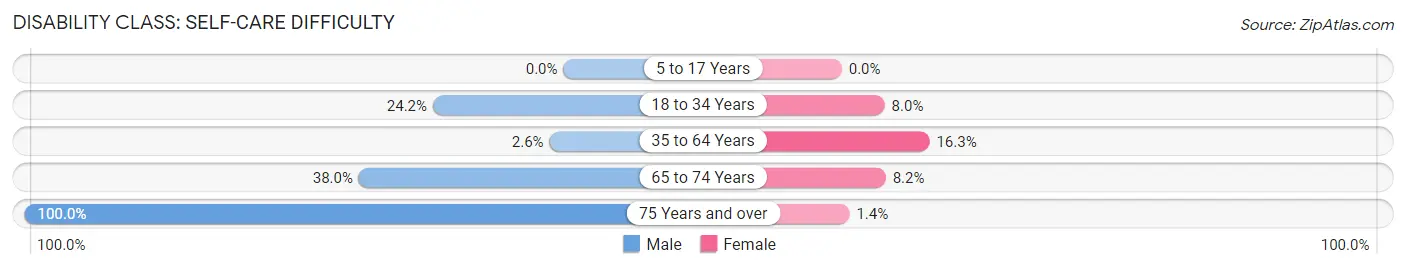
| Age Bracket | Male | Female |
| 5 to 17 Years | 0 (0.0%) | 0 (0.0%) |
| 18 to 34 Years | 54 (24.2%) | 18 (8.0%) |
| 35 to 64 Years | 8 (2.6%) | 91 (16.3%) |
| 65 to 74 Years | 30 (38.0%) | 12 (8.2%) |
| 75 Years and over | 1 (100.0%) | 1 (1.4%) |
Technology Access in Pine Lawn
Computing Device Access in Pine Lawn
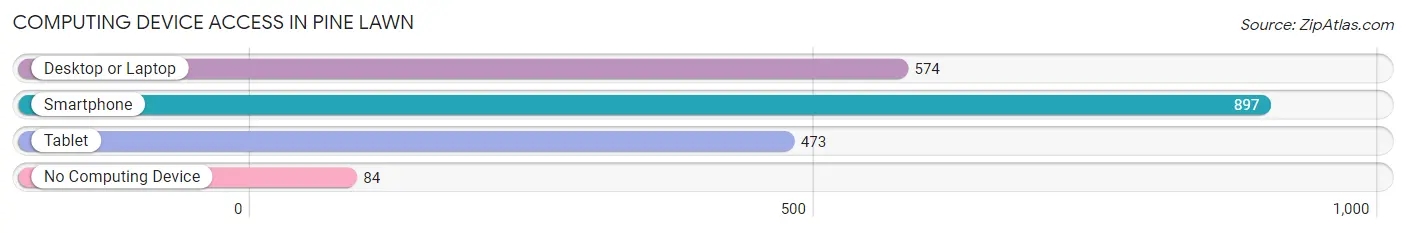
| Device Type | # Households | % Households |
| Desktop or Laptop | 574 | 54.4% |
| Smartphone | 897 | 84.9% |
| Tablet | 473 | 44.8% |
| No Computing Device | 84 | 8.0% |
| Total | 1,056 | 100.0% |
Internet Access in Pine Lawn
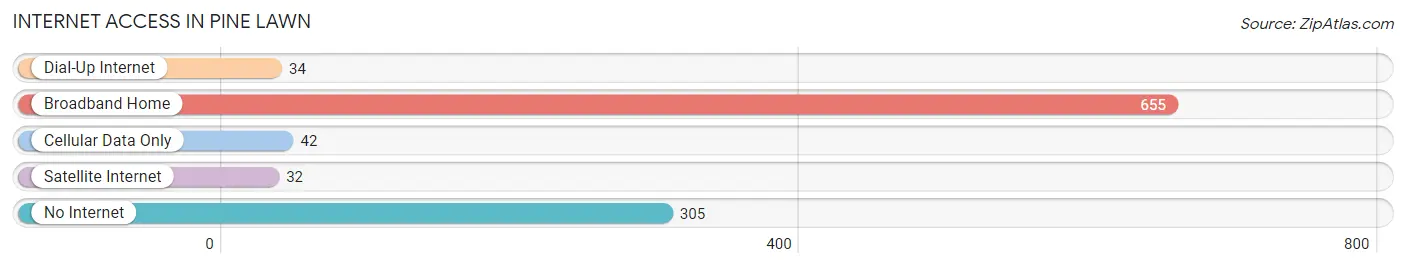
| Internet Type | # Households | % Households |
| Dial-Up Internet | 34 | 3.2% |
| Broadband Home | 655 | 62.0% |
| Cellular Data Only | 42 | 4.0% |
| Satellite Internet | 32 | 3.0% |
| No Internet | 305 | 28.9% |
| Total | 1,056 | 100.0% |
Pine Lawn Summary
Pine Lawn, Missouri is a small city located in St. Louis County, Missouri. It is a suburb of St. Louis and is located just north of the city. The population of Pine Lawn was 4,541 at the 2010 census.
History
Pine Lawn was founded in the early 1900s as a small farming community. The city was named after the pine trees that grew in the area. The city was incorporated in 1945.
In the 1950s, Pine Lawn began to experience rapid growth due to its proximity to St. Louis. The city was annexed by St. Louis County in 1959.
Geography
Pine Lawn is located in St. Louis County, Missouri. It is situated just north of St. Louis and is bordered by the cities of Ferguson, Dellwood, and Jennings. The city has a total area of 1.2 square miles, all of which is land.
The city is located in the Missouri River Valley and is surrounded by rolling hills. The city is located in the Central Lowland region of the United States.
Economy
Pine Lawn has a diverse economy. The city is home to a variety of businesses, including retail stores, restaurants, and professional services. The city is also home to a number of manufacturing companies, including a steel mill and a plastics factory.
The city is also home to a number of government offices, including the St. Louis County Courthouse and the St. Louis County Police Department.
Demographics
As of the 2010 census, the population of Pine Lawn was 4,541. The racial makeup of the city was 79.3% African American, 15.2% White, 0.3% Native American, 0.7% Asian, 0.1% Pacific Islander, and 4.4% from other races.
The median household income in Pine Lawn was $25,972, and the median family income was $31,944. The per capita income was $14,945. About 24.3% of the population was below the poverty line.
Conclusion
Pine Lawn, Missouri is a small city located in St. Louis County, Missouri. It is a suburb of St. Louis and is located just north of the city. The city was founded in the early 1900s as a small farming community and was incorporated in 1945. The city has a diverse economy and a population of 4,541 as of the 2010 census. The racial makeup of the city is 79.3% African American, 15.2% White, 0.3% Native American, 0.7% Asian, 0.1% Pacific Islander, and 4.4% from other races. The median household income in Pine Lawn was $25,972, and the median family income was $31,944. About 24.3% of the population was below the poverty line.
Common Questions
What is Per Capita Income in Pine Lawn?
Per Capita income in Pine Lawn is $11,805.
What is the Median Family Income in Pine Lawn?
Median Family Income in Pine Lawn is $26,572.
What is the Median Household income in Pine Lawn?
Median Household Income in Pine Lawn is $25,164.
What is Income or Wage Gap in Pine Lawn?
Income or Wage Gap in Pine Lawn is 17.8%.
Women in Pine Lawn earn 82.2 cents for every dollar earned by a man.
What is Inequality or Gini Index in Pine Lawn?
Inequality or Gini Index in Pine Lawn is 0.42.
What is the Total Population of Pine Lawn?
Total Population of Pine Lawn is 2,772.
What is the Total Male Population of Pine Lawn?
Total Male Population of Pine Lawn is 1,249.
What is the Total Female Population of Pine Lawn?
Total Female Population of Pine Lawn is 1,523.
What is the Ratio of Males per 100 Females in Pine Lawn?
There are 82.01 Males per 100 Females in Pine Lawn.
What is the Ratio of Females per 100 Males in Pine Lawn?
There are 121.94 Females per 100 Males in Pine Lawn.
What is the Median Population Age in Pine Lawn?
Median Population Age in Pine Lawn is 25.9 Years.
What is the Average Family Size in Pine Lawn
Average Family Size in Pine Lawn is 3.7 People.
What is the Average Household Size in Pine Lawn
Average Household Size in Pine Lawn is 2.6 People.
How Large is the Labor Force in Pine Lawn?
There are 973 People in the Labor Forcein in Pine Lawn.
What is the Percentage of People in the Labor Force in Pine Lawn?
60.3% of People are in the Labor Force in Pine Lawn.
What is the Unemployment Rate in Pine Lawn?
Unemployment Rate in Pine Lawn is 16.2%.