St John, MO Map & Demographics
St John Map
St John Overview
$32,021
PER CAPITA INCOME
$59,268
AVG FAMILY INCOME
$52,000
AVG HOUSEHOLD INCOME
3.7%
WAGE / INCOME GAP [ % ]
96.3¢/ $1
WAGE / INCOME GAP [ $ ]
0.46
INEQUALITY / GINI INDEX
6,583
TOTAL POPULATION
3,326
MALE POPULATION
3,257
FEMALE POPULATION
102.12
MALES / 100 FEMALES
97.93
FEMALES / 100 MALES
39.6
MEDIAN AGE
2.7
AVG FAMILY SIZE
2.3
AVG HOUSEHOLD SIZE
3,684
LABOR FORCE [ PEOPLE ]
68.2%
PERCENT IN LABOR FORCE
6.0%
UNEMPLOYMENT RATE
Income in St John
Income Overview in St John
Per Capita Income in St John is $32,021, while median incomes of families and households are $59,268 and $52,000 respectively.
| Characteristic | Number | Measure |
| Per Capita Income | 6,583 | $32,021 |
| Median Family Income | 1,841 | $59,268 |
| Mean Family Income | 1,841 | $70,825 |
| Median Household Income | 2,820 | $52,000 |
| Mean Household Income | 2,820 | $72,779 |
| Income Deficit | 1,841 | $0 |
| Wage / Income Gap (%) | 6,583 | 3.70% |
| Wage / Income Gap ($) | 6,583 | 96.30¢ per $1 |
| Gini / Inequality Index | 6,583 | 0.46 |
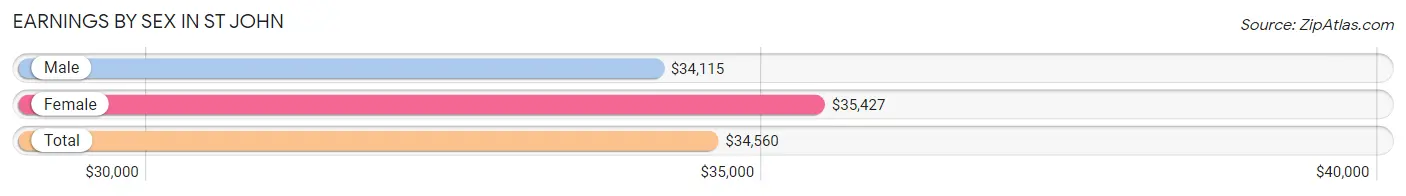
Earnings by Sex in St John
Average Earnings in St John are $34,560, $34,115 for men and $35,427 for women, a difference of 3.7%.
| Sex | Number | Average Earnings |
| Male | 2,207 (56.6%) | $34,115 |
| Female | 1,691 (43.4%) | $35,427 |
| Total | 3,898 (100.0%) | $34,560 |
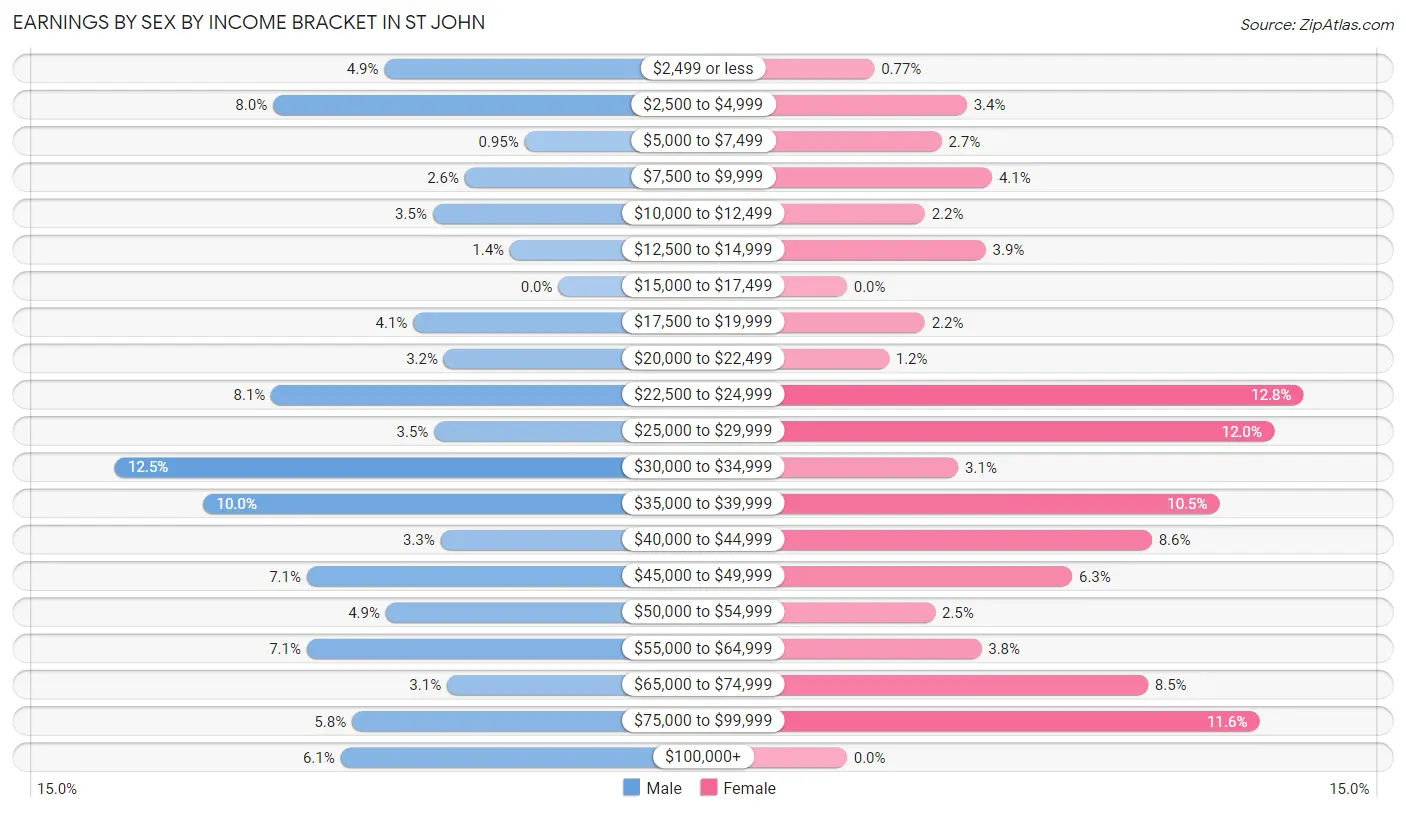
Earnings by Sex by Income Bracket in St John
The most common earnings brackets in St John are $30,000 to $34,999 for men (275 | 12.5%) and $22,500 to $24,999 for women (217 | 12.8%).
| Income | Male | Female |
| $2,499 or less | 108 (4.9%) | 13 (0.8%) |
| $2,500 to $4,999 | 177 (8.0%) | 57 (3.4%) |
| $5,000 to $7,499 | 21 (0.9%) | 45 (2.7%) |
| $7,500 to $9,999 | 58 (2.6%) | 69 (4.1%) |
| $10,000 to $12,499 | 78 (3.5%) | 37 (2.2%) |
| $12,500 to $14,999 | 30 (1.4%) | 66 (3.9%) |
| $15,000 to $17,499 | 0 (0.0%) | 0 (0.0%) |
| $17,500 to $19,999 | 90 (4.1%) | 37 (2.2%) |
| $20,000 to $22,499 | 71 (3.2%) | 20 (1.2%) |
| $22,500 to $24,999 | 178 (8.1%) | 217 (12.8%) |
| $25,000 to $29,999 | 77 (3.5%) | 203 (12.0%) |
| $30,000 to $34,999 | 275 (12.5%) | 53 (3.1%) |
| $35,000 to $39,999 | 220 (10.0%) | 177 (10.5%) |
| $40,000 to $44,999 | 73 (3.3%) | 145 (8.6%) |
| $45,000 to $49,999 | 156 (7.1%) | 107 (6.3%) |
| $50,000 to $54,999 | 107 (4.9%) | 42 (2.5%) |
| $55,000 to $64,999 | 156 (7.1%) | 64 (3.8%) |
| $65,000 to $74,999 | 69 (3.1%) | 143 (8.5%) |
| $75,000 to $99,999 | 128 (5.8%) | 196 (11.6%) |
| $100,000+ | 135 (6.1%) | 0 (0.0%) |
| Total | 2,207 (100.0%) | 1,691 (100.0%) |
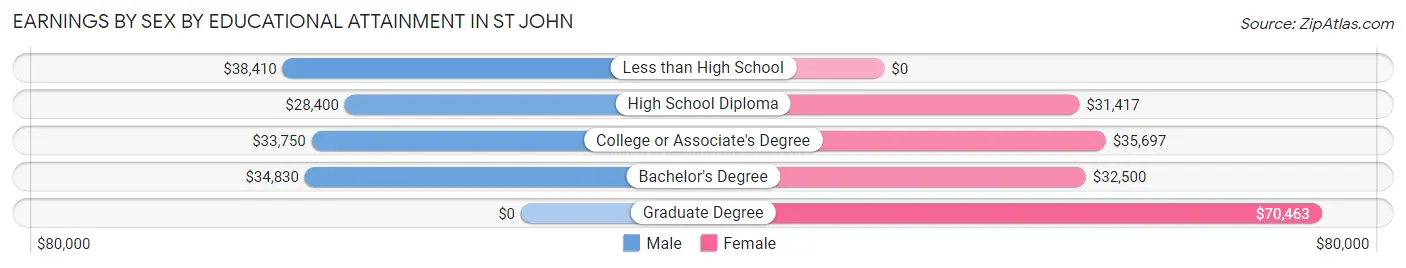
Earnings by Sex by Educational Attainment in St John
Average earnings in St John are $37,660 for men and $36,194 for women, a difference of 3.9%. Men with an educational attainment of less than high school enjoy the highest average annual earnings of $38,410, while those with high school diploma education earn the least with $28,400. Women with an educational attainment of graduate degree earn the most with the average annual earnings of $70,463, while those with high school diploma education have the smallest earnings of $31,417.
| Educational Attainment | Male Income | Female Income |
| Less than High School | $38,410 | $0 |
| High School Diploma | $28,400 | $31,417 |
| College or Associate's Degree | $33,750 | $35,697 |
| Bachelor's Degree | $34,830 | $32,500 |
| Graduate Degree | - | - |
| Total | $37,660 | $36,194 |
Family Income in St John
Family Income Brackets in St John
According to the St John family income data, there are 425 families falling into the $35,000 to $49,999 income range, which is the most common income bracket and makes up 23.1% of all families.
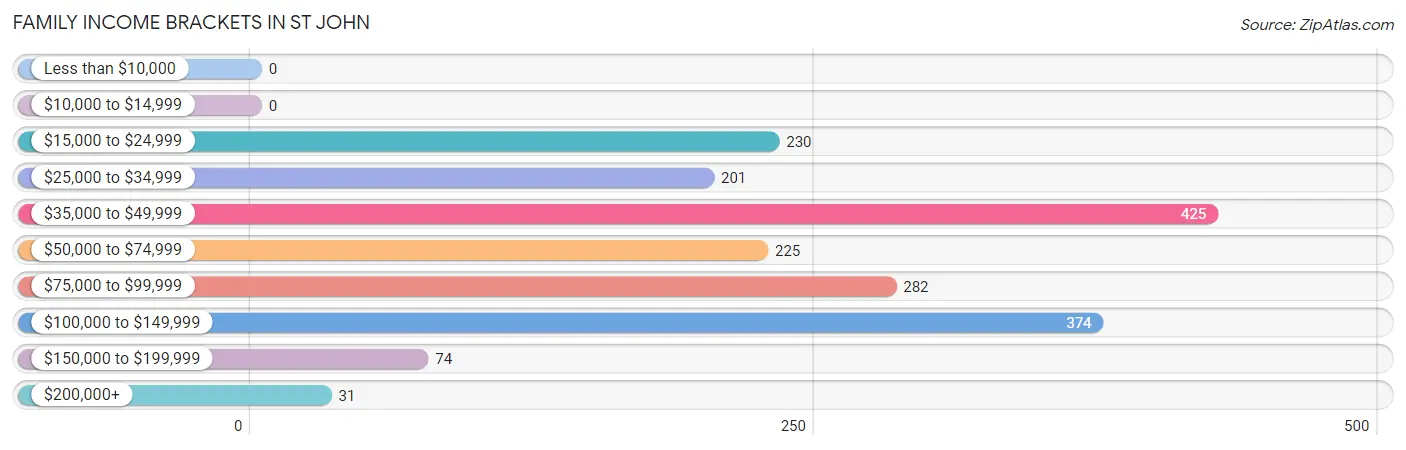
| Income Bracket | # Families | % Families |
| Less than $10,000 | 0 | 0.0% |
| $10,000 to $14,999 | 0 | 0.0% |
| $15,000 to $24,999 | 230 | 12.5% |
| $25,000 to $34,999 | 201 | 10.9% |
| $35,000 to $49,999 | 425 | 23.1% |
| $50,000 to $74,999 | 225 | 12.2% |
| $75,000 to $99,999 | 282 | 15.3% |
| $100,000 to $149,999 | 374 | 20.3% |
| $150,000 to $199,999 | 74 | 4.0% |
| $200,000+ | 31 | 1.7% |
Family Income by Famaliy Size in St John
4-person families (143 | 7.8%) account for the highest median family income in St John with $106,144 per family, while 2-person families (970 | 52.7%) have the highest median income of $34,966 per family member.
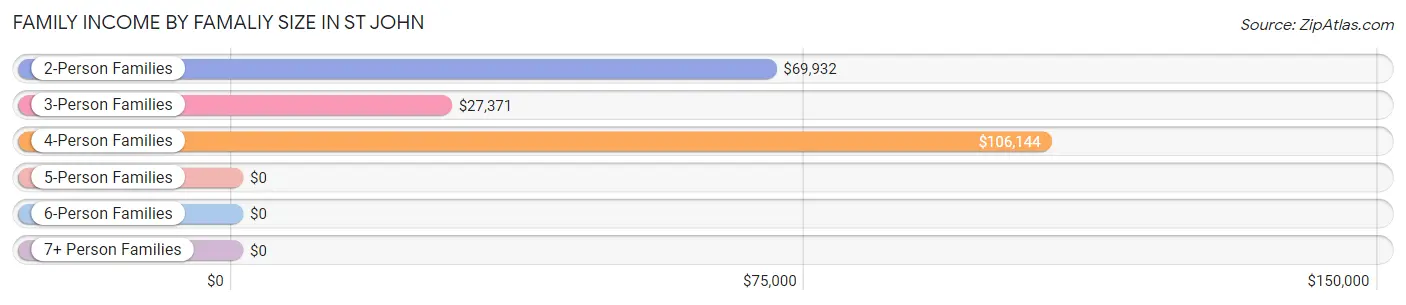
| Income Bracket | # Families | Median Income |
| 2-Person Families | 970 (52.7%) | $69,932 |
| 3-Person Families | 589 (32.0%) | $27,371 |
| 4-Person Families | 143 (7.8%) | $106,144 |
| 5-Person Families | 120 (6.5%) | $0 |
| 6-Person Families | 19 (1.0%) | $0 |
| 7+ Person Families | 0 (0.0%) | $0 |
| Total | 1,841 (100.0%) | $59,268 |
Family Income by Number of Earners in St John
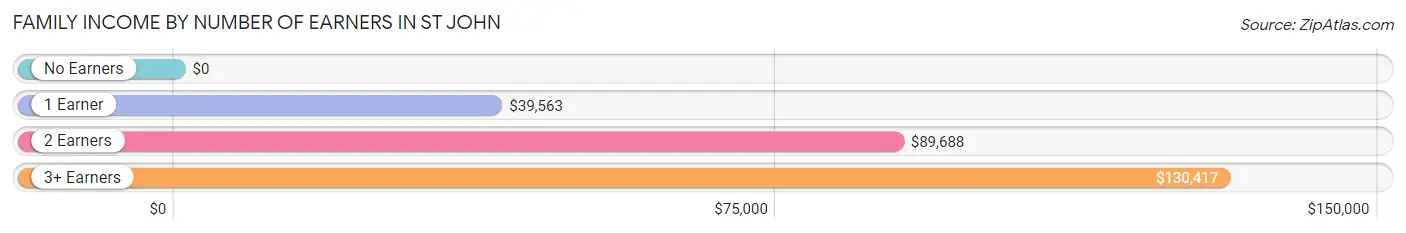
| Number of Earners | # Families | Median Income |
| No Earners | 156 (8.5%) | $0 |
| 1 Earner | 849 (46.1%) | $39,563 |
| 2 Earners | 752 (40.8%) | $89,688 |
| 3+ Earners | 84 (4.6%) | $130,417 |
| Total | 1,841 (100.0%) | $59,268 |
Household Income in St John
Household Income Brackets in St John
With 550 households falling in the category, the $35,000 to $49,999 income range is the most frequent in St John, accounting for 19.5% of all households. In contrast, only 56 households (2.0%) fall into the $200,000+ income bracket, making it the least populous group.
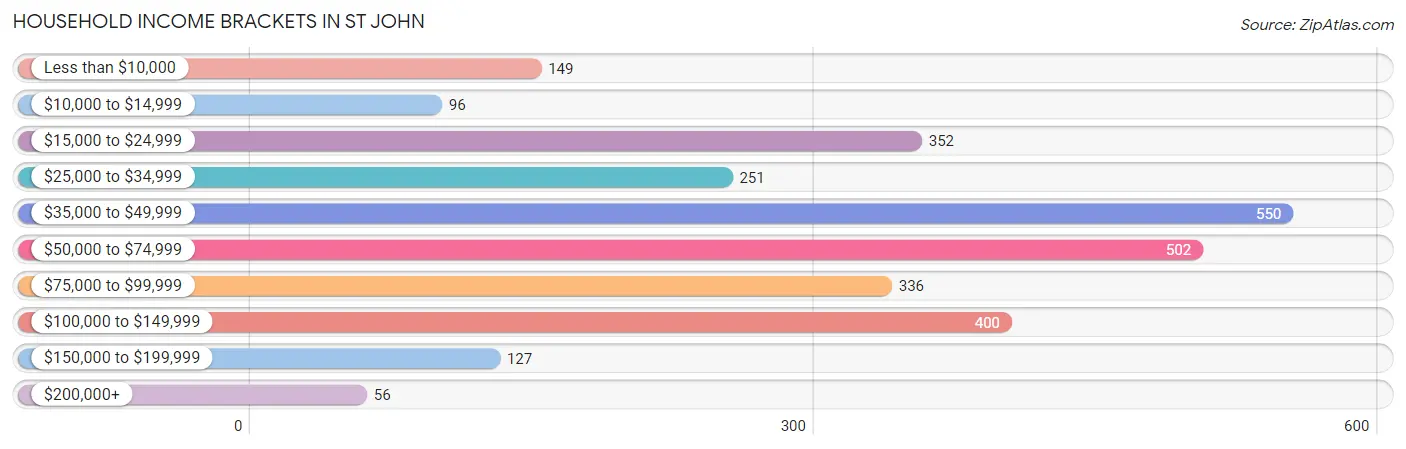
| Income Bracket | # Households | % Households |
| Less than $10,000 | 149 | 5.3% |
| $10,000 to $14,999 | 96 | 3.4% |
| $15,000 to $24,999 | 352 | 12.5% |
| $25,000 to $34,999 | 251 | 8.9% |
| $35,000 to $49,999 | 550 | 19.5% |
| $50,000 to $74,999 | 502 | 17.8% |
| $75,000 to $99,999 | 336 | 11.9% |
| $100,000 to $149,999 | 400 | 14.2% |
| $150,000 to $199,999 | 127 | 4.5% |
| $200,000+ | 56 | 2.0% |
Household Income by Householder Age in St John
The median household income in St John is $52,000, with the highest median household income of $61,346 found in the 45 to 64 years age bracket for the primary householder. A total of 1,148 households (40.7%) fall into this category. Meanwhile, the 65+ years age bracket for the primary householder has the lowest median household income of $28,826, with 604 households (21.4%) in this group.
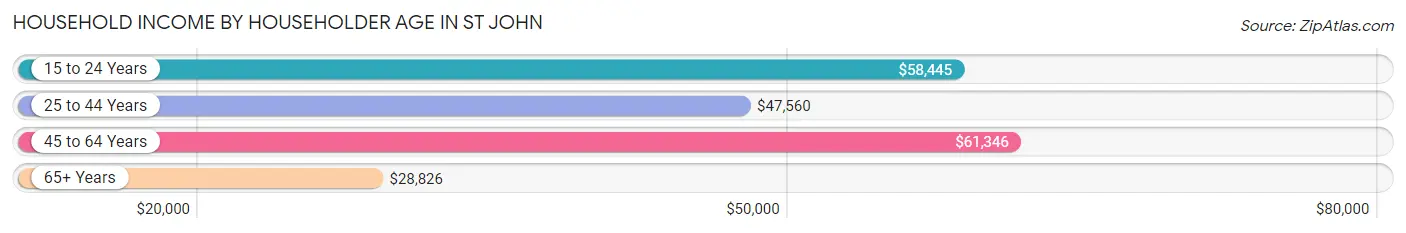
| Income Bracket | # Households | Median Income |
| 15 to 24 Years | 75 (2.7%) | $58,445 |
| 25 to 44 Years | 993 (35.2%) | $47,560 |
| 45 to 64 Years | 1,148 (40.7%) | $61,346 |
| 65+ Years | 604 (21.4%) | $28,826 |
| Total | 2,820 (100.0%) | $52,000 |
Poverty in St John
Income Below Poverty by Sex and Age in St John
With 8.4% poverty level for males and 19.0% for females among the residents of St John, 16 and 17 year old males and under 5 year old females are the most vulnerable to poverty, with 12 males (100.0%) and 64 females (39.5%) in their respective age groups living below the poverty level.
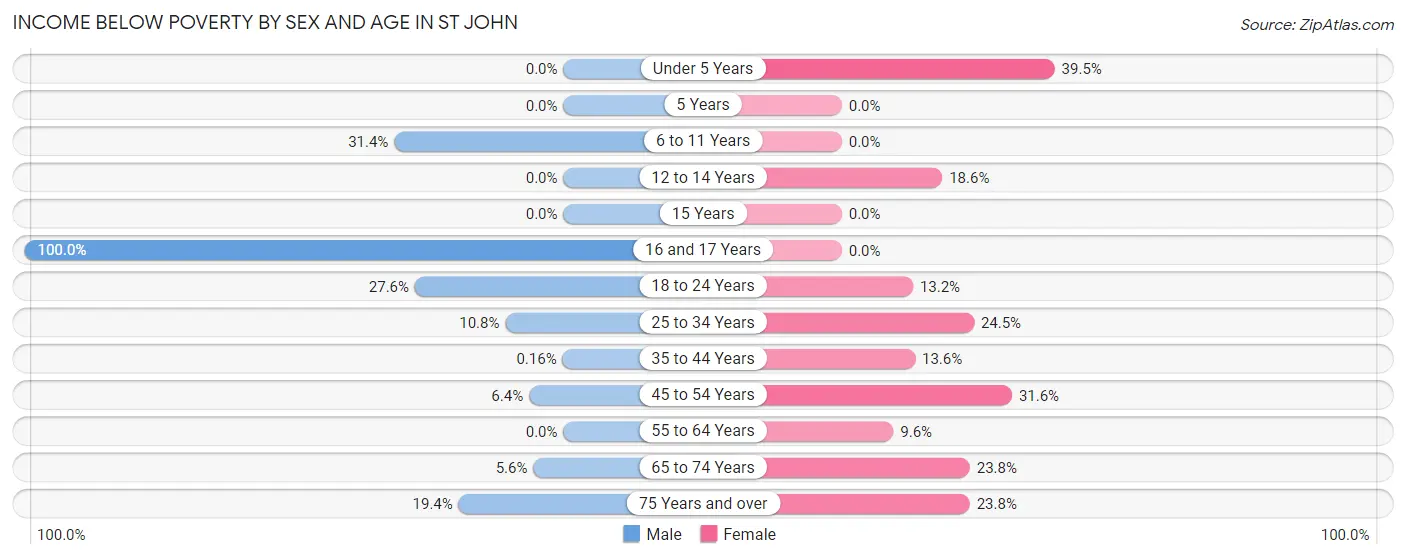
| Age Bracket | Male | Female |
| Under 5 Years | 0 (0.0%) | 64 (39.5%) |
| 5 Years | 0 (0.0%) | 0 (0.0%) |
| 6 to 11 Years | 54 (31.4%) | 0 (0.0%) |
| 12 to 14 Years | 0 (0.0%) | 41 (18.6%) |
| 15 Years | 0 (0.0%) | 0 (0.0%) |
| 16 and 17 Years | 12 (100.0%) | 0 (0.0%) |
| 18 to 24 Years | 78 (27.6%) | 21 (13.2%) |
| 25 to 34 Years | 58 (10.8%) | 131 (24.5%) |
| 35 to 44 Years | 1 (0.2%) | 68 (13.6%) |
| 45 to 54 Years | 24 (6.4%) | 150 (31.6%) |
| 55 to 64 Years | 0 (0.0%) | 47 (9.6%) |
| 65 to 74 Years | 26 (5.6%) | 72 (23.8%) |
| 75 Years and over | 21 (19.4%) | 19 (23.7%) |
| Total | 274 (8.4%) | 613 (19.0%) |
Income Above Poverty by Sex and Age in St John
According to the poverty statistics in St John, males aged under 5 years and females aged 5 years are the age groups that are most secure financially, with 100.0% of males and 100.0% of females in these age groups living above the poverty line.
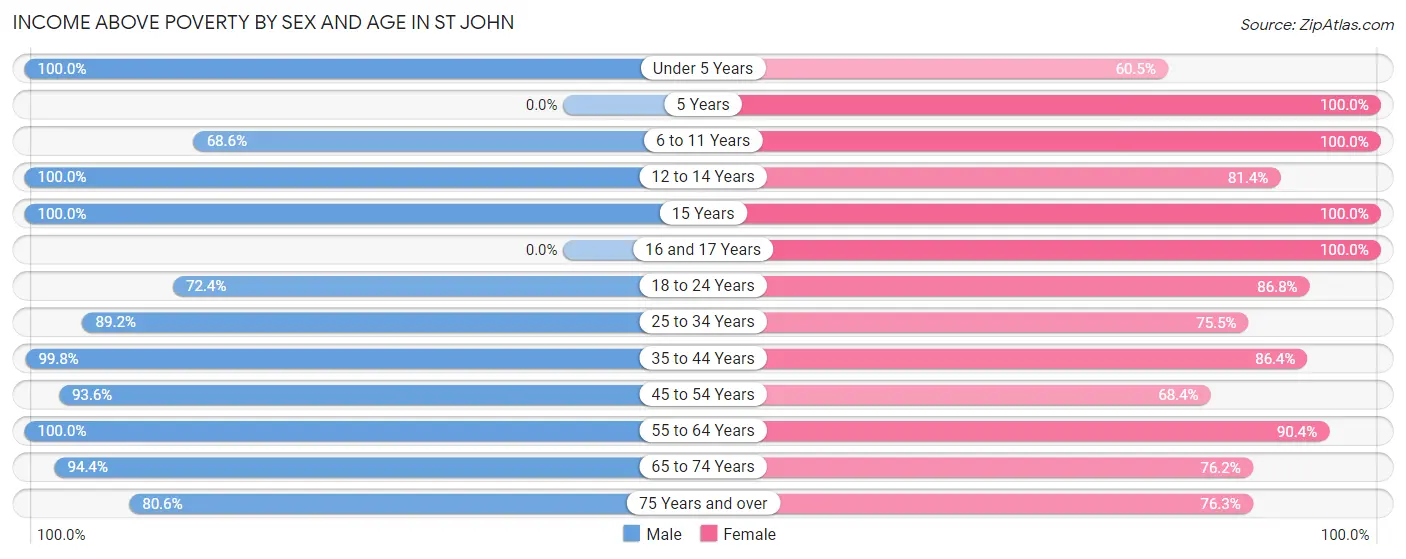
| Age Bracket | Male | Female |
| Under 5 Years | 155 (100.0%) | 98 (60.5%) |
| 5 Years | 0 (0.0%) | 9 (100.0%) |
| 6 to 11 Years | 118 (68.6%) | 247 (100.0%) |
| 12 to 14 Years | 152 (100.0%) | 179 (81.4%) |
| 15 Years | 23 (100.0%) | 20 (100.0%) |
| 16 and 17 Years | 0 (0.0%) | 22 (100.0%) |
| 18 to 24 Years | 205 (72.4%) | 138 (86.8%) |
| 25 to 34 Years | 480 (89.2%) | 403 (75.5%) |
| 35 to 44 Years | 621 (99.8%) | 432 (86.4%) |
| 45 to 54 Years | 352 (93.6%) | 325 (68.4%) |
| 55 to 64 Years | 367 (100.0%) | 444 (90.4%) |
| 65 to 74 Years | 440 (94.4%) | 231 (76.2%) |
| 75 Years and over | 87 (80.6%) | 61 (76.2%) |
| Total | 3,000 (91.6%) | 2,609 (81.0%) |
Income Below Poverty Among Married-Couple Families in St John
The poverty statistics for married-couple families in St John show that 2.6% or 32 of the total 1,216 families live below the poverty line. Families with 1 or 2 children have the highest poverty rate of 3.6%, comprising of 11 families. On the other hand, families with 3 or 4 children have the lowest poverty rate of 0.0%, which includes 0 families.
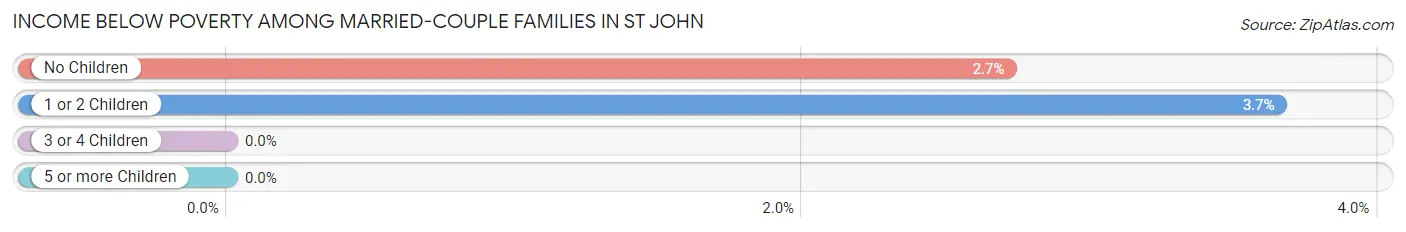
| Children | Above Poverty | Below Poverty |
| No Children | 755 (97.3%) | 21 (2.7%) |
| 1 or 2 Children | 290 (96.4%) | 11 (3.6%) |
| 3 or 4 Children | 139 (100.0%) | 0 (0.0%) |
| 5 or more Children | 0 (0.0%) | 0 (0.0%) |
| Total | 1,184 (97.4%) | 32 (2.6%) |
Income Below Poverty Among Single-Parent Households in St John
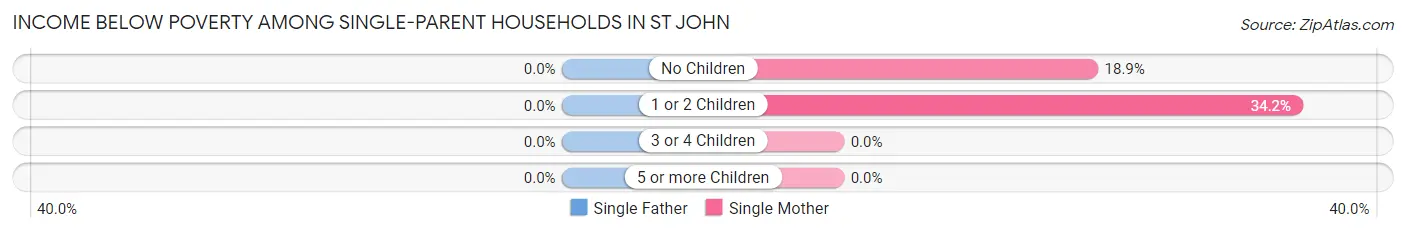
| Children | Single Father | Single Mother |
| No Children | 0 (0.0%) | 35 (18.9%) |
| 1 or 2 Children | 0 (0.0%) | 78 (34.2%) |
| 3 or 4 Children | 0 (0.0%) | 0 (0.0%) |
| 5 or more Children | 0 (0.0%) | 0 (0.0%) |
| Total | 0 (0.0%) | 113 (27.4%) |
Income Below Poverty Among Married-Couple vs Single-Parent Households in St John
The poverty data for St John shows that 32 of the married-couple family households (2.6%) and 113 of the single-parent households (18.1%) are living below the poverty level. Within the married-couple family households, those with 1 or 2 children have the highest poverty rate, with 11 households (3.6%) falling below the poverty line. Among the single-parent households, those with 1 or 2 children have the highest poverty rate, with 78 household (22.7%) living below poverty.
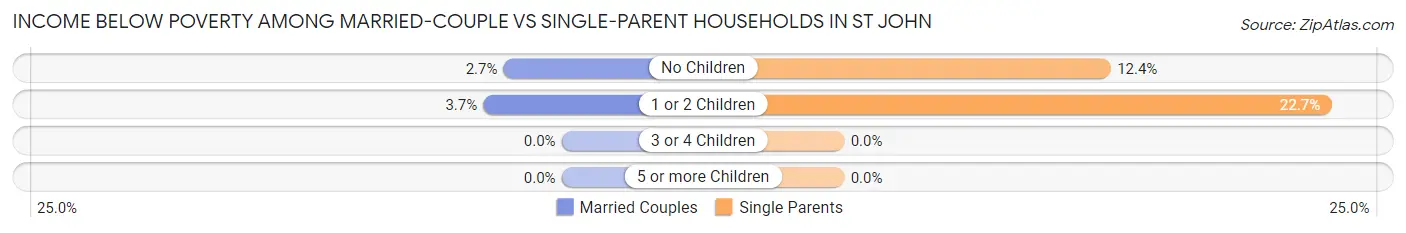
| Children | Married-Couple Families | Single-Parent Households |
| No Children | 21 (2.7%) | 35 (12.4%) |
| 1 or 2 Children | 11 (3.6%) | 78 (22.7%) |
| 3 or 4 Children | 0 (0.0%) | 0 (0.0%) |
| 5 or more Children | 0 (0.0%) | 0 (0.0%) |
| Total | 32 (2.6%) | 113 (18.1%) |
Race in St John
The most populous races in St John are White / Caucasian (3,032 | 46.1%), Black / African American (2,552 | 38.8%), and Hispanic or Latino (723 | 11.0%).
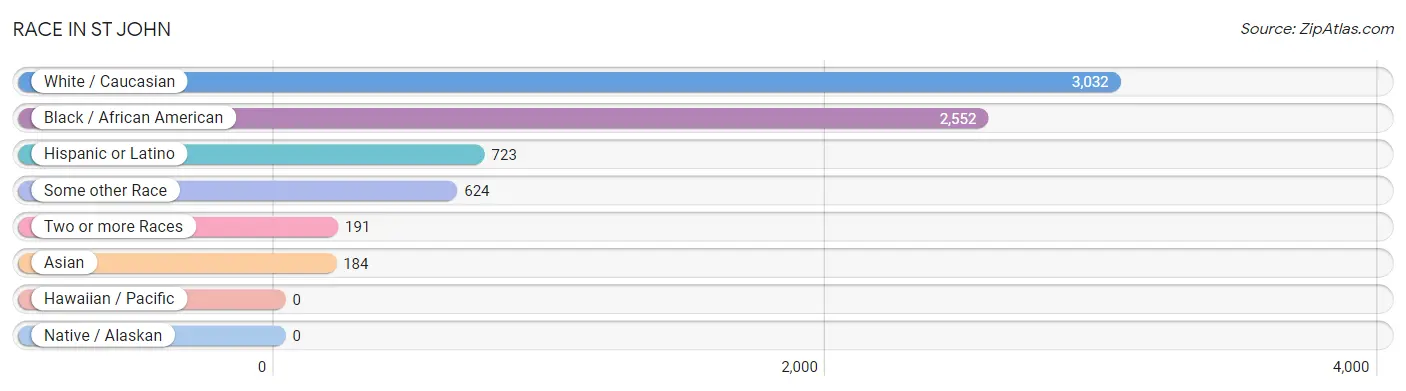
| Race | # Population | % Population |
| Asian | 184 | 2.8% |
| Black / African American | 2,552 | 38.8% |
| Hawaiian / Pacific | 0 | 0.0% |
| Hispanic or Latino | 723 | 11.0% |
| Native / Alaskan | 0 | 0.0% |
| White / Caucasian | 3,032 | 46.1% |
| Two or more Races | 191 | 2.9% |
| Some other Race | 624 | 9.5% |
| Total | 6,583 | 100.0% |
Ancestry in St John
The most populous ancestries reported in St John are Mexican (645 | 9.8%), German (605 | 9.2%), Irish (574 | 8.7%), English (490 | 7.4%), and American (372 | 5.7%), together accounting for 40.8% of all St John residents.
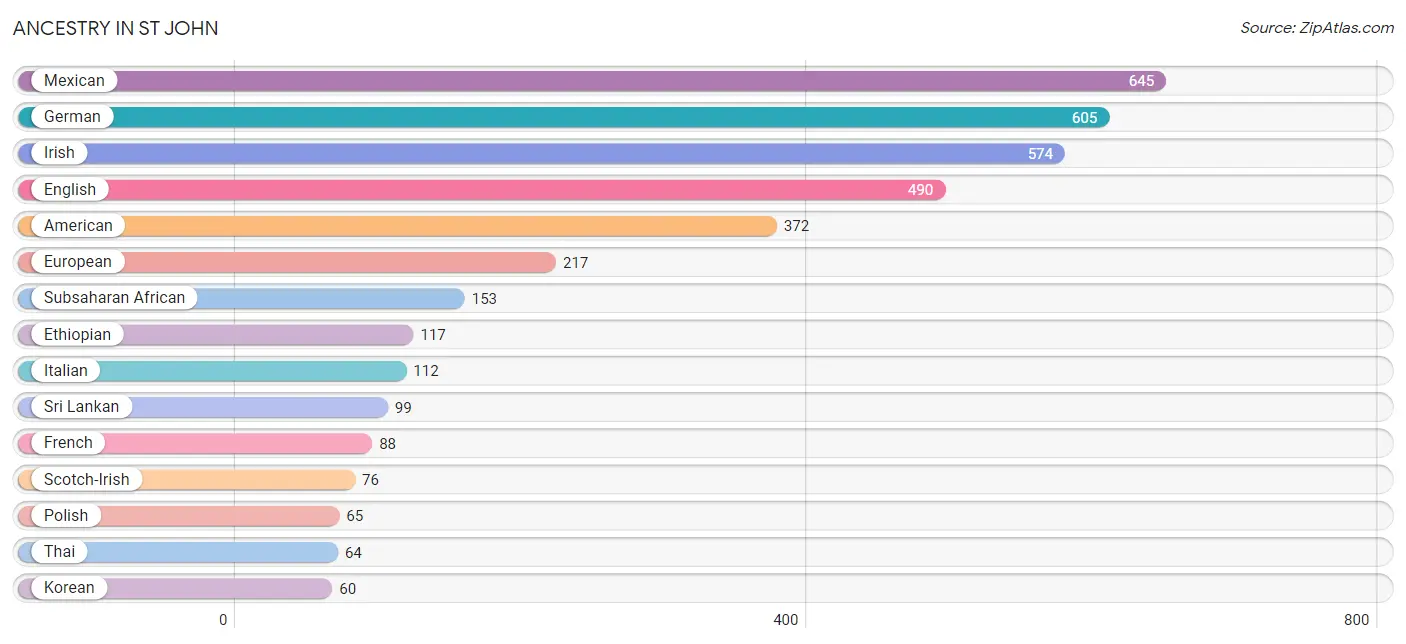
| Ancestry | # Population | % Population |
| African | 15 | 0.2% |
| American | 372 | 5.7% |
| Argentinean | 9 | 0.1% |
| Austrian | 19 | 0.3% |
| British | 27 | 0.4% |
| Central American | 53 | 0.8% |
| Cuban | 16 | 0.2% |
| Danish | 24 | 0.4% |
| Dutch | 37 | 0.6% |
| Eastern European | 23 | 0.4% |
| English | 490 | 7.4% |
| Ethiopian | 117 | 1.8% |
| European | 217 | 3.3% |
| French | 88 | 1.3% |
| French Canadian | 47 | 0.7% |
| German | 605 | 9.2% |
| Honduran | 53 | 0.8% |
| Irish | 574 | 8.7% |
| Italian | 112 | 1.7% |
| Korean | 60 | 0.9% |
| Mexican | 645 | 9.8% |
| Mexican American Indian | 8 | 0.1% |
| Nigerian | 21 | 0.3% |
| Norwegian | 18 | 0.3% |
| Pakistani | 25 | 0.4% |
| Polish | 65 | 1.0% |
| Romanian | 3 | 0.1% |
| Scandinavian | 9 | 0.1% |
| Scotch-Irish | 76 | 1.1% |
| Scottish | 15 | 0.2% |
| Slovak | 18 | 0.3% |
| South American | 9 | 0.1% |
| Sri Lankan | 99 | 1.5% |
| Subsaharan African | 153 | 2.3% |
| Swedish | 43 | 0.6% |
| Thai | 64 | 1.0% |
| Welsh | 20 | 0.3% | View All 37 Rows |
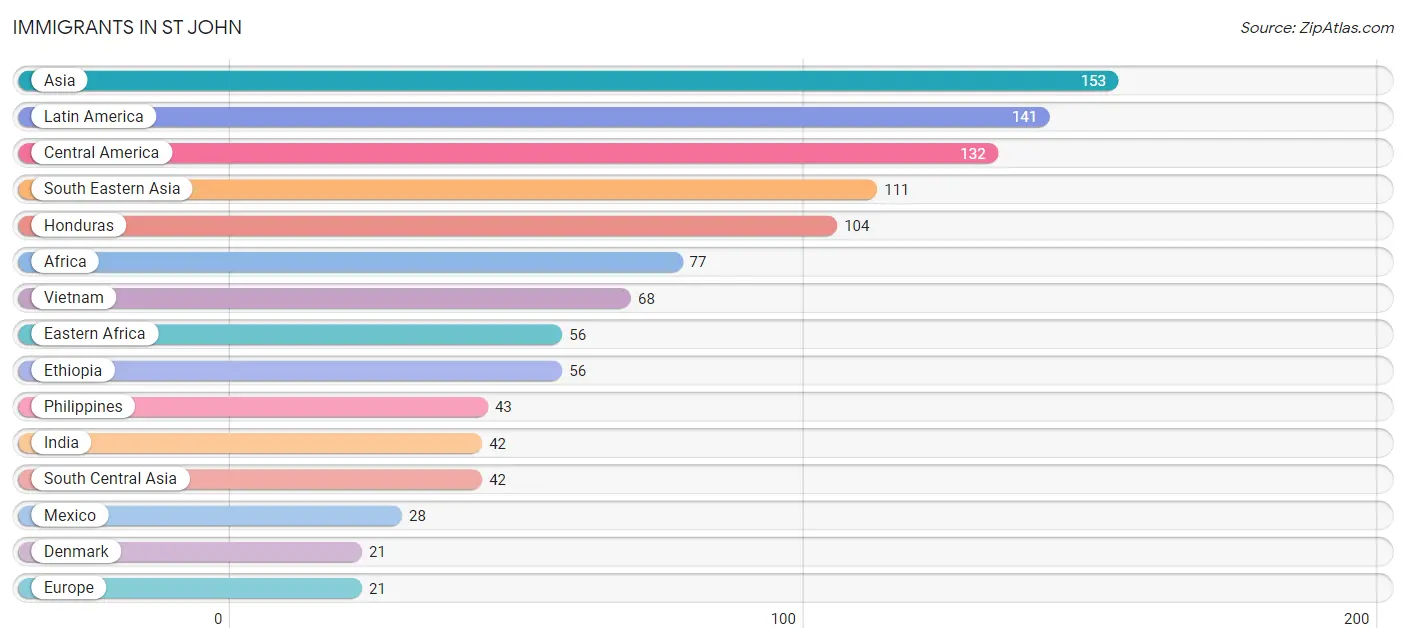
Immigrants in St John
The most numerous immigrant groups reported in St John came from Asia (153 | 2.3%), Latin America (141 | 2.1%), Central America (132 | 2.0%), South Eastern Asia (111 | 1.7%), and Honduras (104 | 1.6%), together accounting for 9.7% of all St John residents.
| Immigration Origin | # Population | % Population |
| Africa | 77 | 1.2% |
| Argentina | 9 | 0.1% |
| Asia | 153 | 2.3% |
| Central America | 132 | 2.0% |
| Denmark | 21 | 0.3% |
| Eastern Africa | 56 | 0.9% |
| Ethiopia | 56 | 0.9% |
| Europe | 21 | 0.3% |
| Honduras | 104 | 1.6% |
| India | 42 | 0.6% |
| Latin America | 141 | 2.1% |
| Mexico | 28 | 0.4% |
| Nigeria | 21 | 0.3% |
| Northern Europe | 21 | 0.3% |
| Philippines | 43 | 0.6% |
| South America | 9 | 0.1% |
| South Central Asia | 42 | 0.6% |
| South Eastern Asia | 111 | 1.7% |
| Vietnam | 68 | 1.0% |
| Western Africa | 21 | 0.3% | View All 20 Rows |
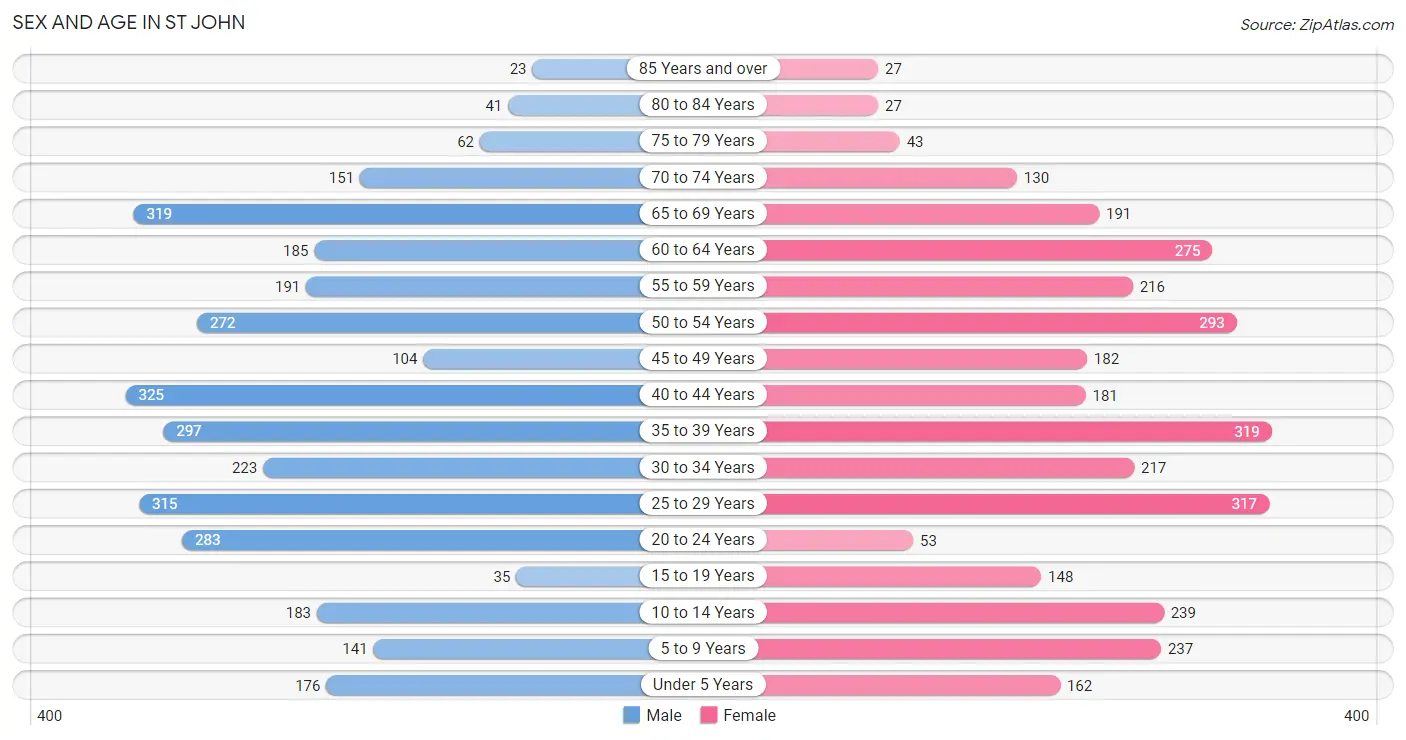
Sex and Age in St John
Sex and Age in St John
The most populous age groups in St John are 40 to 44 Years (325 | 9.8%) for men and 35 to 39 Years (319 | 9.8%) for women.
| Age Bracket | Male | Female |
| Under 5 Years | 176 (5.3%) | 162 (5.0%) |
| 5 to 9 Years | 141 (4.2%) | 237 (7.3%) |
| 10 to 14 Years | 183 (5.5%) | 239 (7.3%) |
| 15 to 19 Years | 35 (1.1%) | 148 (4.5%) |
| 20 to 24 Years | 283 (8.5%) | 53 (1.6%) |
| 25 to 29 Years | 315 (9.5%) | 317 (9.7%) |
| 30 to 34 Years | 223 (6.7%) | 217 (6.7%) |
| 35 to 39 Years | 297 (8.9%) | 319 (9.8%) |
| 40 to 44 Years | 325 (9.8%) | 181 (5.6%) |
| 45 to 49 Years | 104 (3.1%) | 182 (5.6%) |
| 50 to 54 Years | 272 (8.2%) | 293 (9.0%) |
| 55 to 59 Years | 191 (5.7%) | 216 (6.6%) |
| 60 to 64 Years | 185 (5.6%) | 275 (8.4%) |
| 65 to 69 Years | 319 (9.6%) | 191 (5.9%) |
| 70 to 74 Years | 151 (4.5%) | 130 (4.0%) |
| 75 to 79 Years | 62 (1.9%) | 43 (1.3%) |
| 80 to 84 Years | 41 (1.2%) | 27 (0.8%) |
| 85 Years and over | 23 (0.7%) | 27 (0.8%) |
| Total | 3,326 (100.0%) | 3,257 (100.0%) |
Families and Households in St John
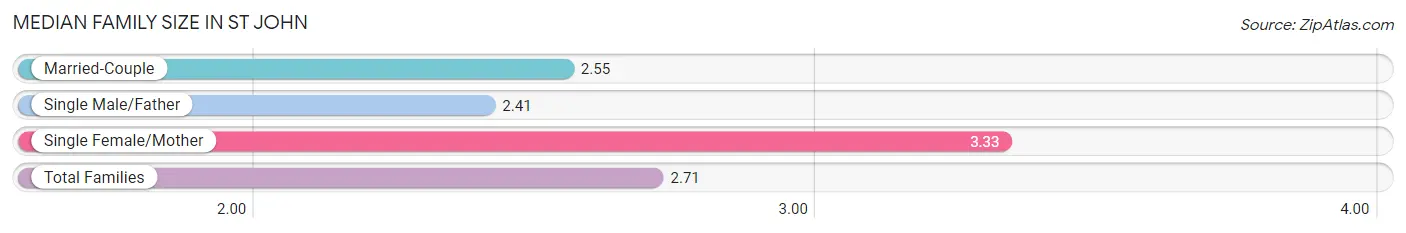
Median Family Size in St John
The median family size in St John is 2.71 persons per family, with single female/mother families (413 | 22.4%) accounting for the largest median family size of 3.33 persons per family. On the other hand, single male/father families (212 | 11.5%) represent the smallest median family size with 2.41 persons per family.
| Family Type | # Families | Family Size |
| Married-Couple | 1,216 (66.0%) | 2.55 |
| Single Male/Father | 212 (11.5%) | 2.41 |
| Single Female/Mother | 413 (22.4%) | 3.33 |
| Total Families | 1,841 (100.0%) | 2.71 |
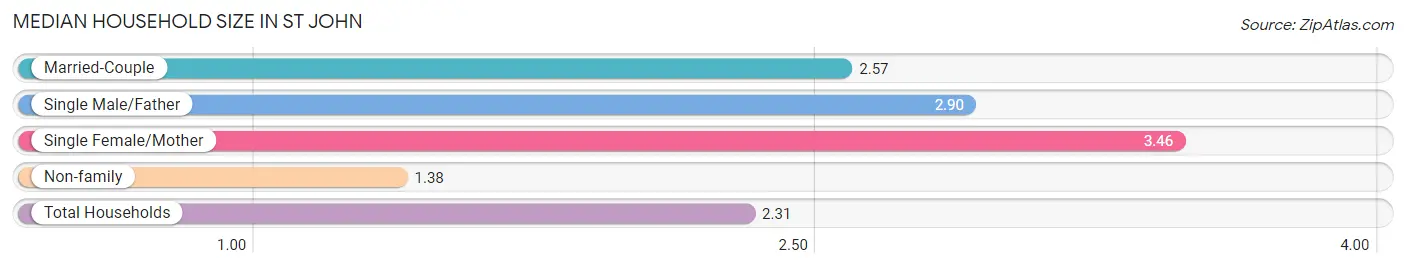
Median Household Size in St John
The median household size in St John is 2.31 persons per household, with single female/mother households (413 | 14.6%) accounting for the largest median household size of 3.46 persons per household. non-family households (979 | 34.7%) represent the smallest median household size with 1.38 persons per household.
| Household Type | # Households | Household Size |
| Married-Couple | 1,216 (43.1%) | 2.57 |
| Single Male/Father | 212 (7.5%) | 2.90 |
| Single Female/Mother | 413 (14.6%) | 3.46 |
| Non-family | 979 (34.7%) | 1.38 |
| Total Households | 2,820 (100.0%) | 2.31 |
Household Size by Marriage Status in St John
Out of a total of 2,820 households in St John, 1,841 (65.3%) are family households, while 979 (34.7%) are nonfamily households. The most numerous type of family households are 2-person households, comprising 920, and the most common type of nonfamily households are 1-person households, comprising 759.
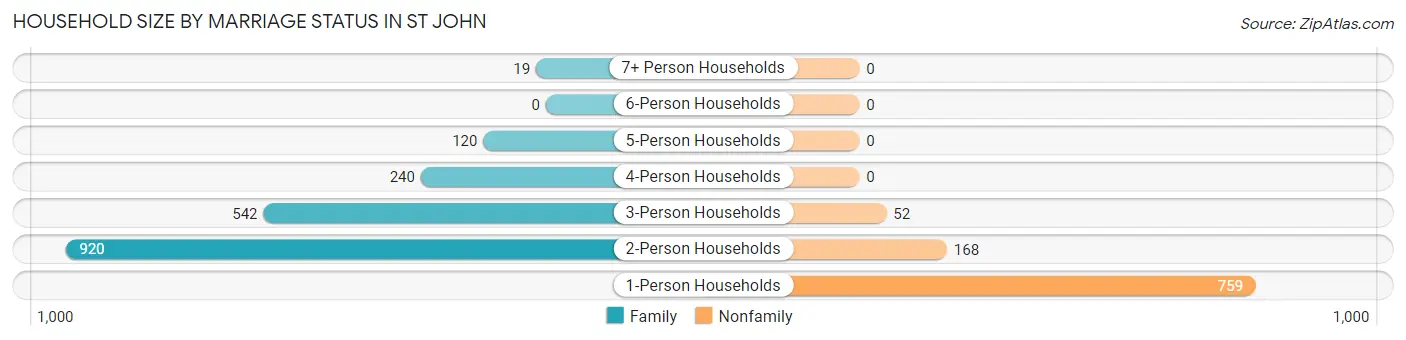
| Household Size | Family Households | Nonfamily Households |
| 1-Person Households | - | 759 (26.9%) |
| 2-Person Households | 920 (32.6%) | 168 (6.0%) |
| 3-Person Households | 542 (19.2%) | 52 (1.8%) |
| 4-Person Households | 240 (8.5%) | 0 (0.0%) |
| 5-Person Households | 120 (4.3%) | 0 (0.0%) |
| 6-Person Households | 0 (0.0%) | 0 (0.0%) |
| 7+ Person Households | 19 (0.7%) | 0 (0.0%) |
| Total | 1,841 (65.3%) | 979 (34.7%) |
Female Fertility in St John
Fertility by Age in St John
Average fertility rate in St John is 33.0 births per 1,000 women. Women in the age bracket of 20 to 34 years have the highest fertility rate with 41.0 births per 1,000 women. Women in the age bracket of 20 to 34 years acount for 50.0% of all women with births.
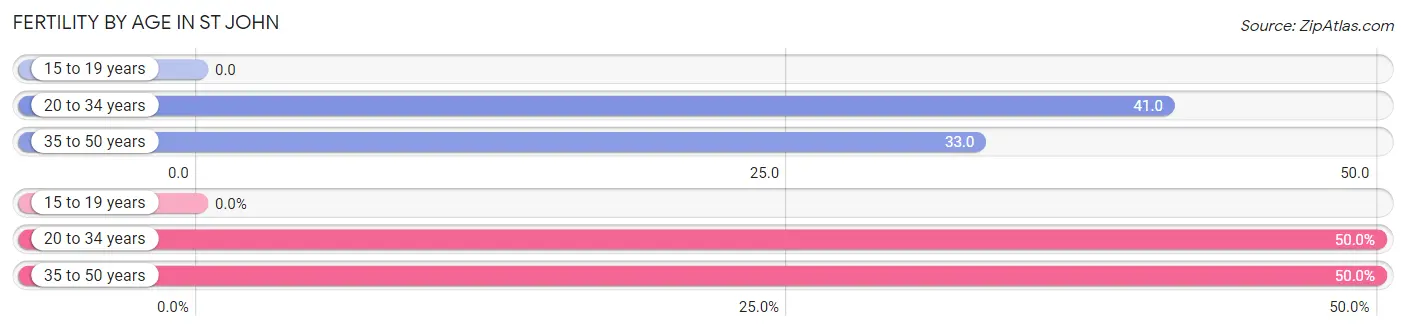
| Age Bracket | Women with Births | Births / 1,000 Women |
| 15 to 19 years | 0 (0.0%) | 0.0 |
| 20 to 34 years | 24 (50.0%) | 41.0 |
| 35 to 50 years | 24 (50.0%) | 33.0 |
| Total | 48 (100.0%) | 33.0 |
Fertility by Age by Marriage Status in St John
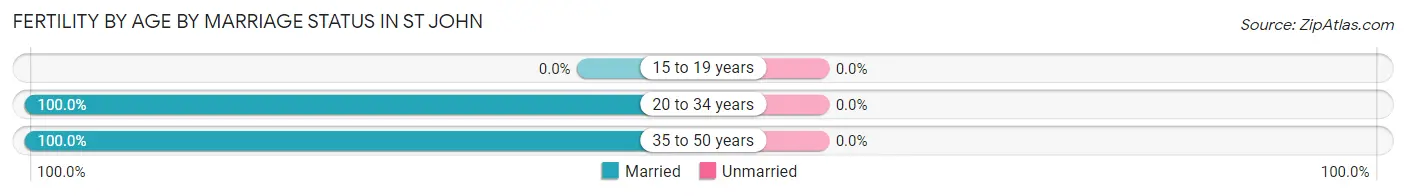
| Age Bracket | Married | Unmarried |
| 15 to 19 years | 0 (0.0%) | 0 (0.0%) |
| 20 to 34 years | 24 (100.0%) | 0 (0.0%) |
| 35 to 50 years | 24 (100.0%) | 0 (0.0%) |
| Total | 48 (100.0%) | 0 (0.0%) |
Fertility by Education in St John
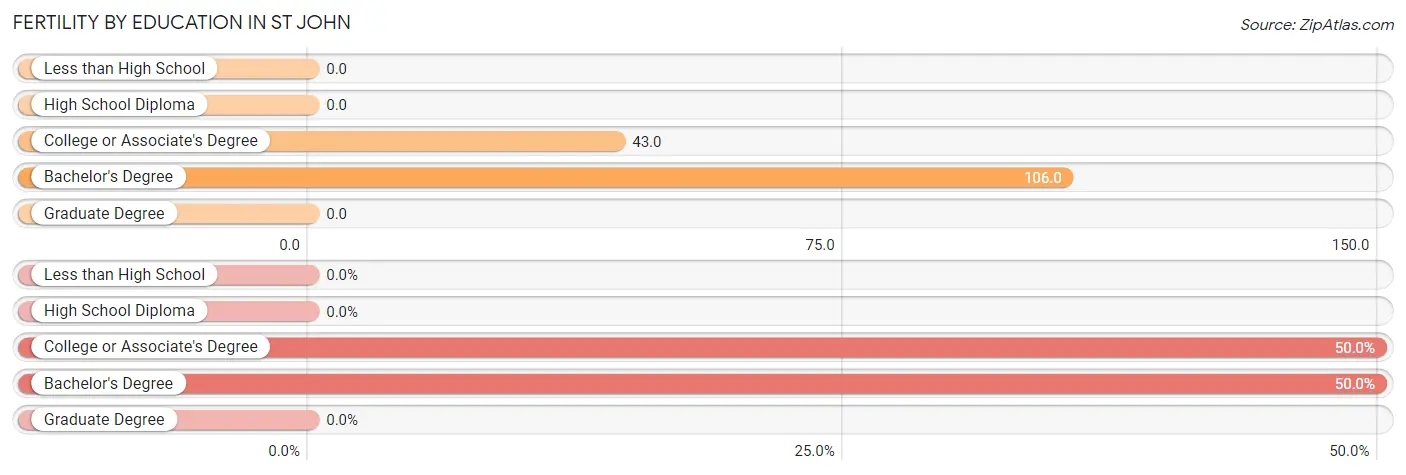
| Educational Attainment | Women with Births | Births / 1,000 Women |
| Less than High School | 0 (0.0%) | 0.0 |
| High School Diploma | 0 (0.0%) | 0.0 |
| College or Associate's Degree | 24 (50.0%) | 43.0 |
| Bachelor's Degree | 24 (50.0%) | 106.0 |
| Graduate Degree | 0 (0.0%) | 0.0 |
| Total | 48 (100.0%) | 33.0 |
Fertility by Education by Marriage Status in St John
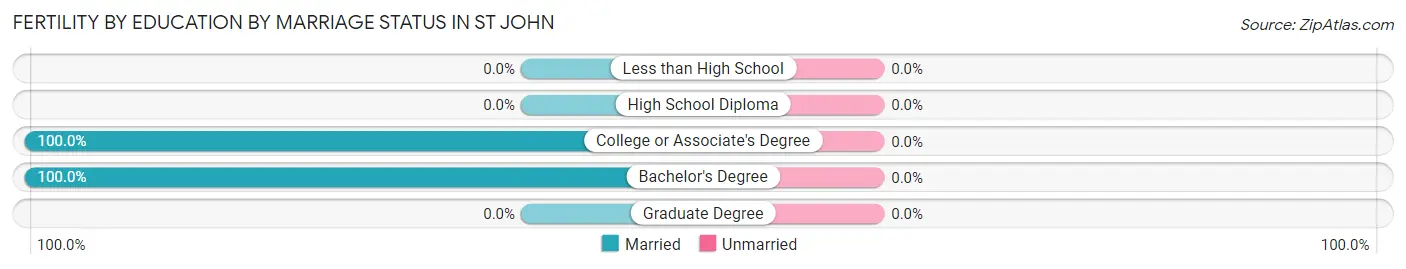
| Educational Attainment | Married | Unmarried |
| Less than High School | 0 (0.0%) | 0 (0.0%) |
| High School Diploma | 0 (0.0%) | 0 (0.0%) |
| College or Associate's Degree | 24 (100.0%) | 0 (0.0%) |
| Bachelor's Degree | 24 (100.0%) | 0 (0.0%) |
| Graduate Degree | 0 (0.0%) | 0 (0.0%) |
| Total | 48 (100.0%) | 0 (0.0%) |
Employment Characteristics in St John
Employment by Class of Employer in St John
Among the 3,452 employed individuals in St John, private company employees (2,703 | 78.3%), not-for-profit organizations (235 | 6.8%), and self-employed (not incorporated) (226 | 6.6%) make up the most common classes of employment.
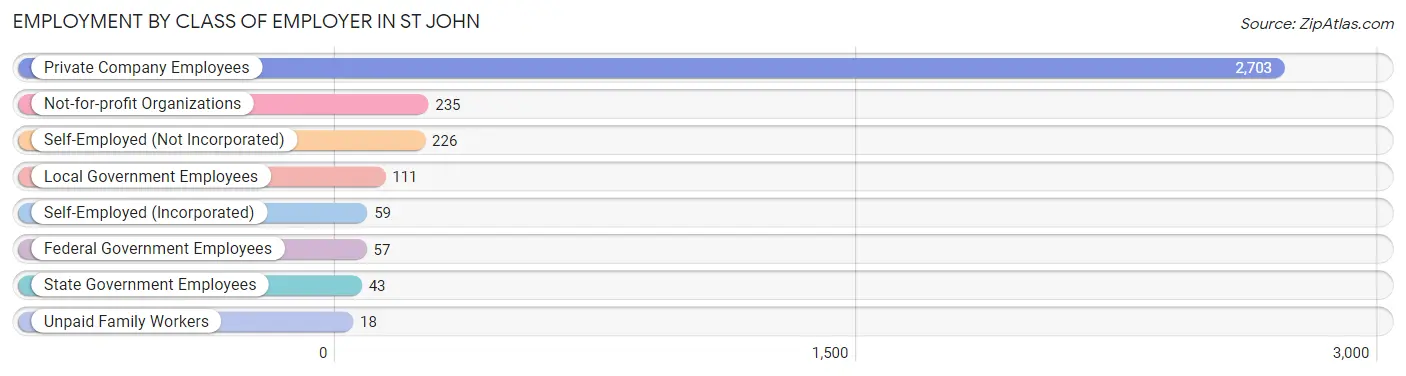
| Employer Class | # Employees | % Employees |
| Private Company Employees | 2,703 | 78.3% |
| Self-Employed (Incorporated) | 59 | 1.7% |
| Self-Employed (Not Incorporated) | 226 | 6.6% |
| Not-for-profit Organizations | 235 | 6.8% |
| Local Government Employees | 111 | 3.2% |
| State Government Employees | 43 | 1.3% |
| Federal Government Employees | 57 | 1.7% |
| Unpaid Family Workers | 18 | 0.5% |
| Total | 3,452 | 100.0% |
Employment Status by Age in St John
According to the labor force statistics for St John, out of the total population over 16 years of age (5,402), 68.2% or 3,684 individuals are in the labor force, with 6.0% or 221 of them unemployed. The age group with the highest labor force participation rate is 20 to 24 years, with 100.0% or 336 individuals in the labor force. Within the labor force, the 16 to 19 years age range has the highest percentage of unemployed individuals, with 27.1% or 32 of them being unemployed.
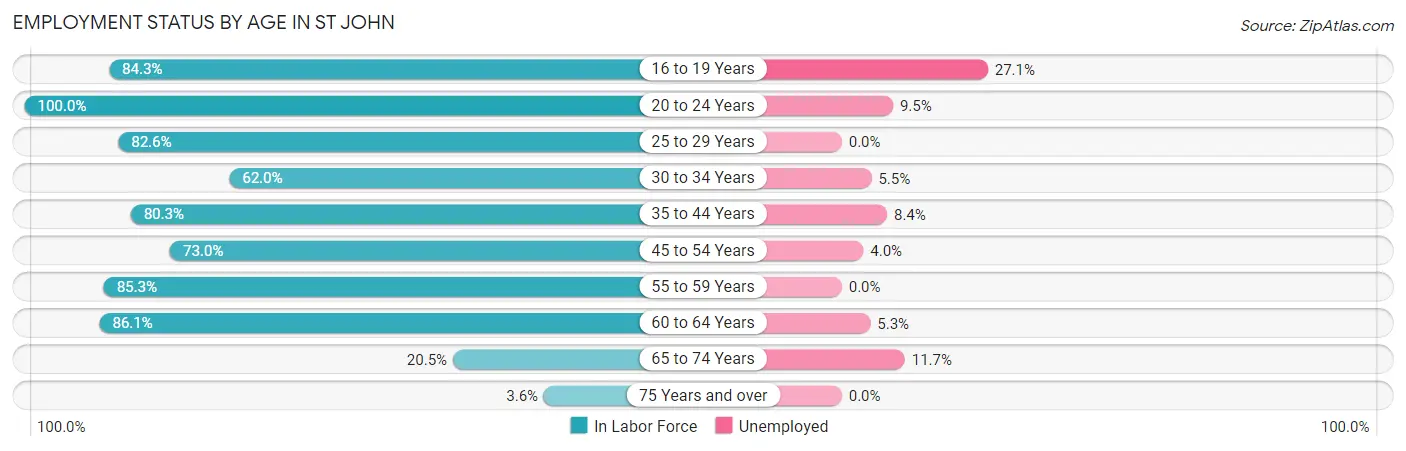
| Age Bracket | In Labor Force | Unemployed |
| 16 to 19 Years | 118 (84.3%) | 32 (27.1%) |
| 20 to 24 Years | 336 (100.0%) | 32 (9.5%) |
| 25 to 29 Years | 522 (82.6%) | 0 (0.0%) |
| 30 to 34 Years | 273 (62.0%) | 15 (5.5%) |
| 35 to 44 Years | 901 (80.3%) | 76 (8.4%) |
| 45 to 54 Years | 621 (73.0%) | 25 (4.0%) |
| 55 to 59 Years | 347 (85.3%) | 0 (0.0%) |
| 60 to 64 Years | 396 (86.1%) | 21 (5.3%) |
| 65 to 74 Years | 162 (20.5%) | 19 (11.7%) |
| 75 Years and over | 8 (3.6%) | 0 (0.0%) |
| Total | 3,684 (68.2%) | 221 (6.0%) |
Employment Status by Educational Attainment in St John
According to labor force statistics for St John, 78.2% of individuals (3,059) out of the total population between 25 and 64 years of age (3,912) are in the labor force, with 4.5% or 138 of them being unemployed. The group with the highest labor force participation rate are those with the educational attainment of bachelor's degree or higher, with 85.8% or 699 individuals in the labor force. Within the labor force, individuals with high school diploma education have the highest percentage of unemployment, with 8.1% or 74 of them being unemployed.
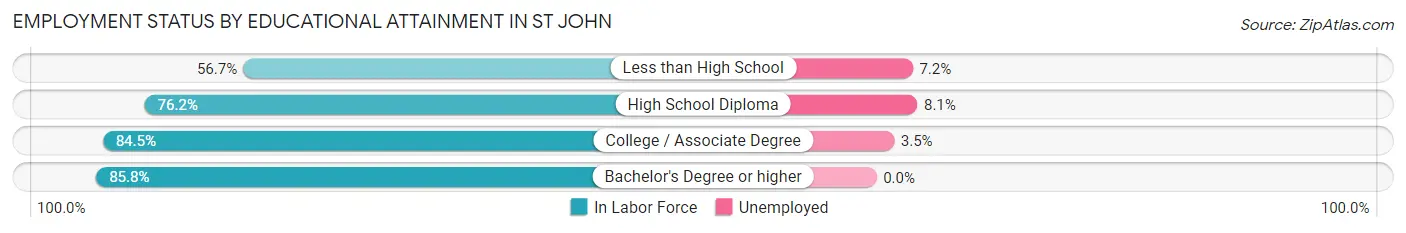
| Educational Attainment | In Labor Force | Unemployed |
| Less than High School | 321 (56.7%) | 41 (7.2%) |
| High School Diploma | 913 (76.2%) | 97 (8.1%) |
| College / Associate Degree | 1,126 (84.5%) | 47 (3.5%) |
| Bachelor's Degree or higher | 699 (85.8%) | 0 (0.0%) |
| Total | 3,059 (78.2%) | 176 (4.5%) |
Employment Occupations by Sex in St John
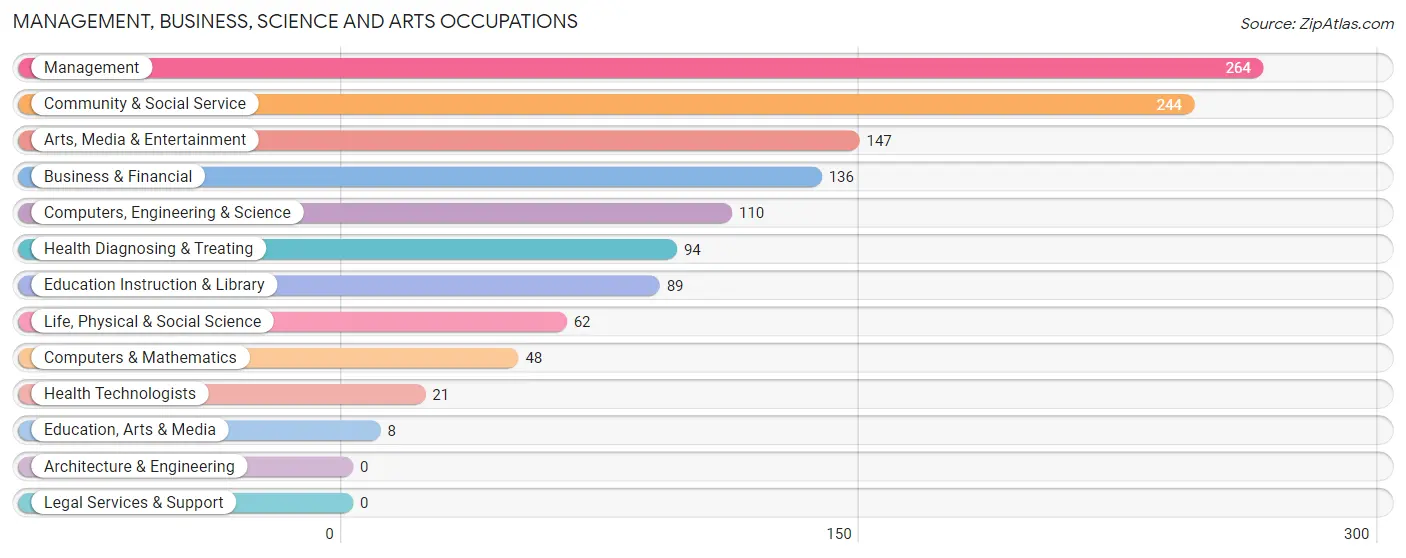
Management, Business, Science and Arts Occupations
The most common Management, Business, Science and Arts occupations in St John are Management (264 | 7.6%), Community & Social Service (244 | 7.0%), Arts, Media & Entertainment (147 | 4.2%), Business & Financial (136 | 3.9%), and Computers, Engineering & Science (110 | 3.2%).
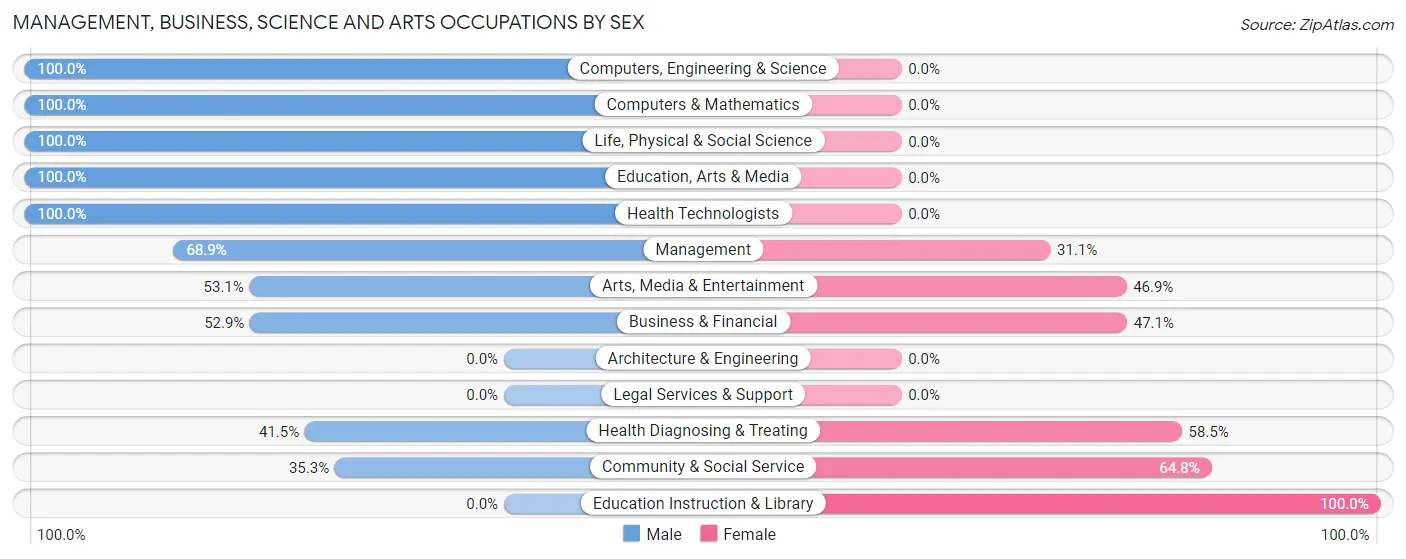
Management, Business, Science and Arts Occupations by Sex
Within the Management, Business, Science and Arts occupations in St John, the most male-oriented occupations are Computers, Engineering & Science (100.0%), Computers & Mathematics (100.0%), and Life, Physical & Social Science (100.0%), while the most female-oriented occupations are Education Instruction & Library (100.0%), Community & Social Service (64.7%), and Health Diagnosing & Treating (58.5%).
| Occupation | Male | Female |
| Management | 182 (68.9%) | 82 (31.1%) |
| Business & Financial | 72 (52.9%) | 64 (47.1%) |
| Computers, Engineering & Science | 110 (100.0%) | 0 (0.0%) |
| Computers & Mathematics | 48 (100.0%) | 0 (0.0%) |
| Architecture & Engineering | 0 (0.0%) | 0 (0.0%) |
| Life, Physical & Social Science | 62 (100.0%) | 0 (0.0%) |
| Community & Social Service | 86 (35.2%) | 158 (64.7%) |
| Education, Arts & Media | 8 (100.0%) | 0 (0.0%) |
| Legal Services & Support | 0 (0.0%) | 0 (0.0%) |
| Education Instruction & Library | 0 (0.0%) | 89 (100.0%) |
| Arts, Media & Entertainment | 78 (53.1%) | 69 (46.9%) |
| Health Diagnosing & Treating | 39 (41.5%) | 55 (58.5%) |
| Health Technologists | 21 (100.0%) | 0 (0.0%) |
| Total (Category) | 489 (57.7%) | 359 (42.3%) |
| Total (Overall) | 1,876 (54.2%) | 1,588 (45.8%) |
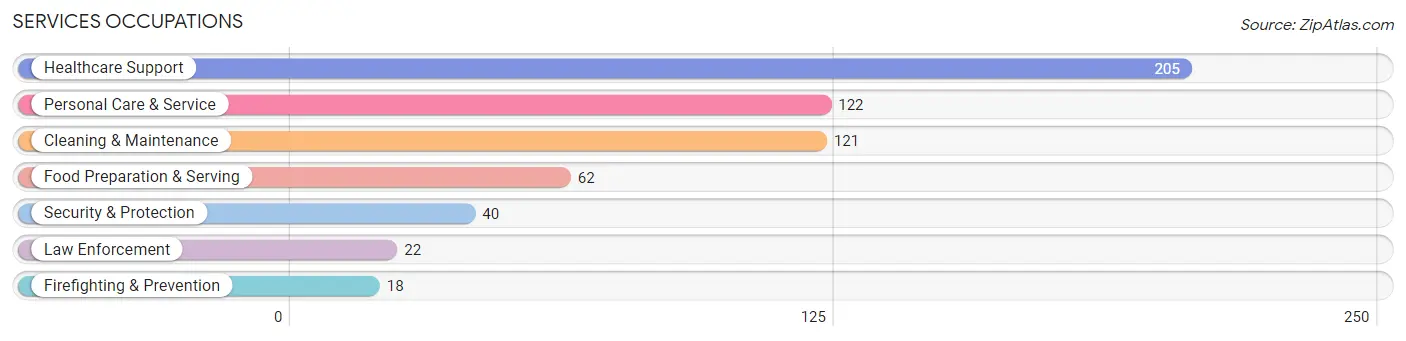
Services Occupations
The most common Services occupations in St John are Healthcare Support (205 | 5.9%), Personal Care & Service (122 | 3.5%), Cleaning & Maintenance (121 | 3.5%), Food Preparation & Serving (62 | 1.8%), and Security & Protection (40 | 1.1%).
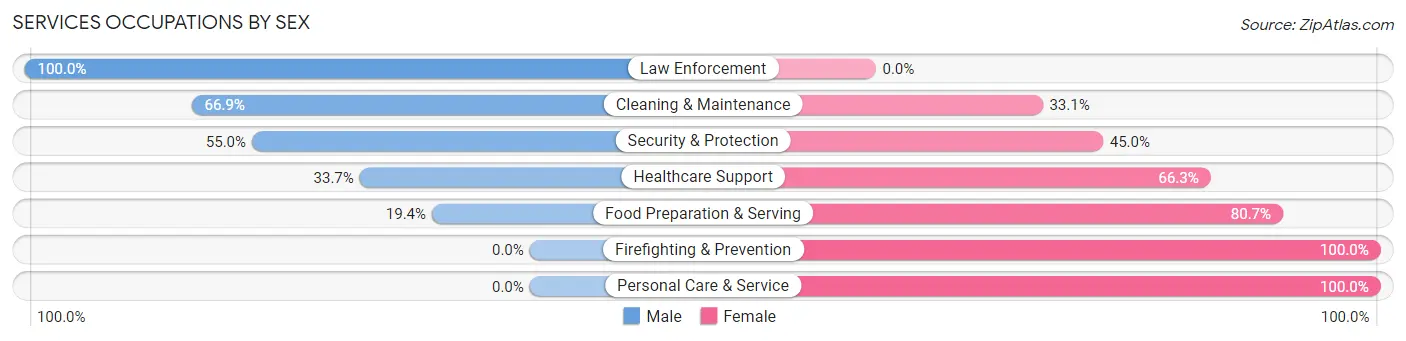
Services Occupations by Sex
Within the Services occupations in St John, the most male-oriented occupations are Law Enforcement (100.0%), Cleaning & Maintenance (66.9%), and Security & Protection (55.0%), while the most female-oriented occupations are Firefighting & Prevention (100.0%), Personal Care & Service (100.0%), and Food Preparation & Serving (80.6%).
| Occupation | Male | Female |
| Healthcare Support | 69 (33.7%) | 136 (66.3%) |
| Security & Protection | 22 (55.0%) | 18 (45.0%) |
| Firefighting & Prevention | 0 (0.0%) | 18 (100.0%) |
| Law Enforcement | 22 (100.0%) | 0 (0.0%) |
| Food Preparation & Serving | 12 (19.4%) | 50 (80.6%) |
| Cleaning & Maintenance | 81 (66.9%) | 40 (33.1%) |
| Personal Care & Service | 0 (0.0%) | 122 (100.0%) |
| Total (Category) | 184 (33.5%) | 366 (66.5%) |
| Total (Overall) | 1,876 (54.2%) | 1,588 (45.8%) |
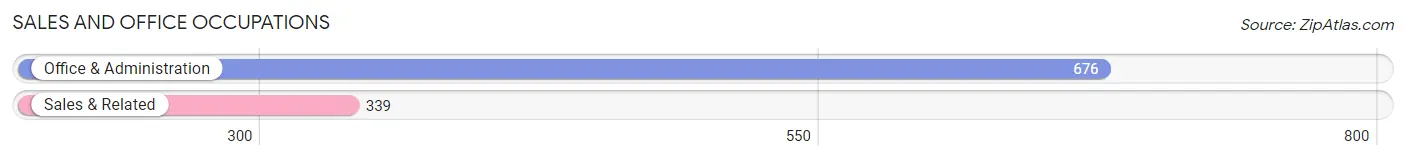
Sales and Office Occupations
The most common Sales and Office occupations in St John are Office & Administration (676 | 19.5%), and Sales & Related (339 | 9.8%).
Sales and Office Occupations by Sex
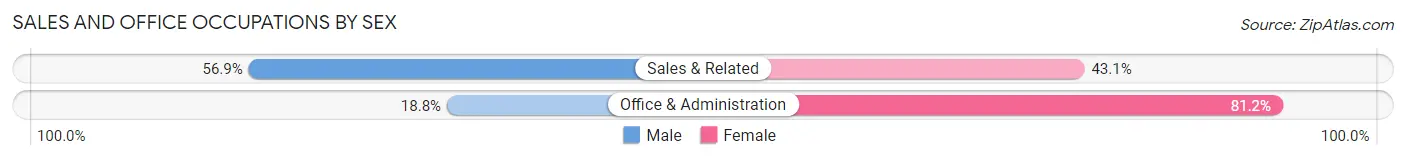
| Occupation | Male | Female |
| Sales & Related | 193 (56.9%) | 146 (43.1%) |
| Office & Administration | 127 (18.8%) | 549 (81.2%) |
| Total (Category) | 320 (31.5%) | 695 (68.5%) |
| Total (Overall) | 1,876 (54.2%) | 1,588 (45.8%) |
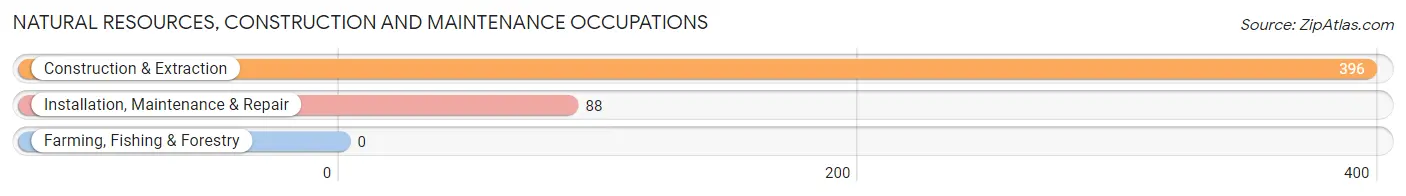
Natural Resources, Construction and Maintenance Occupations
The most common Natural Resources, Construction and Maintenance occupations in St John are Construction & Extraction (396 | 11.4%), and Installation, Maintenance & Repair (88 | 2.5%).
Natural Resources, Construction and Maintenance Occupations by Sex
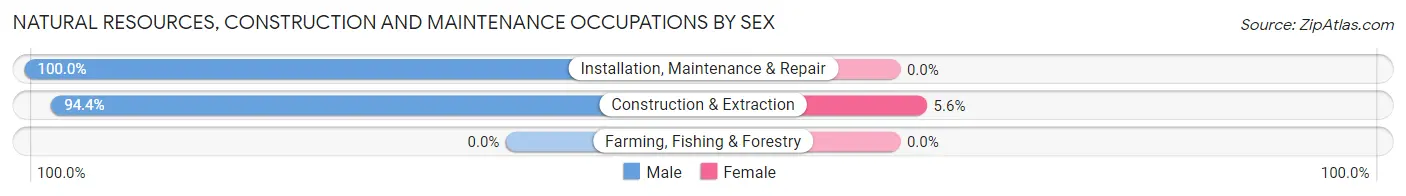
| Occupation | Male | Female |
| Farming, Fishing & Forestry | 0 (0.0%) | 0 (0.0%) |
| Construction & Extraction | 374 (94.4%) | 22 (5.6%) |
| Installation, Maintenance & Repair | 88 (100.0%) | 0 (0.0%) |
| Total (Category) | 462 (95.5%) | 22 (4.5%) |
| Total (Overall) | 1,876 (54.2%) | 1,588 (45.8%) |
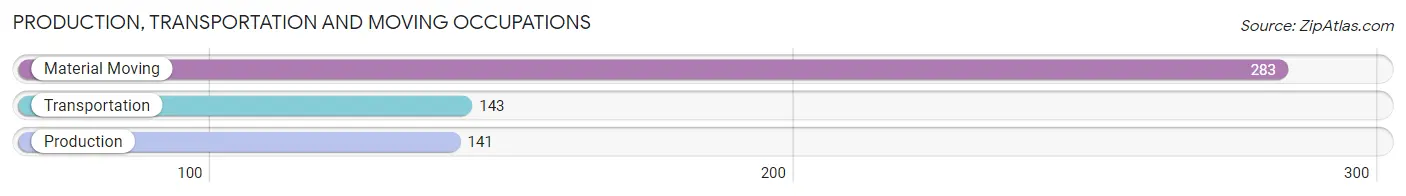
Production, Transportation and Moving Occupations
The most common Production, Transportation and Moving occupations in St John are Material Moving (283 | 8.2%), Transportation (143 | 4.1%), and Production (141 | 4.1%).
Production, Transportation and Moving Occupations by Sex
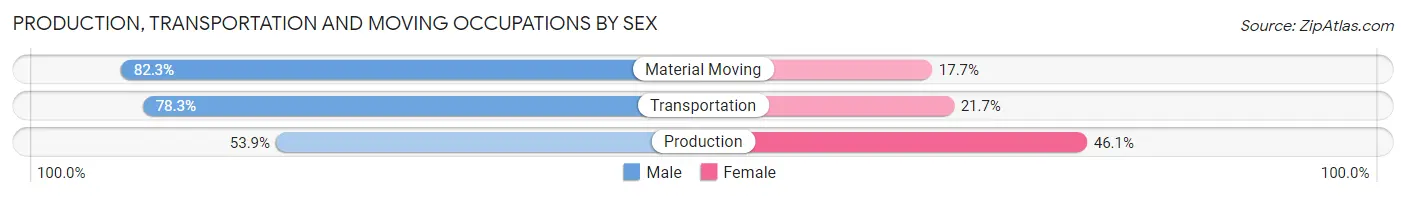
| Occupation | Male | Female |
| Production | 76 (53.9%) | 65 (46.1%) |
| Transportation | 112 (78.3%) | 31 (21.7%) |
| Material Moving | 233 (82.3%) | 50 (17.7%) |
| Total (Category) | 421 (74.3%) | 146 (25.8%) |
| Total (Overall) | 1,876 (54.2%) | 1,588 (45.8%) |
Employment Industries by Sex in St John
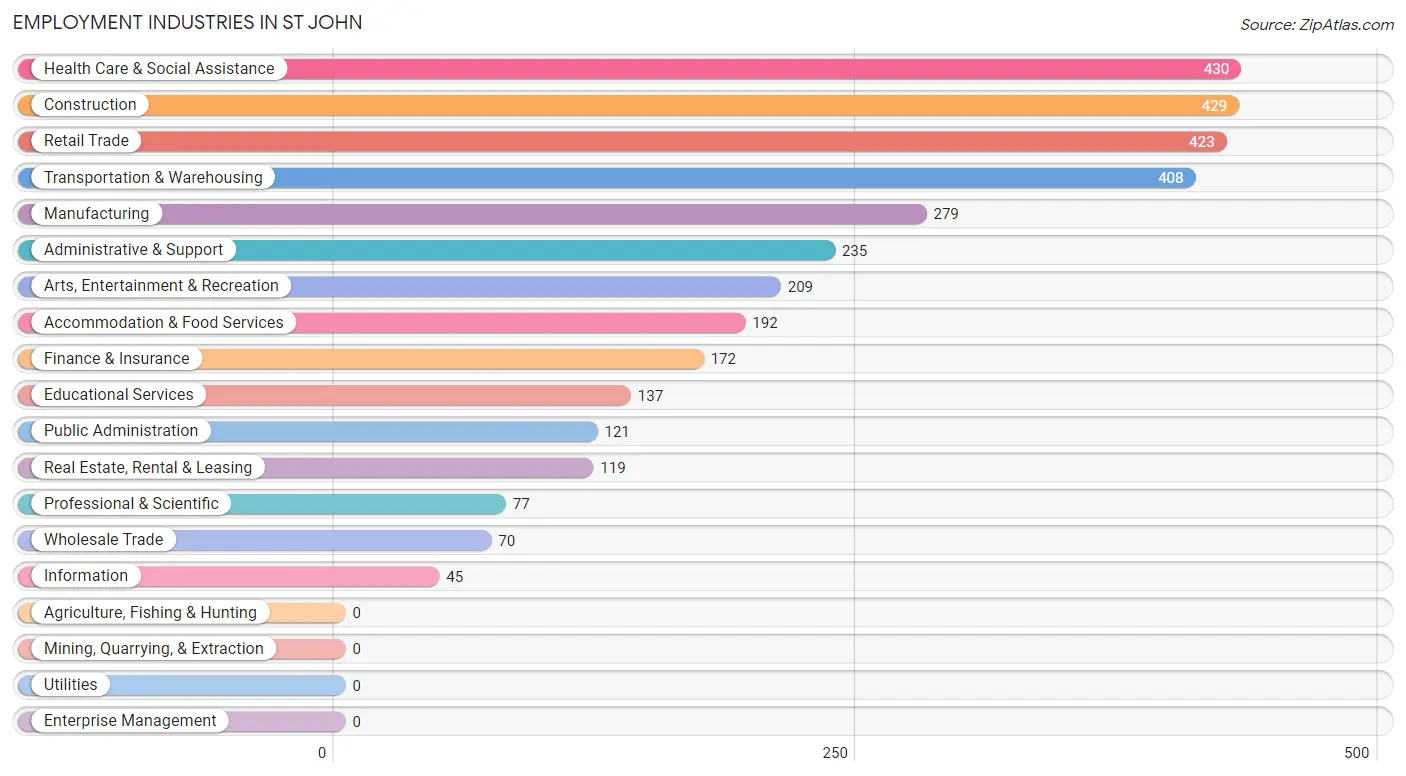
Employment Industries in St John
The major employment industries in St John include Health Care & Social Assistance (430 | 12.4%), Construction (429 | 12.4%), Retail Trade (423 | 12.2%), Transportation & Warehousing (408 | 11.8%), and Manufacturing (279 | 8.1%).
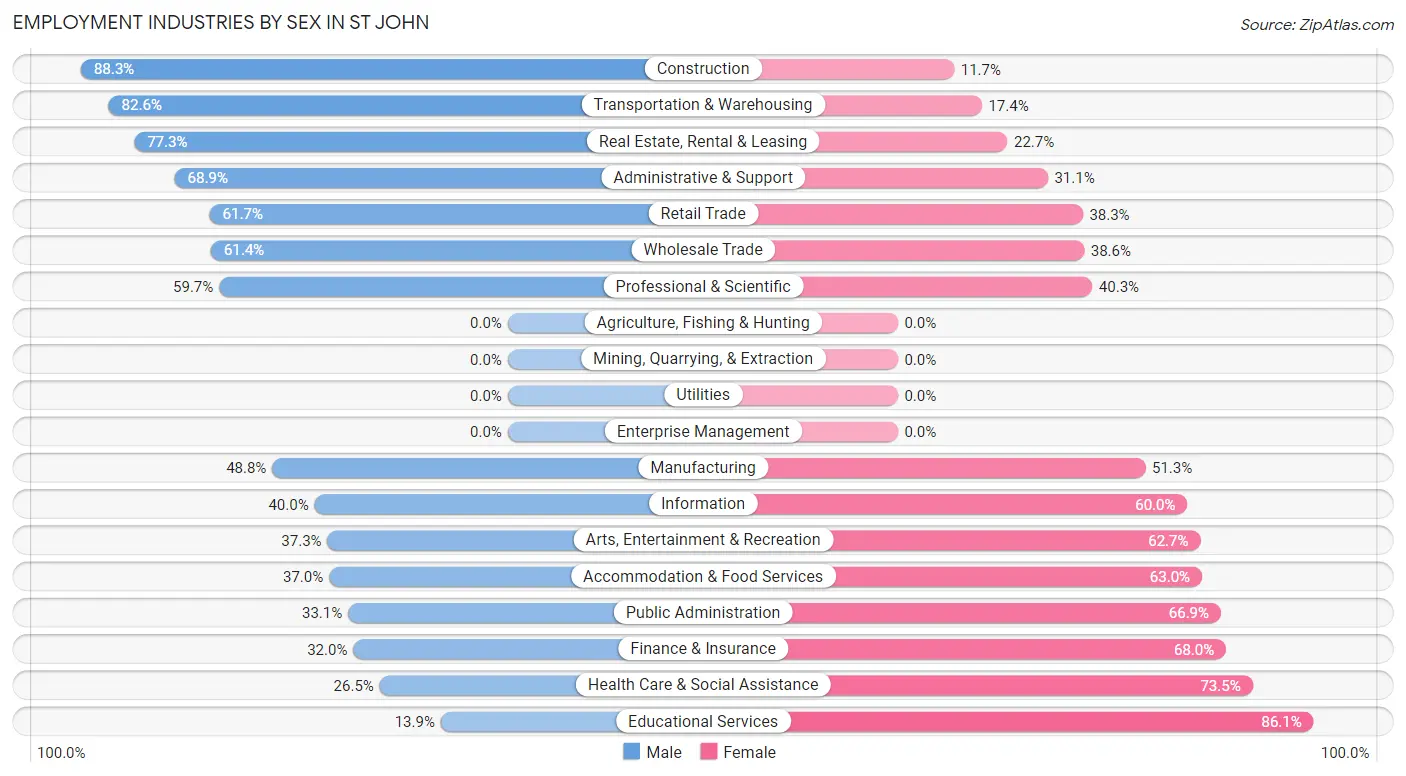
Employment Industries by Sex in St John
The St John industries that see more men than women are Construction (88.3%), Transportation & Warehousing (82.6%), and Real Estate, Rental & Leasing (77.3%), whereas the industries that tend to have a higher number of women are Educational Services (86.1%), Health Care & Social Assistance (73.5%), and Finance & Insurance (68.0%).
| Industry | Male | Female |
| Agriculture, Fishing & Hunting | 0 (0.0%) | 0 (0.0%) |
| Mining, Quarrying, & Extraction | 0 (0.0%) | 0 (0.0%) |
| Construction | 379 (88.3%) | 50 (11.7%) |
| Manufacturing | 136 (48.7%) | 143 (51.2%) |
| Wholesale Trade | 43 (61.4%) | 27 (38.6%) |
| Retail Trade | 261 (61.7%) | 162 (38.3%) |
| Transportation & Warehousing | 337 (82.6%) | 71 (17.4%) |
| Utilities | 0 (0.0%) | 0 (0.0%) |
| Information | 18 (40.0%) | 27 (60.0%) |
| Finance & Insurance | 55 (32.0%) | 117 (68.0%) |
| Real Estate, Rental & Leasing | 92 (77.3%) | 27 (22.7%) |
| Professional & Scientific | 46 (59.7%) | 31 (40.3%) |
| Enterprise Management | 0 (0.0%) | 0 (0.0%) |
| Administrative & Support | 162 (68.9%) | 73 (31.1%) |
| Educational Services | 19 (13.9%) | 118 (86.1%) |
| Health Care & Social Assistance | 114 (26.5%) | 316 (73.5%) |
| Arts, Entertainment & Recreation | 78 (37.3%) | 131 (62.7%) |
| Accommodation & Food Services | 71 (37.0%) | 121 (63.0%) |
| Public Administration | 40 (33.1%) | 81 (66.9%) |
| Total | 1,876 (54.2%) | 1,588 (45.8%) |
Education in St John
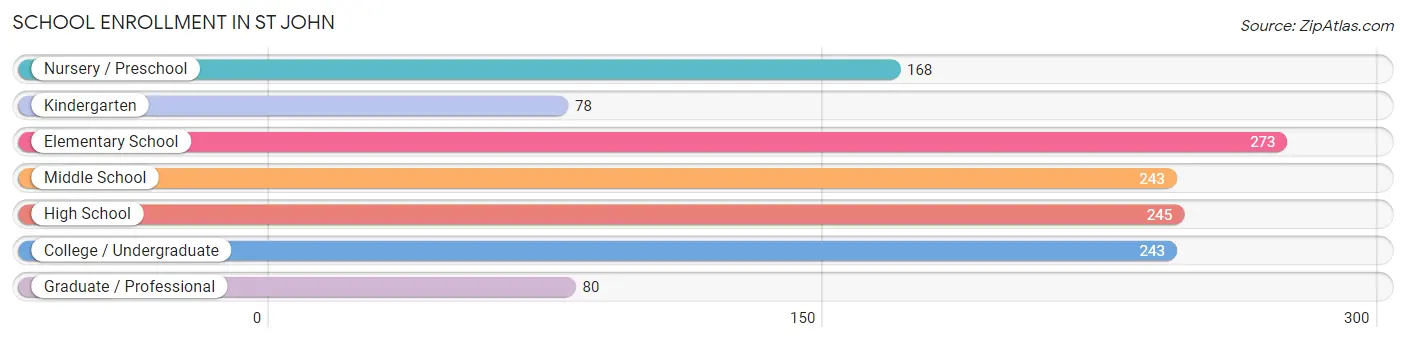
School Enrollment in St John
The most common levels of schooling among the 1,330 students in St John are elementary school (273 | 20.5%), high school (245 | 18.4%), and middle school (243 | 18.3%).
| School Level | # Students | % Students |
| Nursery / Preschool | 168 | 12.6% |
| Kindergarten | 78 | 5.9% |
| Elementary School | 273 | 20.5% |
| Middle School | 243 | 18.3% |
| High School | 245 | 18.4% |
| College / Undergraduate | 243 | 18.3% |
| Graduate / Professional | 80 | 6.0% |
| Total | 1,330 | 100.0% |
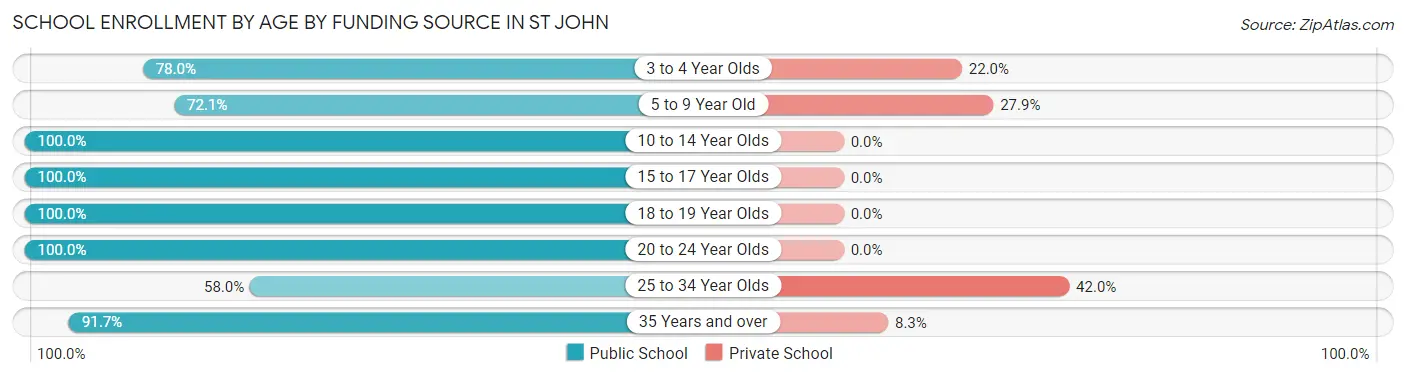
School Enrollment by Age by Funding Source in St John
Out of a total of 1,330 students who are enrolled in schools in St John, 202 (15.2%) attend a private institution, while the remaining 1,128 (84.8%) are enrolled in public schools. The age group of 25 to 34 year olds has the highest likelihood of being enrolled in private schools, with 63 (42.0% in the age bracket) enrolled. Conversely, the age group of 10 to 14 year olds has the lowest likelihood of being enrolled in a private school, with 400 (100.0% in the age bracket) attending a public institution.
| Age Bracket | Public School | Private School |
| 3 to 4 Year Olds | 124 (78.0%) | 35 (22.0%) |
| 5 to 9 Year Old | 246 (72.1%) | 95 (27.9%) |
| 10 to 14 Year Olds | 400 (100.0%) | 0 (0.0%) |
| 15 to 17 Year Olds | 77 (100.0%) | 0 (0.0%) |
| 18 to 19 Year Olds | 62 (100.0%) | 0 (0.0%) |
| 20 to 24 Year Olds | 32 (100.0%) | 0 (0.0%) |
| 25 to 34 Year Olds | 87 (58.0%) | 63 (42.0%) |
| 35 Years and over | 100 (91.7%) | 9 (8.3%) |
| Total | 1,128 (84.8%) | 202 (15.2%) |
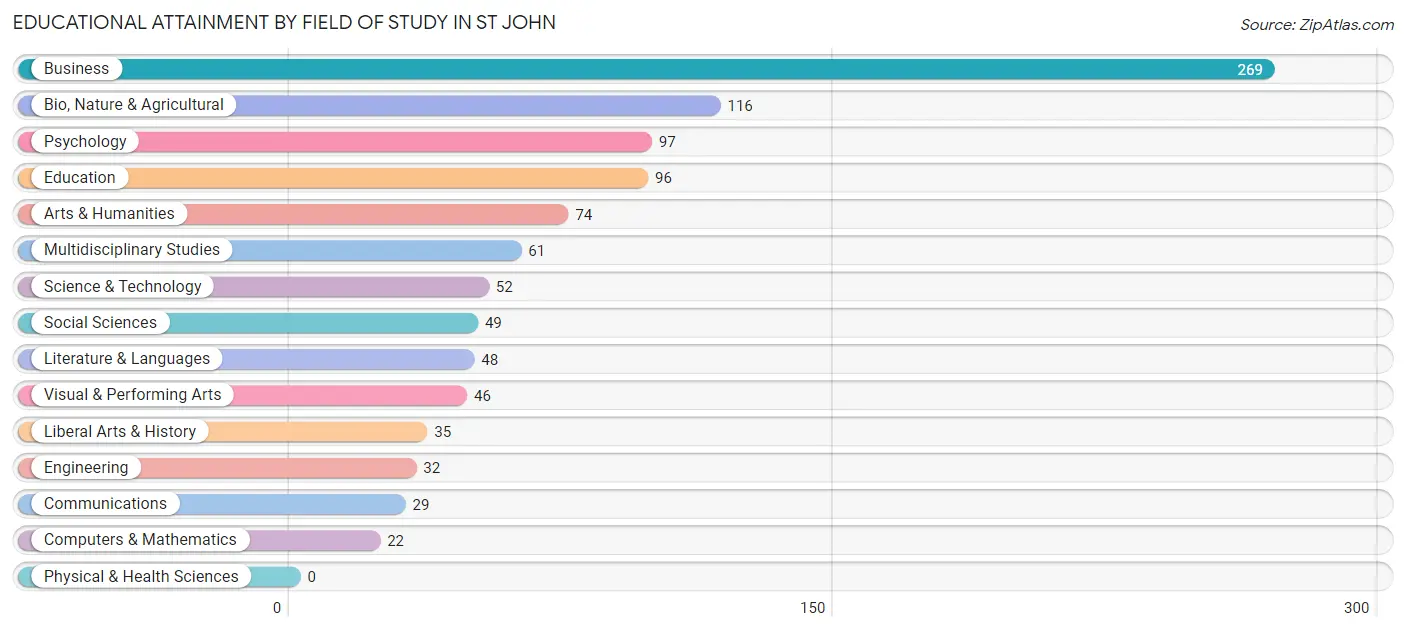
Educational Attainment by Field of Study in St John
Business (269 | 26.2%), bio, nature & agricultural (116 | 11.3%), psychology (97 | 9.5%), education (96 | 9.4%), and arts & humanities (74 | 7.2%) are the most common fields of study among 1,026 individuals in St John who have obtained a bachelor's degree or higher.
| Field of Study | # Graduates | % Graduates |
| Computers & Mathematics | 22 | 2.1% |
| Bio, Nature & Agricultural | 116 | 11.3% |
| Physical & Health Sciences | 0 | 0.0% |
| Psychology | 97 | 9.5% |
| Social Sciences | 49 | 4.8% |
| Engineering | 32 | 3.1% |
| Multidisciplinary Studies | 61 | 5.9% |
| Science & Technology | 52 | 5.1% |
| Business | 269 | 26.2% |
| Education | 96 | 9.4% |
| Literature & Languages | 48 | 4.7% |
| Liberal Arts & History | 35 | 3.4% |
| Visual & Performing Arts | 46 | 4.5% |
| Communications | 29 | 2.8% |
| Arts & Humanities | 74 | 7.2% |
| Total | 1,026 | 100.0% |
Transportation & Commute in St John
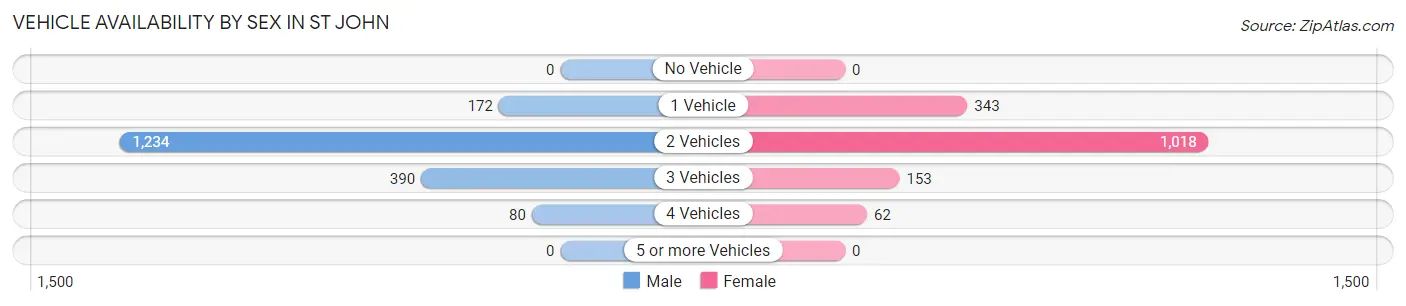
Vehicle Availability by Sex in St John
The most prevalent vehicle ownership categories in St John are males with 2 vehicles (1,234, accounting for 65.8%) and females with 2 vehicles (1,018, making up 78.3%).
| Vehicles Available | Male | Female |
| No Vehicle | 0 (0.0%) | 0 (0.0%) |
| 1 Vehicle | 172 (9.2%) | 343 (21.8%) |
| 2 Vehicles | 1,234 (65.8%) | 1,018 (64.6%) |
| 3 Vehicles | 390 (20.8%) | 153 (9.7%) |
| 4 Vehicles | 80 (4.3%) | 62 (3.9%) |
| 5 or more Vehicles | 0 (0.0%) | 0 (0.0%) |
| Total | 1,876 (100.0%) | 1,576 (100.0%) |
Commute Time in St John
The most frequently occuring commute durations in St John are 20 to 24 minutes (849 commuters, 27.0%), 15 to 19 minutes (545 commuters, 17.3%), and 10 to 14 minutes (533 commuters, 16.9%).
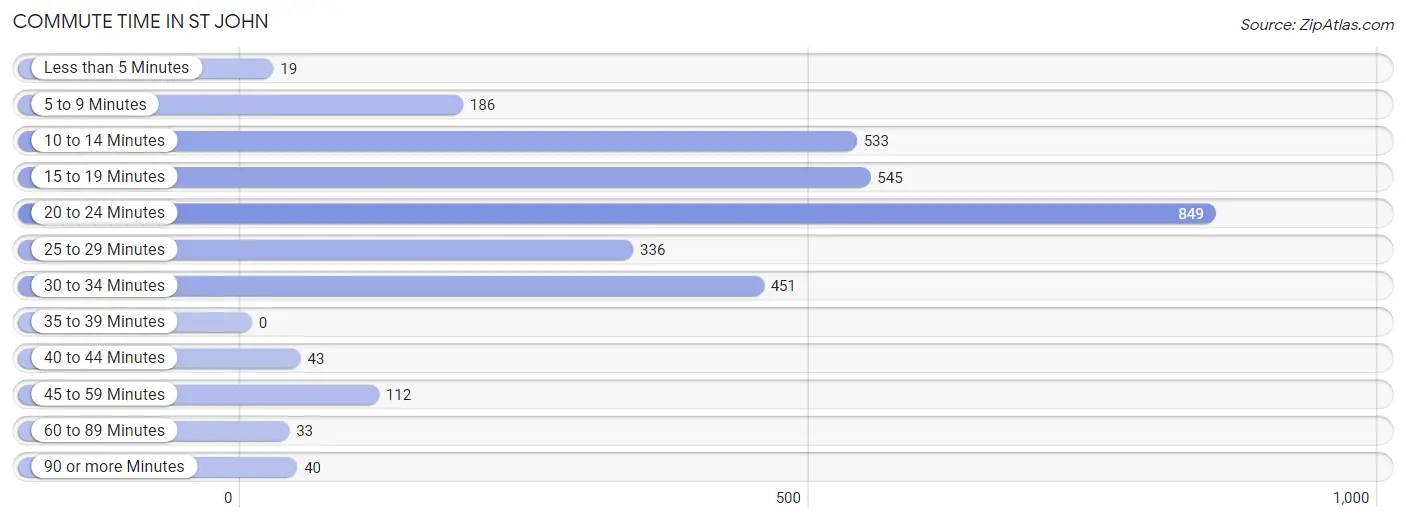
| Commute Time | # Commuters | % Commuters |
| Less than 5 Minutes | 19 | 0.6% |
| 5 to 9 Minutes | 186 | 5.9% |
| 10 to 14 Minutes | 533 | 16.9% |
| 15 to 19 Minutes | 545 | 17.3% |
| 20 to 24 Minutes | 849 | 27.0% |
| 25 to 29 Minutes | 336 | 10.7% |
| 30 to 34 Minutes | 451 | 14.3% |
| 35 to 39 Minutes | 0 | 0.0% |
| 40 to 44 Minutes | 43 | 1.4% |
| 45 to 59 Minutes | 112 | 3.6% |
| 60 to 89 Minutes | 33 | 1.1% |
| 90 or more Minutes | 40 | 1.3% |
Commute Time by Sex in St John
The most common commute times in St John are 20 to 24 minutes (518 commuters, 30.6%) for males and 20 to 24 minutes (331 commuters, 22.8%) for females.
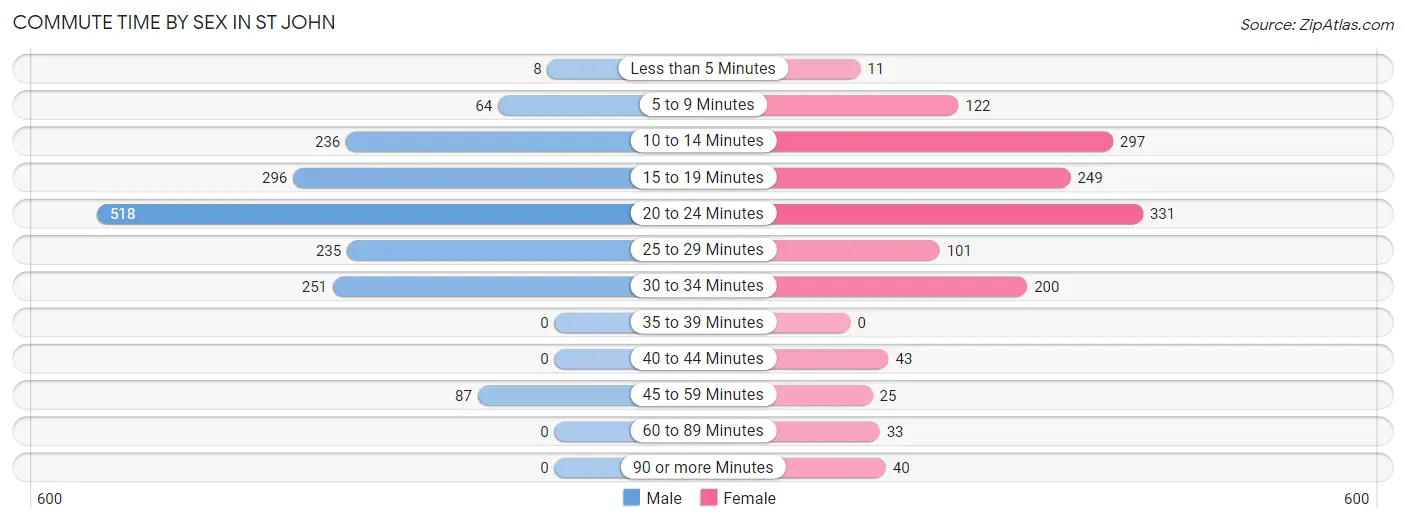
| Commute Time | Male | Female |
| Less than 5 Minutes | 8 (0.5%) | 11 (0.8%) |
| 5 to 9 Minutes | 64 (3.8%) | 122 (8.4%) |
| 10 to 14 Minutes | 236 (13.9%) | 297 (20.4%) |
| 15 to 19 Minutes | 296 (17.5%) | 249 (17.2%) |
| 20 to 24 Minutes | 518 (30.6%) | 331 (22.8%) |
| 25 to 29 Minutes | 235 (13.9%) | 101 (7.0%) |
| 30 to 34 Minutes | 251 (14.8%) | 200 (13.8%) |
| 35 to 39 Minutes | 0 (0.0%) | 0 (0.0%) |
| 40 to 44 Minutes | 0 (0.0%) | 43 (3.0%) |
| 45 to 59 Minutes | 87 (5.1%) | 25 (1.7%) |
| 60 to 89 Minutes | 0 (0.0%) | 33 (2.3%) |
| 90 or more Minutes | 0 (0.0%) | 40 (2.8%) |
Time of Departure to Work by Sex in St John
The most frequent times of departure to work in St John are 7:00 AM to 7:29 AM (414, 24.4%) for males and 7:00 AM to 7:29 AM (263, 18.1%) for females.
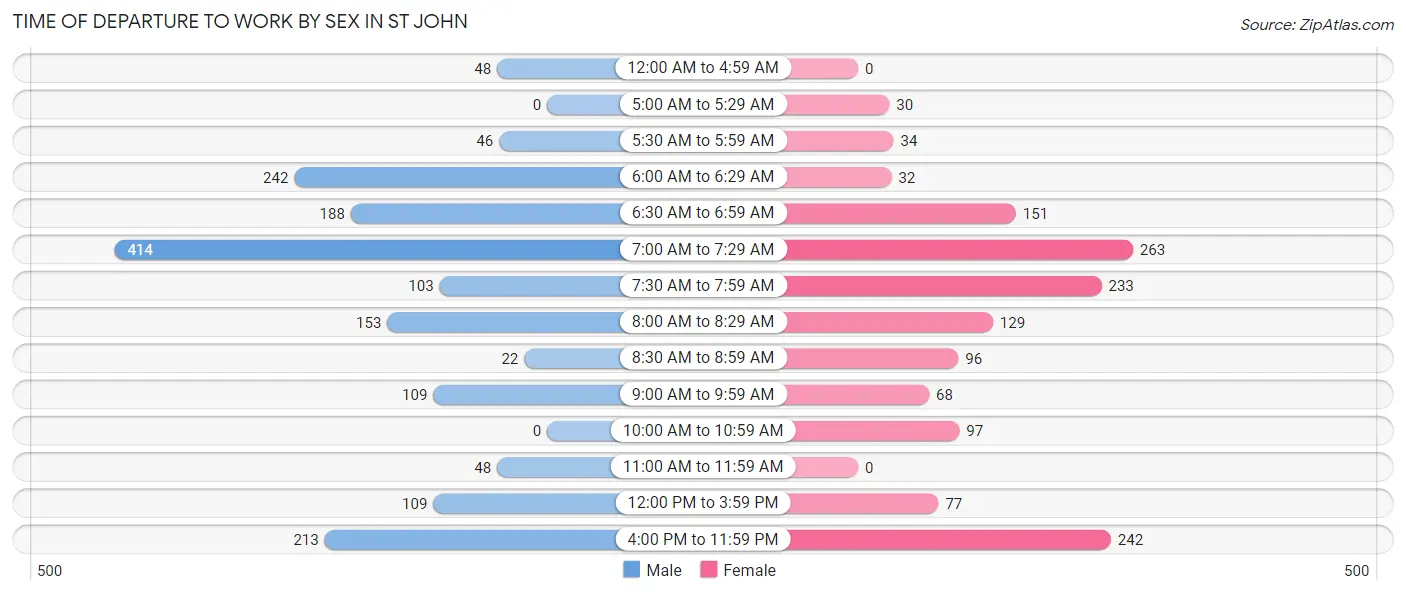
| Time of Departure | Male | Female |
| 12:00 AM to 4:59 AM | 48 (2.8%) | 0 (0.0%) |
| 5:00 AM to 5:29 AM | 0 (0.0%) | 30 (2.1%) |
| 5:30 AM to 5:59 AM | 46 (2.7%) | 34 (2.3%) |
| 6:00 AM to 6:29 AM | 242 (14.3%) | 32 (2.2%) |
| 6:30 AM to 6:59 AM | 188 (11.1%) | 151 (10.4%) |
| 7:00 AM to 7:29 AM | 414 (24.4%) | 263 (18.1%) |
| 7:30 AM to 7:59 AM | 103 (6.1%) | 233 (16.1%) |
| 8:00 AM to 8:29 AM | 153 (9.0%) | 129 (8.9%) |
| 8:30 AM to 8:59 AM | 22 (1.3%) | 96 (6.6%) |
| 9:00 AM to 9:59 AM | 109 (6.4%) | 68 (4.7%) |
| 10:00 AM to 10:59 AM | 0 (0.0%) | 97 (6.7%) |
| 11:00 AM to 11:59 AM | 48 (2.8%) | 0 (0.0%) |
| 12:00 PM to 3:59 PM | 109 (6.4%) | 77 (5.3%) |
| 4:00 PM to 11:59 PM | 213 (12.6%) | 242 (16.7%) |
| Total | 1,695 (100.0%) | 1,452 (100.0%) |
Housing Occupancy in St John
Occupancy by Ownership in St John
Of the total 2,820 dwellings in St John, owner-occupied units account for 1,547 (54.9%), while renter-occupied units make up 1,273 (45.1%).
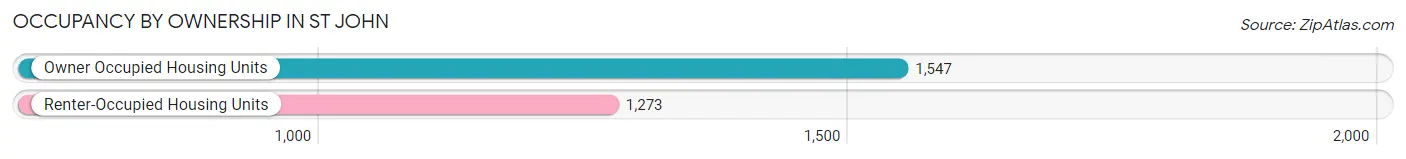
| Occupancy | # Housing Units | % Housing Units |
| Owner Occupied Housing Units | 1,547 | 54.9% |
| Renter-Occupied Housing Units | 1,273 | 45.1% |
| Total Occupied Housing Units | 2,820 | 100.0% |
Occupancy by Household Size in St John
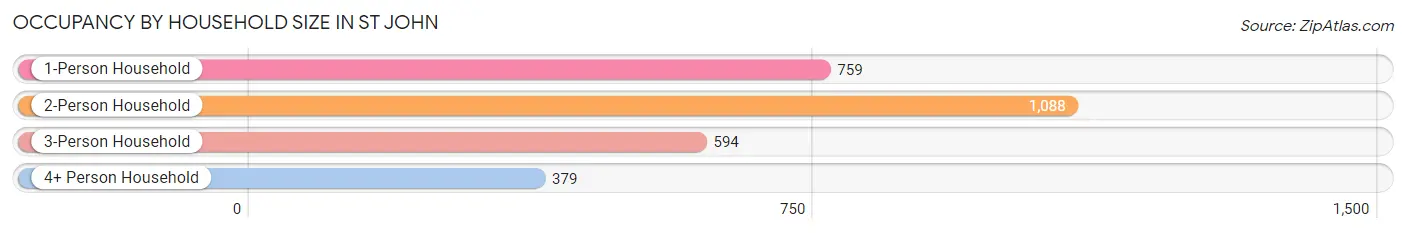
| Household Size | # Housing Units | % Housing Units |
| 1-Person Household | 759 | 26.9% |
| 2-Person Household | 1,088 | 38.6% |
| 3-Person Household | 594 | 21.1% |
| 4+ Person Household | 379 | 13.4% |
| Total Housing Units | 2,820 | 100.0% |
Occupancy by Ownership by Household Size in St John
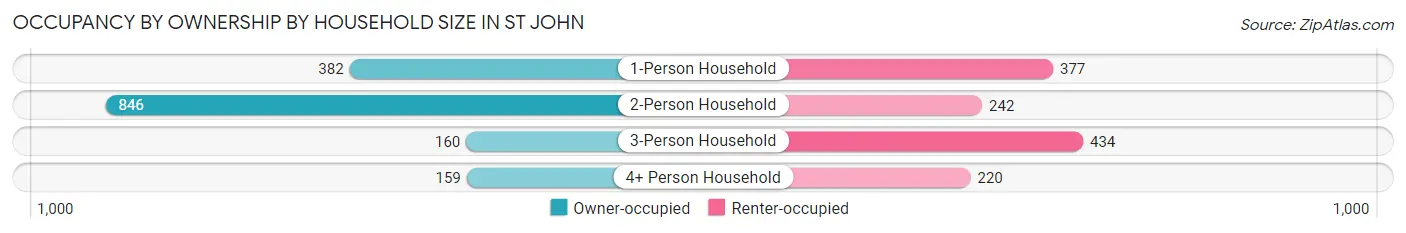
| Household Size | Owner-occupied | Renter-occupied |
| 1-Person Household | 382 (50.3%) | 377 (49.7%) |
| 2-Person Household | 846 (77.8%) | 242 (22.2%) |
| 3-Person Household | 160 (26.9%) | 434 (73.1%) |
| 4+ Person Household | 159 (41.9%) | 220 (58.1%) |
| Total Housing Units | 1,547 (54.9%) | 1,273 (45.1%) |
Occupancy by Educational Attainment in St John
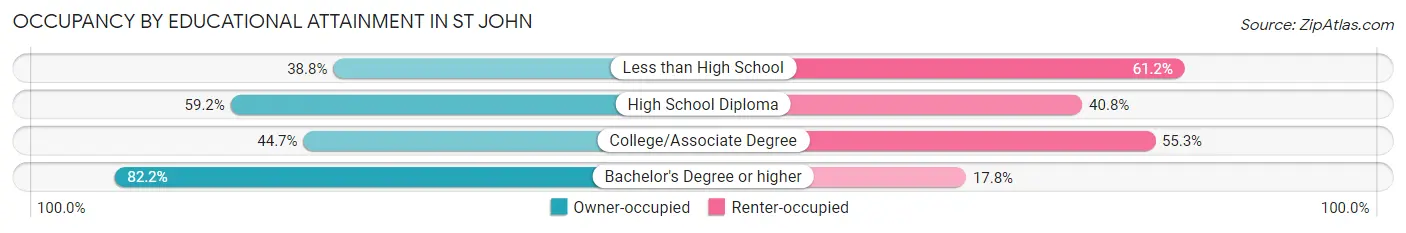
| Household Size | Owner-occupied | Renter-occupied |
| Less than High School | 144 (38.8%) | 227 (61.2%) |
| High School Diploma | 562 (59.2%) | 388 (40.8%) |
| College/Associate Degree | 467 (44.7%) | 577 (55.3%) |
| Bachelor's Degree or higher | 374 (82.2%) | 81 (17.8%) |
Occupancy by Age of Householder in St John
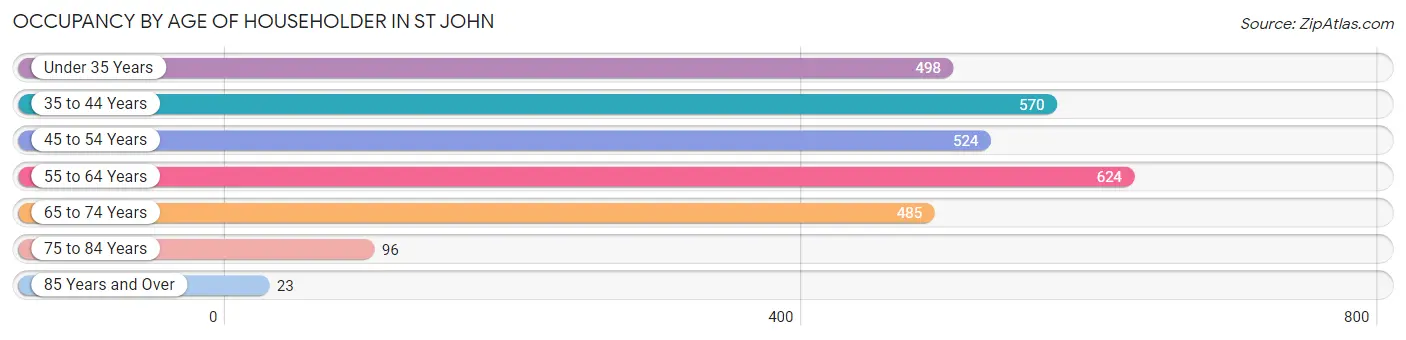
| Age Bracket | # Households | % Households |
| Under 35 Years | 498 | 17.7% |
| 35 to 44 Years | 570 | 20.2% |
| 45 to 54 Years | 524 | 18.6% |
| 55 to 64 Years | 624 | 22.1% |
| 65 to 74 Years | 485 | 17.2% |
| 75 to 84 Years | 96 | 3.4% |
| 85 Years and Over | 23 | 0.8% |
| Total | 2,820 | 100.0% |
Housing Finances in St John
Median Income by Occupancy in St John
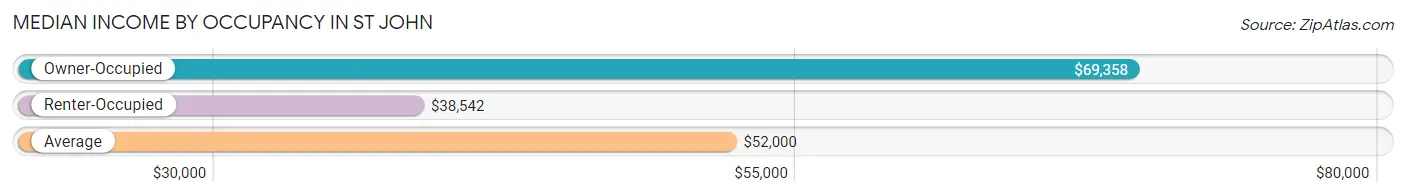
| Occupancy Type | # Households | Median Income |
| Owner-Occupied | 1,547 (54.9%) | $69,358 |
| Renter-Occupied | 1,273 (45.1%) | $38,542 |
| Average | 2,820 (100.0%) | $52,000 |
Occupancy by Householder Income Bracket in St John
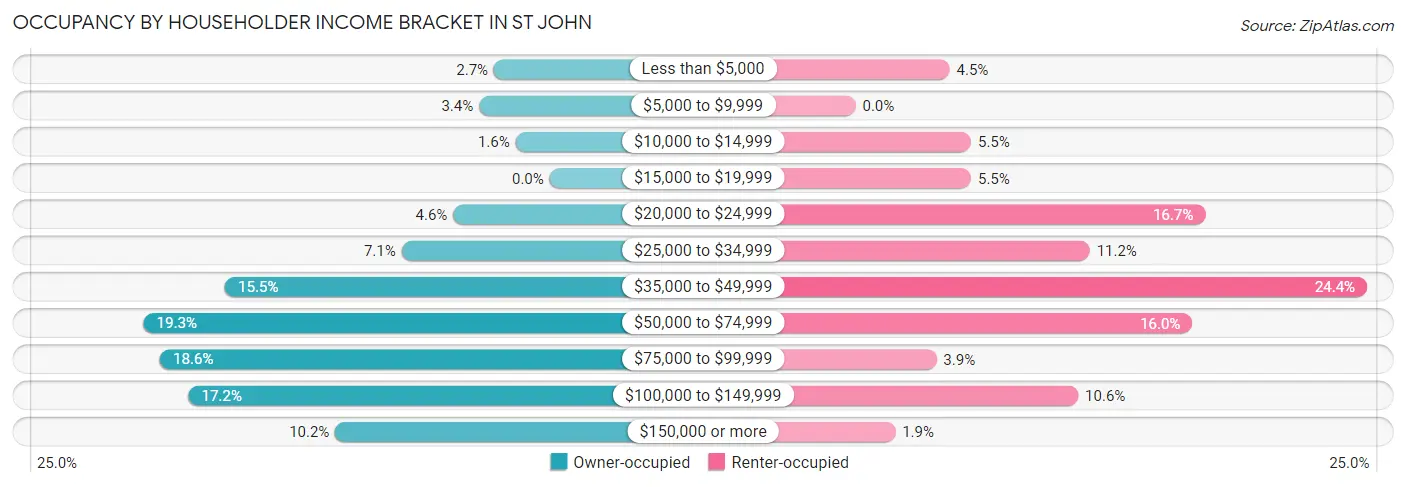
| Income Bracket | Owner-occupied | Renter-occupied |
| Less than $5,000 | 41 (2.6%) | 57 (4.5%) |
| $5,000 to $9,999 | 52 (3.4%) | 0 (0.0%) |
| $10,000 to $14,999 | 25 (1.6%) | 70 (5.5%) |
| $15,000 to $19,999 | 0 (0.0%) | 70 (5.5%) |
| $20,000 to $24,999 | 71 (4.6%) | 212 (16.7%) |
| $25,000 to $34,999 | 109 (7.0%) | 142 (11.2%) |
| $35,000 to $49,999 | 239 (15.4%) | 310 (24.3%) |
| $50,000 to $74,999 | 299 (19.3%) | 204 (16.0%) |
| $75,000 to $99,999 | 287 (18.5%) | 49 (3.8%) |
| $100,000 to $149,999 | 266 (17.2%) | 135 (10.6%) |
| $150,000 or more | 158 (10.2%) | 24 (1.9%) |
| Total | 1,547 (100.0%) | 1,273 (100.0%) |
Monthly Housing Cost Tiers in St John
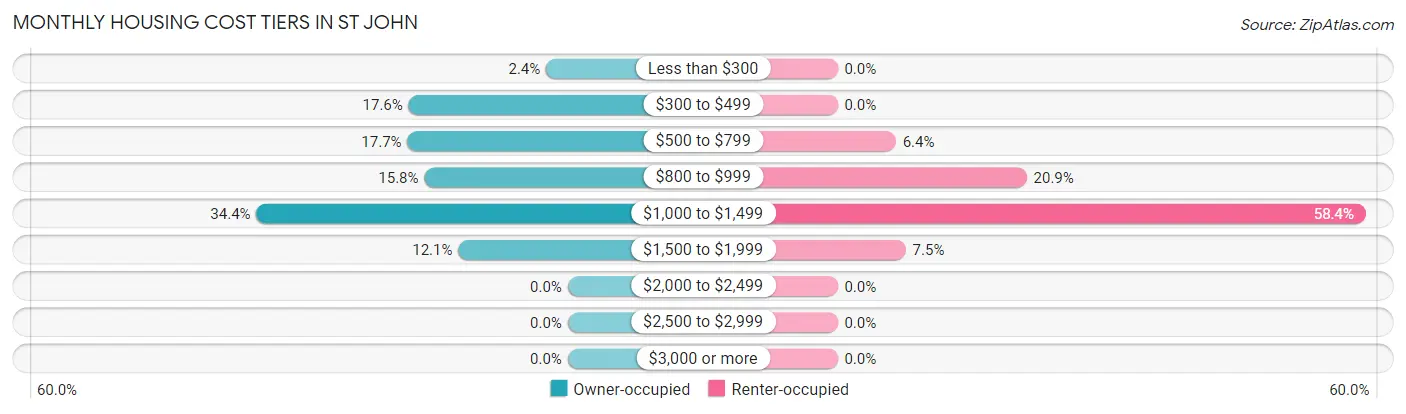
| Monthly Cost | Owner-occupied | Renter-occupied |
| Less than $300 | 37 (2.4%) | 0 (0.0%) |
| $300 to $499 | 272 (17.6%) | 0 (0.0%) |
| $500 to $799 | 274 (17.7%) | 82 (6.4%) |
| $800 to $999 | 245 (15.8%) | 266 (20.9%) |
| $1,000 to $1,499 | 532 (34.4%) | 743 (58.4%) |
| $1,500 to $1,999 | 187 (12.1%) | 96 (7.5%) |
| $2,000 to $2,499 | 0 (0.0%) | 0 (0.0%) |
| $2,500 to $2,999 | 0 (0.0%) | 0 (0.0%) |
| $3,000 or more | 0 (0.0%) | 0 (0.0%) |
| Total | 1,547 (100.0%) | 1,273 (100.0%) |
Physical Housing Characteristics in St John
Housing Structures in St John
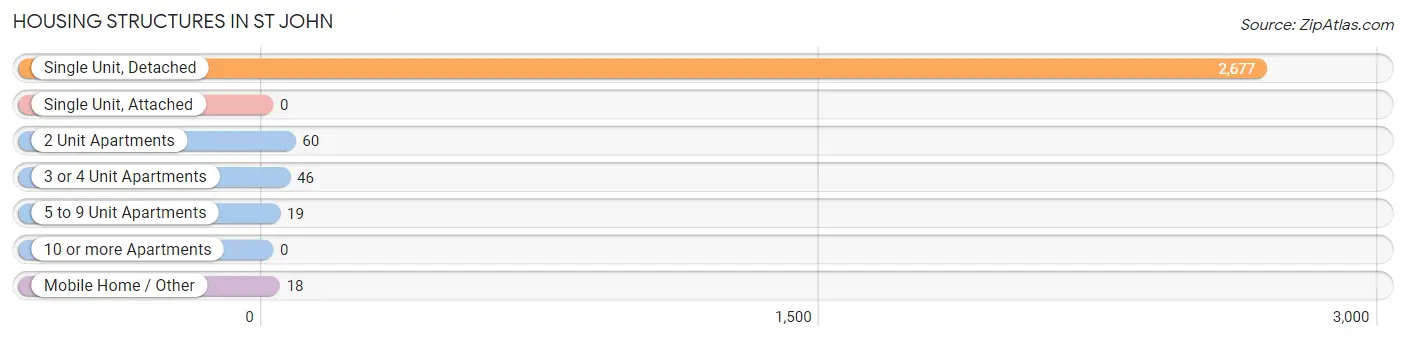
| Structure Type | # Housing Units | % Housing Units |
| Single Unit, Detached | 2,677 | 94.9% |
| Single Unit, Attached | 0 | 0.0% |
| 2 Unit Apartments | 60 | 2.1% |
| 3 or 4 Unit Apartments | 46 | 1.6% |
| 5 to 9 Unit Apartments | 19 | 0.7% |
| 10 or more Apartments | 0 | 0.0% |
| Mobile Home / Other | 18 | 0.6% |
| Total | 2,820 | 100.0% |
Housing Structures by Occupancy in St John
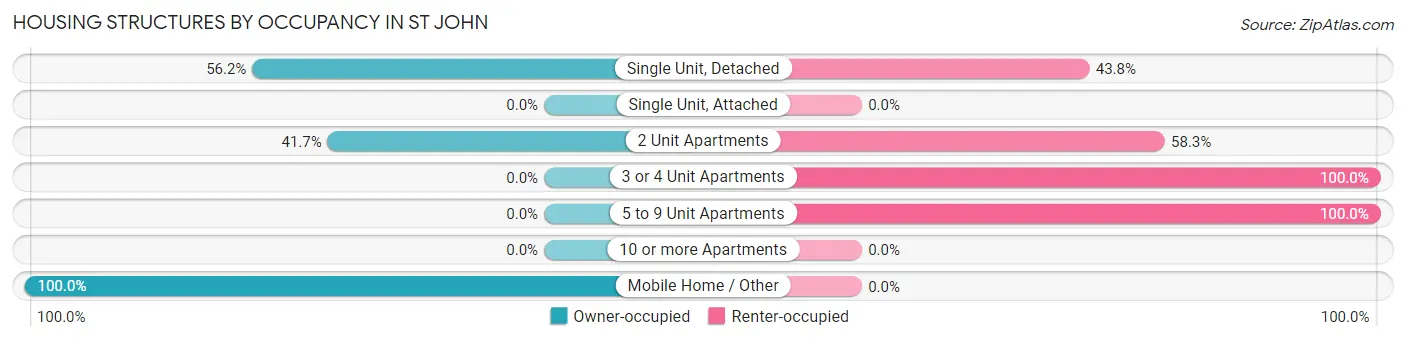
| Structure Type | Owner-occupied | Renter-occupied |
| Single Unit, Detached | 1,504 (56.2%) | 1,173 (43.8%) |
| Single Unit, Attached | 0 (0.0%) | 0 (0.0%) |
| 2 Unit Apartments | 25 (41.7%) | 35 (58.3%) |
| 3 or 4 Unit Apartments | 0 (0.0%) | 46 (100.0%) |
| 5 to 9 Unit Apartments | 0 (0.0%) | 19 (100.0%) |
| 10 or more Apartments | 0 (0.0%) | 0 (0.0%) |
| Mobile Home / Other | 18 (100.0%) | 0 (0.0%) |
| Total | 1,547 (54.9%) | 1,273 (45.1%) |
Housing Structures by Number of Rooms in St John
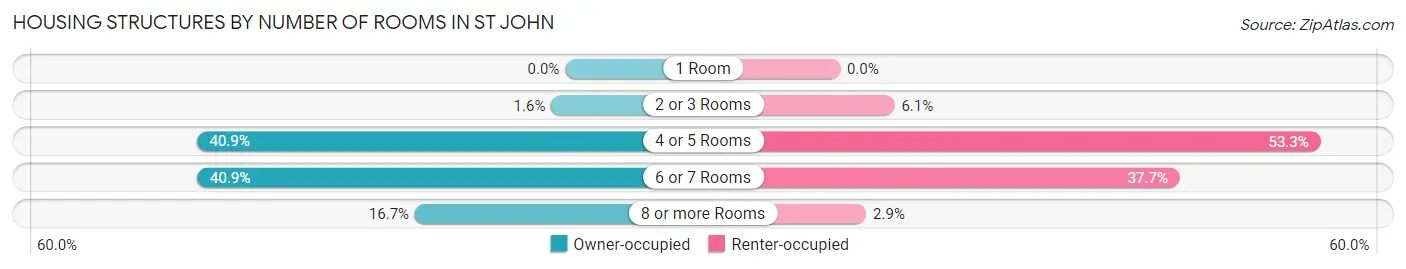
| Number of Rooms | Owner-occupied | Renter-occupied |
| 1 Room | 0 (0.0%) | 0 (0.0%) |
| 2 or 3 Rooms | 24 (1.5%) | 77 (6.0%) |
| 4 or 5 Rooms | 633 (40.9%) | 679 (53.3%) |
| 6 or 7 Rooms | 632 (40.8%) | 480 (37.7%) |
| 8 or more Rooms | 258 (16.7%) | 37 (2.9%) |
| Total | 1,547 (100.0%) | 1,273 (100.0%) |
Housing Structure by Heating Type in St John
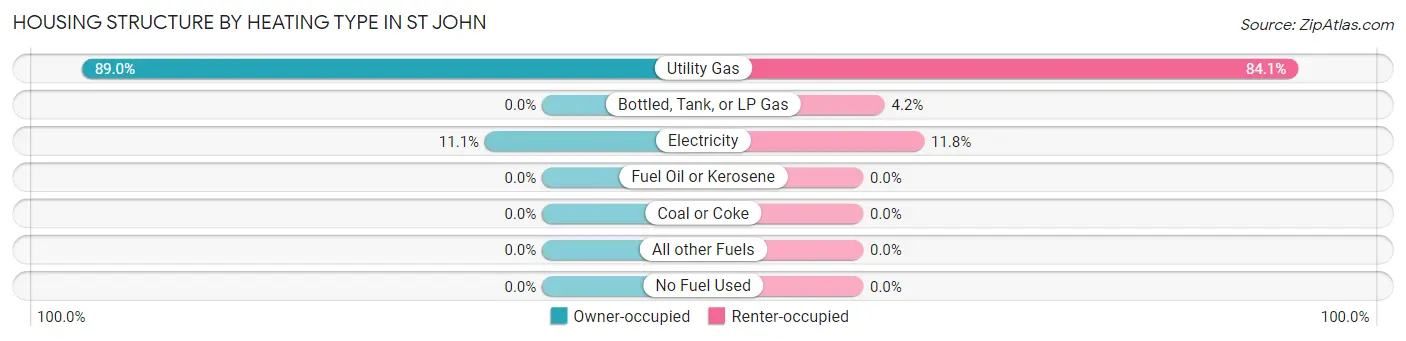
| Heating Type | Owner-occupied | Renter-occupied |
| Utility Gas | 1,376 (88.9%) | 1,070 (84.1%) |
| Bottled, Tank, or LP Gas | 0 (0.0%) | 53 (4.2%) |
| Electricity | 171 (11.1%) | 150 (11.8%) |
| Fuel Oil or Kerosene | 0 (0.0%) | 0 (0.0%) |
| Coal or Coke | 0 (0.0%) | 0 (0.0%) |
| All other Fuels | 0 (0.0%) | 0 (0.0%) |
| No Fuel Used | 0 (0.0%) | 0 (0.0%) |
| Total | 1,547 (100.0%) | 1,273 (100.0%) |
Household Vehicle Usage in St John
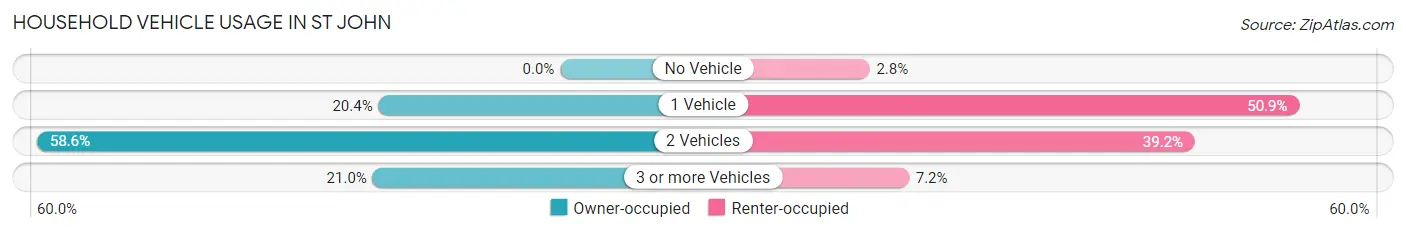
| Vehicles per Household | Owner-occupied | Renter-occupied |
| No Vehicle | 0 (0.0%) | 35 (2.8%) |
| 1 Vehicle | 315 (20.4%) | 648 (50.9%) |
| 2 Vehicles | 907 (58.6%) | 499 (39.2%) |
| 3 or more Vehicles | 325 (21.0%) | 91 (7.1%) |
| Total | 1,547 (100.0%) | 1,273 (100.0%) |
Real Estate & Mortgages in St John
Real Estate and Mortgage Overview in St John
| Characteristic | Without Mortgage | With Mortgage |
| Housing Units | 542 | 1,005 |
| Median Property Value | $88,000 | $89,400 |
| Median Household Income | $59,656 | $158 |
| Monthly Housing Costs | $473 | $0 |
| Real Estate Taxes | $1,797 | $20 |
Property Value by Mortgage Status in St John
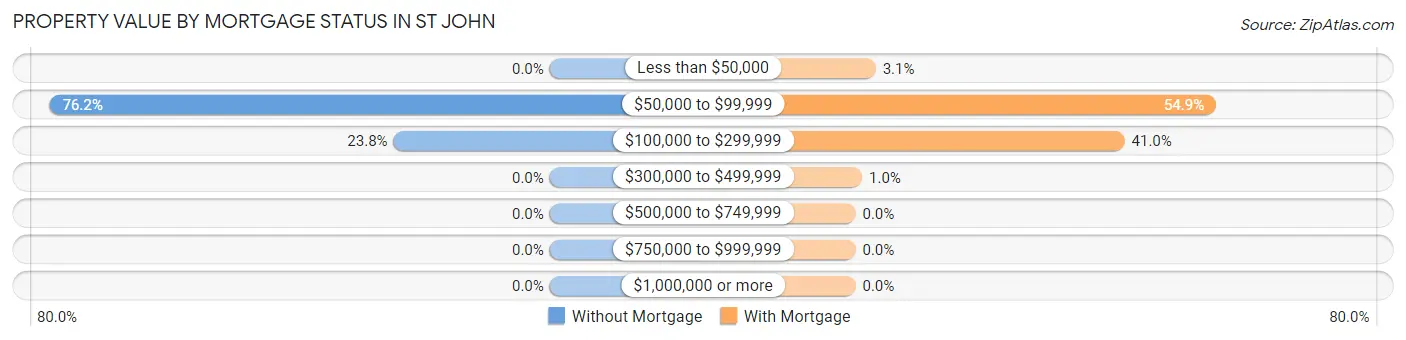
| Property Value | Without Mortgage | With Mortgage |
| Less than $50,000 | 0 (0.0%) | 31 (3.1%) |
| $50,000 to $99,999 | 413 (76.2%) | 552 (54.9%) |
| $100,000 to $299,999 | 129 (23.8%) | 412 (41.0%) |
| $300,000 to $499,999 | 0 (0.0%) | 10 (1.0%) |
| $500,000 to $749,999 | 0 (0.0%) | 0 (0.0%) |
| $750,000 to $999,999 | 0 (0.0%) | 0 (0.0%) |
| $1,000,000 or more | 0 (0.0%) | 0 (0.0%) |
| Total | 542 (100.0%) | 1,005 (100.0%) |
Household Income by Mortgage Status in St John
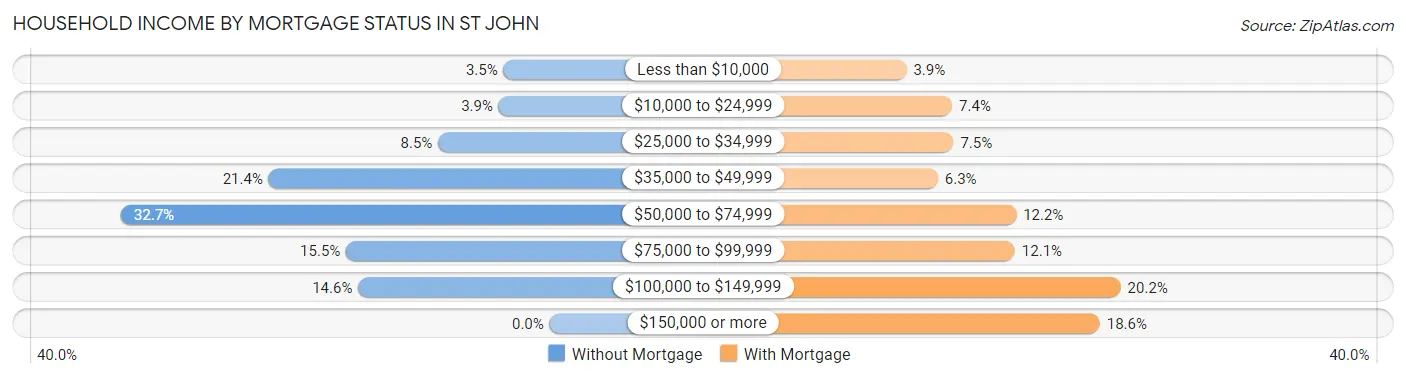
| Household Income | Without Mortgage | With Mortgage |
| Less than $10,000 | 19 (3.5%) | 39 (3.9%) |
| $10,000 to $24,999 | 21 (3.9%) | 74 (7.4%) |
| $25,000 to $34,999 | 46 (8.5%) | 75 (7.5%) |
| $35,000 to $49,999 | 116 (21.4%) | 63 (6.3%) |
| $50,000 to $74,999 | 177 (32.7%) | 123 (12.2%) |
| $75,000 to $99,999 | 84 (15.5%) | 122 (12.1%) |
| $100,000 to $149,999 | 79 (14.6%) | 203 (20.2%) |
| $150,000 or more | 0 (0.0%) | 187 (18.6%) |
| Total | 542 (100.0%) | 1,005 (100.0%) |
Property Value to Household Income Ratio in St John
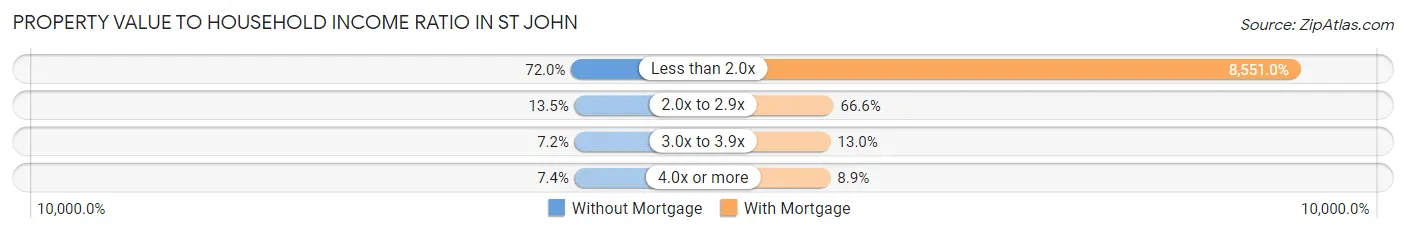
| Value-to-Income Ratio | Without Mortgage | With Mortgage |
| Less than 2.0x | 390 (72.0%) | 85,938 (8,551.0%) |
| 2.0x to 2.9x | 73 (13.5%) | 669 (66.6%) |
| 3.0x to 3.9x | 39 (7.2%) | 131 (13.0%) |
| 4.0x or more | 40 (7.4%) | 89 (8.9%) |
| Total | 542 (100.0%) | 1,005 (100.0%) |
Real Estate Taxes by Mortgage Status in St John
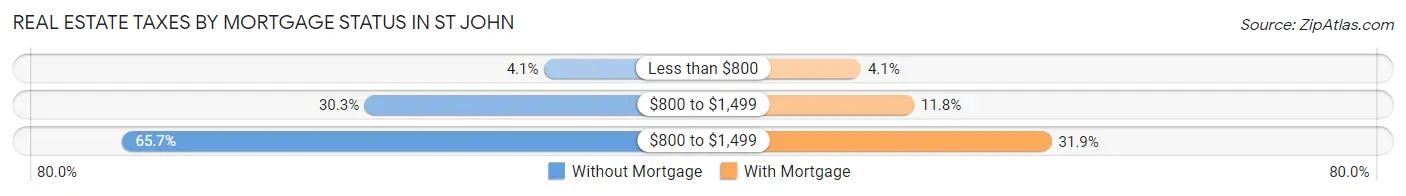
| Property Taxes | Without Mortgage | With Mortgage |
| Less than $800 | 22 (4.1%) | 41 (4.1%) |
| $800 to $1,499 | 164 (30.3%) | 119 (11.8%) |
| $800 to $1,499 | 356 (65.7%) | 321 (31.9%) |
| Total | 542 (100.0%) | 1,005 (100.0%) |
Health & Disability in St John
Health Insurance Coverage by Age in St John
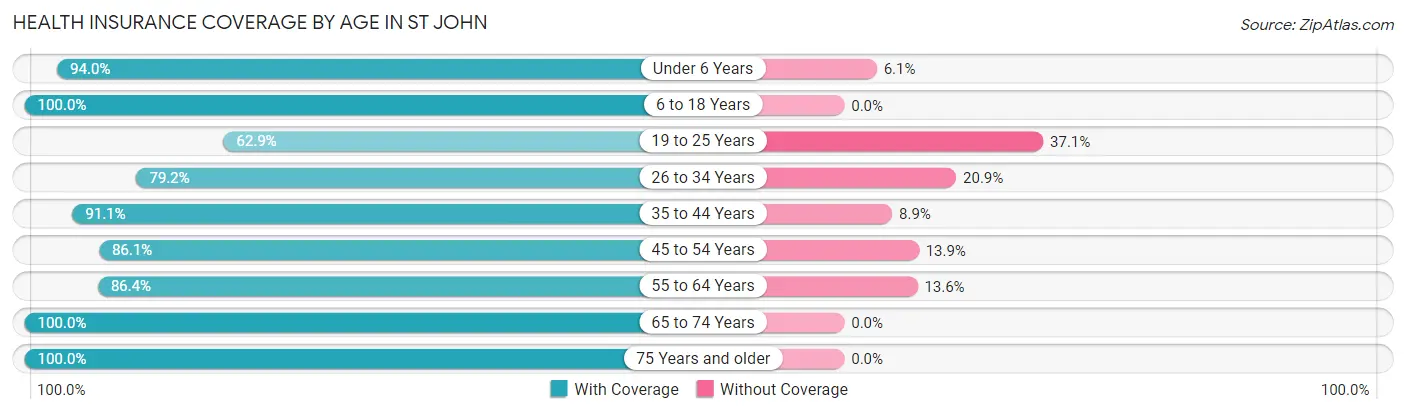
| Age Bracket | With Coverage | Without Coverage |
| Under 6 Years | 326 (94.0%) | 21 (6.0%) |
| 6 to 18 Years | 962 (100.0%) | 0 (0.0%) |
| 19 to 25 Years | 302 (62.9%) | 178 (37.1%) |
| 26 to 34 Years | 744 (79.1%) | 196 (20.8%) |
| 35 to 44 Years | 1,022 (91.1%) | 100 (8.9%) |
| 45 to 54 Years | 733 (86.1%) | 118 (13.9%) |
| 55 to 64 Years | 741 (86.4%) | 117 (13.6%) |
| 65 to 74 Years | 769 (100.0%) | 0 (0.0%) |
| 75 Years and older | 188 (100.0%) | 0 (0.0%) |
| Total | 5,787 (88.8%) | 730 (11.2%) |
Health Insurance Coverage by Citizenship Status in St John
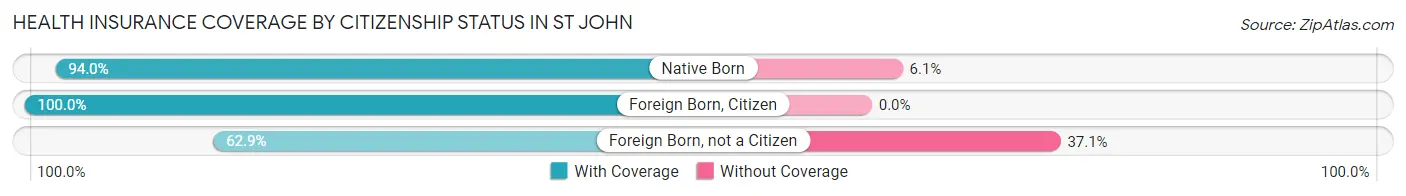
| Citizenship Status | With Coverage | Without Coverage |
| Native Born | 326 (94.0%) | 21 (6.0%) |
| Foreign Born, Citizen | 962 (100.0%) | 0 (0.0%) |
| Foreign Born, not a Citizen | 302 (62.9%) | 178 (37.1%) |
Health Insurance Coverage by Household Income in St John
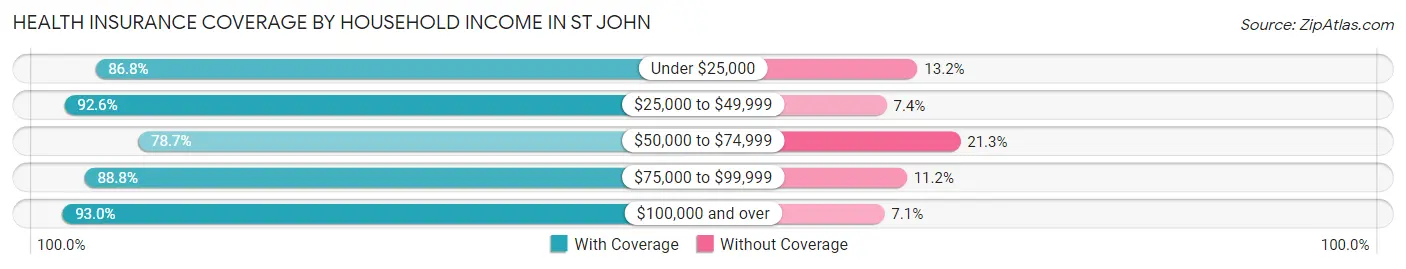
| Household Income | With Coverage | Without Coverage |
| Under $25,000 | 879 (86.8%) | 134 (13.2%) |
| $25,000 to $49,999 | 1,816 (92.6%) | 146 (7.4%) |
| $50,000 to $74,999 | 915 (78.7%) | 247 (21.3%) |
| $75,000 to $99,999 | 751 (88.8%) | 95 (11.2%) |
| $100,000 and over | 1,425 (92.9%) | 108 (7.0%) |
Public vs Private Health Insurance Coverage by Age in St John
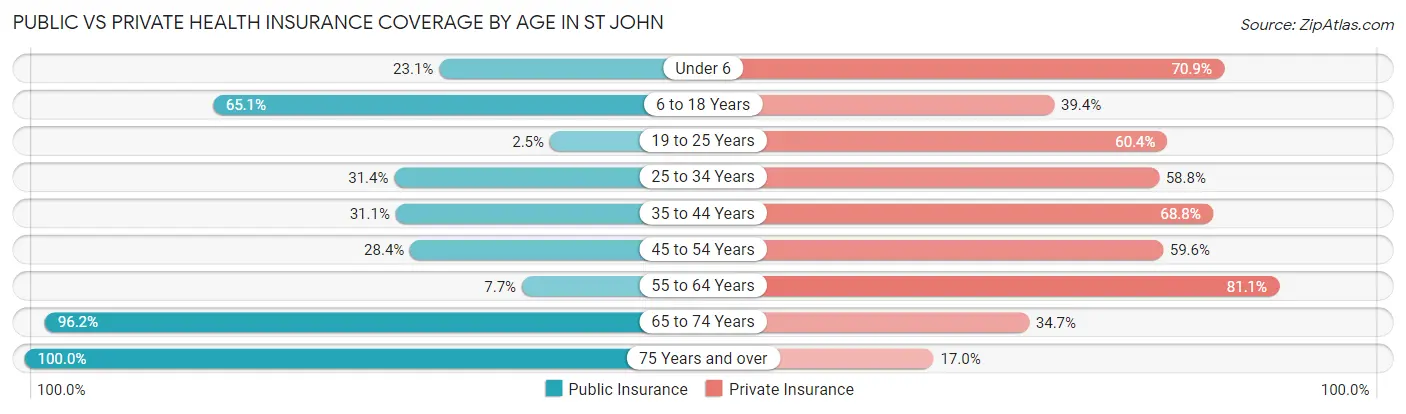
| Age Bracket | Public Insurance | Private Insurance |
| Under 6 | 80 (23.1%) | 246 (70.9%) |
| 6 to 18 Years | 626 (65.1%) | 379 (39.4%) |
| 19 to 25 Years | 12 (2.5%) | 290 (60.4%) |
| 25 to 34 Years | 295 (31.4%) | 553 (58.8%) |
| 35 to 44 Years | 349 (31.1%) | 772 (68.8%) |
| 45 to 54 Years | 242 (28.4%) | 507 (59.6%) |
| 55 to 64 Years | 66 (7.7%) | 696 (81.1%) |
| 65 to 74 Years | 740 (96.2%) | 267 (34.7%) |
| 75 Years and over | 188 (100.0%) | 32 (17.0%) |
| Total | 2,598 (39.9%) | 3,742 (57.4%) |
Disability Status by Sex by Age in St John
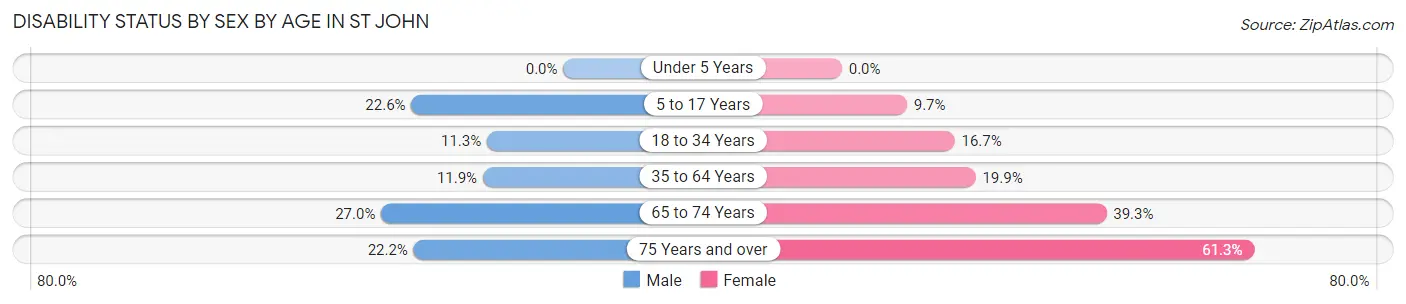
| Age Bracket | Male | Female |
| Under 5 Years | 0 (0.0%) | 0 (0.0%) |
| 5 to 17 Years | 81 (22.6%) | 50 (9.7%) |
| 18 to 34 Years | 93 (11.3%) | 116 (16.7%) |
| 35 to 64 Years | 163 (11.9%) | 291 (19.9%) |
| 65 to 74 Years | 126 (27.0%) | 119 (39.3%) |
| 75 Years and over | 24 (22.2%) | 49 (61.3%) |
Disability Class by Sex by Age in St John
Disability Class: Hearing Difficulty
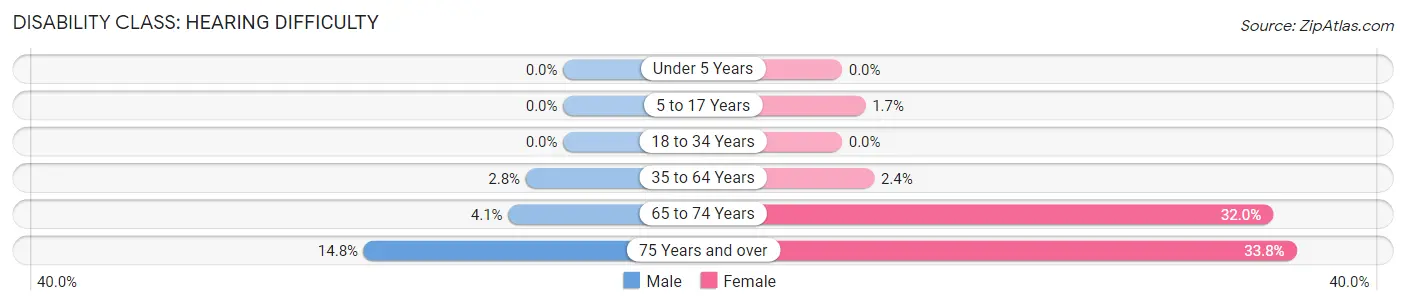
| Age Bracket | Male | Female |
| Under 5 Years | 0 (0.0%) | 0 (0.0%) |
| 5 to 17 Years | 0 (0.0%) | 9 (1.7%) |
| 18 to 34 Years | 0 (0.0%) | 0 (0.0%) |
| 35 to 64 Years | 38 (2.8%) | 35 (2.4%) |
| 65 to 74 Years | 19 (4.1%) | 97 (32.0%) |
| 75 Years and over | 16 (14.8%) | 27 (33.8%) |
Disability Class: Vision Difficulty
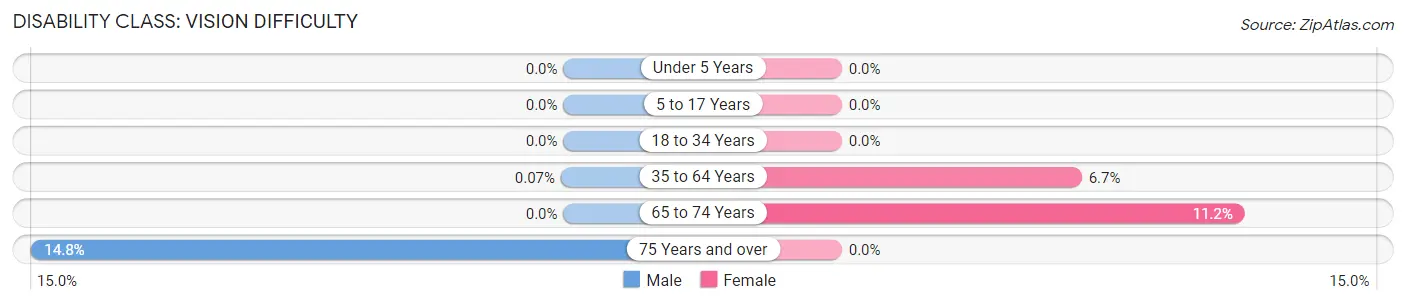
| Age Bracket | Male | Female |
| Under 5 Years | 0 (0.0%) | 0 (0.0%) |
| 5 to 17 Years | 0 (0.0%) | 0 (0.0%) |
| 18 to 34 Years | 0 (0.0%) | 0 (0.0%) |
| 35 to 64 Years | 1 (0.1%) | 98 (6.7%) |
| 65 to 74 Years | 0 (0.0%) | 34 (11.2%) |
| 75 Years and over | 16 (14.8%) | 0 (0.0%) |
Disability Class: Cognitive Difficulty
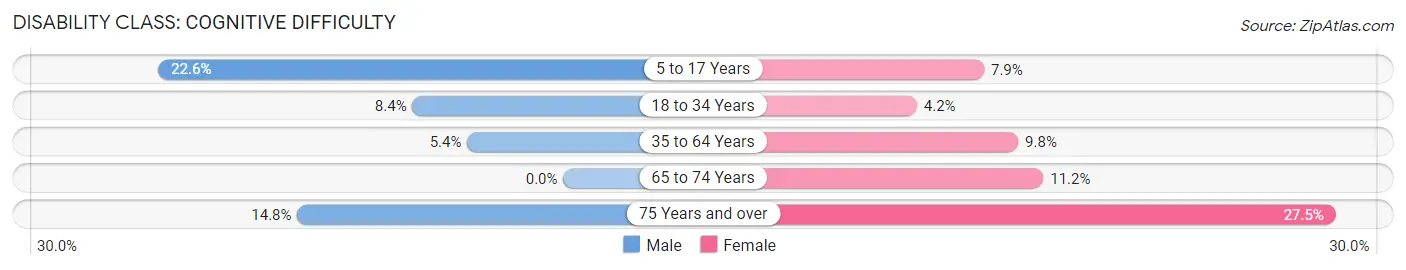
| Age Bracket | Male | Female |
| 5 to 17 Years | 81 (22.6%) | 41 (7.9%) |
| 18 to 34 Years | 69 (8.4%) | 29 (4.2%) |
| 35 to 64 Years | 73 (5.3%) | 144 (9.8%) |
| 65 to 74 Years | 0 (0.0%) | 34 (11.2%) |
| 75 Years and over | 16 (14.8%) | 22 (27.5%) |
Disability Class: Ambulatory Difficulty
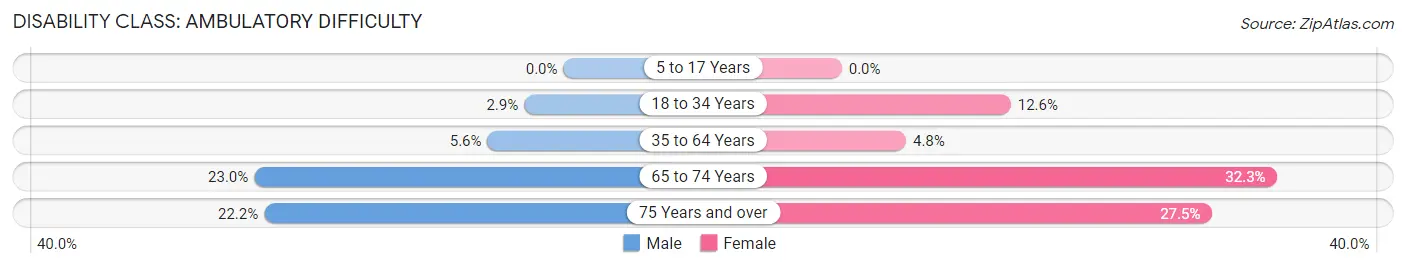
| Age Bracket | Male | Female |
| 5 to 17 Years | 0 (0.0%) | 0 (0.0%) |
| 18 to 34 Years | 24 (2.9%) | 87 (12.6%) |
| 35 to 64 Years | 77 (5.6%) | 70 (4.8%) |
| 65 to 74 Years | 107 (23.0%) | 98 (32.3%) |
| 75 Years and over | 24 (22.2%) | 22 (27.5%) |
Disability Class: Self-Care Difficulty
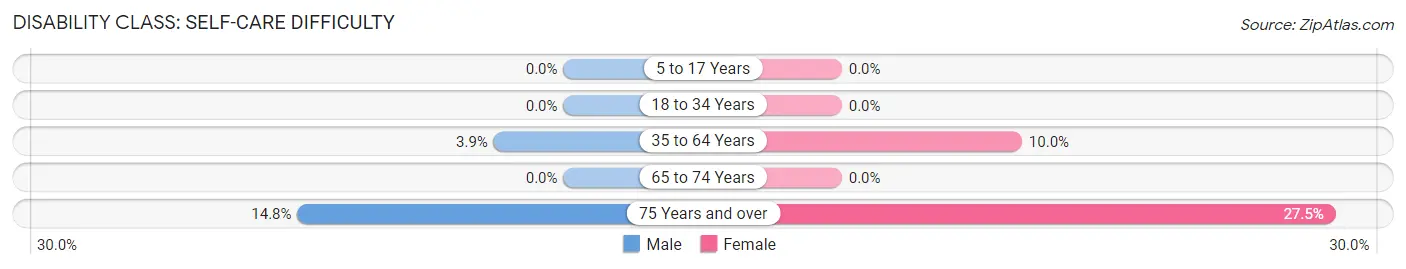
| Age Bracket | Male | Female |
| 5 to 17 Years | 0 (0.0%) | 0 (0.0%) |
| 18 to 34 Years | 0 (0.0%) | 0 (0.0%) |
| 35 to 64 Years | 53 (3.9%) | 147 (10.0%) |
| 65 to 74 Years | 0 (0.0%) | 0 (0.0%) |
| 75 Years and over | 16 (14.8%) | 22 (27.5%) |
Technology Access in St John
Computing Device Access in St John
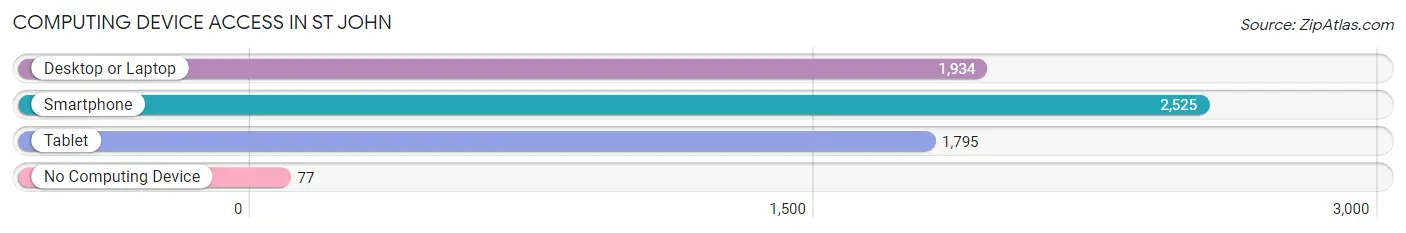
| Device Type | # Households | % Households |
| Desktop or Laptop | 1,934 | 68.6% |
| Smartphone | 2,525 | 89.5% |
| Tablet | 1,795 | 63.6% |
| No Computing Device | 77 | 2.7% |
| Total | 2,820 | 100.0% |
Internet Access in St John
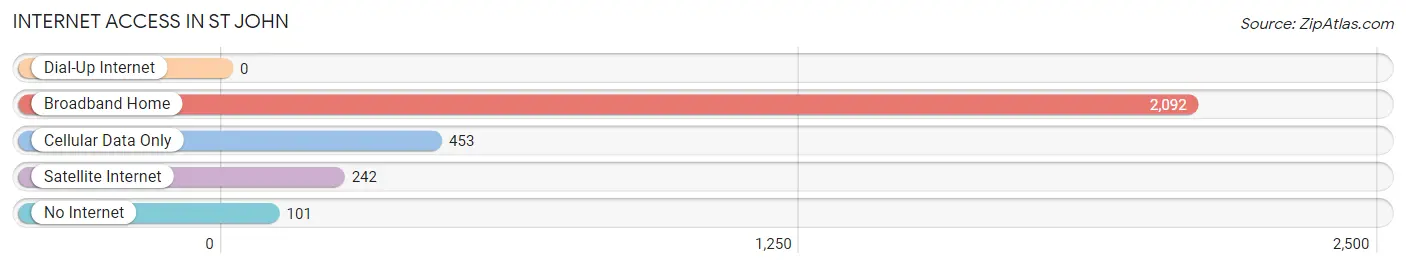
| Internet Type | # Households | % Households |
| Dial-Up Internet | 0 | 0.0% |
| Broadband Home | 2,092 | 74.2% |
| Cellular Data Only | 453 | 16.1% |
| Satellite Internet | 242 | 8.6% |
| No Internet | 101 | 3.6% |
| Total | 2,820 | 100.0% |
St John Summary
John, Missouri is a small town located in the southeastern corner of the state, in St. Francois County. It is situated on the banks of the Big River, and is surrounded by rolling hills and lush forests. The town was founded in 1818, and has a population of approximately 1,000 people.
John is a rural community with a rich history. It was originally settled by French-Canadian fur traders, who established a trading post in the area. The town was later settled by German immigrants, who established a number of businesses in the area. The town was named after St. John the Baptist, and the local church is named in his honor.
John is located in the Ozark Mountains, and is known for its scenic beauty. The town is surrounded by rolling hills, lush forests, and numerous streams and rivers. The Big River runs through the town, and is a popular spot for fishing and canoeing. The town is also home to several parks, including the St. John State Park, which offers camping, hiking, and other outdoor activities.
John is a small town with a strong economy. The town is home to several businesses, including a grocery store, a hardware store, and a number of restaurants. The town also has a number of small manufacturing businesses, which produce a variety of products, including furniture, clothing, and other items. The town is also home to a number of farms, which produce a variety of crops, including corn, soybeans, and wheat.
John is a diverse community, with a population that is made up of a variety of ethnic backgrounds. The town is home to a large number of African-Americans, as well as a significant number of Hispanics and Native Americans. The town also has a large number of immigrants, including those from Mexico, Central America, and Asia.
John is a small town with a rich history and a strong economy. The town is home to a variety of businesses, and is surrounded by beautiful scenery. The town is also home to a diverse population, and is a great place to live and work.
Common Questions
What is Per Capita Income in St John?
Per Capita income in St John is $32,021.
What is the Median Family Income in St John?
Median Family Income in St John is $59,268.
What is the Median Household income in St John?
Median Household Income in St John is $52,000.
What is Income or Wage Gap in St John?
Income or Wage Gap in St John is 3.7%.
Women in St John earn 96.3 cents for every dollar earned by a man.
What is Inequality or Gini Index in St John?
Inequality or Gini Index in St John is 0.46.
What is the Total Population of St John?
Total Population of St John is 6,583.
What is the Total Male Population of St John?
Total Male Population of St John is 3,326.
What is the Total Female Population of St John?
Total Female Population of St John is 3,257.
What is the Ratio of Males per 100 Females in St John?
There are 102.12 Males per 100 Females in St John.
What is the Ratio of Females per 100 Males in St John?
There are 97.93 Females per 100 Males in St John.
What is the Median Population Age in St John?
Median Population Age in St John is 39.6 Years.
What is the Average Family Size in St John
Average Family Size in St John is 2.7 People.
What is the Average Household Size in St John
Average Household Size in St John is 2.3 People.
How Large is the Labor Force in St John?
There are 3,684 People in the Labor Forcein in St John.
What is the Percentage of People in the Labor Force in St John?
68.2% of People are in the Labor Force in St John.
What is the Unemployment Rate in St John?
Unemployment Rate in St John is 6.0%.