Vinita Park, MO Map & Demographics
Vinita Park Map
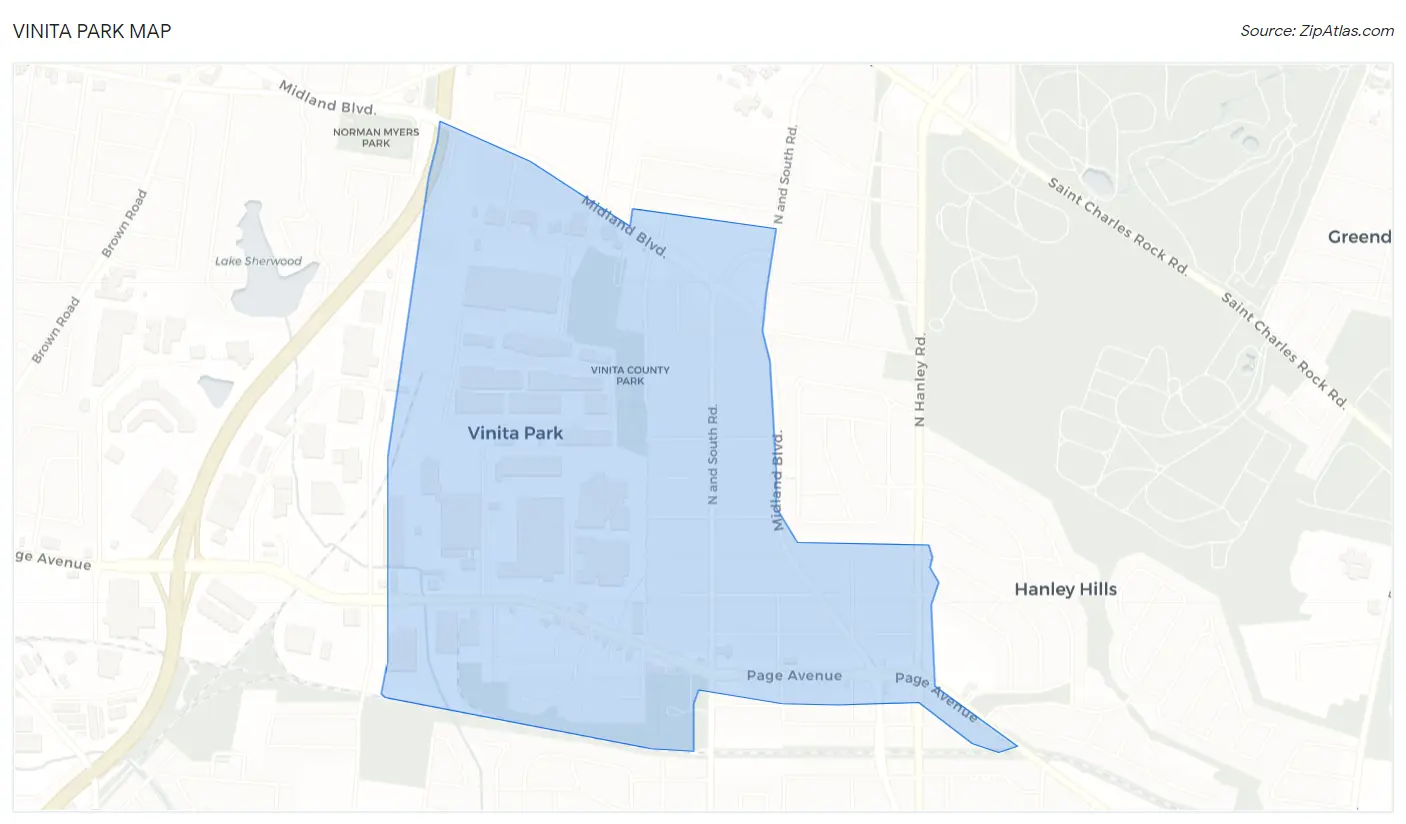
Vinita Park Overview
$31,618
PER CAPITA INCOME
$58,750
AVG FAMILY INCOME
$50,964
AVG HOUSEHOLD INCOME
29.2%
WAGE / INCOME GAP [ % ]
70.8¢/ $1
WAGE / INCOME GAP [ $ ]
$8,749
FAMILY INCOME DEFICIT
0.39
INEQUALITY / GINI INDEX
1,857
TOTAL POPULATION
925
MALE POPULATION
932
FEMALE POPULATION
99.25
MALES / 100 FEMALES
100.76
FEMALES / 100 MALES
40.8
MEDIAN AGE
3.0
AVG FAMILY SIZE
2.1
AVG HOUSEHOLD SIZE
1,135
LABOR FORCE [ PEOPLE ]
74.5%
PERCENT IN LABOR FORCE
9.9%
UNEMPLOYMENT RATE
Income in Vinita Park
Income Overview in Vinita Park
Per Capita Income in Vinita Park is $31,618, while median incomes of families and households are $58,750 and $50,964 respectively.
| Characteristic | Number | Measure |
| Per Capita Income | 1,857 | $31,618 |
| Median Family Income | 412 | $58,750 |
| Mean Family Income | 412 | $76,492 |
| Median Household Income | 884 | $50,964 |
| Mean Household Income | 884 | $64,626 |
| Income Deficit | 412 | $8,749 |
| Wage / Income Gap (%) | 1,857 | 29.20% |
| Wage / Income Gap ($) | 1,857 | 70.80¢ per $1 |
| Gini / Inequality Index | 1,857 | 0.39 |
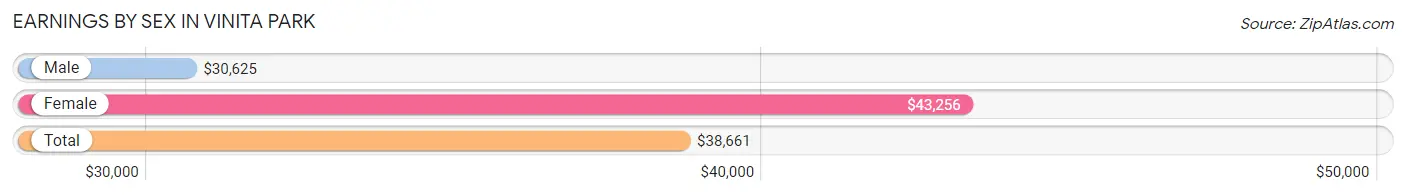
Earnings by Sex in Vinita Park
Average Earnings in Vinita Park are $38,661, $30,625 for men and $43,256 for women, a difference of 29.2%.
| Sex | Number | Average Earnings |
| Male | 547 (47.2%) | $30,625 |
| Female | 611 (52.8%) | $43,256 |
| Total | 1,158 (100.0%) | $38,661 |
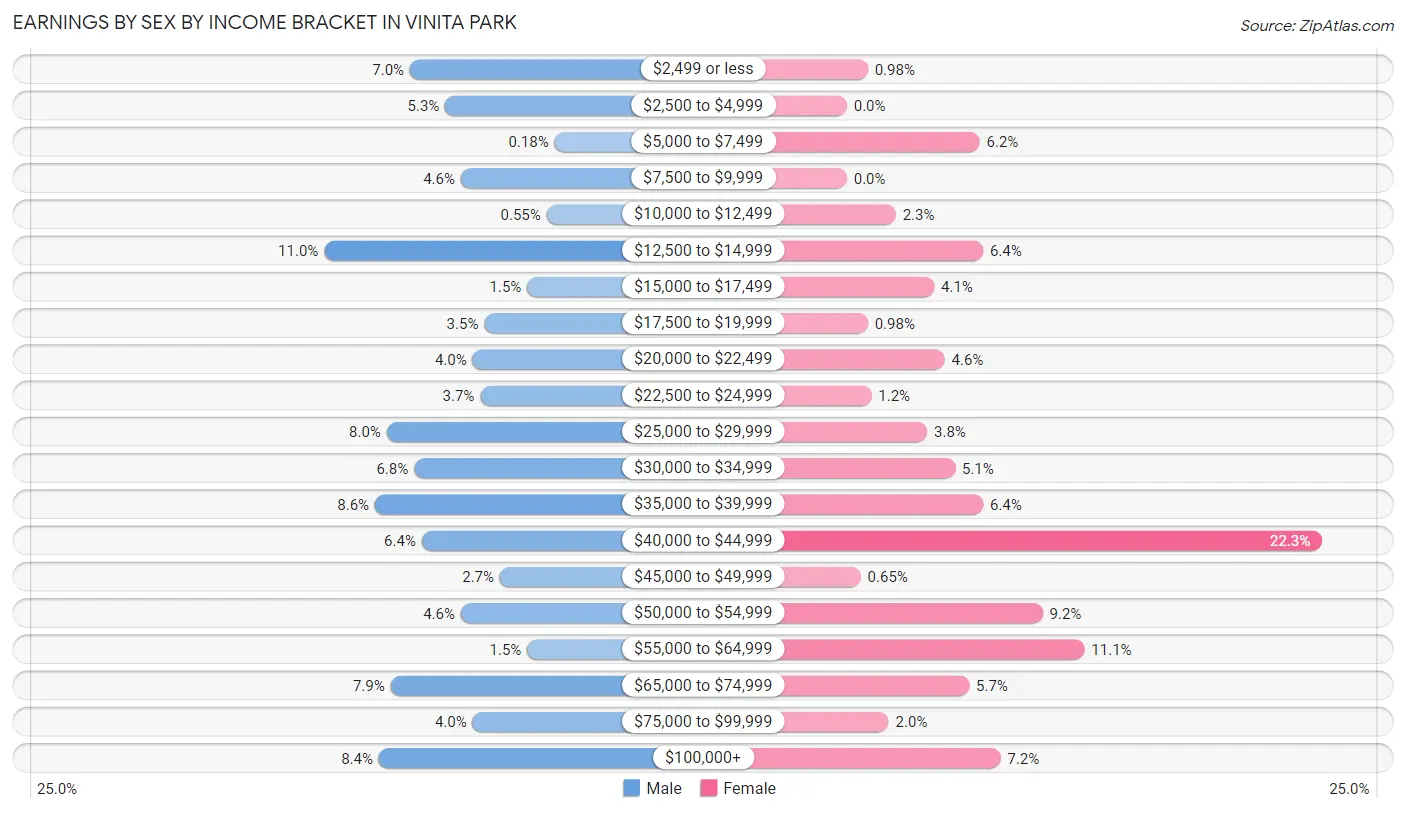
Earnings by Sex by Income Bracket in Vinita Park
The most common earnings brackets in Vinita Park are $12,500 to $14,999 for men (60 | 11.0%) and $40,000 to $44,999 for women (136 | 22.3%).
| Income | Male | Female |
| $2,499 or less | 38 (7.0%) | 6 (1.0%) |
| $2,500 to $4,999 | 29 (5.3%) | 0 (0.0%) |
| $5,000 to $7,499 | 1 (0.2%) | 38 (6.2%) |
| $7,500 to $9,999 | 25 (4.6%) | 0 (0.0%) |
| $10,000 to $12,499 | 3 (0.5%) | 14 (2.3%) |
| $12,500 to $14,999 | 60 (11.0%) | 39 (6.4%) |
| $15,000 to $17,499 | 8 (1.5%) | 25 (4.1%) |
| $17,500 to $19,999 | 19 (3.5%) | 6 (1.0%) |
| $20,000 to $22,499 | 22 (4.0%) | 28 (4.6%) |
| $22,500 to $24,999 | 20 (3.7%) | 7 (1.1%) |
| $25,000 to $29,999 | 44 (8.0%) | 23 (3.8%) |
| $30,000 to $34,999 | 37 (6.8%) | 31 (5.1%) |
| $35,000 to $39,999 | 47 (8.6%) | 39 (6.4%) |
| $40,000 to $44,999 | 35 (6.4%) | 136 (22.3%) |
| $45,000 to $49,999 | 15 (2.7%) | 4 (0.6%) |
| $50,000 to $54,999 | 25 (4.6%) | 56 (9.2%) |
| $55,000 to $64,999 | 8 (1.5%) | 68 (11.1%) |
| $65,000 to $74,999 | 43 (7.9%) | 35 (5.7%) |
| $75,000 to $99,999 | 22 (4.0%) | 12 (2.0%) |
| $100,000+ | 46 (8.4%) | 44 (7.2%) |
| Total | 547 (100.0%) | 611 (100.0%) |
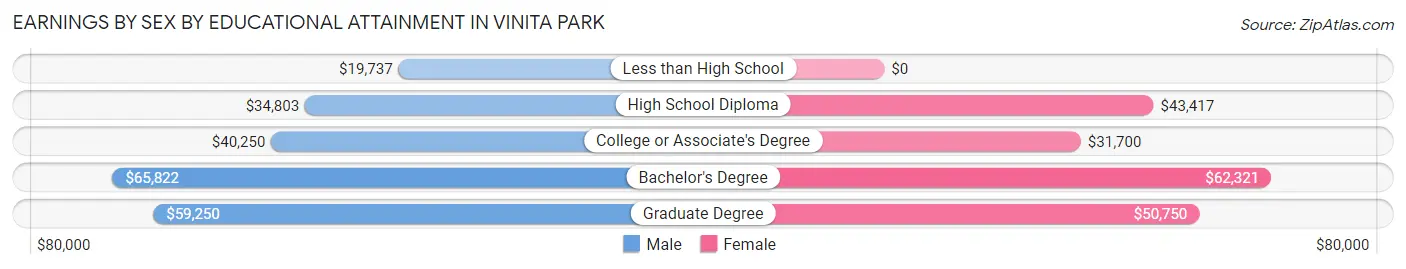
Earnings by Sex by Educational Attainment in Vinita Park
Average earnings in Vinita Park are $36,063 for men and $43,800 for women, a difference of 17.7%. Men with an educational attainment of bachelor's degree enjoy the highest average annual earnings of $65,822, while those with less than high school education earn the least with $19,737. Women with an educational attainment of bachelor's degree earn the most with the average annual earnings of $62,321, while those with college or associate's degree education have the smallest earnings of $31,700.
| Educational Attainment | Male Income | Female Income |
| Less than High School | $19,737 | $0 |
| High School Diploma | $34,803 | $43,417 |
| College or Associate's Degree | $40,250 | $31,700 |
| Bachelor's Degree | $65,822 | $62,321 |
| Graduate Degree | $59,250 | $50,750 |
| Total | $36,063 | $43,800 |
Family Income in Vinita Park
Family Income Brackets in Vinita Park
According to the Vinita Park family income data, there are 135 families falling into the $50,000 to $74,999 income range, which is the most common income bracket and makes up 32.8% of all families. Conversely, the $150,000 to $199,999 income bracket is the least frequent group with only 6 families (1.5%) belonging to this category.
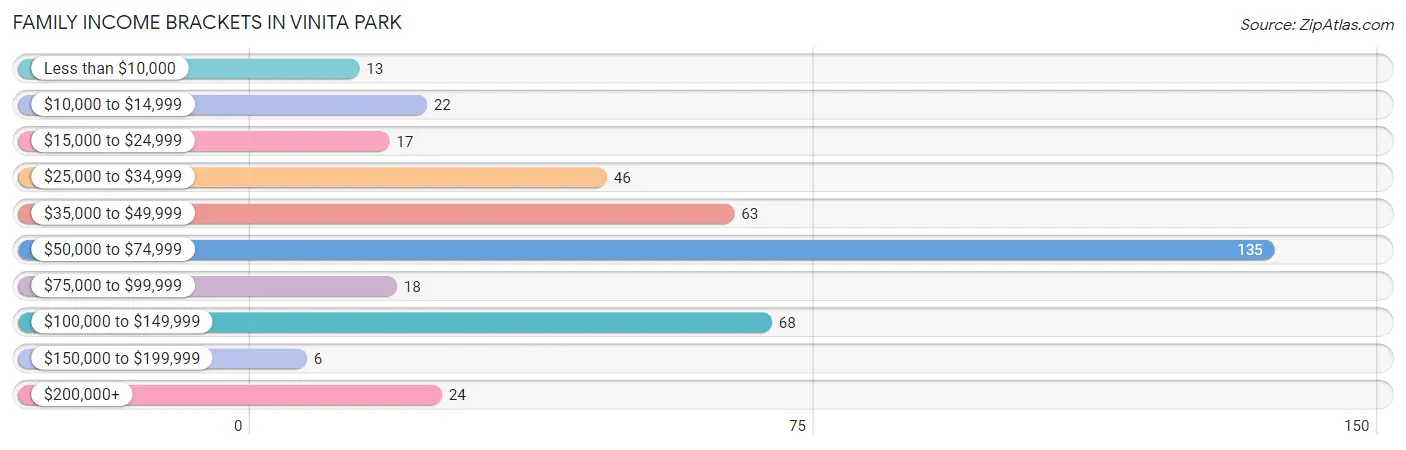
| Income Bracket | # Families | % Families |
| Less than $10,000 | 13 | 3.2% |
| $10,000 to $14,999 | 22 | 5.3% |
| $15,000 to $24,999 | 17 | 4.1% |
| $25,000 to $34,999 | 46 | 11.2% |
| $35,000 to $49,999 | 63 | 15.3% |
| $50,000 to $74,999 | 135 | 32.8% |
| $75,000 to $99,999 | 18 | 4.4% |
| $100,000 to $149,999 | 68 | 16.5% |
| $150,000 to $199,999 | 6 | 1.5% |
| $200,000+ | 24 | 5.8% |
Family Income by Famaliy Size in Vinita Park
2-person families (233 | 56.6%) account for the highest median family income in Vinita Park with $60,250 per family, while 2-person families (233 | 56.6%) have the highest median income of $30,125 per family member.
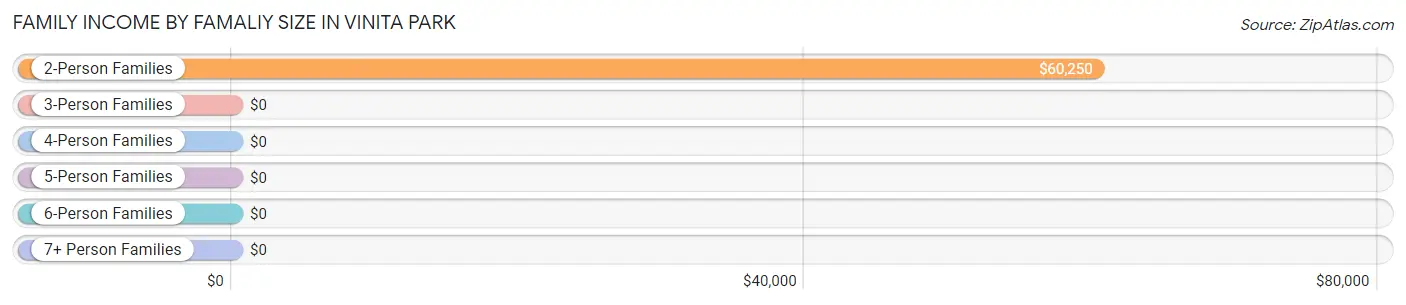
| Income Bracket | # Families | Median Income |
| 2-Person Families | 233 (56.6%) | $60,250 |
| 3-Person Families | 56 (13.6%) | $0 |
| 4-Person Families | 56 (13.6%) | $0 |
| 5-Person Families | 64 (15.5%) | $0 |
| 6-Person Families | 0 (0.0%) | $0 |
| 7+ Person Families | 3 (0.7%) | $0 |
| Total | 412 (100.0%) | $58,750 |
Family Income by Number of Earners in Vinita Park
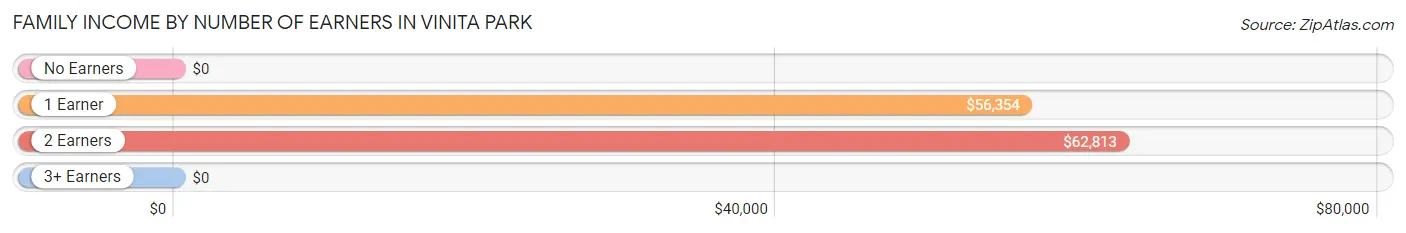
| Number of Earners | # Families | Median Income |
| No Earners | 70 (17.0%) | $0 |
| 1 Earner | 97 (23.5%) | $56,354 |
| 2 Earners | 236 (57.3%) | $62,813 |
| 3+ Earners | 9 (2.2%) | $0 |
| Total | 412 (100.0%) | $58,750 |
Household Income in Vinita Park
Household Income Brackets in Vinita Park
With 259 households falling in the category, the $50,000 to $74,999 income range is the most frequent in Vinita Park, accounting for 29.3% of all households. In contrast, only 6 households (0.7%) fall into the $150,000 to $199,999 income bracket, making it the least populous group.
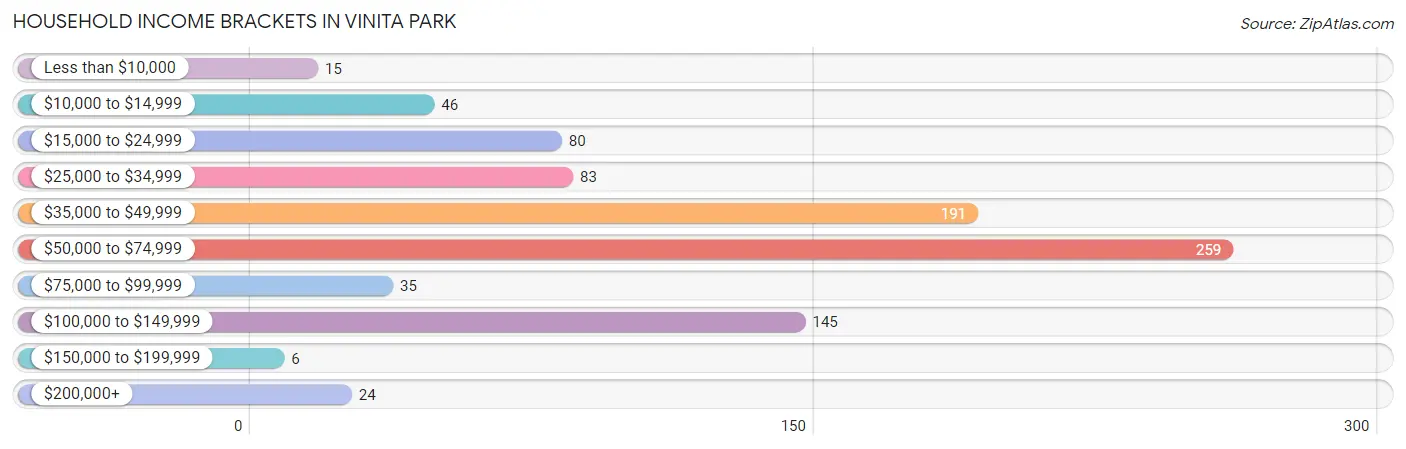
| Income Bracket | # Households | % Households |
| Less than $10,000 | 15 | 1.7% |
| $10,000 to $14,999 | 46 | 5.2% |
| $15,000 to $24,999 | 80 | 9.0% |
| $25,000 to $34,999 | 83 | 9.4% |
| $35,000 to $49,999 | 191 | 21.6% |
| $50,000 to $74,999 | 259 | 29.3% |
| $75,000 to $99,999 | 35 | 4.0% |
| $100,000 to $149,999 | 145 | 16.4% |
| $150,000 to $199,999 | 6 | 0.7% |
| $200,000+ | 24 | 2.7% |
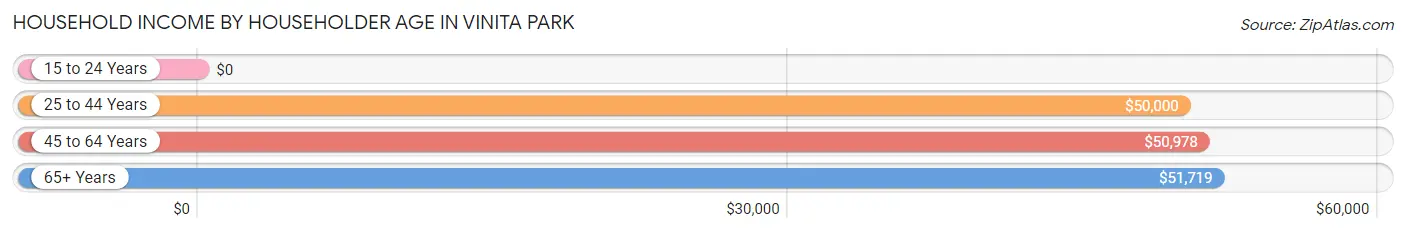
Household Income by Householder Age in Vinita Park
The median household income in Vinita Park is $50,964, with the highest median household income of $51,719 found in the 65+ years age bracket for the primary householder. A total of 177 households (20.0%) fall into this category. Meanwhile, the 15 to 24 years age bracket for the primary householder has the lowest median household income of $0, with 15 households (1.7%) in this group.
| Income Bracket | # Households | Median Income |
| 15 to 24 Years | 15 (1.7%) | $0 |
| 25 to 44 Years | 344 (38.9%) | $50,000 |
| 45 to 64 Years | 348 (39.4%) | $50,978 |
| 65+ Years | 177 (20.0%) | $51,719 |
| Total | 884 (100.0%) | $50,964 |
Poverty in Vinita Park
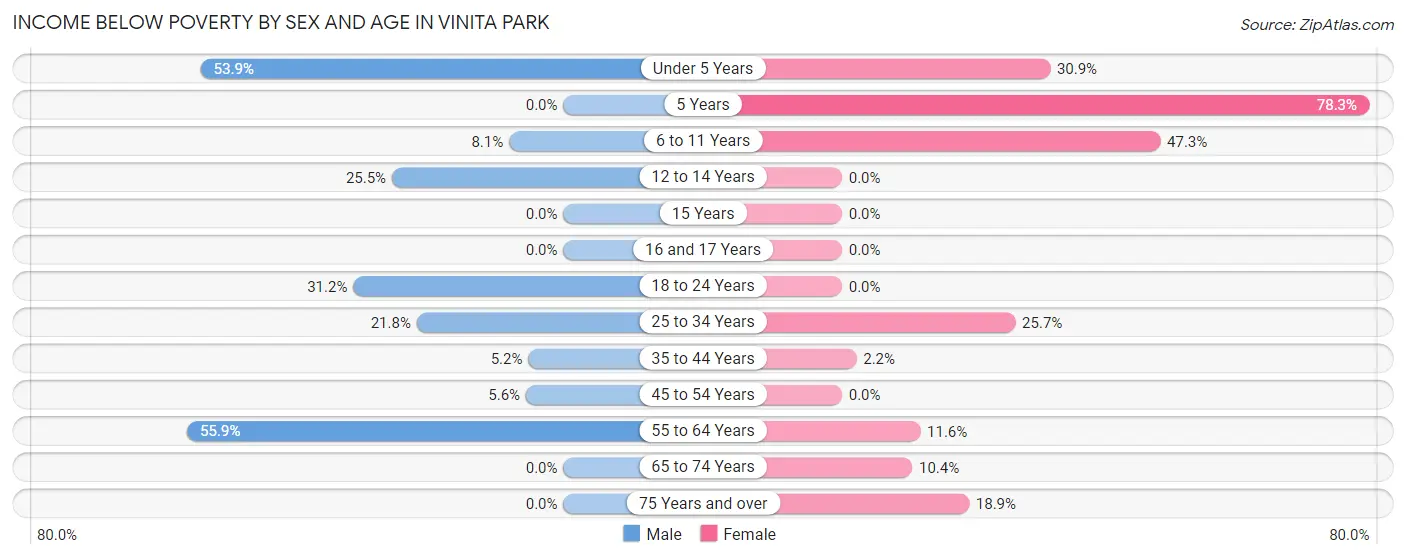
Income Below Poverty by Sex and Age in Vinita Park
With 22.9% poverty level for males and 14.2% for females among the residents of Vinita Park, 55 to 64 year old males and 5 year old females are the most vulnerable to poverty, with 76 males (55.9%) and 18 females (78.3%) in their respective age groups living below the poverty level.
| Age Bracket | Male | Female |
| Under 5 Years | 35 (53.8%) | 17 (30.9%) |
| 5 Years | 0 (0.0%) | 18 (78.3%) |
| 6 to 11 Years | 5 (8.1%) | 26 (47.3%) |
| 12 to 14 Years | 14 (25.5%) | 0 (0.0%) |
| 15 Years | 0 (0.0%) | 0 (0.0%) |
| 16 and 17 Years | 0 (0.0%) | 0 (0.0%) |
| 18 to 24 Years | 39 (31.2%) | 0 (0.0%) |
| 25 to 34 Years | 32 (21.8%) | 35 (25.7%) |
| 35 to 44 Years | 5 (5.2%) | 4 (2.1%) |
| 45 to 54 Years | 6 (5.6%) | 0 (0.0%) |
| 55 to 64 Years | 76 (55.9%) | 10 (11.6%) |
| 65 to 74 Years | 0 (0.0%) | 12 (10.4%) |
| 75 Years and over | 0 (0.0%) | 10 (18.9%) |
| Total | 212 (22.9%) | 132 (14.2%) |
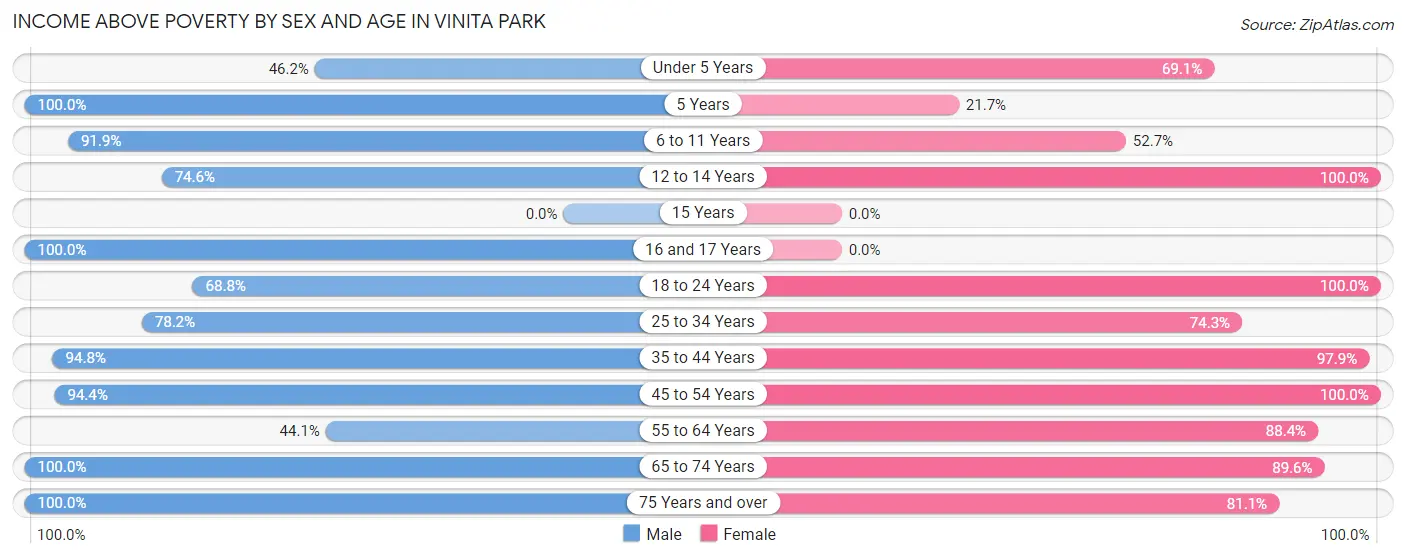
Income Above Poverty by Sex and Age in Vinita Park
According to the poverty statistics in Vinita Park, males aged 5 years and females aged 12 to 14 years are the age groups that are most secure financially, with 100.0% of males and 100.0% of females in these age groups living above the poverty line.
| Age Bracket | Male | Female |
| Under 5 Years | 30 (46.2%) | 38 (69.1%) |
| 5 Years | 5 (100.0%) | 5 (21.7%) |
| 6 to 11 Years | 57 (91.9%) | 29 (52.7%) |
| 12 to 14 Years | 41 (74.6%) | 14 (100.0%) |
| 15 Years | 0 (0.0%) | 0 (0.0%) |
| 16 and 17 Years | 12 (100.0%) | 0 (0.0%) |
| 18 to 24 Years | 86 (68.8%) | 54 (100.0%) |
| 25 to 34 Years | 115 (78.2%) | 101 (74.3%) |
| 35 to 44 Years | 91 (94.8%) | 182 (97.9%) |
| 45 to 54 Years | 102 (94.4%) | 155 (100.0%) |
| 55 to 64 Years | 60 (44.1%) | 76 (88.4%) |
| 65 to 74 Years | 95 (100.0%) | 103 (89.6%) |
| 75 Years and over | 19 (100.0%) | 43 (81.1%) |
| Total | 713 (77.1%) | 800 (85.8%) |
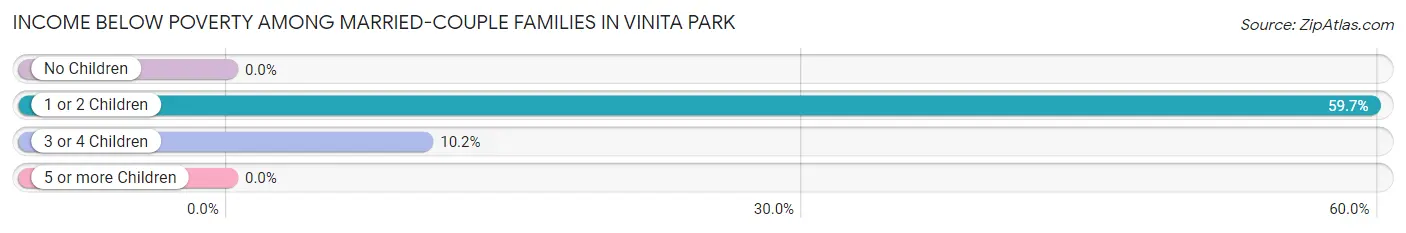
Income Below Poverty Among Married-Couple Families in Vinita Park
The poverty statistics for married-couple families in Vinita Park show that 15.6% or 39 of the total 250 families live below the poverty line. Families with 1 or 2 children have the highest poverty rate of 59.7%, comprising of 34 families. On the other hand, families with no children have the lowest poverty rate of 0.0%, which includes 0 families.
| Children | Above Poverty | Below Poverty |
| No Children | 141 (100.0%) | 0 (0.0%) |
| 1 or 2 Children | 23 (40.4%) | 34 (59.7%) |
| 3 or 4 Children | 44 (89.8%) | 5 (10.2%) |
| 5 or more Children | 3 (100.0%) | 0 (0.0%) |
| Total | 211 (84.4%) | 39 (15.6%) |
Income Below Poverty Among Single-Parent Households in Vinita Park
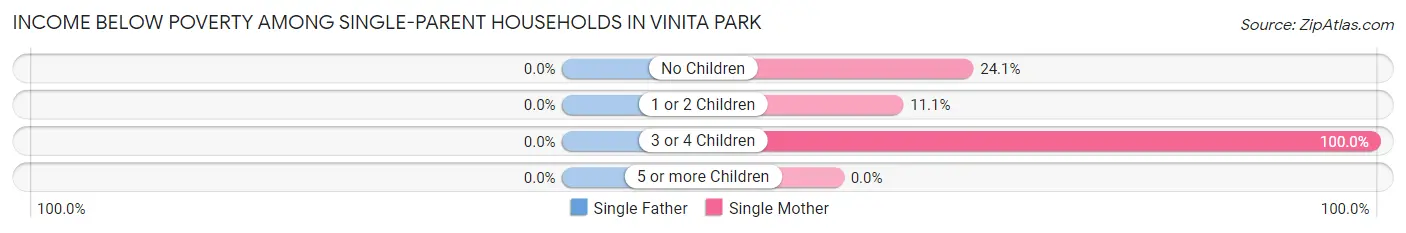
| Children | Single Father | Single Mother |
| No Children | 0 (0.0%) | 14 (24.1%) |
| 1 or 2 Children | 0 (0.0%) | 5 (11.1%) |
| 3 or 4 Children | 0 (0.0%) | 13 (100.0%) |
| 5 or more Children | 0 (0.0%) | 0 (0.0%) |
| Total | 0 (0.0%) | 32 (27.6%) |
Income Below Poverty Among Married-Couple vs Single-Parent Households in Vinita Park
The poverty data for Vinita Park shows that 39 of the married-couple family households (15.6%) and 32 of the single-parent households (19.8%) are living below the poverty level. Within the married-couple family households, those with 1 or 2 children have the highest poverty rate, with 34 households (59.7%) falling below the poverty line. Among the single-parent households, those with 3 or 4 children have the highest poverty rate, with 13 household (100.0%) living below poverty.
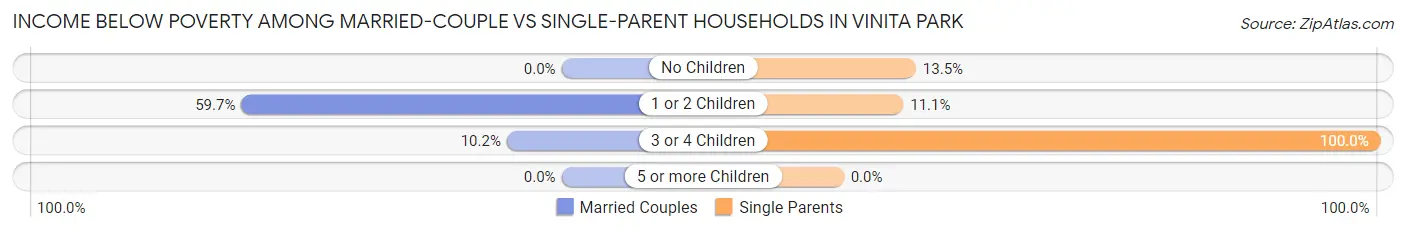
| Children | Married-Couple Families | Single-Parent Households |
| No Children | 0 (0.0%) | 14 (13.5%) |
| 1 or 2 Children | 34 (59.7%) | 5 (11.1%) |
| 3 or 4 Children | 5 (10.2%) | 13 (100.0%) |
| 5 or more Children | 0 (0.0%) | 0 (0.0%) |
| Total | 39 (15.6%) | 32 (19.8%) |
Race in Vinita Park
The most populous races in Vinita Park are Black / African American (1,211 | 65.2%), White / Caucasian (458 | 24.7%), and Hispanic or Latino (114 | 6.1%).
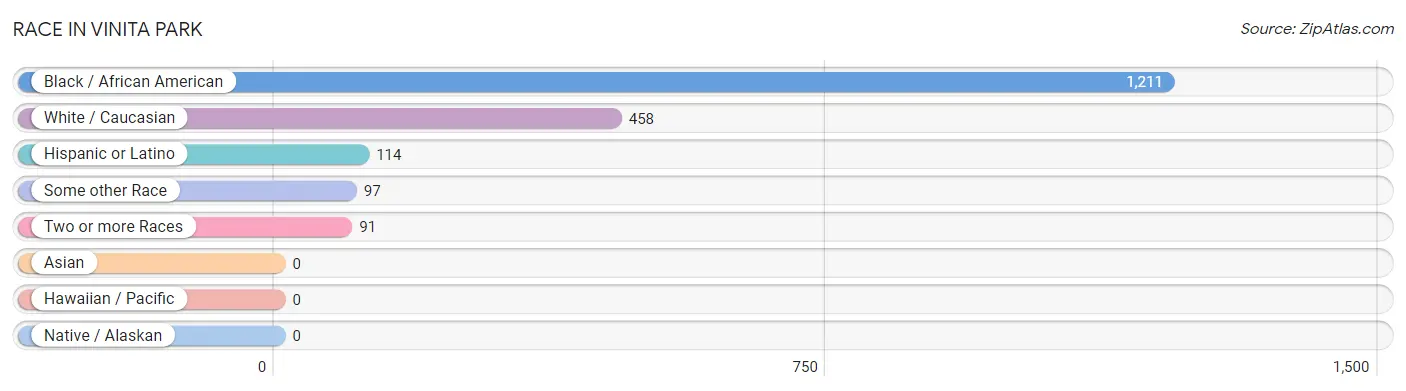
| Race | # Population | % Population |
| Asian | 0 | 0.0% |
| Black / African American | 1,211 | 65.2% |
| Hawaiian / Pacific | 0 | 0.0% |
| Hispanic or Latino | 114 | 6.1% |
| Native / Alaskan | 0 | 0.0% |
| White / Caucasian | 458 | 24.7% |
| Two or more Races | 91 | 4.9% |
| Some other Race | 97 | 5.2% |
| Total | 1,857 | 100.0% |
Ancestry in Vinita Park
The most populous ancestries reported in Vinita Park are German (184 | 9.9%), American (124 | 6.7%), Mexican (106 | 5.7%), English (102 | 5.5%), and Irish (63 | 3.4%), together accounting for 31.2% of all Vinita Park residents.
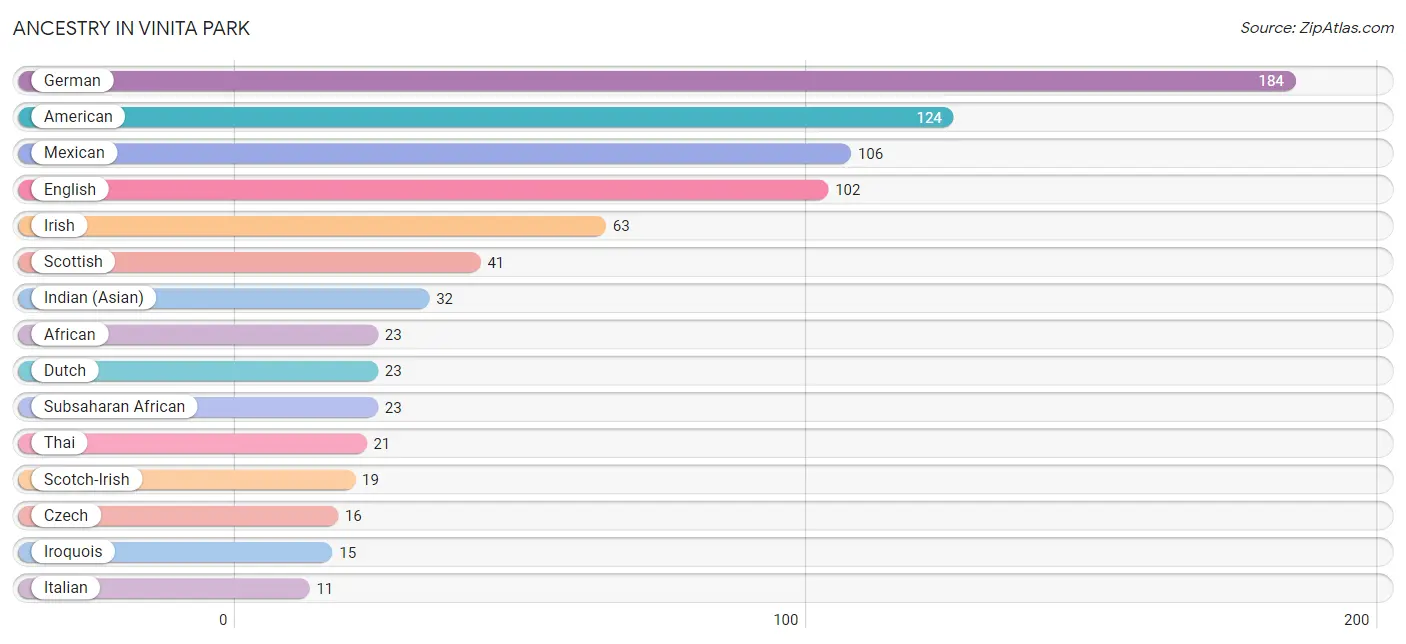
| Ancestry | # Population | % Population |
| African | 23 | 1.2% |
| American | 124 | 6.7% |
| Canadian | 8 | 0.4% |
| Central American | 8 | 0.4% |
| Czech | 16 | 0.9% |
| Czechoslovakian | 3 | 0.2% |
| Dutch | 23 | 1.2% |
| Eastern European | 5 | 0.3% |
| English | 102 | 5.5% |
| European | 4 | 0.2% |
| French | 3 | 0.2% |
| German | 184 | 9.9% |
| Greek | 4 | 0.2% |
| Honduran | 8 | 0.4% |
| Indian (Asian) | 32 | 1.7% |
| Iranian | 5 | 0.3% |
| Irish | 63 | 3.4% |
| Iroquois | 15 | 0.8% |
| Italian | 11 | 0.6% |
| Jamaican | 5 | 0.3% |
| Korean | 5 | 0.3% |
| Mexican | 106 | 5.7% |
| Northern European | 9 | 0.5% |
| Norwegian | 3 | 0.2% |
| Scotch-Irish | 19 | 1.0% |
| Scottish | 41 | 2.2% |
| Subsaharan African | 23 | 1.2% |
| Thai | 21 | 1.1% | View All 28 Rows |
Immigrants in Vinita Park
The most numerous immigrant groups reported in Vinita Park came from Latin America (59 | 3.2%), Central America (54 | 2.9%), Mexico (54 | 2.9%), Europe (22 | 1.2%), and Eastern Europe (20 | 1.1%), together accounting for 11.3% of all Vinita Park residents.
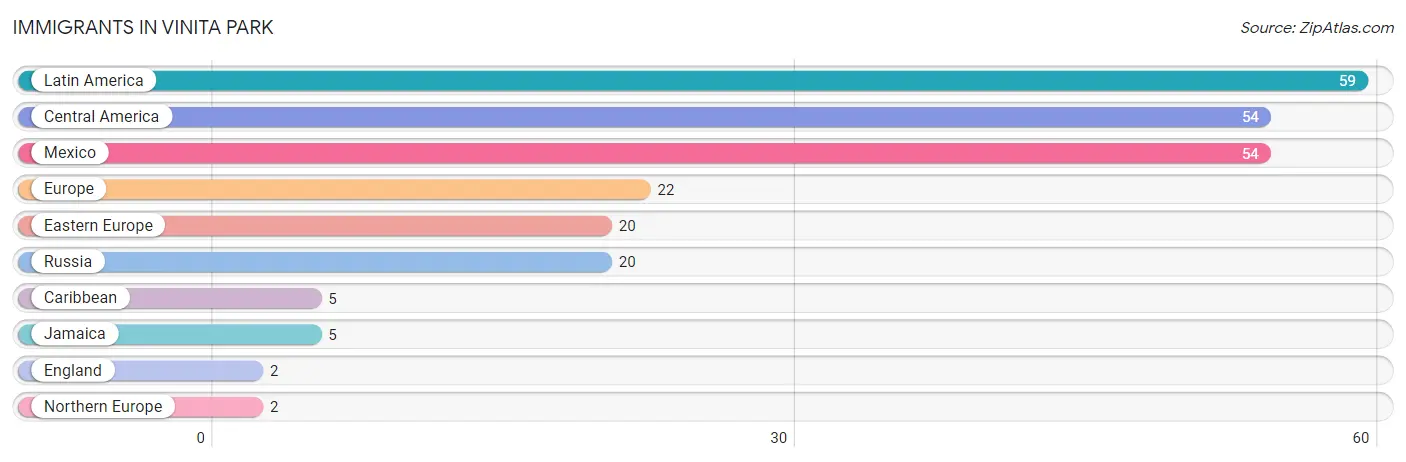
| Immigration Origin | # Population | % Population |
| Caribbean | 5 | 0.3% |
| Central America | 54 | 2.9% |
| Eastern Europe | 20 | 1.1% |
| England | 2 | 0.1% |
| Europe | 22 | 1.2% |
| Jamaica | 5 | 0.3% |
| Latin America | 59 | 3.2% |
| Mexico | 54 | 2.9% |
| Northern Europe | 2 | 0.1% |
| Russia | 20 | 1.1% | View All 10 Rows |
Sex and Age in Vinita Park
Sex and Age in Vinita Park
The most populous age groups in Vinita Park are 60 to 64 Years (104 | 11.2%) for men and 40 to 44 Years (114 | 12.2%) for women.
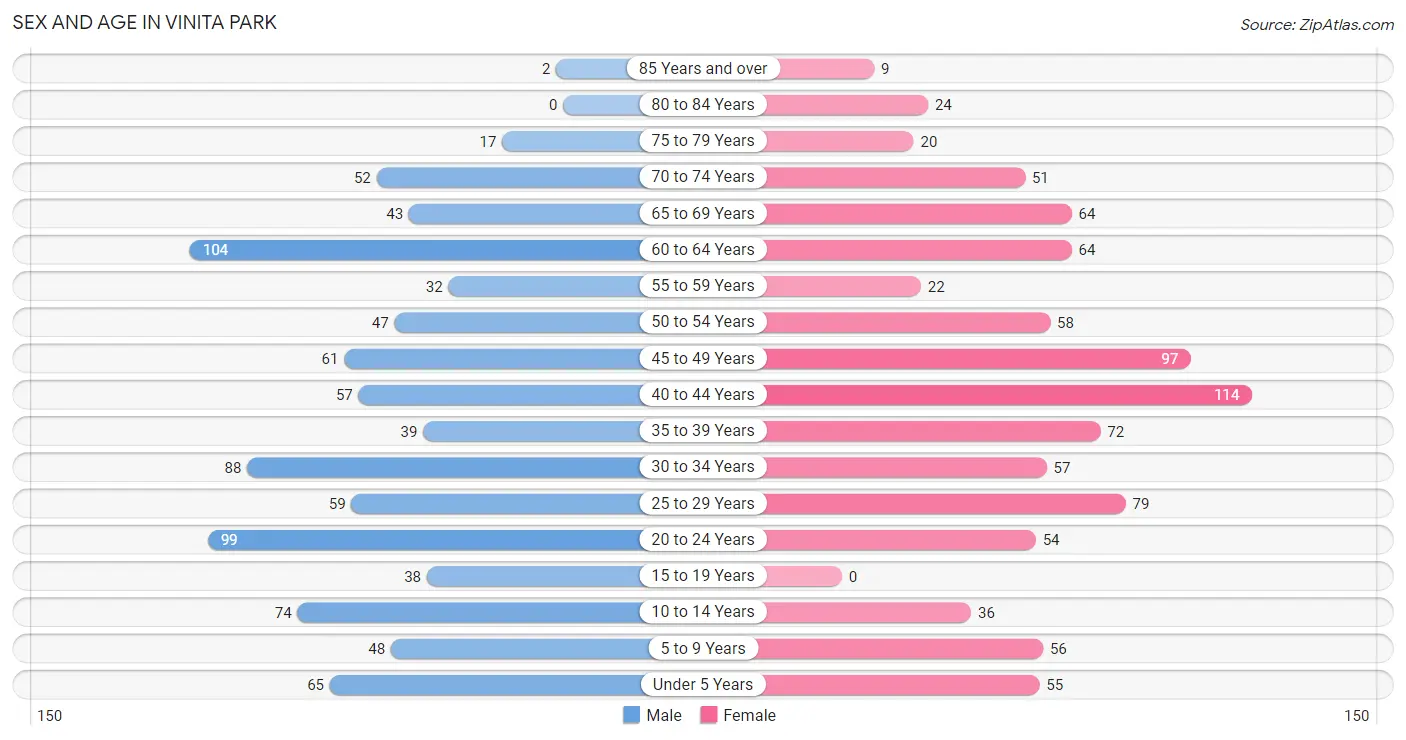
| Age Bracket | Male | Female |
| Under 5 Years | 65 (7.0%) | 55 (5.9%) |
| 5 to 9 Years | 48 (5.2%) | 56 (6.0%) |
| 10 to 14 Years | 74 (8.0%) | 36 (3.9%) |
| 15 to 19 Years | 38 (4.1%) | 0 (0.0%) |
| 20 to 24 Years | 99 (10.7%) | 54 (5.8%) |
| 25 to 29 Years | 59 (6.4%) | 79 (8.5%) |
| 30 to 34 Years | 88 (9.5%) | 57 (6.1%) |
| 35 to 39 Years | 39 (4.2%) | 72 (7.7%) |
| 40 to 44 Years | 57 (6.2%) | 114 (12.2%) |
| 45 to 49 Years | 61 (6.6%) | 97 (10.4%) |
| 50 to 54 Years | 47 (5.1%) | 58 (6.2%) |
| 55 to 59 Years | 32 (3.5%) | 22 (2.4%) |
| 60 to 64 Years | 104 (11.2%) | 64 (6.9%) |
| 65 to 69 Years | 43 (4.6%) | 64 (6.9%) |
| 70 to 74 Years | 52 (5.6%) | 51 (5.5%) |
| 75 to 79 Years | 17 (1.8%) | 20 (2.1%) |
| 80 to 84 Years | 0 (0.0%) | 24 (2.6%) |
| 85 Years and over | 2 (0.2%) | 9 (1.0%) |
| Total | 925 (100.0%) | 932 (100.0%) |
Families and Households in Vinita Park
Median Family Size in Vinita Park
The median family size in Vinita Park is 3.04 persons per family, with single male/father families (46 | 11.2%) accounting for the largest median family size of 3.24 persons per family. On the other hand, single female/mother families (116 | 28.2%) represent the smallest median family size with 2.74 persons per family.
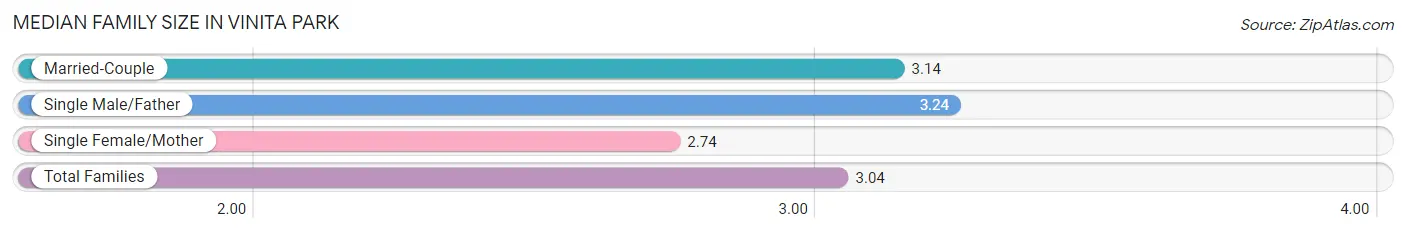
| Family Type | # Families | Family Size |
| Married-Couple | 250 (60.7%) | 3.14 |
| Single Male/Father | 46 (11.2%) | 3.24 |
| Single Female/Mother | 116 (28.2%) | 2.74 |
| Total Families | 412 (100.0%) | 3.04 |
Median Household Size in Vinita Park
The median household size in Vinita Park is 2.10 persons per household, with single male/father households (46 | 5.2%) accounting for the largest median household size of 3.43 persons per household. non-family households (472 | 53.4%) represent the smallest median household size with 1.21 persons per household.
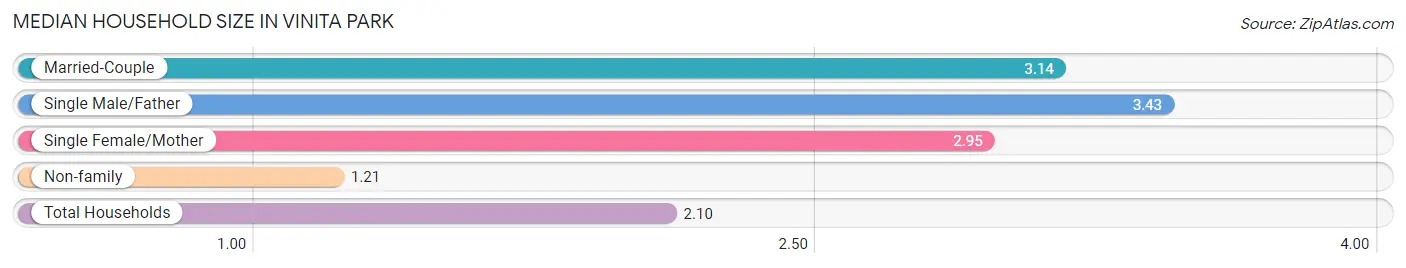
| Household Type | # Households | Household Size |
| Married-Couple | 250 (28.3%) | 3.14 |
| Single Male/Father | 46 (5.2%) | 3.43 |
| Single Female/Mother | 116 (13.1%) | 2.95 |
| Non-family | 472 (53.4%) | 1.21 |
| Total Households | 884 (100.0%) | 2.10 |
Household Size by Marriage Status in Vinita Park
Out of a total of 884 households in Vinita Park, 412 (46.6%) are family households, while 472 (53.4%) are nonfamily households. The most numerous type of family households are 2-person households, comprising 223, and the most common type of nonfamily households are 1-person households, comprising 391.
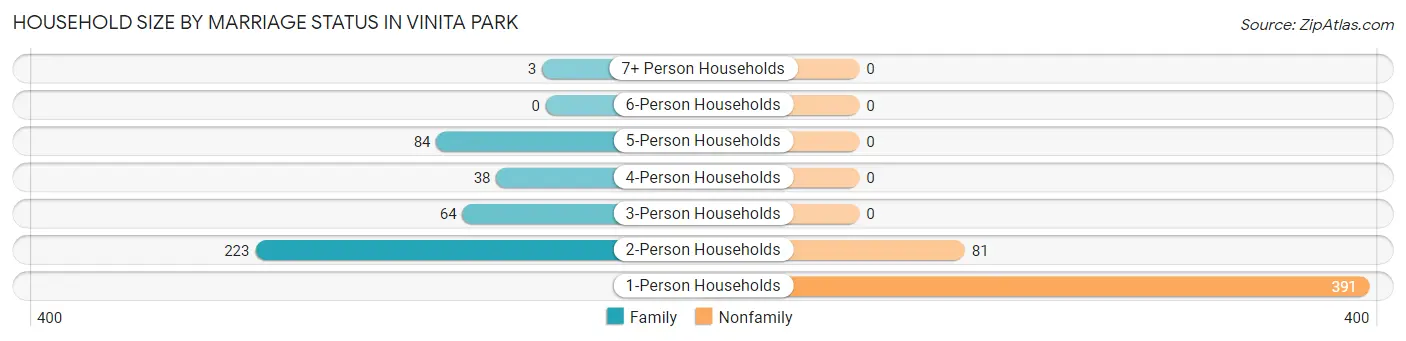
| Household Size | Family Households | Nonfamily Households |
| 1-Person Households | - | 391 (44.2%) |
| 2-Person Households | 223 (25.2%) | 81 (9.2%) |
| 3-Person Households | 64 (7.2%) | 0 (0.0%) |
| 4-Person Households | 38 (4.3%) | 0 (0.0%) |
| 5-Person Households | 84 (9.5%) | 0 (0.0%) |
| 6-Person Households | 0 (0.0%) | 0 (0.0%) |
| 7+ Person Households | 3 (0.3%) | 0 (0.0%) |
| Total | 412 (46.6%) | 472 (53.4%) |
Female Fertility in Vinita Park
Fertility by Age in Vinita Park
Average fertility rate in Vinita Park is 27.0 births per 1,000 women. Women in the age bracket of 20 to 34 years have the highest fertility rate with 68.0 births per 1,000 women. Women in the age bracket of 20 to 34 years acount for 100.0% of all women with births.
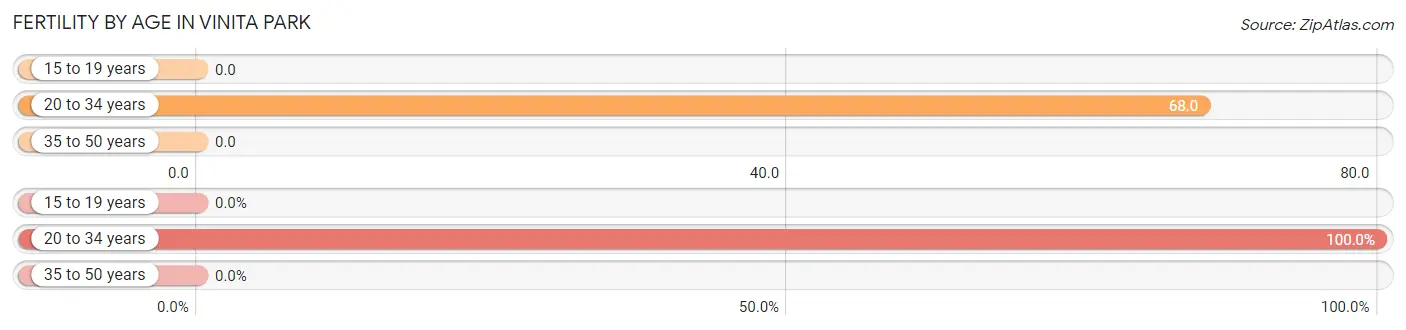
| Age Bracket | Women with Births | Births / 1,000 Women |
| 15 to 19 years | 0 (0.0%) | 0.0 |
| 20 to 34 years | 13 (100.0%) | 68.0 |
| 35 to 50 years | 0 (0.0%) | 0.0 |
| Total | 13 (100.0%) | 27.0 |
Fertility by Age by Marriage Status in Vinita Park
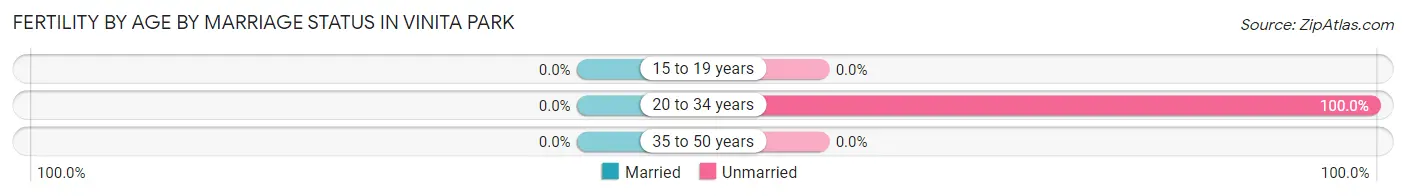
| Age Bracket | Married | Unmarried |
| 15 to 19 years | 0 (0.0%) | 0 (0.0%) |
| 20 to 34 years | 0 (0.0%) | 13 (100.0%) |
| 35 to 50 years | 0 (0.0%) | 0 (0.0%) |
| Total | 0 (0.0%) | 13 (100.0%) |
Fertility by Education in Vinita Park
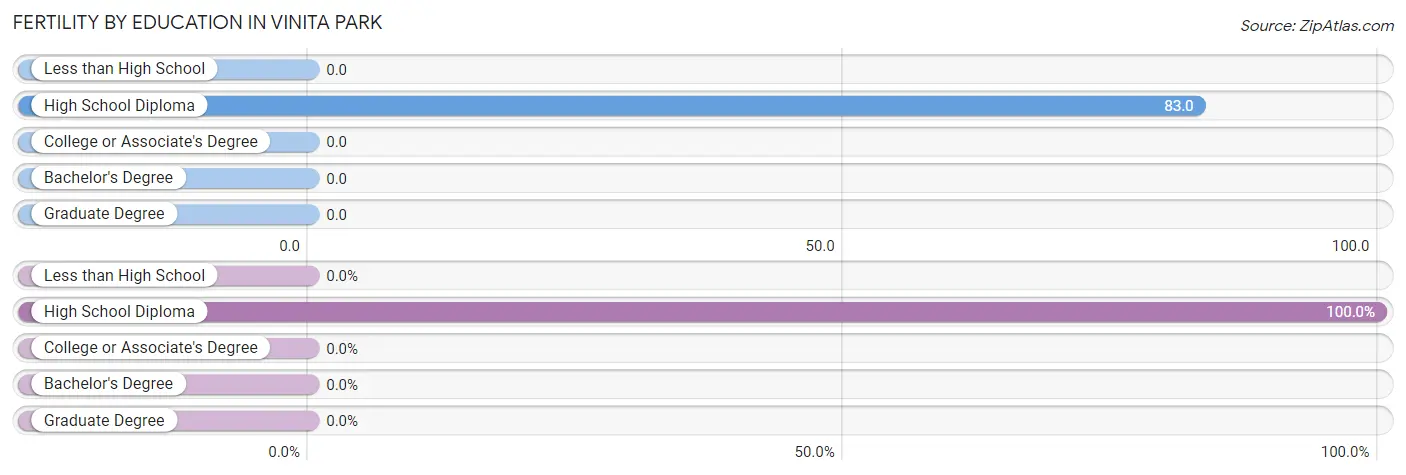
| Educational Attainment | Women with Births | Births / 1,000 Women |
| Less than High School | 0 (0.0%) | 0.0 |
| High School Diploma | 13 (100.0%) | 83.0 |
| College or Associate's Degree | 0 (0.0%) | 0.0 |
| Bachelor's Degree | 0 (0.0%) | 0.0 |
| Graduate Degree | 0 (0.0%) | 0.0 |
| Total | 13 (100.0%) | 27.0 |
Fertility by Education by Marriage Status in Vinita Park
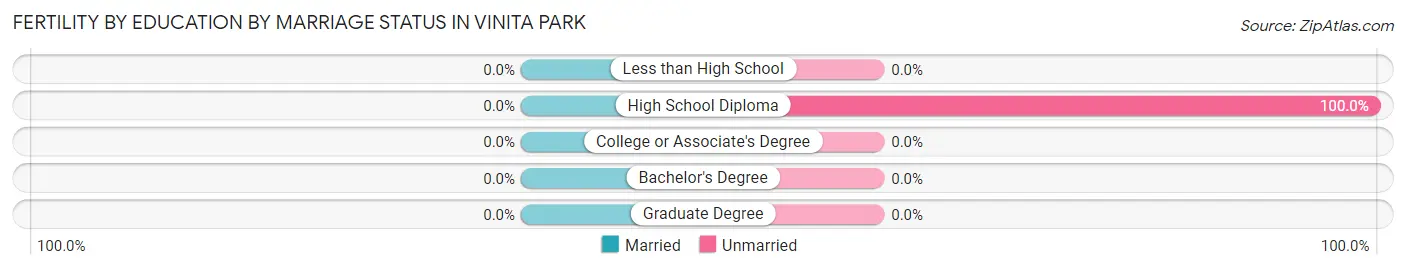
| Educational Attainment | Married | Unmarried |
| Less than High School | 0 (0.0%) | 0 (0.0%) |
| High School Diploma | 0 (0.0%) | 13 (100.0%) |
| College or Associate's Degree | 0 (0.0%) | 0 (0.0%) |
| Bachelor's Degree | 0 (0.0%) | 0 (0.0%) |
| Graduate Degree | 0 (0.0%) | 0 (0.0%) |
| Total | 0 (0.0%) | 13 (100.0%) |
Employment Characteristics in Vinita Park
Employment by Class of Employer in Vinita Park
Among the 1,021 employed individuals in Vinita Park, private company employees (738 | 72.3%), not-for-profit organizations (169 | 16.6%), and self-employed (not incorporated) (37 | 3.6%) make up the most common classes of employment.
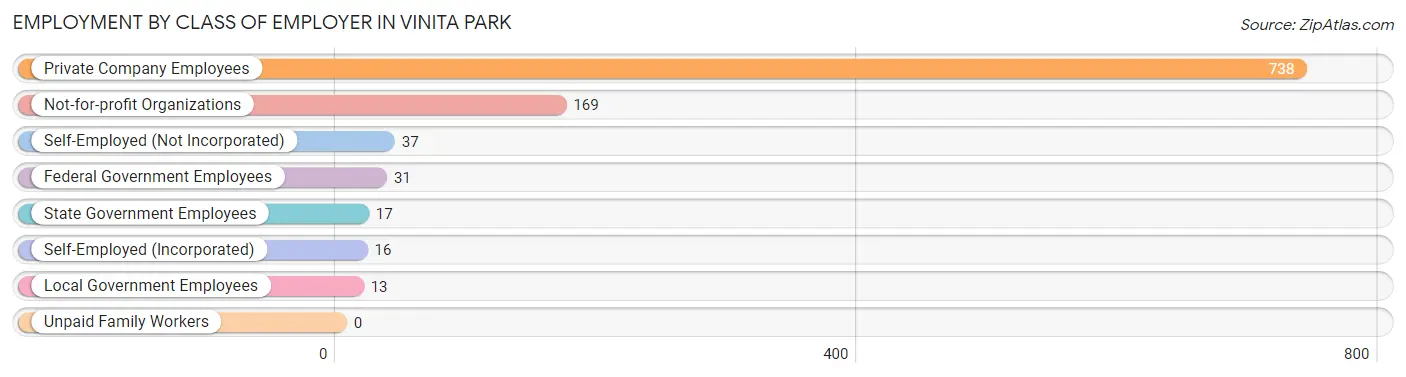
| Employer Class | # Employees | % Employees |
| Private Company Employees | 738 | 72.3% |
| Self-Employed (Incorporated) | 16 | 1.6% |
| Self-Employed (Not Incorporated) | 37 | 3.6% |
| Not-for-profit Organizations | 169 | 16.6% |
| Local Government Employees | 13 | 1.3% |
| State Government Employees | 17 | 1.7% |
| Federal Government Employees | 31 | 3.0% |
| Unpaid Family Workers | 0 | 0.0% |
| Total | 1,021 | 100.0% |
Employment Status by Age in Vinita Park
According to the labor force statistics for Vinita Park, out of the total population over 16 years of age (1,523), 74.5% or 1,135 individuals are in the labor force, with 9.9% or 112 of them unemployed. The age group with the highest labor force participation rate is 45 to 54 years, with 100.0% or 263 individuals in the labor force. Within the labor force, the 20 to 24 years age range has the highest percentage of unemployed individuals, with 19.9% or 27 of them being unemployed.
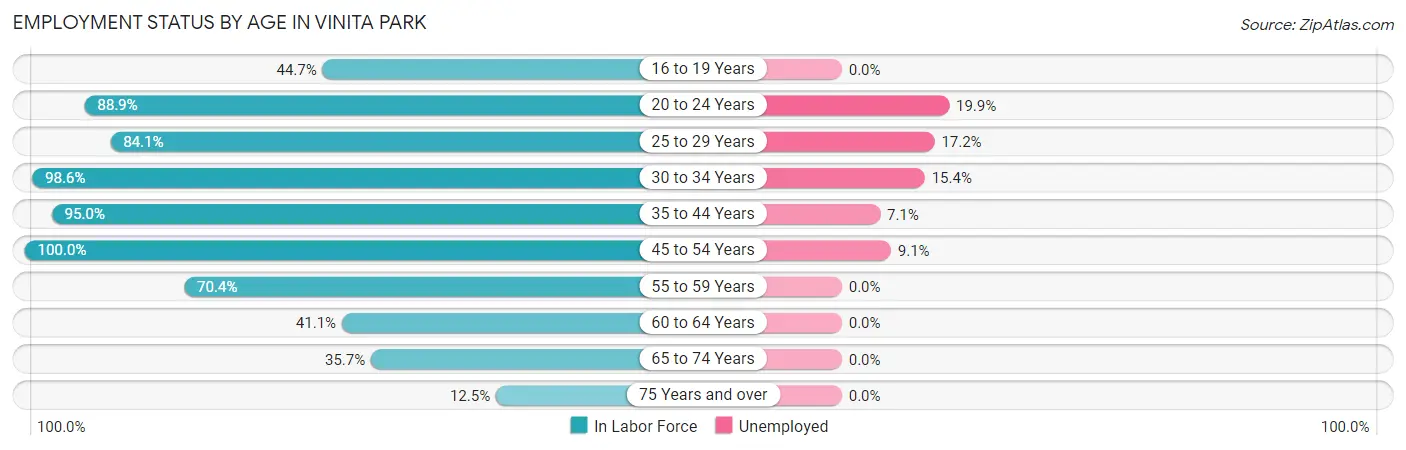
| Age Bracket | In Labor Force | Unemployed |
| 16 to 19 Years | 17 (44.7%) | 0 (0.0%) |
| 20 to 24 Years | 136 (88.9%) | 27 (19.9%) |
| 25 to 29 Years | 116 (84.1%) | 20 (17.2%) |
| 30 to 34 Years | 143 (98.6%) | 22 (15.4%) |
| 35 to 44 Years | 268 (95.0%) | 19 (7.1%) |
| 45 to 54 Years | 263 (100.0%) | 24 (9.1%) |
| 55 to 59 Years | 38 (70.4%) | 0 (0.0%) |
| 60 to 64 Years | 69 (41.1%) | 0 (0.0%) |
| 65 to 74 Years | 75 (35.7%) | 0 (0.0%) |
| 75 Years and over | 9 (12.5%) | 0 (0.0%) |
| Total | 1,135 (74.5%) | 112 (9.9%) |
Employment Status by Educational Attainment in Vinita Park
According to labor force statistics for Vinita Park, 85.4% of individuals (897) out of the total population between 25 and 64 years of age (1,050) are in the labor force, with 9.5% or 85 of them being unemployed. The group with the highest labor force participation rate are those with the educational attainment of bachelor's degree or higher, with 95.8% or 323 individuals in the labor force. Within the labor force, individuals with less than high school education have the highest percentage of unemployment, with 25.3% or 24 of them being unemployed.
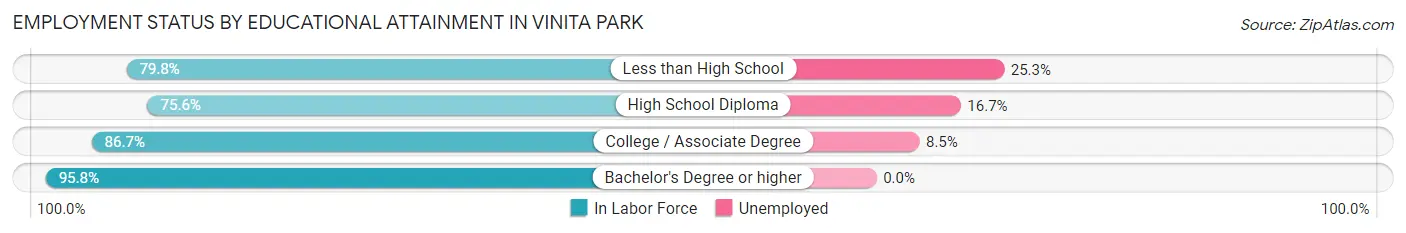
| Educational Attainment | In Labor Force | Unemployed |
| Less than High School | 95 (79.8%) | 30 (25.3%) |
| High School Diploma | 245 (75.6%) | 54 (16.7%) |
| College / Associate Degree | 234 (86.7%) | 23 (8.5%) |
| Bachelor's Degree or higher | 323 (95.8%) | 0 (0.0%) |
| Total | 897 (85.4%) | 100 (9.5%) |
Employment Occupations by Sex in Vinita Park
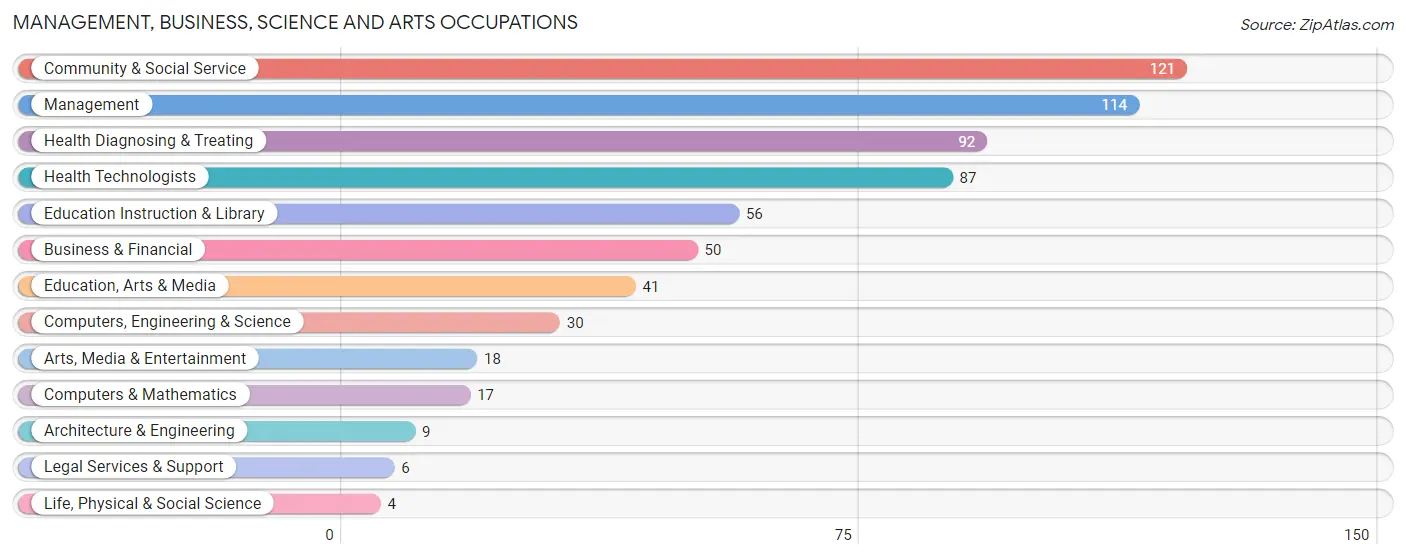
Management, Business, Science and Arts Occupations
The most common Management, Business, Science and Arts occupations in Vinita Park are Community & Social Service (121 | 11.8%), Management (114 | 11.2%), Health Diagnosing & Treating (92 | 9.0%), Health Technologists (87 | 8.5%), and Education Instruction & Library (56 | 5.5%).
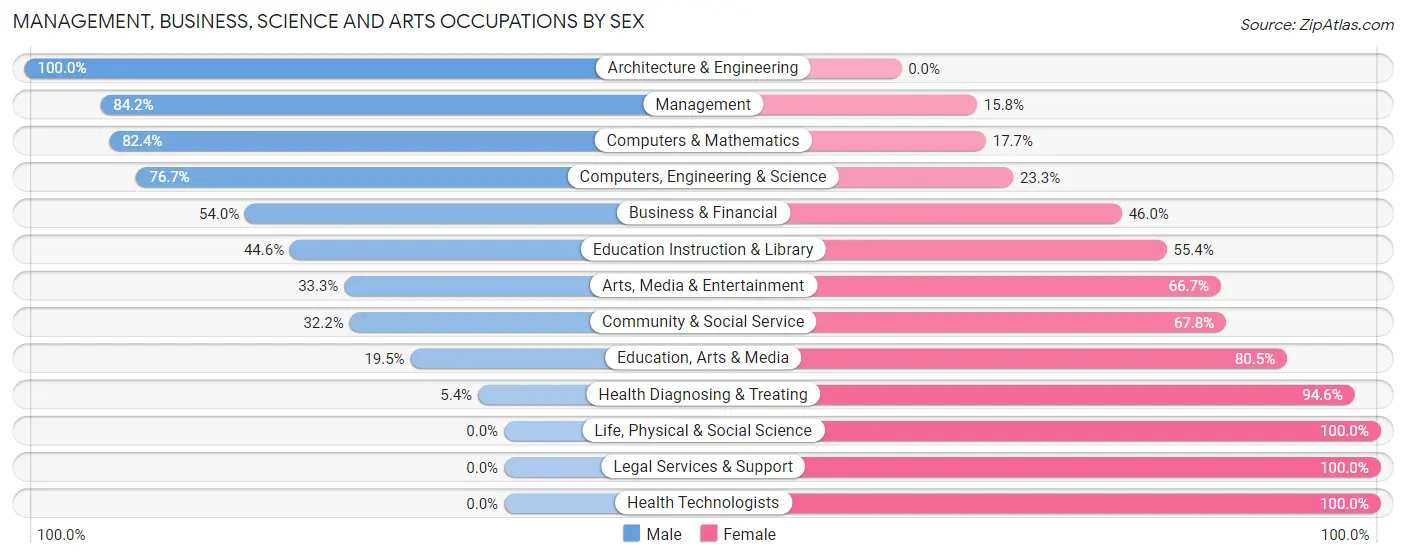
Management, Business, Science and Arts Occupations by Sex
Within the Management, Business, Science and Arts occupations in Vinita Park, the most male-oriented occupations are Architecture & Engineering (100.0%), Management (84.2%), and Computers & Mathematics (82.4%), while the most female-oriented occupations are Life, Physical & Social Science (100.0%), Legal Services & Support (100.0%), and Health Technologists (100.0%).
| Occupation | Male | Female |
| Management | 96 (84.2%) | 18 (15.8%) |
| Business & Financial | 27 (54.0%) | 23 (46.0%) |
| Computers, Engineering & Science | 23 (76.7%) | 7 (23.3%) |
| Computers & Mathematics | 14 (82.4%) | 3 (17.6%) |
| Architecture & Engineering | 9 (100.0%) | 0 (0.0%) |
| Life, Physical & Social Science | 0 (0.0%) | 4 (100.0%) |
| Community & Social Service | 39 (32.2%) | 82 (67.8%) |
| Education, Arts & Media | 8 (19.5%) | 33 (80.5%) |
| Legal Services & Support | 0 (0.0%) | 6 (100.0%) |
| Education Instruction & Library | 25 (44.6%) | 31 (55.4%) |
| Arts, Media & Entertainment | 6 (33.3%) | 12 (66.7%) |
| Health Diagnosing & Treating | 5 (5.4%) | 87 (94.6%) |
| Health Technologists | 0 (0.0%) | 87 (100.0%) |
| Total (Category) | 190 (46.7%) | 217 (53.3%) |
| Total (Overall) | 458 (44.8%) | 564 (55.2%) |
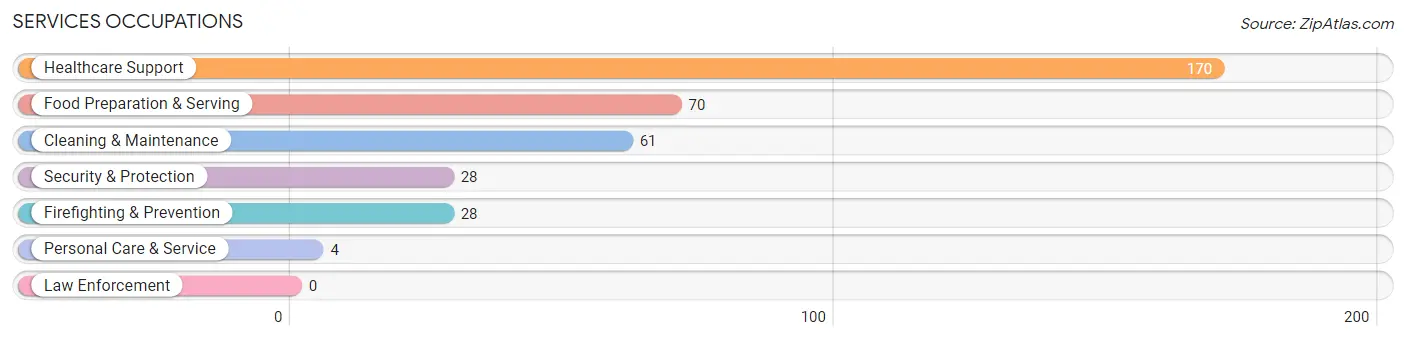
Services Occupations
The most common Services occupations in Vinita Park are Healthcare Support (170 | 16.6%), Food Preparation & Serving (70 | 6.9%), Cleaning & Maintenance (61 | 6.0%), Security & Protection (28 | 2.7%), and Firefighting & Prevention (28 | 2.7%).
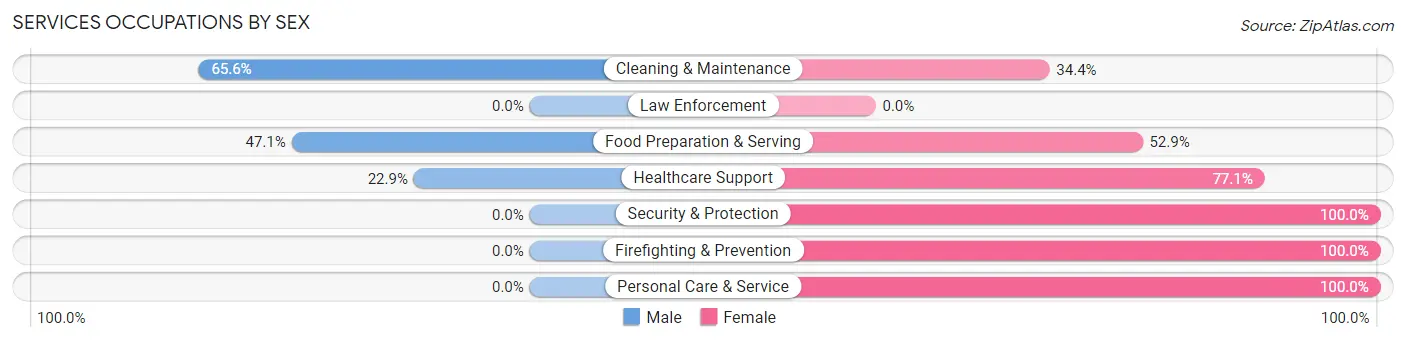
Services Occupations by Sex
Within the Services occupations in Vinita Park, the most male-oriented occupations are Cleaning & Maintenance (65.6%), Food Preparation & Serving (47.1%), and Healthcare Support (22.9%), while the most female-oriented occupations are Security & Protection (100.0%), Firefighting & Prevention (100.0%), and Personal Care & Service (100.0%).
| Occupation | Male | Female |
| Healthcare Support | 39 (22.9%) | 131 (77.1%) |
| Security & Protection | 0 (0.0%) | 28 (100.0%) |
| Firefighting & Prevention | 0 (0.0%) | 28 (100.0%) |
| Law Enforcement | 0 (0.0%) | 0 (0.0%) |
| Food Preparation & Serving | 33 (47.1%) | 37 (52.9%) |
| Cleaning & Maintenance | 40 (65.6%) | 21 (34.4%) |
| Personal Care & Service | 0 (0.0%) | 4 (100.0%) |
| Total (Category) | 112 (33.6%) | 221 (66.4%) |
| Total (Overall) | 458 (44.8%) | 564 (55.2%) |
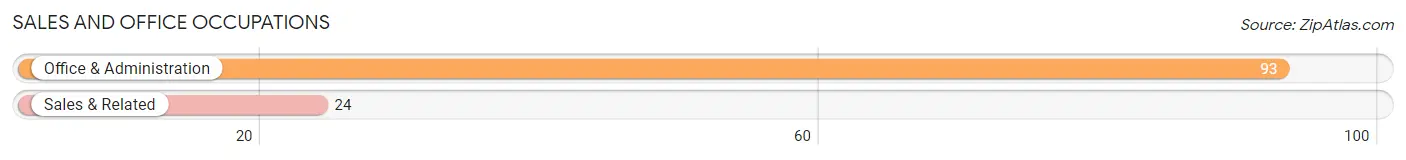
Sales and Office Occupations
The most common Sales and Office occupations in Vinita Park are Office & Administration (93 | 9.1%), and Sales & Related (24 | 2.4%).
Sales and Office Occupations by Sex
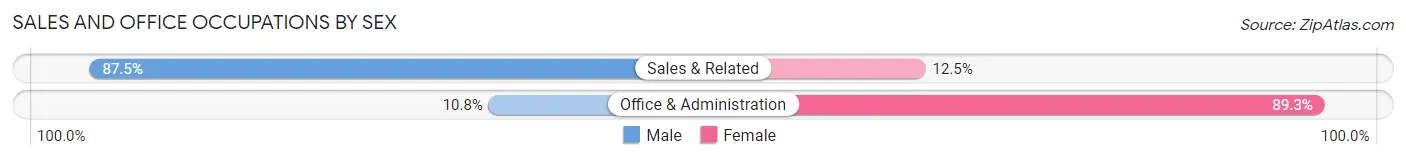
| Occupation | Male | Female |
| Sales & Related | 21 (87.5%) | 3 (12.5%) |
| Office & Administration | 10 (10.7%) | 83 (89.2%) |
| Total (Category) | 31 (26.5%) | 86 (73.5%) |
| Total (Overall) | 458 (44.8%) | 564 (55.2%) |
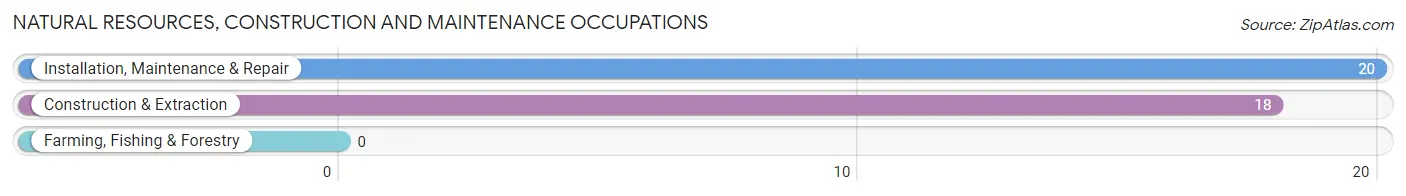
Natural Resources, Construction and Maintenance Occupations
The most common Natural Resources, Construction and Maintenance occupations in Vinita Park are Installation, Maintenance & Repair (20 | 2.0%), and Construction & Extraction (18 | 1.8%).
Natural Resources, Construction and Maintenance Occupations by Sex
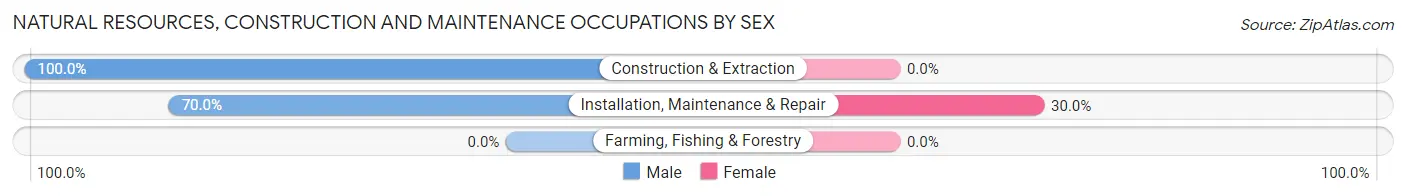
| Occupation | Male | Female |
| Farming, Fishing & Forestry | 0 (0.0%) | 0 (0.0%) |
| Construction & Extraction | 18 (100.0%) | 0 (0.0%) |
| Installation, Maintenance & Repair | 14 (70.0%) | 6 (30.0%) |
| Total (Category) | 32 (84.2%) | 6 (15.8%) |
| Total (Overall) | 458 (44.8%) | 564 (55.2%) |
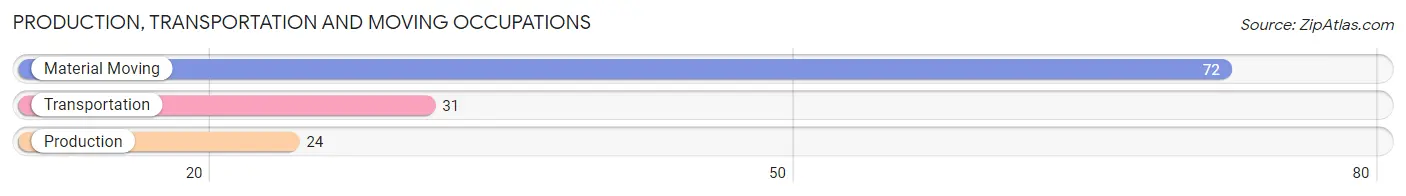
Production, Transportation and Moving Occupations
The most common Production, Transportation and Moving occupations in Vinita Park are Material Moving (72 | 7.0%), Transportation (31 | 3.0%), and Production (24 | 2.4%).
Production, Transportation and Moving Occupations by Sex
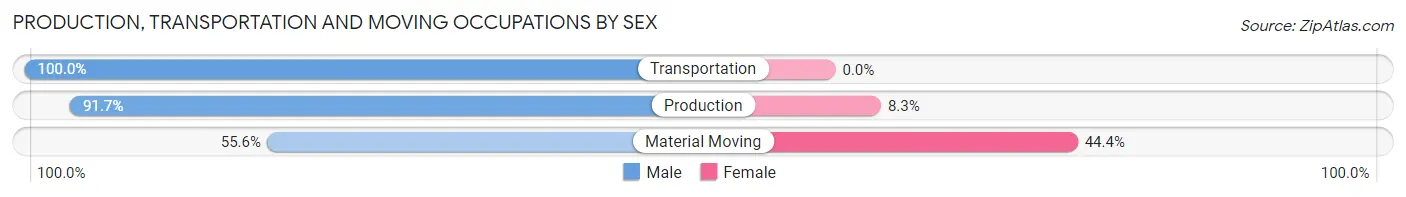
| Occupation | Male | Female |
| Production | 22 (91.7%) | 2 (8.3%) |
| Transportation | 31 (100.0%) | 0 (0.0%) |
| Material Moving | 40 (55.6%) | 32 (44.4%) |
| Total (Category) | 93 (73.2%) | 34 (26.8%) |
| Total (Overall) | 458 (44.8%) | 564 (55.2%) |
Employment Industries by Sex in Vinita Park
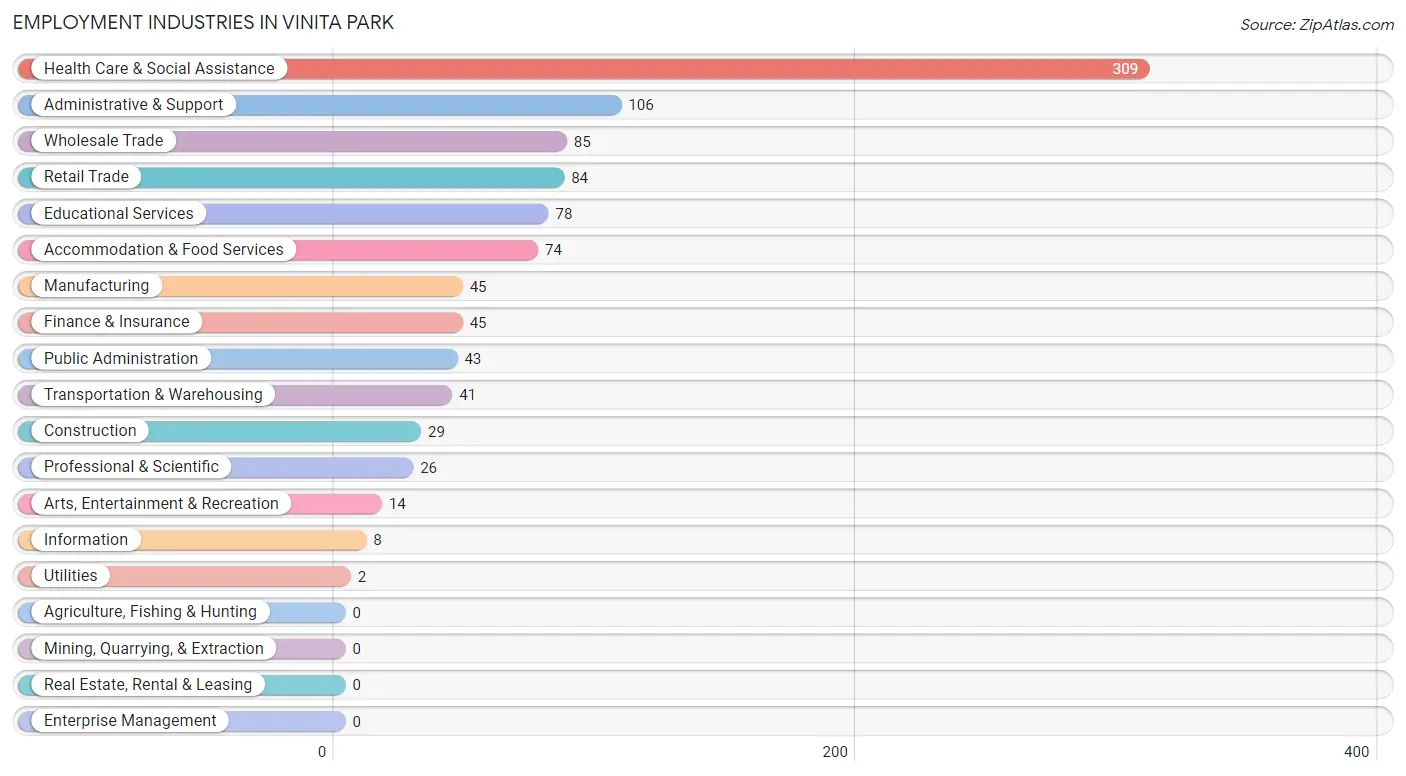
Employment Industries in Vinita Park
The major employment industries in Vinita Park include Health Care & Social Assistance (309 | 30.2%), Administrative & Support (106 | 10.4%), Wholesale Trade (85 | 8.3%), Retail Trade (84 | 8.2%), and Educational Services (78 | 7.6%).
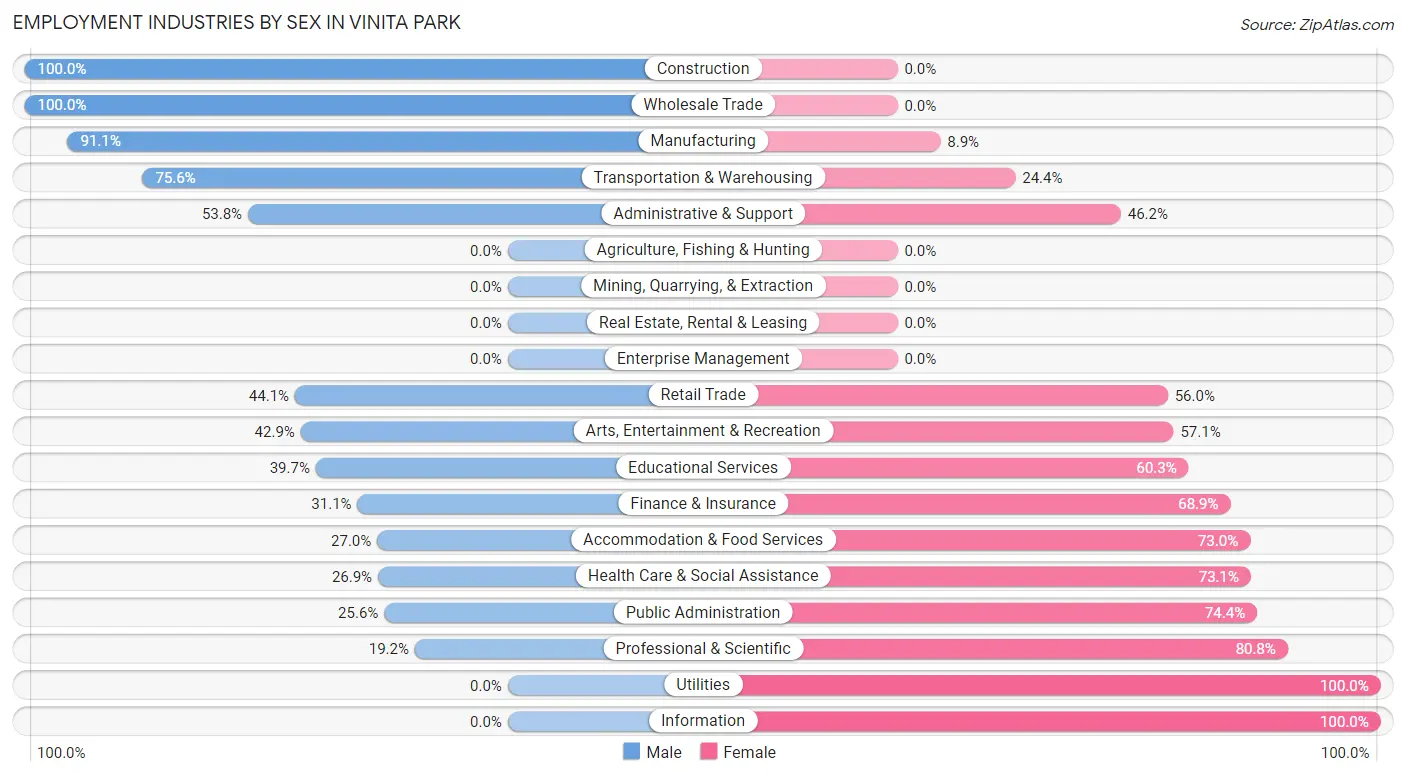
Employment Industries by Sex in Vinita Park
The Vinita Park industries that see more men than women are Construction (100.0%), Wholesale Trade (100.0%), and Manufacturing (91.1%), whereas the industries that tend to have a higher number of women are Utilities (100.0%), Information (100.0%), and Professional & Scientific (80.8%).
| Industry | Male | Female |
| Agriculture, Fishing & Hunting | 0 (0.0%) | 0 (0.0%) |
| Mining, Quarrying, & Extraction | 0 (0.0%) | 0 (0.0%) |
| Construction | 29 (100.0%) | 0 (0.0%) |
| Manufacturing | 41 (91.1%) | 4 (8.9%) |
| Wholesale Trade | 85 (100.0%) | 0 (0.0%) |
| Retail Trade | 37 (44.1%) | 47 (55.9%) |
| Transportation & Warehousing | 31 (75.6%) | 10 (24.4%) |
| Utilities | 0 (0.0%) | 2 (100.0%) |
| Information | 0 (0.0%) | 8 (100.0%) |
| Finance & Insurance | 14 (31.1%) | 31 (68.9%) |
| Real Estate, Rental & Leasing | 0 (0.0%) | 0 (0.0%) |
| Professional & Scientific | 5 (19.2%) | 21 (80.8%) |
| Enterprise Management | 0 (0.0%) | 0 (0.0%) |
| Administrative & Support | 57 (53.8%) | 49 (46.2%) |
| Educational Services | 31 (39.7%) | 47 (60.3%) |
| Health Care & Social Assistance | 83 (26.9%) | 226 (73.1%) |
| Arts, Entertainment & Recreation | 6 (42.9%) | 8 (57.1%) |
| Accommodation & Food Services | 20 (27.0%) | 54 (73.0%) |
| Public Administration | 11 (25.6%) | 32 (74.4%) |
| Total | 458 (44.8%) | 564 (55.2%) |
Education in Vinita Park
School Enrollment in Vinita Park
The most common levels of schooling among the 324 students in Vinita Park are middle school (102 | 31.5%), elementary school (58 | 17.9%), and graduate / professional (48 | 14.8%).
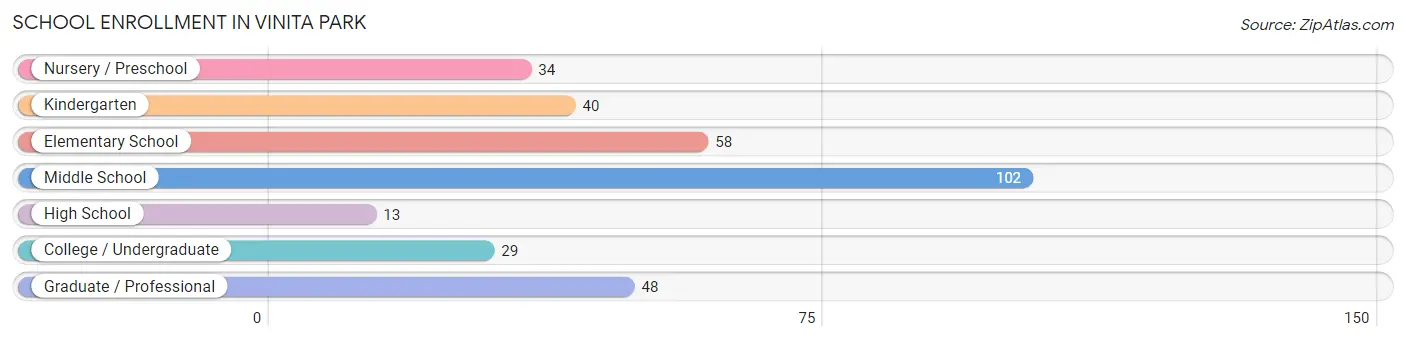
| School Level | # Students | % Students |
| Nursery / Preschool | 34 | 10.5% |
| Kindergarten | 40 | 12.3% |
| Elementary School | 58 | 17.9% |
| Middle School | 102 | 31.5% |
| High School | 13 | 4.0% |
| College / Undergraduate | 29 | 8.9% |
| Graduate / Professional | 48 | 14.8% |
| Total | 324 | 100.0% |
School Enrollment by Age by Funding Source in Vinita Park
Out of a total of 324 students who are enrolled in schools in Vinita Park, 78 (24.1%) attend a private institution, while the remaining 246 (75.9%) are enrolled in public schools. The age group of 35 years and over has the highest likelihood of being enrolled in private schools, with 9 (100.0% in the age bracket) enrolled. Conversely, the age group of 15 to 17 year olds has the lowest likelihood of being enrolled in a private school, with 3 (100.0% in the age bracket) attending a public institution.
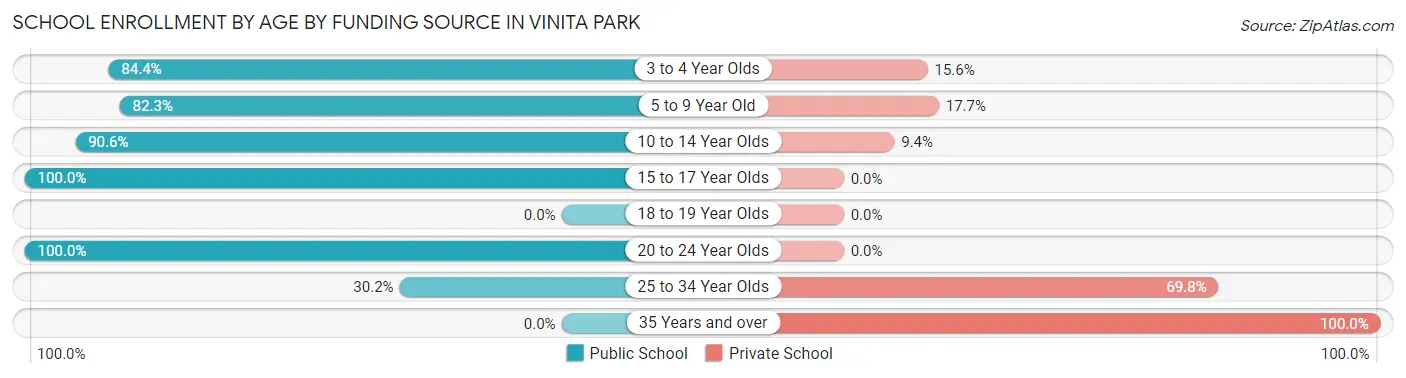
| Age Bracket | Public School | Private School |
| 3 to 4 Year Olds | 27 (84.4%) | 5 (15.6%) |
| 5 to 9 Year Old | 79 (82.3%) | 17 (17.7%) |
| 10 to 14 Year Olds | 96 (90.6%) | 10 (9.4%) |
| 15 to 17 Year Olds | 3 (100.0%) | 0 (0.0%) |
| 18 to 19 Year Olds | 0 (0.0%) | 0 (0.0%) |
| 20 to 24 Year Olds | 25 (100.0%) | 0 (0.0%) |
| 25 to 34 Year Olds | 16 (30.2%) | 37 (69.8%) |
| 35 Years and over | 0 (0.0%) | 9 (100.0%) |
| Total | 246 (75.9%) | 78 (24.1%) |
Educational Attainment by Field of Study in Vinita Park
Science & technology (98 | 26.1%), visual & performing arts (62 | 16.5%), communications (57 | 15.2%), arts & humanities (38 | 10.1%), and education (36 | 9.6%) are the most common fields of study among 375 individuals in Vinita Park who have obtained a bachelor's degree or higher.
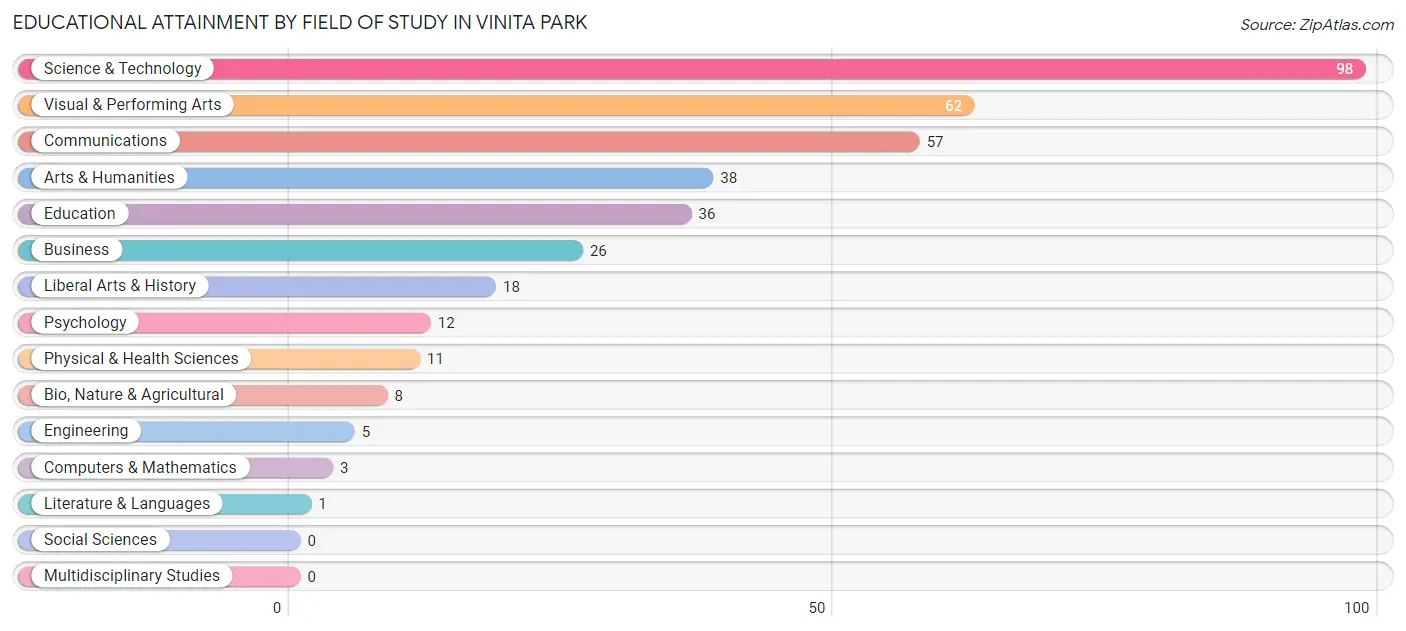
| Field of Study | # Graduates | % Graduates |
| Computers & Mathematics | 3 | 0.8% |
| Bio, Nature & Agricultural | 8 | 2.1% |
| Physical & Health Sciences | 11 | 2.9% |
| Psychology | 12 | 3.2% |
| Social Sciences | 0 | 0.0% |
| Engineering | 5 | 1.3% |
| Multidisciplinary Studies | 0 | 0.0% |
| Science & Technology | 98 | 26.1% |
| Business | 26 | 6.9% |
| Education | 36 | 9.6% |
| Literature & Languages | 1 | 0.3% |
| Liberal Arts & History | 18 | 4.8% |
| Visual & Performing Arts | 62 | 16.5% |
| Communications | 57 | 15.2% |
| Arts & Humanities | 38 | 10.1% |
| Total | 375 | 100.0% |
Transportation & Commute in Vinita Park
Vehicle Availability by Sex in Vinita Park
The most prevalent vehicle ownership categories in Vinita Park are males with 2 vehicles (267, accounting for 58.4%) and females with 2 vehicles (165, making up 47.3%).
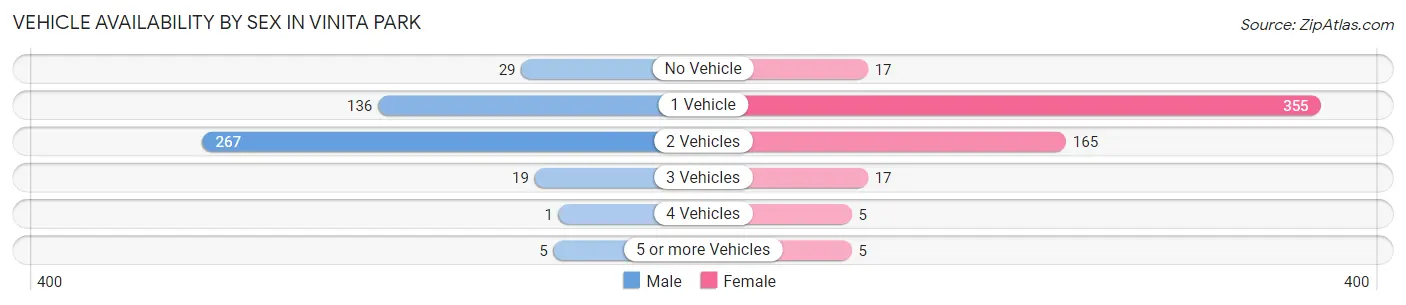
| Vehicles Available | Male | Female |
| No Vehicle | 29 (6.4%) | 17 (3.0%) |
| 1 Vehicle | 136 (29.8%) | 355 (62.9%) |
| 2 Vehicles | 267 (58.4%) | 165 (29.3%) |
| 3 Vehicles | 19 (4.2%) | 17 (3.0%) |
| 4 Vehicles | 1 (0.2%) | 5 (0.9%) |
| 5 or more Vehicles | 5 (1.1%) | 5 (0.9%) |
| Total | 457 (100.0%) | 564 (100.0%) |
Commute Time in Vinita Park
The most frequently occuring commute durations in Vinita Park are 20 to 24 minutes (301 commuters, 33.6%), 15 to 19 minutes (218 commuters, 24.4%), and 10 to 14 minutes (146 commuters, 16.3%).
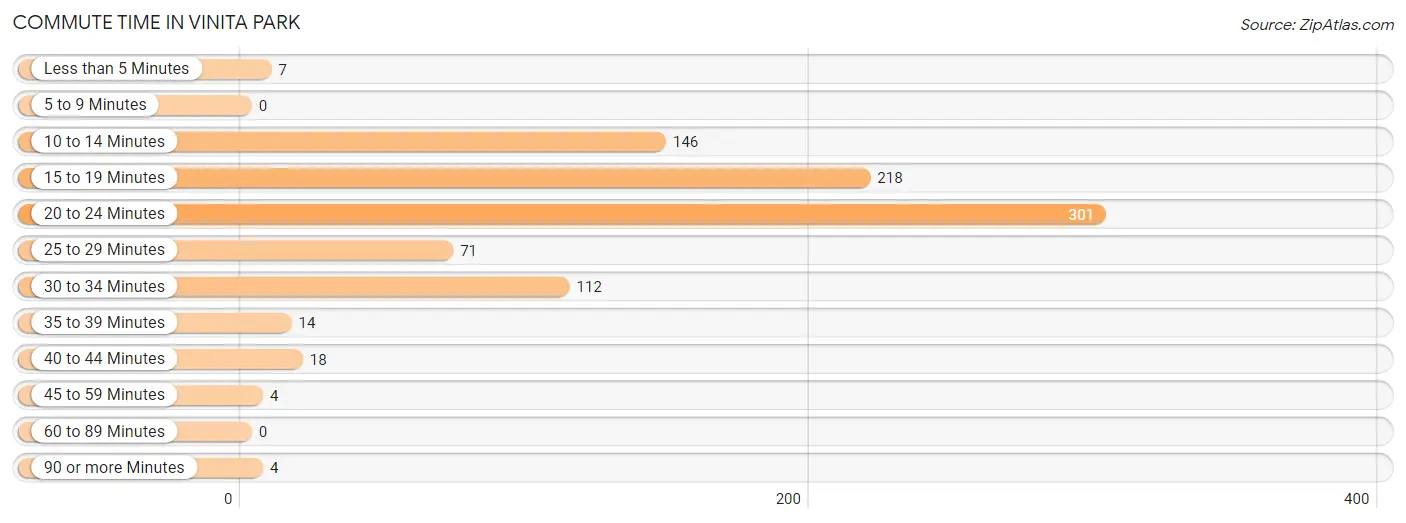
| Commute Time | # Commuters | % Commuters |
| Less than 5 Minutes | 7 | 0.8% |
| 5 to 9 Minutes | 0 | 0.0% |
| 10 to 14 Minutes | 146 | 16.3% |
| 15 to 19 Minutes | 218 | 24.4% |
| 20 to 24 Minutes | 301 | 33.6% |
| 25 to 29 Minutes | 71 | 7.9% |
| 30 to 34 Minutes | 112 | 12.5% |
| 35 to 39 Minutes | 14 | 1.6% |
| 40 to 44 Minutes | 18 | 2.0% |
| 45 to 59 Minutes | 4 | 0.4% |
| 60 to 89 Minutes | 0 | 0.0% |
| 90 or more Minutes | 4 | 0.4% |
Commute Time by Sex in Vinita Park
The most common commute times in Vinita Park are 15 to 19 minutes (129 commuters, 31.6%) for males and 20 to 24 minutes (180 commuters, 37.0%) for females.
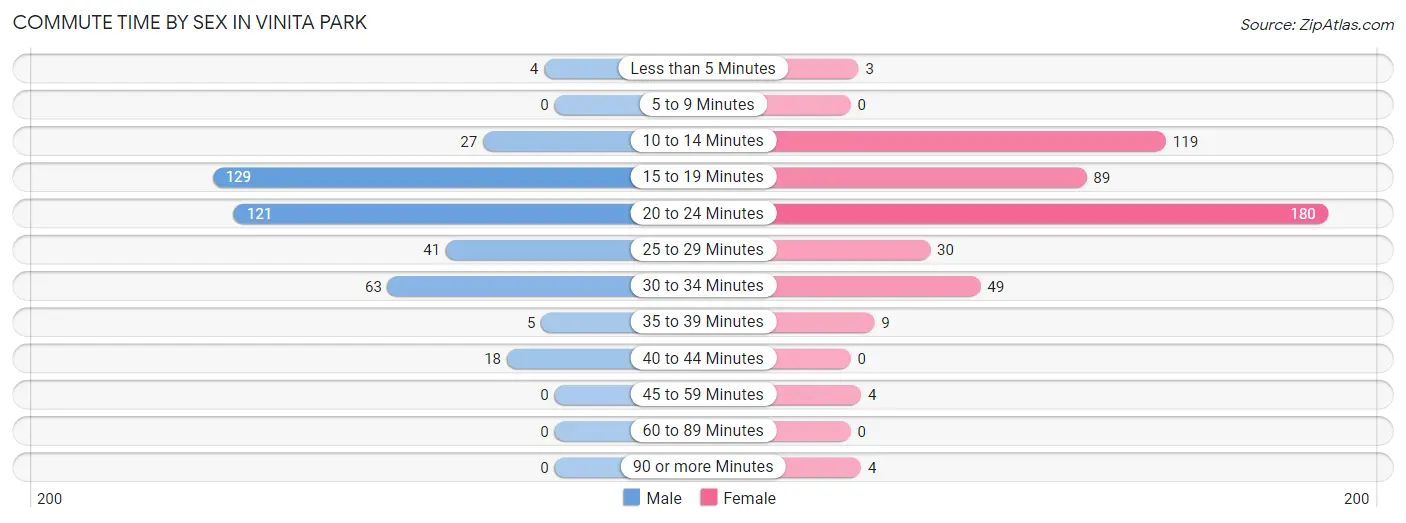
| Commute Time | Male | Female |
| Less than 5 Minutes | 4 (1.0%) | 3 (0.6%) |
| 5 to 9 Minutes | 0 (0.0%) | 0 (0.0%) |
| 10 to 14 Minutes | 27 (6.6%) | 119 (24.4%) |
| 15 to 19 Minutes | 129 (31.6%) | 89 (18.3%) |
| 20 to 24 Minutes | 121 (29.7%) | 180 (37.0%) |
| 25 to 29 Minutes | 41 (10.1%) | 30 (6.2%) |
| 30 to 34 Minutes | 63 (15.4%) | 49 (10.1%) |
| 35 to 39 Minutes | 5 (1.2%) | 9 (1.8%) |
| 40 to 44 Minutes | 18 (4.4%) | 0 (0.0%) |
| 45 to 59 Minutes | 0 (0.0%) | 4 (0.8%) |
| 60 to 89 Minutes | 0 (0.0%) | 0 (0.0%) |
| 90 or more Minutes | 0 (0.0%) | 4 (0.8%) |
Time of Departure to Work by Sex in Vinita Park
The most frequent times of departure to work in Vinita Park are 7:30 AM to 7:59 AM (116, 28.4%) for males and 7:00 AM to 7:29 AM (96, 19.7%) for females.
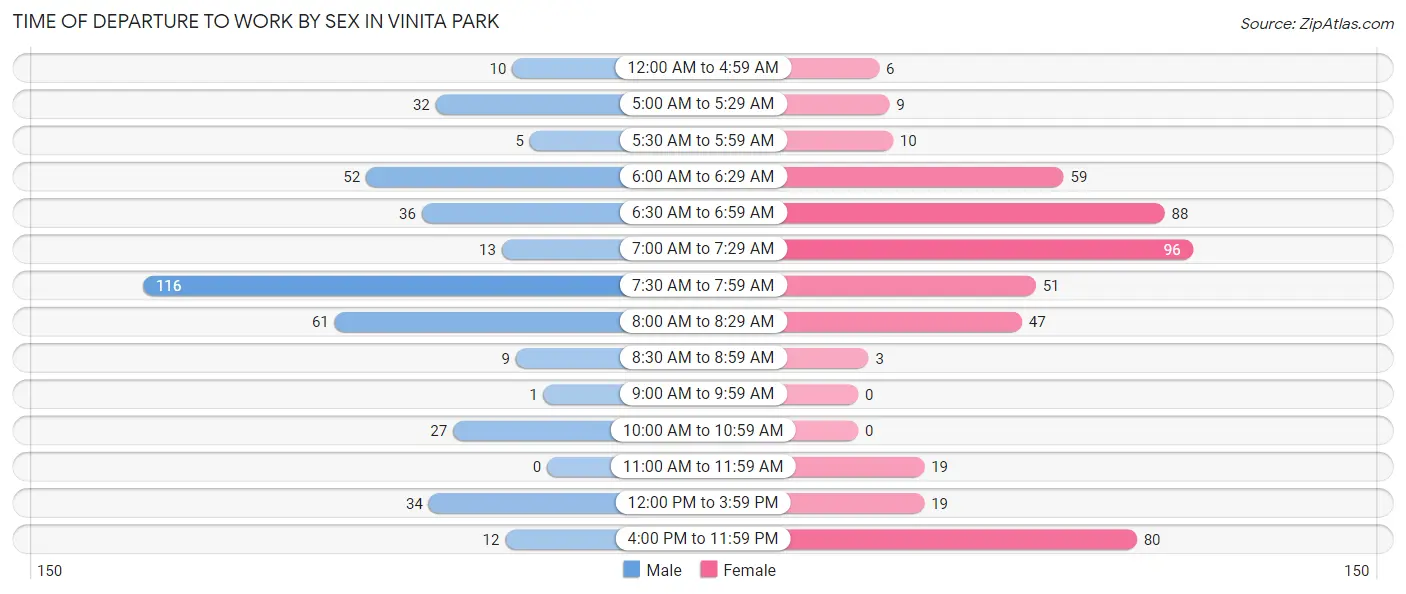
| Time of Departure | Male | Female |
| 12:00 AM to 4:59 AM | 10 (2.5%) | 6 (1.2%) |
| 5:00 AM to 5:29 AM | 32 (7.8%) | 9 (1.8%) |
| 5:30 AM to 5:59 AM | 5 (1.2%) | 10 (2.1%) |
| 6:00 AM to 6:29 AM | 52 (12.8%) | 59 (12.1%) |
| 6:30 AM to 6:59 AM | 36 (8.8%) | 88 (18.1%) |
| 7:00 AM to 7:29 AM | 13 (3.2%) | 96 (19.7%) |
| 7:30 AM to 7:59 AM | 116 (28.4%) | 51 (10.5%) |
| 8:00 AM to 8:29 AM | 61 (14.9%) | 47 (9.7%) |
| 8:30 AM to 8:59 AM | 9 (2.2%) | 3 (0.6%) |
| 9:00 AM to 9:59 AM | 1 (0.3%) | 0 (0.0%) |
| 10:00 AM to 10:59 AM | 27 (6.6%) | 0 (0.0%) |
| 11:00 AM to 11:59 AM | 0 (0.0%) | 19 (3.9%) |
| 12:00 PM to 3:59 PM | 34 (8.3%) | 19 (3.9%) |
| 4:00 PM to 11:59 PM | 12 (2.9%) | 80 (16.4%) |
| Total | 408 (100.0%) | 487 (100.0%) |
Housing Occupancy in Vinita Park
Occupancy by Ownership in Vinita Park
Of the total 884 dwellings in Vinita Park, owner-occupied units account for 383 (43.3%), while renter-occupied units make up 501 (56.7%).
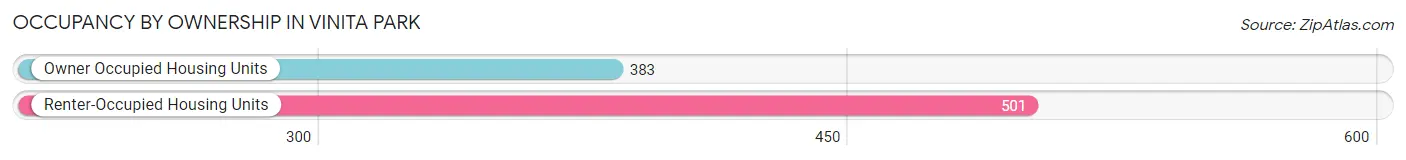
| Occupancy | # Housing Units | % Housing Units |
| Owner Occupied Housing Units | 383 | 43.3% |
| Renter-Occupied Housing Units | 501 | 56.7% |
| Total Occupied Housing Units | 884 | 100.0% |
Occupancy by Household Size in Vinita Park

| Household Size | # Housing Units | % Housing Units |
| 1-Person Household | 391 | 44.2% |
| 2-Person Household | 304 | 34.4% |
| 3-Person Household | 64 | 7.2% |
| 4+ Person Household | 125 | 14.1% |
| Total Housing Units | 884 | 100.0% |
Occupancy by Ownership by Household Size in Vinita Park
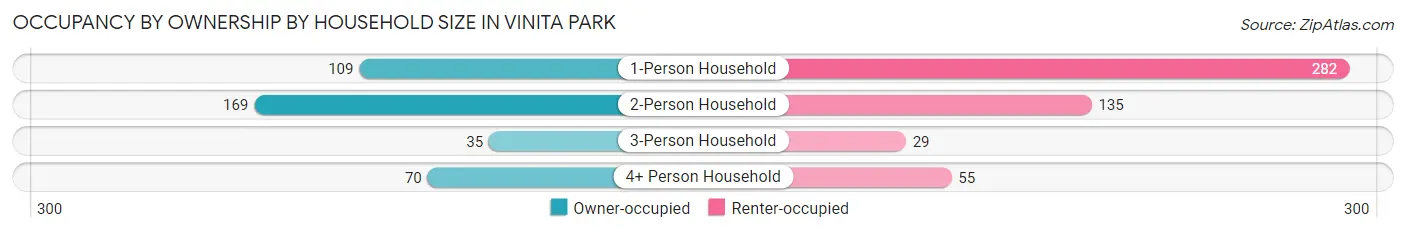
| Household Size | Owner-occupied | Renter-occupied |
| 1-Person Household | 109 (27.9%) | 282 (72.1%) |
| 2-Person Household | 169 (55.6%) | 135 (44.4%) |
| 3-Person Household | 35 (54.7%) | 29 (45.3%) |
| 4+ Person Household | 70 (56.0%) | 55 (44.0%) |
| Total Housing Units | 383 (43.3%) | 501 (56.7%) |
Occupancy by Educational Attainment in Vinita Park
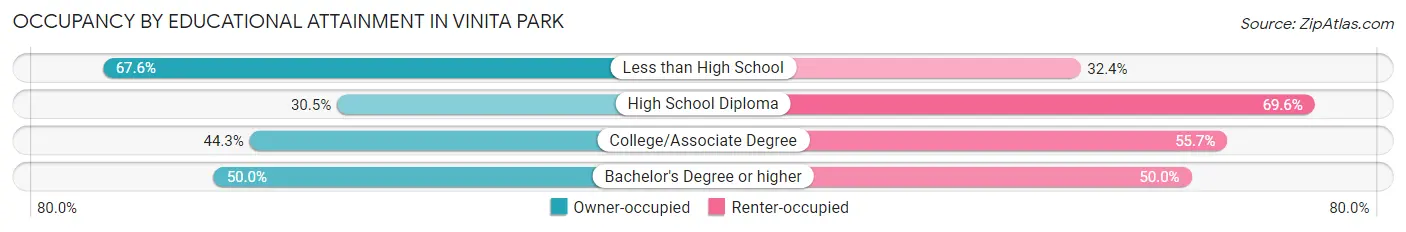
| Household Size | Owner-occupied | Renter-occupied |
| Less than High School | 48 (67.6%) | 23 (32.4%) |
| High School Diploma | 88 (30.4%) | 201 (69.6%) |
| College/Associate Degree | 117 (44.3%) | 147 (55.7%) |
| Bachelor's Degree or higher | 130 (50.0%) | 130 (50.0%) |
Occupancy by Age of Householder in Vinita Park
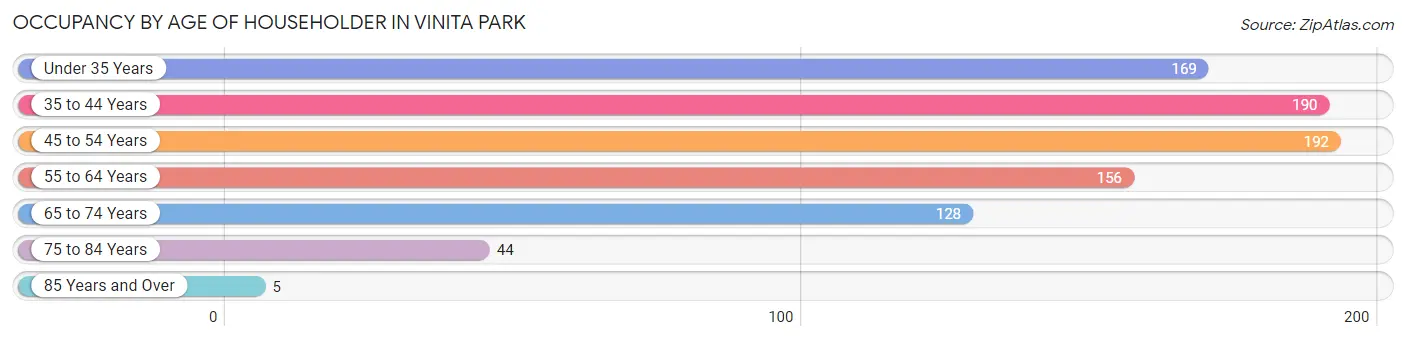
| Age Bracket | # Households | % Households |
| Under 35 Years | 169 | 19.1% |
| 35 to 44 Years | 190 | 21.5% |
| 45 to 54 Years | 192 | 21.7% |
| 55 to 64 Years | 156 | 17.6% |
| 65 to 74 Years | 128 | 14.5% |
| 75 to 84 Years | 44 | 5.0% |
| 85 Years and Over | 5 | 0.6% |
| Total | 884 | 100.0% |
Housing Finances in Vinita Park
Median Income by Occupancy in Vinita Park
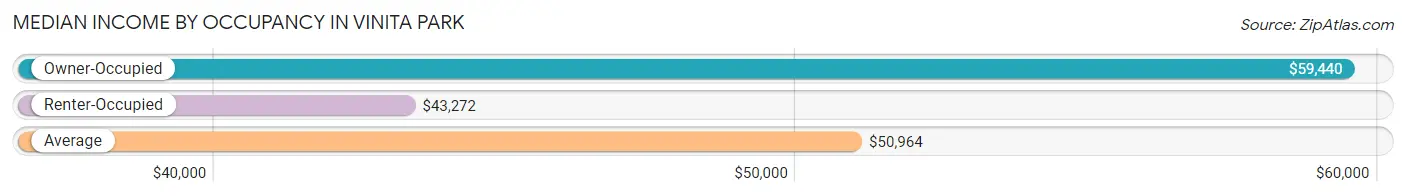
| Occupancy Type | # Households | Median Income |
| Owner-Occupied | 383 (43.3%) | $59,440 |
| Renter-Occupied | 501 (56.7%) | $43,272 |
| Average | 884 (100.0%) | $50,964 |
Occupancy by Householder Income Bracket in Vinita Park
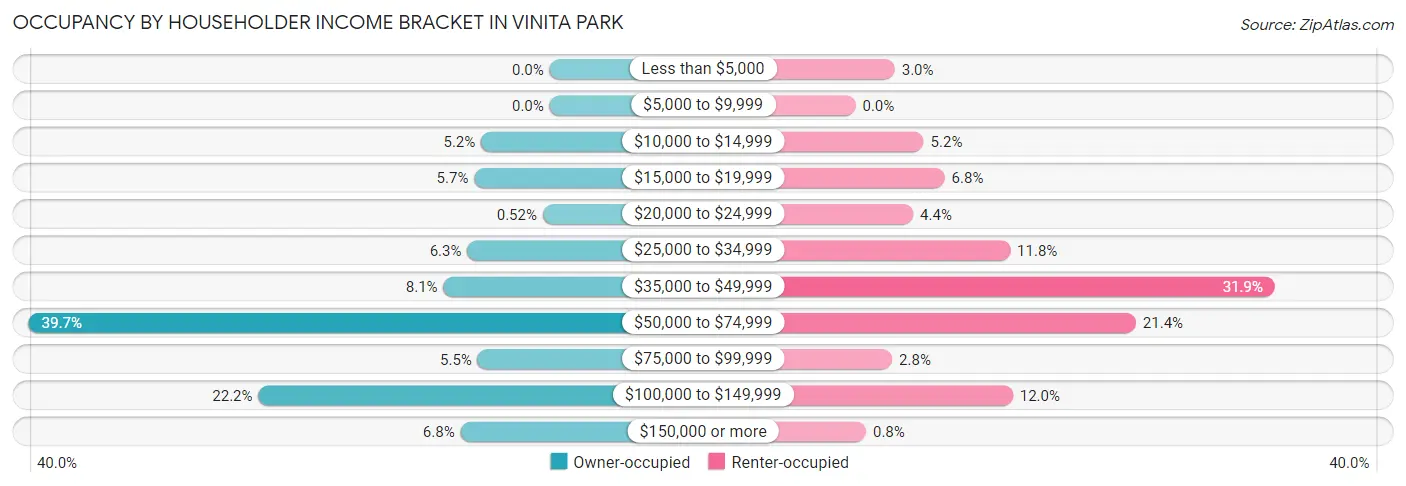
| Income Bracket | Owner-occupied | Renter-occupied |
| Less than $5,000 | 0 (0.0%) | 15 (3.0%) |
| $5,000 to $9,999 | 0 (0.0%) | 0 (0.0%) |
| $10,000 to $14,999 | 20 (5.2%) | 26 (5.2%) |
| $15,000 to $19,999 | 22 (5.7%) | 34 (6.8%) |
| $20,000 to $24,999 | 2 (0.5%) | 22 (4.4%) |
| $25,000 to $34,999 | 24 (6.3%) | 59 (11.8%) |
| $35,000 to $49,999 | 31 (8.1%) | 160 (31.9%) |
| $50,000 to $74,999 | 152 (39.7%) | 107 (21.4%) |
| $75,000 to $99,999 | 21 (5.5%) | 14 (2.8%) |
| $100,000 to $149,999 | 85 (22.2%) | 60 (12.0%) |
| $150,000 or more | 26 (6.8%) | 4 (0.8%) |
| Total | 383 (100.0%) | 501 (100.0%) |
Monthly Housing Cost Tiers in Vinita Park
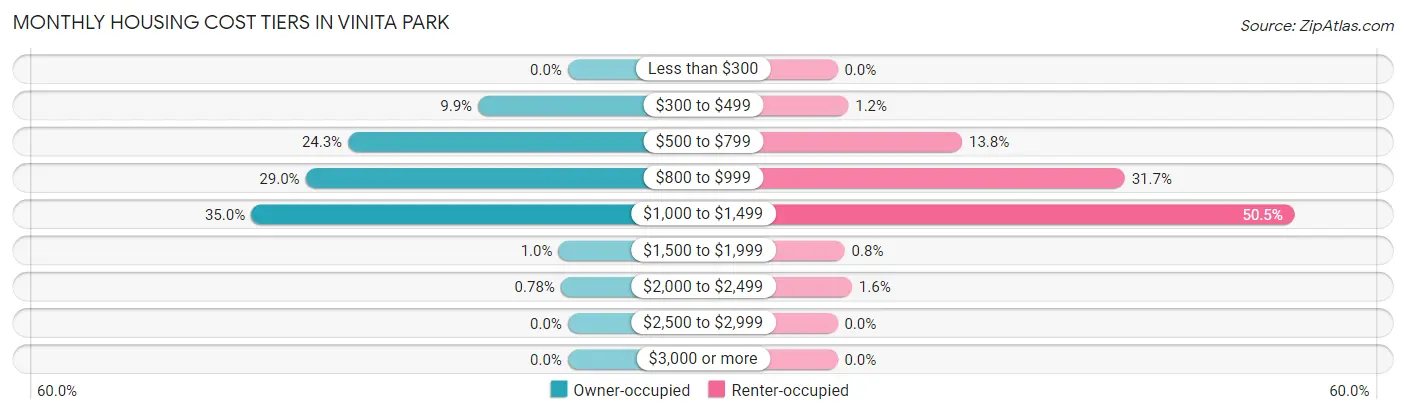
| Monthly Cost | Owner-occupied | Renter-occupied |
| Less than $300 | 0 (0.0%) | 0 (0.0%) |
| $300 to $499 | 38 (9.9%) | 6 (1.2%) |
| $500 to $799 | 93 (24.3%) | 69 (13.8%) |
| $800 to $999 | 111 (29.0%) | 159 (31.7%) |
| $1,000 to $1,499 | 134 (35.0%) | 253 (50.5%) |
| $1,500 to $1,999 | 4 (1.0%) | 4 (0.8%) |
| $2,000 to $2,499 | 3 (0.8%) | 8 (1.6%) |
| $2,500 to $2,999 | 0 (0.0%) | 0 (0.0%) |
| $3,000 or more | 0 (0.0%) | 0 (0.0%) |
| Total | 383 (100.0%) | 501 (100.0%) |
Physical Housing Characteristics in Vinita Park
Housing Structures in Vinita Park
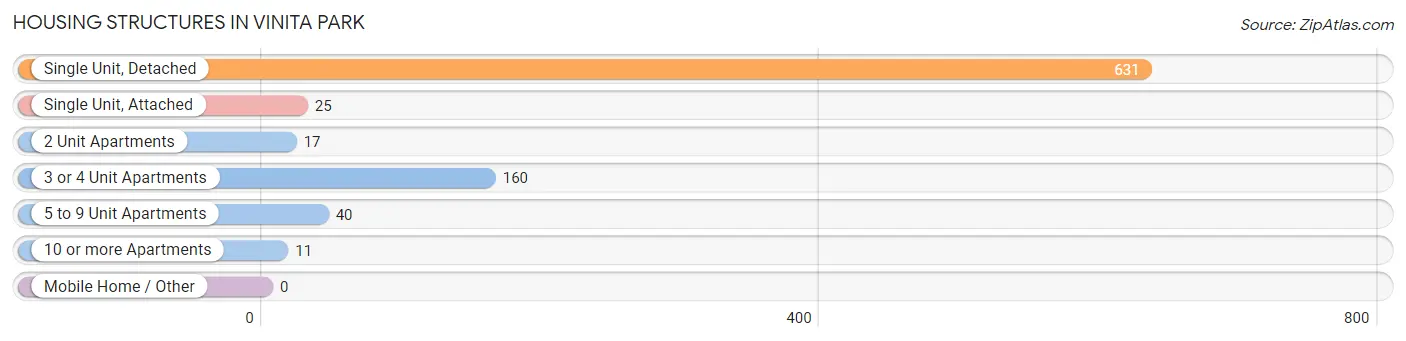
| Structure Type | # Housing Units | % Housing Units |
| Single Unit, Detached | 631 | 71.4% |
| Single Unit, Attached | 25 | 2.8% |
| 2 Unit Apartments | 17 | 1.9% |
| 3 or 4 Unit Apartments | 160 | 18.1% |
| 5 to 9 Unit Apartments | 40 | 4.5% |
| 10 or more Apartments | 11 | 1.2% |
| Mobile Home / Other | 0 | 0.0% |
| Total | 884 | 100.0% |
Housing Structures by Occupancy in Vinita Park
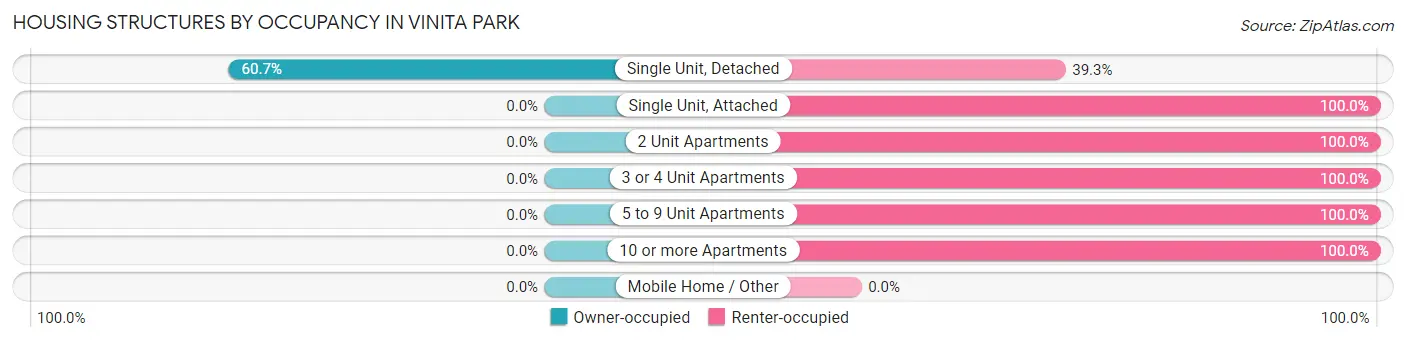
| Structure Type | Owner-occupied | Renter-occupied |
| Single Unit, Detached | 383 (60.7%) | 248 (39.3%) |
| Single Unit, Attached | 0 (0.0%) | 25 (100.0%) |
| 2 Unit Apartments | 0 (0.0%) | 17 (100.0%) |
| 3 or 4 Unit Apartments | 0 (0.0%) | 160 (100.0%) |
| 5 to 9 Unit Apartments | 0 (0.0%) | 40 (100.0%) |
| 10 or more Apartments | 0 (0.0%) | 11 (100.0%) |
| Mobile Home / Other | 0 (0.0%) | 0 (0.0%) |
| Total | 383 (43.3%) | 501 (56.7%) |
Housing Structures by Number of Rooms in Vinita Park
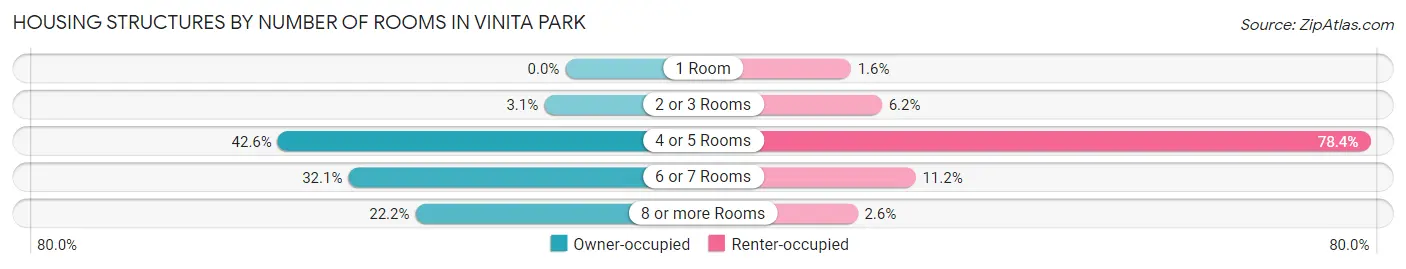
| Number of Rooms | Owner-occupied | Renter-occupied |
| 1 Room | 0 (0.0%) | 8 (1.6%) |
| 2 or 3 Rooms | 12 (3.1%) | 31 (6.2%) |
| 4 or 5 Rooms | 163 (42.6%) | 393 (78.4%) |
| 6 or 7 Rooms | 123 (32.1%) | 56 (11.2%) |
| 8 or more Rooms | 85 (22.2%) | 13 (2.6%) |
| Total | 383 (100.0%) | 501 (100.0%) |
Housing Structure by Heating Type in Vinita Park
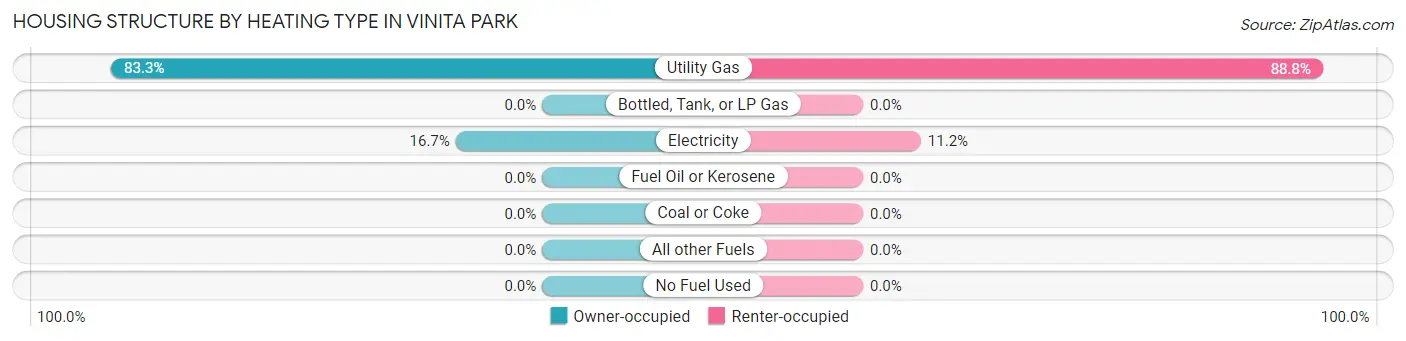
| Heating Type | Owner-occupied | Renter-occupied |
| Utility Gas | 319 (83.3%) | 445 (88.8%) |
| Bottled, Tank, or LP Gas | 0 (0.0%) | 0 (0.0%) |
| Electricity | 64 (16.7%) | 56 (11.2%) |
| Fuel Oil or Kerosene | 0 (0.0%) | 0 (0.0%) |
| Coal or Coke | 0 (0.0%) | 0 (0.0%) |
| All other Fuels | 0 (0.0%) | 0 (0.0%) |
| No Fuel Used | 0 (0.0%) | 0 (0.0%) |
| Total | 383 (100.0%) | 501 (100.0%) |
Household Vehicle Usage in Vinita Park
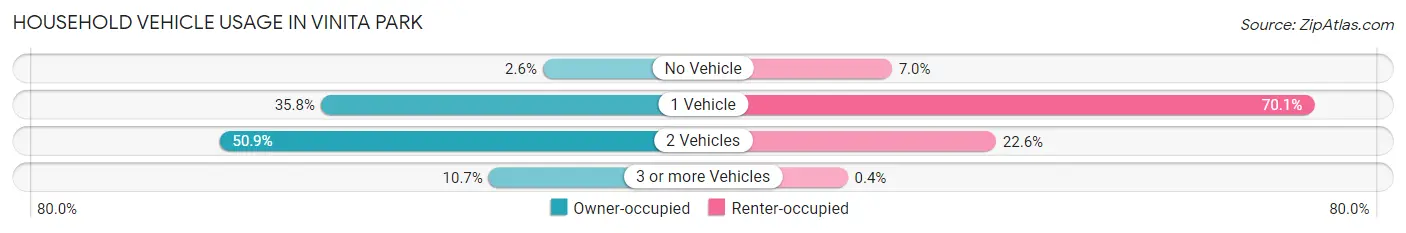
| Vehicles per Household | Owner-occupied | Renter-occupied |
| No Vehicle | 10 (2.6%) | 35 (7.0%) |
| 1 Vehicle | 137 (35.8%) | 351 (70.1%) |
| 2 Vehicles | 195 (50.9%) | 113 (22.6%) |
| 3 or more Vehicles | 41 (10.7%) | 2 (0.4%) |
| Total | 383 (100.0%) | 501 (100.0%) |
Real Estate & Mortgages in Vinita Park
Real Estate and Mortgage Overview in Vinita Park
| Characteristic | Without Mortgage | With Mortgage |
| Housing Units | 87 | 296 |
| Median Property Value | $94,800 | $89,000 |
| Median Household Income | $51,806 | $17 |
| Monthly Housing Costs | $533 | $0 |
| Real Estate Taxes | $1,721 | $0 |
Property Value by Mortgage Status in Vinita Park
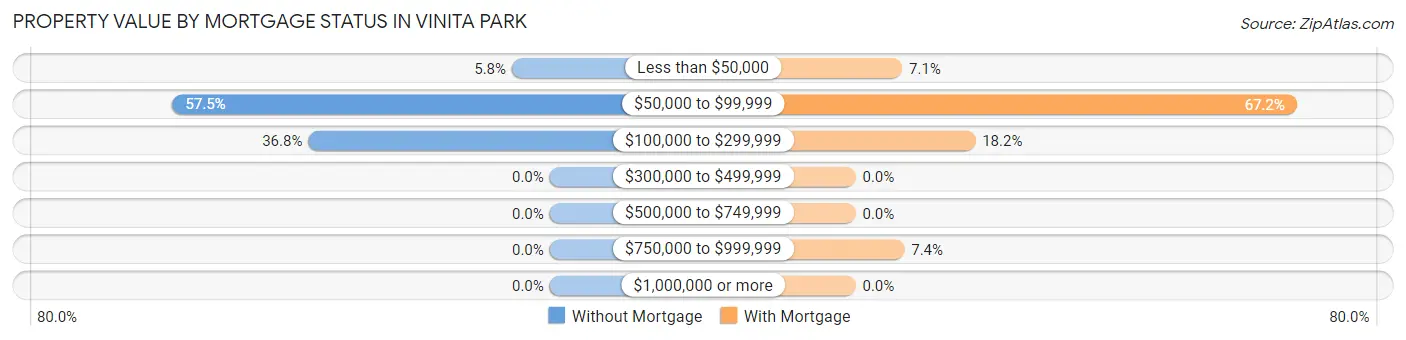
| Property Value | Without Mortgage | With Mortgage |
| Less than $50,000 | 5 (5.8%) | 21 (7.1%) |
| $50,000 to $99,999 | 50 (57.5%) | 199 (67.2%) |
| $100,000 to $299,999 | 32 (36.8%) | 54 (18.2%) |
| $300,000 to $499,999 | 0 (0.0%) | 0 (0.0%) |
| $500,000 to $749,999 | 0 (0.0%) | 0 (0.0%) |
| $750,000 to $999,999 | 0 (0.0%) | 22 (7.4%) |
| $1,000,000 or more | 0 (0.0%) | 0 (0.0%) |
| Total | 87 (100.0%) | 296 (100.0%) |
Household Income by Mortgage Status in Vinita Park
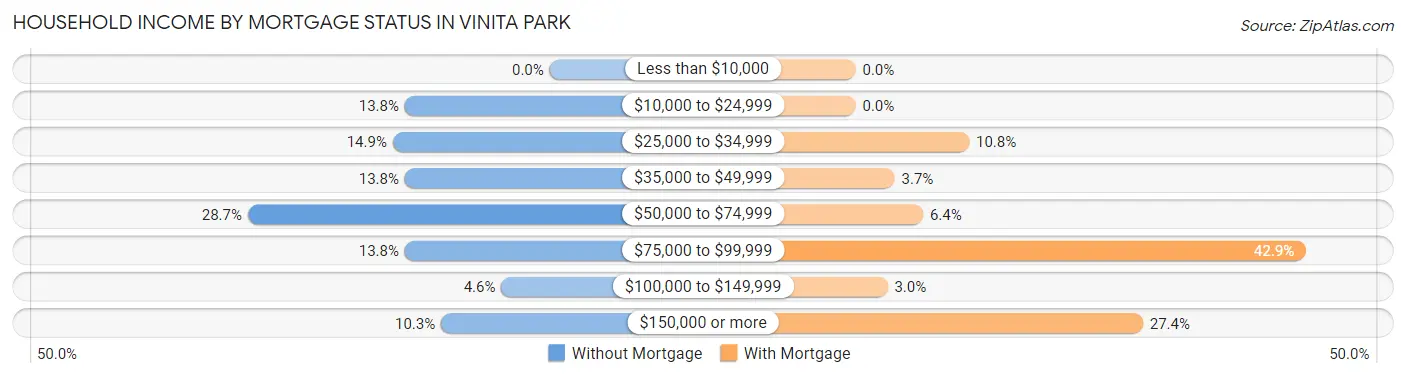
| Household Income | Without Mortgage | With Mortgage |
| Less than $10,000 | 0 (0.0%) | 0 (0.0%) |
| $10,000 to $24,999 | 12 (13.8%) | 0 (0.0%) |
| $25,000 to $34,999 | 13 (14.9%) | 32 (10.8%) |
| $35,000 to $49,999 | 12 (13.8%) | 11 (3.7%) |
| $50,000 to $74,999 | 25 (28.7%) | 19 (6.4%) |
| $75,000 to $99,999 | 12 (13.8%) | 127 (42.9%) |
| $100,000 to $149,999 | 4 (4.6%) | 9 (3.0%) |
| $150,000 or more | 9 (10.3%) | 81 (27.4%) |
| Total | 87 (100.0%) | 296 (100.0%) |
Property Value to Household Income Ratio in Vinita Park
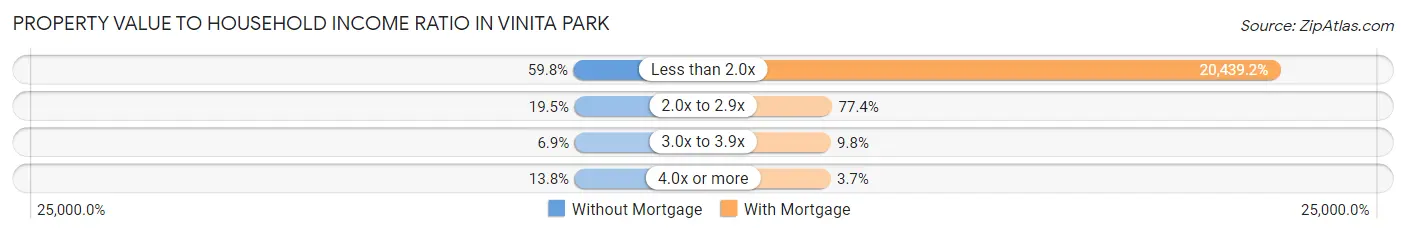
| Value-to-Income Ratio | Without Mortgage | With Mortgage |
| Less than 2.0x | 52 (59.8%) | 60,500 (20,439.2%) |
| 2.0x to 2.9x | 17 (19.5%) | 229 (77.4%) |
| 3.0x to 3.9x | 6 (6.9%) | 29 (9.8%) |
| 4.0x or more | 12 (13.8%) | 11 (3.7%) |
| Total | 87 (100.0%) | 296 (100.0%) |
Real Estate Taxes by Mortgage Status in Vinita Park
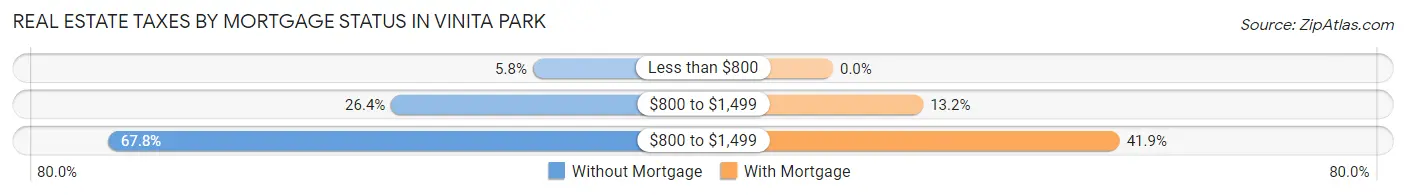
| Property Taxes | Without Mortgage | With Mortgage |
| Less than $800 | 5 (5.8%) | 0 (0.0%) |
| $800 to $1,499 | 23 (26.4%) | 39 (13.2%) |
| $800 to $1,499 | 59 (67.8%) | 124 (41.9%) |
| Total | 87 (100.0%) | 296 (100.0%) |
Health & Disability in Vinita Park
Health Insurance Coverage by Age in Vinita Park
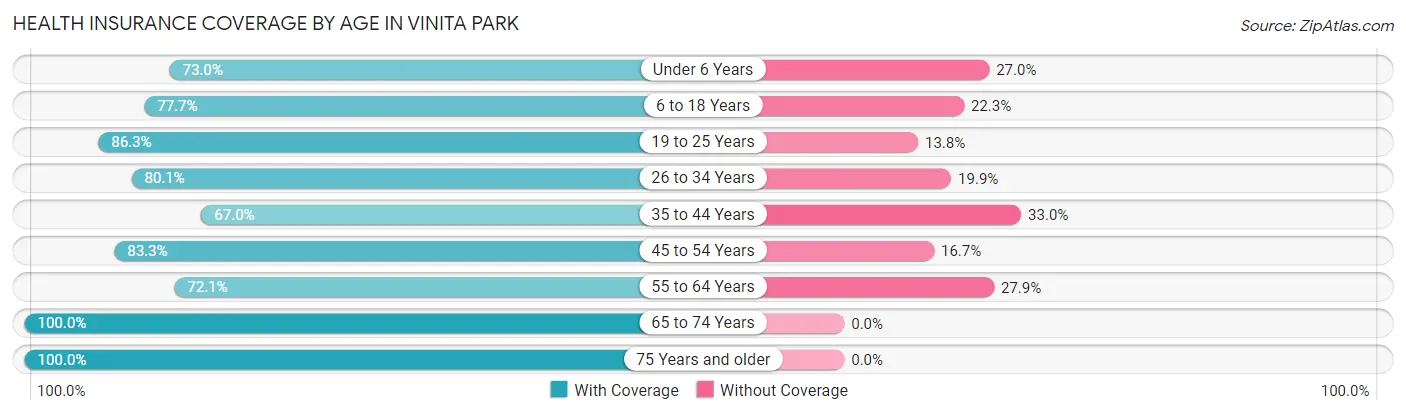
| Age Bracket | With Coverage | Without Coverage |
| Under 6 Years | 108 (73.0%) | 40 (27.0%) |
| 6 to 18 Years | 174 (77.7%) | 50 (22.3%) |
| 19 to 25 Years | 138 (86.3%) | 22 (13.8%) |
| 26 to 34 Years | 221 (80.1%) | 55 (19.9%) |
| 35 to 44 Years | 189 (67.0%) | 93 (33.0%) |
| 45 to 54 Years | 219 (83.3%) | 44 (16.7%) |
| 55 to 64 Years | 160 (72.1%) | 62 (27.9%) |
| 65 to 74 Years | 210 (100.0%) | 0 (0.0%) |
| 75 Years and older | 72 (100.0%) | 0 (0.0%) |
| Total | 1,491 (80.3%) | 366 (19.7%) |
Health Insurance Coverage by Citizenship Status in Vinita Park
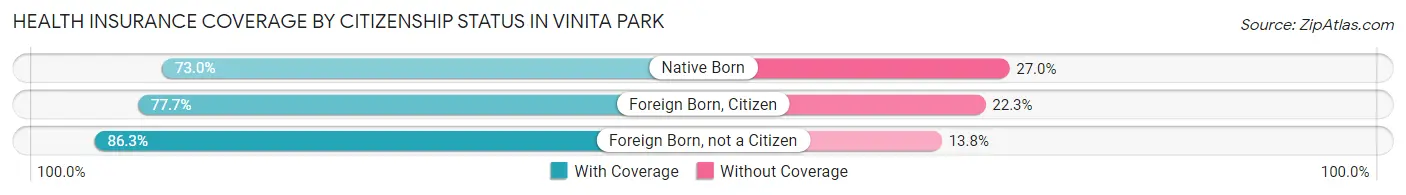
| Citizenship Status | With Coverage | Without Coverage |
| Native Born | 108 (73.0%) | 40 (27.0%) |
| Foreign Born, Citizen | 174 (77.7%) | 50 (22.3%) |
| Foreign Born, not a Citizen | 138 (86.3%) | 22 (13.8%) |
Health Insurance Coverage by Household Income in Vinita Park
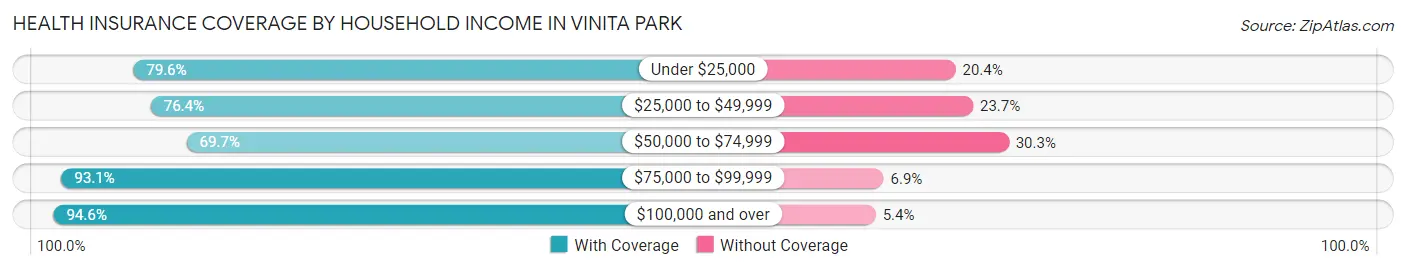
| Household Income | With Coverage | Without Coverage |
| Under $25,000 | 211 (79.6%) | 54 (20.4%) |
| $25,000 to $49,999 | 381 (76.3%) | 118 (23.6%) |
| $50,000 to $74,999 | 372 (69.7%) | 162 (30.3%) |
| $75,000 to $99,999 | 108 (93.1%) | 8 (6.9%) |
| $100,000 and over | 419 (94.6%) | 24 (5.4%) |
Public vs Private Health Insurance Coverage by Age in Vinita Park
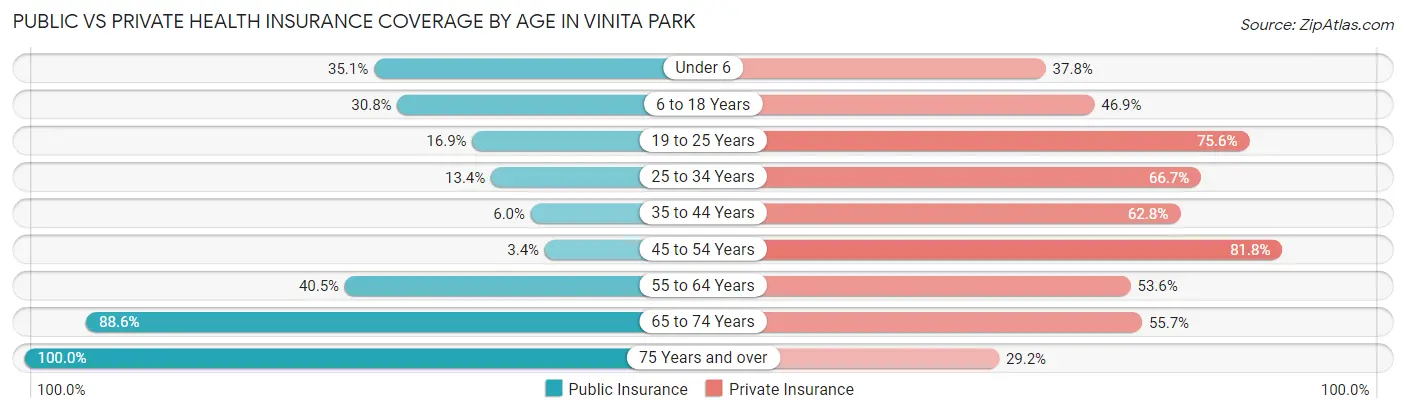
| Age Bracket | Public Insurance | Private Insurance |
| Under 6 | 52 (35.1%) | 56 (37.8%) |
| 6 to 18 Years | 69 (30.8%) | 105 (46.9%) |
| 19 to 25 Years | 27 (16.9%) | 121 (75.6%) |
| 25 to 34 Years | 37 (13.4%) | 184 (66.7%) |
| 35 to 44 Years | 17 (6.0%) | 177 (62.8%) |
| 45 to 54 Years | 9 (3.4%) | 215 (81.8%) |
| 55 to 64 Years | 90 (40.5%) | 119 (53.6%) |
| 65 to 74 Years | 186 (88.6%) | 117 (55.7%) |
| 75 Years and over | 72 (100.0%) | 21 (29.2%) |
| Total | 559 (30.1%) | 1,115 (60.0%) |
Disability Status by Sex by Age in Vinita Park
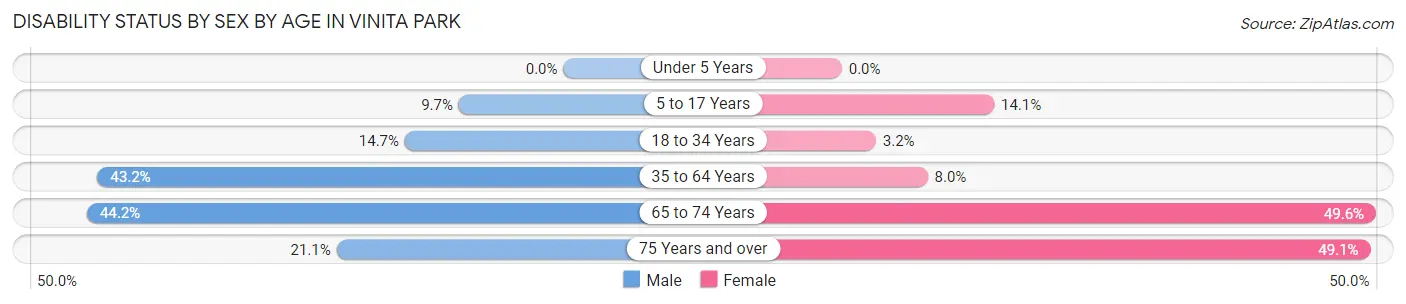
| Age Bracket | Male | Female |
| Under 5 Years | 0 (0.0%) | 0 (0.0%) |
| 5 to 17 Years | 13 (9.7%) | 13 (14.1%) |
| 18 to 34 Years | 40 (14.7%) | 6 (3.2%) |
| 35 to 64 Years | 147 (43.2%) | 34 (8.0%) |
| 65 to 74 Years | 42 (44.2%) | 57 (49.6%) |
| 75 Years and over | 4 (21.0%) | 26 (49.1%) |
Disability Class by Sex by Age in Vinita Park
Disability Class: Hearing Difficulty
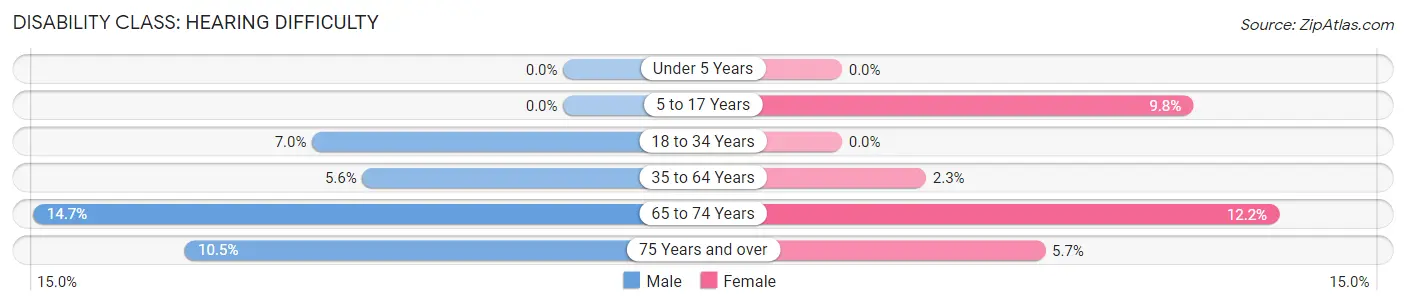
| Age Bracket | Male | Female |
| Under 5 Years | 0 (0.0%) | 0 (0.0%) |
| 5 to 17 Years | 0 (0.0%) | 9 (9.8%) |
| 18 to 34 Years | 19 (7.0%) | 0 (0.0%) |
| 35 to 64 Years | 19 (5.6%) | 10 (2.3%) |
| 65 to 74 Years | 14 (14.7%) | 14 (12.2%) |
| 75 Years and over | 2 (10.5%) | 3 (5.7%) |
Disability Class: Vision Difficulty
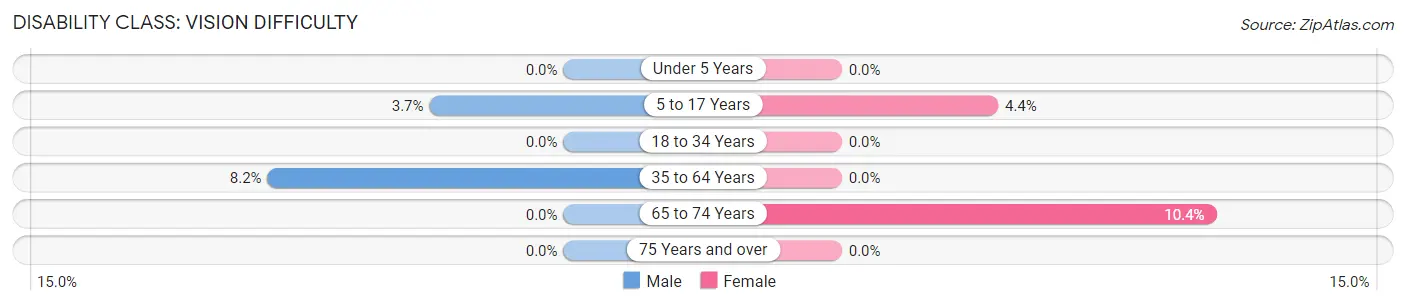
| Age Bracket | Male | Female |
| Under 5 Years | 0 (0.0%) | 0 (0.0%) |
| 5 to 17 Years | 5 (3.7%) | 4 (4.3%) |
| 18 to 34 Years | 0 (0.0%) | 0 (0.0%) |
| 35 to 64 Years | 28 (8.2%) | 0 (0.0%) |
| 65 to 74 Years | 0 (0.0%) | 12 (10.4%) |
| 75 Years and over | 0 (0.0%) | 0 (0.0%) |
Disability Class: Cognitive Difficulty
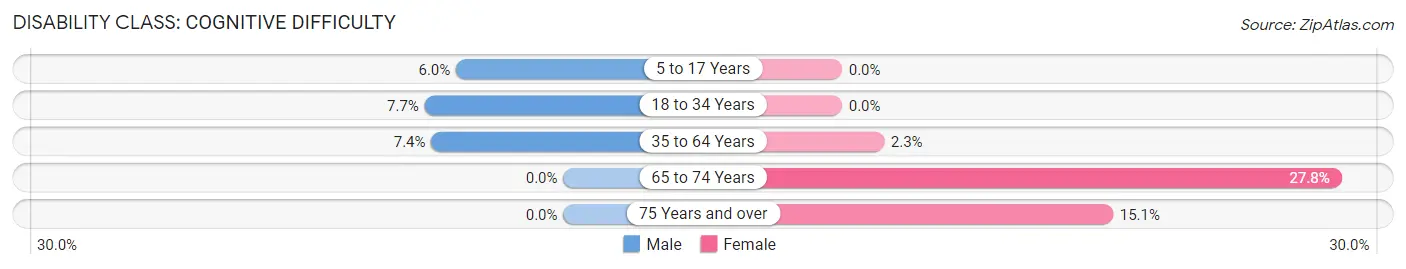
| Age Bracket | Male | Female |
| 5 to 17 Years | 8 (6.0%) | 0 (0.0%) |
| 18 to 34 Years | 21 (7.7%) | 0 (0.0%) |
| 35 to 64 Years | 25 (7.3%) | 10 (2.3%) |
| 65 to 74 Years | 0 (0.0%) | 32 (27.8%) |
| 75 Years and over | 0 (0.0%) | 8 (15.1%) |
Disability Class: Ambulatory Difficulty
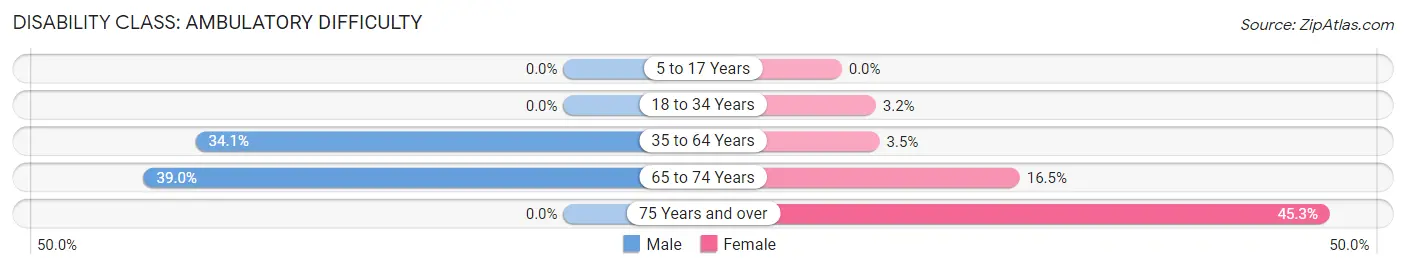
| Age Bracket | Male | Female |
| 5 to 17 Years | 0 (0.0%) | 0 (0.0%) |
| 18 to 34 Years | 0 (0.0%) | 6 (3.2%) |
| 35 to 64 Years | 116 (34.1%) | 15 (3.5%) |
| 65 to 74 Years | 37 (39.0%) | 19 (16.5%) |
| 75 Years and over | 0 (0.0%) | 24 (45.3%) |
Disability Class: Self-Care Difficulty
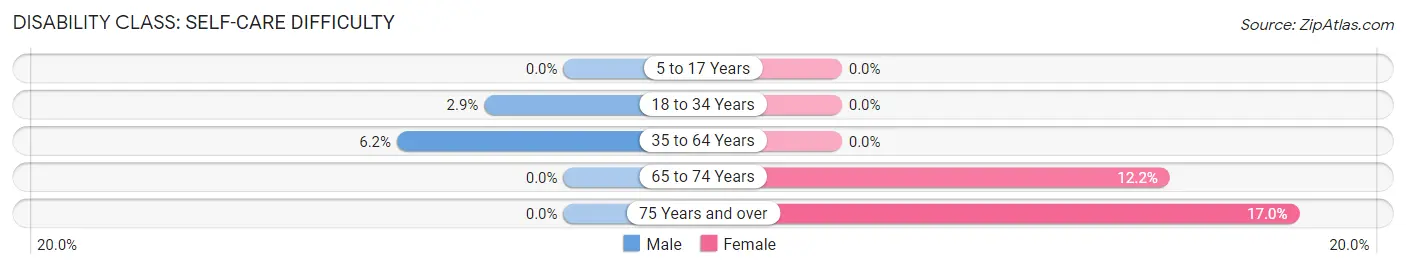
| Age Bracket | Male | Female |
| 5 to 17 Years | 0 (0.0%) | 0 (0.0%) |
| 18 to 34 Years | 8 (2.9%) | 0 (0.0%) |
| 35 to 64 Years | 21 (6.2%) | 0 (0.0%) |
| 65 to 74 Years | 0 (0.0%) | 14 (12.2%) |
| 75 Years and over | 0 (0.0%) | 9 (17.0%) |
Technology Access in Vinita Park
Computing Device Access in Vinita Park
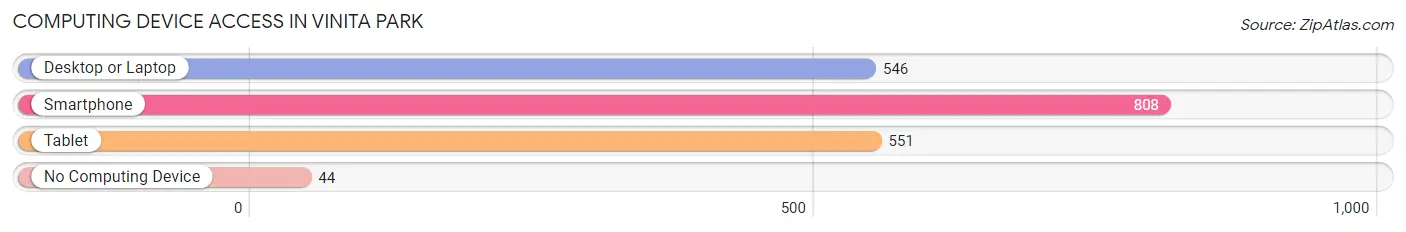
| Device Type | # Households | % Households |
| Desktop or Laptop | 546 | 61.8% |
| Smartphone | 808 | 91.4% |
| Tablet | 551 | 62.3% |
| No Computing Device | 44 | 5.0% |
| Total | 884 | 100.0% |
Internet Access in Vinita Park
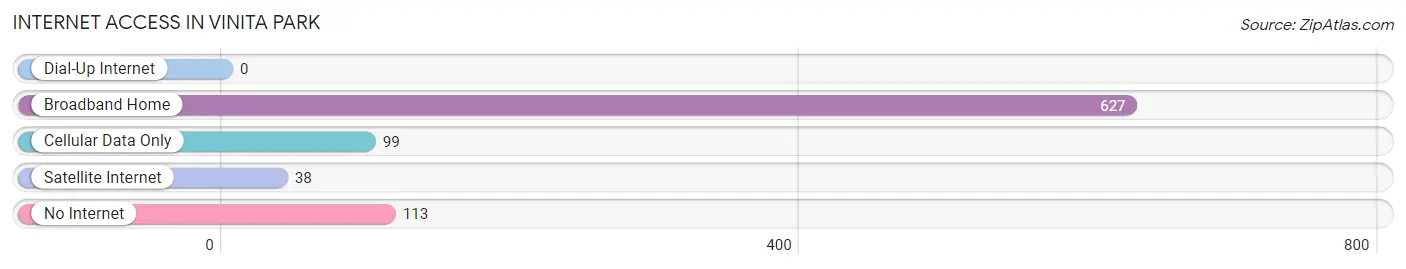
| Internet Type | # Households | % Households |
| Dial-Up Internet | 0 | 0.0% |
| Broadband Home | 627 | 70.9% |
| Cellular Data Only | 99 | 11.2% |
| Satellite Internet | 38 | 4.3% |
| No Internet | 113 | 12.8% |
| Total | 884 | 100.0% |
Vinita Park Summary
Vinita Park is a small city located in St. Louis County, Missouri. It is situated just east of the city of St. Louis and is part of the Greater St. Louis metropolitan area. The city has a population of approximately 4,000 people and covers an area of 1.2 square miles.
History
Vinita Park was founded in 1925 by the St. Louis Realty Company. The city was named after the daughter of the company’s president, Vinita Smith. The city was originally intended to be a residential suburb of St. Louis, and it was designed to be a “model city” with wide streets, sidewalks, and parks.
In the 1950s, the city began to experience a population boom as African Americans moved to the area from the city of St. Louis. This influx of new residents led to the development of a vibrant African American community in Vinita Park.
In the 1960s, the city experienced a period of decline as many of its residents moved away. However, in the 1970s, the city began to experience a resurgence as new businesses and residents moved into the area.
Geography
Vinita Park is located in St. Louis County, Missouri. It is situated just east of the city of St. Louis and is part of the Greater St. Louis metropolitan area. The city has a total area of 1.2 square miles, all of which is land.
The city is located in the Missouri River Valley, and it is bordered by the cities of St. Louis, Jennings, and Bellefontaine Neighbors. The city is located in a predominantly flat area, and it is situated at an elevation of approximately 500 feet above sea level.
Economy
Vinita Park has a diverse economy that is largely based on retail, manufacturing, and services. The city is home to a variety of businesses, including restaurants, grocery stores, and auto repair shops.
The city is also home to several large employers, including the St. Louis County government, the St. Louis Public Schools, and the St. Louis Community College.
Demographics
As of the 2010 census, the population of Vinita Park was 4,000. The racial makeup of the city was 79.3% African American, 15.2% White, 0.3% Native American, 0.7% Asian, and 4.5% from other races.
The median household income in Vinita Park was $37,917, and the median family income was $41,250. The per capita income in the city was $17,845. Approximately 22.3% of the population was below the poverty line.
Conclusion
Vinita Park is a small city located in St. Louis County, Missouri. It is situated just east of the city of St. Louis and is part of the Greater St. Louis metropolitan area. The city has a population of approximately 4,000 people and covers an area of 1.2 square miles. The city was founded in 1925 and has a diverse economy that is largely based on retail, manufacturing, and services. The city is predominantly African American, and the median household income is $37,917.
Common Questions
What is Per Capita Income in Vinita Park?
Per Capita income in Vinita Park is $31,618.
What is the Median Family Income in Vinita Park?
Median Family Income in Vinita Park is $58,750.
What is the Median Household income in Vinita Park?
Median Household Income in Vinita Park is $50,964.
What is Income or Wage Gap in Vinita Park?
Income or Wage Gap in Vinita Park is 29.2%.
Women in Vinita Park earn 70.8 cents for every dollar earned by a man.
What is Family Income Deficit in Vinita Park?
Family Income Deficit in Vinita Park is $8,749.
Families that are below poverty line in Vinita Park earn $8,749 less on average than the poverty threshold level.
What is Inequality or Gini Index in Vinita Park?
Inequality or Gini Index in Vinita Park is 0.39.
What is the Total Population of Vinita Park?
Total Population of Vinita Park is 1,857.
What is the Total Male Population of Vinita Park?
Total Male Population of Vinita Park is 925.
What is the Total Female Population of Vinita Park?
Total Female Population of Vinita Park is 932.
What is the Ratio of Males per 100 Females in Vinita Park?
There are 99.25 Males per 100 Females in Vinita Park.
What is the Ratio of Females per 100 Males in Vinita Park?
There are 100.76 Females per 100 Males in Vinita Park.
What is the Median Population Age in Vinita Park?
Median Population Age in Vinita Park is 40.8 Years.
What is the Average Family Size in Vinita Park
Average Family Size in Vinita Park is 3.0 People.
What is the Average Household Size in Vinita Park
Average Household Size in Vinita Park is 2.1 People.
How Large is the Labor Force in Vinita Park?
There are 1,135 People in the Labor Forcein in Vinita Park.
What is the Percentage of People in the Labor Force in Vinita Park?
74.5% of People are in the Labor Force in Vinita Park.
What is the Unemployment Rate in Vinita Park?
Unemployment Rate in Vinita Park is 9.9%.