Pasadena Park, MO Map & Demographics
Pasadena Park Map
Pasadena Park Overview
$41,763
PER CAPITA INCOME
$85,305
AVG HOUSEHOLD INCOME
9.7%
WAGE / INCOME GAP [ % ]
90.3¢/ $1
WAGE / INCOME GAP [ $ ]
0.29
INEQUALITY / GINI INDEX
731
TOTAL POPULATION
229
MALE POPULATION
502
FEMALE POPULATION
45.62
MALES / 100 FEMALES
219.21
FEMALES / 100 MALES
40.1
MEDIAN AGE
3.2
AVG FAMILY SIZE
2.1
AVG HOUSEHOLD SIZE
438
LABOR FORCE [ PEOPLE ]
72.6%
PERCENT IN LABOR FORCE
1.6%
UNEMPLOYMENT RATE
Income in Pasadena Park
Income Overview in Pasadena Park
| Characteristic | Number | Measure |
| Per Capita Income | 731 | $41,763 |
| Median Family Income | 105 | $0 |
| Mean Family Income | 105 | $100,592 |
| Median Household Income | 346 | $85,305 |
| Mean Household Income | 346 | $88,391 |
| Income Deficit | 105 | $0 |
| Wage / Income Gap (%) | 731 | 9.70% |
| Wage / Income Gap ($) | 731 | 90.30¢ per $1 |
| Gini / Inequality Index | 731 | 0.29 |
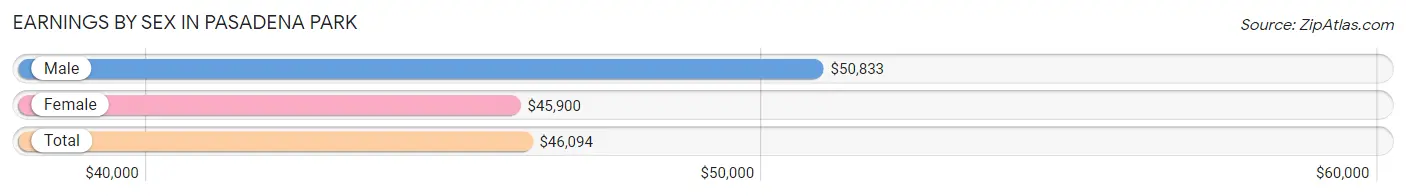
Earnings by Sex in Pasadena Park
Average Earnings in Pasadena Park are $46,094, $50,833 for men and $45,900 for women, a difference of 9.7%.
| Sex | Number | Average Earnings |
| Male | 146 (31.7%) | $50,833 |
| Female | 314 (68.3%) | $45,900 |
| Total | 460 (100.0%) | $46,094 |
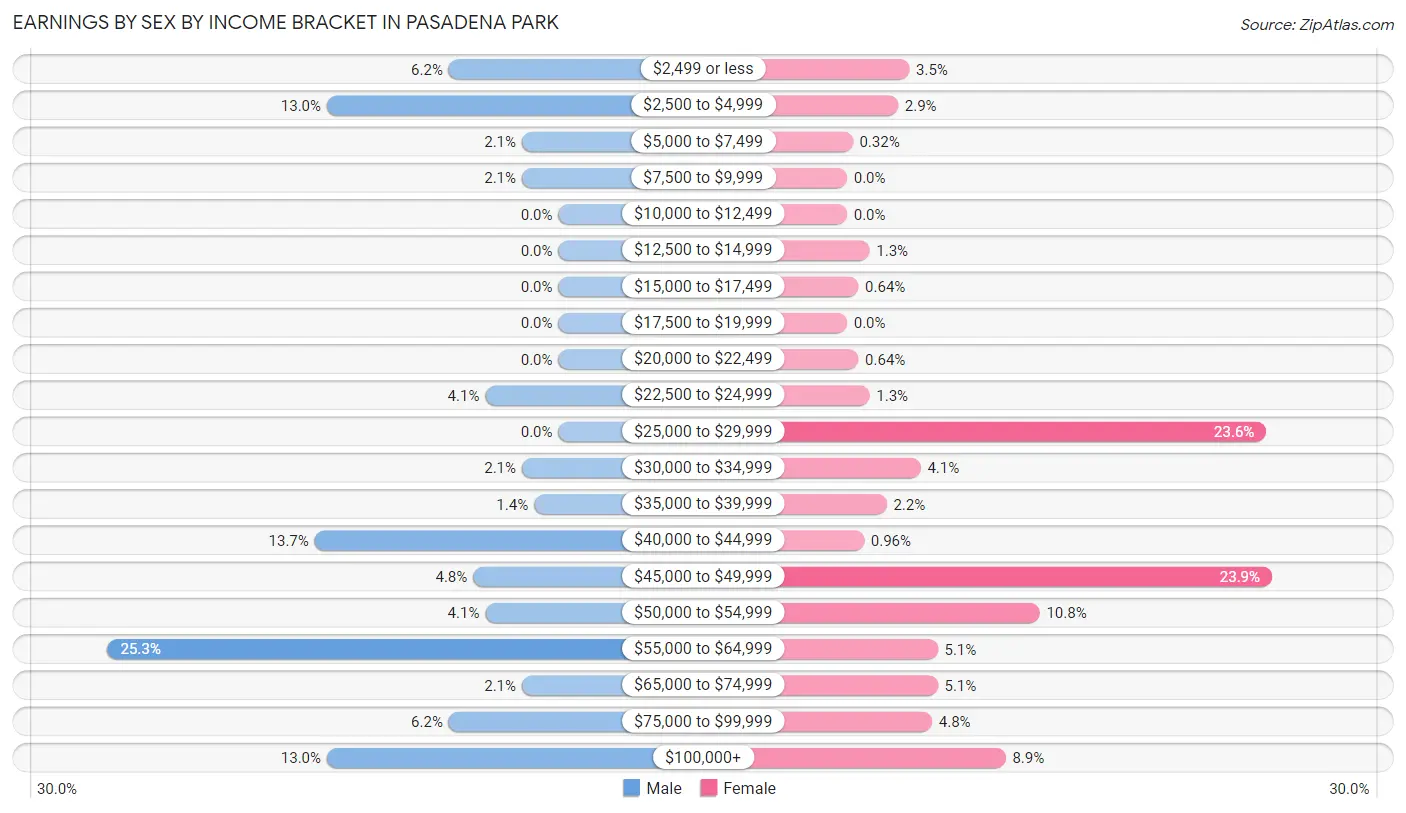
Earnings by Sex by Income Bracket in Pasadena Park
The most common earnings brackets in Pasadena Park are $55,000 to $64,999 for men (37 | 25.3%) and $45,000 to $49,999 for women (75 | 23.9%).
| Income | Male | Female |
| $2,499 or less | 9 (6.2%) | 11 (3.5%) |
| $2,500 to $4,999 | 19 (13.0%) | 9 (2.9%) |
| $5,000 to $7,499 | 3 (2.1%) | 1 (0.3%) |
| $7,500 to $9,999 | 3 (2.1%) | 0 (0.0%) |
| $10,000 to $12,499 | 0 (0.0%) | 0 (0.0%) |
| $12,500 to $14,999 | 0 (0.0%) | 4 (1.3%) |
| $15,000 to $17,499 | 0 (0.0%) | 2 (0.6%) |
| $17,500 to $19,999 | 0 (0.0%) | 0 (0.0%) |
| $20,000 to $22,499 | 0 (0.0%) | 2 (0.6%) |
| $22,500 to $24,999 | 6 (4.1%) | 4 (1.3%) |
| $25,000 to $29,999 | 0 (0.0%) | 74 (23.6%) |
| $30,000 to $34,999 | 3 (2.1%) | 13 (4.1%) |
| $35,000 to $39,999 | 2 (1.4%) | 7 (2.2%) |
| $40,000 to $44,999 | 20 (13.7%) | 3 (1.0%) |
| $45,000 to $49,999 | 7 (4.8%) | 75 (23.9%) |
| $50,000 to $54,999 | 6 (4.1%) | 34 (10.8%) |
| $55,000 to $64,999 | 37 (25.3%) | 16 (5.1%) |
| $65,000 to $74,999 | 3 (2.1%) | 16 (5.1%) |
| $75,000 to $99,999 | 9 (6.2%) | 15 (4.8%) |
| $100,000+ | 19 (13.0%) | 28 (8.9%) |
| Total | 146 (100.0%) | 314 (100.0%) |
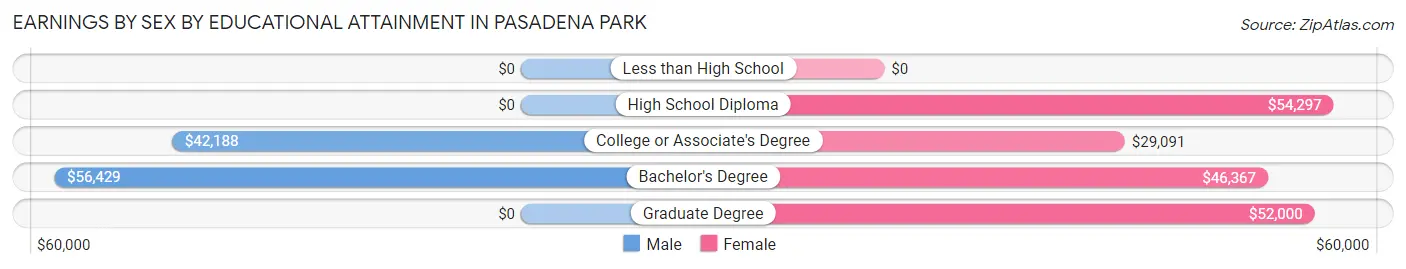
Earnings by Sex by Educational Attainment in Pasadena Park
Average earnings in Pasadena Park are $55,352 for men and $46,950 for women, a difference of 15.2%. Men with an educational attainment of bachelor's degree enjoy the highest average annual earnings of $56,429, while those with college or associate's degree education earn the least with $42,188. Women with an educational attainment of high school diploma earn the most with the average annual earnings of $54,297, while those with college or associate's degree education have the smallest earnings of $29,091.
| Educational Attainment | Male Income | Female Income |
| Less than High School | - | - |
| High School Diploma | - | - |
| College or Associate's Degree | $42,188 | $29,091 |
| Bachelor's Degree | $56,429 | $46,367 |
| Graduate Degree | - | - |
| Total | $55,352 | $46,950 |
Family Income in Pasadena Park
Family Income Brackets in Pasadena Park
According to the Pasadena Park family income data, there are 31 families falling into the $50,000 to $74,999 income range, which is the most common income bracket and makes up 29.5% of all families.
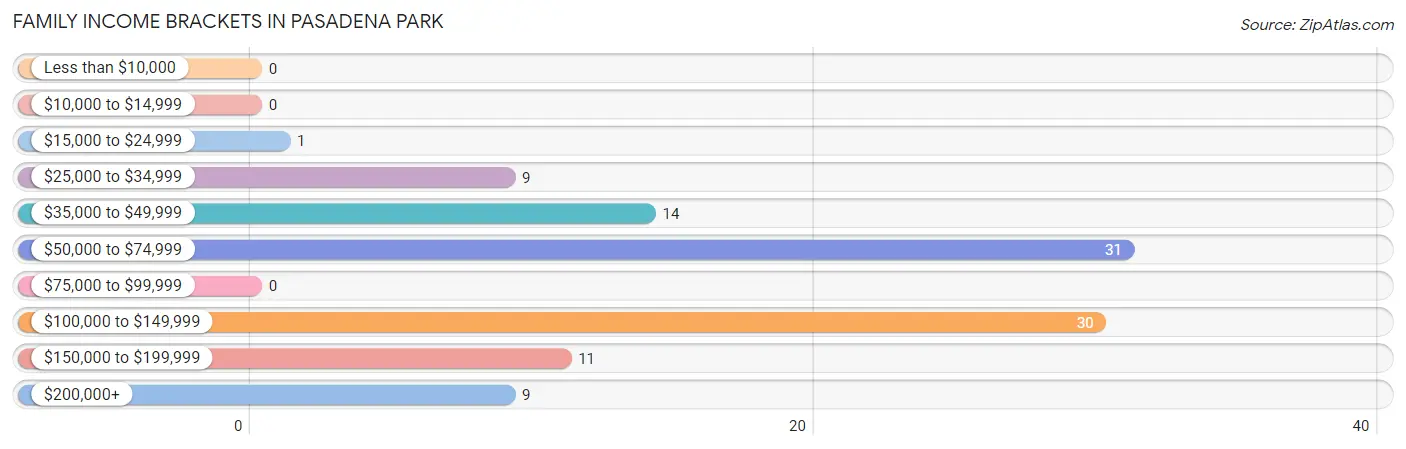
| Income Bracket | # Families | % Families |
| Less than $10,000 | 0 | 0.0% |
| $10,000 to $14,999 | 0 | 0.0% |
| $15,000 to $24,999 | 1 | 1.0% |
| $25,000 to $34,999 | 9 | 8.6% |
| $35,000 to $49,999 | 14 | 13.3% |
| $50,000 to $74,999 | 31 | 29.5% |
| $75,000 to $99,999 | 0 | 0.0% |
| $100,000 to $149,999 | 30 | 28.6% |
| $150,000 to $199,999 | 11 | 10.5% |
| $200,000+ | 9 | 8.6% |
Family Income by Famaliy Size in Pasadena Park
5-person families (31 | 29.5%) account for the highest median family income in Pasadena Park with $110,221 per family, while 5-person families (31 | 29.5%) have the highest median income of $22,044 per family member.
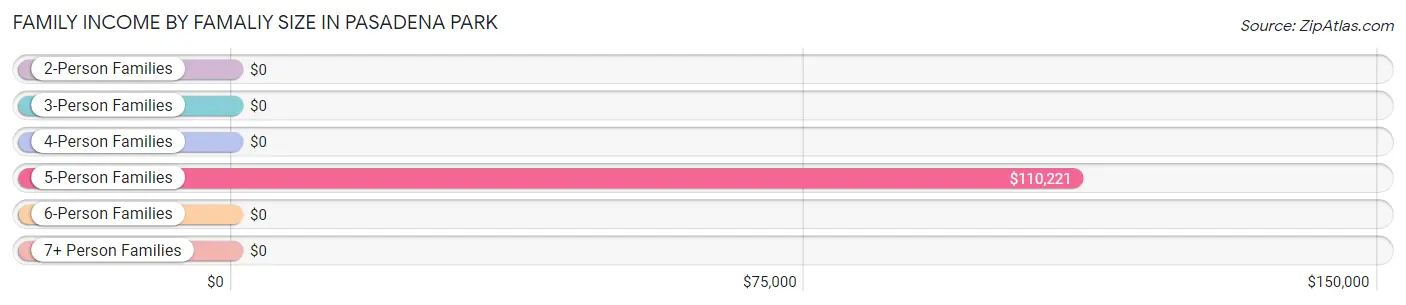
| Income Bracket | # Families | Median Income |
| 2-Person Families | 31 (29.5%) | $0 |
| 3-Person Families | 32 (30.5%) | $0 |
| 4-Person Families | 11 (10.5%) | $0 |
| 5-Person Families | 31 (29.5%) | $110,221 |
| 6-Person Families | 0 (0.0%) | $0 |
| 7+ Person Families | 0 (0.0%) | $0 |
| Total | 105 (100.0%) | $0 |
Family Income by Number of Earners in Pasadena Park
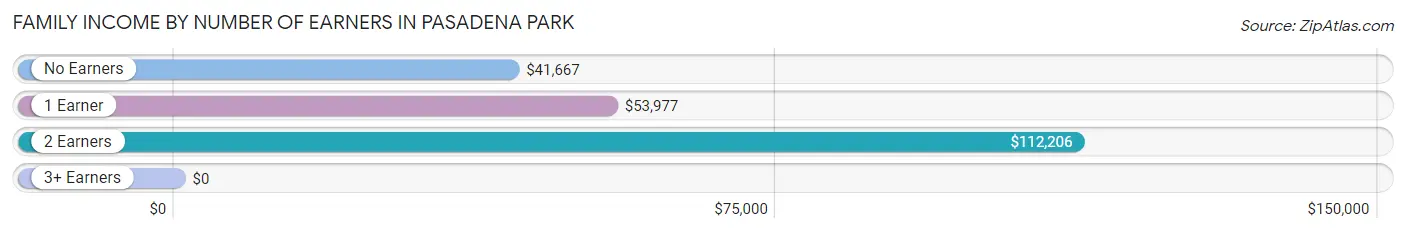
| Number of Earners | # Families | Median Income |
| No Earners | 10 (9.5%) | $41,667 |
| 1 Earner | 41 (39.1%) | $53,977 |
| 2 Earners | 40 (38.1%) | $112,206 |
| 3+ Earners | 14 (13.3%) | $0 |
| Total | 105 (100.0%) | $0 |
Household Income in Pasadena Park
Household Income Brackets in Pasadena Park
With 112 households falling in the category, the $75,000 to $99,999 income range is the most frequent in Pasadena Park, accounting for 32.4% of all households. In contrast, only 1 households (0.3%) fall into the $10,000 to $14,999 income bracket, making it the least populous group.
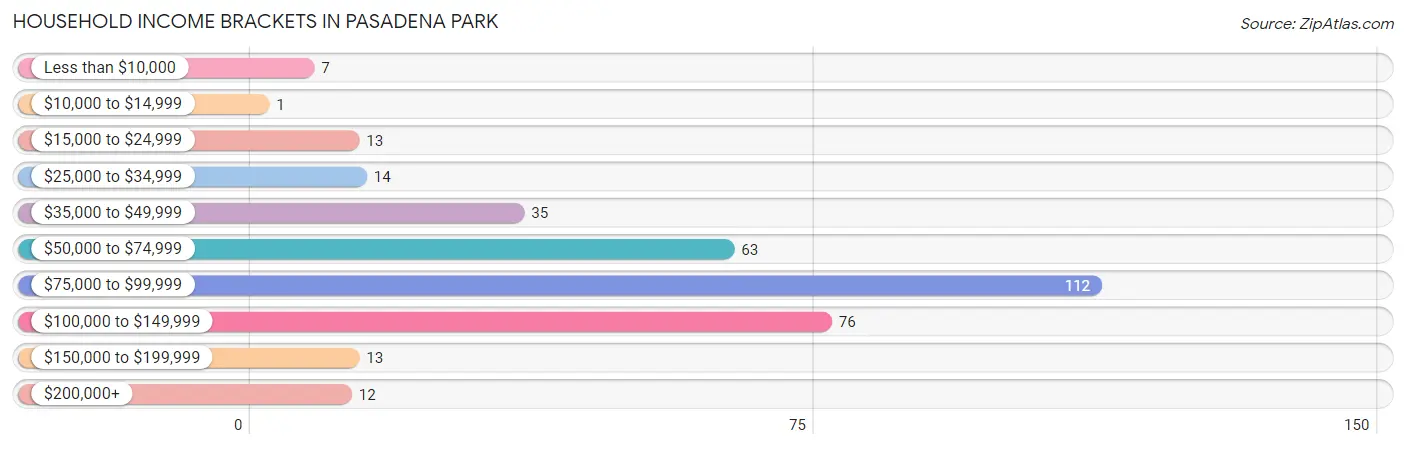
| Income Bracket | # Households | % Households |
| Less than $10,000 | 7 | 2.0% |
| $10,000 to $14,999 | 1 | 0.3% |
| $15,000 to $24,999 | 13 | 3.8% |
| $25,000 to $34,999 | 14 | 4.0% |
| $35,000 to $49,999 | 35 | 10.1% |
| $50,000 to $74,999 | 63 | 18.2% |
| $75,000 to $99,999 | 112 | 32.4% |
| $100,000 to $149,999 | 76 | 22.0% |
| $150,000 to $199,999 | 13 | 3.8% |
| $200,000+ | 12 | 3.5% |
Household Income by Householder Age in Pasadena Park
The median household income in Pasadena Park is $85,305, with the highest median household income of $86,296 found in the 45 to 64 years age bracket for the primary householder. A total of 199 households (57.5%) fall into this category. Meanwhile, the 15 to 24 years age bracket for the primary householder has the lowest median household income of $0, with 9 households (2.6%) in this group.
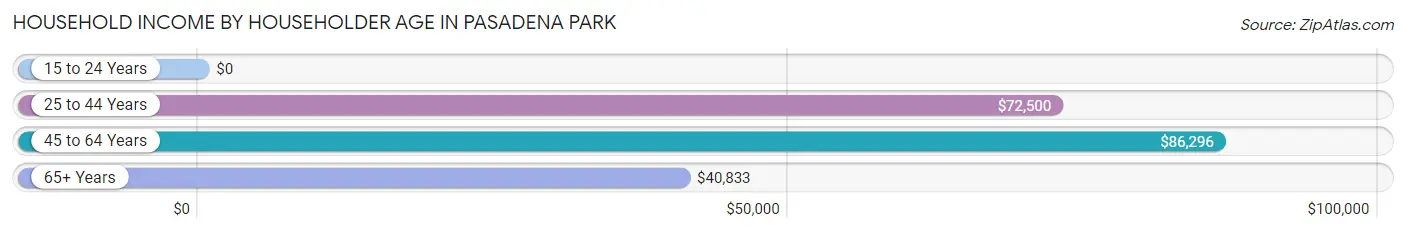
| Income Bracket | # Households | Median Income |
| 15 to 24 Years | 9 (2.6%) | $0 |
| 25 to 44 Years | 66 (19.1%) | $72,500 |
| 45 to 64 Years | 199 (57.5%) | $86,296 |
| 65+ Years | 72 (20.8%) | $40,833 |
| Total | 346 (100.0%) | $85,305 |
Poverty in Pasadena Park
Income Below Poverty by Sex and Age in Pasadena Park
With 3.9% poverty level for males and 13.0% for females among the residents of Pasadena Park, 55 to 64 year old males and 18 to 24 year old females are the most vulnerable to poverty, with 7 males (23.3%) and 59 females (50.4%) in their respective age groups living below the poverty level.
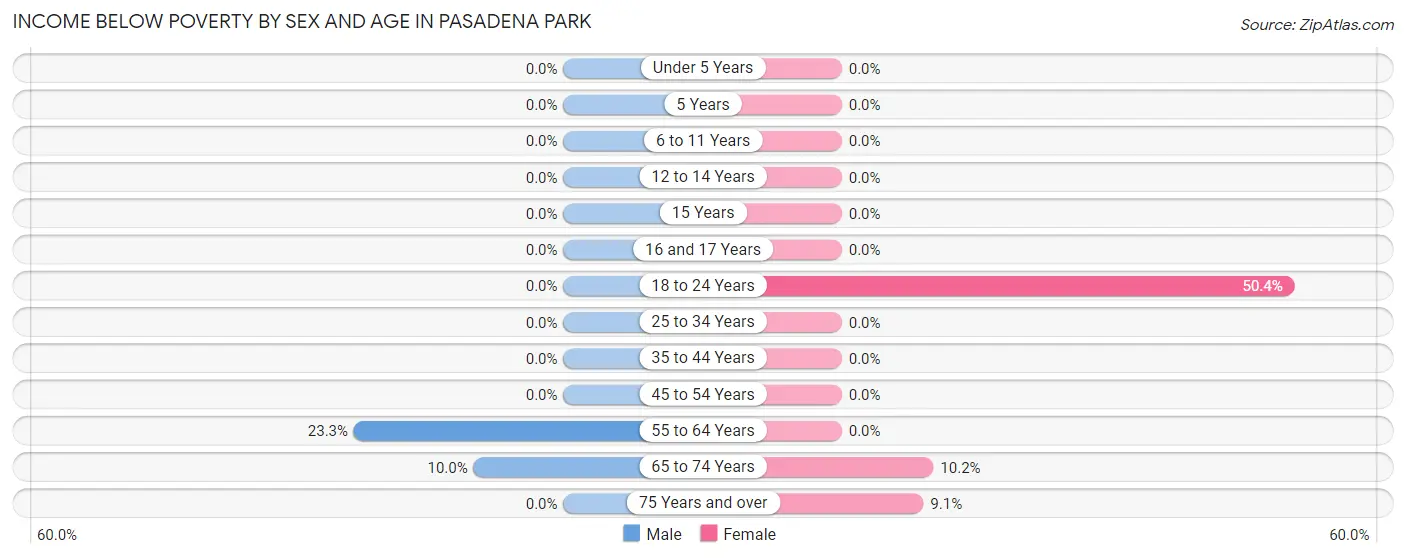
| Age Bracket | Male | Female |
| Under 5 Years | 0 (0.0%) | 0 (0.0%) |
| 5 Years | 0 (0.0%) | 0 (0.0%) |
| 6 to 11 Years | 0 (0.0%) | 0 (0.0%) |
| 12 to 14 Years | 0 (0.0%) | 0 (0.0%) |
| 15 Years | 0 (0.0%) | 0 (0.0%) |
| 16 and 17 Years | 0 (0.0%) | 0 (0.0%) |
| 18 to 24 Years | 0 (0.0%) | 59 (50.4%) |
| 25 to 34 Years | 0 (0.0%) | 0 (0.0%) |
| 35 to 44 Years | 0 (0.0%) | 0 (0.0%) |
| 45 to 54 Years | 0 (0.0%) | 0 (0.0%) |
| 55 to 64 Years | 7 (23.3%) | 0 (0.0%) |
| 65 to 74 Years | 2 (10.0%) | 5 (10.2%) |
| 75 Years and over | 0 (0.0%) | 1 (9.1%) |
| Total | 9 (3.9%) | 65 (13.0%) |
Income Above Poverty by Sex and Age in Pasadena Park
According to the poverty statistics in Pasadena Park, males aged under 5 years and females aged under 5 years are the age groups that are most secure financially, with 100.0% of males and 100.0% of females in these age groups living above the poverty line.
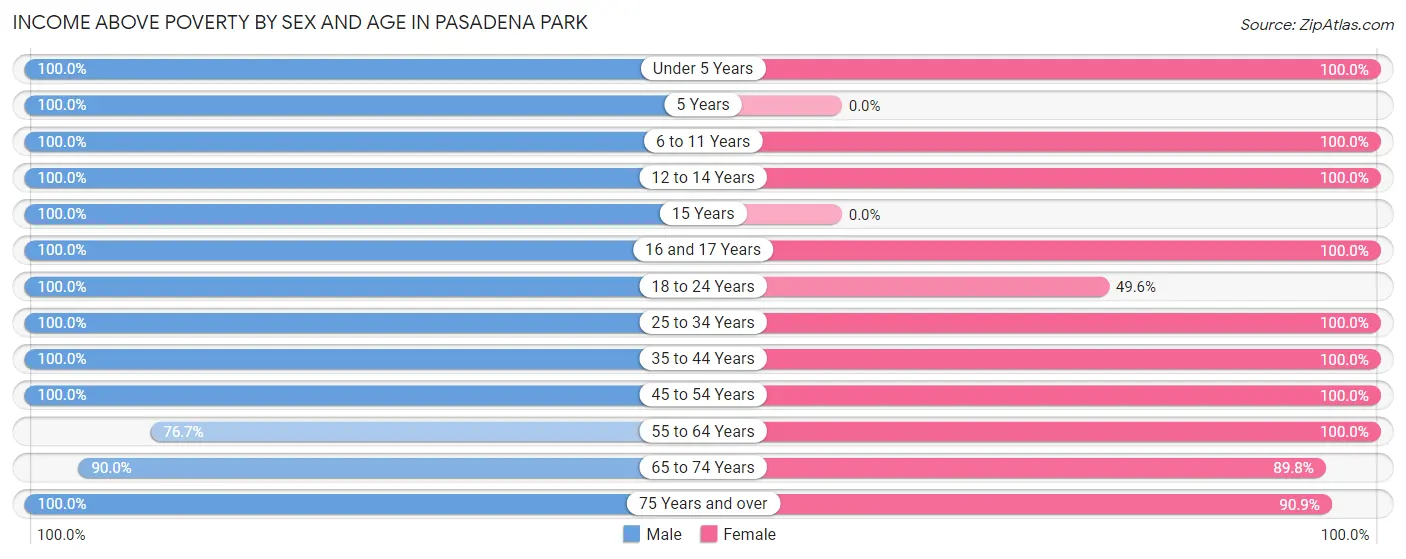
| Age Bracket | Male | Female |
| Under 5 Years | 9 (100.0%) | 20 (100.0%) |
| 5 Years | 13 (100.0%) | 0 (0.0%) |
| 6 to 11 Years | 23 (100.0%) | 28 (100.0%) |
| 12 to 14 Years | 4 (100.0%) | 25 (100.0%) |
| 15 Years | 6 (100.0%) | 0 (0.0%) |
| 16 and 17 Years | 2 (100.0%) | 5 (100.0%) |
| 18 to 24 Years | 19 (100.0%) | 58 (49.6%) |
| 25 to 34 Years | 20 (100.0%) | 28 (100.0%) |
| 35 to 44 Years | 29 (100.0%) | 36 (100.0%) |
| 45 to 54 Years | 51 (100.0%) | 62 (100.0%) |
| 55 to 64 Years | 23 (76.7%) | 121 (100.0%) |
| 65 to 74 Years | 18 (90.0%) | 44 (89.8%) |
| 75 Years and over | 3 (100.0%) | 10 (90.9%) |
| Total | 220 (96.1%) | 437 (87.1%) |
Income Below Poverty Among Married-Couple Families in Pasadena Park
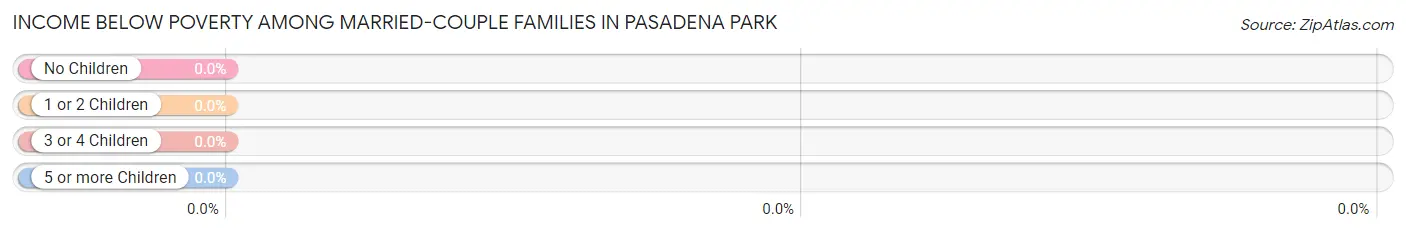
| Children | Above Poverty | Below Poverty |
| No Children | 24 (100.0%) | 0 (0.0%) |
| 1 or 2 Children | 13 (100.0%) | 0 (0.0%) |
| 3 or 4 Children | 17 (100.0%) | 0 (0.0%) |
| 5 or more Children | 0 (0.0%) | 0 (0.0%) |
| Total | 54 (100.0%) | 0 (0.0%) |
Income Below Poverty Among Single-Parent Households in Pasadena Park
| Children | Single Father | Single Mother |
| No Children | 0 (0.0%) | 0 (0.0%) |
| 1 or 2 Children | 0 (0.0%) | 0 (0.0%) |
| 3 or 4 Children | 0 (0.0%) | 0 (0.0%) |
| 5 or more Children | 0 (0.0%) | 0 (0.0%) |
| Total | 0 (0.0%) | 0 (0.0%) |
Income Below Poverty Among Married-Couple vs Single-Parent Households in Pasadena Park
| Children | Married-Couple Families | Single-Parent Households |
| No Children | 0 (0.0%) | 0 (0.0%) |
| 1 or 2 Children | 0 (0.0%) | 0 (0.0%) |
| 3 or 4 Children | 0 (0.0%) | 0 (0.0%) |
| 5 or more Children | 0 (0.0%) | 0 (0.0%) |
| Total | 0 (0.0%) | 0 (0.0%) |
Race in Pasadena Park
The most populous races in Pasadena Park are Black / African American (599 | 81.9%), White / Caucasian (115 | 15.7%), and Asian (10 | 1.4%).
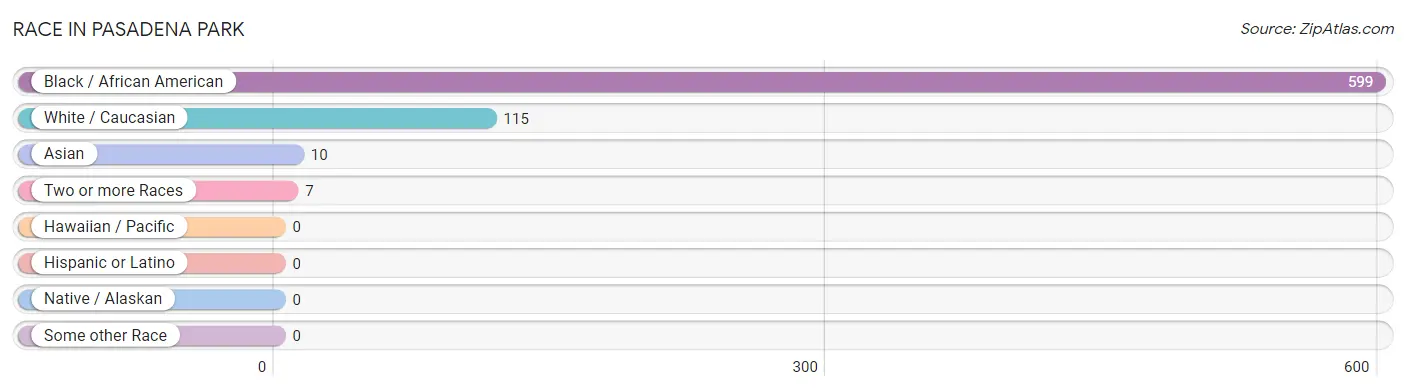
| Race | # Population | % Population |
| Asian | 10 | 1.4% |
| Black / African American | 599 | 81.9% |
| Hawaiian / Pacific | 0 | 0.0% |
| Hispanic or Latino | 0 | 0.0% |
| Native / Alaskan | 0 | 0.0% |
| White / Caucasian | 115 | 15.7% |
| Two or more Races | 7 | 1.0% |
| Some other Race | 0 | 0.0% |
| Total | 731 | 100.0% |
Ancestry in Pasadena Park
The most populous ancestries reported in Pasadena Park are German (82 | 11.2%), Irish (30 | 4.1%), Subsaharan African (20 | 2.7%), American (19 | 2.6%), and African (15 | 2.1%), together accounting for 22.7% of all Pasadena Park residents.
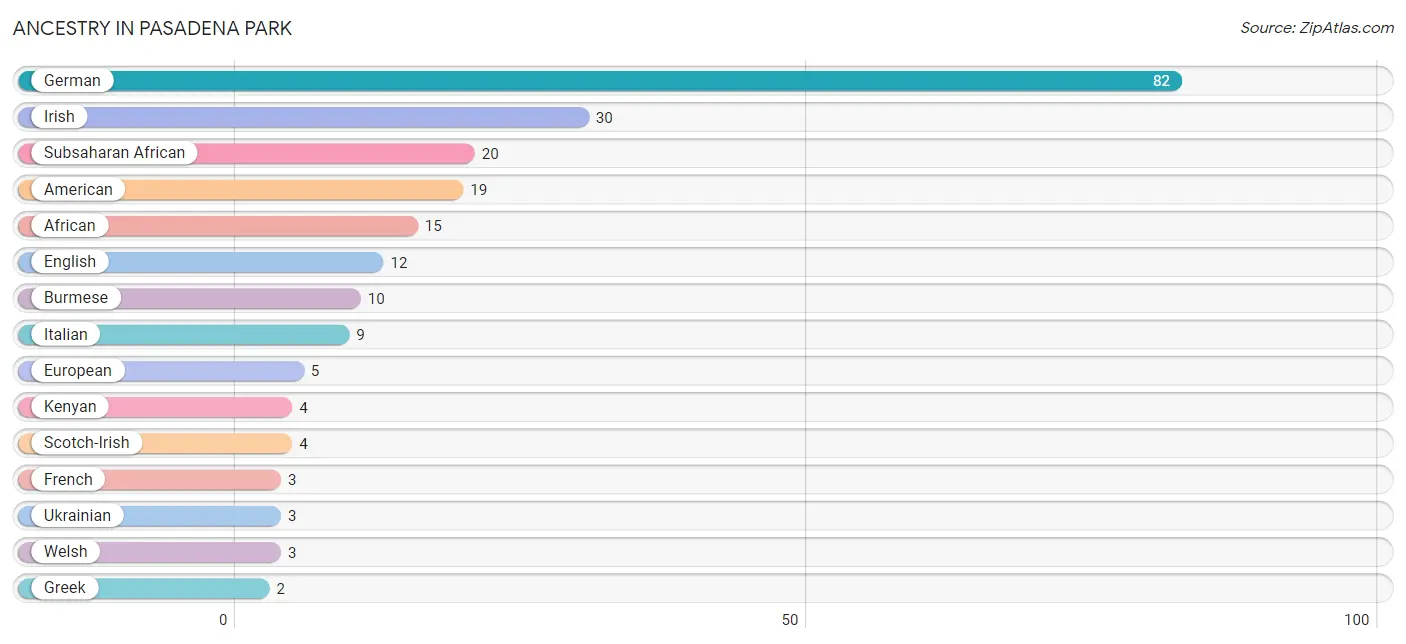
| Ancestry | # Population | % Population |
| African | 15 | 2.1% |
| American | 19 | 2.6% |
| Burmese | 10 | 1.4% |
| English | 12 | 1.6% |
| European | 5 | 0.7% |
| French | 3 | 0.4% |
| German | 82 | 11.2% |
| Ghanaian | 1 | 0.1% |
| Greek | 2 | 0.3% |
| Irish | 30 | 4.1% |
| Italian | 9 | 1.2% |
| Kenyan | 4 | 0.5% |
| Scotch-Irish | 4 | 0.5% |
| Subsaharan African | 20 | 2.7% |
| Swiss | 2 | 0.3% |
| Ukrainian | 3 | 0.4% |
| Welsh | 3 | 0.4% | View All 17 Rows |
Immigrants in Pasadena Park
The most numerous immigrant groups reported in Pasadena Park came from Africa (9 | 1.2%), Liberia (5 | 0.7%), Western Africa (5 | 0.7%), Eastern Africa (4 | 0.5%), and Kenya (4 | 0.5%), together accounting for 3.7% of all Pasadena Park residents.
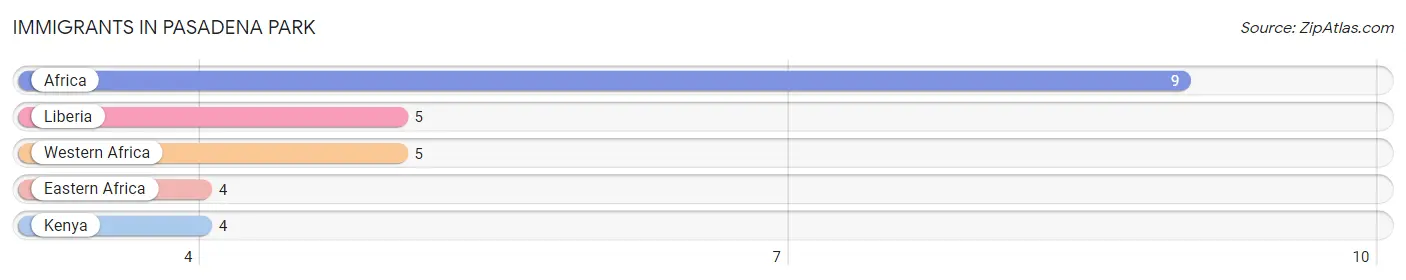
| Immigration Origin | # Population | % Population |
| Africa | 9 | 1.2% |
| Eastern Africa | 4 | 0.5% |
| Kenya | 4 | 0.5% |
| Liberia | 5 | 0.7% |
| Western Africa | 5 | 0.7% | View All 5 Rows |
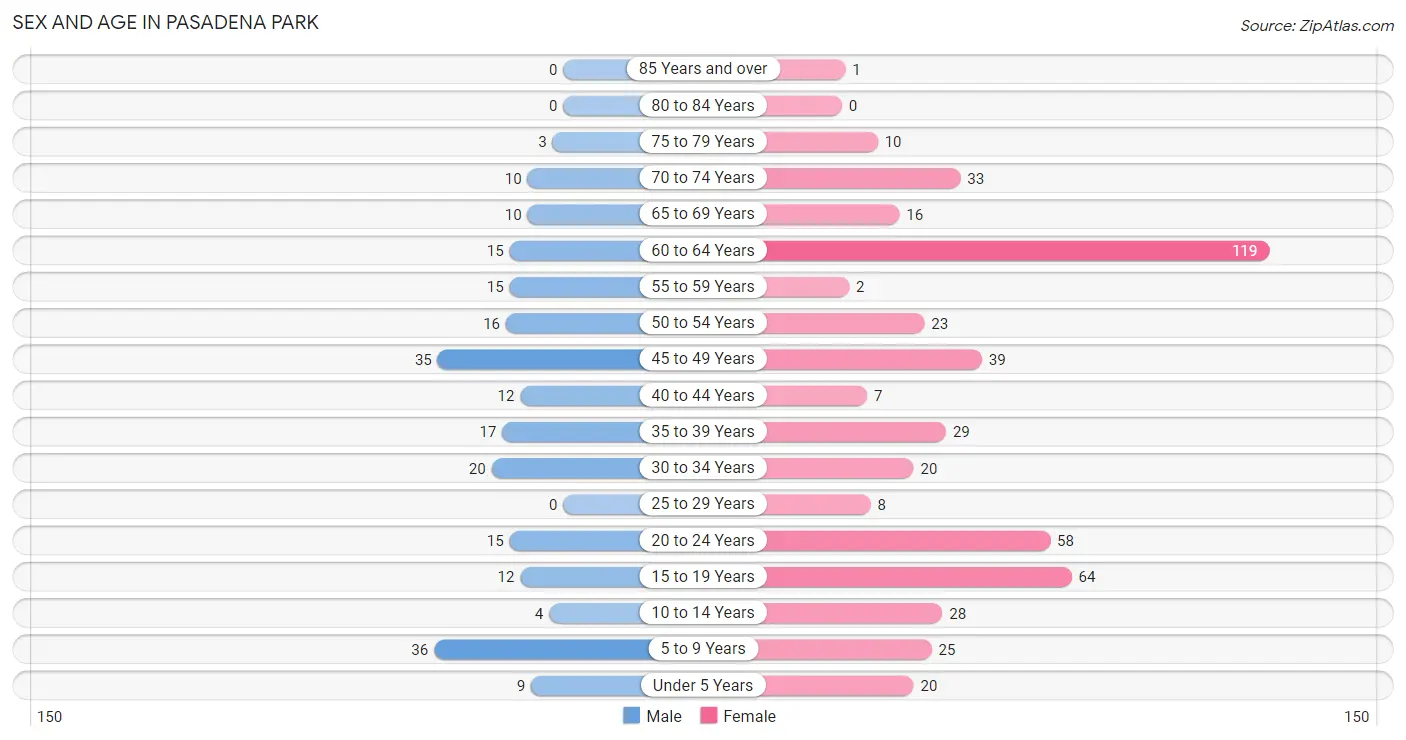
Sex and Age in Pasadena Park
Sex and Age in Pasadena Park
The most populous age groups in Pasadena Park are 5 to 9 Years (36 | 15.7%) for men and 60 to 64 Years (119 | 23.7%) for women.
| Age Bracket | Male | Female |
| Under 5 Years | 9 (3.9%) | 20 (4.0%) |
| 5 to 9 Years | 36 (15.7%) | 25 (5.0%) |
| 10 to 14 Years | 4 (1.8%) | 28 (5.6%) |
| 15 to 19 Years | 12 (5.2%) | 64 (12.8%) |
| 20 to 24 Years | 15 (6.6%) | 58 (11.6%) |
| 25 to 29 Years | 0 (0.0%) | 8 (1.6%) |
| 30 to 34 Years | 20 (8.7%) | 20 (4.0%) |
| 35 to 39 Years | 17 (7.4%) | 29 (5.8%) |
| 40 to 44 Years | 12 (5.2%) | 7 (1.4%) |
| 45 to 49 Years | 35 (15.3%) | 39 (7.8%) |
| 50 to 54 Years | 16 (7.0%) | 23 (4.6%) |
| 55 to 59 Years | 15 (6.6%) | 2 (0.4%) |
| 60 to 64 Years | 15 (6.6%) | 119 (23.7%) |
| 65 to 69 Years | 10 (4.4%) | 16 (3.2%) |
| 70 to 74 Years | 10 (4.4%) | 33 (6.6%) |
| 75 to 79 Years | 3 (1.3%) | 10 (2.0%) |
| 80 to 84 Years | 0 (0.0%) | 0 (0.0%) |
| 85 Years and over | 0 (0.0%) | 1 (0.2%) |
| Total | 229 (100.0%) | 502 (100.0%) |
Families and Households in Pasadena Park
Median Family Size in Pasadena Park
The median family size in Pasadena Park is 3.22 persons per family, with single female/mother families (42 | 40.0%) accounting for the largest median family size of 3.29 persons per family. On the other hand, single male/father families (9 | 8.6%) represent the smallest median family size with 2.56 persons per family.
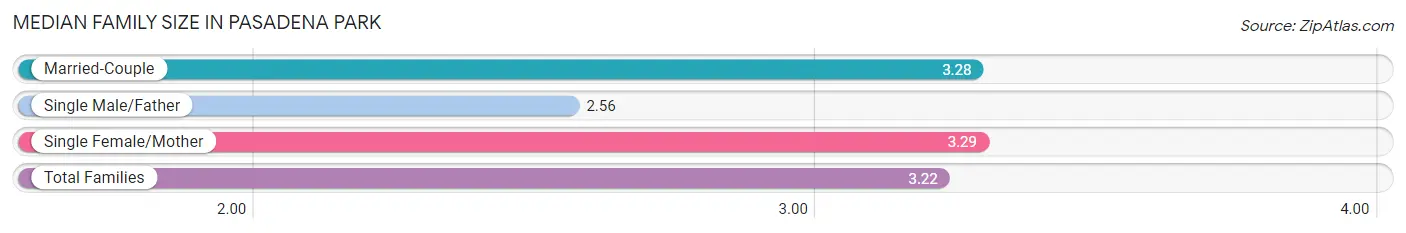
| Family Type | # Families | Family Size |
| Married-Couple | 54 (51.4%) | 3.28 |
| Single Male/Father | 9 (8.6%) | 2.56 |
| Single Female/Mother | 42 (40.0%) | 3.29 |
| Total Families | 105 (100.0%) | 3.22 |
Median Household Size in Pasadena Park
The median household size in Pasadena Park is 2.11 persons per household, with single female/mother households (42 | 12.1%) accounting for the largest median household size of 3.38 persons per household. non-family households (241 | 69.7%) represent the smallest median household size with 1.61 persons per household.
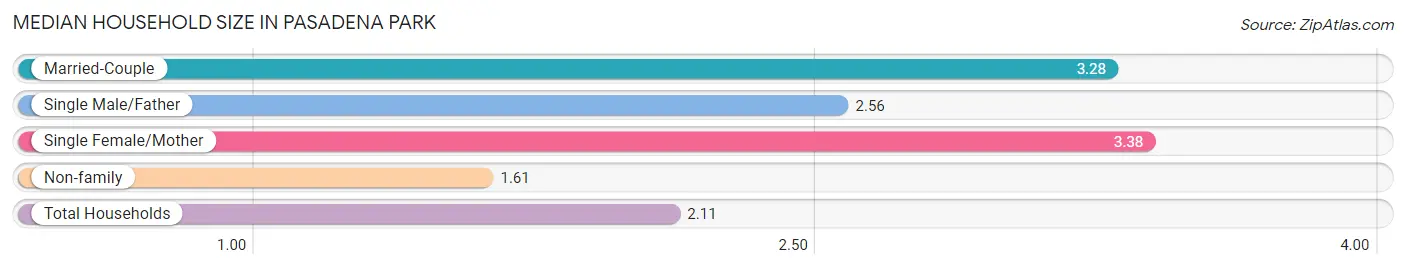
| Household Type | # Households | Household Size |
| Married-Couple | 54 (15.6%) | 3.28 |
| Single Male/Father | 9 (2.6%) | 2.56 |
| Single Female/Mother | 42 (12.1%) | 3.38 |
| Non-family | 241 (69.7%) | 1.61 |
| Total Households | 346 (100.0%) | 2.11 |
Household Size by Marriage Status in Pasadena Park
Out of a total of 346 households in Pasadena Park, 105 (30.3%) are family households, while 241 (69.7%) are nonfamily households. The most numerous type of family households are 2-person households, comprising 31, and the most common type of nonfamily households are 1-person households, comprising 201.
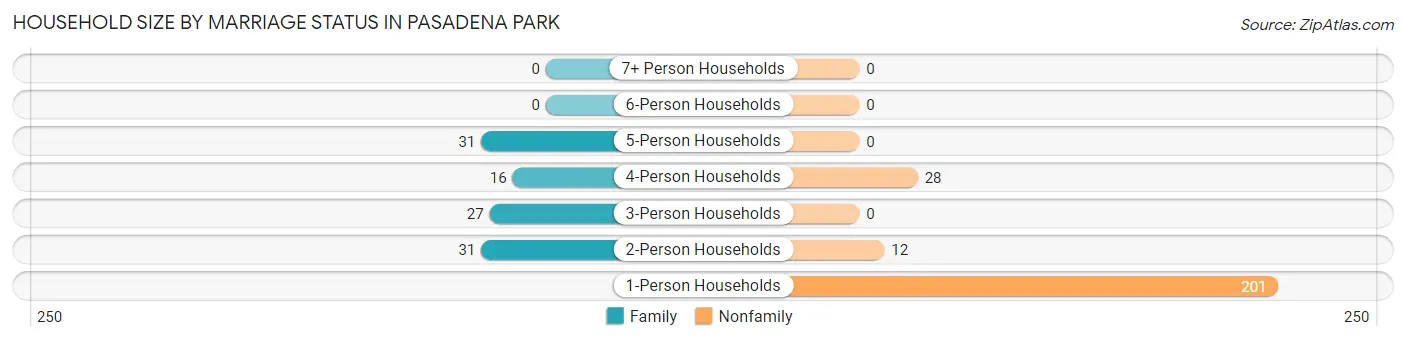
| Household Size | Family Households | Nonfamily Households |
| 1-Person Households | - | 201 (58.1%) |
| 2-Person Households | 31 (9.0%) | 12 (3.5%) |
| 3-Person Households | 27 (7.8%) | 0 (0.0%) |
| 4-Person Households | 16 (4.6%) | 28 (8.1%) |
| 5-Person Households | 31 (9.0%) | 0 (0.0%) |
| 6-Person Households | 0 (0.0%) | 0 (0.0%) |
| 7+ Person Households | 0 (0.0%) | 0 (0.0%) |
| Total | 105 (30.3%) | 241 (69.7%) |
Female Fertility in Pasadena Park
Fertility by Age in Pasadena Park
Average fertility rate in Pasadena Park is 13.0 births per 1,000 women. Women in the age bracket of 35 to 50 years have the highest fertility rate with 40.0 births per 1,000 women. Women in the age bracket of 35 to 50 years acount for 100.0% of all women with births.
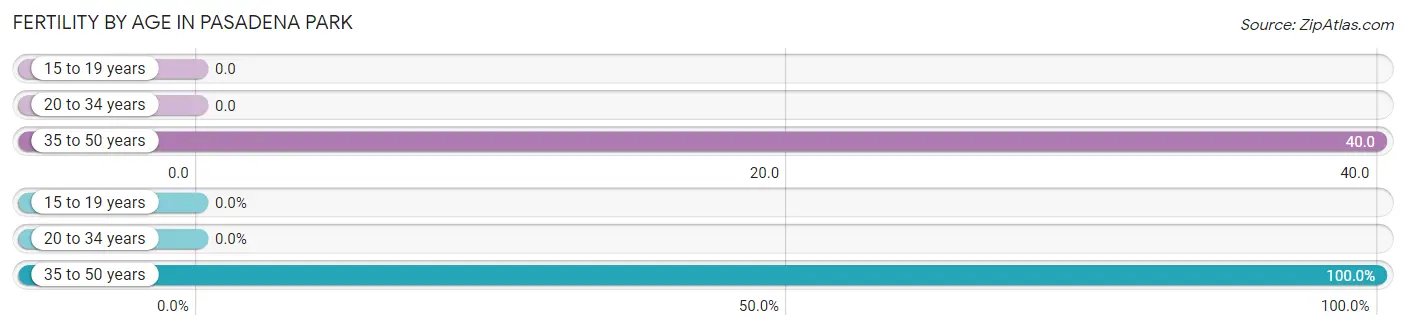
| Age Bracket | Women with Births | Births / 1,000 Women |
| 15 to 19 years | 0 (0.0%) | 0.0 |
| 20 to 34 years | 0 (0.0%) | 0.0 |
| 35 to 50 years | 3 (100.0%) | 40.0 |
| Total | 3 (100.0%) | 13.0 |
Fertility by Age by Marriage Status in Pasadena Park
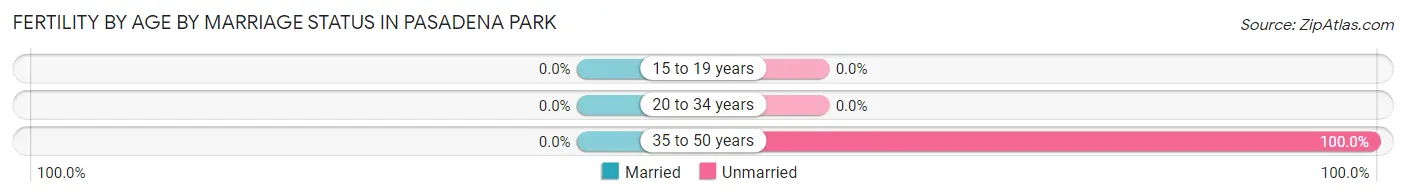
| Age Bracket | Married | Unmarried |
| 15 to 19 years | 0 (0.0%) | 0 (0.0%) |
| 20 to 34 years | 0 (0.0%) | 0 (0.0%) |
| 35 to 50 years | 0 (0.0%) | 3 (100.0%) |
| Total | 0 (0.0%) | 3 (100.0%) |
Fertility by Education in Pasadena Park
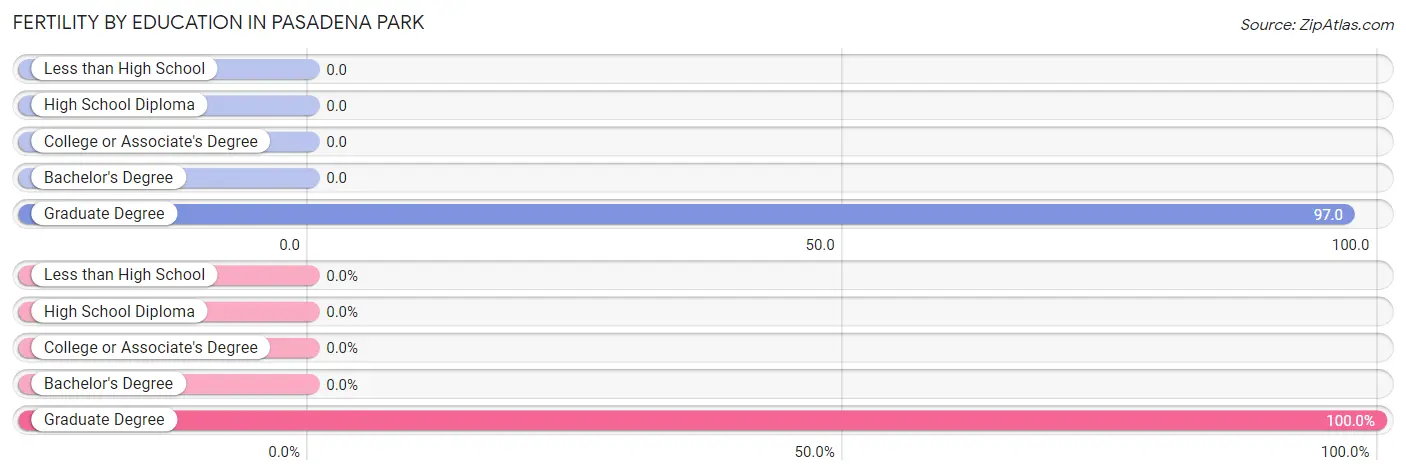
| Educational Attainment | Women with Births | Births / 1,000 Women |
| Less than High School | 0 (0.0%) | 0.0 |
| High School Diploma | 0 (0.0%) | 0.0 |
| College or Associate's Degree | 0 (0.0%) | 0.0 |
| Bachelor's Degree | 0 (0.0%) | 0.0 |
| Graduate Degree | 3 (100.0%) | 97.0 |
| Total | 3 (100.0%) | 13.0 |
Fertility by Education by Marriage Status in Pasadena Park
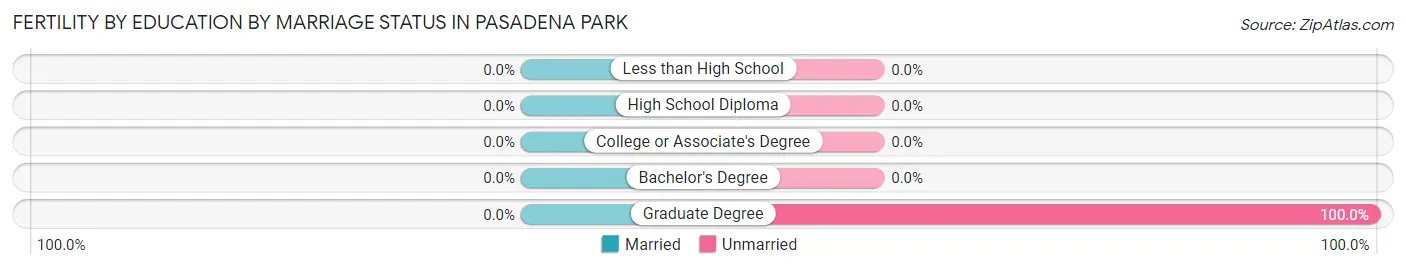
| Educational Attainment | Married | Unmarried |
| Less than High School | 0 (0.0%) | 0 (0.0%) |
| High School Diploma | 0 (0.0%) | 0 (0.0%) |
| College or Associate's Degree | 0 (0.0%) | 0 (0.0%) |
| Bachelor's Degree | 0 (0.0%) | 0 (0.0%) |
| Graduate Degree | 0 (0.0%) | 3 (100.0%) |
| Total | 0 (0.0%) | 3 (100.0%) |
Employment Characteristics in Pasadena Park
Employment by Class of Employer in Pasadena Park
Among the 431 employed individuals in Pasadena Park, private company employees (269 | 62.4%), local government employees (106 | 24.6%), and not-for-profit organizations (26 | 6.0%) make up the most common classes of employment.
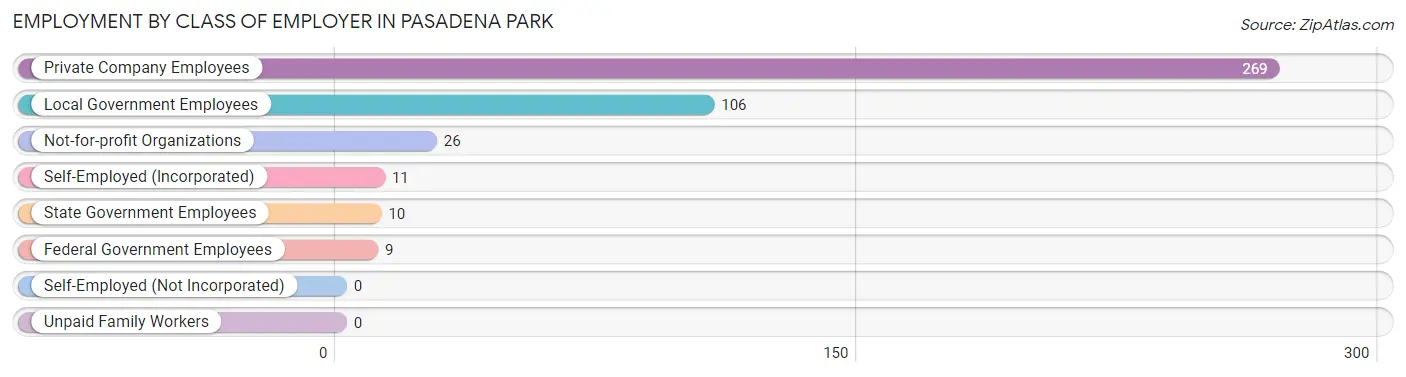
| Employer Class | # Employees | % Employees |
| Private Company Employees | 269 | 62.4% |
| Self-Employed (Incorporated) | 11 | 2.5% |
| Self-Employed (Not Incorporated) | 0 | 0.0% |
| Not-for-profit Organizations | 26 | 6.0% |
| Local Government Employees | 106 | 24.6% |
| State Government Employees | 10 | 2.3% |
| Federal Government Employees | 9 | 2.1% |
| Unpaid Family Workers | 0 | 0.0% |
| Total | 431 | 100.0% |
Employment Status by Age in Pasadena Park
According to the labor force statistics for Pasadena Park, out of the total population over 16 years of age (603), 72.6% or 438 individuals are in the labor force, with 1.6% or 7 of them unemployed. The age group with the highest labor force participation rate is 20 to 24 years, with 100.0% or 73 individuals in the labor force. Within the labor force, the 16 to 19 years age range has the highest percentage of unemployed individuals, with 18.2% or 2 of them being unemployed.
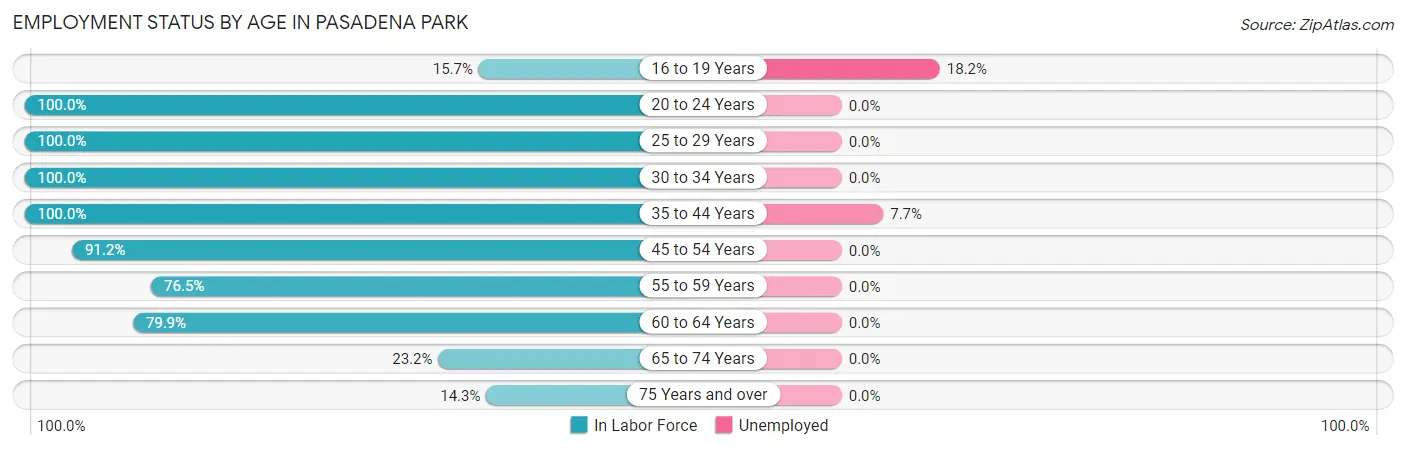
| Age Bracket | In Labor Force | Unemployed |
| 16 to 19 Years | 11 (15.7%) | 2 (18.2%) |
| 20 to 24 Years | 73 (100.0%) | 0 (0.0%) |
| 25 to 29 Years | 8 (100.0%) | 0 (0.0%) |
| 30 to 34 Years | 40 (100.0%) | 0 (0.0%) |
| 35 to 44 Years | 65 (100.0%) | 5 (7.7%) |
| 45 to 54 Years | 103 (91.2%) | 0 (0.0%) |
| 55 to 59 Years | 13 (76.5%) | 0 (0.0%) |
| 60 to 64 Years | 107 (79.9%) | 0 (0.0%) |
| 65 to 74 Years | 16 (23.2%) | 0 (0.0%) |
| 75 Years and over | 2 (14.3%) | 0 (0.0%) |
| Total | 438 (72.6%) | 7 (1.6%) |
Employment Status by Educational Attainment in Pasadena Park
According to labor force statistics for Pasadena Park, 89.1% of individuals (336) out of the total population between 25 and 64 years of age (377) are in the labor force, with 1.5% or 5 of them being unemployed. The group with the highest labor force participation rate are those with the educational attainment of bachelor's degree or higher, with 97.6% or 241 individuals in the labor force. Within the labor force, individuals with bachelor's degree or higher education have the highest percentage of unemployment, with 2.1% or 5 of them being unemployed.
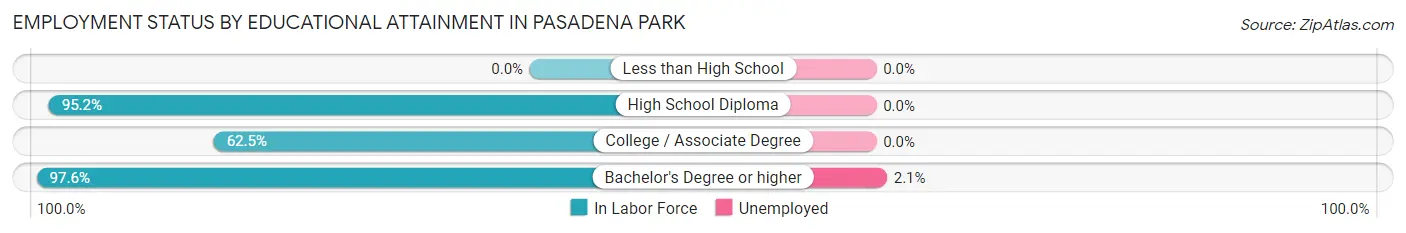
| Educational Attainment | In Labor Force | Unemployed |
| Less than High School | 0 (0.0%) | 0 (0.0%) |
| High School Diploma | 40 (95.2%) | 0 (0.0%) |
| College / Associate Degree | 55 (62.5%) | 0 (0.0%) |
| Bachelor's Degree or higher | 241 (97.6%) | 5 (2.1%) |
| Total | 336 (89.1%) | 6 (1.5%) |
Employment Occupations by Sex in Pasadena Park
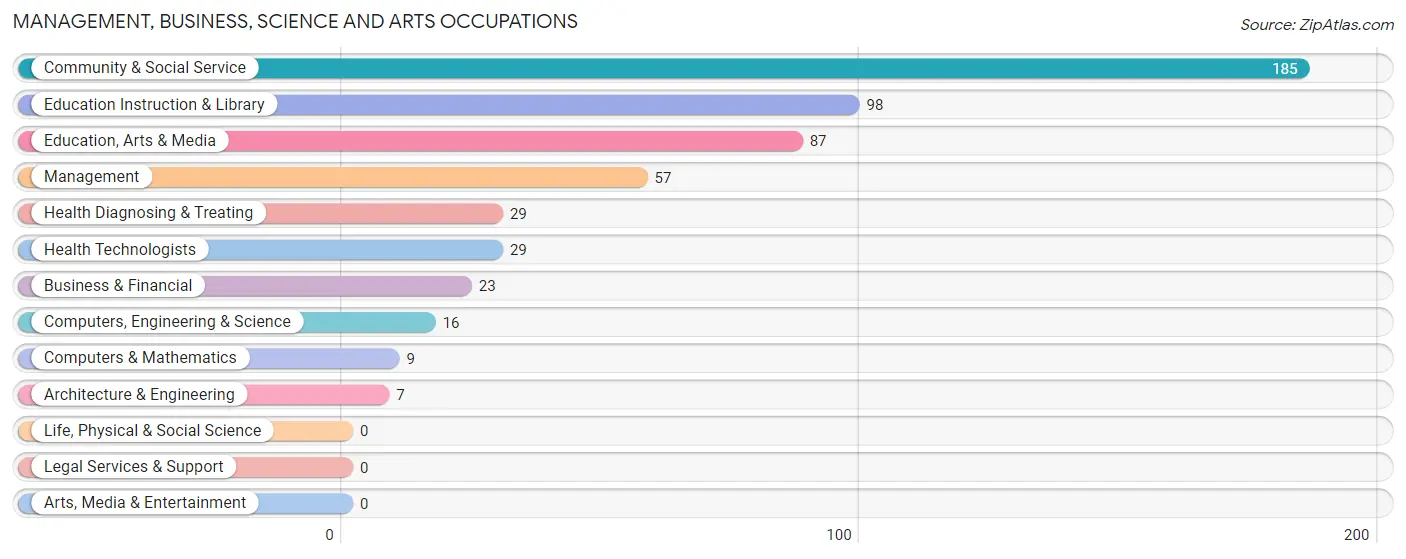
Management, Business, Science and Arts Occupations
The most common Management, Business, Science and Arts occupations in Pasadena Park are Community & Social Service (185 | 42.9%), Education Instruction & Library (98 | 22.7%), Education, Arts & Media (87 | 20.2%), Management (57 | 13.2%), and Health Diagnosing & Treating (29 | 6.7%).
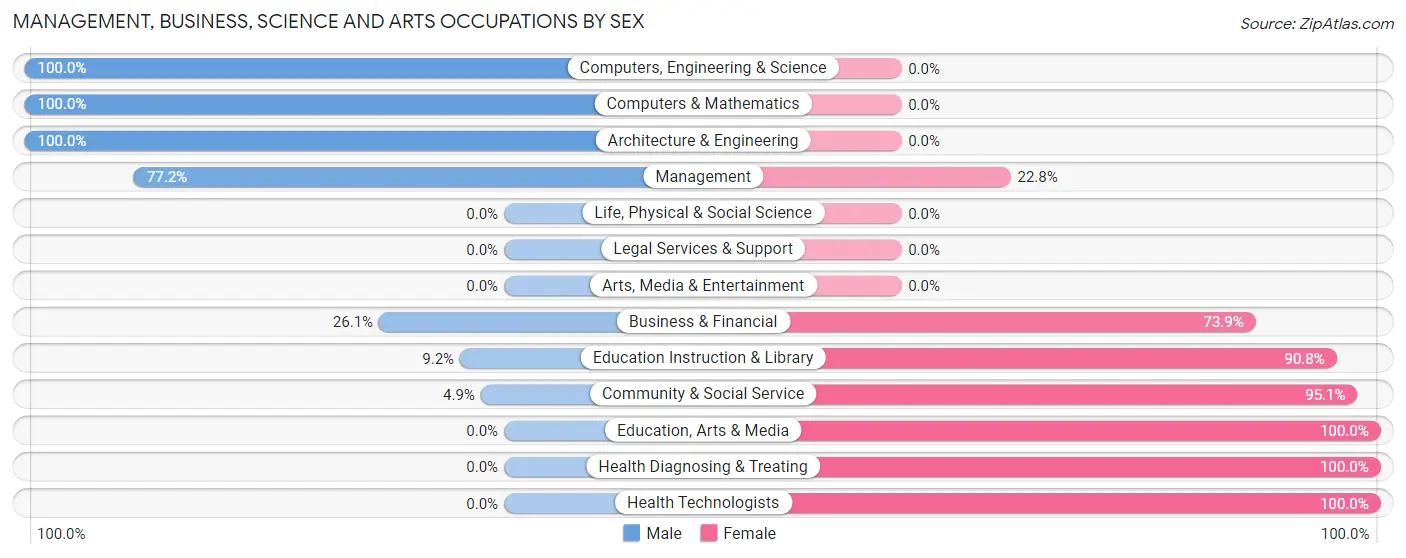
Management, Business, Science and Arts Occupations by Sex
Within the Management, Business, Science and Arts occupations in Pasadena Park, the most male-oriented occupations are Computers, Engineering & Science (100.0%), Computers & Mathematics (100.0%), and Architecture & Engineering (100.0%), while the most female-oriented occupations are Education, Arts & Media (100.0%), Health Diagnosing & Treating (100.0%), and Health Technologists (100.0%).
| Occupation | Male | Female |
| Management | 44 (77.2%) | 13 (22.8%) |
| Business & Financial | 6 (26.1%) | 17 (73.9%) |
| Computers, Engineering & Science | 16 (100.0%) | 0 (0.0%) |
| Computers & Mathematics | 9 (100.0%) | 0 (0.0%) |
| Architecture & Engineering | 7 (100.0%) | 0 (0.0%) |
| Life, Physical & Social Science | 0 (0.0%) | 0 (0.0%) |
| Community & Social Service | 9 (4.9%) | 176 (95.1%) |
| Education, Arts & Media | 0 (0.0%) | 87 (100.0%) |
| Legal Services & Support | 0 (0.0%) | 0 (0.0%) |
| Education Instruction & Library | 9 (9.2%) | 89 (90.8%) |
| Arts, Media & Entertainment | 0 (0.0%) | 0 (0.0%) |
| Health Diagnosing & Treating | 0 (0.0%) | 29 (100.0%) |
| Health Technologists | 0 (0.0%) | 29 (100.0%) |
| Total (Category) | 75 (24.2%) | 235 (75.8%) |
| Total (Overall) | 139 (32.3%) | 292 (67.7%) |
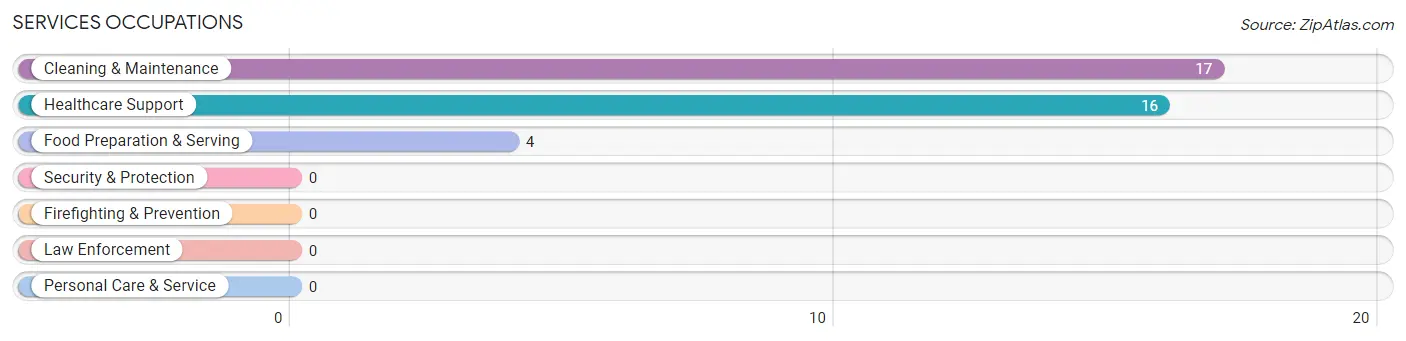
Services Occupations
The most common Services occupations in Pasadena Park are Cleaning & Maintenance (17 | 3.9%), Healthcare Support (16 | 3.7%), and Food Preparation & Serving (4 | 0.9%).
Services Occupations by Sex
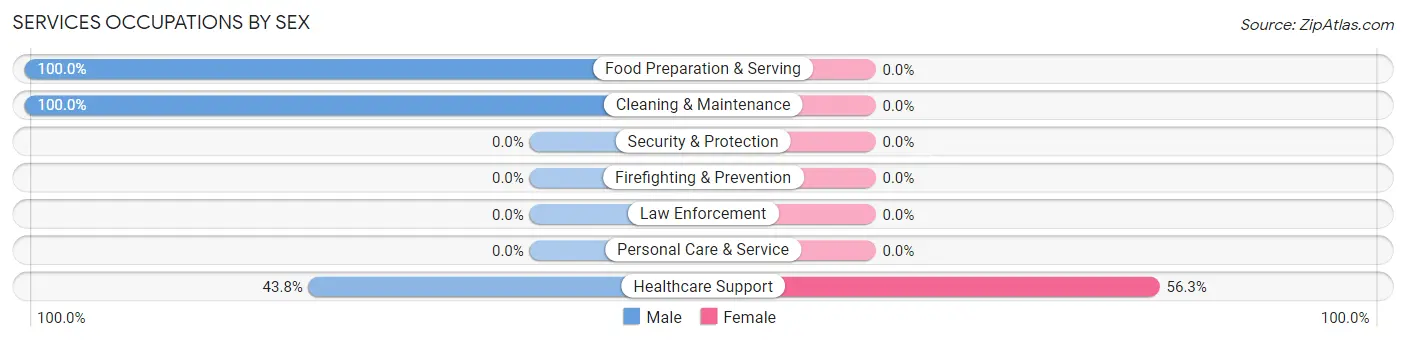
| Occupation | Male | Female |
| Healthcare Support | 7 (43.8%) | 9 (56.2%) |
| Security & Protection | 0 (0.0%) | 0 (0.0%) |
| Firefighting & Prevention | 0 (0.0%) | 0 (0.0%) |
| Law Enforcement | 0 (0.0%) | 0 (0.0%) |
| Food Preparation & Serving | 4 (100.0%) | 0 (0.0%) |
| Cleaning & Maintenance | 17 (100.0%) | 0 (0.0%) |
| Personal Care & Service | 0 (0.0%) | 0 (0.0%) |
| Total (Category) | 28 (75.7%) | 9 (24.3%) |
| Total (Overall) | 139 (32.3%) | 292 (67.7%) |
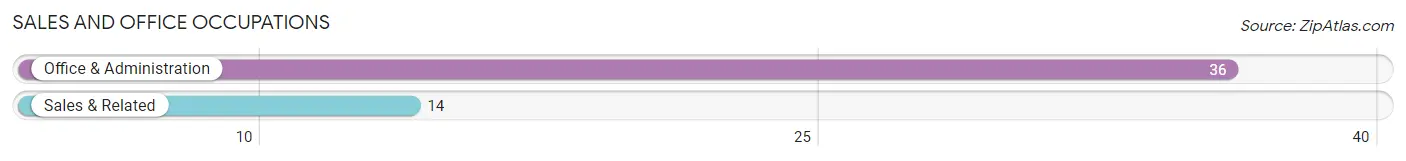
Sales and Office Occupations
The most common Sales and Office occupations in Pasadena Park are Office & Administration (36 | 8.4%), and Sales & Related (14 | 3.3%).
Sales and Office Occupations by Sex
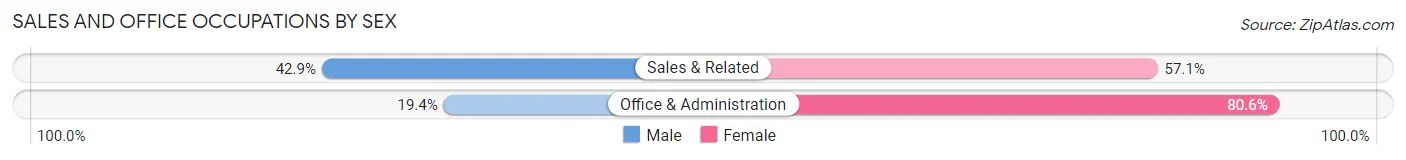
| Occupation | Male | Female |
| Sales & Related | 6 (42.9%) | 8 (57.1%) |
| Office & Administration | 7 (19.4%) | 29 (80.6%) |
| Total (Category) | 13 (26.0%) | 37 (74.0%) |
| Total (Overall) | 139 (32.3%) | 292 (67.7%) |
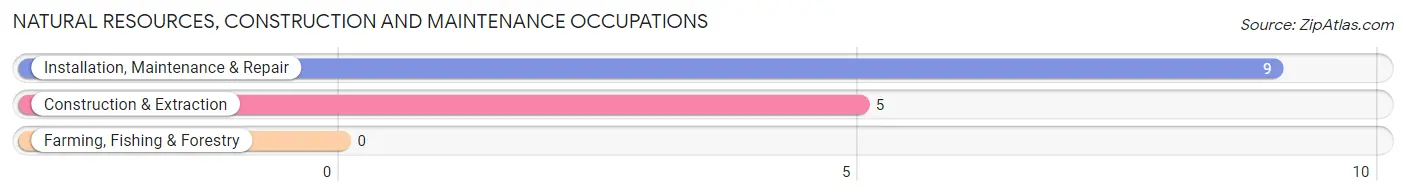
Natural Resources, Construction and Maintenance Occupations
The most common Natural Resources, Construction and Maintenance occupations in Pasadena Park are Installation, Maintenance & Repair (9 | 2.1%), and Construction & Extraction (5 | 1.2%).
Natural Resources, Construction and Maintenance Occupations by Sex
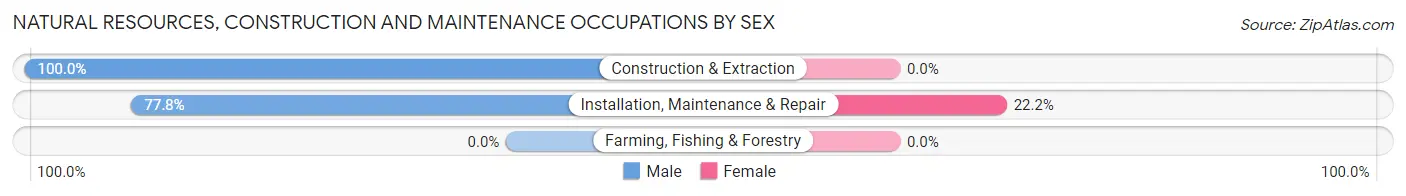
| Occupation | Male | Female |
| Farming, Fishing & Forestry | 0 (0.0%) | 0 (0.0%) |
| Construction & Extraction | 5 (100.0%) | 0 (0.0%) |
| Installation, Maintenance & Repair | 7 (77.8%) | 2 (22.2%) |
| Total (Category) | 12 (85.7%) | 2 (14.3%) |
| Total (Overall) | 139 (32.3%) | 292 (67.7%) |
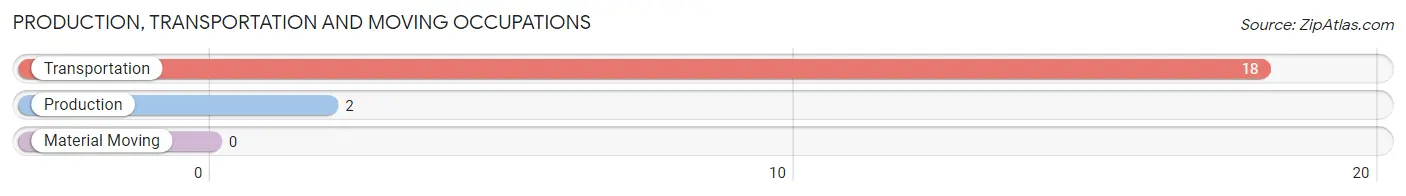
Production, Transportation and Moving Occupations
The most common Production, Transportation and Moving occupations in Pasadena Park are Transportation (18 | 4.2%), and Production (2 | 0.5%).
Production, Transportation and Moving Occupations by Sex
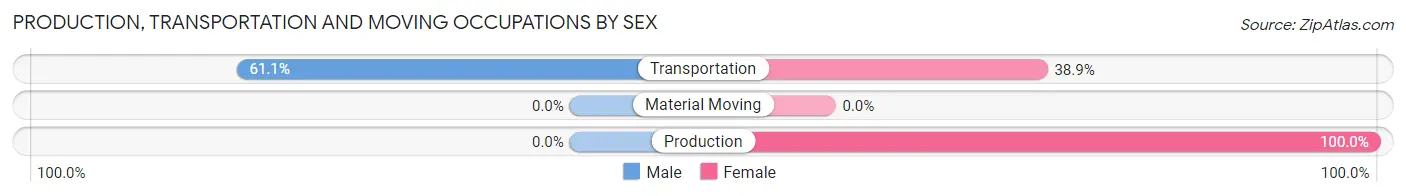
| Occupation | Male | Female |
| Production | 0 (0.0%) | 2 (100.0%) |
| Transportation | 11 (61.1%) | 7 (38.9%) |
| Material Moving | 0 (0.0%) | 0 (0.0%) |
| Total (Category) | 11 (55.0%) | 9 (45.0%) |
| Total (Overall) | 139 (32.3%) | 292 (67.7%) |
Employment Industries by Sex in Pasadena Park
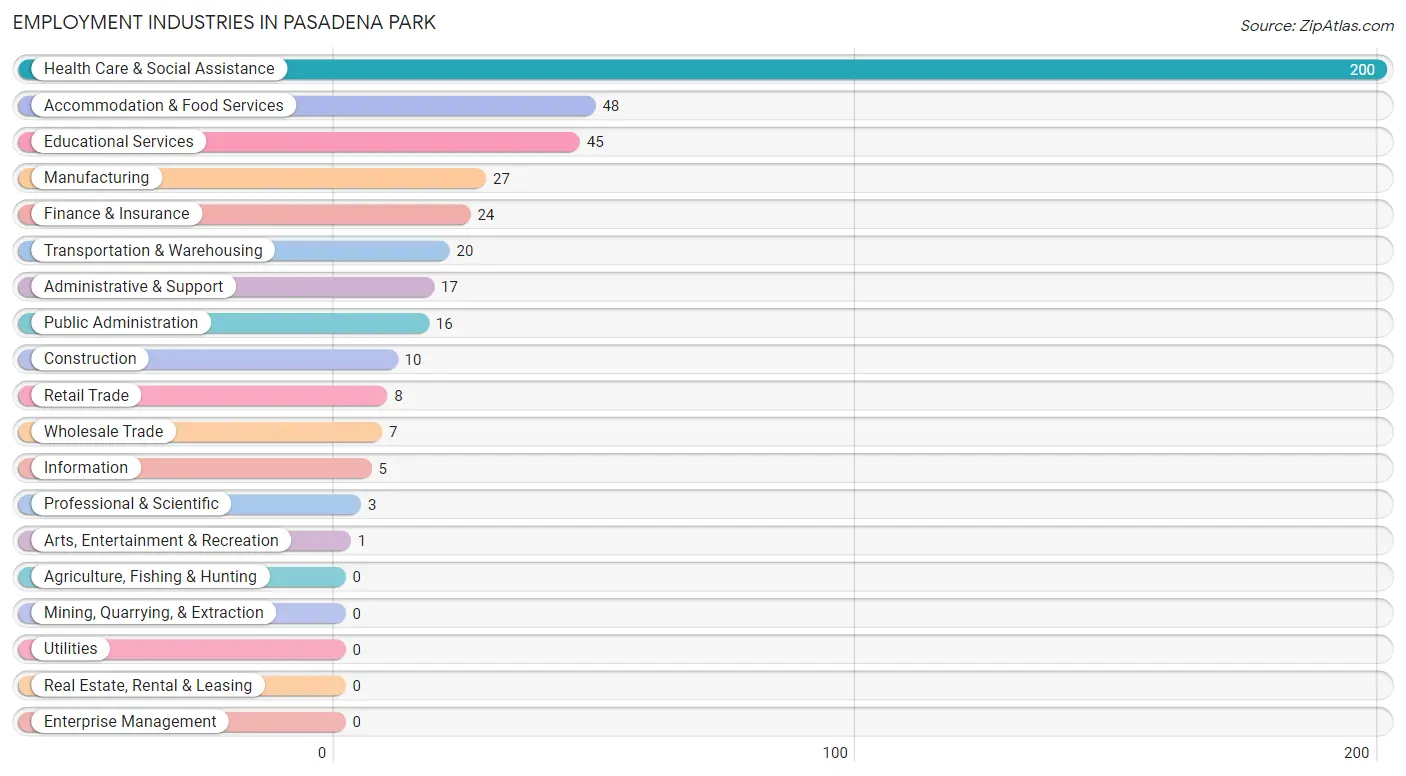
Employment Industries in Pasadena Park
The major employment industries in Pasadena Park include Health Care & Social Assistance (200 | 46.4%), Accommodation & Food Services (48 | 11.1%), Educational Services (45 | 10.4%), Manufacturing (27 | 6.3%), and Finance & Insurance (24 | 5.6%).
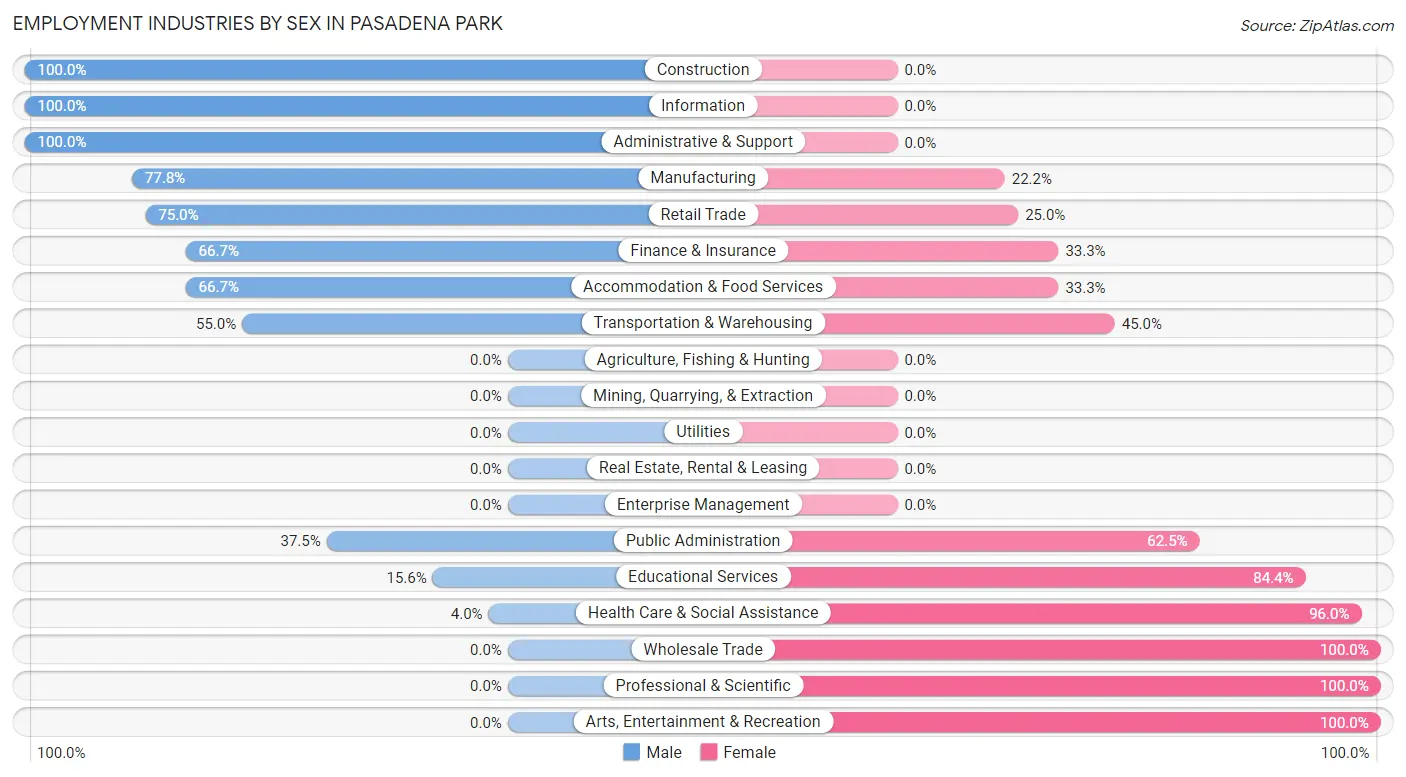
Employment Industries by Sex in Pasadena Park
The Pasadena Park industries that see more men than women are Construction (100.0%), Information (100.0%), and Administrative & Support (100.0%), whereas the industries that tend to have a higher number of women are Wholesale Trade (100.0%), Professional & Scientific (100.0%), and Arts, Entertainment & Recreation (100.0%).
| Industry | Male | Female |
| Agriculture, Fishing & Hunting | 0 (0.0%) | 0 (0.0%) |
| Mining, Quarrying, & Extraction | 0 (0.0%) | 0 (0.0%) |
| Construction | 10 (100.0%) | 0 (0.0%) |
| Manufacturing | 21 (77.8%) | 6 (22.2%) |
| Wholesale Trade | 0 (0.0%) | 7 (100.0%) |
| Retail Trade | 6 (75.0%) | 2 (25.0%) |
| Transportation & Warehousing | 11 (55.0%) | 9 (45.0%) |
| Utilities | 0 (0.0%) | 0 (0.0%) |
| Information | 5 (100.0%) | 0 (0.0%) |
| Finance & Insurance | 16 (66.7%) | 8 (33.3%) |
| Real Estate, Rental & Leasing | 0 (0.0%) | 0 (0.0%) |
| Professional & Scientific | 0 (0.0%) | 3 (100.0%) |
| Enterprise Management | 0 (0.0%) | 0 (0.0%) |
| Administrative & Support | 17 (100.0%) | 0 (0.0%) |
| Educational Services | 7 (15.6%) | 38 (84.4%) |
| Health Care & Social Assistance | 8 (4.0%) | 192 (96.0%) |
| Arts, Entertainment & Recreation | 0 (0.0%) | 1 (100.0%) |
| Accommodation & Food Services | 32 (66.7%) | 16 (33.3%) |
| Public Administration | 6 (37.5%) | 10 (62.5%) |
| Total | 139 (32.3%) | 292 (67.7%) |
Education in Pasadena Park
School Enrollment in Pasadena Park
The most common levels of schooling among the 239 students in Pasadena Park are high school (80 | 33.5%), college / undergraduate (63 | 26.4%), and elementary school (40 | 16.7%).
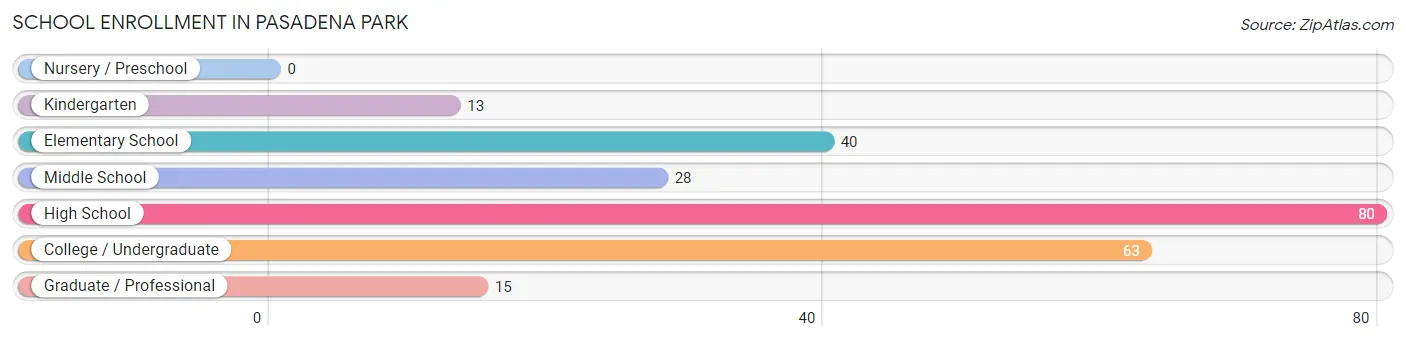
| School Level | # Students | % Students |
| Nursery / Preschool | 0 | 0.0% |
| Kindergarten | 13 | 5.4% |
| Elementary School | 40 | 16.7% |
| Middle School | 28 | 11.7% |
| High School | 80 | 33.5% |
| College / Undergraduate | 63 | 26.4% |
| Graduate / Professional | 15 | 6.3% |
| Total | 239 | 100.0% |
School Enrollment by Age by Funding Source in Pasadena Park
Out of a total of 239 students who are enrolled in schools in Pasadena Park, 64 (26.8%) attend a private institution, while the remaining 175 (73.2%) are enrolled in public schools. The age group of 25 to 34 year olds has the highest likelihood of being enrolled in private schools, with 15 (75.0% in the age bracket) enrolled. Conversely, the age group of 20 to 24 year olds has the lowest likelihood of being enrolled in a private school, with 58 (100.0% in the age bracket) attending a public institution.
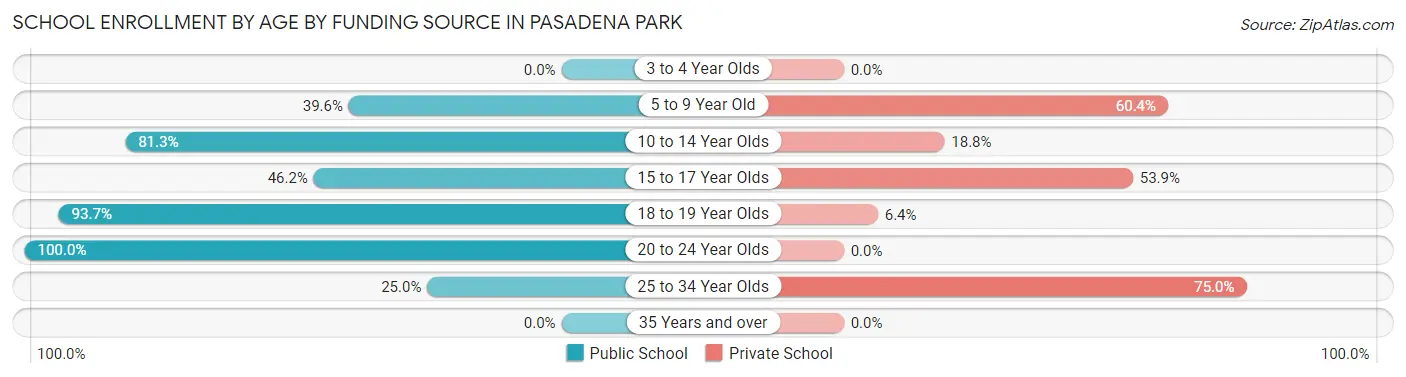
| Age Bracket | Public School | Private School |
| 3 to 4 Year Olds | 0 (0.0%) | 0 (0.0%) |
| 5 to 9 Year Old | 21 (39.6%) | 32 (60.4%) |
| 10 to 14 Year Olds | 26 (81.2%) | 6 (18.8%) |
| 15 to 17 Year Olds | 6 (46.2%) | 7 (53.8%) |
| 18 to 19 Year Olds | 59 (93.6%) | 4 (6.4%) |
| 20 to 24 Year Olds | 58 (100.0%) | 0 (0.0%) |
| 25 to 34 Year Olds | 5 (25.0%) | 15 (75.0%) |
| 35 Years and over | 0 (0.0%) | 0 (0.0%) |
| Total | 175 (73.2%) | 64 (26.8%) |
Educational Attainment by Field of Study in Pasadena Park
Education (119 | 37.5%), business (70 | 22.1%), social sciences (37 | 11.7%), science & technology (25 | 7.9%), and arts & humanities (20 | 6.3%) are the most common fields of study among 317 individuals in Pasadena Park who have obtained a bachelor's degree or higher.
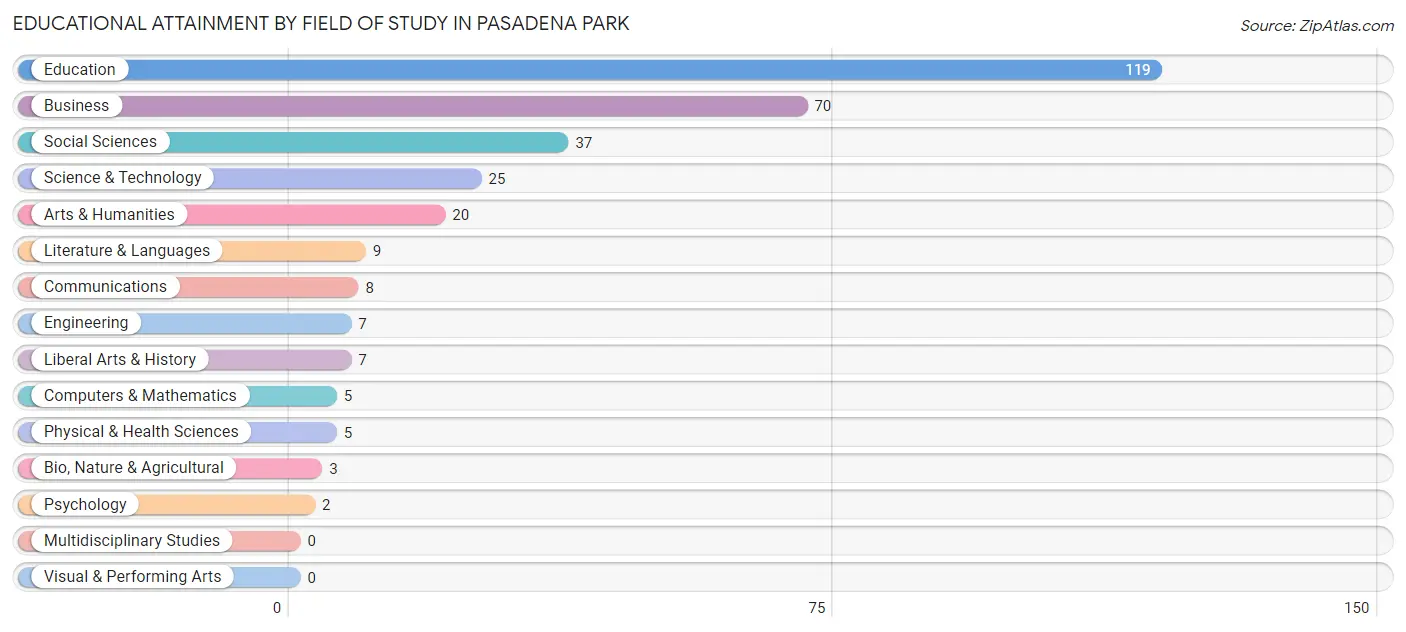
| Field of Study | # Graduates | % Graduates |
| Computers & Mathematics | 5 | 1.6% |
| Bio, Nature & Agricultural | 3 | 0.9% |
| Physical & Health Sciences | 5 | 1.6% |
| Psychology | 2 | 0.6% |
| Social Sciences | 37 | 11.7% |
| Engineering | 7 | 2.2% |
| Multidisciplinary Studies | 0 | 0.0% |
| Science & Technology | 25 | 7.9% |
| Business | 70 | 22.1% |
| Education | 119 | 37.5% |
| Literature & Languages | 9 | 2.8% |
| Liberal Arts & History | 7 | 2.2% |
| Visual & Performing Arts | 0 | 0.0% |
| Communications | 8 | 2.5% |
| Arts & Humanities | 20 | 6.3% |
| Total | 317 | 100.0% |
Transportation & Commute in Pasadena Park
Vehicle Availability by Sex in Pasadena Park
The most prevalent vehicle ownership categories in Pasadena Park are males with 3 vehicles (58, accounting for 41.7%) and females with 3 vehicles (95, making up 19.9%).
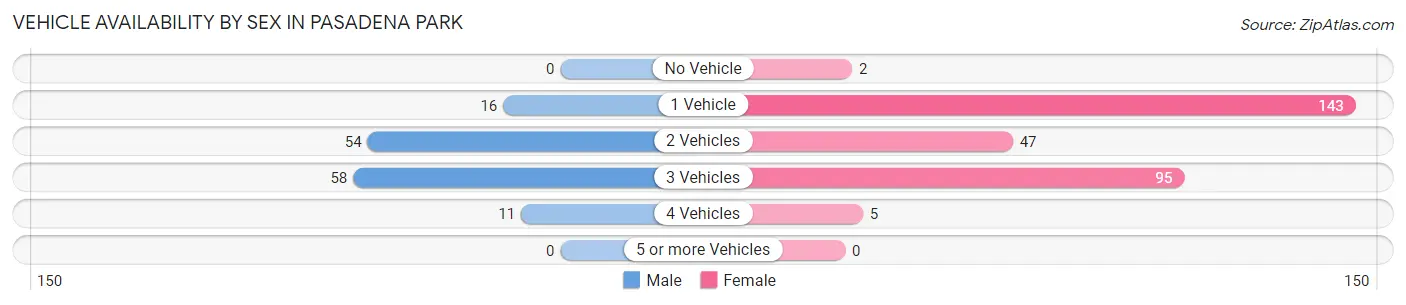
| Vehicles Available | Male | Female |
| No Vehicle | 0 (0.0%) | 2 (0.7%) |
| 1 Vehicle | 16 (11.5%) | 143 (49.0%) |
| 2 Vehicles | 54 (38.9%) | 47 (16.1%) |
| 3 Vehicles | 58 (41.7%) | 95 (32.5%) |
| 4 Vehicles | 11 (7.9%) | 5 (1.7%) |
| 5 or more Vehicles | 0 (0.0%) | 0 (0.0%) |
| Total | 139 (100.0%) | 292 (100.0%) |
Commute Time in Pasadena Park
The most frequently occuring commute durations in Pasadena Park are 20 to 24 minutes (124 commuters, 31.2%), 15 to 19 minutes (90 commuters, 22.7%), and 40 to 44 minutes (81 commuters, 20.4%).
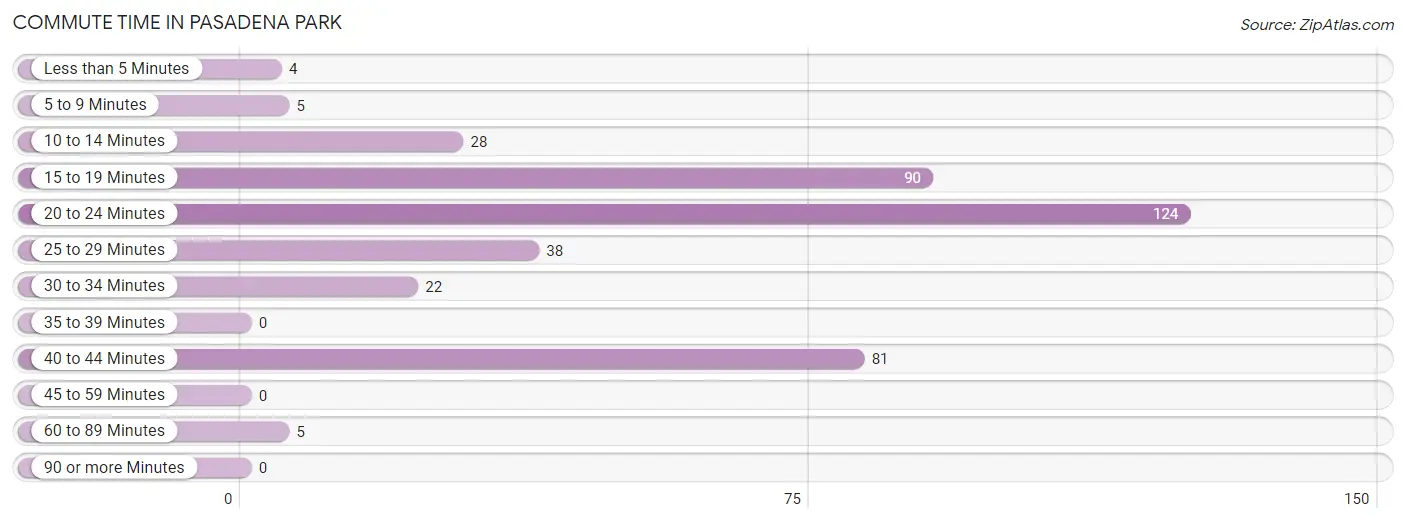
| Commute Time | # Commuters | % Commuters |
| Less than 5 Minutes | 4 | 1.0% |
| 5 to 9 Minutes | 5 | 1.3% |
| 10 to 14 Minutes | 28 | 7.0% |
| 15 to 19 Minutes | 90 | 22.7% |
| 20 to 24 Minutes | 124 | 31.2% |
| 25 to 29 Minutes | 38 | 9.6% |
| 30 to 34 Minutes | 22 | 5.5% |
| 35 to 39 Minutes | 0 | 0.0% |
| 40 to 44 Minutes | 81 | 20.4% |
| 45 to 59 Minutes | 0 | 0.0% |
| 60 to 89 Minutes | 5 | 1.3% |
| 90 or more Minutes | 0 | 0.0% |
Commute Time by Sex in Pasadena Park
The most common commute times in Pasadena Park are 15 to 19 minutes (62 commuters, 51.2%) for males and 20 to 24 minutes (117 commuters, 42.4%) for females.
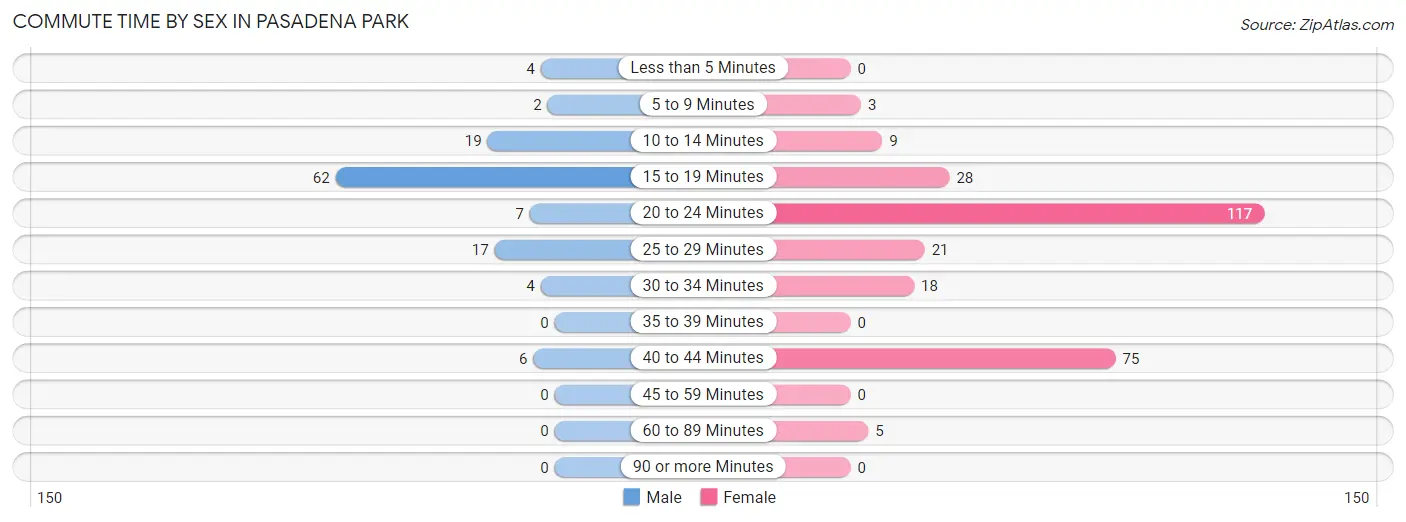
| Commute Time | Male | Female |
| Less than 5 Minutes | 4 (3.3%) | 0 (0.0%) |
| 5 to 9 Minutes | 2 (1.7%) | 3 (1.1%) |
| 10 to 14 Minutes | 19 (15.7%) | 9 (3.3%) |
| 15 to 19 Minutes | 62 (51.2%) | 28 (10.1%) |
| 20 to 24 Minutes | 7 (5.8%) | 117 (42.4%) |
| 25 to 29 Minutes | 17 (14.1%) | 21 (7.6%) |
| 30 to 34 Minutes | 4 (3.3%) | 18 (6.5%) |
| 35 to 39 Minutes | 0 (0.0%) | 0 (0.0%) |
| 40 to 44 Minutes | 6 (5.0%) | 75 (27.2%) |
| 45 to 59 Minutes | 0 (0.0%) | 0 (0.0%) |
| 60 to 89 Minutes | 0 (0.0%) | 5 (1.8%) |
| 90 or more Minutes | 0 (0.0%) | 0 (0.0%) |
Time of Departure to Work by Sex in Pasadena Park
The most frequent times of departure to work in Pasadena Park are 6:00 AM to 6:29 AM (42, 34.7%) for males and 7:00 AM to 7:29 AM (95, 34.4%) for females.
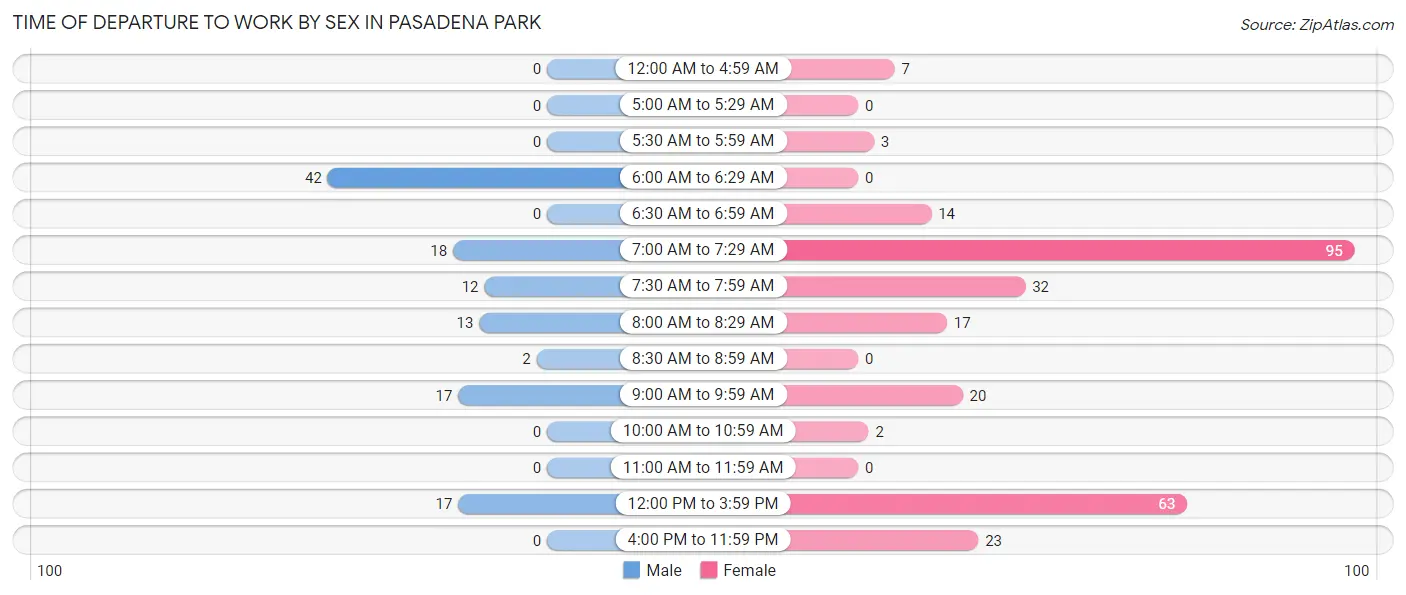
| Time of Departure | Male | Female |
| 12:00 AM to 4:59 AM | 0 (0.0%) | 7 (2.5%) |
| 5:00 AM to 5:29 AM | 0 (0.0%) | 0 (0.0%) |
| 5:30 AM to 5:59 AM | 0 (0.0%) | 3 (1.1%) |
| 6:00 AM to 6:29 AM | 42 (34.7%) | 0 (0.0%) |
| 6:30 AM to 6:59 AM | 0 (0.0%) | 14 (5.1%) |
| 7:00 AM to 7:29 AM | 18 (14.9%) | 95 (34.4%) |
| 7:30 AM to 7:59 AM | 12 (9.9%) | 32 (11.6%) |
| 8:00 AM to 8:29 AM | 13 (10.7%) | 17 (6.2%) |
| 8:30 AM to 8:59 AM | 2 (1.7%) | 0 (0.0%) |
| 9:00 AM to 9:59 AM | 17 (14.1%) | 20 (7.2%) |
| 10:00 AM to 10:59 AM | 0 (0.0%) | 2 (0.7%) |
| 11:00 AM to 11:59 AM | 0 (0.0%) | 0 (0.0%) |
| 12:00 PM to 3:59 PM | 17 (14.1%) | 63 (22.8%) |
| 4:00 PM to 11:59 PM | 0 (0.0%) | 23 (8.3%) |
| Total | 121 (100.0%) | 276 (100.0%) |
Housing Occupancy in Pasadena Park
Occupancy by Ownership in Pasadena Park
Of the total 346 dwellings in Pasadena Park, owner-occupied units account for 269 (77.7%), while renter-occupied units make up 77 (22.3%).
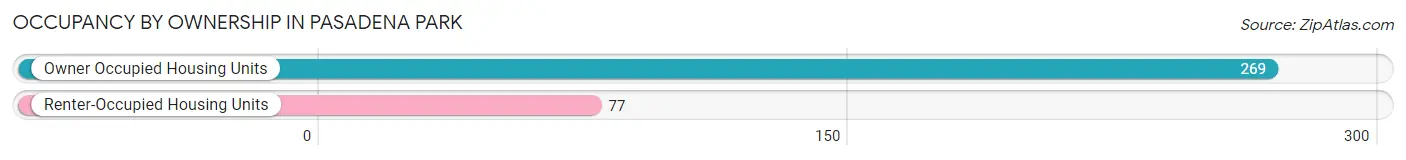
| Occupancy | # Housing Units | % Housing Units |
| Owner Occupied Housing Units | 269 | 77.7% |
| Renter-Occupied Housing Units | 77 | 22.3% |
| Total Occupied Housing Units | 346 | 100.0% |
Occupancy by Household Size in Pasadena Park
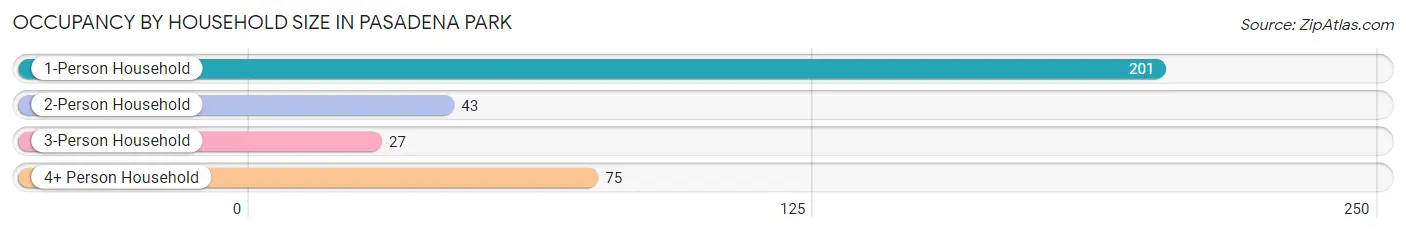
| Household Size | # Housing Units | % Housing Units |
| 1-Person Household | 201 | 58.1% |
| 2-Person Household | 43 | 12.4% |
| 3-Person Household | 27 | 7.8% |
| 4+ Person Household | 75 | 21.7% |
| Total Housing Units | 346 | 100.0% |
Occupancy by Ownership by Household Size in Pasadena Park
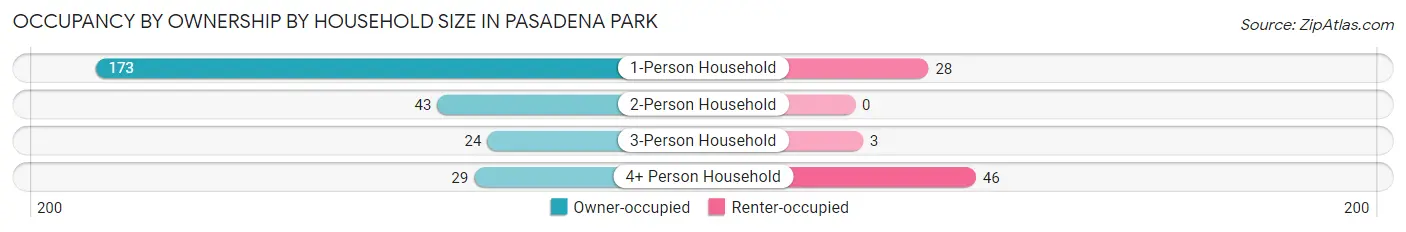
| Household Size | Owner-occupied | Renter-occupied |
| 1-Person Household | 173 (86.1%) | 28 (13.9%) |
| 2-Person Household | 43 (100.0%) | 0 (0.0%) |
| 3-Person Household | 24 (88.9%) | 3 (11.1%) |
| 4+ Person Household | 29 (38.7%) | 46 (61.3%) |
| Total Housing Units | 269 (77.7%) | 77 (22.3%) |
Occupancy by Educational Attainment in Pasadena Park
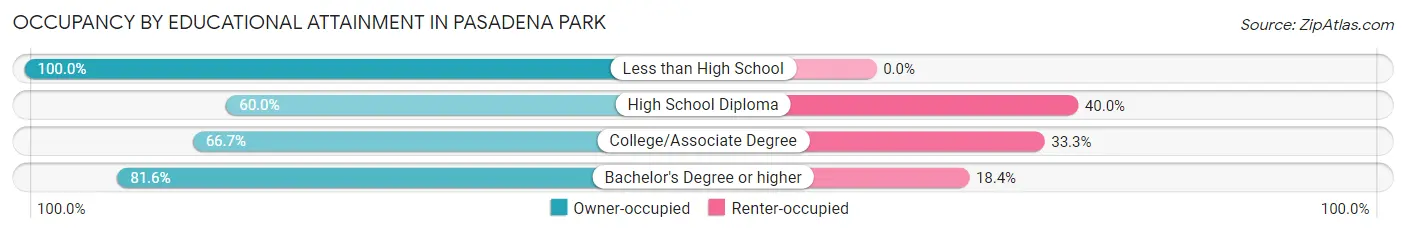
| Household Size | Owner-occupied | Renter-occupied |
| Less than High School | 1 (100.0%) | 0 (0.0%) |
| High School Diploma | 9 (60.0%) | 6 (40.0%) |
| College/Associate Degree | 46 (66.7%) | 23 (33.3%) |
| Bachelor's Degree or higher | 213 (81.6%) | 48 (18.4%) |
Occupancy by Age of Householder in Pasadena Park
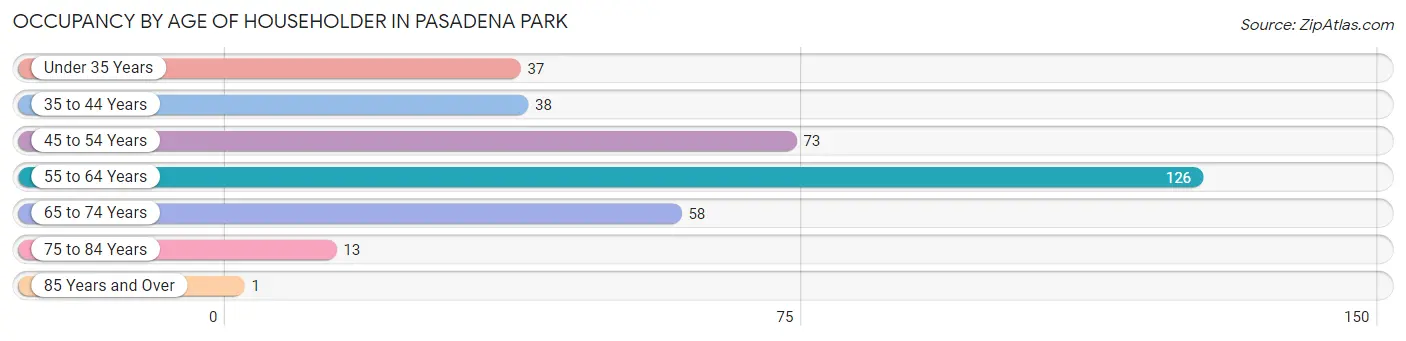
| Age Bracket | # Households | % Households |
| Under 35 Years | 37 | 10.7% |
| 35 to 44 Years | 38 | 11.0% |
| 45 to 54 Years | 73 | 21.1% |
| 55 to 64 Years | 126 | 36.4% |
| 65 to 74 Years | 58 | 16.8% |
| 75 to 84 Years | 13 | 3.8% |
| 85 Years and Over | 1 | 0.3% |
| Total | 346 | 100.0% |
Housing Finances in Pasadena Park
Median Income by Occupancy in Pasadena Park
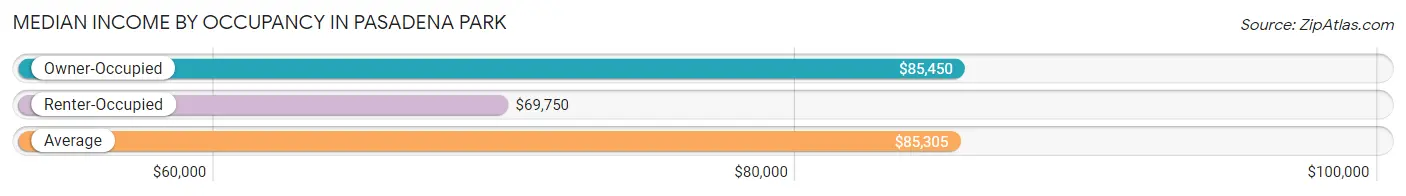
| Occupancy Type | # Households | Median Income |
| Owner-Occupied | 269 (77.7%) | $85,450 |
| Renter-Occupied | 77 (22.3%) | $69,750 |
| Average | 346 (100.0%) | $85,305 |
Occupancy by Householder Income Bracket in Pasadena Park
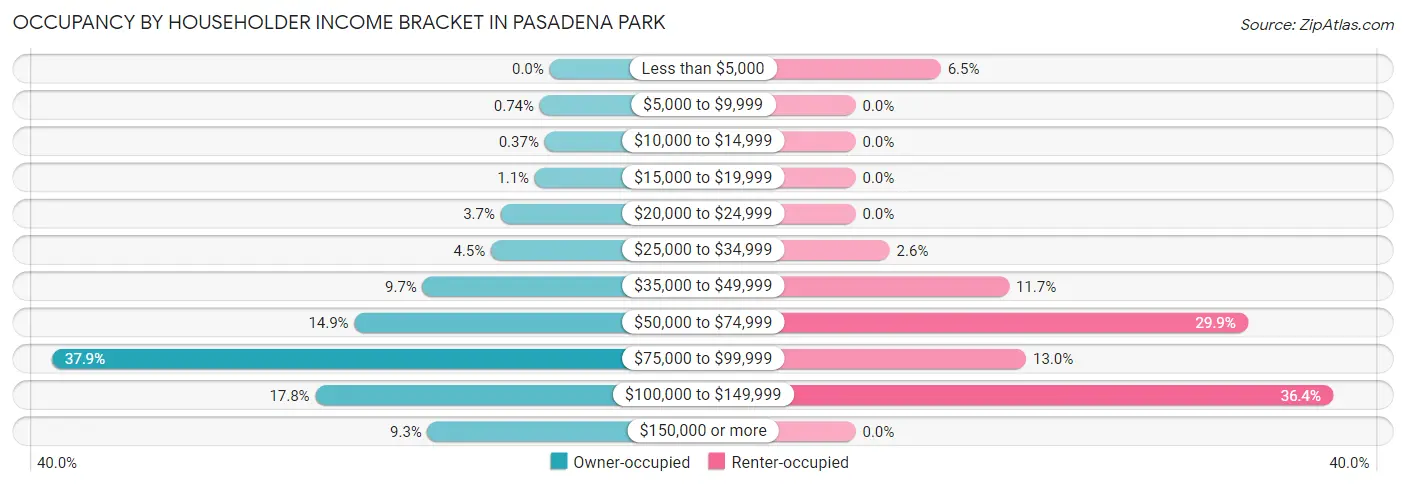
| Income Bracket | Owner-occupied | Renter-occupied |
| Less than $5,000 | 0 (0.0%) | 5 (6.5%) |
| $5,000 to $9,999 | 2 (0.7%) | 0 (0.0%) |
| $10,000 to $14,999 | 1 (0.4%) | 0 (0.0%) |
| $15,000 to $19,999 | 3 (1.1%) | 0 (0.0%) |
| $20,000 to $24,999 | 10 (3.7%) | 0 (0.0%) |
| $25,000 to $34,999 | 12 (4.5%) | 2 (2.6%) |
| $35,000 to $49,999 | 26 (9.7%) | 9 (11.7%) |
| $50,000 to $74,999 | 40 (14.9%) | 23 (29.9%) |
| $75,000 to $99,999 | 102 (37.9%) | 10 (13.0%) |
| $100,000 to $149,999 | 48 (17.8%) | 28 (36.4%) |
| $150,000 or more | 25 (9.3%) | 0 (0.0%) |
| Total | 269 (100.0%) | 77 (100.0%) |
Monthly Housing Cost Tiers in Pasadena Park
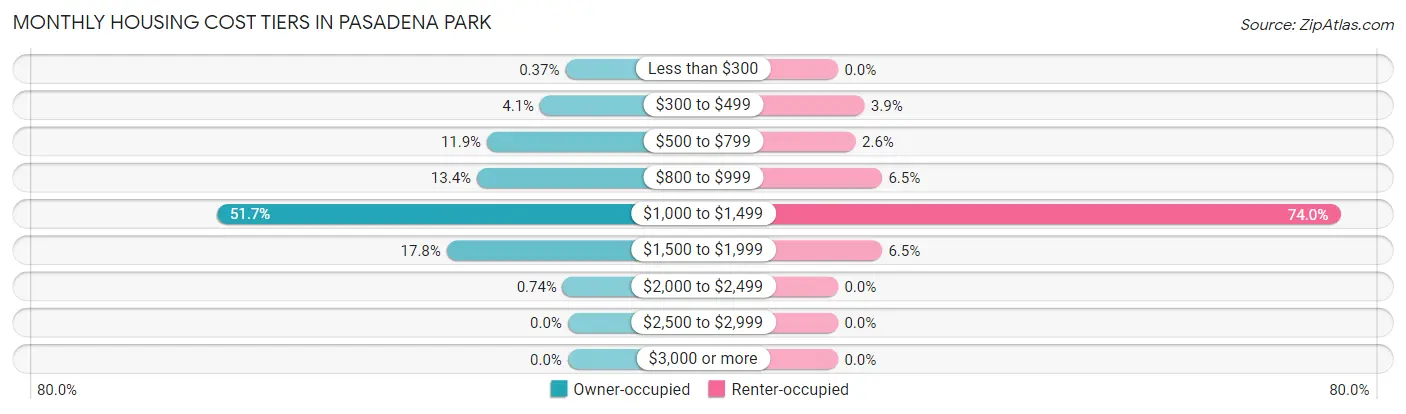
| Monthly Cost | Owner-occupied | Renter-occupied |
| Less than $300 | 1 (0.4%) | 0 (0.0%) |
| $300 to $499 | 11 (4.1%) | 3 (3.9%) |
| $500 to $799 | 32 (11.9%) | 2 (2.6%) |
| $800 to $999 | 36 (13.4%) | 5 (6.5%) |
| $1,000 to $1,499 | 139 (51.7%) | 57 (74.0%) |
| $1,500 to $1,999 | 48 (17.8%) | 5 (6.5%) |
| $2,000 to $2,499 | 2 (0.7%) | 0 (0.0%) |
| $2,500 to $2,999 | 0 (0.0%) | 0 (0.0%) |
| $3,000 or more | 0 (0.0%) | 0 (0.0%) |
| Total | 269 (100.0%) | 77 (100.0%) |
Physical Housing Characteristics in Pasadena Park
Housing Structures in Pasadena Park
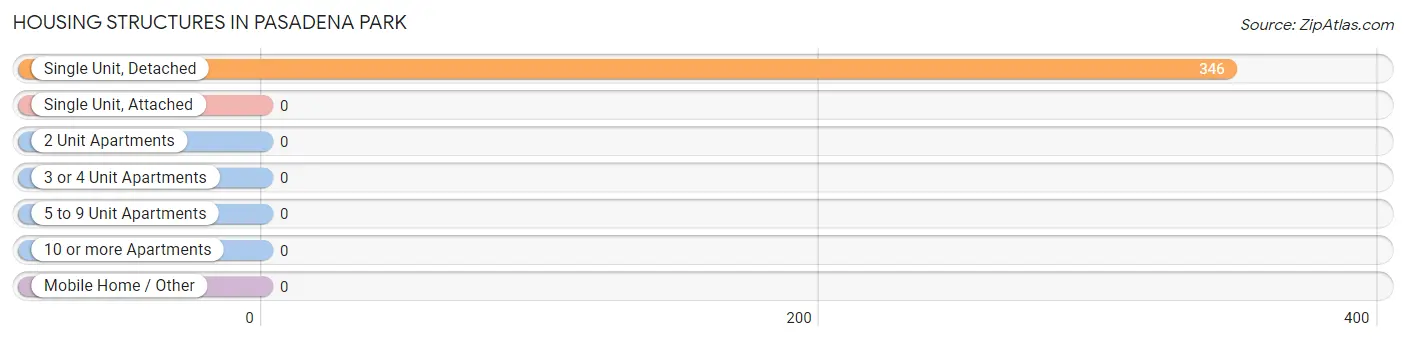
| Structure Type | # Housing Units | % Housing Units |
| Single Unit, Detached | 346 | 100.0% |
| Single Unit, Attached | 0 | 0.0% |
| 2 Unit Apartments | 0 | 0.0% |
| 3 or 4 Unit Apartments | 0 | 0.0% |
| 5 to 9 Unit Apartments | 0 | 0.0% |
| 10 or more Apartments | 0 | 0.0% |
| Mobile Home / Other | 0 | 0.0% |
| Total | 346 | 100.0% |
Housing Structures by Occupancy in Pasadena Park
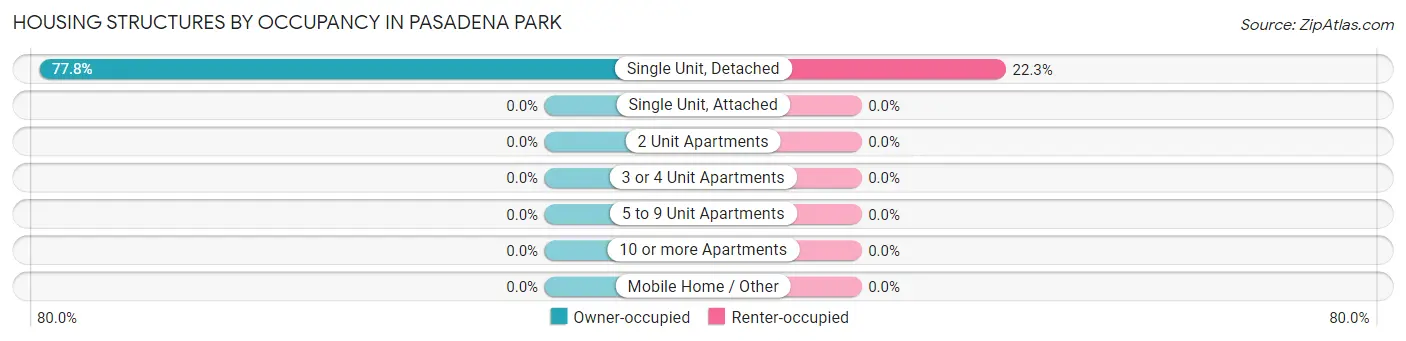
| Structure Type | Owner-occupied | Renter-occupied |
| Single Unit, Detached | 269 (77.7%) | 77 (22.3%) |
| Single Unit, Attached | 0 (0.0%) | 0 (0.0%) |
| 2 Unit Apartments | 0 (0.0%) | 0 (0.0%) |
| 3 or 4 Unit Apartments | 0 (0.0%) | 0 (0.0%) |
| 5 to 9 Unit Apartments | 0 (0.0%) | 0 (0.0%) |
| 10 or more Apartments | 0 (0.0%) | 0 (0.0%) |
| Mobile Home / Other | 0 (0.0%) | 0 (0.0%) |
| Total | 269 (77.7%) | 77 (22.3%) |
Housing Structures by Number of Rooms in Pasadena Park
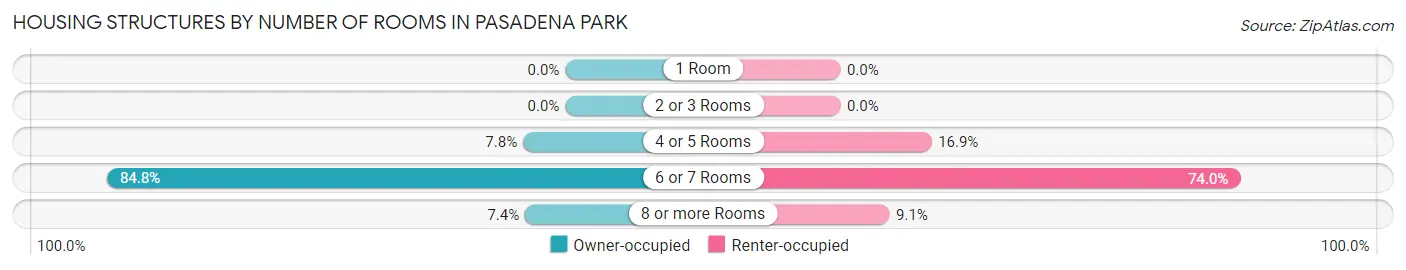
| Number of Rooms | Owner-occupied | Renter-occupied |
| 1 Room | 0 (0.0%) | 0 (0.0%) |
| 2 or 3 Rooms | 0 (0.0%) | 0 (0.0%) |
| 4 or 5 Rooms | 21 (7.8%) | 13 (16.9%) |
| 6 or 7 Rooms | 228 (84.8%) | 57 (74.0%) |
| 8 or more Rooms | 20 (7.4%) | 7 (9.1%) |
| Total | 269 (100.0%) | 77 (100.0%) |
Housing Structure by Heating Type in Pasadena Park
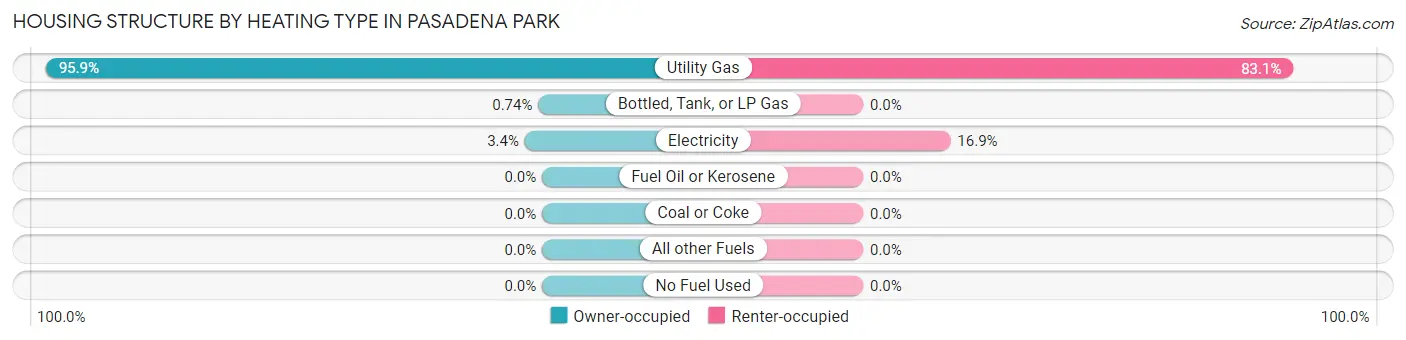
| Heating Type | Owner-occupied | Renter-occupied |
| Utility Gas | 258 (95.9%) | 64 (83.1%) |
| Bottled, Tank, or LP Gas | 2 (0.7%) | 0 (0.0%) |
| Electricity | 9 (3.4%) | 13 (16.9%) |
| Fuel Oil or Kerosene | 0 (0.0%) | 0 (0.0%) |
| Coal or Coke | 0 (0.0%) | 0 (0.0%) |
| All other Fuels | 0 (0.0%) | 0 (0.0%) |
| No Fuel Used | 0 (0.0%) | 0 (0.0%) |
| Total | 269 (100.0%) | 77 (100.0%) |
Household Vehicle Usage in Pasadena Park
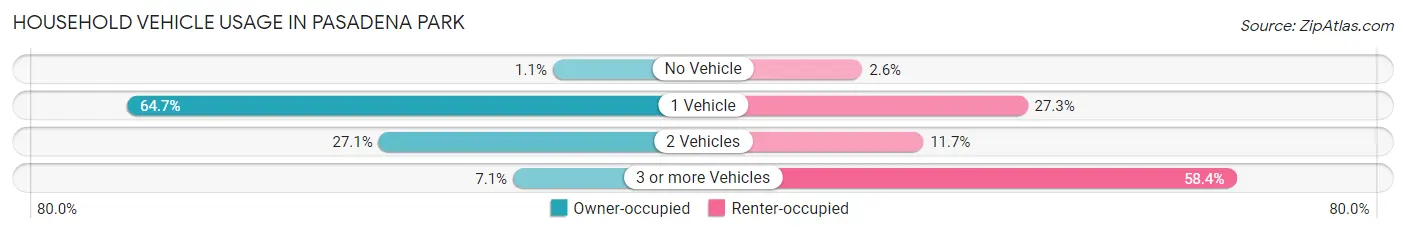
| Vehicles per Household | Owner-occupied | Renter-occupied |
| No Vehicle | 3 (1.1%) | 2 (2.6%) |
| 1 Vehicle | 174 (64.7%) | 21 (27.3%) |
| 2 Vehicles | 73 (27.1%) | 9 (11.7%) |
| 3 or more Vehicles | 19 (7.1%) | 45 (58.4%) |
| Total | 269 (100.0%) | 77 (100.0%) |
Real Estate & Mortgages in Pasadena Park
Real Estate and Mortgage Overview in Pasadena Park
| Characteristic | Without Mortgage | With Mortgage |
| Housing Units | 49 | 220 |
| Median Property Value | $118,400 | $151,700 |
| Median Household Income | $83,250 | $24 |
| Monthly Housing Costs | $633 | $0 |
| Real Estate Taxes | $2,833 | $0 |
Property Value by Mortgage Status in Pasadena Park
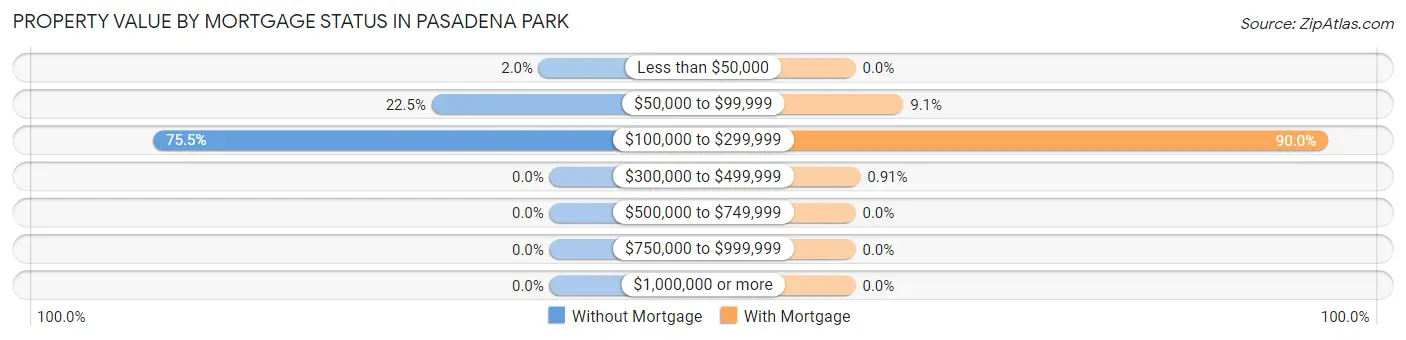
| Property Value | Without Mortgage | With Mortgage |
| Less than $50,000 | 1 (2.0%) | 0 (0.0%) |
| $50,000 to $99,999 | 11 (22.5%) | 20 (9.1%) |
| $100,000 to $299,999 | 37 (75.5%) | 198 (90.0%) |
| $300,000 to $499,999 | 0 (0.0%) | 2 (0.9%) |
| $500,000 to $749,999 | 0 (0.0%) | 0 (0.0%) |
| $750,000 to $999,999 | 0 (0.0%) | 0 (0.0%) |
| $1,000,000 or more | 0 (0.0%) | 0 (0.0%) |
| Total | 49 (100.0%) | 220 (100.0%) |
Household Income by Mortgage Status in Pasadena Park
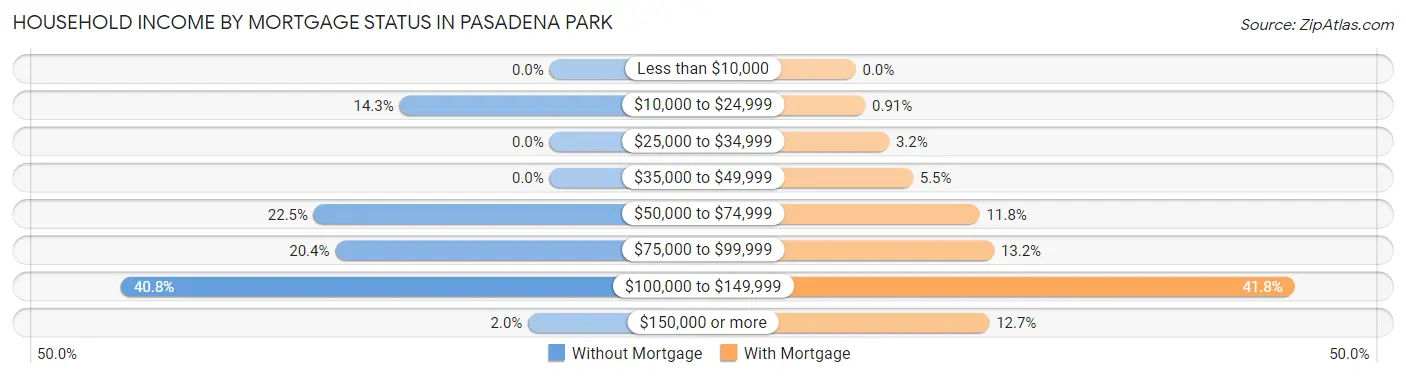
| Household Income | Without Mortgage | With Mortgage |
| Less than $10,000 | 0 (0.0%) | 0 (0.0%) |
| $10,000 to $24,999 | 7 (14.3%) | 2 (0.9%) |
| $25,000 to $34,999 | 0 (0.0%) | 7 (3.2%) |
| $35,000 to $49,999 | 0 (0.0%) | 12 (5.4%) |
| $50,000 to $74,999 | 11 (22.5%) | 26 (11.8%) |
| $75,000 to $99,999 | 10 (20.4%) | 29 (13.2%) |
| $100,000 to $149,999 | 20 (40.8%) | 92 (41.8%) |
| $150,000 or more | 1 (2.0%) | 28 (12.7%) |
| Total | 49 (100.0%) | 220 (100.0%) |
Property Value to Household Income Ratio in Pasadena Park
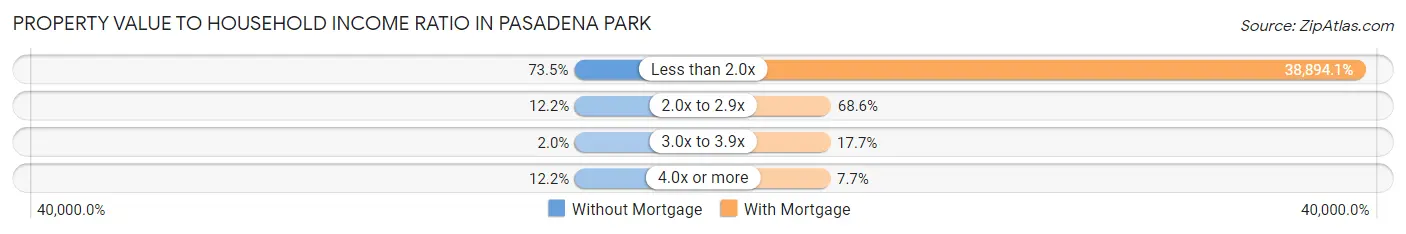
| Value-to-Income Ratio | Without Mortgage | With Mortgage |
| Less than 2.0x | 36 (73.5%) | 85,567 (38,894.1%) |
| 2.0x to 2.9x | 6 (12.2%) | 151 (68.6%) |
| 3.0x to 3.9x | 1 (2.0%) | 39 (17.7%) |
| 4.0x or more | 6 (12.2%) | 17 (7.7%) |
| Total | 49 (100.0%) | 220 (100.0%) |
Real Estate Taxes by Mortgage Status in Pasadena Park
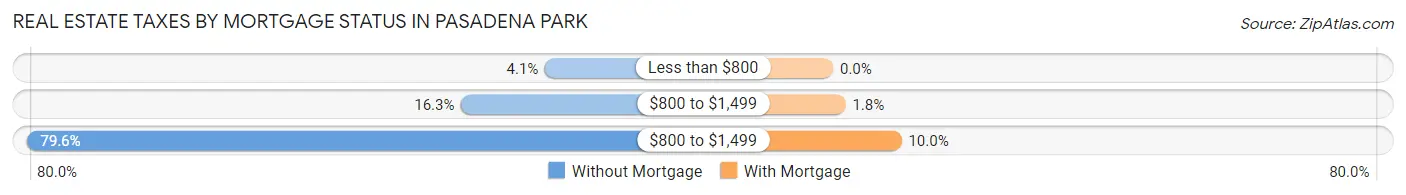
| Property Taxes | Without Mortgage | With Mortgage |
| Less than $800 | 2 (4.1%) | 0 (0.0%) |
| $800 to $1,499 | 8 (16.3%) | 4 (1.8%) |
| $800 to $1,499 | 39 (79.6%) | 22 (10.0%) |
| Total | 49 (100.0%) | 220 (100.0%) |
Health & Disability in Pasadena Park
Health Insurance Coverage by Age in Pasadena Park
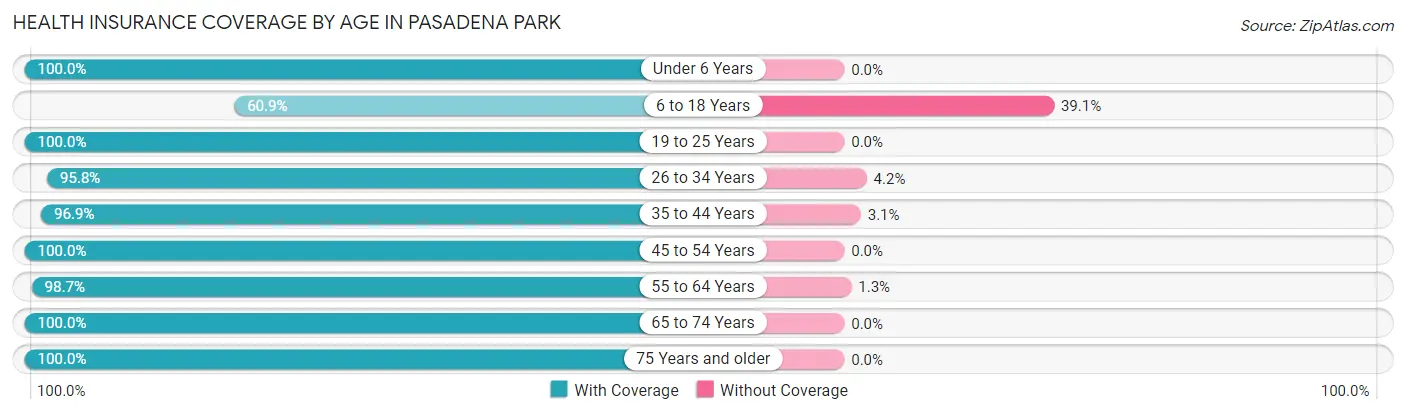
| Age Bracket | With Coverage | Without Coverage |
| Under 6 Years | 42 (100.0%) | 0 (0.0%) |
| 6 to 18 Years | 95 (60.9%) | 61 (39.1%) |
| 19 to 25 Years | 73 (100.0%) | 0 (0.0%) |
| 26 to 34 Years | 46 (95.8%) | 2 (4.2%) |
| 35 to 44 Years | 63 (96.9%) | 2 (3.1%) |
| 45 to 54 Years | 113 (100.0%) | 0 (0.0%) |
| 55 to 64 Years | 149 (98.7%) | 2 (1.3%) |
| 65 to 74 Years | 69 (100.0%) | 0 (0.0%) |
| 75 Years and older | 14 (100.0%) | 0 (0.0%) |
| Total | 664 (90.8%) | 67 (9.2%) |
Health Insurance Coverage by Citizenship Status in Pasadena Park
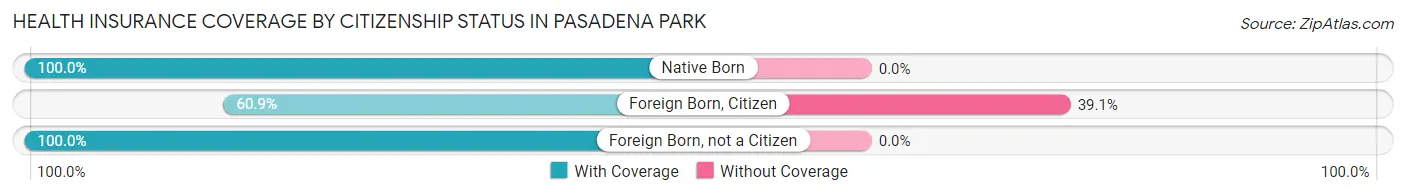
| Citizenship Status | With Coverage | Without Coverage |
| Native Born | 42 (100.0%) | 0 (0.0%) |
| Foreign Born, Citizen | 95 (60.9%) | 61 (39.1%) |
| Foreign Born, not a Citizen | 73 (100.0%) | 0 (0.0%) |
Health Insurance Coverage by Household Income in Pasadena Park
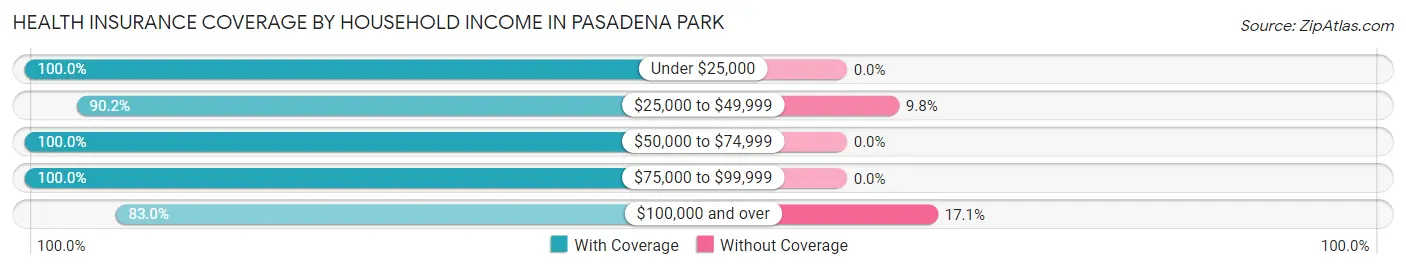
| Household Income | With Coverage | Without Coverage |
| Under $25,000 | 23 (100.0%) | 0 (0.0%) |
| $25,000 to $49,999 | 74 (90.2%) | 8 (9.8%) |
| $50,000 to $74,999 | 161 (100.0%) | 0 (0.0%) |
| $75,000 to $99,999 | 119 (100.0%) | 0 (0.0%) |
| $100,000 and over | 287 (83.0%) | 59 (17.1%) |
Public vs Private Health Insurance Coverage by Age in Pasadena Park
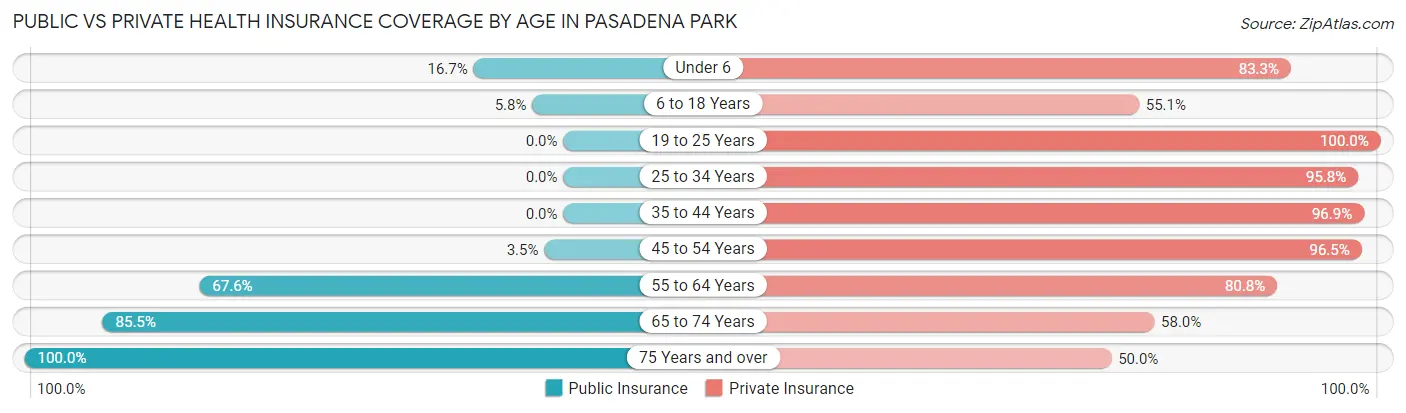
| Age Bracket | Public Insurance | Private Insurance |
| Under 6 | 7 (16.7%) | 35 (83.3%) |
| 6 to 18 Years | 9 (5.8%) | 86 (55.1%) |
| 19 to 25 Years | 0 (0.0%) | 73 (100.0%) |
| 25 to 34 Years | 0 (0.0%) | 46 (95.8%) |
| 35 to 44 Years | 0 (0.0%) | 63 (96.9%) |
| 45 to 54 Years | 4 (3.5%) | 109 (96.5%) |
| 55 to 64 Years | 102 (67.5%) | 122 (80.8%) |
| 65 to 74 Years | 59 (85.5%) | 40 (58.0%) |
| 75 Years and over | 14 (100.0%) | 7 (50.0%) |
| Total | 195 (26.7%) | 581 (79.5%) |
Disability Status by Sex by Age in Pasadena Park
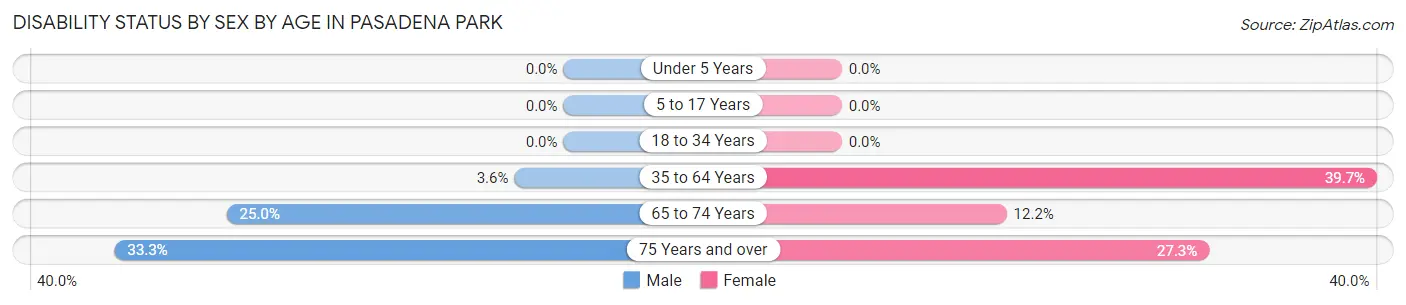
| Age Bracket | Male | Female |
| Under 5 Years | 0 (0.0%) | 0 (0.0%) |
| 5 to 17 Years | 0 (0.0%) | 0 (0.0%) |
| 18 to 34 Years | 0 (0.0%) | 0 (0.0%) |
| 35 to 64 Years | 4 (3.6%) | 87 (39.7%) |
| 65 to 74 Years | 5 (25.0%) | 6 (12.2%) |
| 75 Years and over | 1 (33.3%) | 3 (27.3%) |
Disability Class by Sex by Age in Pasadena Park
Disability Class: Hearing Difficulty
| Age Bracket | Male | Female |
| Under 5 Years | 0 (0.0%) | 0 (0.0%) |
| 5 to 17 Years | 0 (0.0%) | 0 (0.0%) |
| 18 to 34 Years | 0 (0.0%) | 0 (0.0%) |
| 35 to 64 Years | 0 (0.0%) | 0 (0.0%) |
| 65 to 74 Years | 0 (0.0%) | 0 (0.0%) |
| 75 Years and over | 0 (0.0%) | 0 (0.0%) |
Disability Class: Vision Difficulty
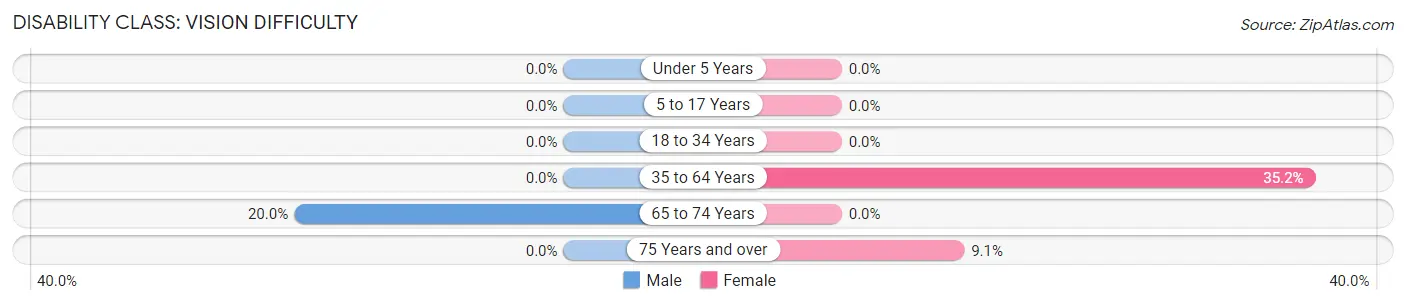
| Age Bracket | Male | Female |
| Under 5 Years | 0 (0.0%) | 0 (0.0%) |
| 5 to 17 Years | 0 (0.0%) | 0 (0.0%) |
| 18 to 34 Years | 0 (0.0%) | 0 (0.0%) |
| 35 to 64 Years | 0 (0.0%) | 77 (35.2%) |
| 65 to 74 Years | 4 (20.0%) | 0 (0.0%) |
| 75 Years and over | 0 (0.0%) | 1 (9.1%) |
Disability Class: Cognitive Difficulty
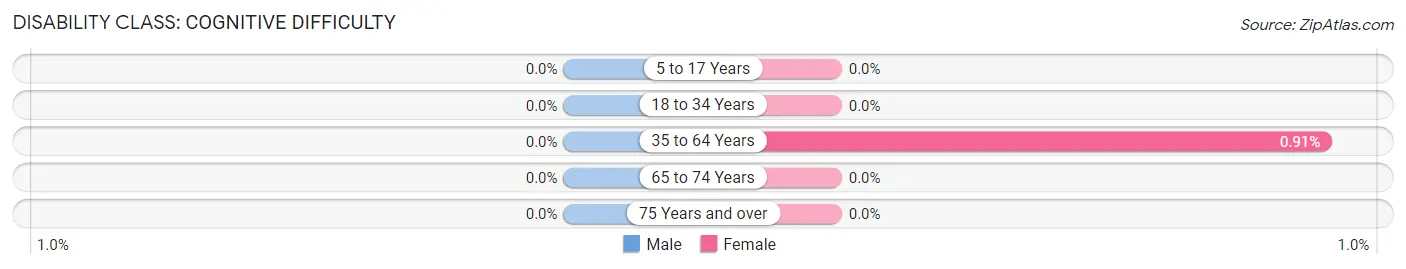
| Age Bracket | Male | Female |
| 5 to 17 Years | 0 (0.0%) | 0 (0.0%) |
| 18 to 34 Years | 0 (0.0%) | 0 (0.0%) |
| 35 to 64 Years | 0 (0.0%) | 2 (0.9%) |
| 65 to 74 Years | 0 (0.0%) | 0 (0.0%) |
| 75 Years and over | 0 (0.0%) | 0 (0.0%) |
Disability Class: Ambulatory Difficulty
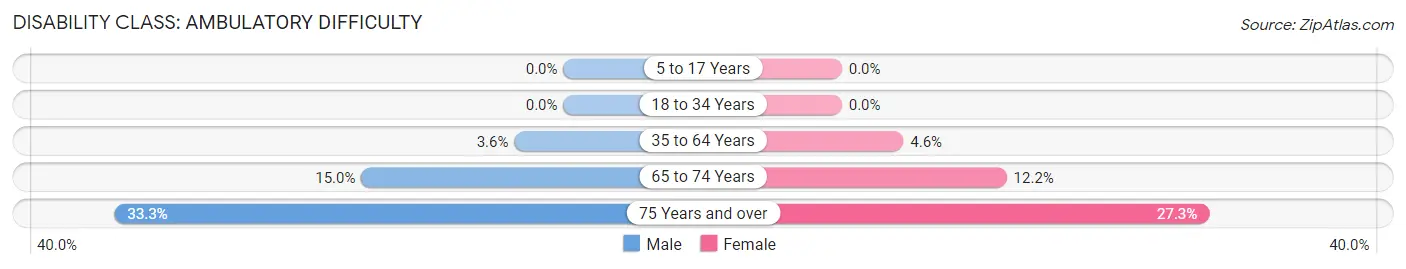
| Age Bracket | Male | Female |
| 5 to 17 Years | 0 (0.0%) | 0 (0.0%) |
| 18 to 34 Years | 0 (0.0%) | 0 (0.0%) |
| 35 to 64 Years | 4 (3.6%) | 10 (4.6%) |
| 65 to 74 Years | 3 (15.0%) | 6 (12.2%) |
| 75 Years and over | 1 (33.3%) | 3 (27.3%) |
Disability Class: Self-Care Difficulty
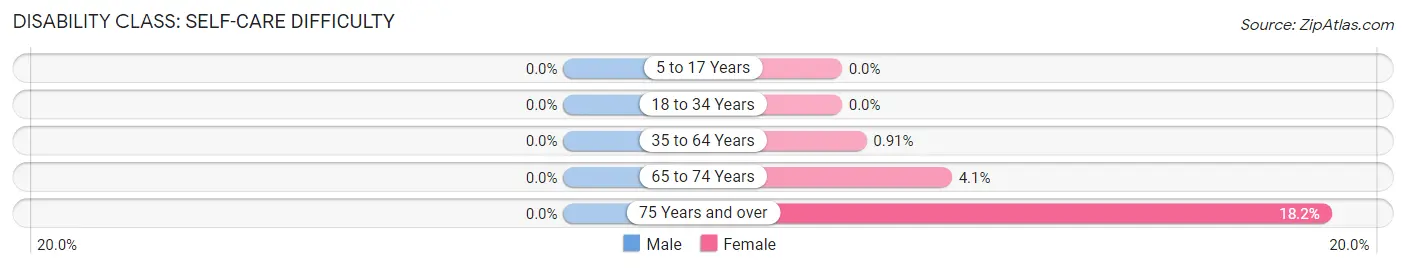
| Age Bracket | Male | Female |
| 5 to 17 Years | 0 (0.0%) | 0 (0.0%) |
| 18 to 34 Years | 0 (0.0%) | 0 (0.0%) |
| 35 to 64 Years | 0 (0.0%) | 2 (0.9%) |
| 65 to 74 Years | 0 (0.0%) | 2 (4.1%) |
| 75 Years and over | 0 (0.0%) | 2 (18.2%) |
Technology Access in Pasadena Park
Computing Device Access in Pasadena Park
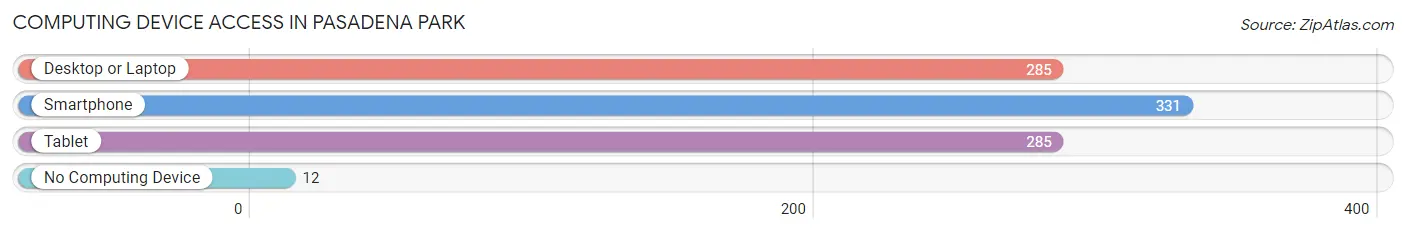
| Device Type | # Households | % Households |
| Desktop or Laptop | 285 | 82.4% |
| Smartphone | 331 | 95.7% |
| Tablet | 285 | 82.4% |
| No Computing Device | 12 | 3.5% |
| Total | 346 | 100.0% |
Internet Access in Pasadena Park
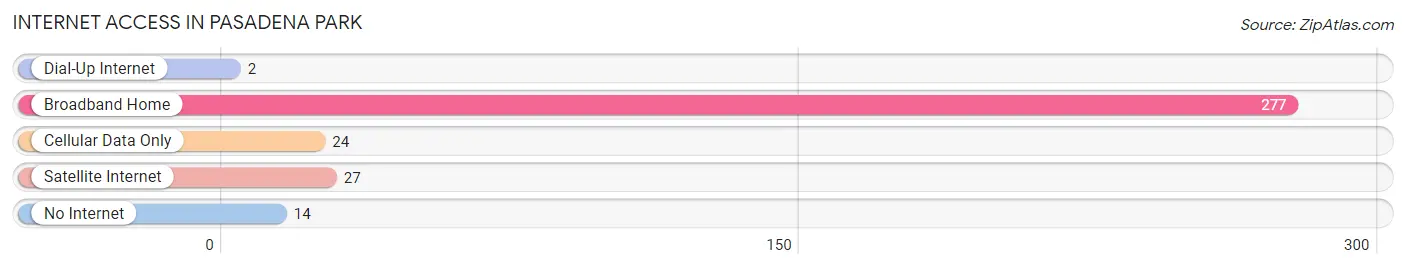
| Internet Type | # Households | % Households |
| Dial-Up Internet | 2 | 0.6% |
| Broadband Home | 277 | 80.1% |
| Cellular Data Only | 24 | 6.9% |
| Satellite Internet | 27 | 7.8% |
| No Internet | 14 | 4.1% |
| Total | 346 | 100.0% |
Pasadena Park Summary
Pasadena Park is a small unincorporated community located in St. Louis County, Missouri. It is situated in the northwest corner of the county, just south of the city of St. Louis. The community is bordered by the Missouri River to the east, the Mississippi River to the west, and the city of St. Louis to the south. The population of Pasadena Park was estimated to be 1,845 in the 2010 census.
Geography
Pasadena Park is located at 38°45'25"N 90°19'45"W (38.756944, -90.329167). It is situated in the northwest corner of St. Louis County, just south of the city of St. Louis. The community is bordered by the Missouri River to the east, the Mississippi River to the west, and the city of St. Louis to the south. The total area of Pasadena Park is 0.7 square miles, all of which is land.
The terrain of Pasadena Park is mostly flat, with some rolling hills. The soil is mostly clay and loam. The climate is humid continental, with hot summers and cold winters. The average annual temperature is 54°F, and the average annual precipitation is 40 inches.
History
Pasadena Park was founded in 1876 by a group of German immigrants. The community was named after Pasadena, California, which was a popular destination for German immigrants at the time. The original settlers were mostly farmers, and the community was largely agricultural until the early 20th century.
In the early 1900s, the community began to experience rapid growth due to the influx of new residents from St. Louis. The population of Pasadena Park increased from 1,000 in 1910 to 4,000 in 1920. This growth was largely due to the construction of the St. Louis-San Francisco Railway, which connected the community to St. Louis.
The population of Pasadena Park peaked in the 1950s, with a population of over 5,000. Since then, the population has declined steadily, and the 2010 census estimated the population to be 1,845.
Economy
The economy of Pasadena Park is largely based on service industries. The largest employers in the community are the St. Louis County government, the St. Louis Public Schools, and the St. Louis Community College. Other major employers include retail stores, restaurants, and medical facilities.
The median household income in Pasadena Park is $37,813, which is slightly lower than the median household income for St. Louis County ($41,945). The poverty rate in Pasadena Park is 16.3%, which is higher than the poverty rate for St. Louis County (13.2%).
Demographics
The population of Pasadena Park was estimated to be 1,845 in the 2010 census. The racial makeup of the community is 79.2% White, 14.2% African American, 2.2% Hispanic or Latino, and 4.4% other.
The median age in Pasadena Park is 38.3 years, which is slightly lower than the median age for St. Louis County (40.2 years). The gender ratio is almost even, with 50.3% female and 49.7% male.
Conclusion
Pasadena Park is a small unincorporated community located in St. Louis County, Missouri. It is situated in the northwest corner of the county, just south of the city of St. Louis. The population of Pasadena Park was estimated to be 1,845 in the 2010 census. The economy of Pasadena Park is largely based on service industries, and the median household income is slightly lower than the median household income for St. Louis County. The racial makeup of the community is 79.2% White, 14.2% African American, 2.2% Hispanic or Latino, and 4.4% other. The median age in Pasadena Park is 38.3 years, and the gender ratio is almost even.
Common Questions
What is Per Capita Income in Pasadena Park?
Per Capita income in Pasadena Park is $41,763.
What is the Median Household income in Pasadena Park?
Median Household Income in Pasadena Park is $85,305.
What is Income or Wage Gap in Pasadena Park?
Income or Wage Gap in Pasadena Park is 9.7%.
Women in Pasadena Park earn 90.3 cents for every dollar earned by a man.
What is Inequality or Gini Index in Pasadena Park?
Inequality or Gini Index in Pasadena Park is 0.29.
What is the Total Population of Pasadena Park?
Total Population of Pasadena Park is 731.
What is the Total Male Population of Pasadena Park?
Total Male Population of Pasadena Park is 229.
What is the Total Female Population of Pasadena Park?
Total Female Population of Pasadena Park is 502.
What is the Ratio of Males per 100 Females in Pasadena Park?
There are 45.62 Males per 100 Females in Pasadena Park.
What is the Ratio of Females per 100 Males in Pasadena Park?
There are 219.21 Females per 100 Males in Pasadena Park.
What is the Median Population Age in Pasadena Park?
Median Population Age in Pasadena Park is 40.1 Years.
What is the Average Family Size in Pasadena Park
Average Family Size in Pasadena Park is 3.2 People.
What is the Average Household Size in Pasadena Park
Average Household Size in Pasadena Park is 2.1 People.
How Large is the Labor Force in Pasadena Park?
There are 438 People in the Labor Forcein in Pasadena Park.
What is the Percentage of People in the Labor Force in Pasadena Park?
72.6% of People are in the Labor Force in Pasadena Park.
What is the Unemployment Rate in Pasadena Park?
Unemployment Rate in Pasadena Park is 1.6%.