Jennings, MO Map & Demographics
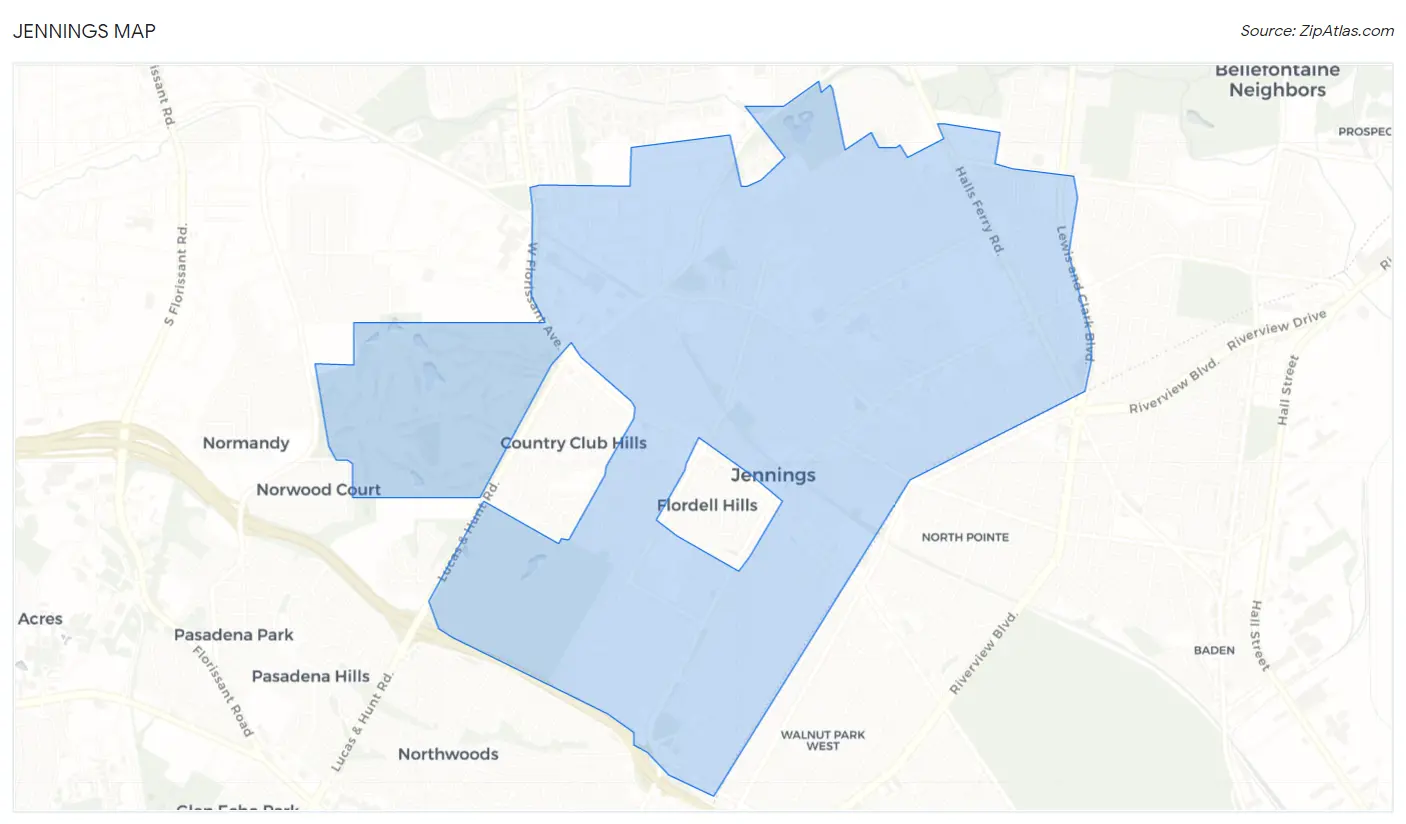
Jennings Map
Jennings Overview
$20,748
PER CAPITA INCOME
$45,240
AVG FAMILY INCOME
$32,462
AVG HOUSEHOLD INCOME
16.2%
WAGE / INCOME GAP [ % ]
83.8¢/ $1
WAGE / INCOME GAP [ $ ]
$9,404
FAMILY INCOME DEFICIT
0.44
INEQUALITY / GINI INDEX
12,996
TOTAL POPULATION
5,314
MALE POPULATION
7,682
FEMALE POPULATION
69.17
MALES / 100 FEMALES
144.56
FEMALES / 100 MALES
42.5
MEDIAN AGE
3.2
AVG FAMILY SIZE
2.2
AVG HOUSEHOLD SIZE
5,690
LABOR FORCE [ PEOPLE ]
53.4%
PERCENT IN LABOR FORCE
10.1%
UNEMPLOYMENT RATE
Jennings Area Codes
Income in Jennings
Income Overview in Jennings
Per Capita Income in Jennings is $20,748, while median incomes of families and households are $45,240 and $32,462 respectively.
| Characteristic | Number | Measure |
| Per Capita Income | 12,996 | $20,748 |
| Median Family Income | 2,907 | $45,240 |
| Mean Family Income | 2,907 | $55,762 |
| Median Household Income | 5,988 | $32,462 |
| Mean Household Income | 5,988 | $43,633 |
| Income Deficit | 2,907 | $9,404 |
| Wage / Income Gap (%) | 12,996 | 16.22% |
| Wage / Income Gap ($) | 12,996 | 83.78¢ per $1 |
| Gini / Inequality Index | 12,996 | 0.44 |
Earnings by Sex in Jennings
Average Earnings in Jennings are $27,492, $25,241 for men and $30,128 for women, a difference of 16.2%.
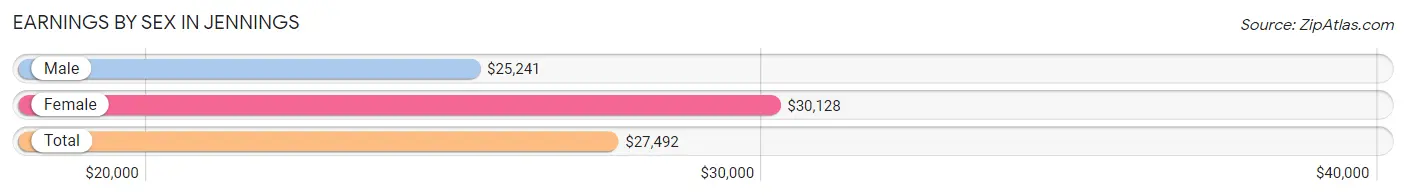
| Sex | Number | Average Earnings |
| Male | 2,371 (41.2%) | $25,241 |
| Female | 3,388 (58.8%) | $30,128 |
| Total | 5,759 (100.0%) | $27,492 |
Earnings by Sex by Income Bracket in Jennings
The most common earnings brackets in Jennings are $2,499 or less for men (324 | 13.7%) and $40,000 to $44,999 for women (411 | 12.1%).
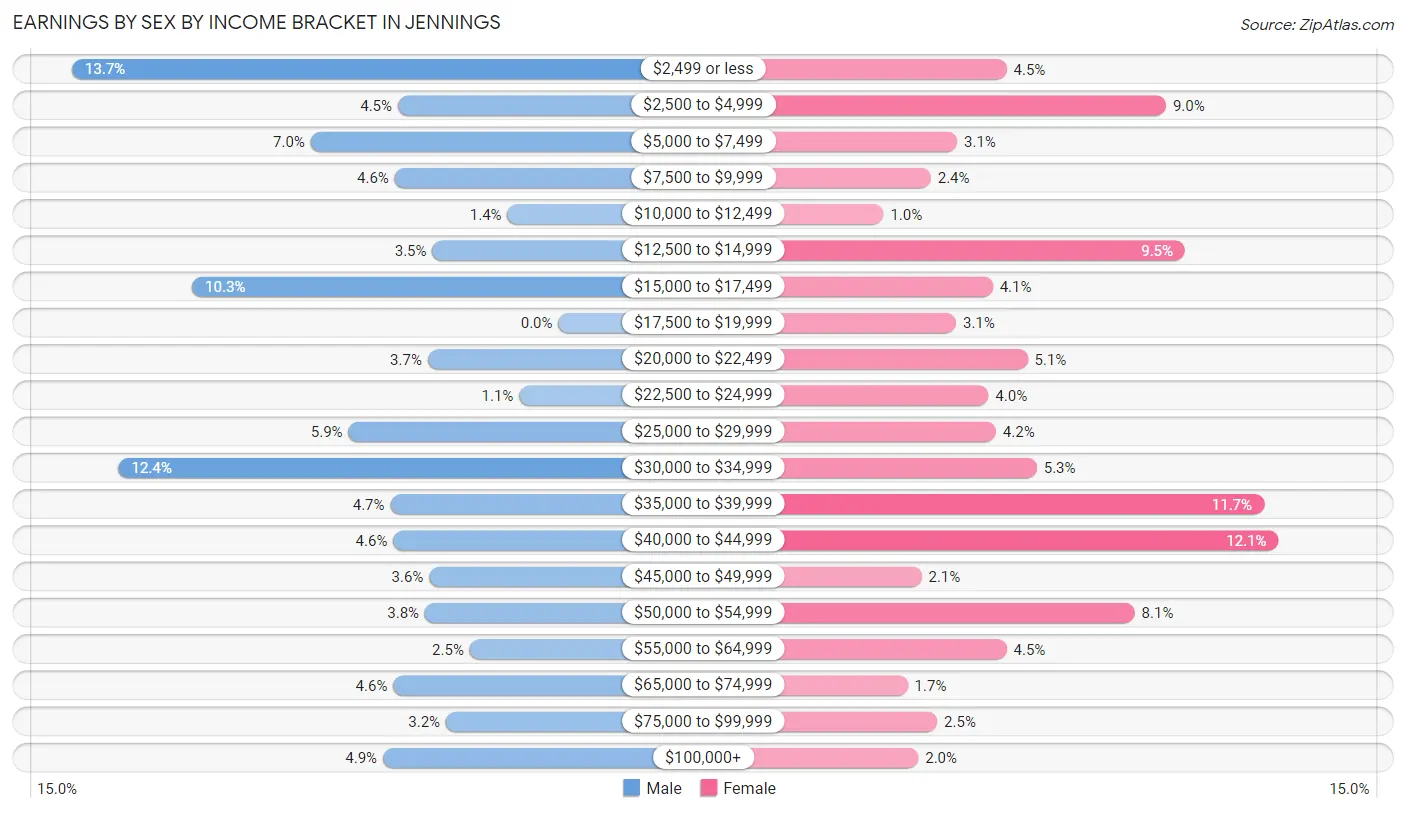
| Income | Male | Female |
| $2,499 or less | 324 (13.7%) | 152 (4.5%) |
| $2,500 to $4,999 | 107 (4.5%) | 304 (9.0%) |
| $5,000 to $7,499 | 165 (7.0%) | 105 (3.1%) |
| $7,500 to $9,999 | 109 (4.6%) | 80 (2.4%) |
| $10,000 to $12,499 | 34 (1.4%) | 35 (1.0%) |
| $12,500 to $14,999 | 84 (3.5%) | 322 (9.5%) |
| $15,000 to $17,499 | 244 (10.3%) | 139 (4.1%) |
| $17,500 to $19,999 | 0 (0.0%) | 104 (3.1%) |
| $20,000 to $22,499 | 87 (3.7%) | 172 (5.1%) |
| $22,500 to $24,999 | 26 (1.1%) | 135 (4.0%) |
| $25,000 to $29,999 | 140 (5.9%) | 142 (4.2%) |
| $30,000 to $34,999 | 293 (12.4%) | 181 (5.3%) |
| $35,000 to $39,999 | 112 (4.7%) | 397 (11.7%) |
| $40,000 to $44,999 | 110 (4.6%) | 411 (12.1%) |
| $45,000 to $49,999 | 86 (3.6%) | 71 (2.1%) |
| $50,000 to $54,999 | 89 (3.7%) | 274 (8.1%) |
| $55,000 to $64,999 | 59 (2.5%) | 152 (4.5%) |
| $65,000 to $74,999 | 110 (4.6%) | 58 (1.7%) |
| $75,000 to $99,999 | 75 (3.2%) | 86 (2.5%) |
| $100,000+ | 117 (4.9%) | 68 (2.0%) |
| Total | 2,371 (100.0%) | 3,388 (100.0%) |
Earnings by Sex by Educational Attainment in Jennings
Average earnings in Jennings are $30,339 for men and $35,727 for women, a difference of 15.1%. Men with an educational attainment of bachelor's degree enjoy the highest average annual earnings of $70,750, while those with college or associate's degree education earn the least with $22,386. Women with an educational attainment of graduate degree earn the most with the average annual earnings of $67,639, while those with less than high school education have the smallest earnings of $26,045.
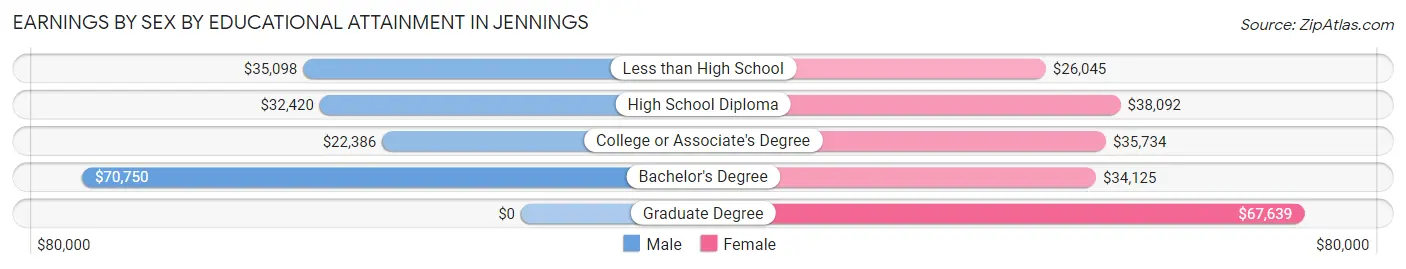
| Educational Attainment | Male Income | Female Income |
| Less than High School | $35,098 | $26,045 |
| High School Diploma | $32,420 | $38,092 |
| College or Associate's Degree | $22,386 | $35,734 |
| Bachelor's Degree | $70,750 | $34,125 |
| Graduate Degree | - | - |
| Total | $30,339 | $35,727 |
Family Income in Jennings
Family Income Brackets in Jennings
According to the Jennings family income data, there are 657 families falling into the $50,000 to $74,999 income range, which is the most common income bracket and makes up 22.6% of all families. Conversely, the $200,000+ income bracket is the least frequent group with only 44 families (1.5%) belonging to this category.
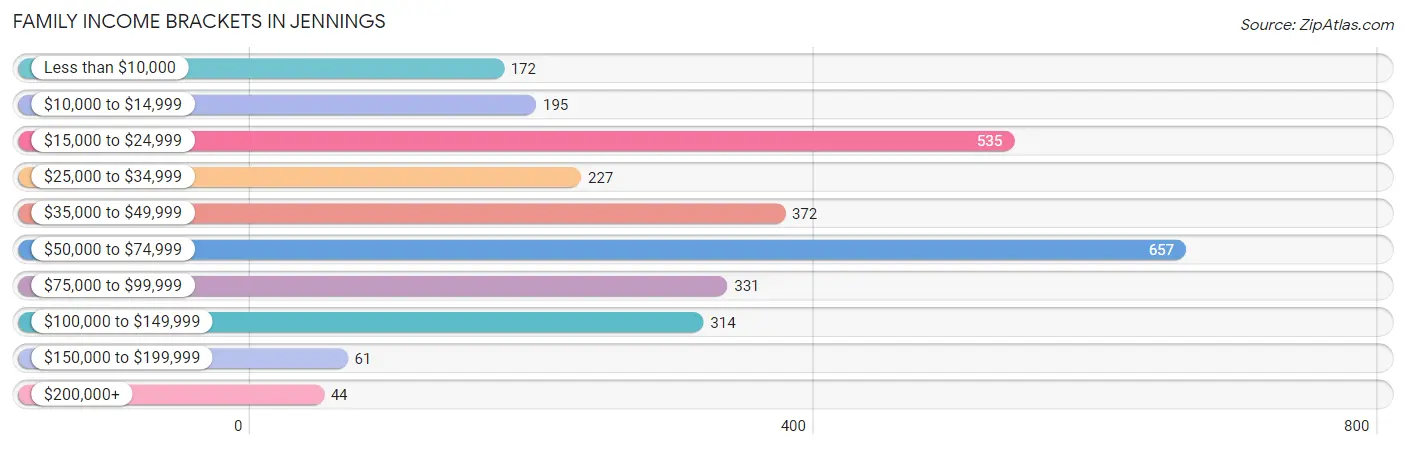
| Income Bracket | # Families | % Families |
| Less than $10,000 | 172 | 5.9% |
| $10,000 to $14,999 | 195 | 6.7% |
| $15,000 to $24,999 | 535 | 18.4% |
| $25,000 to $34,999 | 227 | 7.8% |
| $35,000 to $49,999 | 372 | 12.8% |
| $50,000 to $74,999 | 657 | 22.6% |
| $75,000 to $99,999 | 331 | 11.4% |
| $100,000 to $149,999 | 314 | 10.8% |
| $150,000 to $199,999 | 61 | 2.1% |
| $200,000+ | 44 | 1.5% |
Family Income by Famaliy Size in Jennings
5-person families (260 | 8.9%) account for the highest median family income in Jennings with $74,028 per family, while 2-person families (1,151 | 39.6%) have the highest median income of $20,746 per family member.
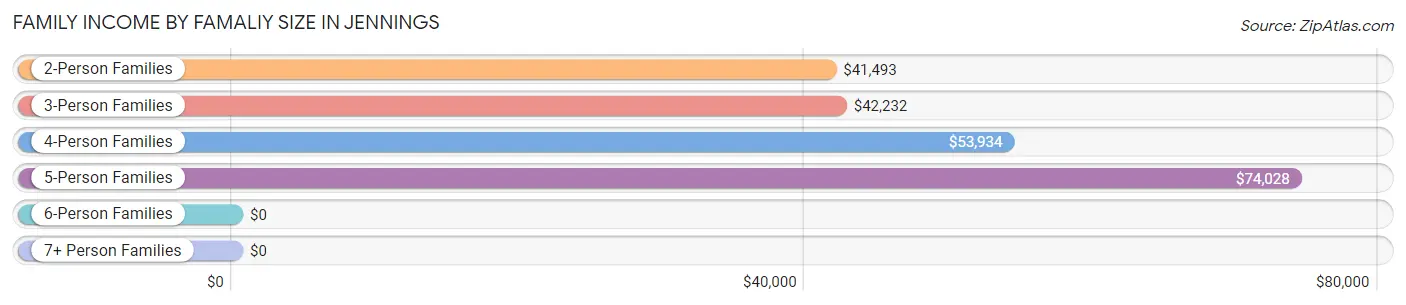
| Income Bracket | # Families | Median Income |
| 2-Person Families | 1,151 (39.6%) | $41,493 |
| 3-Person Families | 1,116 (38.4%) | $42,232 |
| 4-Person Families | 356 (12.2%) | $53,934 |
| 5-Person Families | 260 (8.9%) | $74,028 |
| 6-Person Families | 0 (0.0%) | $0 |
| 7+ Person Families | 24 (0.8%) | $0 |
| Total | 2,907 (100.0%) | $45,240 |
Family Income by Number of Earners in Jennings
The median family income in Jennings is $45,240, with families comprising 2 earners (690) having the highest median family income of $74,375, while families with no earners (590) have the lowest median family income of $21,614, accounting for 23.7% and 20.3% of families, respectively.
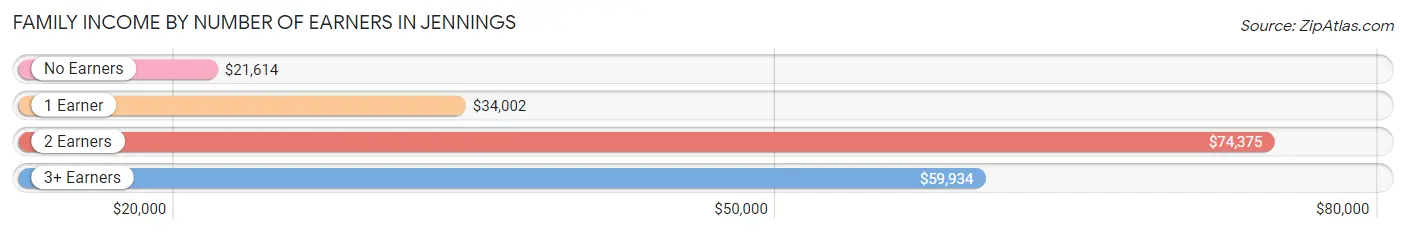
| Number of Earners | # Families | Median Income |
| No Earners | 590 (20.3%) | $21,614 |
| 1 Earner | 1,331 (45.8%) | $34,002 |
| 2 Earners | 690 (23.7%) | $74,375 |
| 3+ Earners | 296 (10.2%) | $59,934 |
| Total | 2,907 (100.0%) | $45,240 |
Household Income in Jennings
Household Income Brackets in Jennings
With 1,054 households falling in the category, the $50,000 to $74,999 income range is the most frequent in Jennings, accounting for 17.6% of all households. In contrast, only 48 households (0.8%) fall into the $200,000+ income bracket, making it the least populous group.
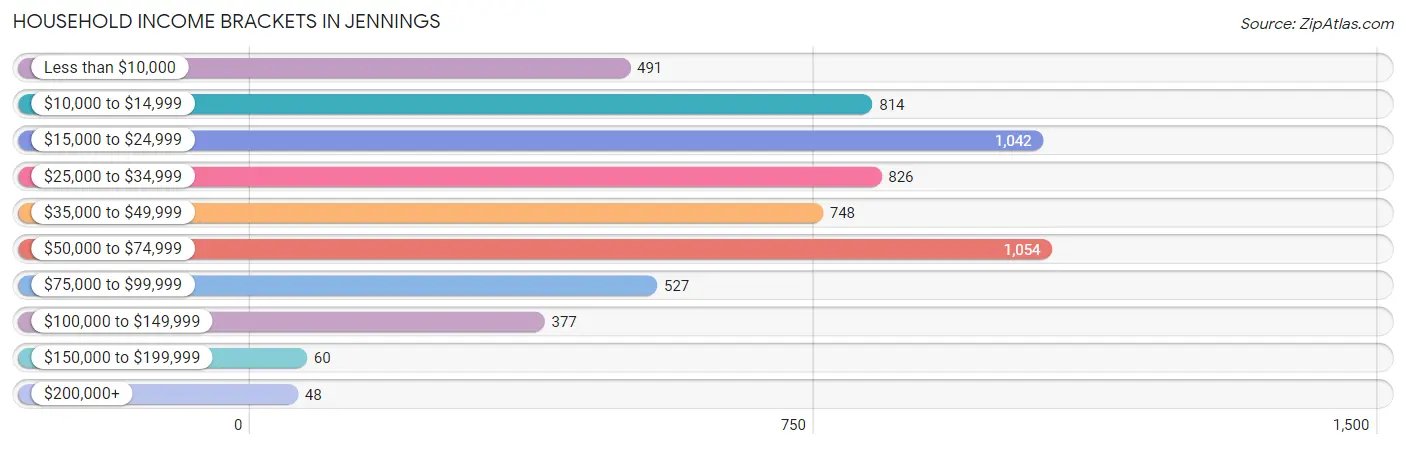
| Income Bracket | # Households | % Households |
| Less than $10,000 | 491 | 8.2% |
| $10,000 to $14,999 | 814 | 13.6% |
| $15,000 to $24,999 | 1,042 | 17.4% |
| $25,000 to $34,999 | 826 | 13.8% |
| $35,000 to $49,999 | 748 | 12.5% |
| $50,000 to $74,999 | 1,054 | 17.6% |
| $75,000 to $99,999 | 527 | 8.8% |
| $100,000 to $149,999 | 377 | 6.3% |
| $150,000 to $199,999 | 60 | 1.0% |
| $200,000+ | 48 | 0.8% |
Household Income by Householder Age in Jennings
The median household income in Jennings is $32,462, with the highest median household income of $41,287 found in the 25 to 44 years age bracket for the primary householder. A total of 1,651 households (27.6%) fall into this category. Meanwhile, the 15 to 24 years age bracket for the primary householder has the lowest median household income of $0, with 128 households (2.1%) in this group.
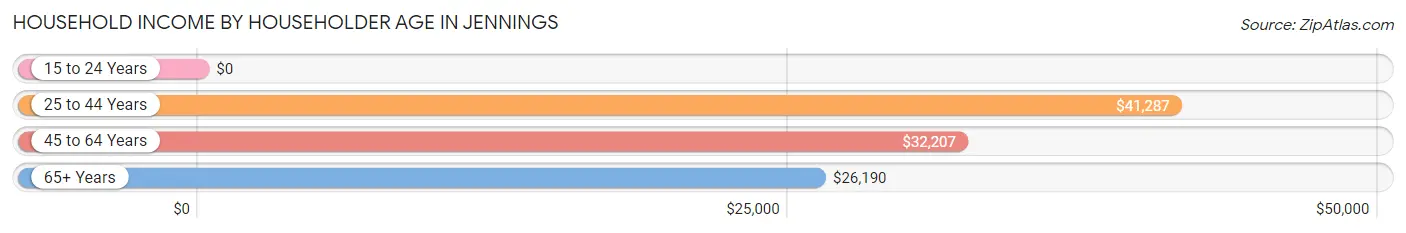
| Income Bracket | # Households | Median Income |
| 15 to 24 Years | 128 (2.1%) | $0 |
| 25 to 44 Years | 1,651 (27.6%) | $41,287 |
| 45 to 64 Years | 2,543 (42.5%) | $32,207 |
| 65+ Years | 1,666 (27.8%) | $26,190 |
| Total | 5,988 (100.0%) | $32,462 |
Poverty in Jennings
Income Below Poverty by Sex and Age in Jennings
With 23.7% poverty level for males and 33.7% for females among the residents of Jennings, 5 year old males and 5 year old females are the most vulnerable to poverty, with 89 males (100.0%) and 136 females (86.1%) in their respective age groups living below the poverty level.
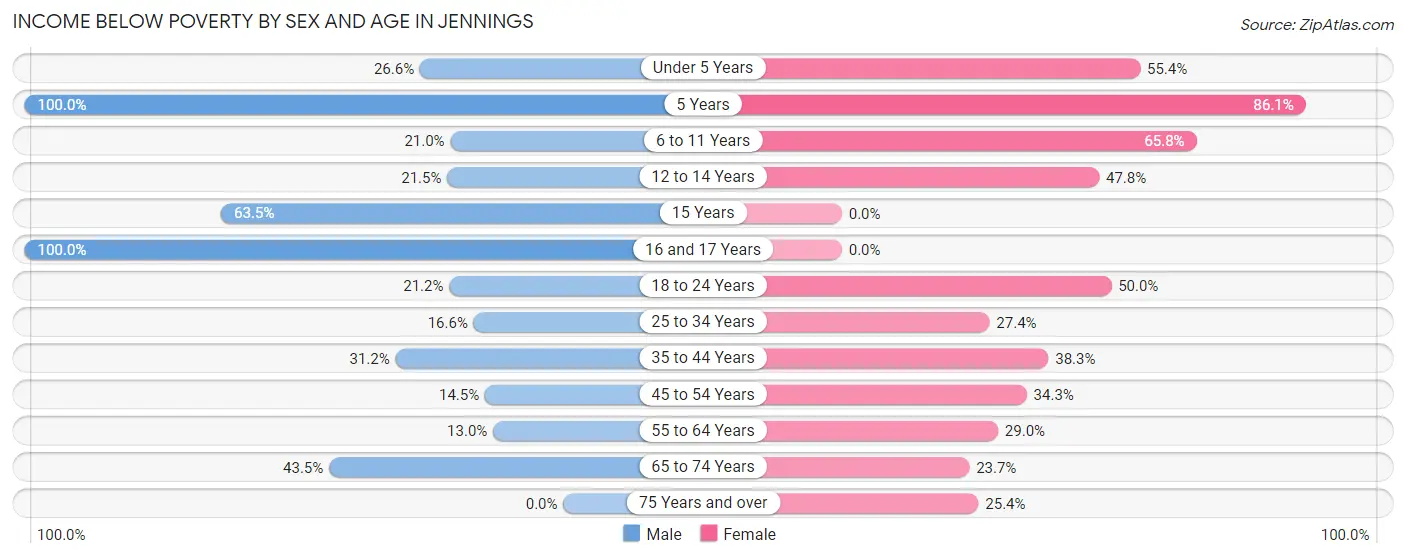
| Age Bracket | Male | Female |
| Under 5 Years | 91 (26.6%) | 186 (55.4%) |
| 5 Years | 89 (100.0%) | 136 (86.1%) |
| 6 to 11 Years | 70 (21.0%) | 233 (65.8%) |
| 12 to 14 Years | 42 (21.5%) | 170 (47.7%) |
| 15 Years | 54 (63.5%) | 0 (0.0%) |
| 16 and 17 Years | 34 (100.0%) | 0 (0.0%) |
| 18 to 24 Years | 94 (21.2%) | 185 (50.0%) |
| 25 to 34 Years | 167 (16.6%) | 300 (27.4%) |
| 35 to 44 Years | 204 (31.1%) | 230 (38.3%) |
| 45 to 54 Years | 76 (14.5%) | 339 (34.3%) |
| 55 to 64 Years | 110 (13.0%) | 397 (29.0%) |
| 65 to 74 Years | 220 (43.5%) | 175 (23.6%) |
| 75 Years and over | 0 (0.0%) | 237 (25.4%) |
| Total | 1,251 (23.7%) | 2,588 (33.7%) |
Income Above Poverty by Sex and Age in Jennings
According to the poverty statistics in Jennings, males aged 75 years and over and females aged 15 years are the age groups that are most secure financially, with 100.0% of males and 100.0% of females in these age groups living above the poverty line.
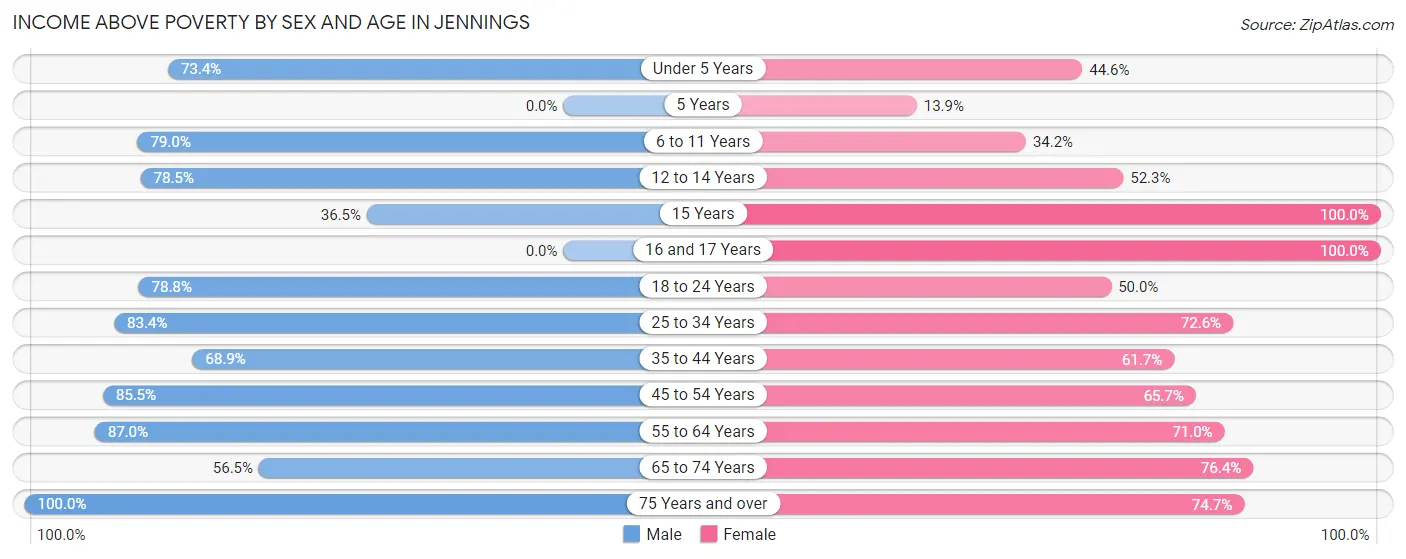
| Age Bracket | Male | Female |
| Under 5 Years | 251 (73.4%) | 150 (44.6%) |
| 5 Years | 0 (0.0%) | 22 (13.9%) |
| 6 to 11 Years | 264 (79.0%) | 121 (34.2%) |
| 12 to 14 Years | 153 (78.5%) | 186 (52.2%) |
| 15 Years | 31 (36.5%) | 91 (100.0%) |
| 16 and 17 Years | 0 (0.0%) | 289 (100.0%) |
| 18 to 24 Years | 350 (78.8%) | 185 (50.0%) |
| 25 to 34 Years | 837 (83.4%) | 795 (72.6%) |
| 35 to 44 Years | 451 (68.9%) | 370 (61.7%) |
| 45 to 54 Years | 447 (85.5%) | 649 (65.7%) |
| 55 to 64 Years | 734 (87.0%) | 973 (71.0%) |
| 65 to 74 Years | 286 (56.5%) | 565 (76.3%) |
| 75 Years and over | 226 (100.0%) | 698 (74.7%) |
| Total | 4,030 (76.3%) | 5,094 (66.3%) |
Income Below Poverty Among Married-Couple Families in Jennings
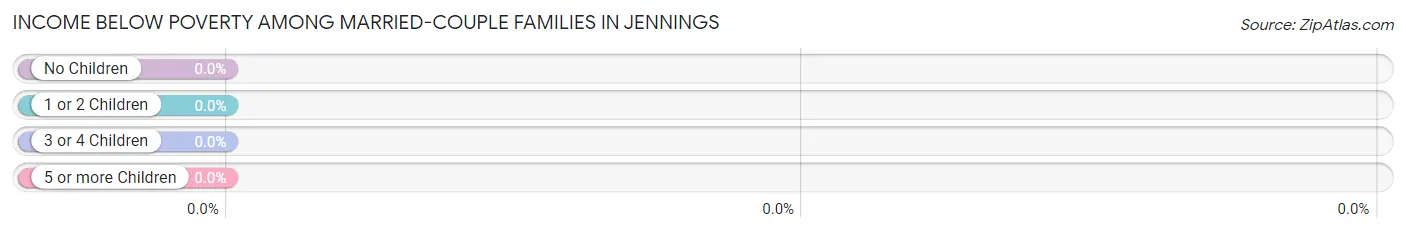
| Children | Above Poverty | Below Poverty |
| No Children | 630 (100.0%) | 0 (0.0%) |
| 1 or 2 Children | 221 (100.0%) | 0 (0.0%) |
| 3 or 4 Children | 55 (100.0%) | 0 (0.0%) |
| 5 or more Children | 0 (0.0%) | 0 (0.0%) |
| Total | 906 (100.0%) | 0 (0.0%) |
Income Below Poverty Among Single-Parent Households in Jennings
According to the poverty data in Jennings, 36.1% or 150 single-father households and 41.5% or 658 single-mother households are living below the poverty line. Among single-father households, those with 1 or 2 children have the highest poverty rate, with 85 households (36.8%) experiencing poverty. Likewise, among single-mother households, those with 3 or 4 children have the highest poverty rate, with 78 households (69.0%) falling below the poverty line.
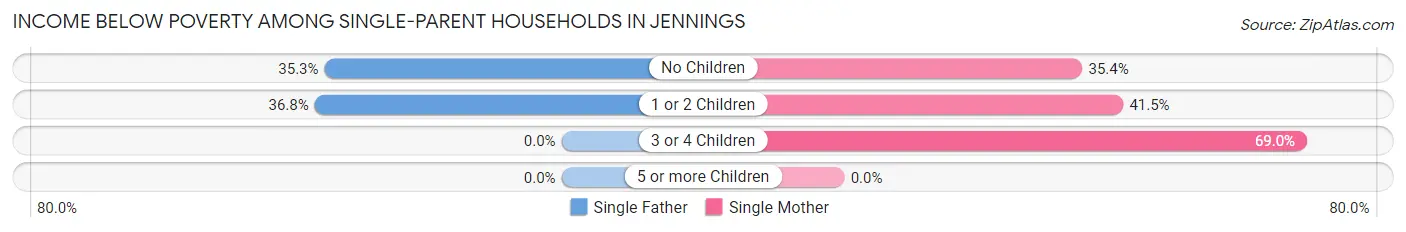
| Children | Single Father | Single Mother |
| No Children | 65 (35.3%) | 185 (35.4%) |
| 1 or 2 Children | 85 (36.8%) | 395 (41.5%) |
| 3 or 4 Children | 0 (0.0%) | 78 (69.0%) |
| 5 or more Children | 0 (0.0%) | 0 (0.0%) |
| Total | 150 (36.1%) | 658 (41.5%) |
Income Below Poverty Among Married-Couple vs Single-Parent Households in Jennings
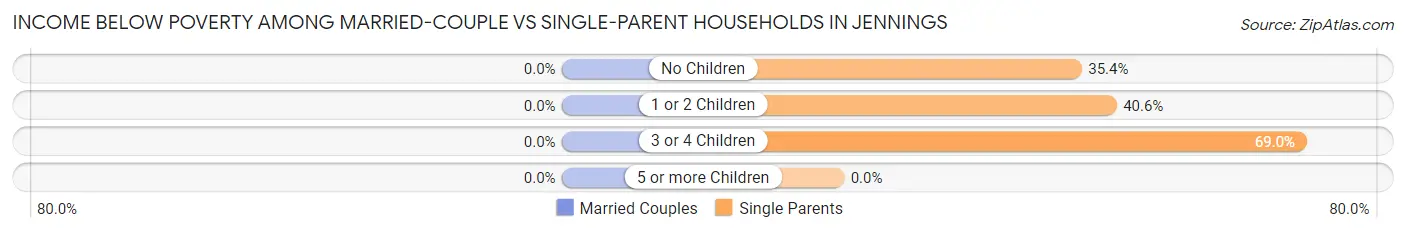
| Children | Married-Couple Families | Single-Parent Households |
| No Children | 0 (0.0%) | 250 (35.4%) |
| 1 or 2 Children | 0 (0.0%) | 480 (40.6%) |
| 3 or 4 Children | 0 (0.0%) | 78 (69.0%) |
| 5 or more Children | 0 (0.0%) | 0 (0.0%) |
| Total | 0 (0.0%) | 808 (40.4%) |
Race in Jennings
The most populous races in Jennings are Black / African American (11,566 | 89.0%), White / Caucasian (861 | 6.6%), and Two or more Races (468 | 3.6%).
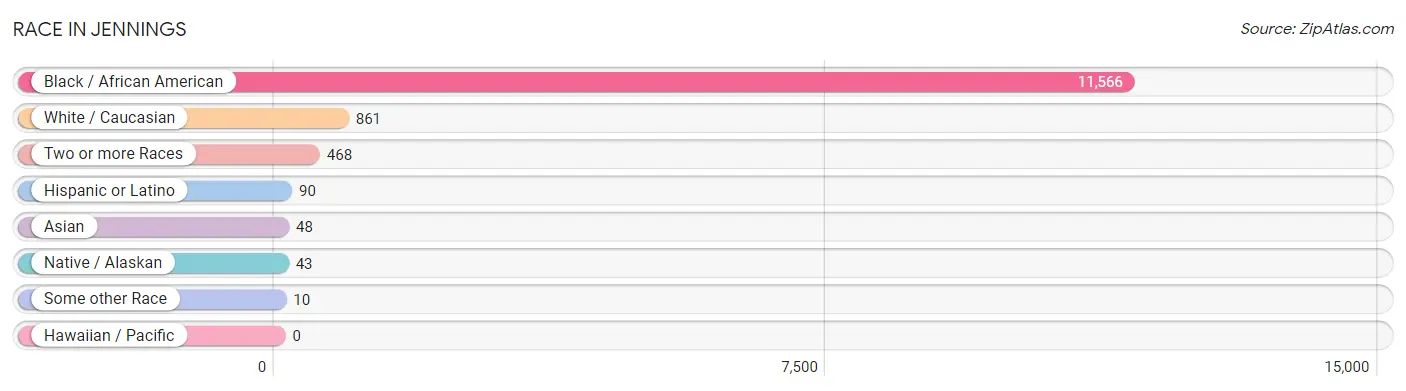
| Race | # Population | % Population |
| Asian | 48 | 0.4% |
| Black / African American | 11,566 | 89.0% |
| Hawaiian / Pacific | 0 | 0.0% |
| Hispanic or Latino | 90 | 0.7% |
| Native / Alaskan | 43 | 0.3% |
| White / Caucasian | 861 | 6.6% |
| Two or more Races | 468 | 3.6% |
| Some other Race | 10 | 0.1% |
| Total | 12,996 | 100.0% |
Ancestry in Jennings
The most populous ancestries reported in Jennings are American (445 | 3.4%), German (265 | 2.0%), Subsaharan African (220 | 1.7%), Indian (Asian) (169 | 1.3%), and Native Hawaiian (169 | 1.3%), together accounting for 9.8% of all Jennings residents.
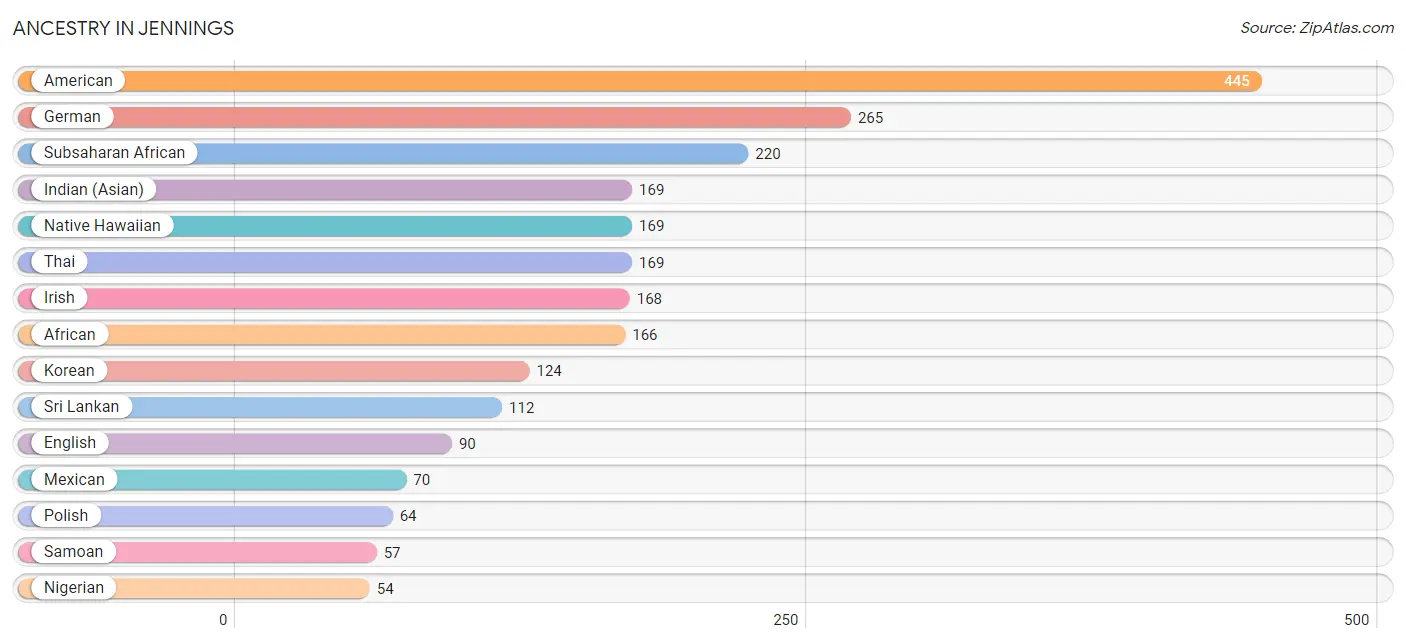
| Ancestry | # Population | % Population |
| African | 166 | 1.3% |
| American | 445 | 3.4% |
| Arab | 36 | 0.3% |
| British | 53 | 0.4% |
| Chippewa | 43 | 0.3% |
| Croatian | 9 | 0.1% |
| Cuban | 10 | 0.1% |
| Dutch | 49 | 0.4% |
| English | 90 | 0.7% |
| European | 44 | 0.3% |
| French | 51 | 0.4% |
| German | 265 | 2.0% |
| Indian (Asian) | 169 | 1.3% |
| Irish | 168 | 1.3% |
| Italian | 20 | 0.2% |
| Jamaican | 33 | 0.3% |
| Korean | 124 | 0.9% |
| Mexican | 70 | 0.5% |
| Moroccan | 36 | 0.3% |
| Native Hawaiian | 169 | 1.3% |
| Nigerian | 54 | 0.4% |
| Polish | 64 | 0.5% |
| Samoan | 57 | 0.4% |
| Spaniard | 10 | 0.1% |
| Sri Lankan | 112 | 0.9% |
| Subsaharan African | 220 | 1.7% |
| Swiss | 10 | 0.1% |
| Thai | 169 | 1.3% | View All 28 Rows |
Immigrants in Jennings
The most numerous immigrant groups reported in Jennings came from Africa (83 | 0.6%), Western Africa (83 | 0.6%), Latin America (59 | 0.4%), Nigeria (54 | 0.4%), and Caribbean (33 | 0.3%), together accounting for 2.4% of all Jennings residents.
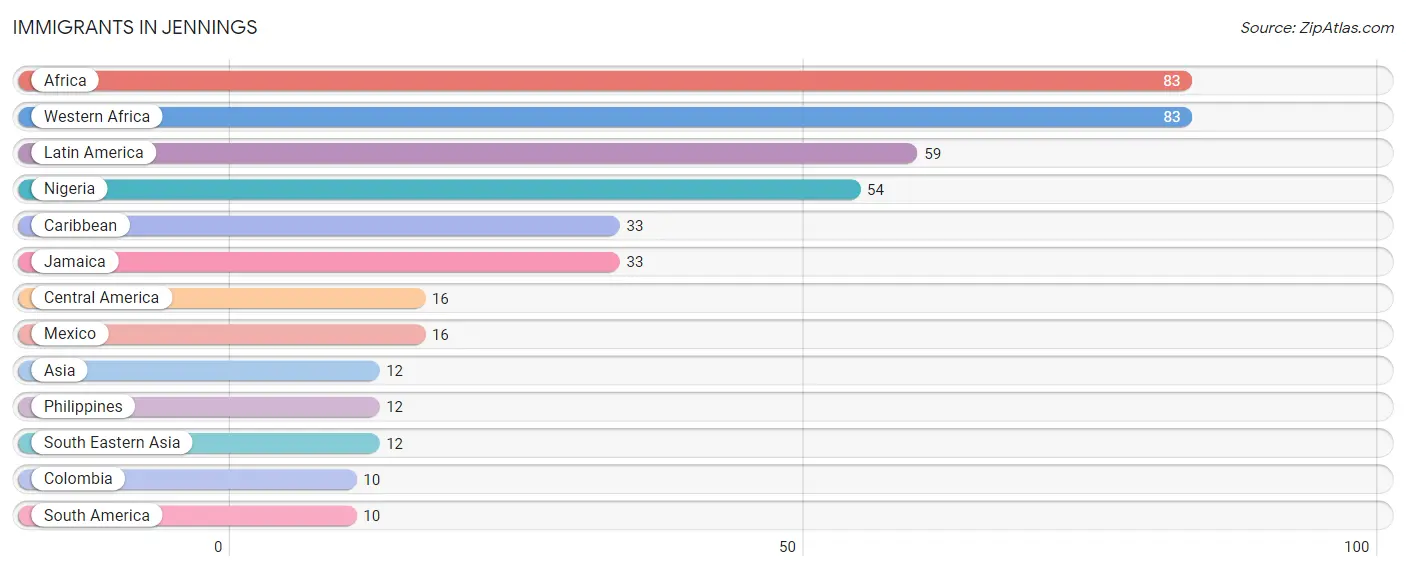
| Immigration Origin | # Population | % Population |
| Africa | 83 | 0.6% |
| Asia | 12 | 0.1% |
| Caribbean | 33 | 0.3% |
| Central America | 16 | 0.1% |
| Colombia | 10 | 0.1% |
| Jamaica | 33 | 0.3% |
| Latin America | 59 | 0.4% |
| Mexico | 16 | 0.1% |
| Nigeria | 54 | 0.4% |
| Philippines | 12 | 0.1% |
| South America | 10 | 0.1% |
| South Eastern Asia | 12 | 0.1% |
| Western Africa | 83 | 0.6% | View All 13 Rows |
Sex and Age in Jennings
Sex and Age in Jennings
The most populous age groups in Jennings are 60 to 64 Years (658 | 12.4%) for men and 60 to 64 Years (844 | 11.0%) for women.
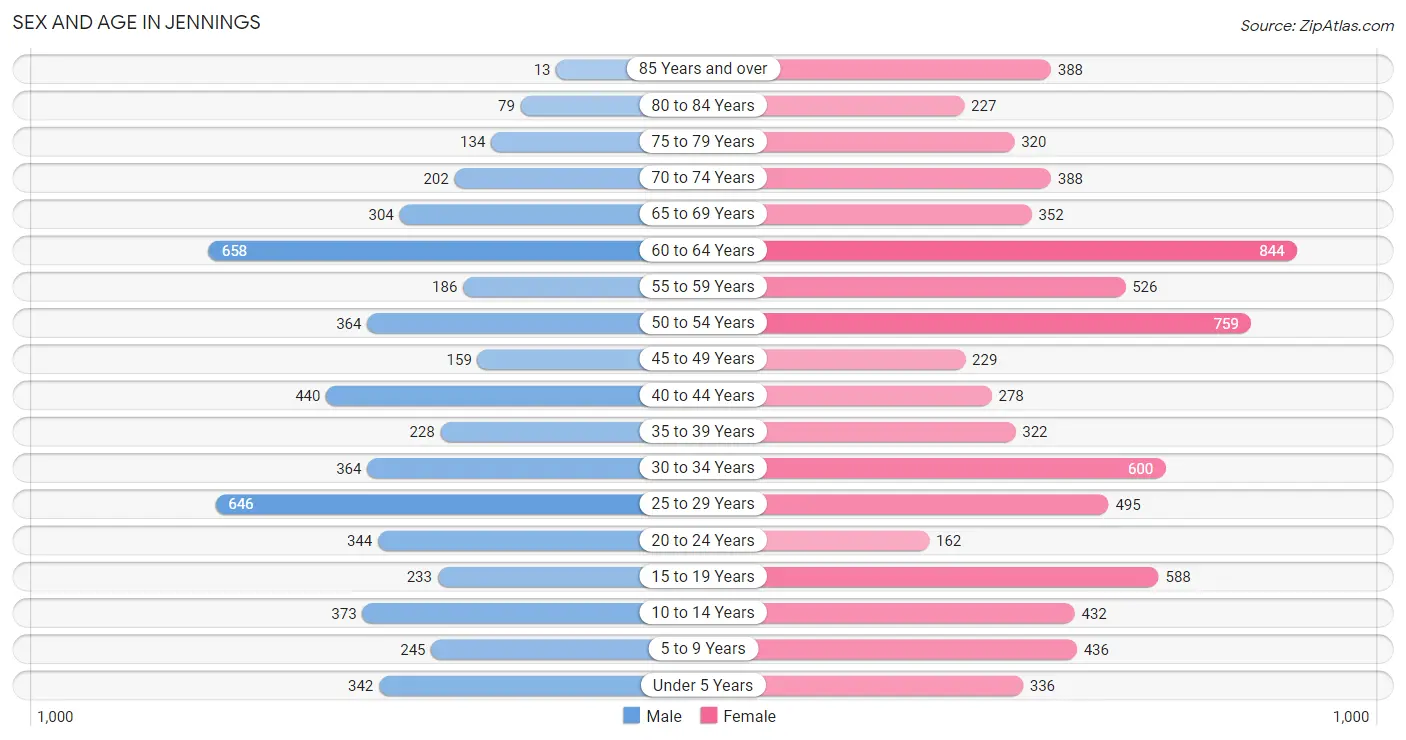
| Age Bracket | Male | Female |
| Under 5 Years | 342 (6.4%) | 336 (4.4%) |
| 5 to 9 Years | 245 (4.6%) | 436 (5.7%) |
| 10 to 14 Years | 373 (7.0%) | 432 (5.6%) |
| 15 to 19 Years | 233 (4.4%) | 588 (7.6%) |
| 20 to 24 Years | 344 (6.5%) | 162 (2.1%) |
| 25 to 29 Years | 646 (12.2%) | 495 (6.4%) |
| 30 to 34 Years | 364 (6.9%) | 600 (7.8%) |
| 35 to 39 Years | 228 (4.3%) | 322 (4.2%) |
| 40 to 44 Years | 440 (8.3%) | 278 (3.6%) |
| 45 to 49 Years | 159 (3.0%) | 229 (3.0%) |
| 50 to 54 Years | 364 (6.9%) | 759 (9.9%) |
| 55 to 59 Years | 186 (3.5%) | 526 (6.9%) |
| 60 to 64 Years | 658 (12.4%) | 844 (11.0%) |
| 65 to 69 Years | 304 (5.7%) | 352 (4.6%) |
| 70 to 74 Years | 202 (3.8%) | 388 (5.1%) |
| 75 to 79 Years | 134 (2.5%) | 320 (4.2%) |
| 80 to 84 Years | 79 (1.5%) | 227 (2.9%) |
| 85 Years and over | 13 (0.2%) | 388 (5.1%) |
| Total | 5,314 (100.0%) | 7,682 (100.0%) |
Families and Households in Jennings
Median Family Size in Jennings
The median family size in Jennings is 3.20 persons per family, with single female/mother families (1,586 | 54.6%) accounting for the largest median family size of 3.48 persons per family. On the other hand, single male/father families (415 | 14.3%) represent the smallest median family size with 2.33 persons per family.
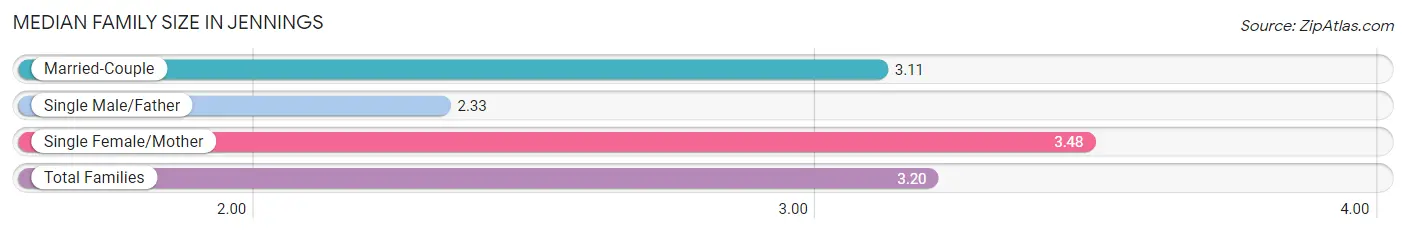
| Family Type | # Families | Family Size |
| Married-Couple | 906 (31.2%) | 3.11 |
| Single Male/Father | 415 (14.3%) | 2.33 |
| Single Female/Mother | 1,586 (54.6%) | 3.48 |
| Total Families | 2,907 (100.0%) | 3.20 |
Median Household Size in Jennings
The median household size in Jennings is 2.16 persons per household, with single female/mother households (1,586 | 26.5%) accounting for the largest median household size of 3.6 persons per household. non-family households (3,081 | 51.4%) represent the smallest median household size with 1.09 persons per household.
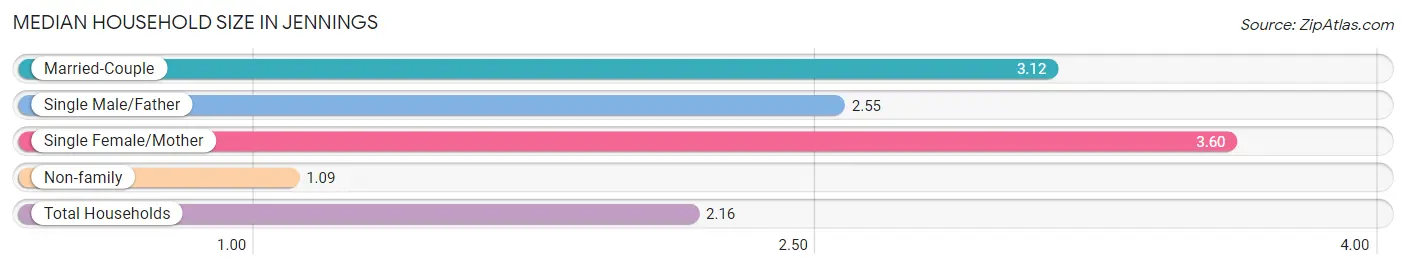
| Household Type | # Households | Household Size |
| Married-Couple | 906 (15.1%) | 3.12 |
| Single Male/Father | 415 (6.9%) | 2.55 |
| Single Female/Mother | 1,586 (26.5%) | 3.60 |
| Non-family | 3,081 (51.4%) | 1.09 |
| Total Households | 5,988 (100.0%) | 2.16 |
Household Size by Marriage Status in Jennings
Out of a total of 5,988 households in Jennings, 2,907 (48.5%) are family households, while 3,081 (51.4%) are nonfamily households. The most numerous type of family households are 2-person households, comprising 1,044, and the most common type of nonfamily households are 1-person households, comprising 2,798.
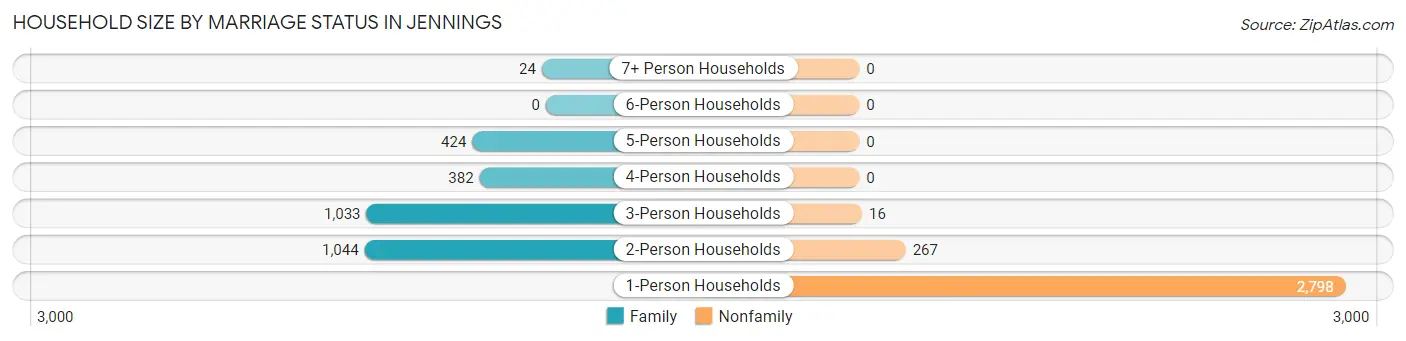
| Household Size | Family Households | Nonfamily Households |
| 1-Person Households | - | 2,798 (46.7%) |
| 2-Person Households | 1,044 (17.4%) | 267 (4.5%) |
| 3-Person Households | 1,033 (17.2%) | 16 (0.3%) |
| 4-Person Households | 382 (6.4%) | 0 (0.0%) |
| 5-Person Households | 424 (7.1%) | 0 (0.0%) |
| 6-Person Households | 0 (0.0%) | 0 (0.0%) |
| 7+ Person Households | 24 (0.4%) | 0 (0.0%) |
| Total | 2,907 (48.5%) | 3,081 (51.4%) |
Female Fertility in Jennings
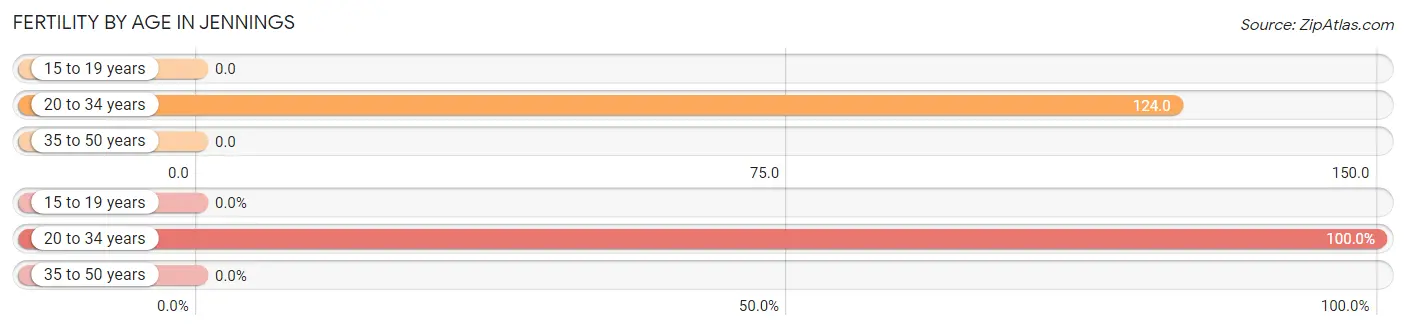
Fertility by Age in Jennings
Average fertility rate in Jennings is 54.0 births per 1,000 women. Women in the age bracket of 20 to 34 years have the highest fertility rate with 124.0 births per 1,000 women. Women in the age bracket of 20 to 34 years acount for 100.0% of all women with births.
| Age Bracket | Women with Births | Births / 1,000 Women |
| 15 to 19 years | 0 (0.0%) | 0.0 |
| 20 to 34 years | 156 (100.0%) | 124.0 |
| 35 to 50 years | 0 (0.0%) | 0.0 |
| Total | 156 (100.0%) | 54.0 |
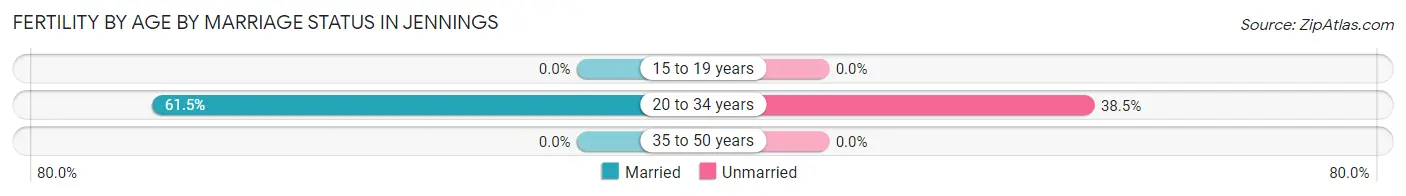
Fertility by Age by Marriage Status in Jennings
61.5% of women with births (156) in Jennings are married. The highest percentage of unmarried women with births falls into 20 to 34 years age bracket with 38.5% of them unmarried at the time of birth, while the lowest percentage of unmarried women with births belong to 20 to 34 years age bracket with 38.5% of them unmarried.
| Age Bracket | Married | Unmarried |
| 15 to 19 years | 0 (0.0%) | 0 (0.0%) |
| 20 to 34 years | 96 (61.5%) | 60 (38.5%) |
| 35 to 50 years | 0 (0.0%) | 0 (0.0%) |
| Total | 96 (61.5%) | 60 (38.5%) |
Fertility by Education in Jennings
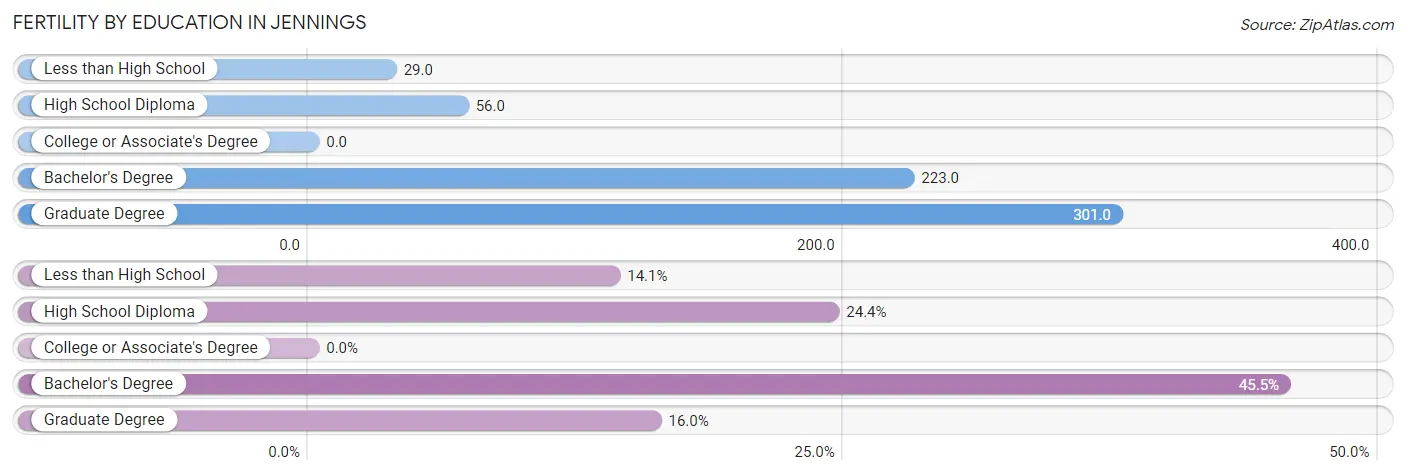
| Educational Attainment | Women with Births | Births / 1,000 Women |
| Less than High School | 22 (14.1%) | 29.0 |
| High School Diploma | 38 (24.4%) | 56.0 |
| College or Associate's Degree | 0 (0.0%) | 0.0 |
| Bachelor's Degree | 71 (45.5%) | 223.0 |
| Graduate Degree | 25 (16.0%) | 301.0 |
| Total | 156 (100.0%) | 54.0 |
Fertility by Education by Marriage Status in Jennings
38.5% of women with births in Jennings are unmarried. Women with the educational attainment of bachelor's degree are most likely to be married with 100.0% of them married at childbirth, while women with the educational attainment of less than high school are least likely to be married with 100.0% of them unmarried at childbirth.
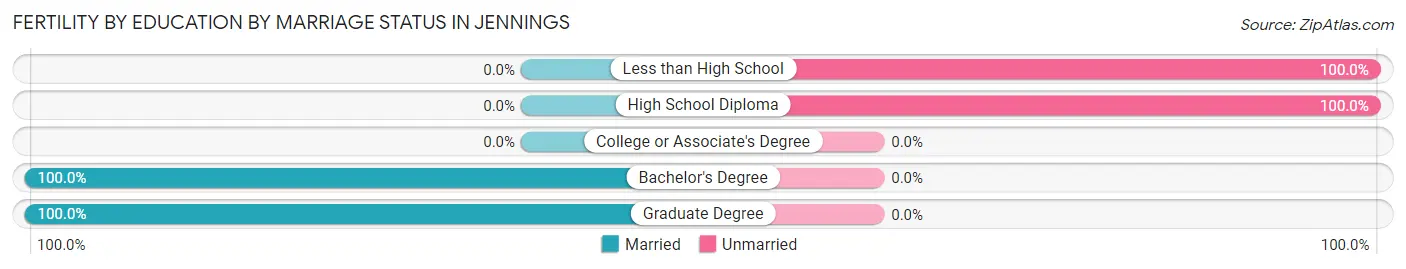
| Educational Attainment | Married | Unmarried |
| Less than High School | 0 (0.0%) | 22 (100.0%) |
| High School Diploma | 0 (0.0%) | 38 (100.0%) |
| College or Associate's Degree | 0 (0.0%) | 0 (0.0%) |
| Bachelor's Degree | 71 (100.0%) | 0 (0.0%) |
| Graduate Degree | 25 (100.0%) | 0 (0.0%) |
| Total | 96 (61.5%) | 60 (38.5%) |
Employment Characteristics in Jennings
Employment by Class of Employer in Jennings
Among the 5,055 employed individuals in Jennings, private company employees (3,672 | 72.6%), not-for-profit organizations (555 | 11.0%), and local government employees (306 | 6.0%) make up the most common classes of employment.
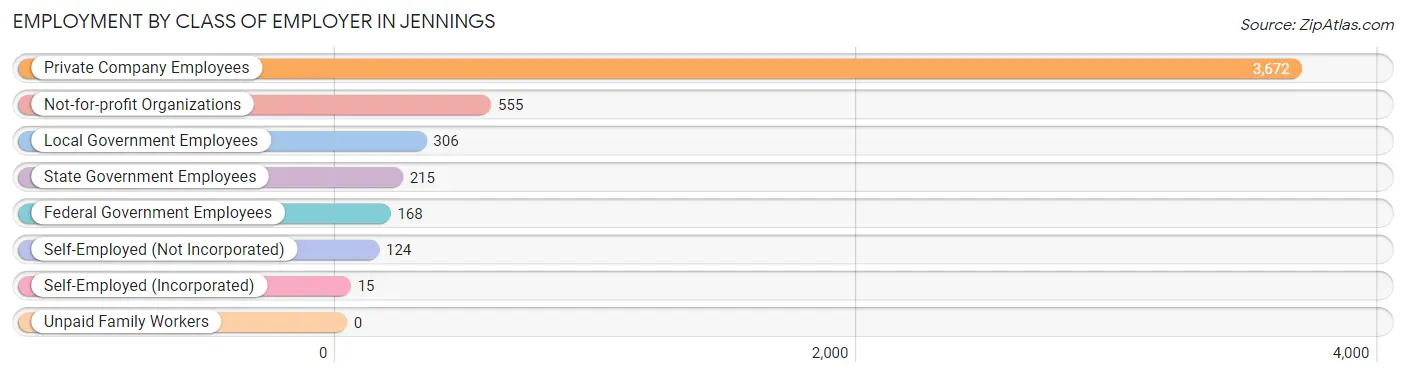
| Employer Class | # Employees | % Employees |
| Private Company Employees | 3,672 | 72.6% |
| Self-Employed (Incorporated) | 15 | 0.3% |
| Self-Employed (Not Incorporated) | 124 | 2.5% |
| Not-for-profit Organizations | 555 | 11.0% |
| Local Government Employees | 306 | 6.0% |
| State Government Employees | 215 | 4.3% |
| Federal Government Employees | 168 | 3.3% |
| Unpaid Family Workers | 0 | 0.0% |
| Total | 5,055 | 100.0% |
Employment Status by Age in Jennings
According to the labor force statistics for Jennings, out of the total population over 16 years of age (10,656), 53.4% or 5,690 individuals are in the labor force, with 10.1% or 575 of them unemployed. The age group with the highest labor force participation rate is 25 to 29 years, with 94.7% or 1,081 individuals in the labor force. Within the labor force, the 16 to 19 years age range has the highest percentage of unemployed individuals, with 23.7% or 97 of them being unemployed.
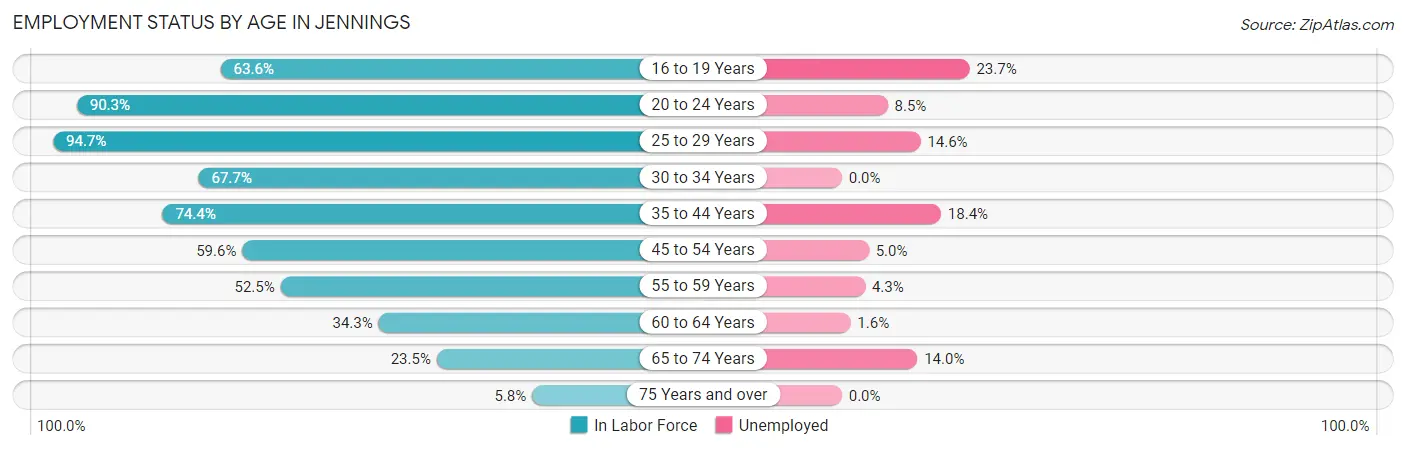
| Age Bracket | In Labor Force | Unemployed |
| 16 to 19 Years | 410 (63.6%) | 97 (23.7%) |
| 20 to 24 Years | 457 (90.3%) | 39 (8.5%) |
| 25 to 29 Years | 1,081 (94.7%) | 158 (14.6%) |
| 30 to 34 Years | 653 (67.7%) | 0 (0.0%) |
| 35 to 44 Years | 943 (74.4%) | 174 (18.4%) |
| 45 to 54 Years | 901 (59.6%) | 45 (5.0%) |
| 55 to 59 Years | 374 (52.5%) | 16 (4.3%) |
| 60 to 64 Years | 515 (34.3%) | 8 (1.6%) |
| 65 to 74 Years | 293 (23.5%) | 41 (14.0%) |
| 75 Years and over | 67 (5.8%) | 0 (0.0%) |
| Total | 5,690 (53.4%) | 575 (10.1%) |
Employment Status by Educational Attainment in Jennings
According to labor force statistics for Jennings, 62.9% of individuals (4,465) out of the total population between 25 and 64 years of age (7,098) are in the labor force, with 9.0% or 402 of them being unemployed. The group with the highest labor force participation rate are those with the educational attainment of bachelor's degree or higher, with 92.2% or 630 individuals in the labor force. Within the labor force, individuals with high school diploma education have the highest percentage of unemployment, with 13.9% or 246 of them being unemployed.
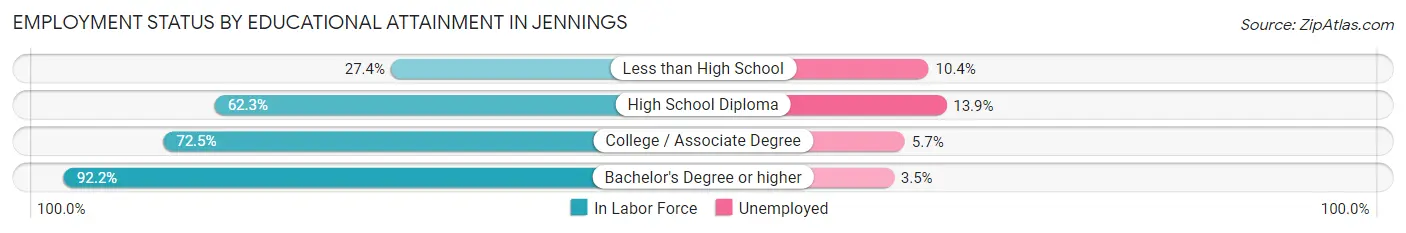
| Educational Attainment | In Labor Force | Unemployed |
| Less than High School | 316 (27.4%) | 120 (10.4%) |
| High School Diploma | 1,772 (62.3%) | 395 (13.9%) |
| College / Associate Degree | 1,751 (72.5%) | 138 (5.7%) |
| Bachelor's Degree or higher | 630 (92.2%) | 24 (3.5%) |
| Total | 4,465 (62.9%) | 639 (9.0%) |
Employment Occupations by Sex in Jennings
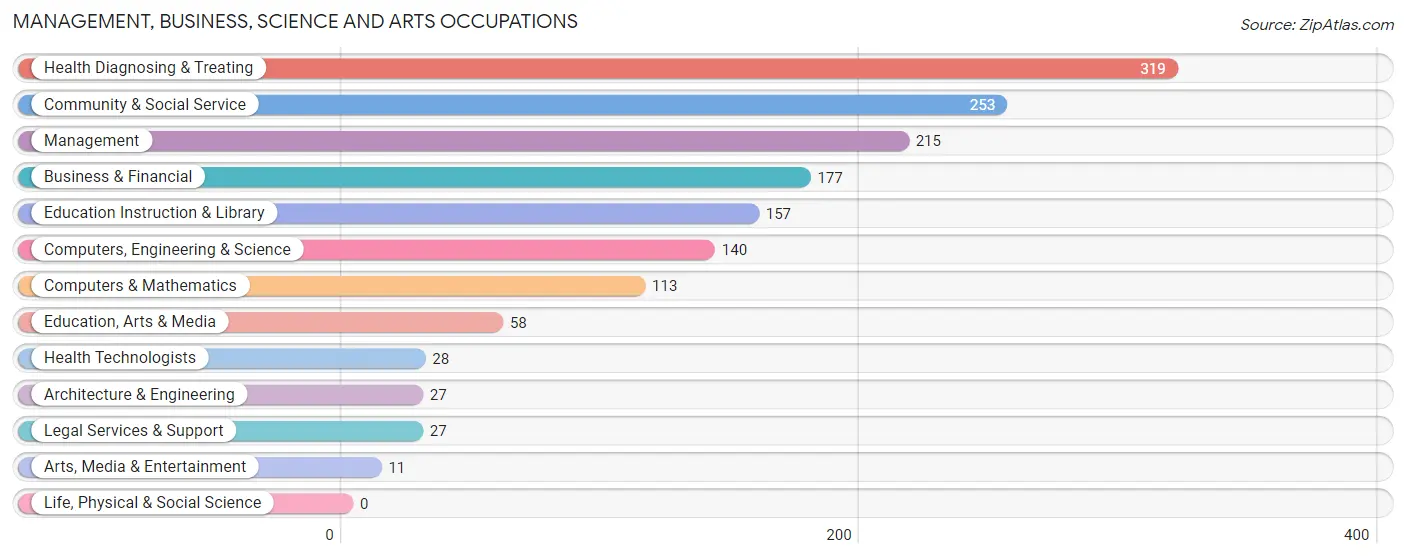
Management, Business, Science and Arts Occupations
The most common Management, Business, Science and Arts occupations in Jennings are Health Diagnosing & Treating (319 | 6.2%), Community & Social Service (253 | 4.9%), Management (215 | 4.2%), Business & Financial (177 | 3.5%), and Education Instruction & Library (157 | 3.1%).
Management, Business, Science and Arts Occupations by Sex
Within the Management, Business, Science and Arts occupations in Jennings, the most male-oriented occupations are Architecture & Engineering (100.0%), Arts, Media & Entertainment (100.0%), and Computers, Engineering & Science (40.0%), while the most female-oriented occupations are Education, Arts & Media (100.0%), Legal Services & Support (100.0%), and Health Technologists (100.0%).
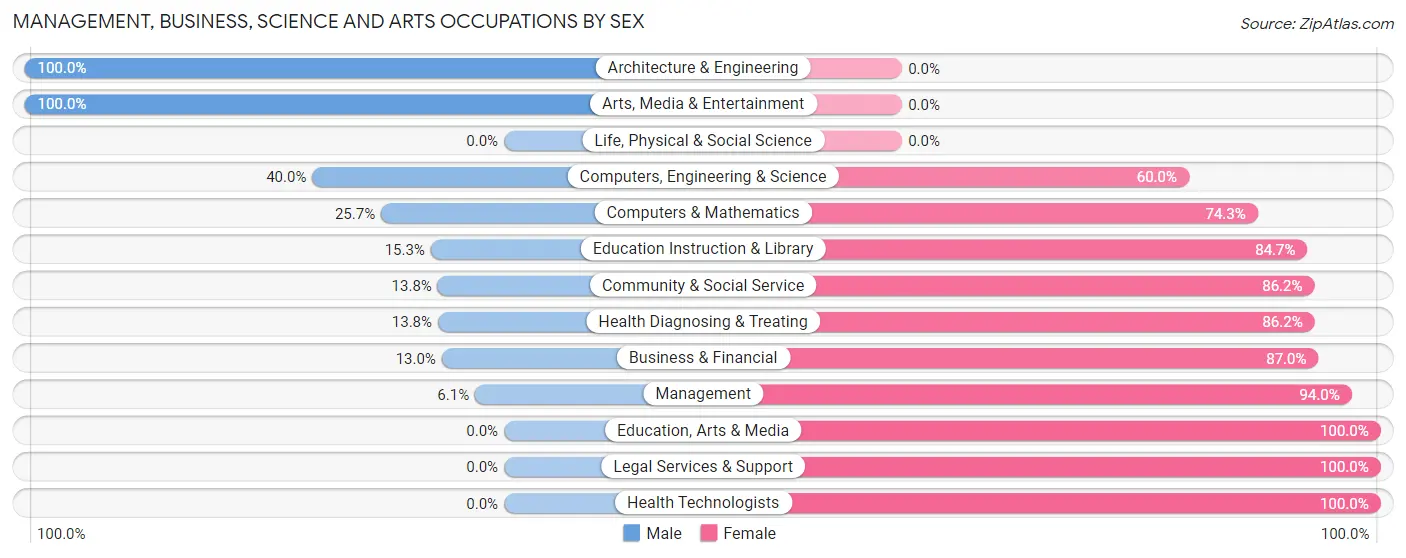
| Occupation | Male | Female |
| Management | 13 (6.0%) | 202 (94.0%) |
| Business & Financial | 23 (13.0%) | 154 (87.0%) |
| Computers, Engineering & Science | 56 (40.0%) | 84 (60.0%) |
| Computers & Mathematics | 29 (25.7%) | 84 (74.3%) |
| Architecture & Engineering | 27 (100.0%) | 0 (0.0%) |
| Life, Physical & Social Science | 0 (0.0%) | 0 (0.0%) |
| Community & Social Service | 35 (13.8%) | 218 (86.2%) |
| Education, Arts & Media | 0 (0.0%) | 58 (100.0%) |
| Legal Services & Support | 0 (0.0%) | 27 (100.0%) |
| Education Instruction & Library | 24 (15.3%) | 133 (84.7%) |
| Arts, Media & Entertainment | 11 (100.0%) | 0 (0.0%) |
| Health Diagnosing & Treating | 44 (13.8%) | 275 (86.2%) |
| Health Technologists | 0 (0.0%) | 28 (100.0%) |
| Total (Category) | 171 (15.5%) | 933 (84.5%) |
| Total (Overall) | 2,024 (39.6%) | 3,093 (60.5%) |
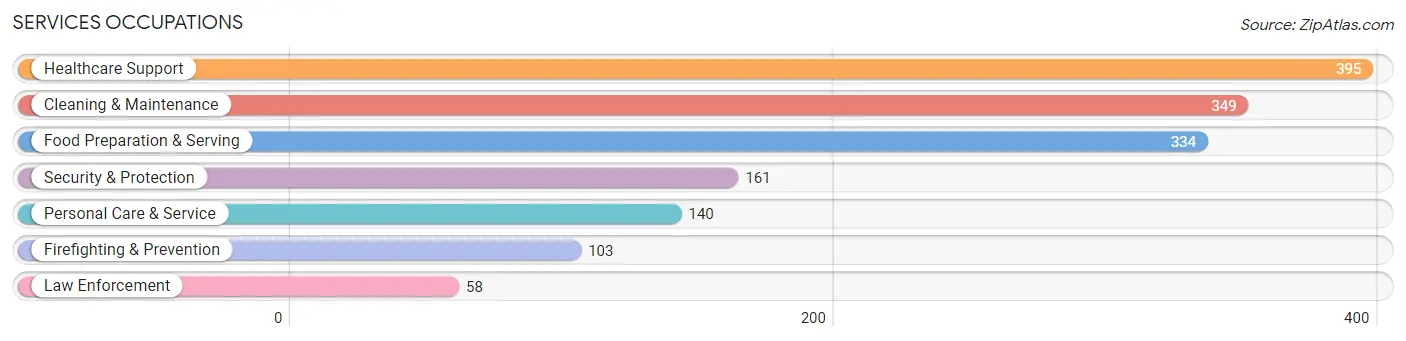
Services Occupations
The most common Services occupations in Jennings are Healthcare Support (395 | 7.7%), Cleaning & Maintenance (349 | 6.8%), Food Preparation & Serving (334 | 6.5%), Security & Protection (161 | 3.2%), and Personal Care & Service (140 | 2.7%).
Services Occupations by Sex
Within the Services occupations in Jennings, the most male-oriented occupations are Firefighting & Prevention (100.0%), Security & Protection (78.3%), and Food Preparation & Serving (55.4%), while the most female-oriented occupations are Healthcare Support (98.7%), Personal Care & Service (87.1%), and Cleaning & Maintenance (79.7%).
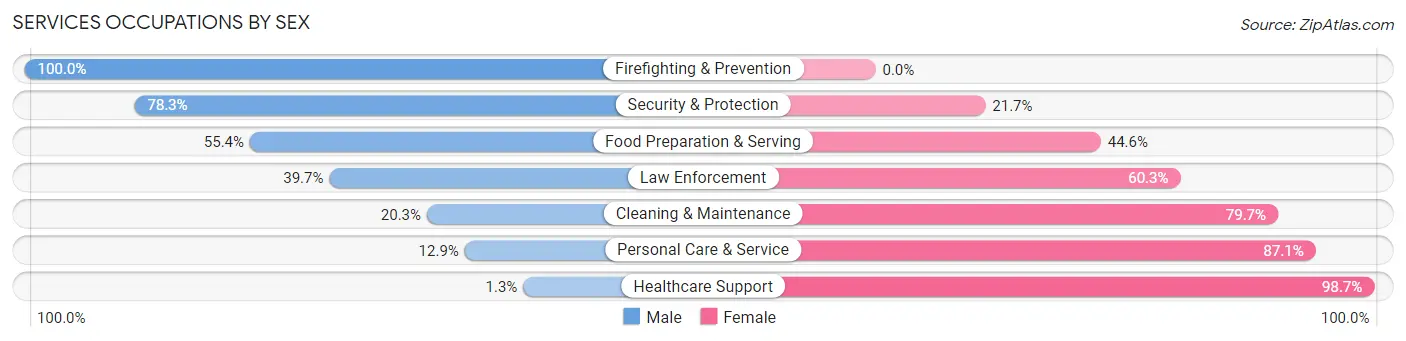
| Occupation | Male | Female |
| Healthcare Support | 5 (1.3%) | 390 (98.7%) |
| Security & Protection | 126 (78.3%) | 35 (21.7%) |
| Firefighting & Prevention | 103 (100.0%) | 0 (0.0%) |
| Law Enforcement | 23 (39.7%) | 35 (60.3%) |
| Food Preparation & Serving | 185 (55.4%) | 149 (44.6%) |
| Cleaning & Maintenance | 71 (20.3%) | 278 (79.7%) |
| Personal Care & Service | 18 (12.9%) | 122 (87.1%) |
| Total (Category) | 405 (29.4%) | 974 (70.6%) |
| Total (Overall) | 2,024 (39.6%) | 3,093 (60.5%) |
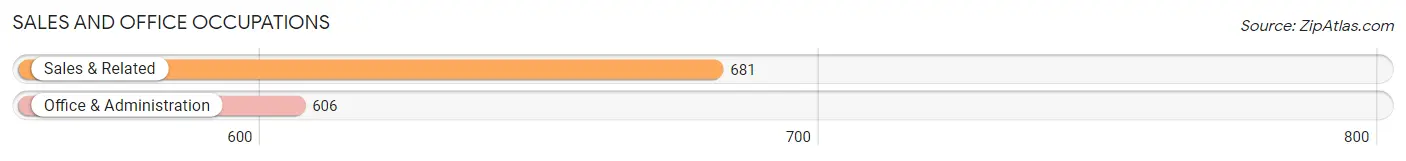
Sales and Office Occupations
The most common Sales and Office occupations in Jennings are Sales & Related (681 | 13.3%), and Office & Administration (606 | 11.8%).
Sales and Office Occupations by Sex
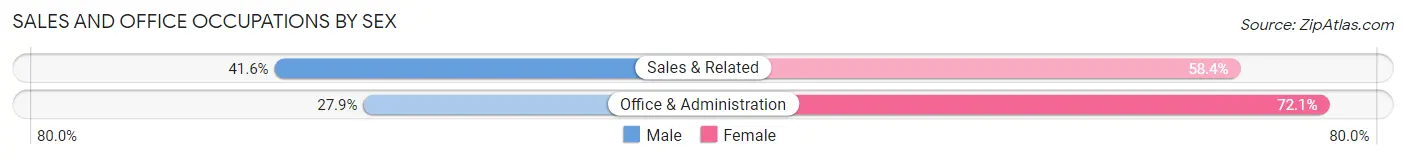
| Occupation | Male | Female |
| Sales & Related | 283 (41.6%) | 398 (58.4%) |
| Office & Administration | 169 (27.9%) | 437 (72.1%) |
| Total (Category) | 452 (35.1%) | 835 (64.9%) |
| Total (Overall) | 2,024 (39.6%) | 3,093 (60.5%) |
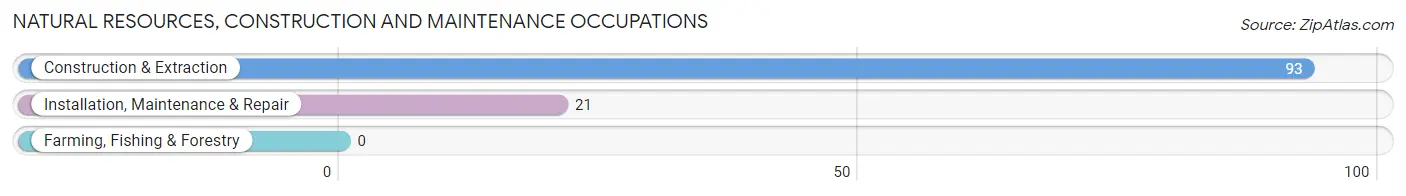
Natural Resources, Construction and Maintenance Occupations
The most common Natural Resources, Construction and Maintenance occupations in Jennings are Construction & Extraction (93 | 1.8%), and Installation, Maintenance & Repair (21 | 0.4%).
Natural Resources, Construction and Maintenance Occupations by Sex
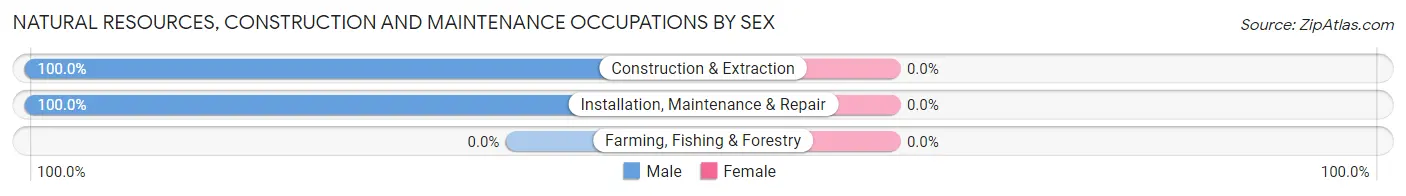
| Occupation | Male | Female |
| Farming, Fishing & Forestry | 0 (0.0%) | 0 (0.0%) |
| Construction & Extraction | 93 (100.0%) | 0 (0.0%) |
| Installation, Maintenance & Repair | 21 (100.0%) | 0 (0.0%) |
| Total (Category) | 114 (100.0%) | 0 (0.0%) |
| Total (Overall) | 2,024 (39.6%) | 3,093 (60.5%) |
Production, Transportation and Moving Occupations
The most common Production, Transportation and Moving occupations in Jennings are Production (528 | 10.3%), Material Moving (395 | 7.7%), and Transportation (310 | 6.1%).
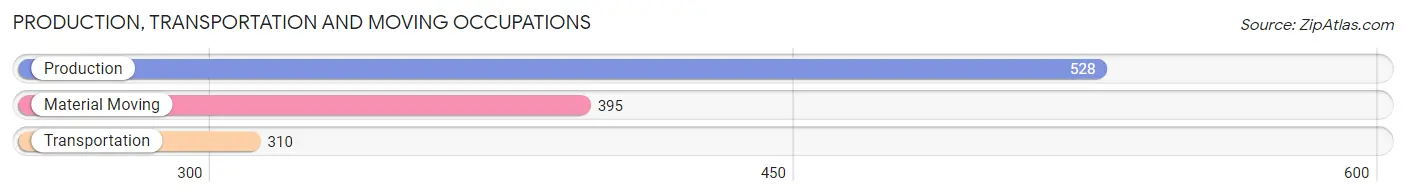
Production, Transportation and Moving Occupations by Sex
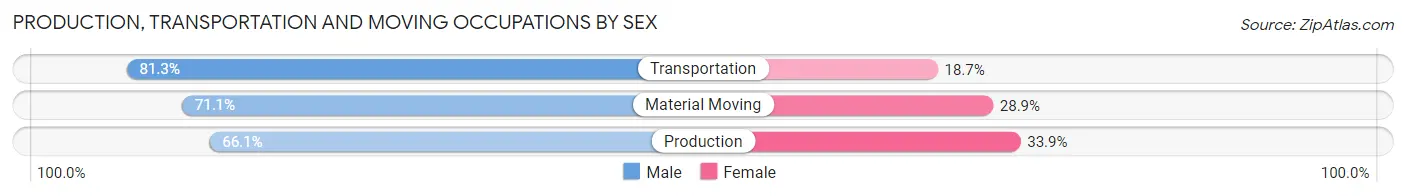
| Occupation | Male | Female |
| Production | 349 (66.1%) | 179 (33.9%) |
| Transportation | 252 (81.3%) | 58 (18.7%) |
| Material Moving | 281 (71.1%) | 114 (28.9%) |
| Total (Category) | 882 (71.5%) | 351 (28.5%) |
| Total (Overall) | 2,024 (39.6%) | 3,093 (60.5%) |
Employment Industries by Sex in Jennings
Employment Industries in Jennings
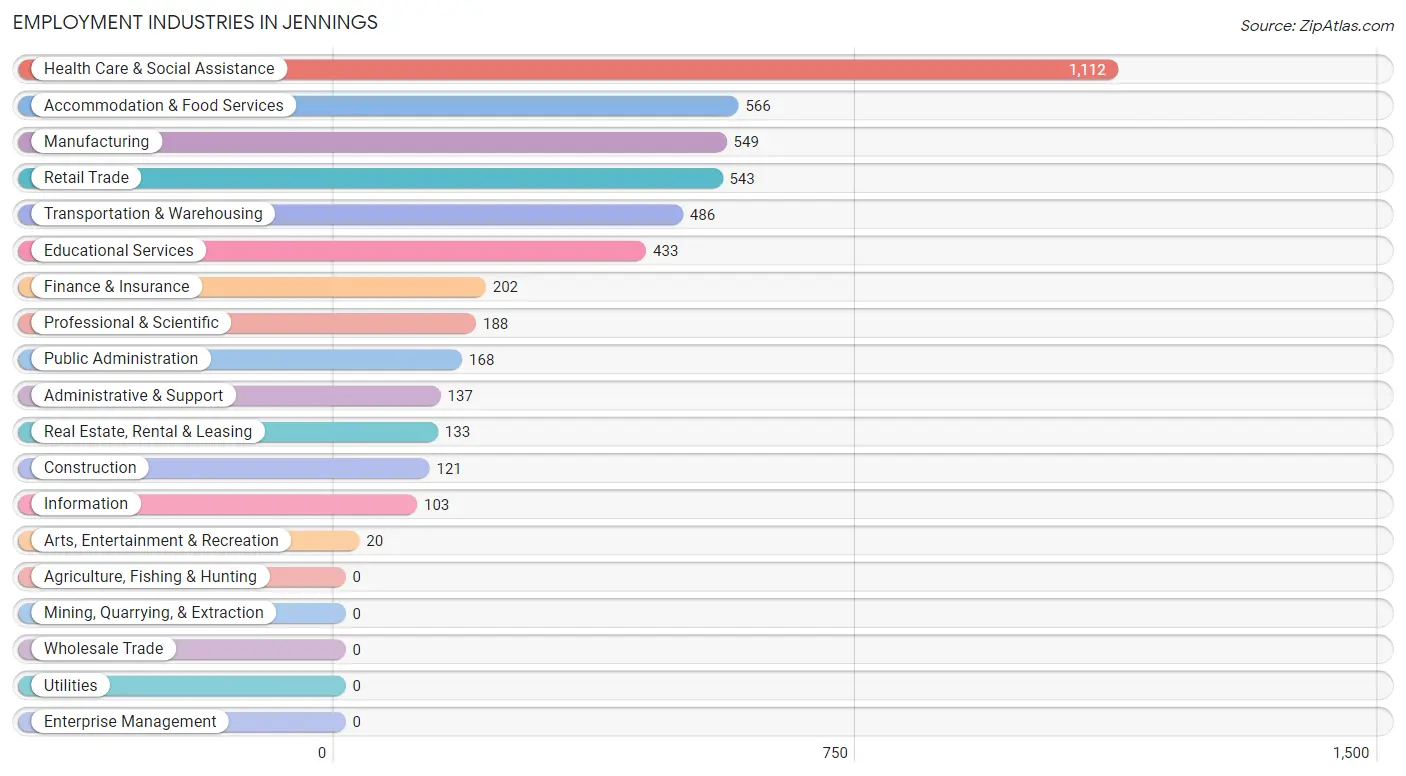
The major employment industries in Jennings include Health Care & Social Assistance (1,112 | 21.7%), Accommodation & Food Services (566 | 11.1%), Manufacturing (549 | 10.7%), Retail Trade (543 | 10.6%), and Transportation & Warehousing (486 | 9.5%).
Employment Industries by Sex in Jennings
The Jennings industries that see more men than women are Real Estate, Rental & Leasing (85.7%), Construction (82.6%), and Professional & Scientific (79.3%), whereas the industries that tend to have a higher number of women are Information (100.0%), Public Administration (100.0%), and Health Care & Social Assistance (91.5%).
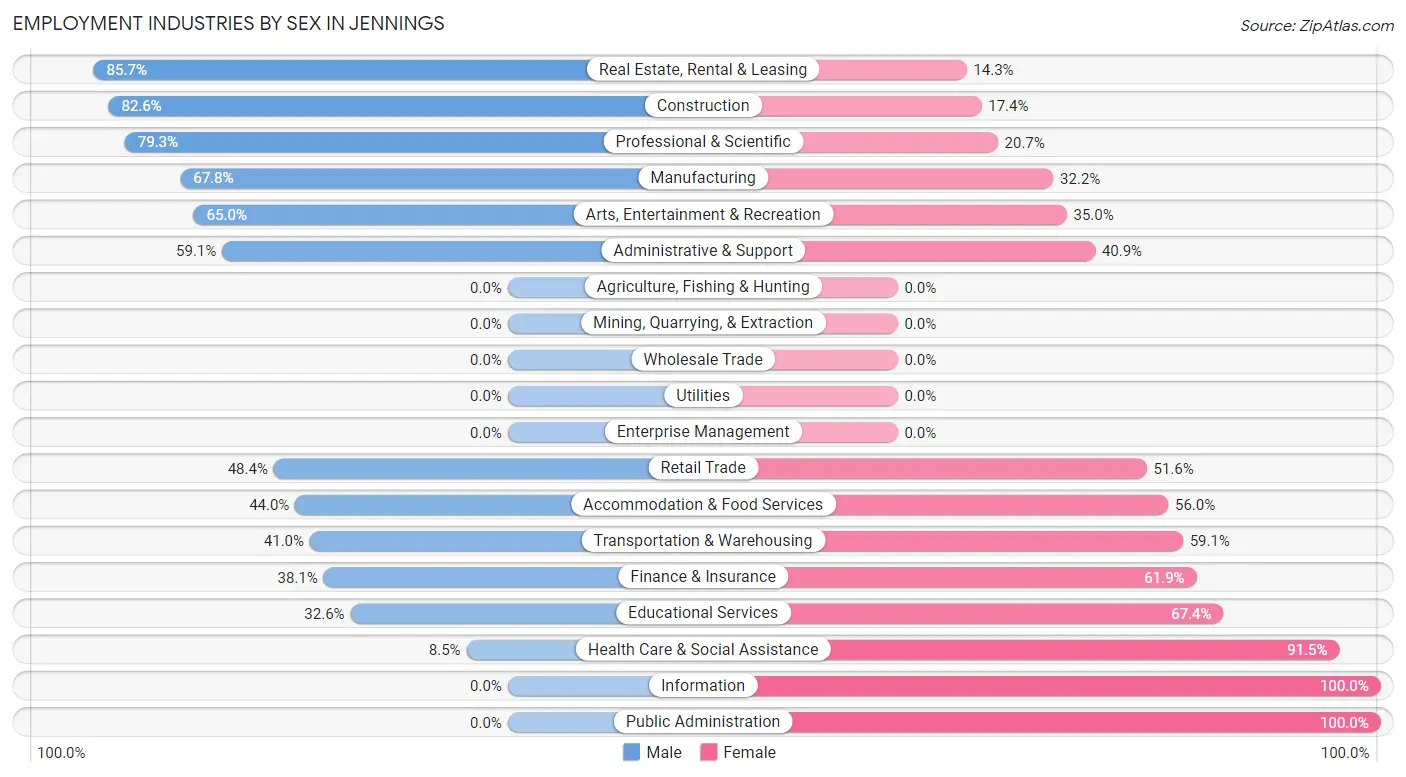
| Industry | Male | Female |
| Agriculture, Fishing & Hunting | 0 (0.0%) | 0 (0.0%) |
| Mining, Quarrying, & Extraction | 0 (0.0%) | 0 (0.0%) |
| Construction | 100 (82.6%) | 21 (17.4%) |
| Manufacturing | 372 (67.8%) | 177 (32.2%) |
| Wholesale Trade | 0 (0.0%) | 0 (0.0%) |
| Retail Trade | 263 (48.4%) | 280 (51.6%) |
| Transportation & Warehousing | 199 (40.9%) | 287 (59.1%) |
| Utilities | 0 (0.0%) | 0 (0.0%) |
| Information | 0 (0.0%) | 103 (100.0%) |
| Finance & Insurance | 77 (38.1%) | 125 (61.9%) |
| Real Estate, Rental & Leasing | 114 (85.7%) | 19 (14.3%) |
| Professional & Scientific | 149 (79.3%) | 39 (20.7%) |
| Enterprise Management | 0 (0.0%) | 0 (0.0%) |
| Administrative & Support | 81 (59.1%) | 56 (40.9%) |
| Educational Services | 141 (32.6%) | 292 (67.4%) |
| Health Care & Social Assistance | 95 (8.5%) | 1,017 (91.5%) |
| Arts, Entertainment & Recreation | 13 (65.0%) | 7 (35.0%) |
| Accommodation & Food Services | 249 (44.0%) | 317 (56.0%) |
| Public Administration | 0 (0.0%) | 168 (100.0%) |
| Total | 2,024 (39.6%) | 3,093 (60.5%) |
Education in Jennings
School Enrollment in Jennings
The most common levels of schooling among the 2,558 students in Jennings are middle school (760 | 29.7%), high school (605 | 23.6%), and elementary school (483 | 18.9%).
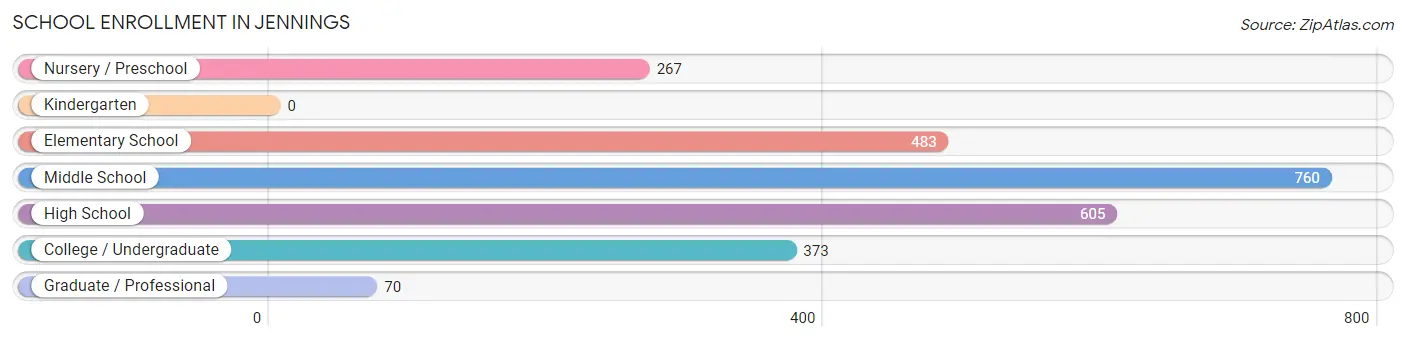
| School Level | # Students | % Students |
| Nursery / Preschool | 267 | 10.4% |
| Kindergarten | 0 | 0.0% |
| Elementary School | 483 | 18.9% |
| Middle School | 760 | 29.7% |
| High School | 605 | 23.6% |
| College / Undergraduate | 373 | 14.6% |
| Graduate / Professional | 70 | 2.7% |
| Total | 2,558 | 100.0% |
School Enrollment by Age by Funding Source in Jennings
Out of a total of 2,558 students who are enrolled in schools in Jennings, 325 (12.7%) attend a private institution, while the remaining 2,233 (87.3%) are enrolled in public schools. The age group of 20 to 24 year olds has the highest likelihood of being enrolled in private schools, with 97 (93.3% in the age bracket) enrolled. Conversely, the age group of 3 to 4 year olds has the lowest likelihood of being enrolled in a private school, with 82 (100.0% in the age bracket) attending a public institution.
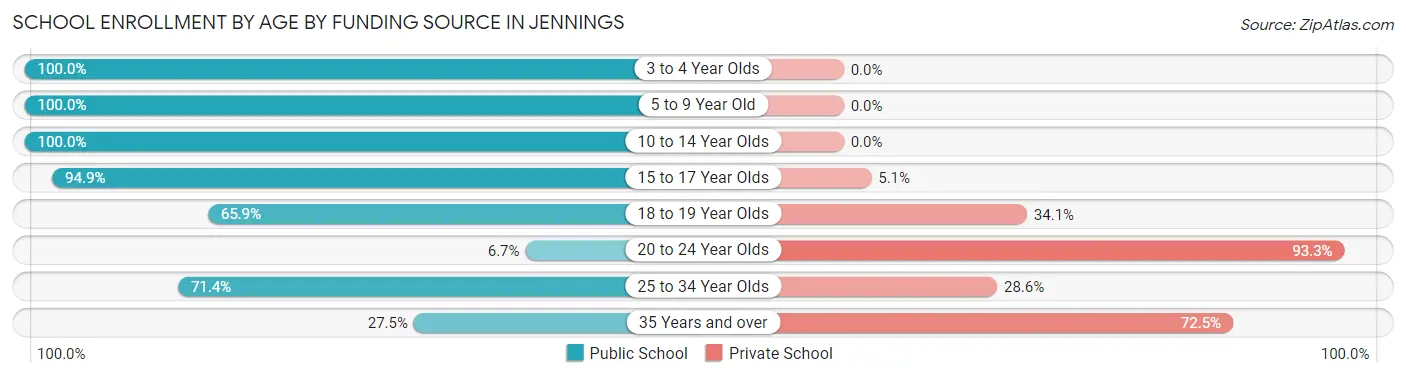
| Age Bracket | Public School | Private School |
| 3 to 4 Year Olds | 82 (100.0%) | 0 (0.0%) |
| 5 to 9 Year Old | 592 (100.0%) | 0 (0.0%) |
| 10 to 14 Year Olds | 805 (100.0%) | 0 (0.0%) |
| 15 to 17 Year Olds | 461 (94.9%) | 25 (5.1%) |
| 18 to 19 Year Olds | 137 (65.9%) | 71 (34.1%) |
| 20 to 24 Year Olds | 7 (6.7%) | 97 (93.3%) |
| 25 to 34 Year Olds | 115 (71.4%) | 46 (28.6%) |
| 35 Years and over | 33 (27.5%) | 87 (72.5%) |
| Total | 2,233 (87.3%) | 325 (12.7%) |
Educational Attainment by Field of Study in Jennings
Business (253 | 23.7%), science & technology (169 | 15.8%), education (129 | 12.1%), literature & languages (128 | 12.0%), and computers & mathematics (96 | 9.0%) are the most common fields of study among 1,069 individuals in Jennings who have obtained a bachelor's degree or higher.
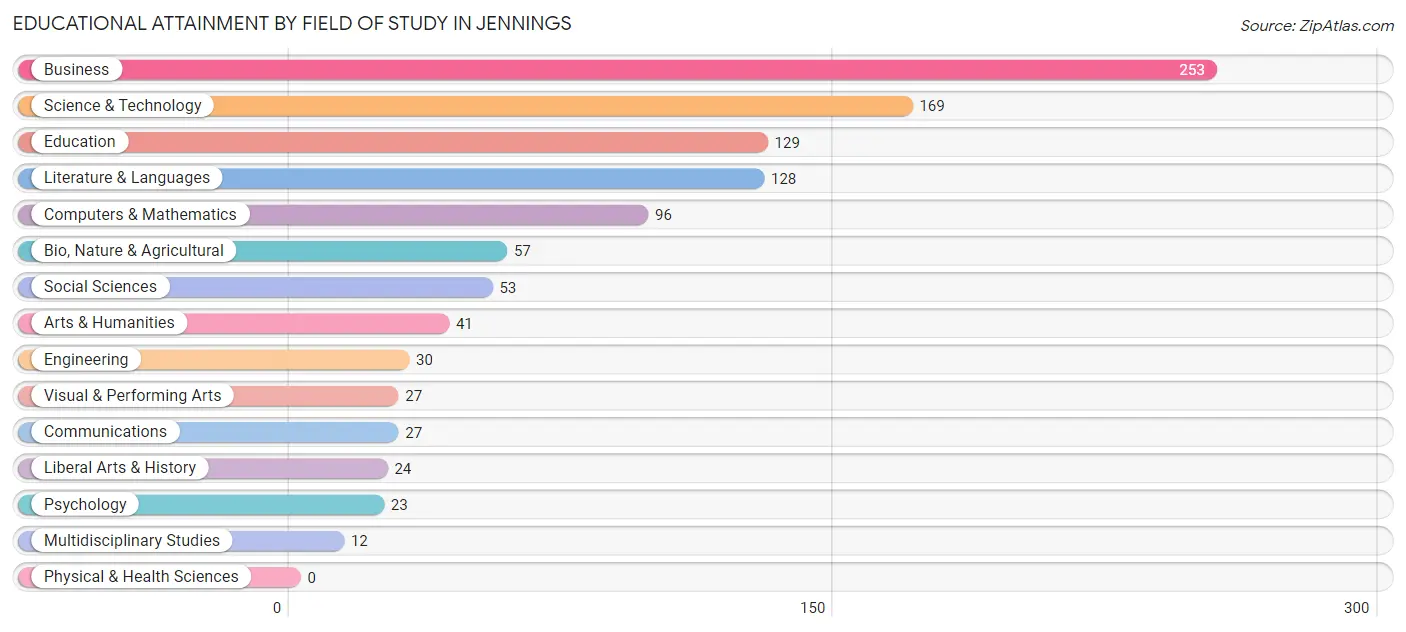
| Field of Study | # Graduates | % Graduates |
| Computers & Mathematics | 96 | 9.0% |
| Bio, Nature & Agricultural | 57 | 5.3% |
| Physical & Health Sciences | 0 | 0.0% |
| Psychology | 23 | 2.1% |
| Social Sciences | 53 | 5.0% |
| Engineering | 30 | 2.8% |
| Multidisciplinary Studies | 12 | 1.1% |
| Science & Technology | 169 | 15.8% |
| Business | 253 | 23.7% |
| Education | 129 | 12.1% |
| Literature & Languages | 128 | 12.0% |
| Liberal Arts & History | 24 | 2.2% |
| Visual & Performing Arts | 27 | 2.5% |
| Communications | 27 | 2.5% |
| Arts & Humanities | 41 | 3.8% |
| Total | 1,069 | 100.0% |
Transportation & Commute in Jennings
Vehicle Availability by Sex in Jennings
The most prevalent vehicle ownership categories in Jennings are males with 2 vehicles (901, accounting for 45.1%) and females with 2 vehicles (931, making up 29.5%).
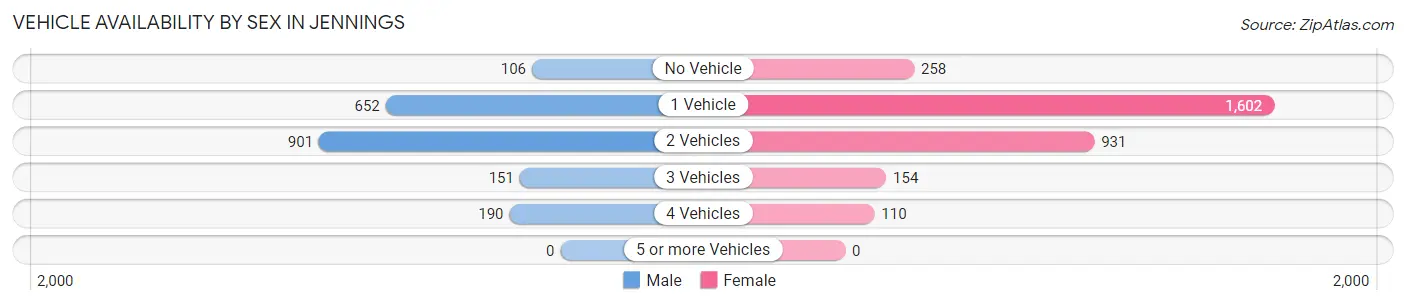
| Vehicles Available | Male | Female |
| No Vehicle | 106 (5.3%) | 258 (8.5%) |
| 1 Vehicle | 652 (32.6%) | 1,602 (52.4%) |
| 2 Vehicles | 901 (45.1%) | 931 (30.5%) |
| 3 Vehicles | 151 (7.5%) | 154 (5.0%) |
| 4 Vehicles | 190 (9.5%) | 110 (3.6%) |
| 5 or more Vehicles | 0 (0.0%) | 0 (0.0%) |
| Total | 2,000 (100.0%) | 3,055 (100.0%) |
Commute Time in Jennings
The most frequently occuring commute durations in Jennings are 20 to 24 minutes (1,318 commuters, 26.9%), 30 to 34 minutes (1,132 commuters, 23.1%), and 10 to 14 minutes (855 commuters, 17.5%).
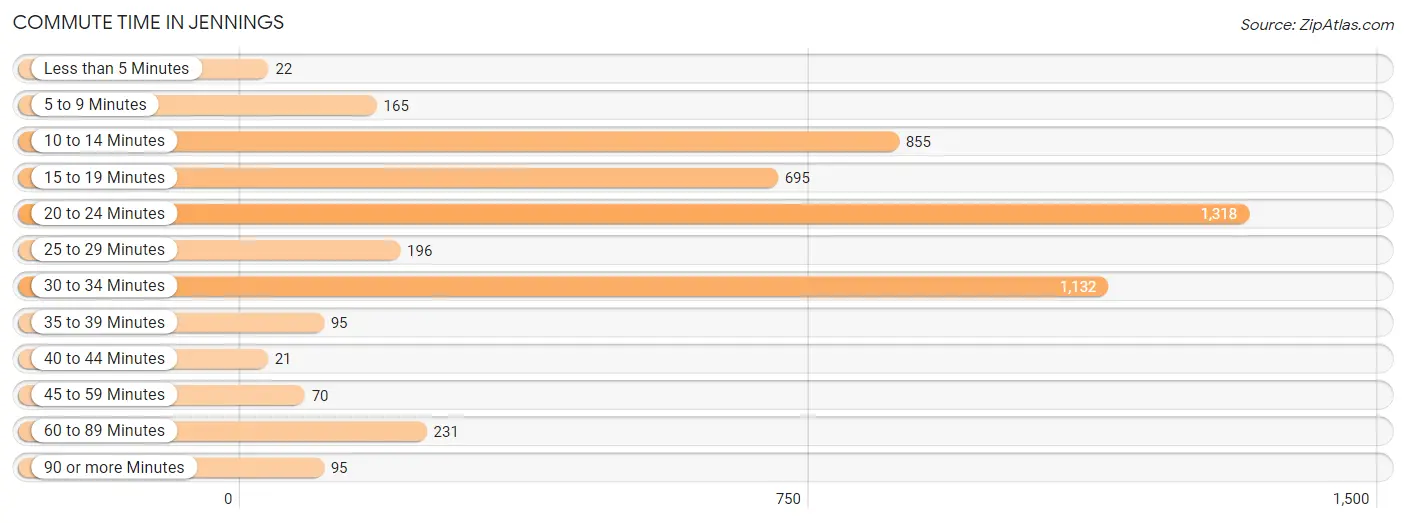
| Commute Time | # Commuters | % Commuters |
| Less than 5 Minutes | 22 | 0.4% |
| 5 to 9 Minutes | 165 | 3.4% |
| 10 to 14 Minutes | 855 | 17.5% |
| 15 to 19 Minutes | 695 | 14.2% |
| 20 to 24 Minutes | 1,318 | 26.9% |
| 25 to 29 Minutes | 196 | 4.0% |
| 30 to 34 Minutes | 1,132 | 23.1% |
| 35 to 39 Minutes | 95 | 1.9% |
| 40 to 44 Minutes | 21 | 0.4% |
| 45 to 59 Minutes | 70 | 1.4% |
| 60 to 89 Minutes | 231 | 4.7% |
| 90 or more Minutes | 95 | 1.9% |
Commute Time by Sex in Jennings
The most common commute times in Jennings are 30 to 34 minutes (543 commuters, 28.1%) for males and 20 to 24 minutes (777 commuters, 26.2%) for females.
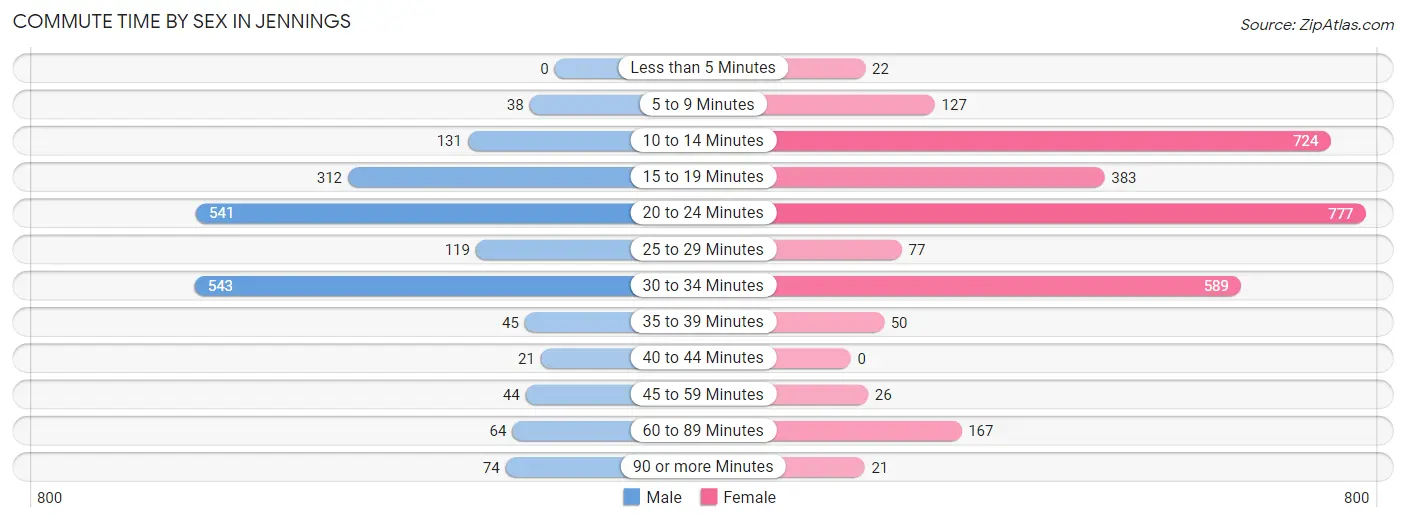
| Commute Time | Male | Female |
| Less than 5 Minutes | 0 (0.0%) | 22 (0.7%) |
| 5 to 9 Minutes | 38 (2.0%) | 127 (4.3%) |
| 10 to 14 Minutes | 131 (6.8%) | 724 (24.4%) |
| 15 to 19 Minutes | 312 (16.2%) | 383 (12.9%) |
| 20 to 24 Minutes | 541 (28.0%) | 777 (26.2%) |
| 25 to 29 Minutes | 119 (6.2%) | 77 (2.6%) |
| 30 to 34 Minutes | 543 (28.1%) | 589 (19.9%) |
| 35 to 39 Minutes | 45 (2.3%) | 50 (1.7%) |
| 40 to 44 Minutes | 21 (1.1%) | 0 (0.0%) |
| 45 to 59 Minutes | 44 (2.3%) | 26 (0.9%) |
| 60 to 89 Minutes | 64 (3.3%) | 167 (5.6%) |
| 90 or more Minutes | 74 (3.8%) | 21 (0.7%) |
Time of Departure to Work by Sex in Jennings
The most frequent times of departure to work in Jennings are 12:00 PM to 3:59 PM (348, 18.0%) for males and 12:00 PM to 3:59 PM (431, 14.5%) for females.
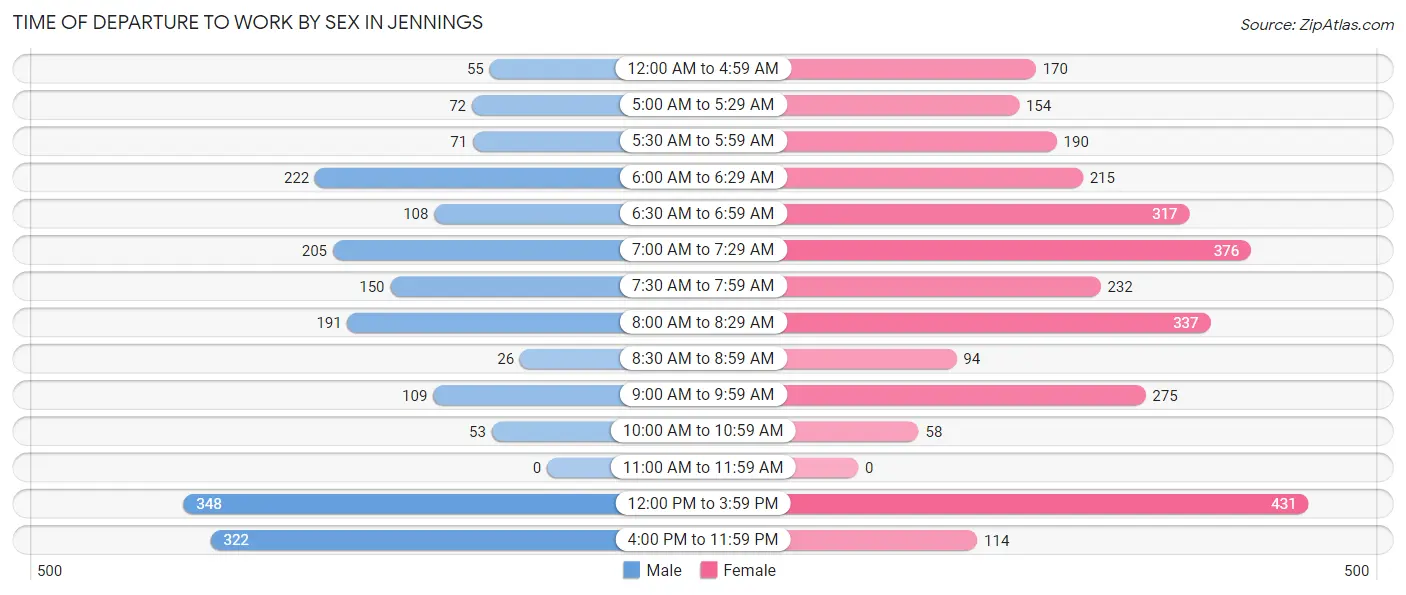
| Time of Departure | Male | Female |
| 12:00 AM to 4:59 AM | 55 (2.9%) | 170 (5.7%) |
| 5:00 AM to 5:29 AM | 72 (3.7%) | 154 (5.2%) |
| 5:30 AM to 5:59 AM | 71 (3.7%) | 190 (6.4%) |
| 6:00 AM to 6:29 AM | 222 (11.5%) | 215 (7.3%) |
| 6:30 AM to 6:59 AM | 108 (5.6%) | 317 (10.7%) |
| 7:00 AM to 7:29 AM | 205 (10.6%) | 376 (12.7%) |
| 7:30 AM to 7:59 AM | 150 (7.8%) | 232 (7.8%) |
| 8:00 AM to 8:29 AM | 191 (9.9%) | 337 (11.4%) |
| 8:30 AM to 8:59 AM | 26 (1.3%) | 94 (3.2%) |
| 9:00 AM to 9:59 AM | 109 (5.6%) | 275 (9.3%) |
| 10:00 AM to 10:59 AM | 53 (2.7%) | 58 (2.0%) |
| 11:00 AM to 11:59 AM | 0 (0.0%) | 0 (0.0%) |
| 12:00 PM to 3:59 PM | 348 (18.0%) | 431 (14.5%) |
| 4:00 PM to 11:59 PM | 322 (16.7%) | 114 (3.8%) |
| Total | 1,932 (100.0%) | 2,963 (100.0%) |
Housing Occupancy in Jennings
Occupancy by Ownership in Jennings
Of the total 5,988 dwellings in Jennings, owner-occupied units account for 2,591 (43.3%), while renter-occupied units make up 3,397 (56.7%).
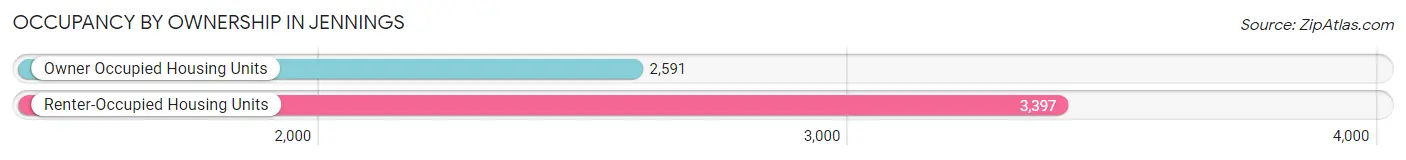
| Occupancy | # Housing Units | % Housing Units |
| Owner Occupied Housing Units | 2,591 | 43.3% |
| Renter-Occupied Housing Units | 3,397 | 56.7% |
| Total Occupied Housing Units | 5,988 | 100.0% |
Occupancy by Household Size in Jennings
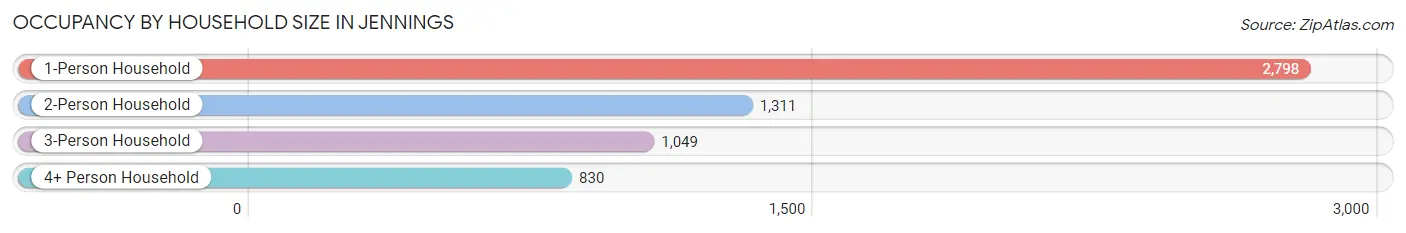
| Household Size | # Housing Units | % Housing Units |
| 1-Person Household | 2,798 | 46.7% |
| 2-Person Household | 1,311 | 21.9% |
| 3-Person Household | 1,049 | 17.5% |
| 4+ Person Household | 830 | 13.9% |
| Total Housing Units | 5,988 | 100.0% |
Occupancy by Ownership by Household Size in Jennings
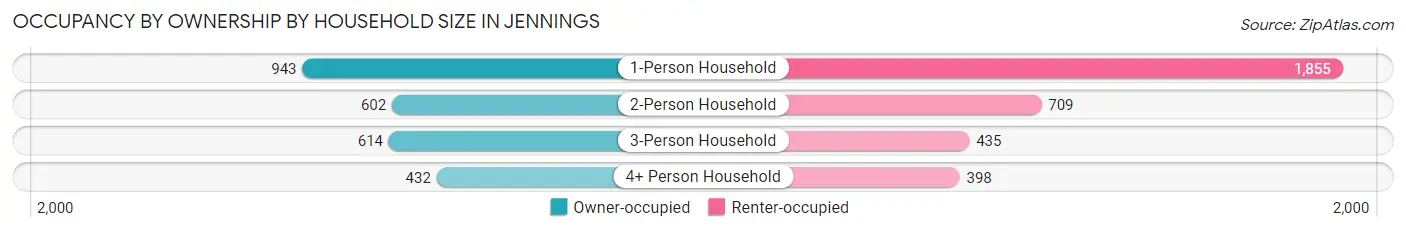
| Household Size | Owner-occupied | Renter-occupied |
| 1-Person Household | 943 (33.7%) | 1,855 (66.3%) |
| 2-Person Household | 602 (45.9%) | 709 (54.1%) |
| 3-Person Household | 614 (58.5%) | 435 (41.5%) |
| 4+ Person Household | 432 (52.0%) | 398 (47.9%) |
| Total Housing Units | 2,591 (43.3%) | 3,397 (56.7%) |
Occupancy by Educational Attainment in Jennings
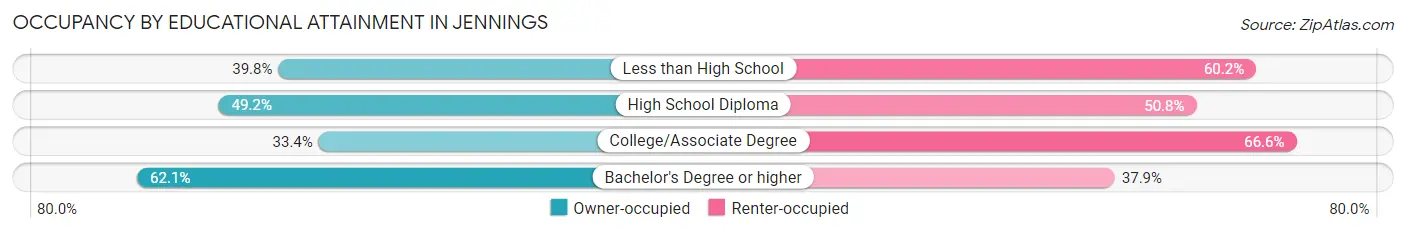
| Household Size | Owner-occupied | Renter-occupied |
| Less than High School | 528 (39.8%) | 800 (60.2%) |
| High School Diploma | 1,025 (49.2%) | 1,057 (50.8%) |
| College/Associate Degree | 654 (33.4%) | 1,306 (66.6%) |
| Bachelor's Degree or higher | 384 (62.1%) | 234 (37.9%) |
Occupancy by Age of Householder in Jennings
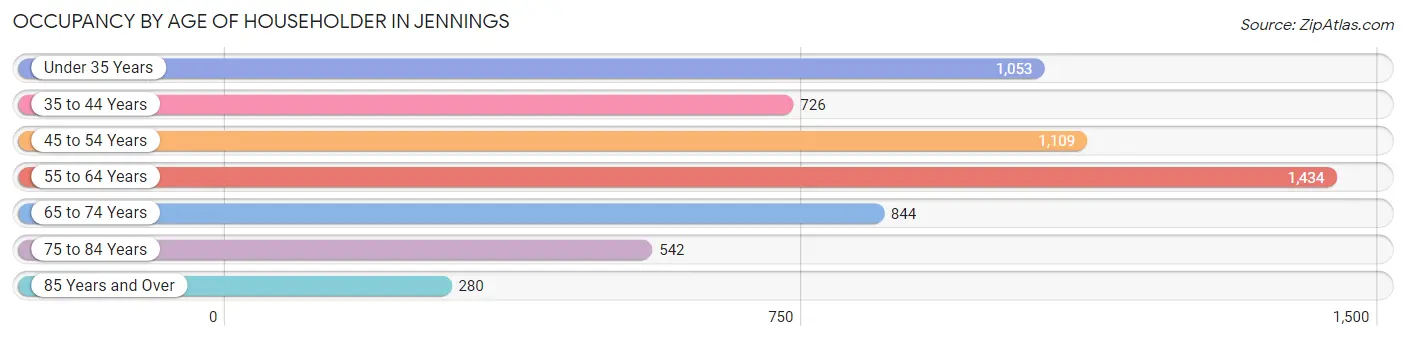
| Age Bracket | # Households | % Households |
| Under 35 Years | 1,053 | 17.6% |
| 35 to 44 Years | 726 | 12.1% |
| 45 to 54 Years | 1,109 | 18.5% |
| 55 to 64 Years | 1,434 | 23.9% |
| 65 to 74 Years | 844 | 14.1% |
| 75 to 84 Years | 542 | 9.0% |
| 85 Years and Over | 280 | 4.7% |
| Total | 5,988 | 100.0% |
Housing Finances in Jennings
Median Income by Occupancy in Jennings
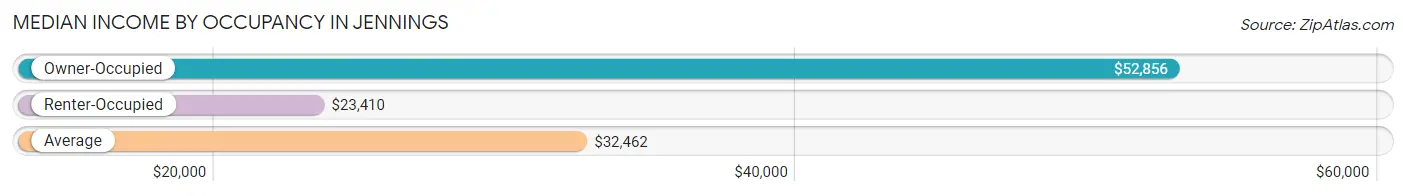
| Occupancy Type | # Households | Median Income |
| Owner-Occupied | 2,591 (43.3%) | $52,856 |
| Renter-Occupied | 3,397 (56.7%) | $23,410 |
| Average | 5,988 (100.0%) | $32,462 |
Occupancy by Householder Income Bracket in Jennings
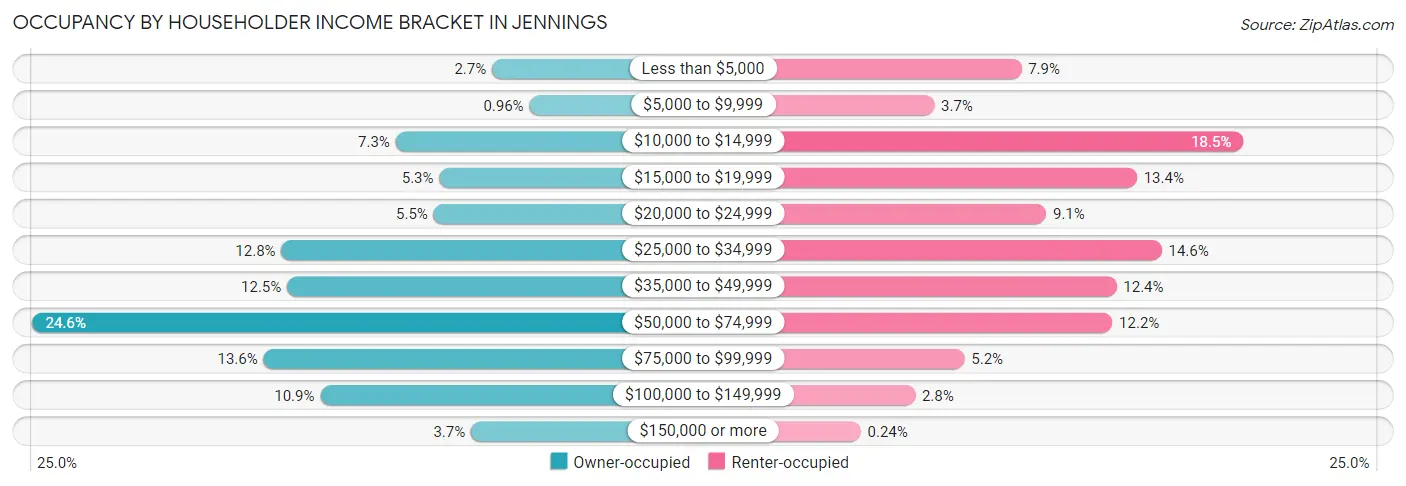
| Income Bracket | Owner-occupied | Renter-occupied |
| Less than $5,000 | 71 (2.7%) | 268 (7.9%) |
| $5,000 to $9,999 | 25 (1.0%) | 127 (3.7%) |
| $10,000 to $14,999 | 190 (7.3%) | 627 (18.5%) |
| $15,000 to $19,999 | 136 (5.2%) | 455 (13.4%) |
| $20,000 to $24,999 | 143 (5.5%) | 308 (9.1%) |
| $25,000 to $34,999 | 331 (12.8%) | 495 (14.6%) |
| $35,000 to $49,999 | 324 (12.5%) | 422 (12.4%) |
| $50,000 to $74,999 | 638 (24.6%) | 415 (12.2%) |
| $75,000 to $99,999 | 353 (13.6%) | 176 (5.2%) |
| $100,000 to $149,999 | 283 (10.9%) | 96 (2.8%) |
| $150,000 or more | 97 (3.7%) | 8 (0.2%) |
| Total | 2,591 (100.0%) | 3,397 (100.0%) |
Monthly Housing Cost Tiers in Jennings
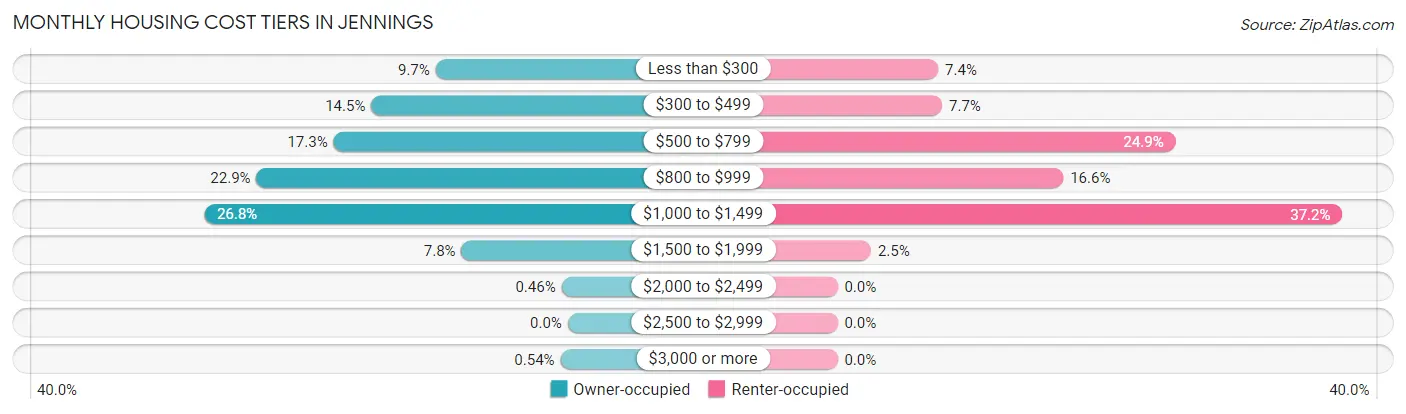
| Monthly Cost | Owner-occupied | Renter-occupied |
| Less than $300 | 252 (9.7%) | 252 (7.4%) |
| $300 to $499 | 375 (14.5%) | 262 (7.7%) |
| $500 to $799 | 447 (17.2%) | 846 (24.9%) |
| $800 to $999 | 594 (22.9%) | 565 (16.6%) |
| $1,000 to $1,499 | 694 (26.8%) | 1,263 (37.2%) |
| $1,500 to $1,999 | 203 (7.8%) | 84 (2.5%) |
| $2,000 to $2,499 | 12 (0.5%) | 0 (0.0%) |
| $2,500 to $2,999 | 0 (0.0%) | 0 (0.0%) |
| $3,000 or more | 14 (0.5%) | 0 (0.0%) |
| Total | 2,591 (100.0%) | 3,397 (100.0%) |
Physical Housing Characteristics in Jennings
Housing Structures in Jennings
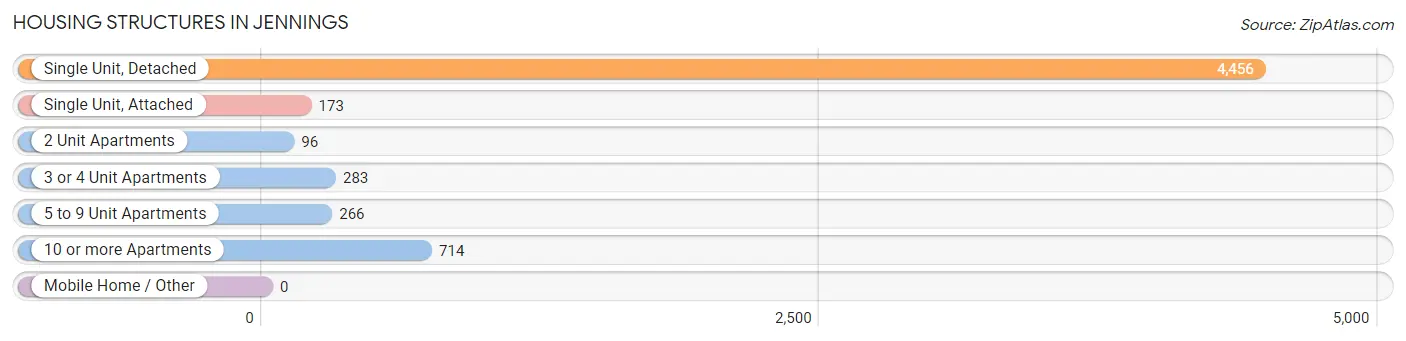
| Structure Type | # Housing Units | % Housing Units |
| Single Unit, Detached | 4,456 | 74.4% |
| Single Unit, Attached | 173 | 2.9% |
| 2 Unit Apartments | 96 | 1.6% |
| 3 or 4 Unit Apartments | 283 | 4.7% |
| 5 to 9 Unit Apartments | 266 | 4.4% |
| 10 or more Apartments | 714 | 11.9% |
| Mobile Home / Other | 0 | 0.0% |
| Total | 5,988 | 100.0% |
Housing Structures by Occupancy in Jennings
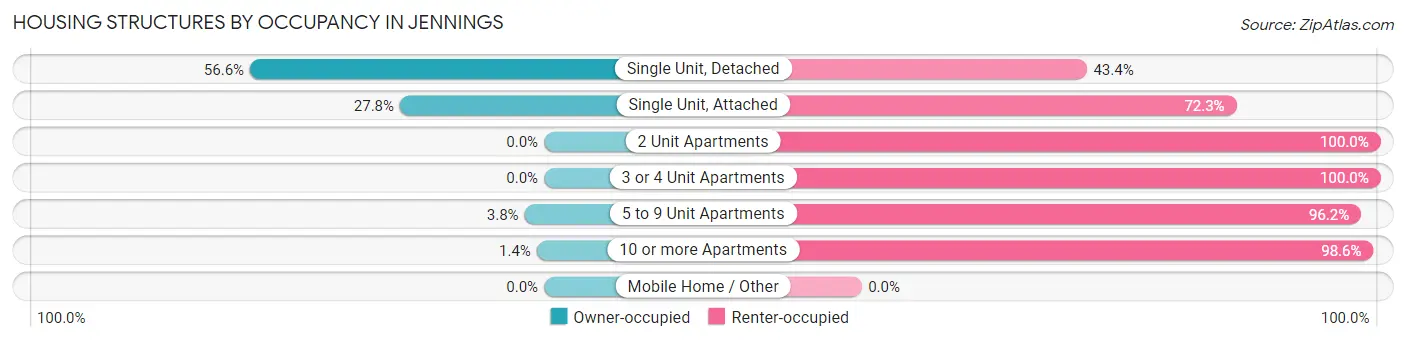
| Structure Type | Owner-occupied | Renter-occupied |
| Single Unit, Detached | 2,523 (56.6%) | 1,933 (43.4%) |
| Single Unit, Attached | 48 (27.8%) | 125 (72.3%) |
| 2 Unit Apartments | 0 (0.0%) | 96 (100.0%) |
| 3 or 4 Unit Apartments | 0 (0.0%) | 283 (100.0%) |
| 5 to 9 Unit Apartments | 10 (3.8%) | 256 (96.2%) |
| 10 or more Apartments | 10 (1.4%) | 704 (98.6%) |
| Mobile Home / Other | 0 (0.0%) | 0 (0.0%) |
| Total | 2,591 (43.3%) | 3,397 (56.7%) |
Housing Structures by Number of Rooms in Jennings
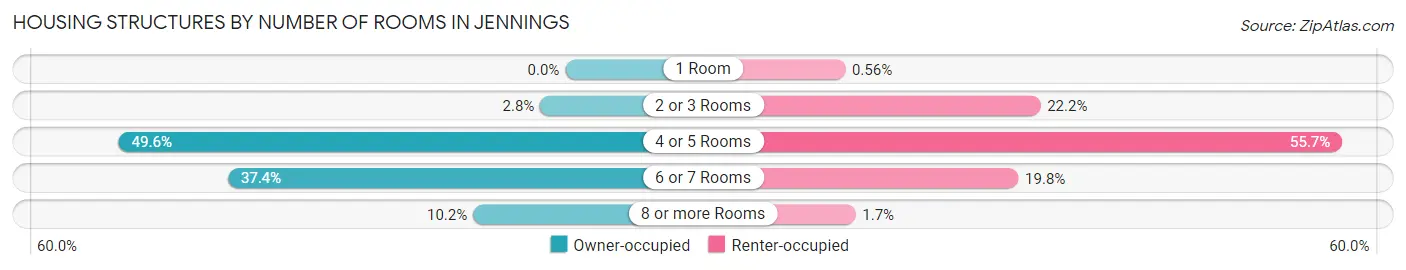
| Number of Rooms | Owner-occupied | Renter-occupied |
| 1 Room | 0 (0.0%) | 19 (0.6%) |
| 2 or 3 Rooms | 72 (2.8%) | 755 (22.2%) |
| 4 or 5 Rooms | 1,284 (49.6%) | 1,893 (55.7%) |
| 6 or 7 Rooms | 970 (37.4%) | 672 (19.8%) |
| 8 or more Rooms | 265 (10.2%) | 58 (1.7%) |
| Total | 2,591 (100.0%) | 3,397 (100.0%) |
Housing Structure by Heating Type in Jennings
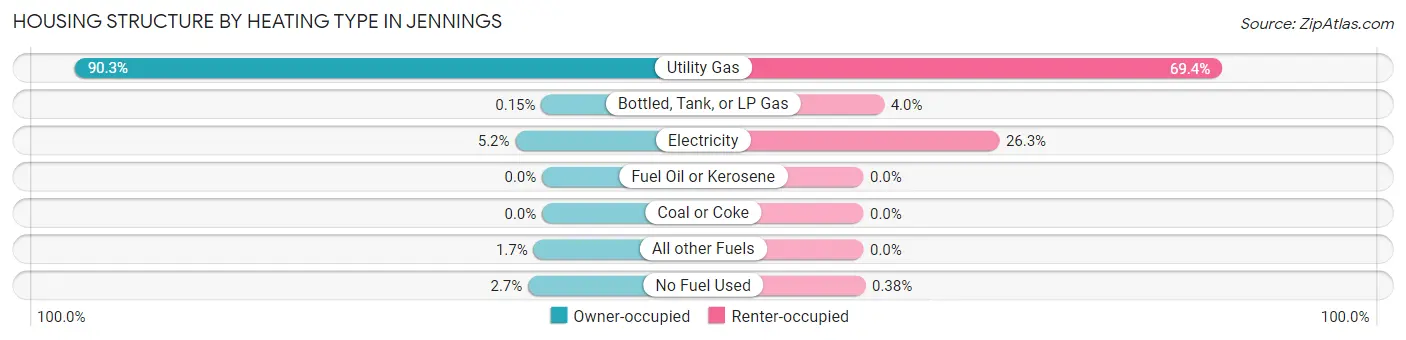
| Heating Type | Owner-occupied | Renter-occupied |
| Utility Gas | 2,340 (90.3%) | 2,356 (69.4%) |
| Bottled, Tank, or LP Gas | 4 (0.2%) | 136 (4.0%) |
| Electricity | 134 (5.2%) | 892 (26.3%) |
| Fuel Oil or Kerosene | 0 (0.0%) | 0 (0.0%) |
| Coal or Coke | 0 (0.0%) | 0 (0.0%) |
| All other Fuels | 43 (1.7%) | 0 (0.0%) |
| No Fuel Used | 70 (2.7%) | 13 (0.4%) |
| Total | 2,591 (100.0%) | 3,397 (100.0%) |
Household Vehicle Usage in Jennings
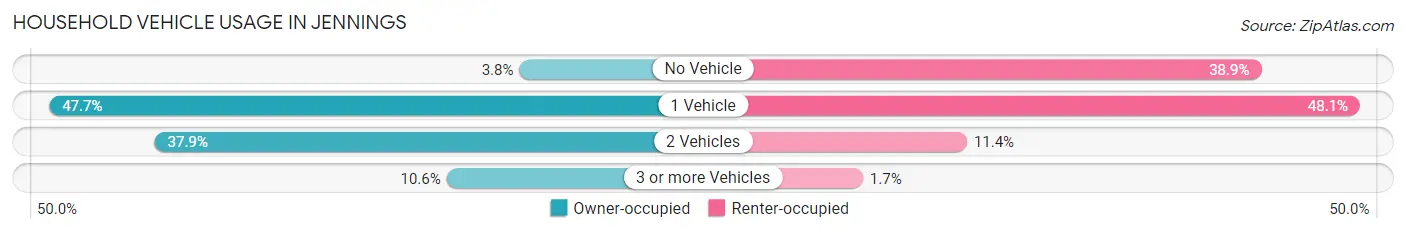
| Vehicles per Household | Owner-occupied | Renter-occupied |
| No Vehicle | 99 (3.8%) | 1,320 (38.9%) |
| 1 Vehicle | 1,236 (47.7%) | 1,633 (48.1%) |
| 2 Vehicles | 981 (37.9%) | 387 (11.4%) |
| 3 or more Vehicles | 275 (10.6%) | 57 (1.7%) |
| Total | 2,591 (100.0%) | 3,397 (100.0%) |
Real Estate & Mortgages in Jennings
Real Estate and Mortgage Overview in Jennings
| Characteristic | Without Mortgage | With Mortgage |
| Housing Units | 881 | 1,710 |
| Median Property Value | $62,200 | $65,000 |
| Median Household Income | $41,162 | $52 |
| Monthly Housing Costs | $425 | $14 |
| Real Estate Taxes | $1,302 | $99 |
Property Value by Mortgage Status in Jennings
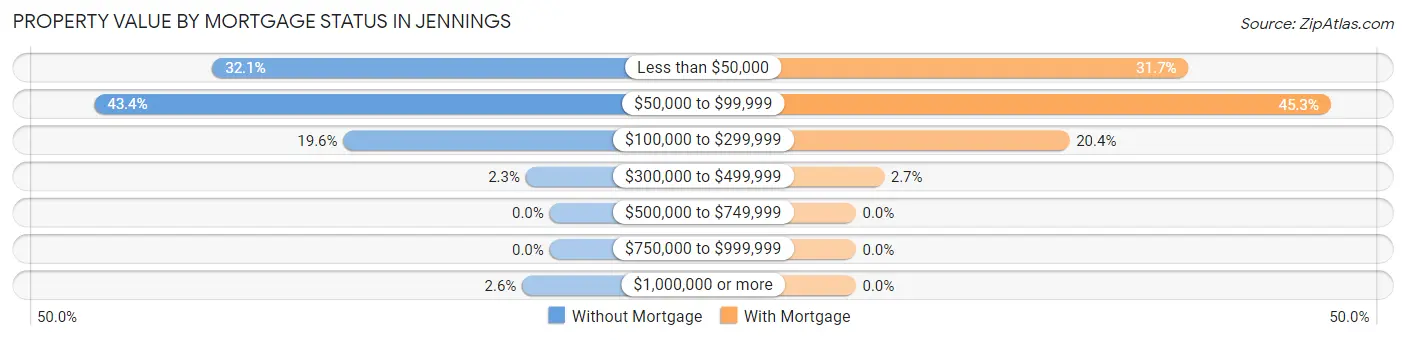
| Property Value | Without Mortgage | With Mortgage |
| Less than $50,000 | 283 (32.1%) | 542 (31.7%) |
| $50,000 to $99,999 | 382 (43.4%) | 774 (45.3%) |
| $100,000 to $299,999 | 173 (19.6%) | 348 (20.3%) |
| $300,000 to $499,999 | 20 (2.3%) | 46 (2.7%) |
| $500,000 to $749,999 | 0 (0.0%) | 0 (0.0%) |
| $750,000 to $999,999 | 0 (0.0%) | 0 (0.0%) |
| $1,000,000 or more | 23 (2.6%) | 0 (0.0%) |
| Total | 881 (100.0%) | 1,710 (100.0%) |
Household Income by Mortgage Status in Jennings
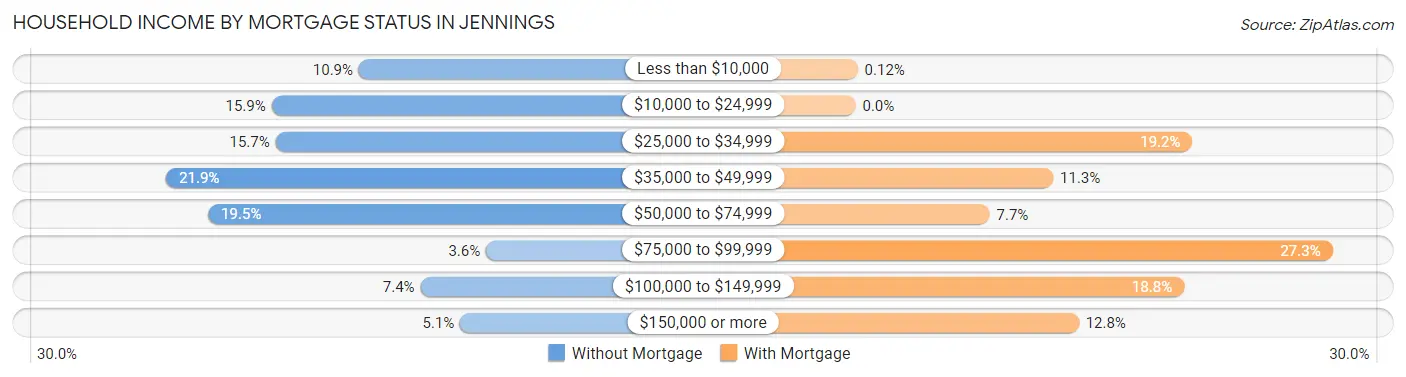
| Household Income | Without Mortgage | With Mortgage |
| Less than $10,000 | 96 (10.9%) | 2 (0.1%) |
| $10,000 to $24,999 | 140 (15.9%) | 0 (0.0%) |
| $25,000 to $34,999 | 138 (15.7%) | 329 (19.2%) |
| $35,000 to $49,999 | 193 (21.9%) | 193 (11.3%) |
| $50,000 to $74,999 | 172 (19.5%) | 131 (7.7%) |
| $75,000 to $99,999 | 32 (3.6%) | 466 (27.3%) |
| $100,000 to $149,999 | 65 (7.4%) | 321 (18.8%) |
| $150,000 or more | 45 (5.1%) | 218 (12.8%) |
| Total | 881 (100.0%) | 1,710 (100.0%) |
Property Value to Household Income Ratio in Jennings
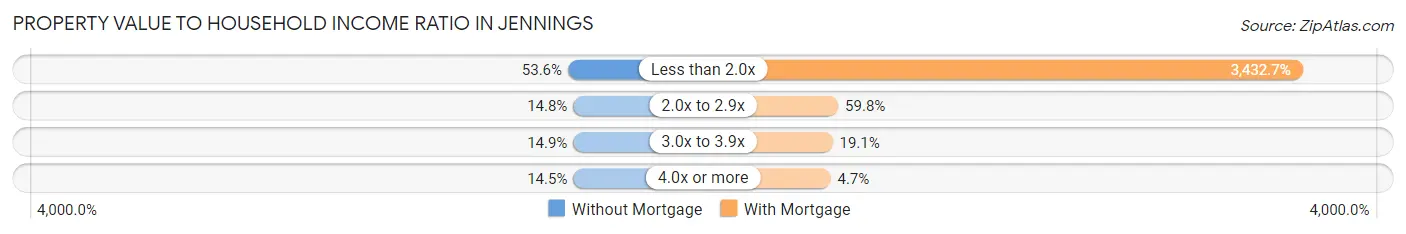
| Value-to-Income Ratio | Without Mortgage | With Mortgage |
| Less than 2.0x | 472 (53.6%) | 58,699 (3,432.7%) |
| 2.0x to 2.9x | 130 (14.8%) | 1,022 (59.8%) |
| 3.0x to 3.9x | 131 (14.9%) | 327 (19.1%) |
| 4.0x or more | 128 (14.5%) | 80 (4.7%) |
| Total | 881 (100.0%) | 1,710 (100.0%) |
Real Estate Taxes by Mortgage Status in Jennings
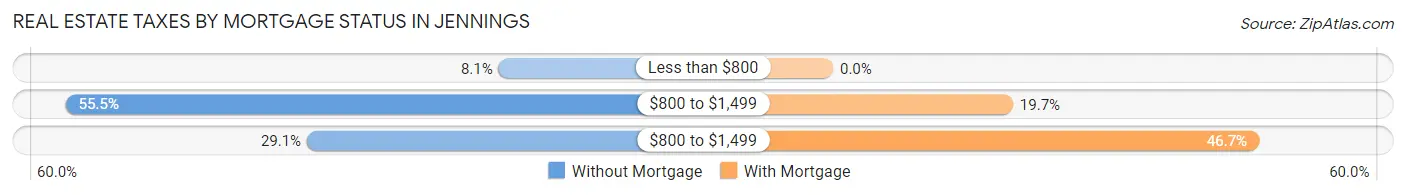
| Property Taxes | Without Mortgage | With Mortgage |
| Less than $800 | 71 (8.1%) | 0 (0.0%) |
| $800 to $1,499 | 489 (55.5%) | 337 (19.7%) |
| $800 to $1,499 | 256 (29.1%) | 798 (46.7%) |
| Total | 881 (100.0%) | 1,710 (100.0%) |
Health & Disability in Jennings
Health Insurance Coverage by Age in Jennings
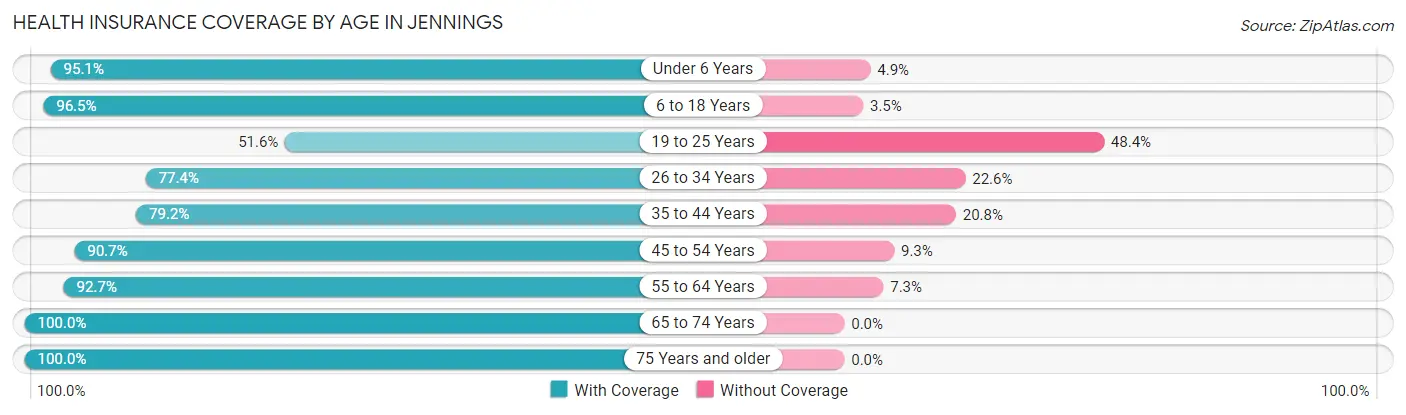
| Age Bracket | With Coverage | Without Coverage |
| Under 6 Years | 880 (95.1%) | 45 (4.9%) |
| 6 to 18 Years | 1,878 (96.5%) | 68 (3.5%) |
| 19 to 25 Years | 550 (51.6%) | 516 (48.4%) |
| 26 to 34 Years | 1,269 (77.4%) | 370 (22.6%) |
| 35 to 44 Years | 994 (79.2%) | 261 (20.8%) |
| 45 to 54 Years | 1,371 (90.7%) | 140 (9.3%) |
| 55 to 64 Years | 2,053 (92.7%) | 161 (7.3%) |
| 65 to 74 Years | 1,246 (100.0%) | 0 (0.0%) |
| 75 Years and older | 1,161 (100.0%) | 0 (0.0%) |
| Total | 11,402 (88.0%) | 1,561 (12.0%) |
Health Insurance Coverage by Citizenship Status in Jennings
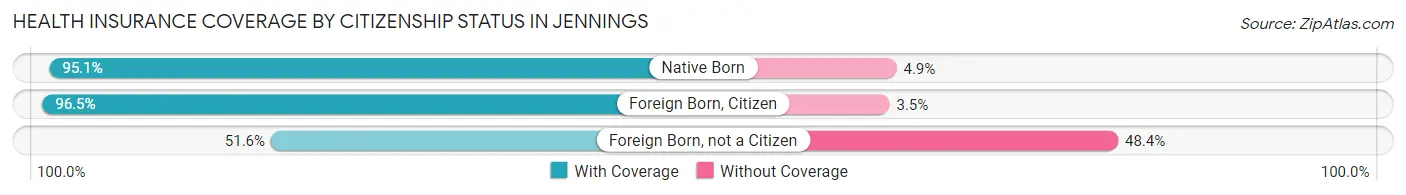
| Citizenship Status | With Coverage | Without Coverage |
| Native Born | 880 (95.1%) | 45 (4.9%) |
| Foreign Born, Citizen | 1,878 (96.5%) | 68 (3.5%) |
| Foreign Born, not a Citizen | 550 (51.6%) | 516 (48.4%) |
Health Insurance Coverage by Household Income in Jennings
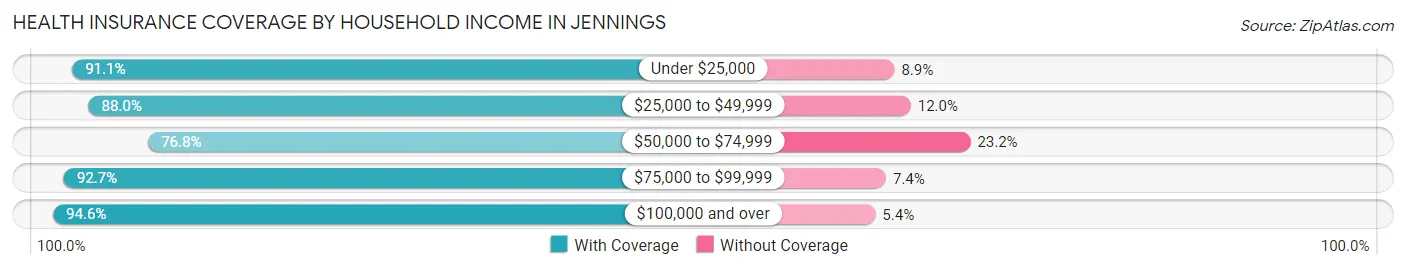
| Household Income | With Coverage | Without Coverage |
| Under $25,000 | 3,681 (91.1%) | 361 (8.9%) |
| $25,000 to $49,999 | 2,695 (88.0%) | 367 (12.0%) |
| $50,000 to $74,999 | 2,112 (76.8%) | 637 (23.2%) |
| $75,000 to $99,999 | 1,361 (92.6%) | 108 (7.3%) |
| $100,000 and over | 1,553 (94.6%) | 88 (5.4%) |
Public vs Private Health Insurance Coverage by Age in Jennings
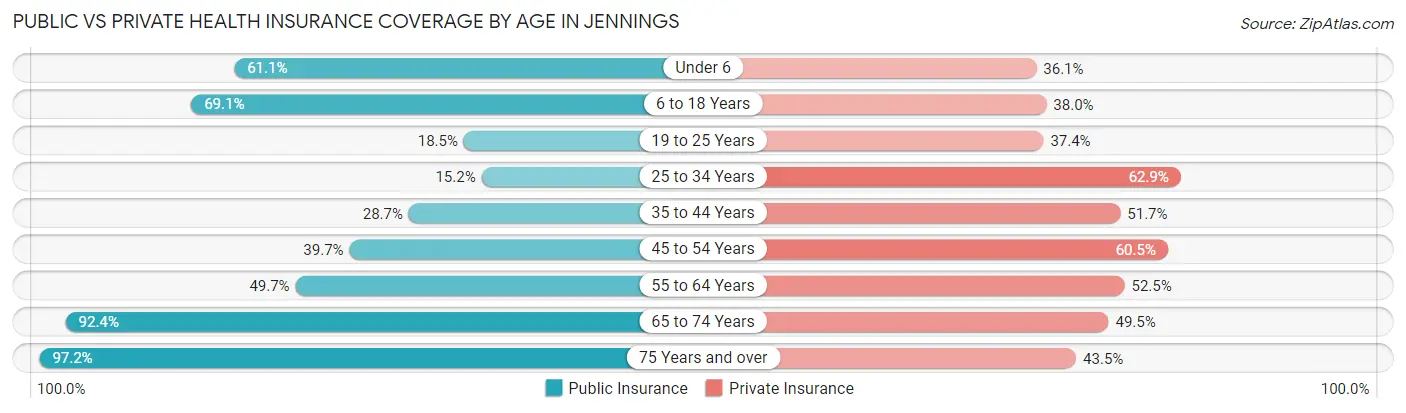
| Age Bracket | Public Insurance | Private Insurance |
| Under 6 | 565 (61.1%) | 334 (36.1%) |
| 6 to 18 Years | 1,344 (69.1%) | 739 (38.0%) |
| 19 to 25 Years | 197 (18.5%) | 399 (37.4%) |
| 25 to 34 Years | 249 (15.2%) | 1,031 (62.9%) |
| 35 to 44 Years | 360 (28.7%) | 649 (51.7%) |
| 45 to 54 Years | 600 (39.7%) | 914 (60.5%) |
| 55 to 64 Years | 1,101 (49.7%) | 1,162 (52.5%) |
| 65 to 74 Years | 1,151 (92.4%) | 617 (49.5%) |
| 75 Years and over | 1,129 (97.2%) | 505 (43.5%) |
| Total | 6,696 (51.6%) | 6,350 (49.0%) |
Disability Status by Sex by Age in Jennings
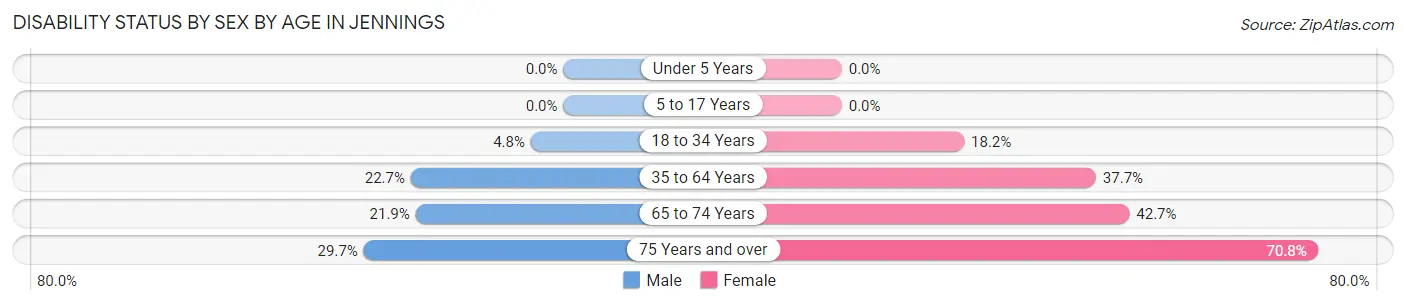
| Age Bracket | Male | Female |
| Under 5 Years | 0 (0.0%) | 0 (0.0%) |
| 5 to 17 Years | 0 (0.0%) | 0 (0.0%) |
| 18 to 34 Years | 70 (4.8%) | 266 (18.2%) |
| 35 to 64 Years | 458 (22.7%) | 1,116 (37.7%) |
| 65 to 74 Years | 111 (21.9%) | 316 (42.7%) |
| 75 Years and over | 67 (29.6%) | 662 (70.8%) |
Disability Class by Sex by Age in Jennings
Disability Class: Hearing Difficulty
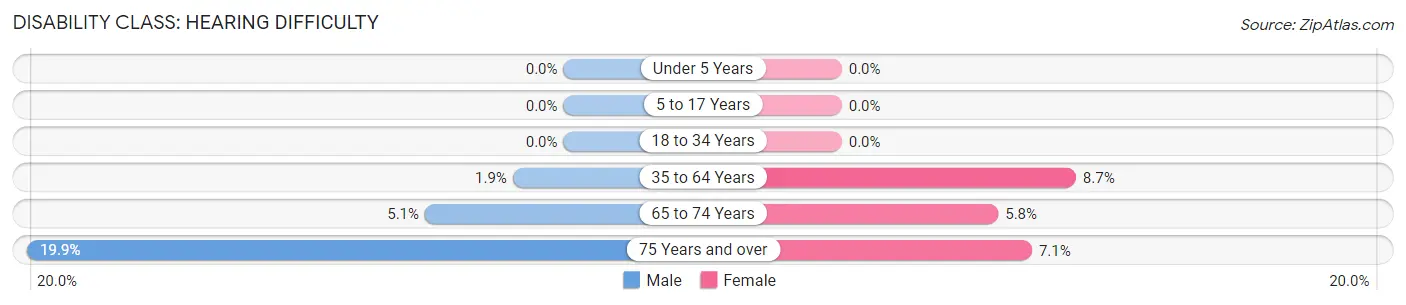
| Age Bracket | Male | Female |
| Under 5 Years | 0 (0.0%) | 0 (0.0%) |
| 5 to 17 Years | 0 (0.0%) | 0 (0.0%) |
| 18 to 34 Years | 0 (0.0%) | 0 (0.0%) |
| 35 to 64 Years | 38 (1.9%) | 257 (8.7%) |
| 65 to 74 Years | 26 (5.1%) | 43 (5.8%) |
| 75 Years and over | 45 (19.9%) | 66 (7.1%) |
Disability Class: Vision Difficulty
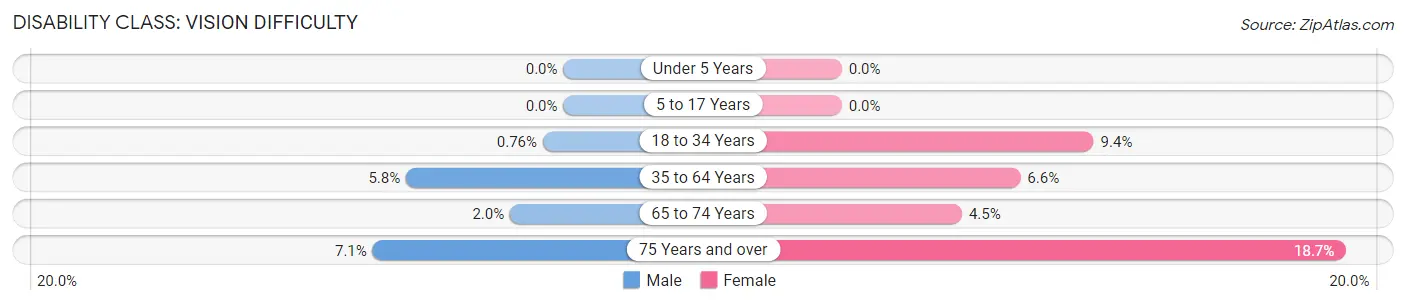
| Age Bracket | Male | Female |
| Under 5 Years | 0 (0.0%) | 0 (0.0%) |
| 5 to 17 Years | 0 (0.0%) | 0 (0.0%) |
| 18 to 34 Years | 11 (0.8%) | 137 (9.3%) |
| 35 to 64 Years | 118 (5.8%) | 196 (6.6%) |
| 65 to 74 Years | 10 (2.0%) | 33 (4.5%) |
| 75 Years and over | 16 (7.1%) | 175 (18.7%) |
Disability Class: Cognitive Difficulty
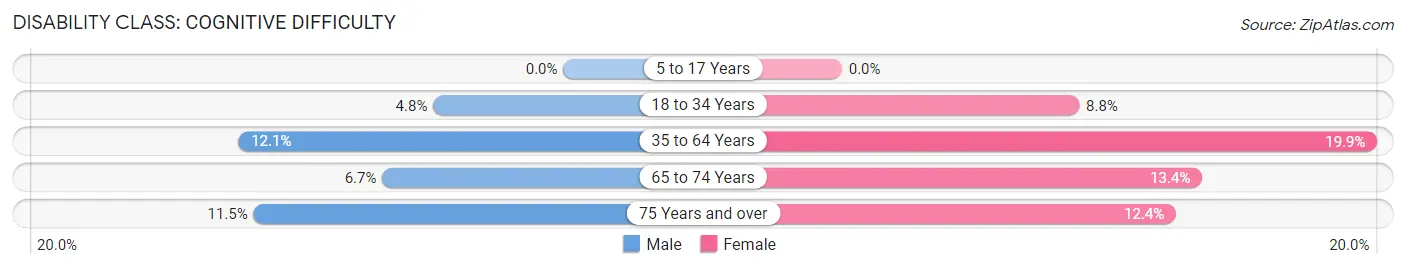
| Age Bracket | Male | Female |
| 5 to 17 Years | 0 (0.0%) | 0 (0.0%) |
| 18 to 34 Years | 70 (4.8%) | 129 (8.8%) |
| 35 to 64 Years | 244 (12.1%) | 588 (19.9%) |
| 65 to 74 Years | 34 (6.7%) | 99 (13.4%) |
| 75 Years and over | 26 (11.5%) | 116 (12.4%) |
Disability Class: Ambulatory Difficulty
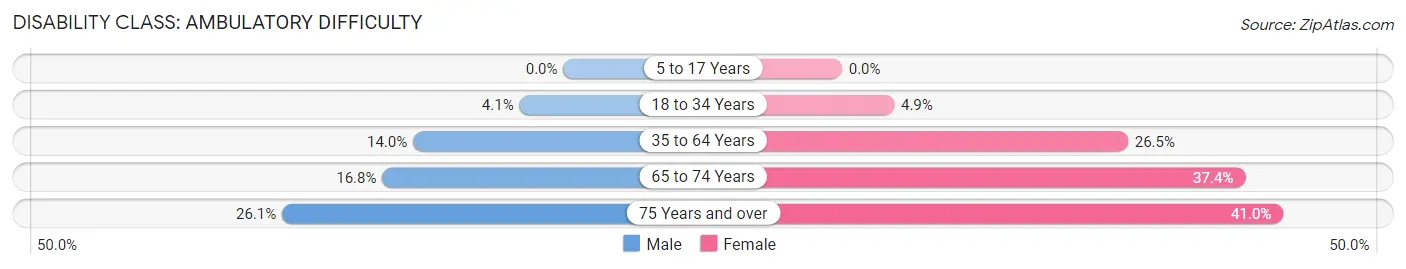
| Age Bracket | Male | Female |
| 5 to 17 Years | 0 (0.0%) | 0 (0.0%) |
| 18 to 34 Years | 59 (4.1%) | 71 (4.9%) |
| 35 to 64 Years | 282 (14.0%) | 785 (26.5%) |
| 65 to 74 Years | 85 (16.8%) | 277 (37.4%) |
| 75 Years and over | 59 (26.1%) | 383 (41.0%) |
Disability Class: Self-Care Difficulty
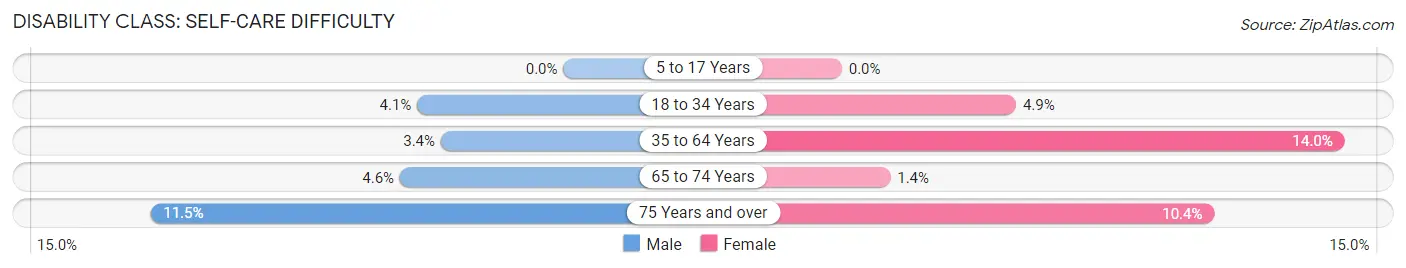
| Age Bracket | Male | Female |
| 5 to 17 Years | 0 (0.0%) | 0 (0.0%) |
| 18 to 34 Years | 59 (4.1%) | 71 (4.9%) |
| 35 to 64 Years | 69 (3.4%) | 414 (14.0%) |
| 65 to 74 Years | 23 (4.5%) | 10 (1.3%) |
| 75 Years and over | 26 (11.5%) | 97 (10.4%) |
Technology Access in Jennings
Computing Device Access in Jennings
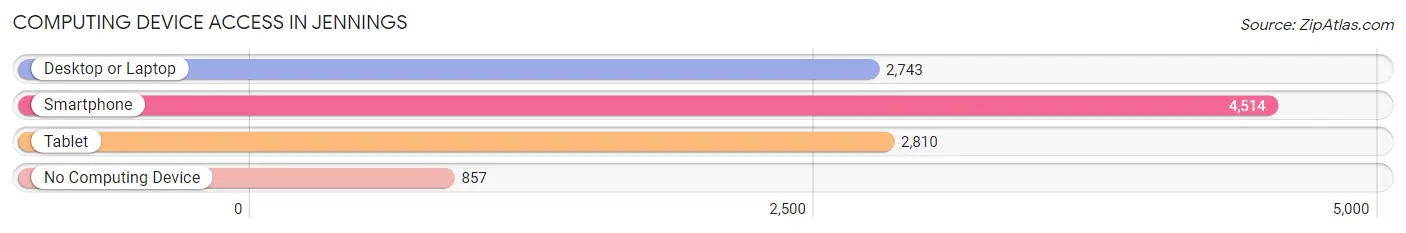
| Device Type | # Households | % Households |
| Desktop or Laptop | 2,743 | 45.8% |
| Smartphone | 4,514 | 75.4% |
| Tablet | 2,810 | 46.9% |
| No Computing Device | 857 | 14.3% |
| Total | 5,988 | 100.0% |
Internet Access in Jennings
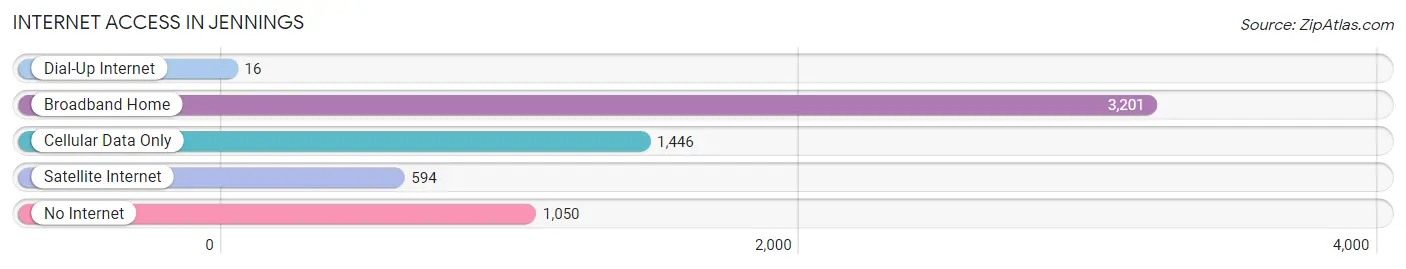
| Internet Type | # Households | % Households |
| Dial-Up Internet | 16 | 0.3% |
| Broadband Home | 3,201 | 53.5% |
| Cellular Data Only | 1,446 | 24.1% |
| Satellite Internet | 594 | 9.9% |
| No Internet | 1,050 | 17.5% |
| Total | 5,988 | 100.0% |
Jennings Summary
Jennings, Missouri is a small city located in St. Louis County, Missouri. It is situated on the banks of the Missouri River, just south of St. Louis. The city has a population of approximately 11,000 people and is part of the Greater St. Louis metropolitan area.
History
Jennings was founded in 1867 by William Jennings, a former Union soldier who had served in the Civil War. He purchased the land from the government and named the town after himself. The town was incorporated in 1875 and was initially a farming community. In the late 19th century, Jennings began to develop into a small industrial center, with the construction of a railroad line and the opening of a brickyard.
In the early 20th century, Jennings experienced a period of growth and development. The city was home to several factories, including a shoe factory, a canning factory, and a furniture factory. The city also had a number of stores and businesses, including a bank, a hotel, and a movie theater.
Geography
Jennings is located in St. Louis County, Missouri, on the banks of the Missouri River. The city is situated just south of St. Louis and is part of the Greater St. Louis metropolitan area. The city has a total area of 4.2 square miles, all of which is land.
Economy
Jennings is a small city with a diverse economy. The city is home to a number of businesses, including manufacturing, retail, and service industries. The city is also home to a number of government offices, including the St. Louis County Courthouse and the St. Louis County Police Department.
The city is also home to a number of educational institutions, including Jennings High School, Jennings Junior High School, and Jennings Elementary School.
Demographics
As of the 2010 census, Jennings had a population of 11,073 people. The racial makeup of the city was 57.3% African American, 37.2% White, 0.7% Asian, 0.3% Native American, 0.1% Pacific Islander, and 4.4% from other races. The median household income was $30,945, and the median family income was $37,945.
Jennings is a small city with a diverse population. The city is home to a number of different cultures and ethnicities, including African American, White, Asian, Native American, and Pacific Islander. The city is also home to a number of religious denominations, including Baptist, Catholic, and Methodist.
Common Questions
What is Per Capita Income in Jennings?
Per Capita income in Jennings is $20,748.
What is the Median Family Income in Jennings?
Median Family Income in Jennings is $45,240.
What is the Median Household income in Jennings?
Median Household Income in Jennings is $32,462.
What is Income or Wage Gap in Jennings?
Income or Wage Gap in Jennings is 16.2%.
Women in Jennings earn 83.8 cents for every dollar earned by a man.
What is Family Income Deficit in Jennings?
Family Income Deficit in Jennings is $9,404.
Families that are below poverty line in Jennings earn $9,404 less on average than the poverty threshold level.
What is Inequality or Gini Index in Jennings?
Inequality or Gini Index in Jennings is 0.44.
What is the Total Population of Jennings?
Total Population of Jennings is 12,996.
What is the Total Male Population of Jennings?
Total Male Population of Jennings is 5,314.
What is the Total Female Population of Jennings?
Total Female Population of Jennings is 7,682.
What is the Ratio of Males per 100 Females in Jennings?
There are 69.17 Males per 100 Females in Jennings.
What is the Ratio of Females per 100 Males in Jennings?
There are 144.56 Females per 100 Males in Jennings.
What is the Median Population Age in Jennings?
Median Population Age in Jennings is 42.5 Years.
What is the Average Family Size in Jennings
Average Family Size in Jennings is 3.2 People.
What is the Average Household Size in Jennings
Average Household Size in Jennings is 2.2 People.
How Large is the Labor Force in Jennings?
There are 5,690 People in the Labor Forcein in Jennings.
What is the Percentage of People in the Labor Force in Jennings?
53.4% of People are in the Labor Force in Jennings.
What is the Unemployment Rate in Jennings?
Unemployment Rate in Jennings is 10.1%.