Poplar Bluff, MO Map & Demographics
Poplar Bluff Map
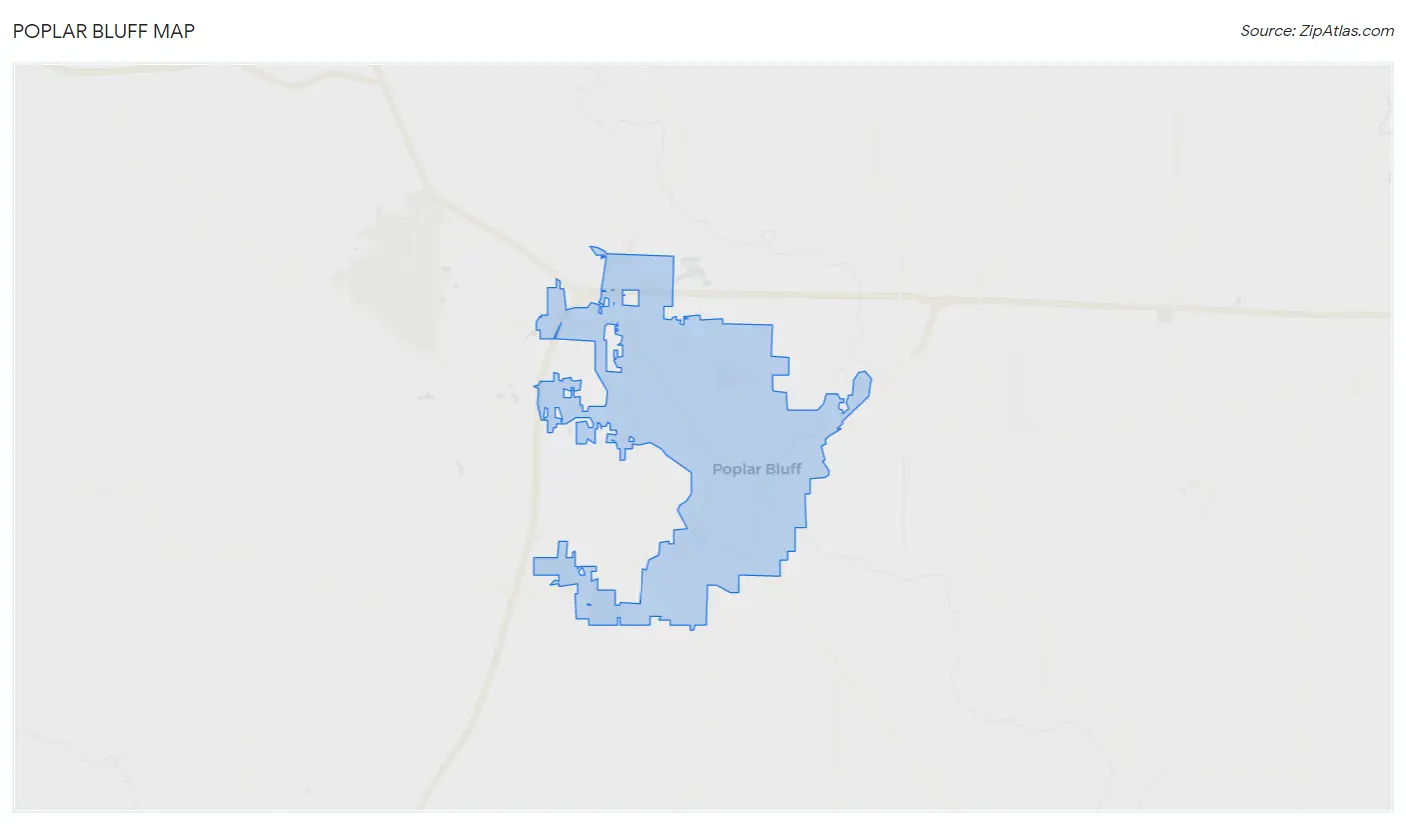
Poplar Bluff Overview
$20,797
PER CAPITA INCOME
$48,510
AVG FAMILY INCOME
$37,448
AVG HOUSEHOLD INCOME
25.7%
WAGE / INCOME GAP [ % ]
74.3¢/ $1
WAGE / INCOME GAP [ $ ]
$11,478
FAMILY INCOME DEFICIT
0.48
INEQUALITY / GINI INDEX
16,313
TOTAL POPULATION
7,742
MALE POPULATION
8,571
FEMALE POPULATION
90.33
MALES / 100 FEMALES
110.71
FEMALES / 100 MALES
36.0
MEDIAN AGE
3.3
AVG FAMILY SIZE
2.5
AVG HOUSEHOLD SIZE
6,357
LABOR FORCE [ PEOPLE ]
50.0%
PERCENT IN LABOR FORCE
5.9%
UNEMPLOYMENT RATE
Poplar Bluff Zip Codes
Poplar Bluff Area Codes
Income in Poplar Bluff
Income Overview in Poplar Bluff
Per Capita Income in Poplar Bluff is $20,797, while median incomes of families and households are $48,510 and $37,448 respectively.
| Characteristic | Number | Measure |
| Per Capita Income | 16,313 | $20,797 |
| Median Family Income | 3,483 | $48,510 |
| Mean Family Income | 3,483 | $64,178 |
| Median Household Income | 6,261 | $37,448 |
| Mean Household Income | 6,261 | $50,701 |
| Income Deficit | 3,483 | $11,478 |
| Wage / Income Gap (%) | 16,313 | 25.75% |
| Wage / Income Gap ($) | 16,313 | 74.25¢ per $1 |
| Gini / Inequality Index | 16,313 | 0.48 |
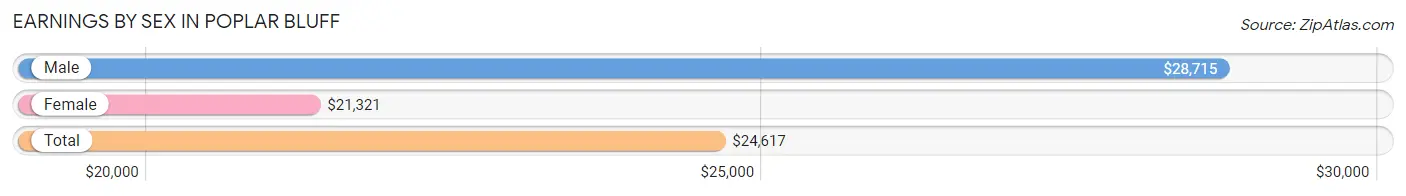
Earnings by Sex in Poplar Bluff
Average Earnings in Poplar Bluff are $24,617, $28,715 for men and $21,321 for women, a difference of 25.8%.
| Sex | Number | Average Earnings |
| Male | 3,496 (51.4%) | $28,715 |
| Female | 3,306 (48.6%) | $21,321 |
| Total | 6,802 (100.0%) | $24,617 |
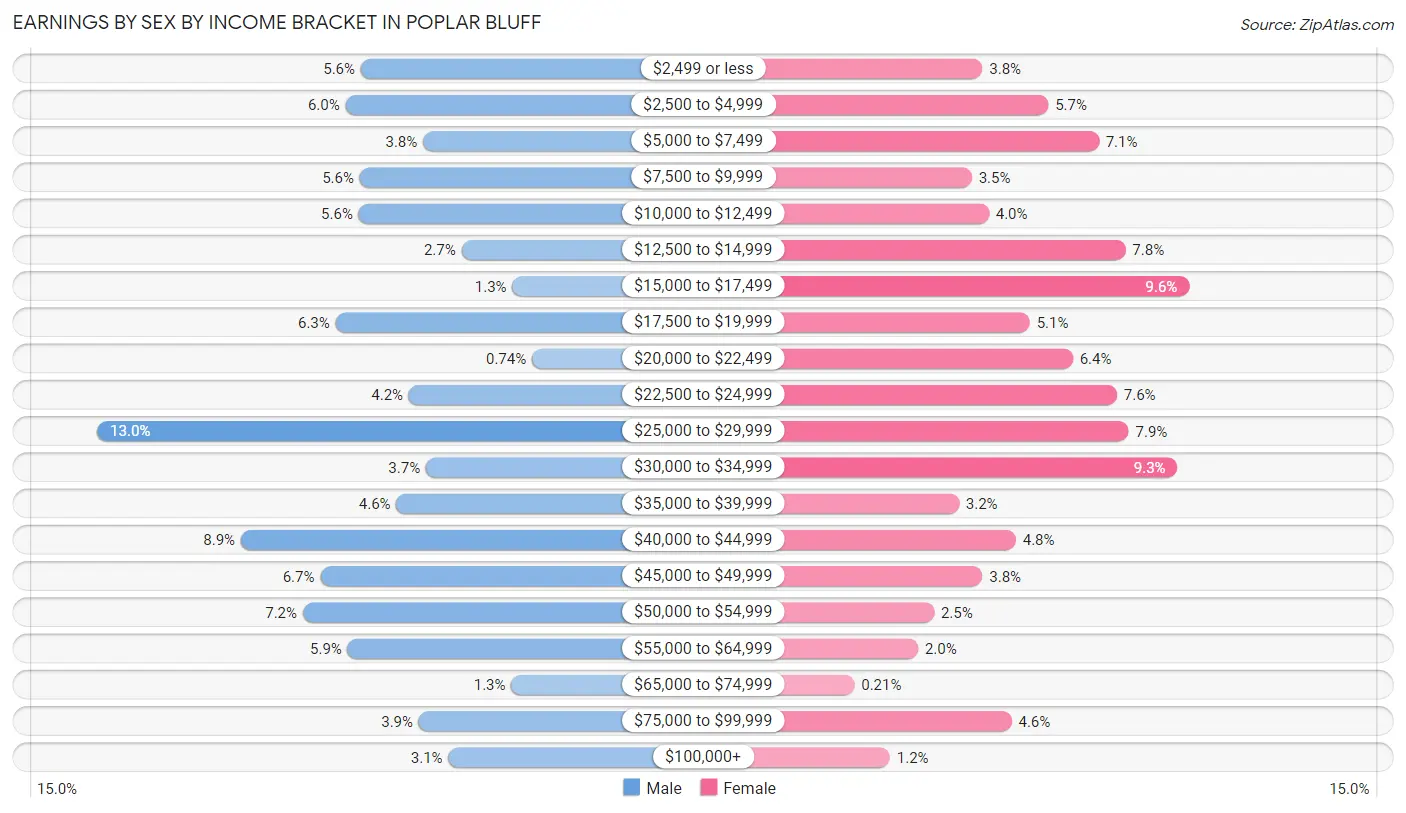
Earnings by Sex by Income Bracket in Poplar Bluff
The most common earnings brackets in Poplar Bluff are $25,000 to $29,999 for men (453 | 13.0%) and $15,000 to $17,499 for women (318 | 9.6%).
| Income | Male | Female |
| $2,499 or less | 194 (5.6%) | 126 (3.8%) |
| $2,500 to $4,999 | 209 (6.0%) | 187 (5.7%) |
| $5,000 to $7,499 | 133 (3.8%) | 234 (7.1%) |
| $7,500 to $9,999 | 195 (5.6%) | 116 (3.5%) |
| $10,000 to $12,499 | 196 (5.6%) | 132 (4.0%) |
| $12,500 to $14,999 | 95 (2.7%) | 259 (7.8%) |
| $15,000 to $17,499 | 45 (1.3%) | 318 (9.6%) |
| $17,500 to $19,999 | 219 (6.3%) | 170 (5.1%) |
| $20,000 to $22,499 | 26 (0.7%) | 210 (6.4%) |
| $22,500 to $24,999 | 147 (4.2%) | 251 (7.6%) |
| $25,000 to $29,999 | 453 (13.0%) | 262 (7.9%) |
| $30,000 to $34,999 | 130 (3.7%) | 307 (9.3%) |
| $35,000 to $39,999 | 159 (4.5%) | 104 (3.2%) |
| $40,000 to $44,999 | 312 (8.9%) | 157 (4.8%) |
| $45,000 to $49,999 | 234 (6.7%) | 126 (3.8%) |
| $50,000 to $54,999 | 251 (7.2%) | 81 (2.5%) |
| $55,000 to $64,999 | 207 (5.9%) | 66 (2.0%) |
| $65,000 to $74,999 | 46 (1.3%) | 7 (0.2%) |
| $75,000 to $99,999 | 137 (3.9%) | 153 (4.6%) |
| $100,000+ | 108 (3.1%) | 40 (1.2%) |
| Total | 3,496 (100.0%) | 3,306 (100.0%) |
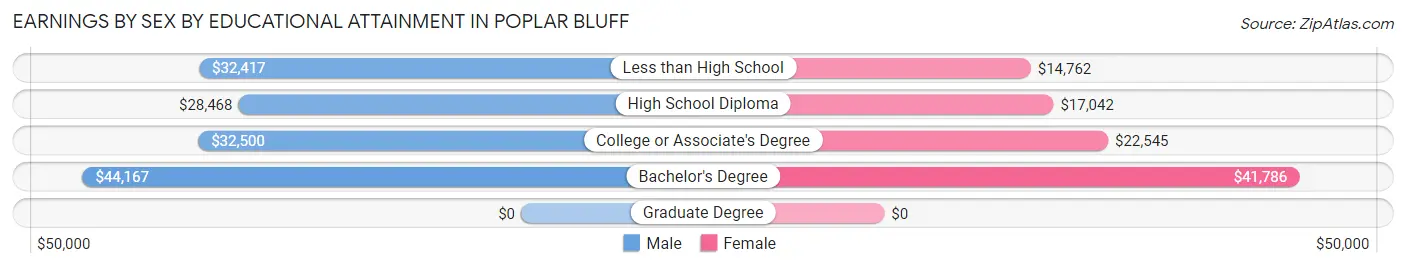
Earnings by Sex by Educational Attainment in Poplar Bluff
Average earnings in Poplar Bluff are $30,481 for men and $21,643 for women, a difference of 29.0%. Men with an educational attainment of bachelor's degree enjoy the highest average annual earnings of $44,167, while those with high school diploma education earn the least with $28,468. Women with an educational attainment of bachelor's degree earn the most with the average annual earnings of $41,786, while those with less than high school education have the smallest earnings of $14,762.
| Educational Attainment | Male Income | Female Income |
| Less than High School | $32,417 | $14,762 |
| High School Diploma | $28,468 | $17,042 |
| College or Associate's Degree | $32,500 | $22,545 |
| Bachelor's Degree | $44,167 | $41,786 |
| Graduate Degree | - | - |
| Total | $30,481 | $21,643 |
Family Income in Poplar Bluff
Family Income Brackets in Poplar Bluff
According to the Poplar Bluff family income data, there are 634 families falling into the $50,000 to $74,999 income range, which is the most common income bracket and makes up 18.2% of all families. Conversely, the $200,000+ income bracket is the least frequent group with only 52 families (1.5%) belonging to this category.
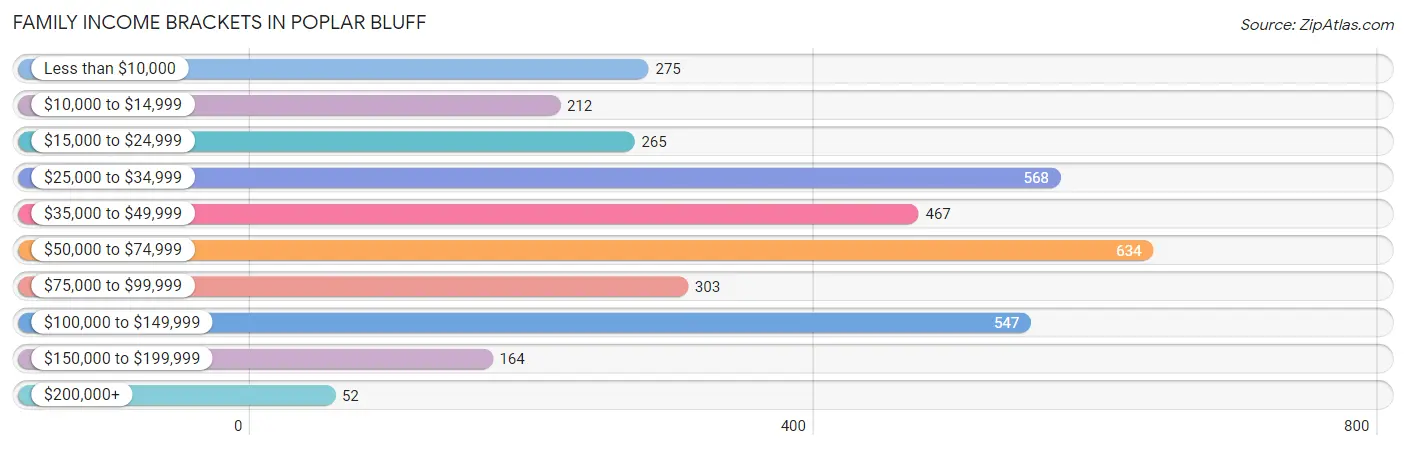
| Income Bracket | # Families | % Families |
| Less than $10,000 | 275 | 7.9% |
| $10,000 to $14,999 | 212 | 6.1% |
| $15,000 to $24,999 | 265 | 7.6% |
| $25,000 to $34,999 | 568 | 16.3% |
| $35,000 to $49,999 | 467 | 13.4% |
| $50,000 to $74,999 | 634 | 18.2% |
| $75,000 to $99,999 | 303 | 8.7% |
| $100,000 to $149,999 | 547 | 15.7% |
| $150,000 to $199,999 | 164 | 4.7% |
| $200,000+ | 52 | 1.5% |
Family Income by Famaliy Size in Poplar Bluff
6-person families (126 | 3.6%) account for the highest median family income in Poplar Bluff with $58,833 per family, while 2-person families (1,711 | 49.1%) have the highest median income of $24,918 per family member.
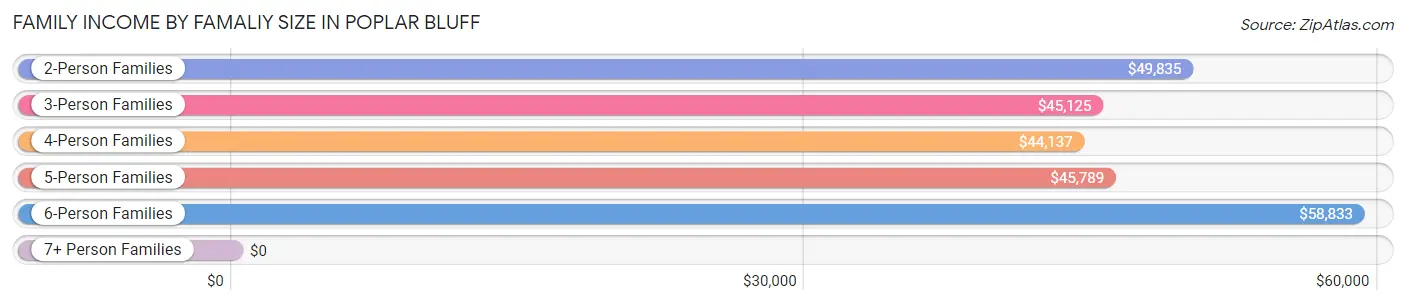
| Income Bracket | # Families | Median Income |
| 2-Person Families | 1,711 (49.1%) | $49,835 |
| 3-Person Families | 971 (27.9%) | $45,125 |
| 4-Person Families | 339 (9.7%) | $44,137 |
| 5-Person Families | 286 (8.2%) | $45,789 |
| 6-Person Families | 126 (3.6%) | $58,833 |
| 7+ Person Families | 50 (1.4%) | $0 |
| Total | 3,483 (100.0%) | $48,510 |
Family Income by Number of Earners in Poplar Bluff
The median family income in Poplar Bluff is $48,510, with families comprising 2 earners (1,063) having the highest median family income of $64,593, while families with no earners (645) have the lowest median family income of $31,723, accounting for 30.5% and 18.5% of families, respectively.
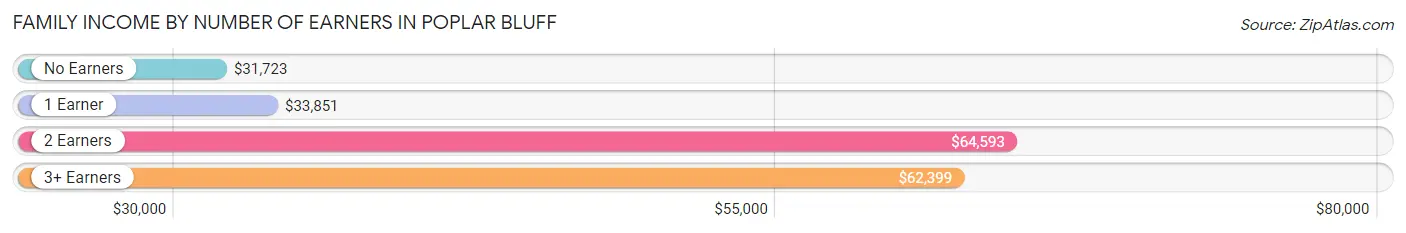
| Number of Earners | # Families | Median Income |
| No Earners | 645 (18.5%) | $31,723 |
| 1 Earner | 1,584 (45.5%) | $33,851 |
| 2 Earners | 1,063 (30.5%) | $64,593 |
| 3+ Earners | 191 (5.5%) | $62,399 |
| Total | 3,483 (100.0%) | $48,510 |
Household Income in Poplar Bluff
Household Income Brackets in Poplar Bluff
With 1,140 households falling in the category, the $50,000 to $74,999 income range is the most frequent in Poplar Bluff, accounting for 18.2% of all households. In contrast, only 69 households (1.1%) fall into the $200,000+ income bracket, making it the least populous group.
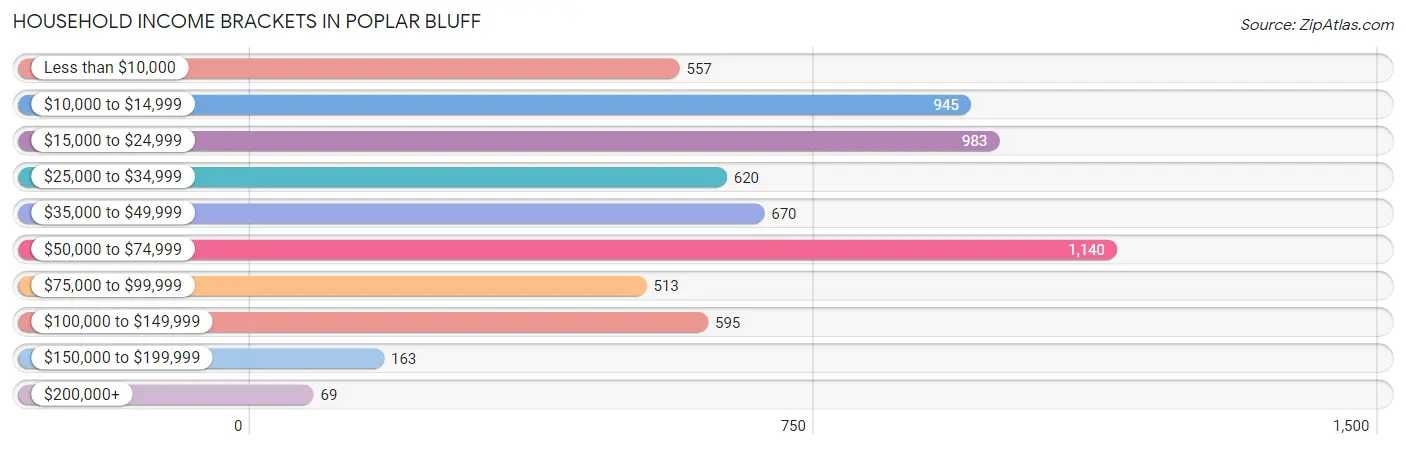
| Income Bracket | # Households | % Households |
| Less than $10,000 | 557 | 8.9% |
| $10,000 to $14,999 | 945 | 15.1% |
| $15,000 to $24,999 | 983 | 15.7% |
| $25,000 to $34,999 | 620 | 9.9% |
| $35,000 to $49,999 | 670 | 10.7% |
| $50,000 to $74,999 | 1,140 | 18.2% |
| $75,000 to $99,999 | 513 | 8.2% |
| $100,000 to $149,999 | 595 | 9.5% |
| $150,000 to $199,999 | 163 | 2.6% |
| $200,000+ | 69 | 1.1% |
Household Income by Householder Age in Poplar Bluff
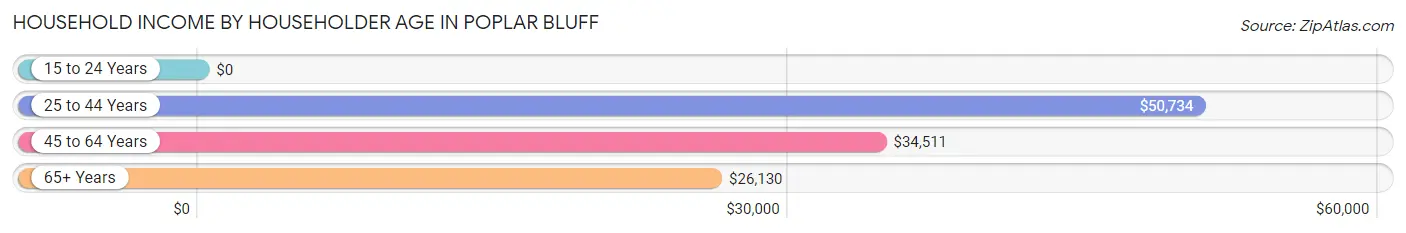
The median household income in Poplar Bluff is $37,448, with the highest median household income of $50,734 found in the 25 to 44 years age bracket for the primary householder. A total of 1,695 households (27.1%) fall into this category. Meanwhile, the 15 to 24 years age bracket for the primary householder has the lowest median household income of $0, with 471 households (7.5%) in this group.
| Income Bracket | # Households | Median Income |
| 15 to 24 Years | 471 (7.5%) | $0 |
| 25 to 44 Years | 1,695 (27.1%) | $50,734 |
| 45 to 64 Years | 2,132 (34.1%) | $34,511 |
| 65+ Years | 1,963 (31.4%) | $26,130 |
| Total | 6,261 (100.0%) | $37,448 |
Poverty in Poplar Bluff
Income Below Poverty by Sex and Age in Poplar Bluff
With 22.2% poverty level for males and 31.2% for females among the residents of Poplar Bluff, 5 year old males and 16 and 17 year old females are the most vulnerable to poverty, with 57 males (41.3%) and 161 females (95.8%) in their respective age groups living below the poverty level.
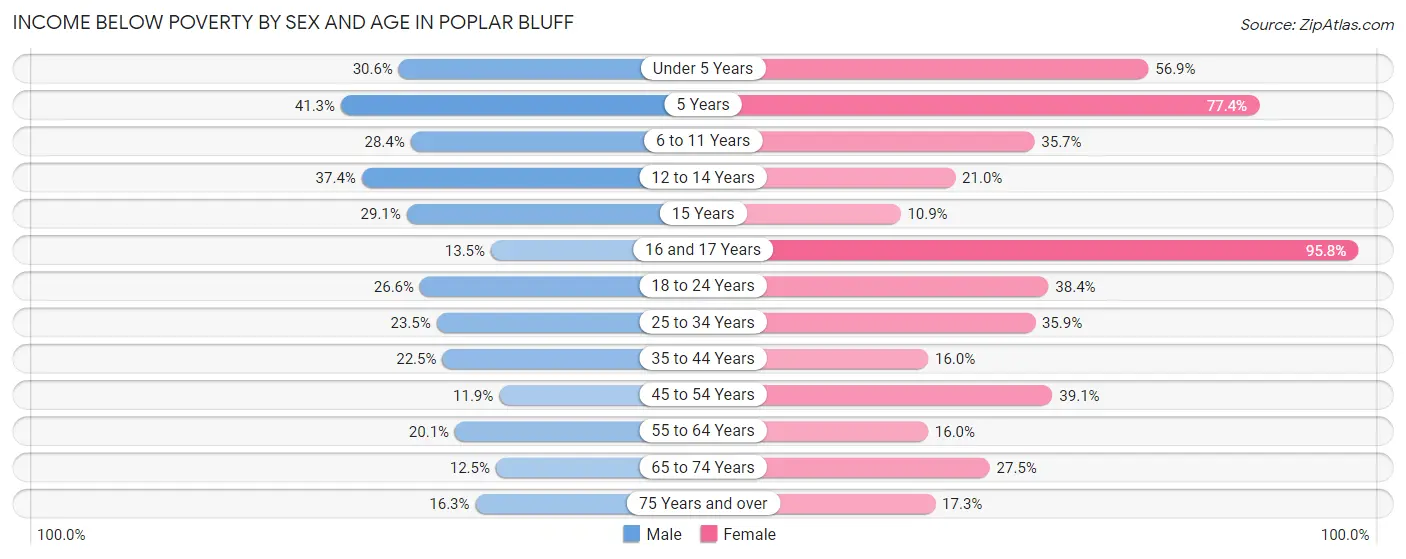
| Age Bracket | Male | Female |
| Under 5 Years | 220 (30.6%) | 334 (56.9%) |
| 5 Years | 57 (41.3%) | 96 (77.4%) |
| 6 to 11 Years | 152 (28.4%) | 203 (35.7%) |
| 12 to 14 Years | 82 (37.4%) | 89 (21.0%) |
| 15 Years | 16 (29.1%) | 11 (10.9%) |
| 16 and 17 Years | 53 (13.5%) | 161 (95.8%) |
| 18 to 24 Years | 172 (26.6%) | 232 (38.4%) |
| 25 to 34 Years | 265 (23.5%) | 402 (35.9%) |
| 35 to 44 Years | 200 (22.5%) | 135 (16.0%) |
| 45 to 54 Years | 72 (11.9%) | 362 (39.1%) |
| 55 to 64 Years | 193 (20.1%) | 171 (16.0%) |
| 65 to 74 Years | 86 (12.5%) | 235 (27.5%) |
| 75 Years and over | 65 (16.3%) | 152 (17.3%) |
| Total | 1,633 (22.2%) | 2,583 (31.2%) |
Income Above Poverty by Sex and Age in Poplar Bluff
According to the poverty statistics in Poplar Bluff, males aged 45 to 54 years and females aged 15 years are the age groups that are most secure financially, with 88.1% of males and 89.1% of females in these age groups living above the poverty line.
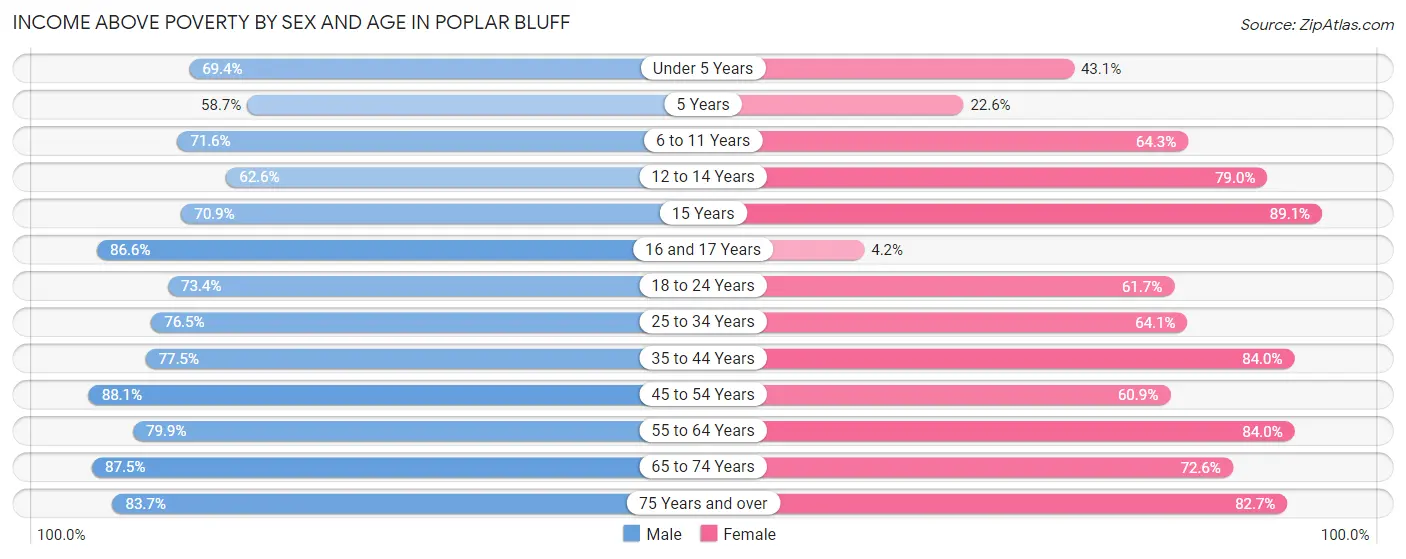
| Age Bracket | Male | Female |
| Under 5 Years | 500 (69.4%) | 253 (43.1%) |
| 5 Years | 81 (58.7%) | 28 (22.6%) |
| 6 to 11 Years | 384 (71.6%) | 365 (64.3%) |
| 12 to 14 Years | 137 (62.6%) | 334 (79.0%) |
| 15 Years | 39 (70.9%) | 90 (89.1%) |
| 16 and 17 Years | 341 (86.6%) | 7 (4.2%) |
| 18 to 24 Years | 474 (73.4%) | 373 (61.7%) |
| 25 to 34 Years | 861 (76.5%) | 719 (64.1%) |
| 35 to 44 Years | 690 (77.5%) | 708 (84.0%) |
| 45 to 54 Years | 532 (88.1%) | 564 (60.9%) |
| 55 to 64 Years | 766 (79.9%) | 900 (84.0%) |
| 65 to 74 Years | 600 (87.5%) | 621 (72.6%) |
| 75 Years and over | 333 (83.7%) | 725 (82.7%) |
| Total | 5,738 (77.8%) | 5,687 (68.8%) |
Income Below Poverty Among Married-Couple Families in Poplar Bluff
The poverty statistics for married-couple families in Poplar Bluff show that 7.4% or 155 of the total 2,103 families live below the poverty line. Families with 5 or more children have the highest poverty rate of 100.0%, comprising of 13 families. On the other hand, families with no children have the lowest poverty rate of 2.6%, which includes 37 families.
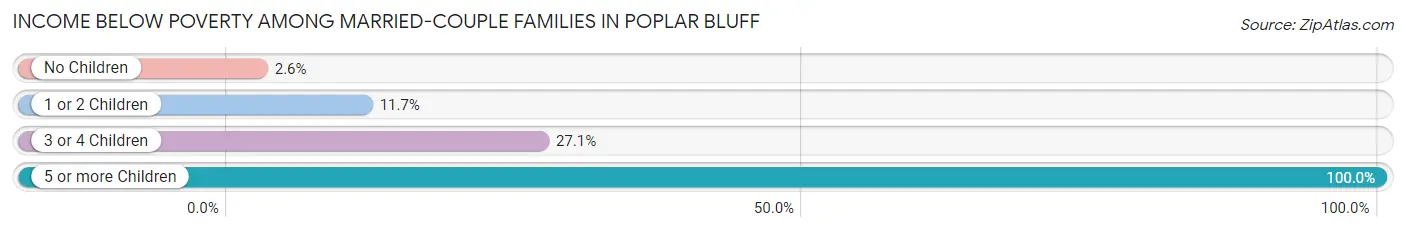
| Children | Above Poverty | Below Poverty |
| No Children | 1,394 (97.4%) | 37 (2.6%) |
| 1 or 2 Children | 422 (88.3%) | 56 (11.7%) |
| 3 or 4 Children | 132 (72.9%) | 49 (27.1%) |
| 5 or more Children | 0 (0.0%) | 13 (100.0%) |
| Total | 1,948 (92.6%) | 155 (7.4%) |
Income Below Poverty Among Single-Parent Households in Poplar Bluff
According to the poverty data in Poplar Bluff, 38.5% or 115 single-father households and 41.9% or 453 single-mother households are living below the poverty line. Among single-father households, those with 1 or 2 children have the highest poverty rate, with 87 households (65.4%) experiencing poverty. Likewise, among single-mother households, those with 3 or 4 children have the highest poverty rate, with 100 households (58.5%) falling below the poverty line.
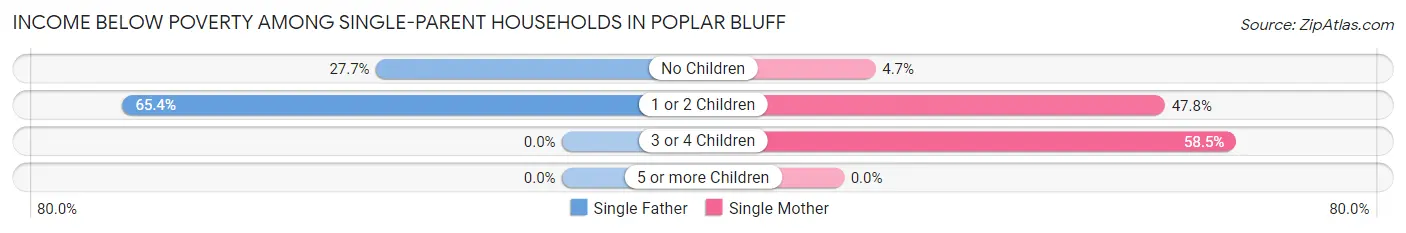
| Children | Single Father | Single Mother |
| No Children | 28 (27.7%) | 9 (4.7%) |
| 1 or 2 Children | 87 (65.4%) | 344 (47.8%) |
| 3 or 4 Children | 0 (0.0%) | 100 (58.5%) |
| 5 or more Children | 0 (0.0%) | 0 (0.0%) |
| Total | 115 (38.5%) | 453 (41.9%) |
Income Below Poverty Among Married-Couple vs Single-Parent Households in Poplar Bluff
The poverty data for Poplar Bluff shows that 155 of the married-couple family households (7.4%) and 568 of the single-parent households (41.2%) are living below the poverty level. Within the married-couple family households, those with 5 or more children have the highest poverty rate, with 13 households (100.0%) falling below the poverty line. Among the single-parent households, those with 1 or 2 children have the highest poverty rate, with 431 household (50.6%) living below poverty.
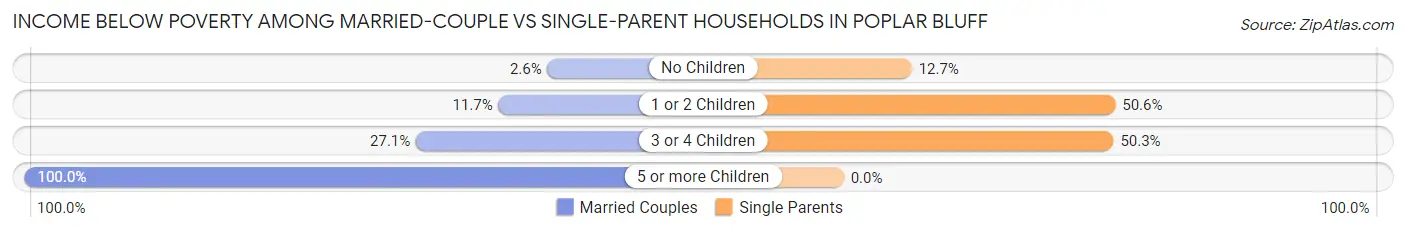
| Children | Married-Couple Families | Single-Parent Households |
| No Children | 37 (2.6%) | 37 (12.7%) |
| 1 or 2 Children | 56 (11.7%) | 431 (50.6%) |
| 3 or 4 Children | 49 (27.1%) | 100 (50.2%) |
| 5 or more Children | 13 (100.0%) | 0 (0.0%) |
| Total | 155 (7.4%) | 568 (41.2%) |
Race in Poplar Bluff
The most populous races in Poplar Bluff are White / Caucasian (12,809 | 78.5%), Black / African American (1,582 | 9.7%), and Two or more Races (1,249 | 7.7%).
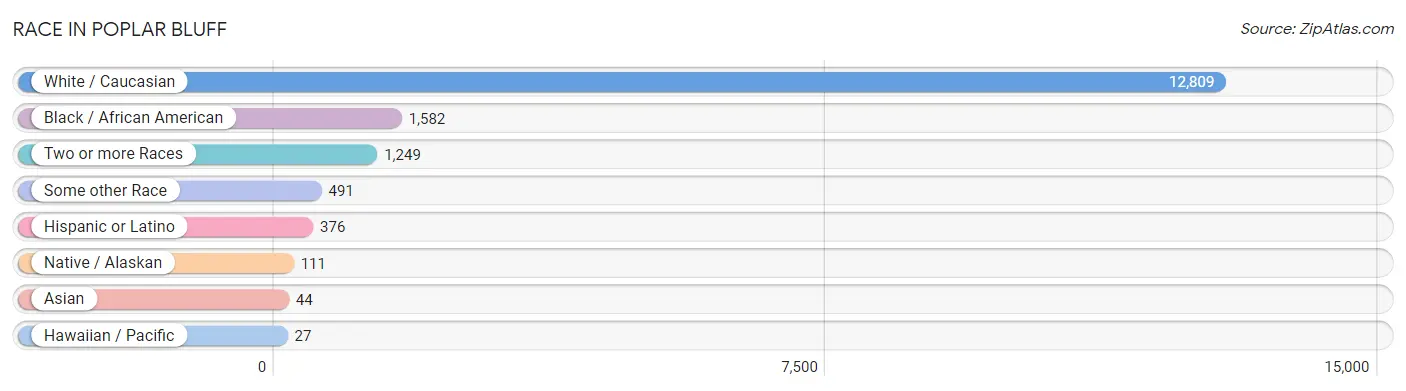
| Race | # Population | % Population |
| Asian | 44 | 0.3% |
| Black / African American | 1,582 | 9.7% |
| Hawaiian / Pacific | 27 | 0.2% |
| Hispanic or Latino | 376 | 2.3% |
| Native / Alaskan | 111 | 0.7% |
| White / Caucasian | 12,809 | 78.5% |
| Two or more Races | 1,249 | 7.7% |
| Some other Race | 491 | 3.0% |
| Total | 16,313 | 100.0% |
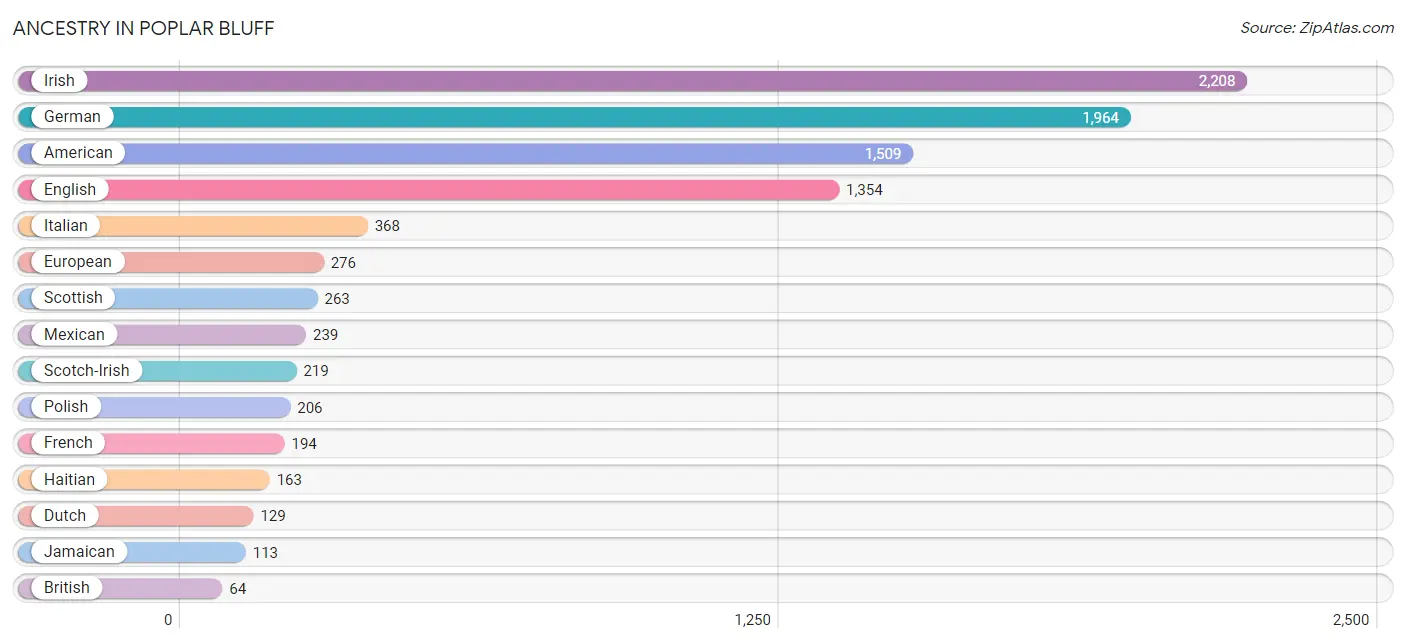
Ancestry in Poplar Bluff
The most populous ancestries reported in Poplar Bluff are Irish (2,208 | 13.5%), German (1,964 | 12.0%), American (1,509 | 9.2%), English (1,354 | 8.3%), and Italian (368 | 2.3%), together accounting for 45.4% of all Poplar Bluff residents.
| Ancestry | # Population | % Population |
| Aleut | 30 | 0.2% |
| American | 1,509 | 9.2% |
| Arab | 47 | 0.3% |
| Austrian | 12 | 0.1% |
| Bhutanese | 11 | 0.1% |
| British | 64 | 0.4% |
| Burmese | 12 | 0.1% |
| Canadian | 7 | 0.0% |
| Central American | 52 | 0.3% |
| Cherokee | 54 | 0.3% |
| Choctaw | 34 | 0.2% |
| Colombian | 23 | 0.1% |
| Comanche | 39 | 0.2% |
| Croatian | 13 | 0.1% |
| Cuban | 27 | 0.2% |
| Dutch | 129 | 0.8% |
| Eastern European | 13 | 0.1% |
| Egyptian | 4 | 0.0% |
| English | 1,354 | 8.3% |
| European | 276 | 1.7% |
| Filipino | 3 | 0.0% |
| French | 194 | 1.2% |
| French Canadian | 25 | 0.2% |
| German | 1,964 | 12.0% |
| Guamanian / Chamorro | 39 | 0.2% |
| Haitian | 163 | 1.0% |
| Honduran | 52 | 0.3% |
| Irish | 2,208 | 13.5% |
| Italian | 368 | 2.3% |
| Jamaican | 113 | 0.7% |
| Korean | 9 | 0.1% |
| Mexican | 239 | 1.5% |
| Nigerian | 12 | 0.1% |
| Northern European | 13 | 0.1% |
| Pennsylvania German | 50 | 0.3% |
| Polish | 206 | 1.3% |
| Potawatomi | 7 | 0.0% |
| Puerto Rican | 31 | 0.2% |
| Scotch-Irish | 219 | 1.3% |
| Scottish | 263 | 1.6% |
| Slovene | 13 | 0.1% |
| South American | 23 | 0.1% |
| Sri Lankan | 23 | 0.1% |
| Subsaharan African | 49 | 0.3% |
| Swedish | 42 | 0.3% |
| Syrian | 43 | 0.3% |
| Welsh | 56 | 0.3% | View All 47 Rows |
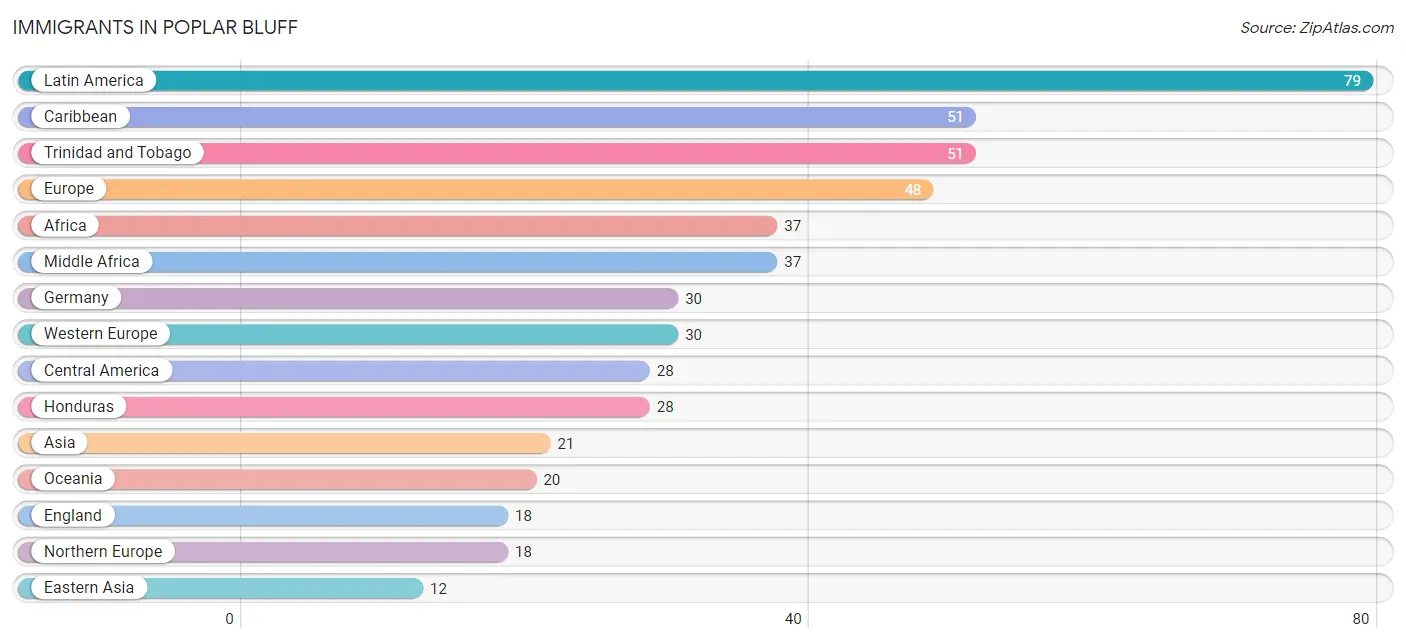
Immigrants in Poplar Bluff
The most numerous immigrant groups reported in Poplar Bluff came from Latin America (79 | 0.5%), Caribbean (51 | 0.3%), Trinidad and Tobago (51 | 0.3%), Europe (48 | 0.3%), and Africa (37 | 0.2%), together accounting for 1.6% of all Poplar Bluff residents.
| Immigration Origin | # Population | % Population |
| Africa | 37 | 0.2% |
| Asia | 21 | 0.1% |
| Canada | 4 | 0.0% |
| Caribbean | 51 | 0.3% |
| Central America | 28 | 0.2% |
| Eastern Asia | 12 | 0.1% |
| England | 18 | 0.1% |
| Europe | 48 | 0.3% |
| Germany | 30 | 0.2% |
| Honduras | 28 | 0.2% |
| Korea | 12 | 0.1% |
| Latin America | 79 | 0.5% |
| Middle Africa | 37 | 0.2% |
| Northern Europe | 18 | 0.1% |
| Oceania | 20 | 0.1% |
| Philippines | 9 | 0.1% |
| South Eastern Asia | 9 | 0.1% |
| Trinidad and Tobago | 51 | 0.3% |
| Western Europe | 30 | 0.2% | View All 19 Rows |
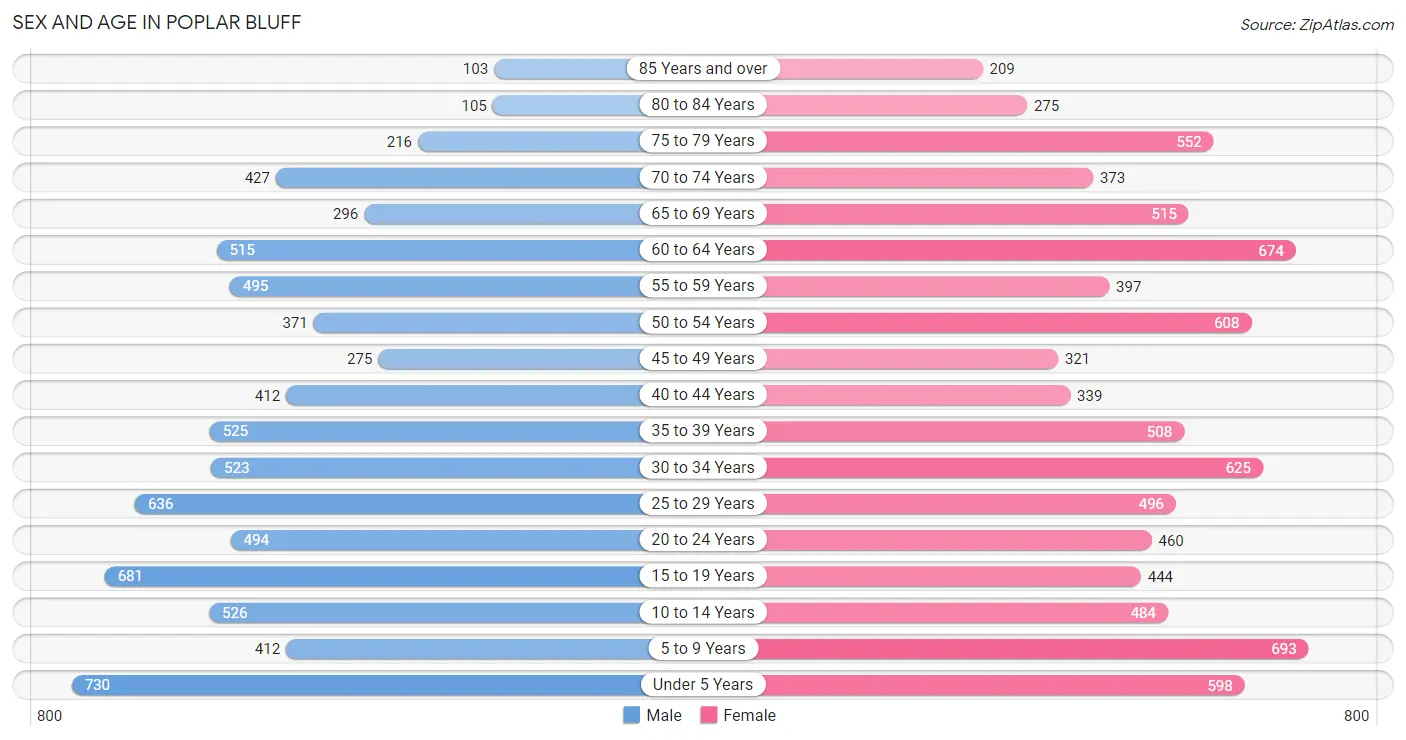
Sex and Age in Poplar Bluff
Sex and Age in Poplar Bluff
The most populous age groups in Poplar Bluff are Under 5 Years (730 | 9.4%) for men and 5 to 9 Years (693 | 8.1%) for women.
| Age Bracket | Male | Female |
| Under 5 Years | 730 (9.4%) | 598 (7.0%) |
| 5 to 9 Years | 412 (5.3%) | 693 (8.1%) |
| 10 to 14 Years | 526 (6.8%) | 484 (5.7%) |
| 15 to 19 Years | 681 (8.8%) | 444 (5.2%) |
| 20 to 24 Years | 494 (6.4%) | 460 (5.4%) |
| 25 to 29 Years | 636 (8.2%) | 496 (5.8%) |
| 30 to 34 Years | 523 (6.8%) | 625 (7.3%) |
| 35 to 39 Years | 525 (6.8%) | 508 (5.9%) |
| 40 to 44 Years | 412 (5.3%) | 339 (4.0%) |
| 45 to 49 Years | 275 (3.5%) | 321 (3.7%) |
| 50 to 54 Years | 371 (4.8%) | 608 (7.1%) |
| 55 to 59 Years | 495 (6.4%) | 397 (4.6%) |
| 60 to 64 Years | 515 (6.7%) | 674 (7.9%) |
| 65 to 69 Years | 296 (3.8%) | 515 (6.0%) |
| 70 to 74 Years | 427 (5.5%) | 373 (4.3%) |
| 75 to 79 Years | 216 (2.8%) | 552 (6.4%) |
| 80 to 84 Years | 105 (1.4%) | 275 (3.2%) |
| 85 Years and over | 103 (1.3%) | 209 (2.4%) |
| Total | 7,742 (100.0%) | 8,571 (100.0%) |
Families and Households in Poplar Bluff
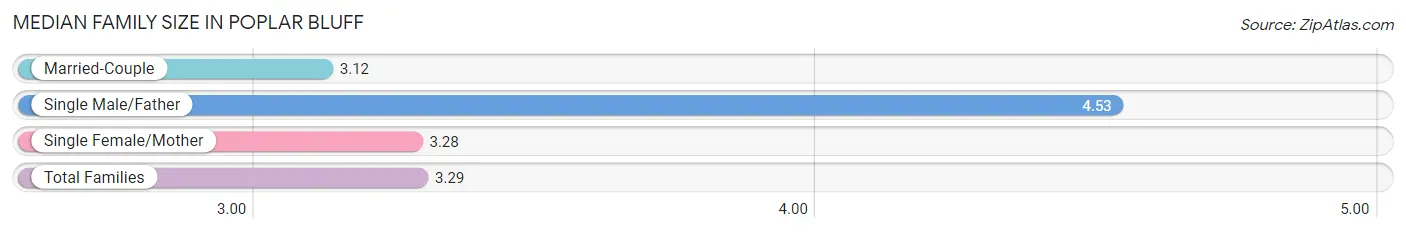
Median Family Size in Poplar Bluff
The median family size in Poplar Bluff is 3.29 persons per family, with single male/father families (299 | 8.6%) accounting for the largest median family size of 4.53 persons per family. On the other hand, married-couple families (2,103 | 60.4%) represent the smallest median family size with 3.12 persons per family.
| Family Type | # Families | Family Size |
| Married-Couple | 2,103 (60.4%) | 3.12 |
| Single Male/Father | 299 (8.6%) | 4.53 |
| Single Female/Mother | 1,081 (31.0%) | 3.28 |
| Total Families | 3,483 (100.0%) | 3.29 |
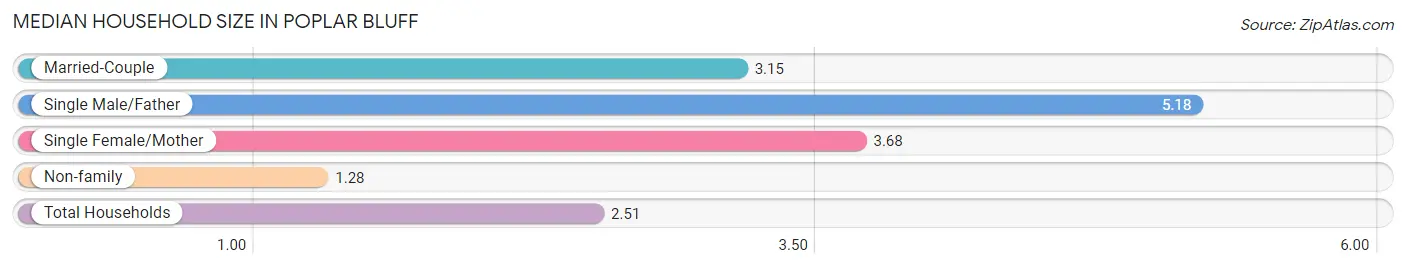
Median Household Size in Poplar Bluff
The median household size in Poplar Bluff is 2.51 persons per household, with single male/father households (299 | 4.8%) accounting for the largest median household size of 5.18 persons per household. non-family households (2,778 | 44.4%) represent the smallest median household size with 1.28 persons per household.
| Household Type | # Households | Household Size |
| Married-Couple | 2,103 (33.6%) | 3.15 |
| Single Male/Father | 299 (4.8%) | 5.18 |
| Single Female/Mother | 1,081 (17.3%) | 3.68 |
| Non-family | 2,778 (44.4%) | 1.28 |
| Total Households | 6,261 (100.0%) | 2.51 |
Household Size by Marriage Status in Poplar Bluff
Out of a total of 6,261 households in Poplar Bluff, 3,483 (55.6%) are family households, while 2,778 (44.4%) are nonfamily households. The most numerous type of family households are 2-person households, comprising 1,511, and the most common type of nonfamily households are 1-person households, comprising 2,545.
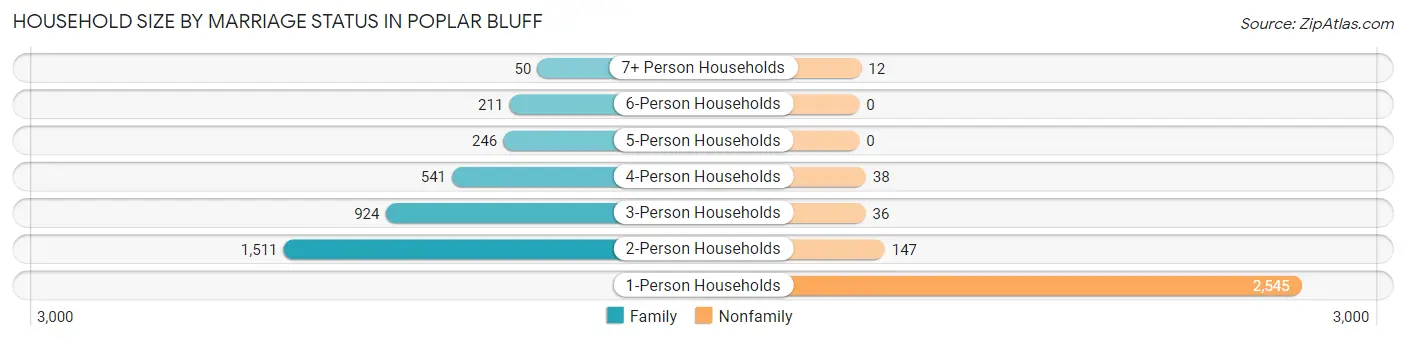
| Household Size | Family Households | Nonfamily Households |
| 1-Person Households | - | 2,545 (40.6%) |
| 2-Person Households | 1,511 (24.1%) | 147 (2.4%) |
| 3-Person Households | 924 (14.8%) | 36 (0.6%) |
| 4-Person Households | 541 (8.6%) | 38 (0.6%) |
| 5-Person Households | 246 (3.9%) | 0 (0.0%) |
| 6-Person Households | 211 (3.4%) | 0 (0.0%) |
| 7+ Person Households | 50 (0.8%) | 12 (0.2%) |
| Total | 3,483 (55.6%) | 2,778 (44.4%) |
Female Fertility in Poplar Bluff
Fertility by Age in Poplar Bluff
Average fertility rate in Poplar Bluff is 68.0 births per 1,000 women. Women in the age bracket of 20 to 34 years have the highest fertility rate with 139.0 births per 1,000 women. Women in the age bracket of 20 to 34 years acount for 99.1% of all women with births.
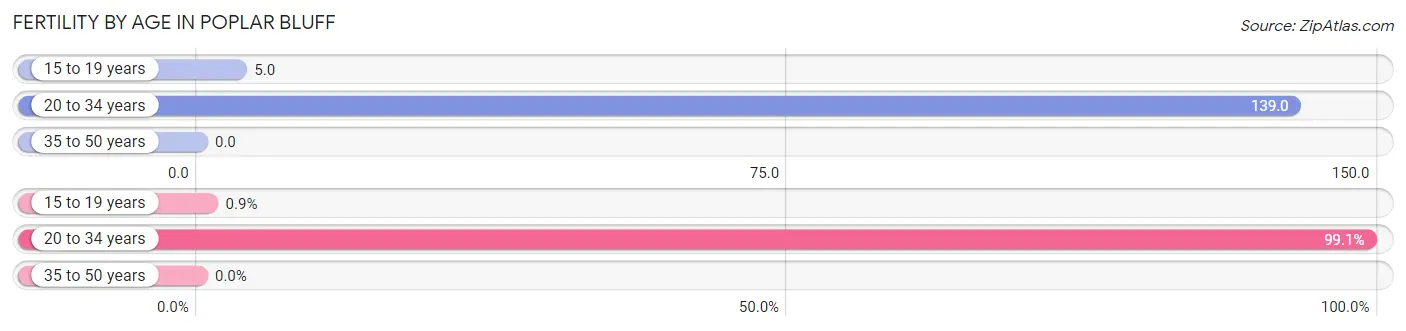
| Age Bracket | Women with Births | Births / 1,000 Women |
| 15 to 19 years | 2 (0.9%) | 5.0 |
| 20 to 34 years | 220 (99.1%) | 139.0 |
| 35 to 50 years | 0 (0.0%) | 0.0 |
| Total | 222 (100.0%) | 68.0 |
Fertility by Age by Marriage Status in Poplar Bluff
38.3% of women with births (222) in Poplar Bluff are married. The highest percentage of unmarried women with births falls into 15 to 19 years age bracket with 100.0% of them unmarried at the time of birth, while the lowest percentage of unmarried women with births belong to 20 to 34 years age bracket with 61.4% of them unmarried.
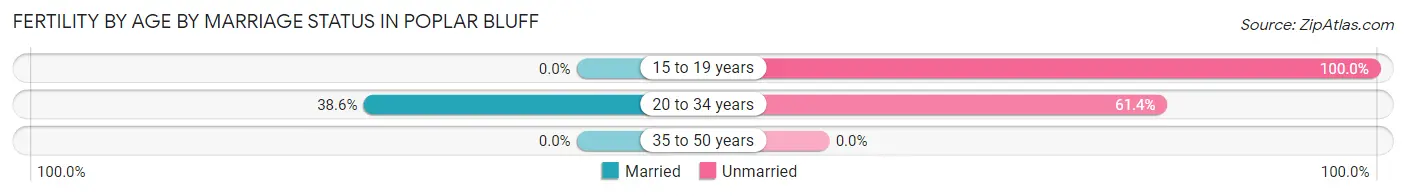
| Age Bracket | Married | Unmarried |
| 15 to 19 years | 0 (0.0%) | 2 (100.0%) |
| 20 to 34 years | 85 (38.6%) | 135 (61.4%) |
| 35 to 50 years | 0 (0.0%) | 0 (0.0%) |
| Total | 85 (38.3%) | 137 (61.7%) |
Fertility by Education in Poplar Bluff
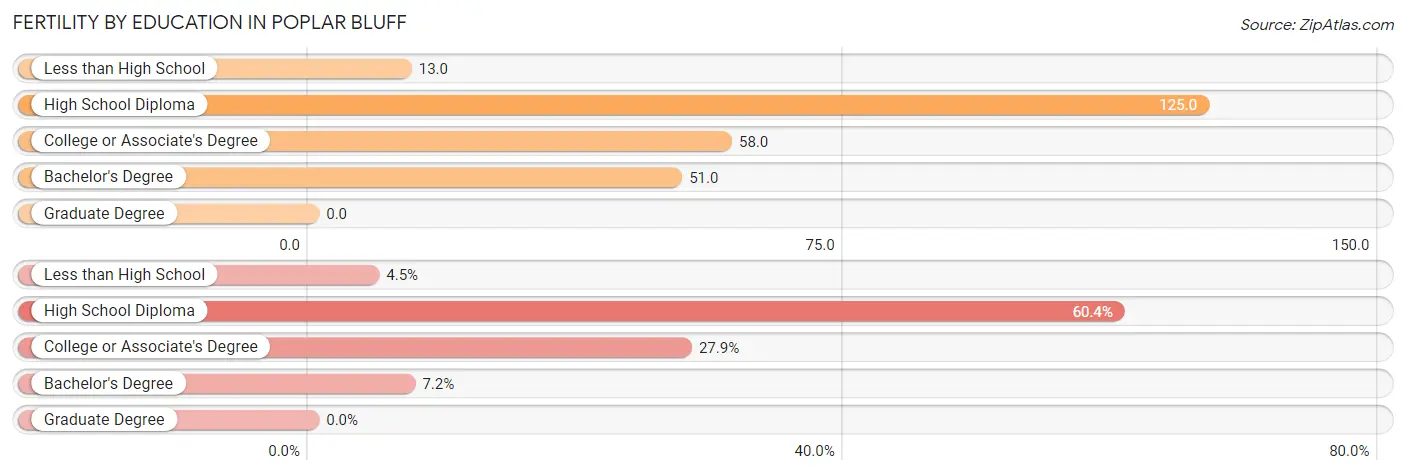
| Educational Attainment | Women with Births | Births / 1,000 Women |
| Less than High School | 10 (4.5%) | 13.0 |
| High School Diploma | 134 (60.4%) | 125.0 |
| College or Associate's Degree | 62 (27.9%) | 58.0 |
| Bachelor's Degree | 16 (7.2%) | 51.0 |
| Graduate Degree | 0 (0.0%) | 0.0 |
| Total | 222 (100.0%) | 68.0 |
Fertility by Education by Marriage Status in Poplar Bluff
61.7% of women with births in Poplar Bluff are unmarried. Women with the educational attainment of bachelor's degree are most likely to be married with 100.0% of them married at childbirth, while women with the educational attainment of less than high school are least likely to be married with 100.0% of them unmarried at childbirth.
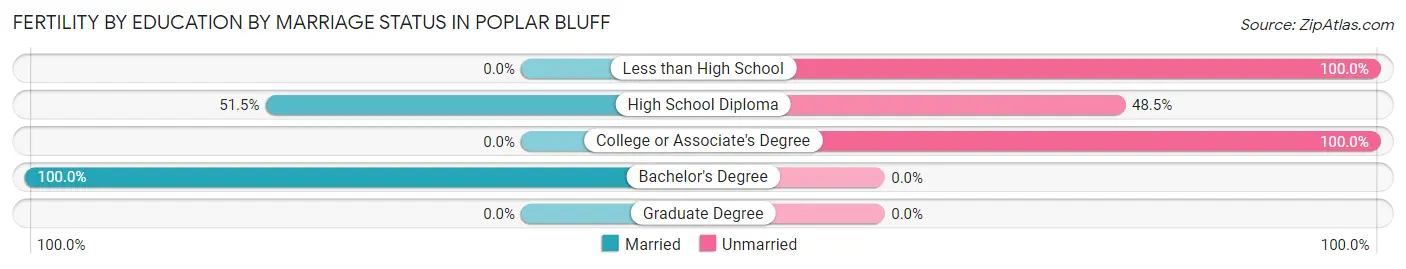
| Educational Attainment | Married | Unmarried |
| Less than High School | 0 (0.0%) | 10 (100.0%) |
| High School Diploma | 69 (51.5%) | 65 (48.5%) |
| College or Associate's Degree | 0 (0.0%) | 62 (100.0%) |
| Bachelor's Degree | 16 (100.0%) | 0 (0.0%) |
| Graduate Degree | 0 (0.0%) | 0 (0.0%) |
| Total | 85 (38.3%) | 137 (61.7%) |
Employment Characteristics in Poplar Bluff
Employment by Class of Employer in Poplar Bluff
Among the 5,899 employed individuals in Poplar Bluff, private company employees (4,497 | 76.2%), self-employed (not incorporated) (352 | 6.0%), and federal government employees (289 | 4.9%) make up the most common classes of employment.
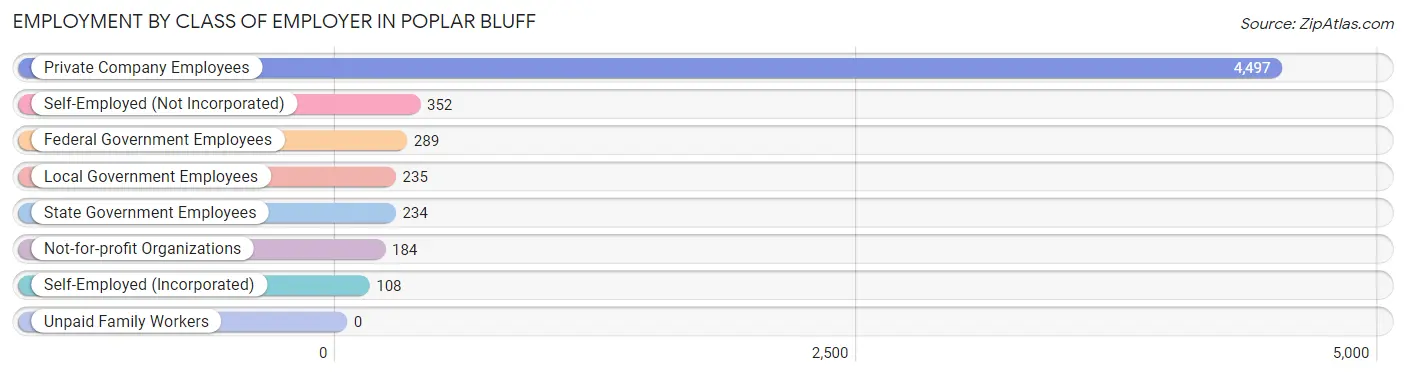
| Employer Class | # Employees | % Employees |
| Private Company Employees | 4,497 | 76.2% |
| Self-Employed (Incorporated) | 108 | 1.8% |
| Self-Employed (Not Incorporated) | 352 | 6.0% |
| Not-for-profit Organizations | 184 | 3.1% |
| Local Government Employees | 235 | 4.0% |
| State Government Employees | 234 | 4.0% |
| Federal Government Employees | 289 | 4.9% |
| Unpaid Family Workers | 0 | 0.0% |
| Total | 5,899 | 100.0% |
Employment Status by Age in Poplar Bluff
According to the labor force statistics for Poplar Bluff, out of the total population over 16 years of age (12,714), 50.0% or 6,357 individuals are in the labor force, with 5.9% or 375 of them unemployed. The age group with the highest labor force participation rate is 30 to 34 years, with 82.1% or 943 individuals in the labor force. Within the labor force, the 16 to 19 years age range has the highest percentage of unemployed individuals, with 26.2% or 68 of them being unemployed.
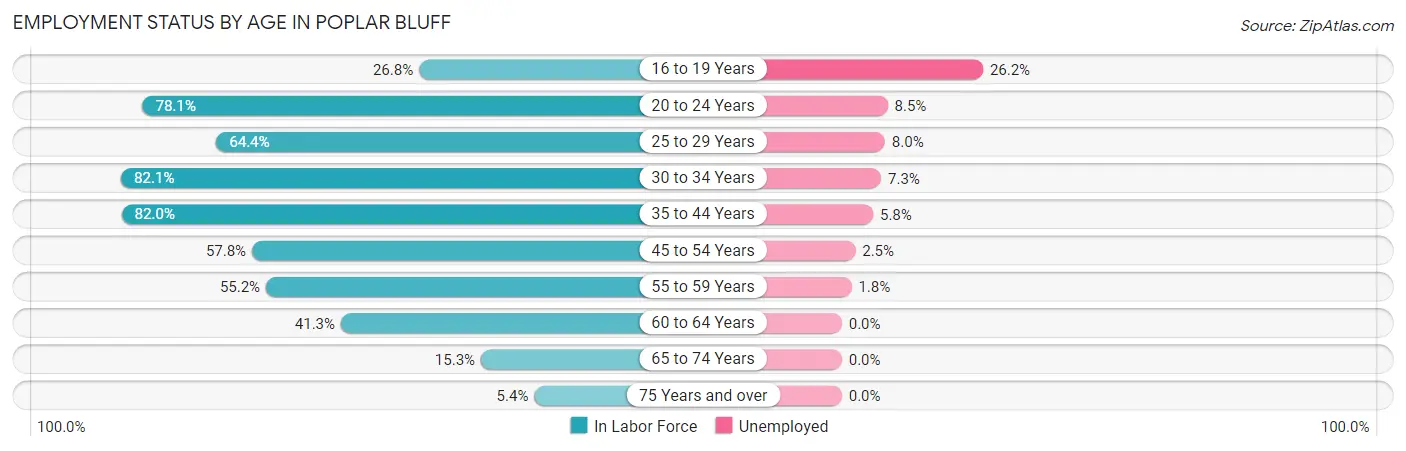
| Age Bracket | In Labor Force | Unemployed |
| 16 to 19 Years | 260 (26.8%) | 68 (26.2%) |
| 20 to 24 Years | 745 (78.1%) | 63 (8.5%) |
| 25 to 29 Years | 729 (64.4%) | 58 (8.0%) |
| 30 to 34 Years | 943 (82.1%) | 69 (7.3%) |
| 35 to 44 Years | 1,463 (82.0%) | 85 (5.8%) |
| 45 to 54 Years | 910 (57.8%) | 23 (2.5%) |
| 55 to 59 Years | 492 (55.2%) | 9 (1.8%) |
| 60 to 64 Years | 491 (41.3%) | 0 (0.0%) |
| 65 to 74 Years | 246 (15.3%) | 0 (0.0%) |
| 75 Years and over | 79 (5.4%) | 0 (0.0%) |
| Total | 6,357 (50.0%) | 375 (5.9%) |
Employment Status by Educational Attainment in Poplar Bluff
According to labor force statistics for Poplar Bluff, 65.1% of individuals (5,026) out of the total population between 25 and 64 years of age (7,720) are in the labor force, with 4.9% or 246 of them being unemployed. The group with the highest labor force participation rate are those with the educational attainment of bachelor's degree or higher, with 84.8% or 872 individuals in the labor force. Within the labor force, individuals with college / associate degree education have the highest percentage of unemployment, with 6.3% or 109 of them being unemployed.
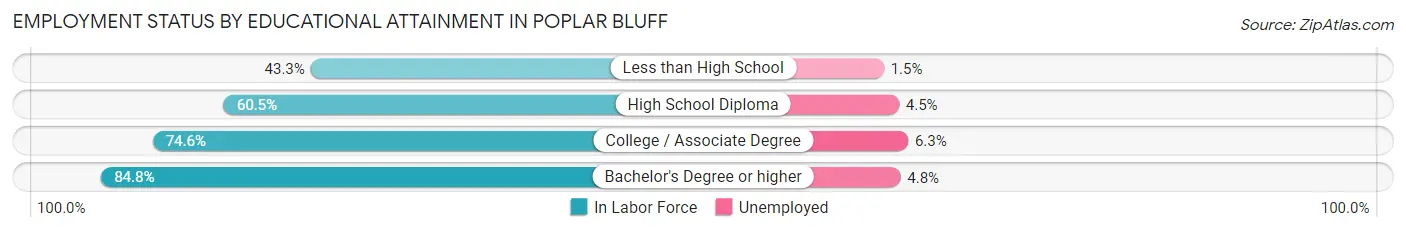
| Educational Attainment | In Labor Force | Unemployed |
| Less than High School | 550 (43.3%) | 19 (1.5%) |
| High School Diploma | 1,882 (60.5%) | 140 (4.5%) |
| College / Associate Degree | 1,724 (74.6%) | 146 (6.3%) |
| Bachelor's Degree or higher | 872 (84.8%) | 49 (4.8%) |
| Total | 5,026 (65.1%) | 378 (4.9%) |
Employment Occupations by Sex in Poplar Bluff
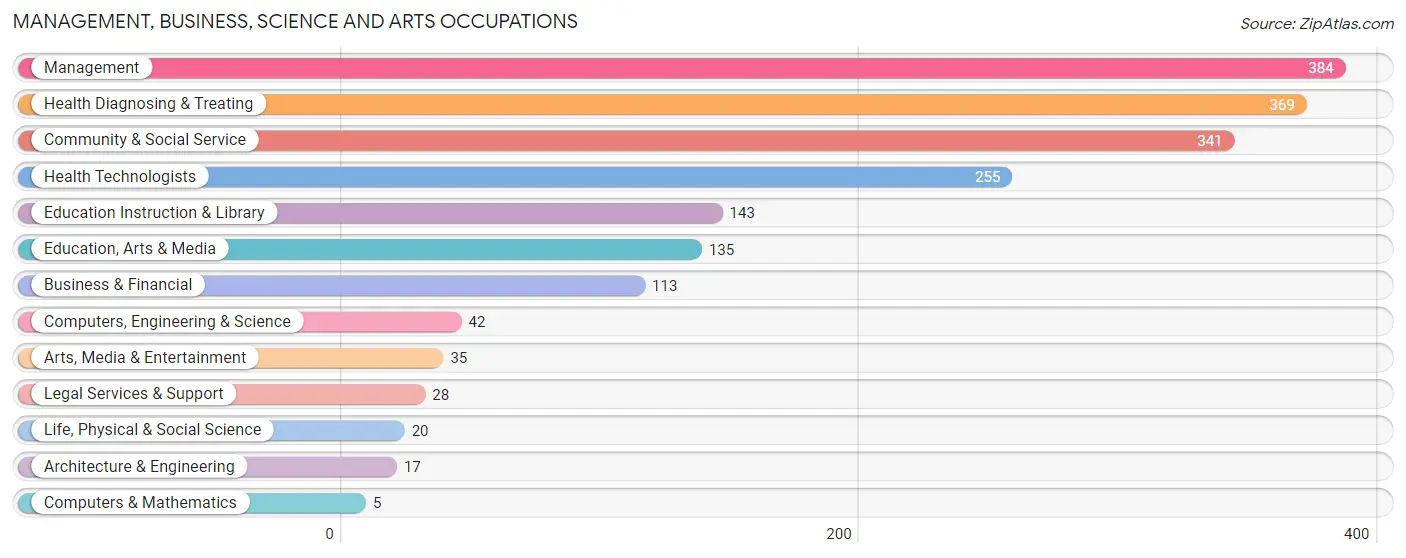
Management, Business, Science and Arts Occupations
The most common Management, Business, Science and Arts occupations in Poplar Bluff are Management (384 | 6.4%), Health Diagnosing & Treating (369 | 6.2%), Community & Social Service (341 | 5.7%), Health Technologists (255 | 4.3%), and Education Instruction & Library (143 | 2.4%).
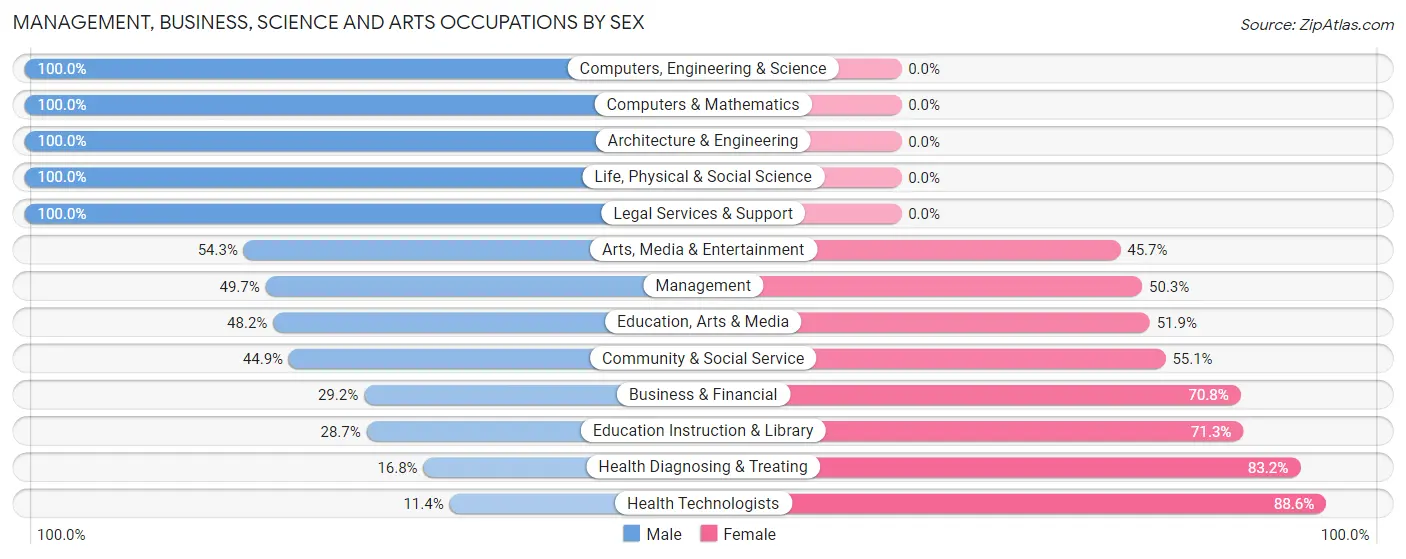
Management, Business, Science and Arts Occupations by Sex
Within the Management, Business, Science and Arts occupations in Poplar Bluff, the most male-oriented occupations are Computers, Engineering & Science (100.0%), Computers & Mathematics (100.0%), and Architecture & Engineering (100.0%), while the most female-oriented occupations are Health Technologists (88.6%), Health Diagnosing & Treating (83.2%), and Education Instruction & Library (71.3%).
| Occupation | Male | Female |
| Management | 191 (49.7%) | 193 (50.3%) |
| Business & Financial | 33 (29.2%) | 80 (70.8%) |
| Computers, Engineering & Science | 42 (100.0%) | 0 (0.0%) |
| Computers & Mathematics | 5 (100.0%) | 0 (0.0%) |
| Architecture & Engineering | 17 (100.0%) | 0 (0.0%) |
| Life, Physical & Social Science | 20 (100.0%) | 0 (0.0%) |
| Community & Social Service | 153 (44.9%) | 188 (55.1%) |
| Education, Arts & Media | 65 (48.1%) | 70 (51.8%) |
| Legal Services & Support | 28 (100.0%) | 0 (0.0%) |
| Education Instruction & Library | 41 (28.7%) | 102 (71.3%) |
| Arts, Media & Entertainment | 19 (54.3%) | 16 (45.7%) |
| Health Diagnosing & Treating | 62 (16.8%) | 307 (83.2%) |
| Health Technologists | 29 (11.4%) | 226 (88.6%) |
| Total (Category) | 481 (38.5%) | 768 (61.5%) |
| Total (Overall) | 3,192 (53.4%) | 2,782 (46.6%) |
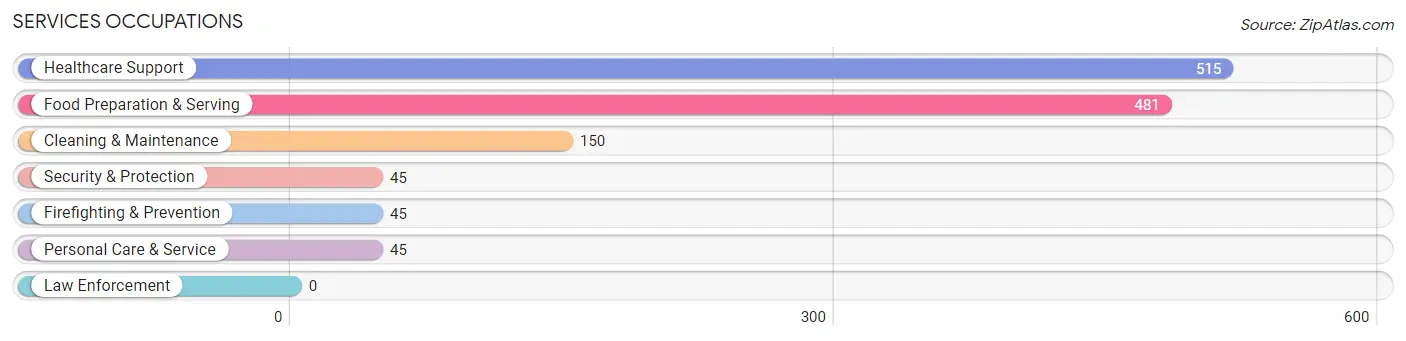
Services Occupations
The most common Services occupations in Poplar Bluff are Healthcare Support (515 | 8.6%), Food Preparation & Serving (481 | 8.1%), Cleaning & Maintenance (150 | 2.5%), Security & Protection (45 | 0.7%), and Firefighting & Prevention (45 | 0.7%).
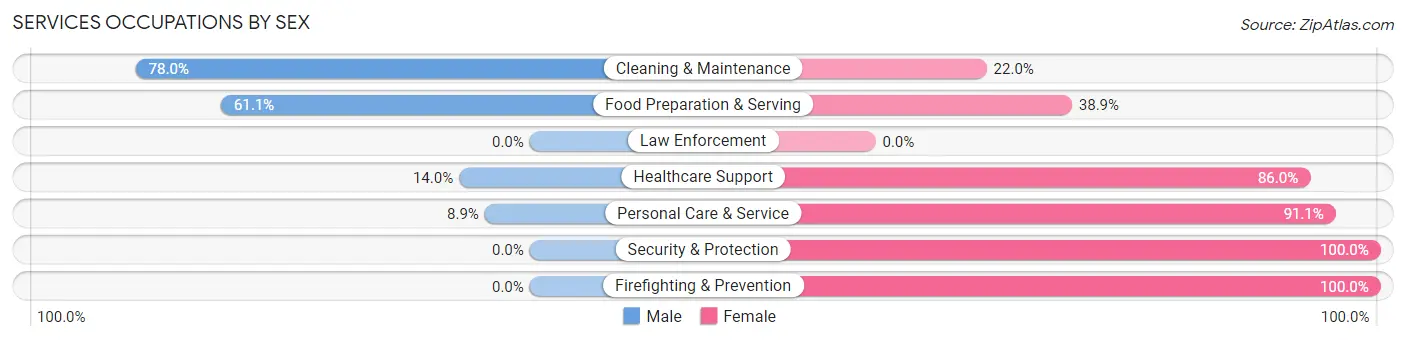
Services Occupations by Sex
Within the Services occupations in Poplar Bluff, the most male-oriented occupations are Cleaning & Maintenance (78.0%), Food Preparation & Serving (61.1%), and Healthcare Support (14.0%), while the most female-oriented occupations are Security & Protection (100.0%), Firefighting & Prevention (100.0%), and Personal Care & Service (91.1%).
| Occupation | Male | Female |
| Healthcare Support | 72 (14.0%) | 443 (86.0%) |
| Security & Protection | 0 (0.0%) | 45 (100.0%) |
| Firefighting & Prevention | 0 (0.0%) | 45 (100.0%) |
| Law Enforcement | 0 (0.0%) | 0 (0.0%) |
| Food Preparation & Serving | 294 (61.1%) | 187 (38.9%) |
| Cleaning & Maintenance | 117 (78.0%) | 33 (22.0%) |
| Personal Care & Service | 4 (8.9%) | 41 (91.1%) |
| Total (Category) | 487 (39.4%) | 749 (60.6%) |
| Total (Overall) | 3,192 (53.4%) | 2,782 (46.6%) |
Sales and Office Occupations
The most common Sales and Office occupations in Poplar Bluff are Sales & Related (657 | 11.0%), and Office & Administration (650 | 10.9%).

Sales and Office Occupations by Sex
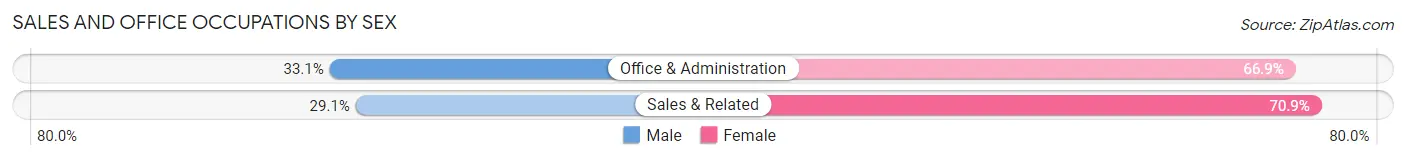
| Occupation | Male | Female |
| Sales & Related | 191 (29.1%) | 466 (70.9%) |
| Office & Administration | 215 (33.1%) | 435 (66.9%) |
| Total (Category) | 406 (31.1%) | 901 (68.9%) |
| Total (Overall) | 3,192 (53.4%) | 2,782 (46.6%) |
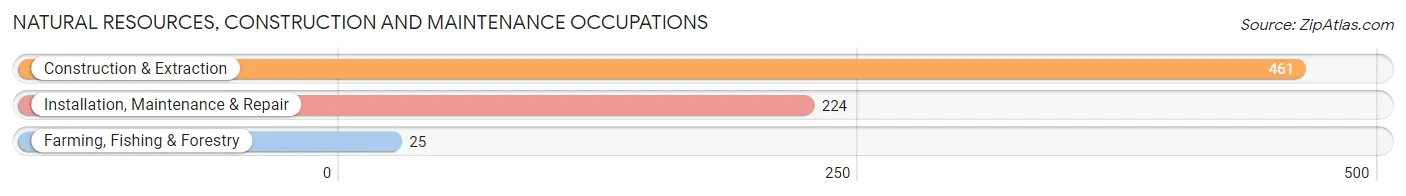
Natural Resources, Construction and Maintenance Occupations
The most common Natural Resources, Construction and Maintenance occupations in Poplar Bluff are Construction & Extraction (461 | 7.7%), Installation, Maintenance & Repair (224 | 3.7%), and Farming, Fishing & Forestry (25 | 0.4%).
Natural Resources, Construction and Maintenance Occupations by Sex
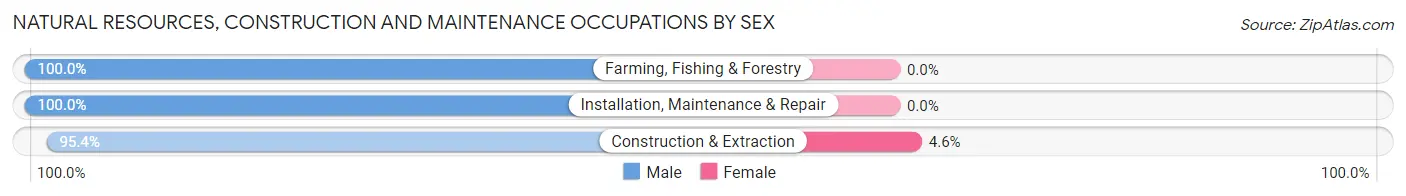
| Occupation | Male | Female |
| Farming, Fishing & Forestry | 25 (100.0%) | 0 (0.0%) |
| Construction & Extraction | 440 (95.4%) | 21 (4.6%) |
| Installation, Maintenance & Repair | 224 (100.0%) | 0 (0.0%) |
| Total (Category) | 689 (97.0%) | 21 (3.0%) |
| Total (Overall) | 3,192 (53.4%) | 2,782 (46.6%) |
Production, Transportation and Moving Occupations
The most common Production, Transportation and Moving occupations in Poplar Bluff are Production (577 | 9.7%), Material Moving (463 | 7.7%), and Transportation (432 | 7.2%).
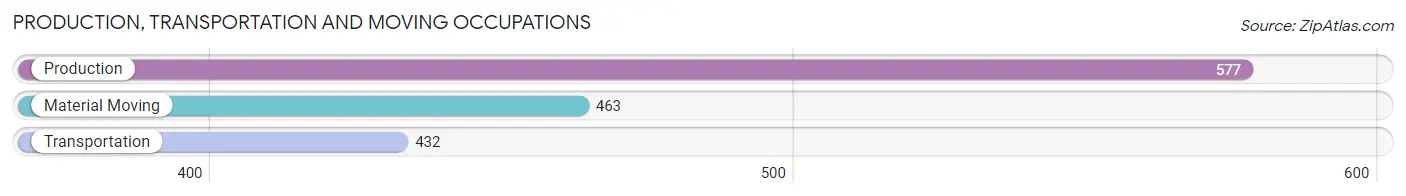
Production, Transportation and Moving Occupations by Sex
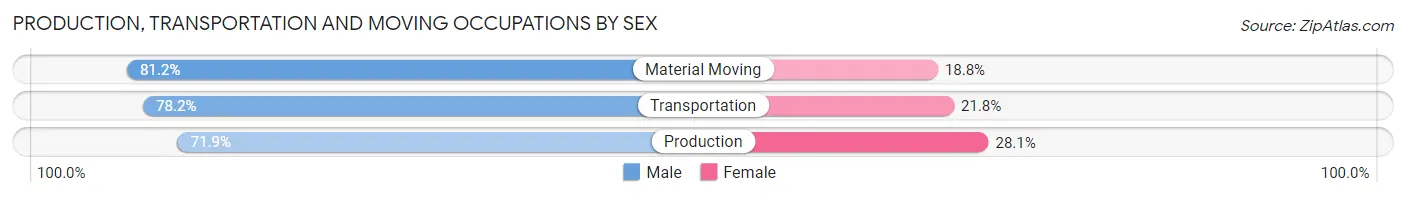
| Occupation | Male | Female |
| Production | 415 (71.9%) | 162 (28.1%) |
| Transportation | 338 (78.2%) | 94 (21.8%) |
| Material Moving | 376 (81.2%) | 87 (18.8%) |
| Total (Category) | 1,129 (76.7%) | 343 (23.3%) |
| Total (Overall) | 3,192 (53.4%) | 2,782 (46.6%) |
Employment Industries by Sex in Poplar Bluff
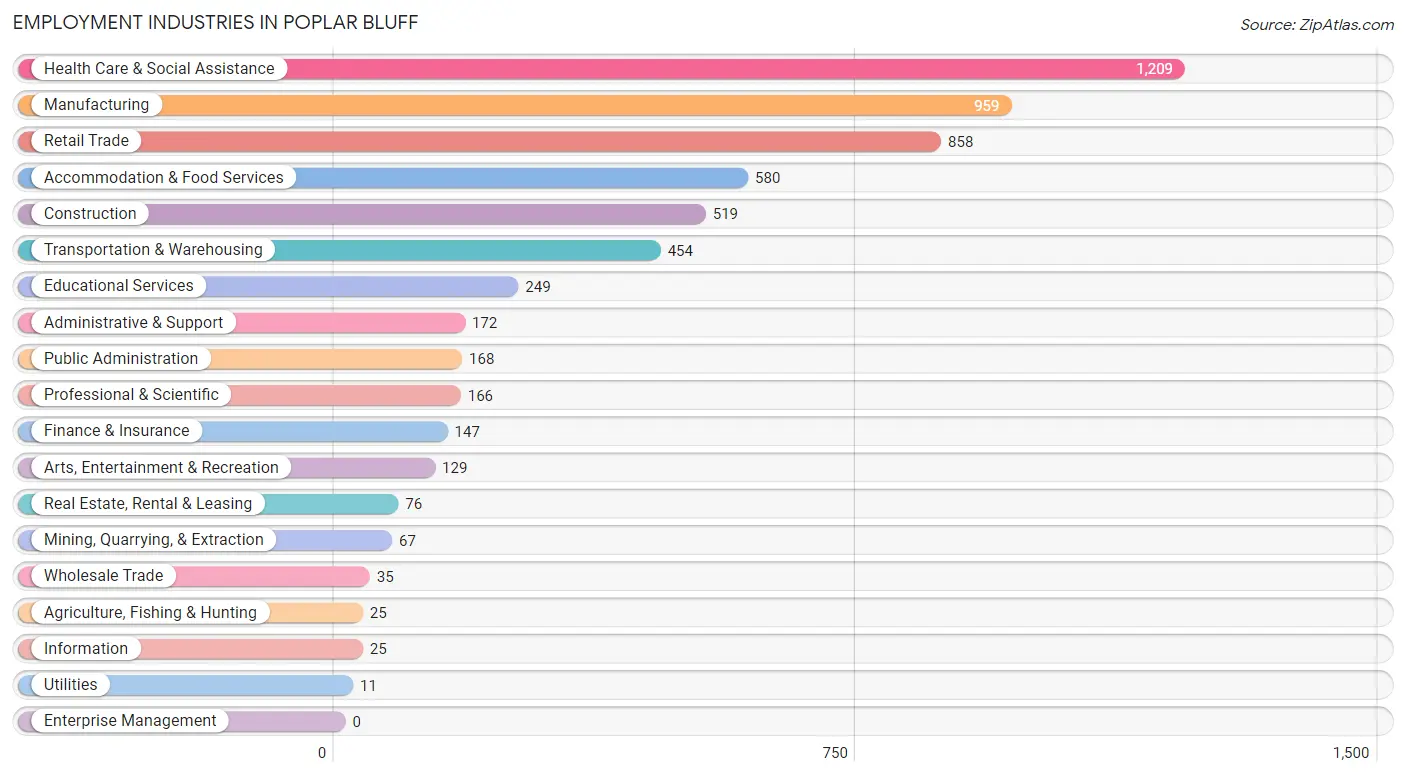
Employment Industries in Poplar Bluff
The major employment industries in Poplar Bluff include Health Care & Social Assistance (1,209 | 20.2%), Manufacturing (959 | 16.1%), Retail Trade (858 | 14.4%), Accommodation & Food Services (580 | 9.7%), and Construction (519 | 8.7%).
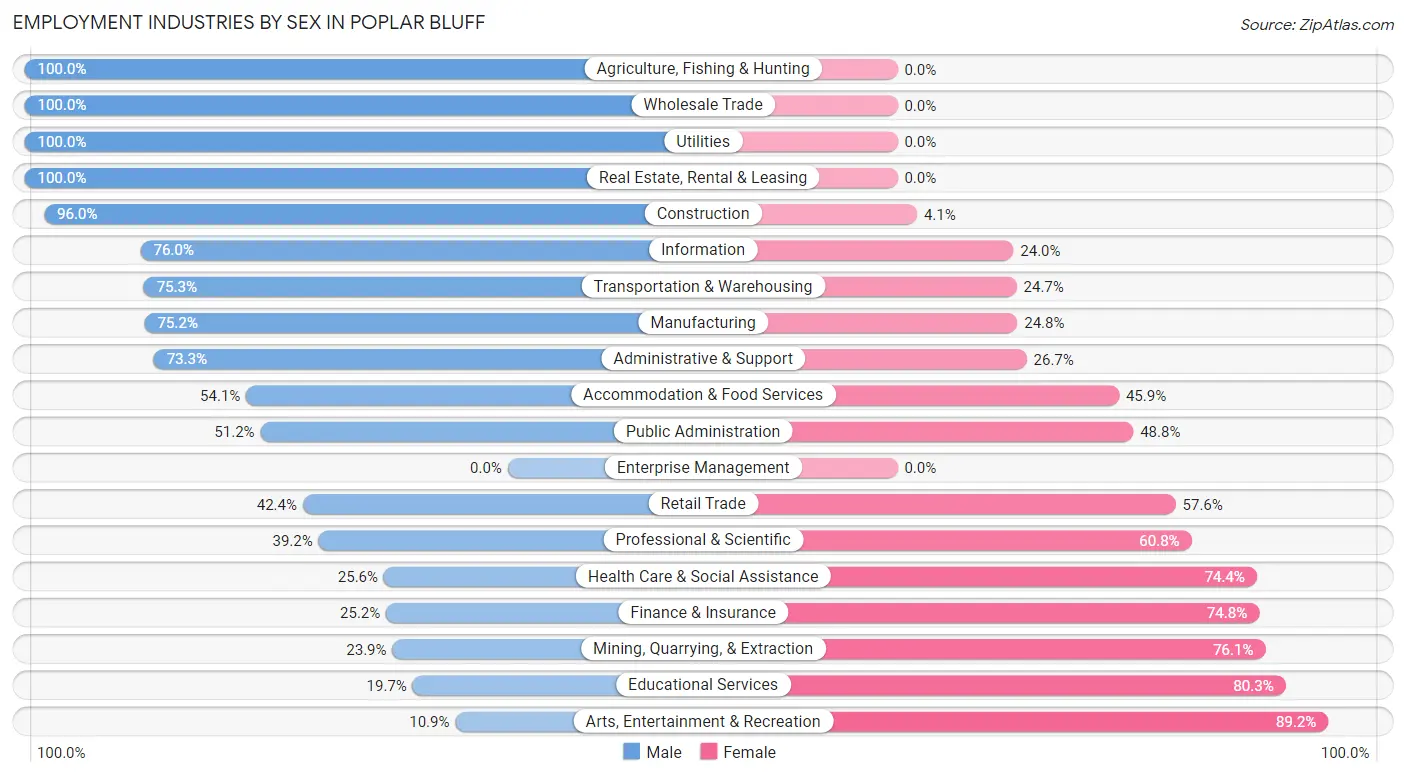
Employment Industries by Sex in Poplar Bluff
The Poplar Bluff industries that see more men than women are Agriculture, Fishing & Hunting (100.0%), Wholesale Trade (100.0%), and Utilities (100.0%), whereas the industries that tend to have a higher number of women are Arts, Entertainment & Recreation (89.1%), Educational Services (80.3%), and Mining, Quarrying, & Extraction (76.1%).
| Industry | Male | Female |
| Agriculture, Fishing & Hunting | 25 (100.0%) | 0 (0.0%) |
| Mining, Quarrying, & Extraction | 16 (23.9%) | 51 (76.1%) |
| Construction | 498 (96.0%) | 21 (4.1%) |
| Manufacturing | 721 (75.2%) | 238 (24.8%) |
| Wholesale Trade | 35 (100.0%) | 0 (0.0%) |
| Retail Trade | 364 (42.4%) | 494 (57.6%) |
| Transportation & Warehousing | 342 (75.3%) | 112 (24.7%) |
| Utilities | 11 (100.0%) | 0 (0.0%) |
| Information | 19 (76.0%) | 6 (24.0%) |
| Finance & Insurance | 37 (25.2%) | 110 (74.8%) |
| Real Estate, Rental & Leasing | 76 (100.0%) | 0 (0.0%) |
| Professional & Scientific | 65 (39.2%) | 101 (60.8%) |
| Enterprise Management | 0 (0.0%) | 0 (0.0%) |
| Administrative & Support | 126 (73.3%) | 46 (26.7%) |
| Educational Services | 49 (19.7%) | 200 (80.3%) |
| Health Care & Social Assistance | 310 (25.6%) | 899 (74.4%) |
| Arts, Entertainment & Recreation | 14 (10.8%) | 115 (89.1%) |
| Accommodation & Food Services | 314 (54.1%) | 266 (45.9%) |
| Public Administration | 86 (51.2%) | 82 (48.8%) |
| Total | 3,192 (53.4%) | 2,782 (46.6%) |
Education in Poplar Bluff
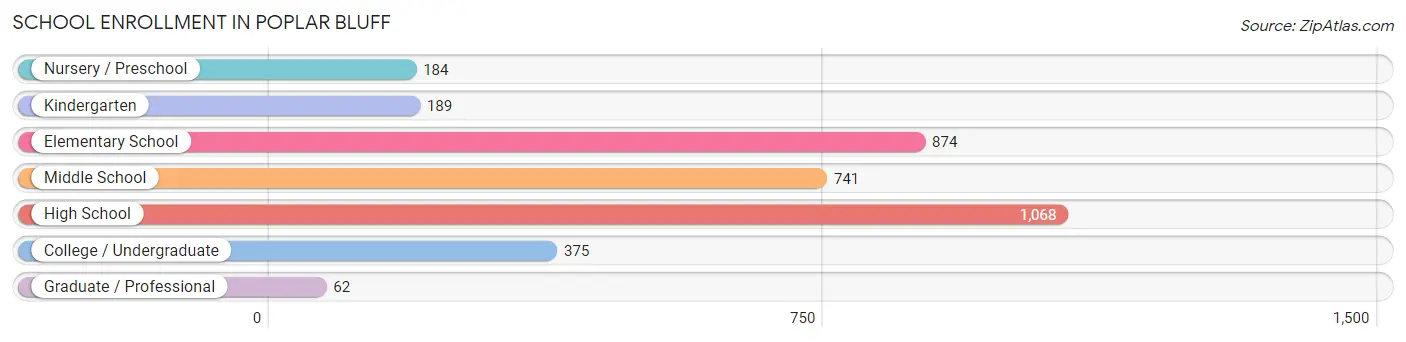
School Enrollment in Poplar Bluff
The most common levels of schooling among the 3,493 students in Poplar Bluff are high school (1,068 | 30.6%), elementary school (874 | 25.0%), and middle school (741 | 21.2%).
| School Level | # Students | % Students |
| Nursery / Preschool | 184 | 5.3% |
| Kindergarten | 189 | 5.4% |
| Elementary School | 874 | 25.0% |
| Middle School | 741 | 21.2% |
| High School | 1,068 | 30.6% |
| College / Undergraduate | 375 | 10.7% |
| Graduate / Professional | 62 | 1.8% |
| Total | 3,493 | 100.0% |
School Enrollment by Age by Funding Source in Poplar Bluff
Out of a total of 3,493 students who are enrolled in schools in Poplar Bluff, 416 (11.9%) attend a private institution, while the remaining 3,077 (88.1%) are enrolled in public schools. The age group of 20 to 24 year olds has the highest likelihood of being enrolled in private schools, with 34 (18.1% in the age bracket) enrolled. Conversely, the age group of 35 years and over has the lowest likelihood of being enrolled in a private school, with 307 (100.0% in the age bracket) attending a public institution.
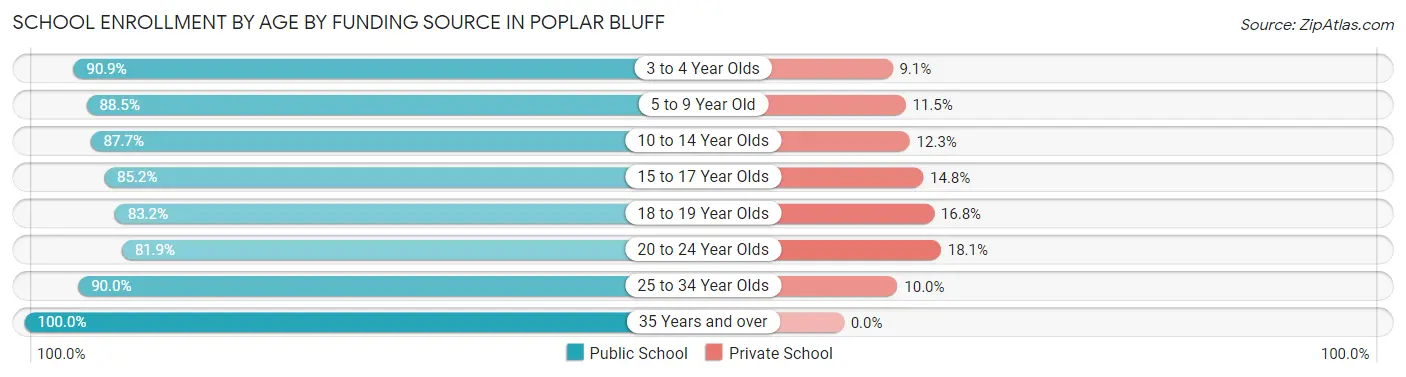
| Age Bracket | Public School | Private School |
| 3 to 4 Year Olds | 110 (90.9%) | 11 (9.1%) |
| 5 to 9 Year Old | 821 (88.5%) | 107 (11.5%) |
| 10 to 14 Year Olds | 878 (87.7%) | 123 (12.3%) |
| 15 to 17 Year Olds | 547 (85.2%) | 95 (14.8%) |
| 18 to 19 Year Olds | 188 (83.2%) | 38 (16.8%) |
| 20 to 24 Year Olds | 154 (81.9%) | 34 (18.1%) |
| 25 to 34 Year Olds | 72 (90.0%) | 8 (10.0%) |
| 35 Years and over | 307 (100.0%) | 0 (0.0%) |
| Total | 3,077 (88.1%) | 416 (11.9%) |
Educational Attainment by Field of Study in Poplar Bluff
Education (418 | 27.2%), business (326 | 21.2%), science & technology (190 | 12.4%), bio, nature & agricultural (102 | 6.6%), and liberal arts & history (99 | 6.4%) are the most common fields of study among 1,537 individuals in Poplar Bluff who have obtained a bachelor's degree or higher.
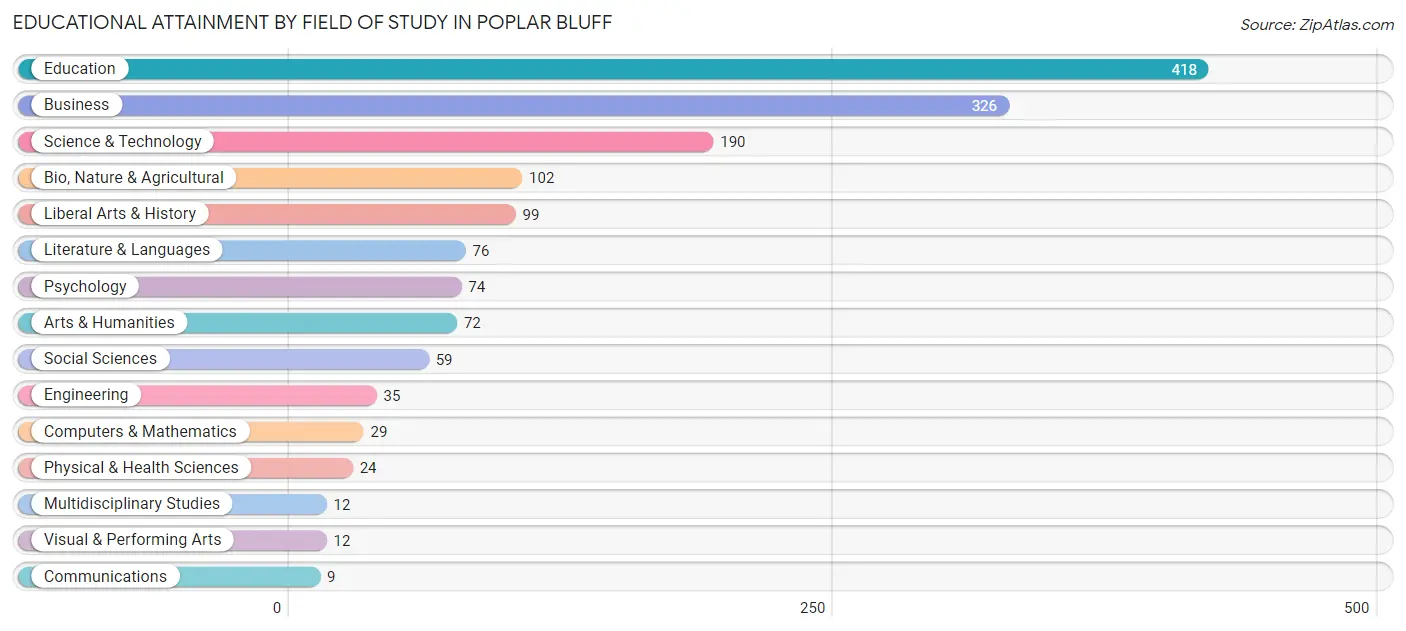
| Field of Study | # Graduates | % Graduates |
| Computers & Mathematics | 29 | 1.9% |
| Bio, Nature & Agricultural | 102 | 6.6% |
| Physical & Health Sciences | 24 | 1.6% |
| Psychology | 74 | 4.8% |
| Social Sciences | 59 | 3.8% |
| Engineering | 35 | 2.3% |
| Multidisciplinary Studies | 12 | 0.8% |
| Science & Technology | 190 | 12.4% |
| Business | 326 | 21.2% |
| Education | 418 | 27.2% |
| Literature & Languages | 76 | 4.9% |
| Liberal Arts & History | 99 | 6.4% |
| Visual & Performing Arts | 12 | 0.8% |
| Communications | 9 | 0.6% |
| Arts & Humanities | 72 | 4.7% |
| Total | 1,537 | 100.0% |
Transportation & Commute in Poplar Bluff
Vehicle Availability by Sex in Poplar Bluff
The most prevalent vehicle ownership categories in Poplar Bluff are males with 2 vehicles (1,410, accounting for 44.8%) and females with 2 vehicles (1,149, making up 51.6%).
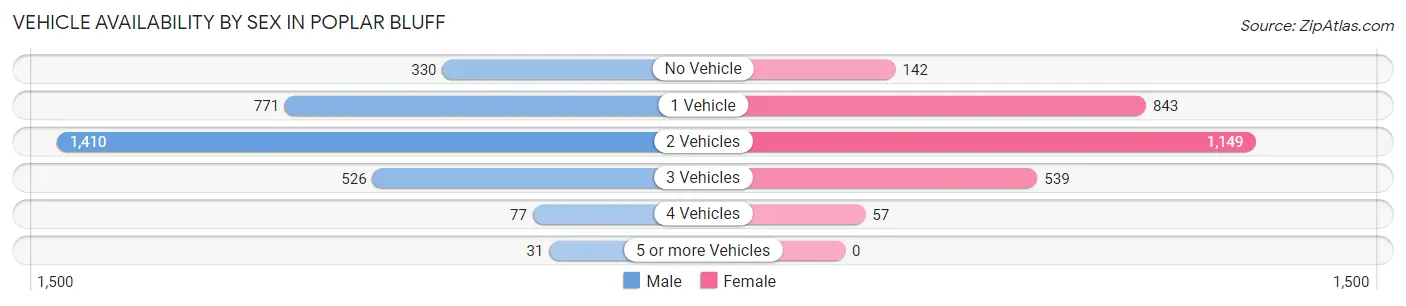
| Vehicles Available | Male | Female |
| No Vehicle | 330 (10.5%) | 142 (5.2%) |
| 1 Vehicle | 771 (24.5%) | 843 (30.9%) |
| 2 Vehicles | 1,410 (44.8%) | 1,149 (42.1%) |
| 3 Vehicles | 526 (16.7%) | 539 (19.7%) |
| 4 Vehicles | 77 (2.5%) | 57 (2.1%) |
| 5 or more Vehicles | 31 (1.0%) | 0 (0.0%) |
| Total | 3,145 (100.0%) | 2,730 (100.0%) |
Commute Time in Poplar Bluff
The most frequently occuring commute durations in Poplar Bluff are 10 to 14 minutes (1,914 commuters, 33.5%), 5 to 9 minutes (1,827 commuters, 31.9%), and 15 to 19 minutes (566 commuters, 9.9%).
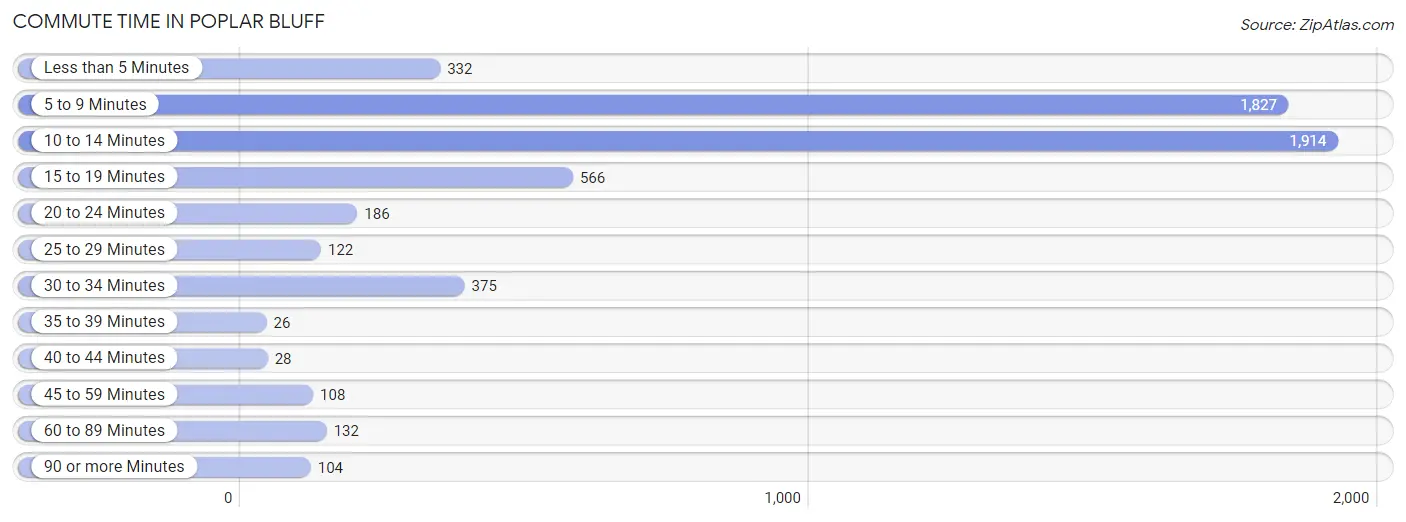
| Commute Time | # Commuters | % Commuters |
| Less than 5 Minutes | 332 | 5.8% |
| 5 to 9 Minutes | 1,827 | 31.9% |
| 10 to 14 Minutes | 1,914 | 33.5% |
| 15 to 19 Minutes | 566 | 9.9% |
| 20 to 24 Minutes | 186 | 3.3% |
| 25 to 29 Minutes | 122 | 2.1% |
| 30 to 34 Minutes | 375 | 6.6% |
| 35 to 39 Minutes | 26 | 0.4% |
| 40 to 44 Minutes | 28 | 0.5% |
| 45 to 59 Minutes | 108 | 1.9% |
| 60 to 89 Minutes | 132 | 2.3% |
| 90 or more Minutes | 104 | 1.8% |
Commute Time by Sex in Poplar Bluff
The most common commute times in Poplar Bluff are 5 to 9 minutes (1,077 commuters, 35.0%) for males and 10 to 14 minutes (1,143 commuters, 43.2%) for females.
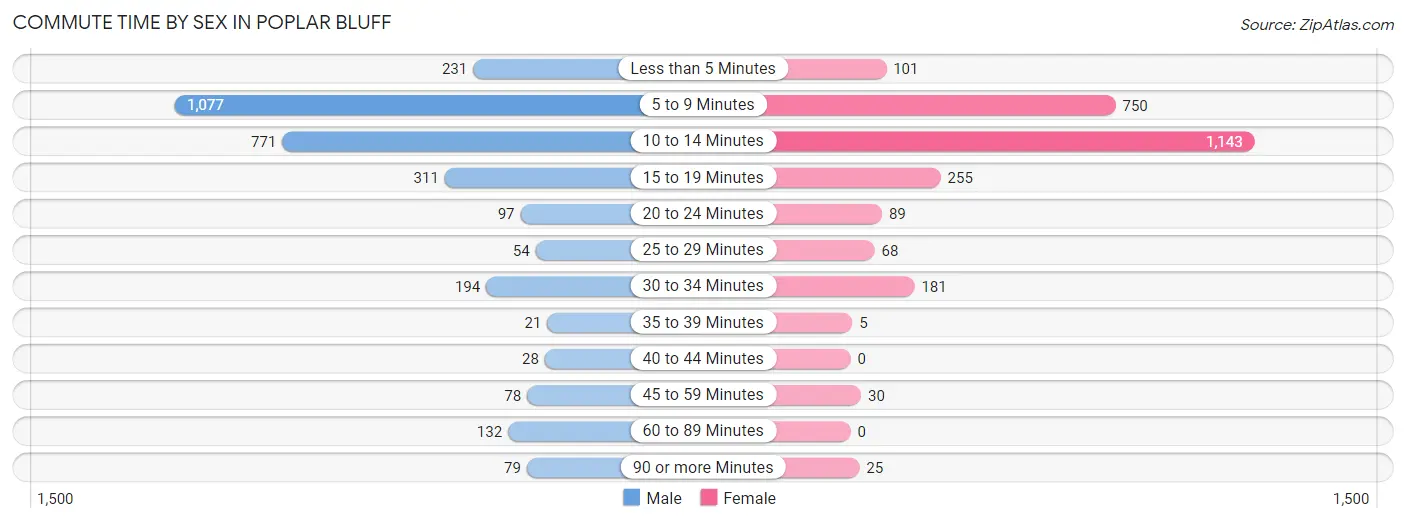
| Commute Time | Male | Female |
| Less than 5 Minutes | 231 (7.5%) | 101 (3.8%) |
| 5 to 9 Minutes | 1,077 (35.0%) | 750 (28.3%) |
| 10 to 14 Minutes | 771 (25.1%) | 1,143 (43.2%) |
| 15 to 19 Minutes | 311 (10.1%) | 255 (9.6%) |
| 20 to 24 Minutes | 97 (3.2%) | 89 (3.4%) |
| 25 to 29 Minutes | 54 (1.8%) | 68 (2.6%) |
| 30 to 34 Minutes | 194 (6.3%) | 181 (6.8%) |
| 35 to 39 Minutes | 21 (0.7%) | 5 (0.2%) |
| 40 to 44 Minutes | 28 (0.9%) | 0 (0.0%) |
| 45 to 59 Minutes | 78 (2.5%) | 30 (1.1%) |
| 60 to 89 Minutes | 132 (4.3%) | 0 (0.0%) |
| 90 or more Minutes | 79 (2.6%) | 25 (0.9%) |
Time of Departure to Work by Sex in Poplar Bluff
The most frequent times of departure to work in Poplar Bluff are 7:30 AM to 7:59 AM (352, 11.5%) for males and 7:00 AM to 7:29 AM (403, 15.2%) for females.
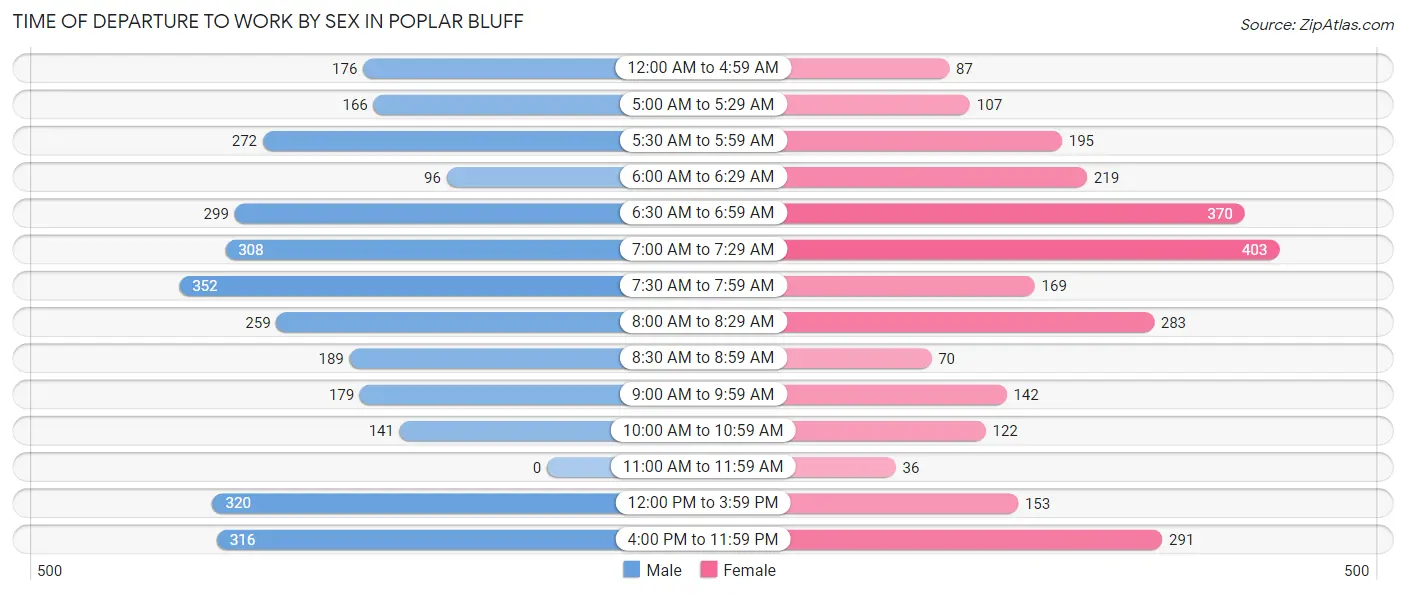
| Time of Departure | Male | Female |
| 12:00 AM to 4:59 AM | 176 (5.7%) | 87 (3.3%) |
| 5:00 AM to 5:29 AM | 166 (5.4%) | 107 (4.0%) |
| 5:30 AM to 5:59 AM | 272 (8.8%) | 195 (7.4%) |
| 6:00 AM to 6:29 AM | 96 (3.1%) | 219 (8.3%) |
| 6:30 AM to 6:59 AM | 299 (9.7%) | 370 (14.0%) |
| 7:00 AM to 7:29 AM | 308 (10.0%) | 403 (15.2%) |
| 7:30 AM to 7:59 AM | 352 (11.5%) | 169 (6.4%) |
| 8:00 AM to 8:29 AM | 259 (8.4%) | 283 (10.7%) |
| 8:30 AM to 8:59 AM | 189 (6.1%) | 70 (2.6%) |
| 9:00 AM to 9:59 AM | 179 (5.8%) | 142 (5.4%) |
| 10:00 AM to 10:59 AM | 141 (4.6%) | 122 (4.6%) |
| 11:00 AM to 11:59 AM | 0 (0.0%) | 36 (1.4%) |
| 12:00 PM to 3:59 PM | 320 (10.4%) | 153 (5.8%) |
| 4:00 PM to 11:59 PM | 316 (10.3%) | 291 (11.0%) |
| Total | 3,073 (100.0%) | 2,647 (100.0%) |
Housing Occupancy in Poplar Bluff
Occupancy by Ownership in Poplar Bluff
Of the total 6,261 dwellings in Poplar Bluff, owner-occupied units account for 3,048 (48.7%), while renter-occupied units make up 3,213 (51.3%).
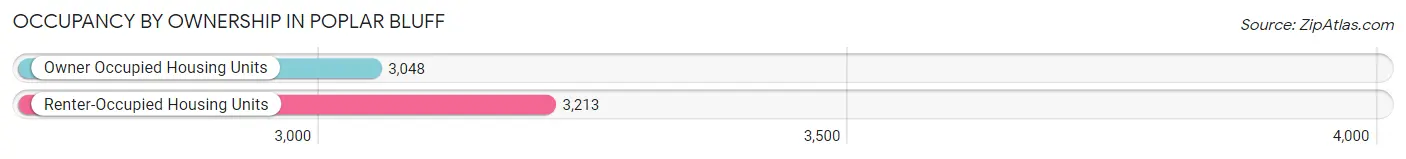
| Occupancy | # Housing Units | % Housing Units |
| Owner Occupied Housing Units | 3,048 | 48.7% |
| Renter-Occupied Housing Units | 3,213 | 51.3% |
| Total Occupied Housing Units | 6,261 | 100.0% |
Occupancy by Household Size in Poplar Bluff
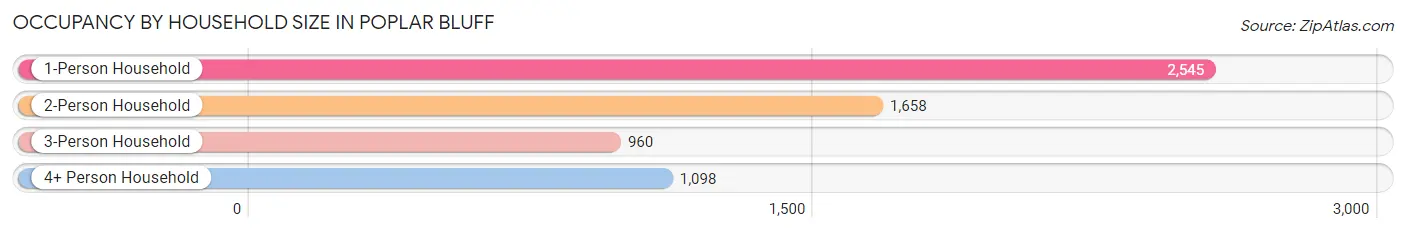
| Household Size | # Housing Units | % Housing Units |
| 1-Person Household | 2,545 | 40.6% |
| 2-Person Household | 1,658 | 26.5% |
| 3-Person Household | 960 | 15.3% |
| 4+ Person Household | 1,098 | 17.5% |
| Total Housing Units | 6,261 | 100.0% |
Occupancy by Ownership by Household Size in Poplar Bluff
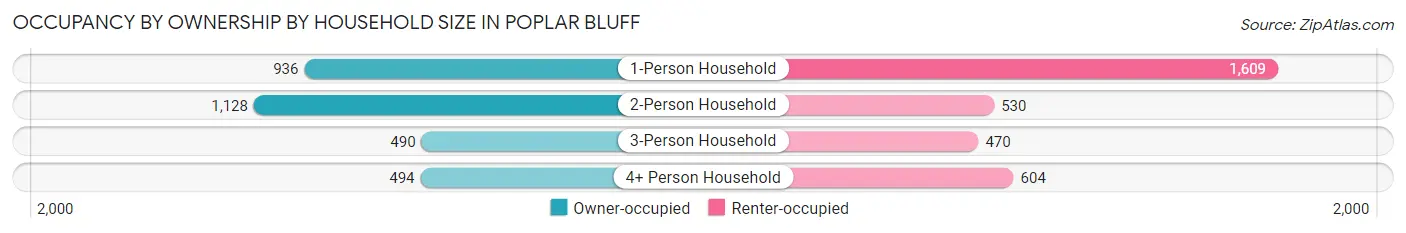
| Household Size | Owner-occupied | Renter-occupied |
| 1-Person Household | 936 (36.8%) | 1,609 (63.2%) |
| 2-Person Household | 1,128 (68.0%) | 530 (32.0%) |
| 3-Person Household | 490 (51.0%) | 470 (49.0%) |
| 4+ Person Household | 494 (45.0%) | 604 (55.0%) |
| Total Housing Units | 3,048 (48.7%) | 3,213 (51.3%) |
Occupancy by Educational Attainment in Poplar Bluff
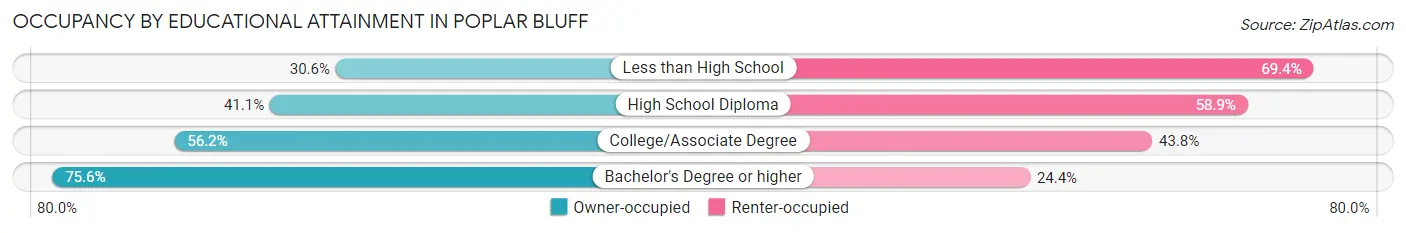
| Household Size | Owner-occupied | Renter-occupied |
| Less than High School | 288 (30.6%) | 652 (69.4%) |
| High School Diploma | 1,106 (41.1%) | 1,586 (58.9%) |
| College/Associate Degree | 969 (56.2%) | 754 (43.8%) |
| Bachelor's Degree or higher | 685 (75.6%) | 221 (24.4%) |
Occupancy by Age of Householder in Poplar Bluff
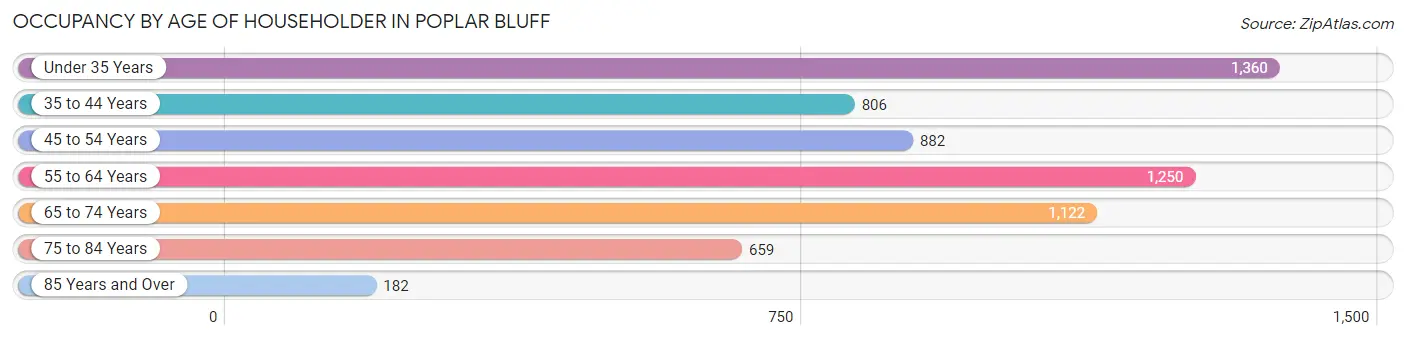
| Age Bracket | # Households | % Households |
| Under 35 Years | 1,360 | 21.7% |
| 35 to 44 Years | 806 | 12.9% |
| 45 to 54 Years | 882 | 14.1% |
| 55 to 64 Years | 1,250 | 20.0% |
| 65 to 74 Years | 1,122 | 17.9% |
| 75 to 84 Years | 659 | 10.5% |
| 85 Years and Over | 182 | 2.9% |
| Total | 6,261 | 100.0% |
Housing Finances in Poplar Bluff
Median Income by Occupancy in Poplar Bluff
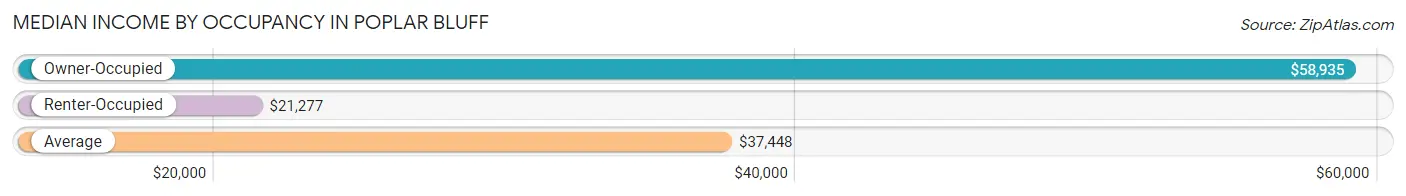
| Occupancy Type | # Households | Median Income |
| Owner-Occupied | 3,048 (48.7%) | $58,935 |
| Renter-Occupied | 3,213 (51.3%) | $21,277 |
| Average | 6,261 (100.0%) | $37,448 |
Occupancy by Householder Income Bracket in Poplar Bluff
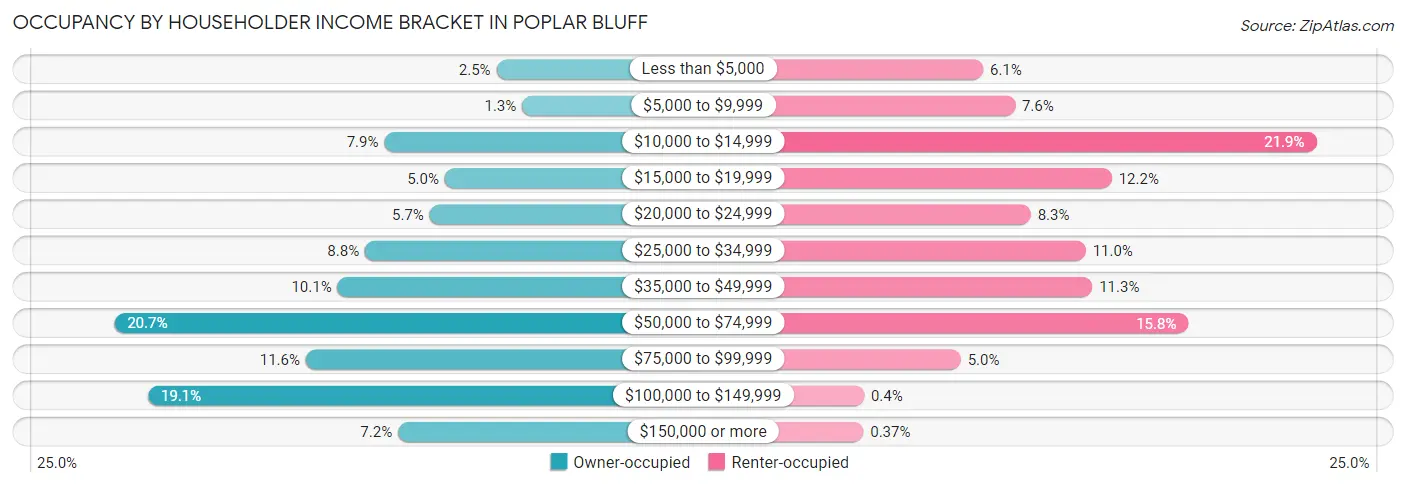
| Income Bracket | Owner-occupied | Renter-occupied |
| Less than $5,000 | 77 (2.5%) | 195 (6.1%) |
| $5,000 to $9,999 | 40 (1.3%) | 244 (7.6%) |
| $10,000 to $14,999 | 240 (7.9%) | 705 (21.9%) |
| $15,000 to $19,999 | 152 (5.0%) | 392 (12.2%) |
| $20,000 to $24,999 | 174 (5.7%) | 268 (8.3%) |
| $25,000 to $34,999 | 268 (8.8%) | 352 (11.0%) |
| $35,000 to $49,999 | 308 (10.1%) | 362 (11.3%) |
| $50,000 to $74,999 | 632 (20.7%) | 509 (15.8%) |
| $75,000 to $99,999 | 354 (11.6%) | 161 (5.0%) |
| $100,000 to $149,999 | 583 (19.1%) | 13 (0.4%) |
| $150,000 or more | 220 (7.2%) | 12 (0.4%) |
| Total | 3,048 (100.0%) | 3,213 (100.0%) |
Monthly Housing Cost Tiers in Poplar Bluff
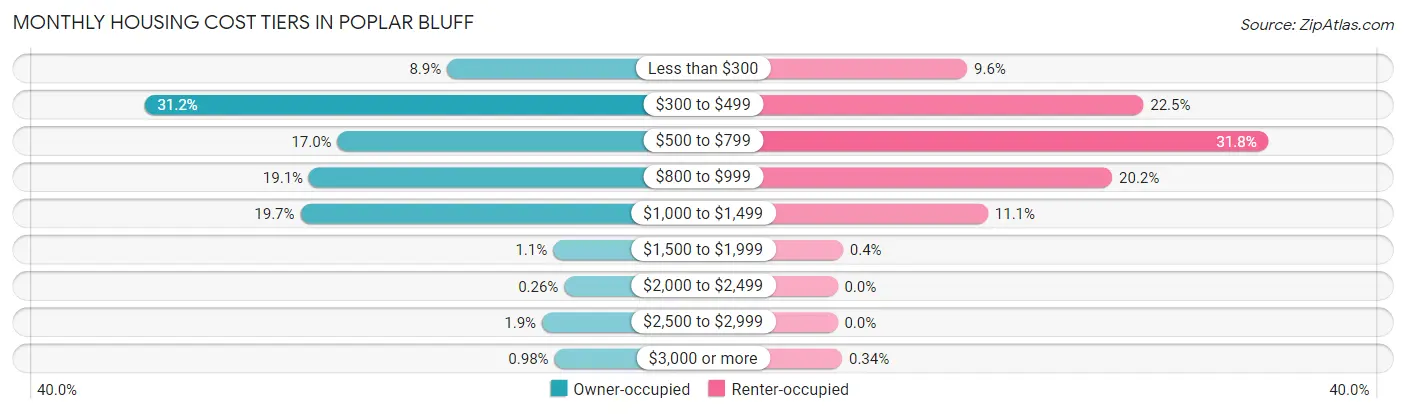
| Monthly Cost | Owner-occupied | Renter-occupied |
| Less than $300 | 271 (8.9%) | 307 (9.6%) |
| $300 to $499 | 950 (31.2%) | 724 (22.5%) |
| $500 to $799 | 517 (17.0%) | 1,020 (31.8%) |
| $800 to $999 | 581 (19.1%) | 650 (20.2%) |
| $1,000 to $1,499 | 600 (19.7%) | 356 (11.1%) |
| $1,500 to $1,999 | 33 (1.1%) | 13 (0.4%) |
| $2,000 to $2,499 | 8 (0.3%) | 0 (0.0%) |
| $2,500 to $2,999 | 58 (1.9%) | 0 (0.0%) |
| $3,000 or more | 30 (1.0%) | 11 (0.3%) |
| Total | 3,048 (100.0%) | 3,213 (100.0%) |
Physical Housing Characteristics in Poplar Bluff
Housing Structures in Poplar Bluff
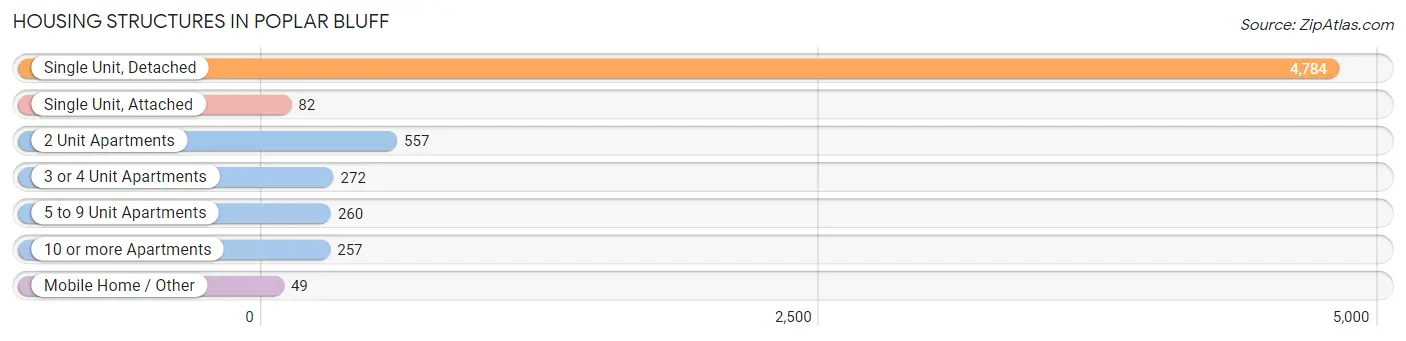
| Structure Type | # Housing Units | % Housing Units |
| Single Unit, Detached | 4,784 | 76.4% |
| Single Unit, Attached | 82 | 1.3% |
| 2 Unit Apartments | 557 | 8.9% |
| 3 or 4 Unit Apartments | 272 | 4.3% |
| 5 to 9 Unit Apartments | 260 | 4.2% |
| 10 or more Apartments | 257 | 4.1% |
| Mobile Home / Other | 49 | 0.8% |
| Total | 6,261 | 100.0% |
Housing Structures by Occupancy in Poplar Bluff
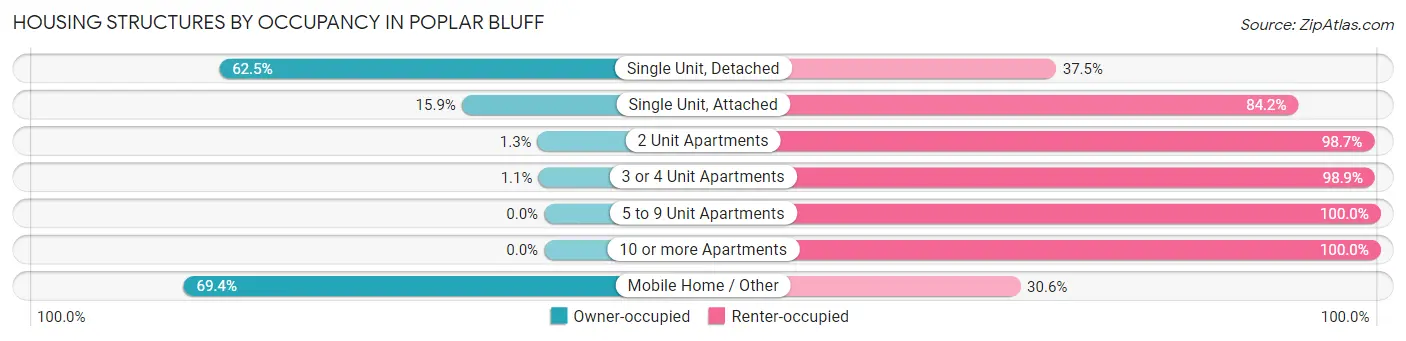
| Structure Type | Owner-occupied | Renter-occupied |
| Single Unit, Detached | 2,991 (62.5%) | 1,793 (37.5%) |
| Single Unit, Attached | 13 (15.9%) | 69 (84.2%) |
| 2 Unit Apartments | 7 (1.3%) | 550 (98.7%) |
| 3 or 4 Unit Apartments | 3 (1.1%) | 269 (98.9%) |
| 5 to 9 Unit Apartments | 0 (0.0%) | 260 (100.0%) |
| 10 or more Apartments | 0 (0.0%) | 257 (100.0%) |
| Mobile Home / Other | 34 (69.4%) | 15 (30.6%) |
| Total | 3,048 (48.7%) | 3,213 (51.3%) |
Housing Structures by Number of Rooms in Poplar Bluff
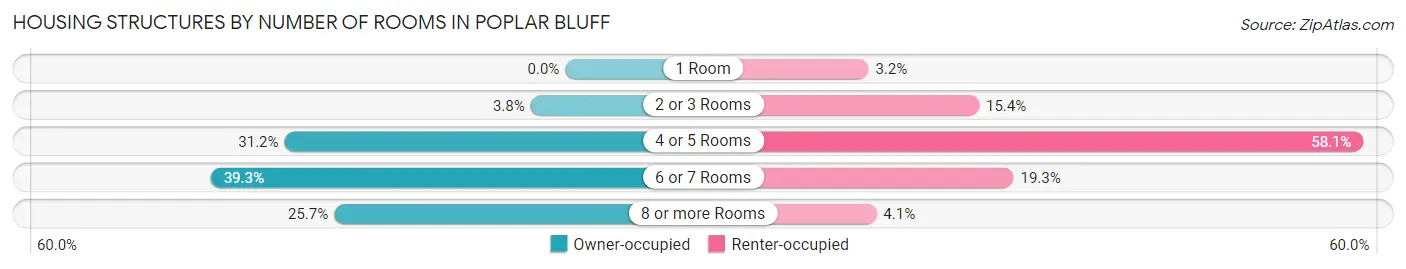
| Number of Rooms | Owner-occupied | Renter-occupied |
| 1 Room | 0 (0.0%) | 102 (3.2%) |
| 2 or 3 Rooms | 117 (3.8%) | 496 (15.4%) |
| 4 or 5 Rooms | 950 (31.2%) | 1,866 (58.1%) |
| 6 or 7 Rooms | 1,199 (39.3%) | 619 (19.3%) |
| 8 or more Rooms | 782 (25.7%) | 130 (4.1%) |
| Total | 3,048 (100.0%) | 3,213 (100.0%) |
Housing Structure by Heating Type in Poplar Bluff
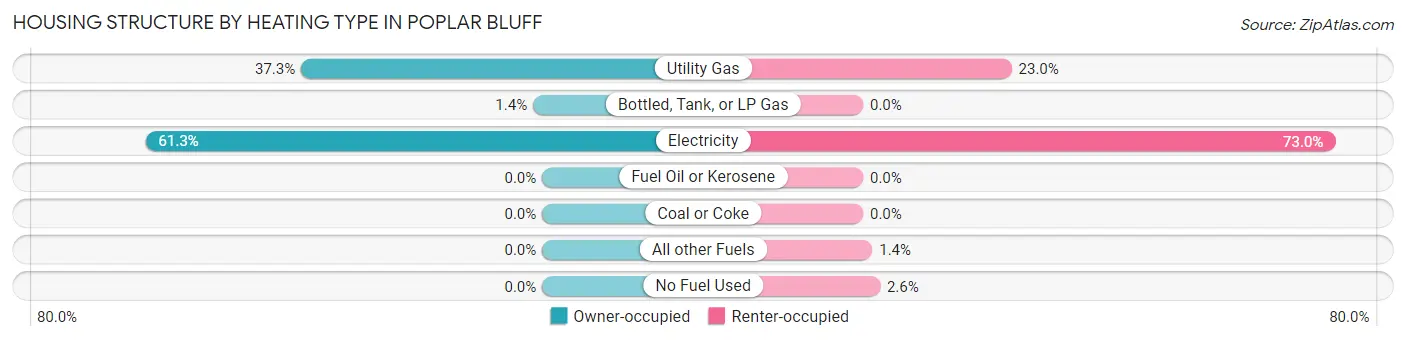
| Heating Type | Owner-occupied | Renter-occupied |
| Utility Gas | 1,136 (37.3%) | 738 (23.0%) |
| Bottled, Tank, or LP Gas | 43 (1.4%) | 0 (0.0%) |
| Electricity | 1,869 (61.3%) | 2,345 (73.0%) |
| Fuel Oil or Kerosene | 0 (0.0%) | 0 (0.0%) |
| Coal or Coke | 0 (0.0%) | 0 (0.0%) |
| All other Fuels | 0 (0.0%) | 46 (1.4%) |
| No Fuel Used | 0 (0.0%) | 84 (2.6%) |
| Total | 3,048 (100.0%) | 3,213 (100.0%) |
Household Vehicle Usage in Poplar Bluff
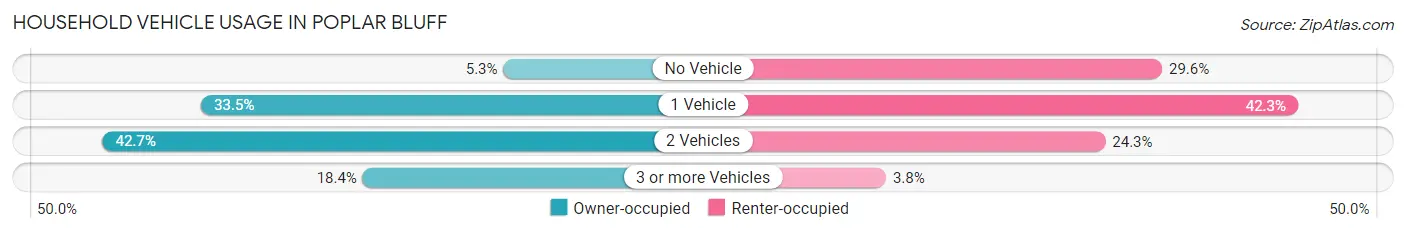
| Vehicles per Household | Owner-occupied | Renter-occupied |
| No Vehicle | 162 (5.3%) | 951 (29.6%) |
| 1 Vehicle | 1,022 (33.5%) | 1,358 (42.3%) |
| 2 Vehicles | 1,302 (42.7%) | 781 (24.3%) |
| 3 or more Vehicles | 562 (18.4%) | 123 (3.8%) |
| Total | 3,048 (100.0%) | 3,213 (100.0%) |
Real Estate & Mortgages in Poplar Bluff
Real Estate and Mortgage Overview in Poplar Bluff
| Characteristic | Without Mortgage | With Mortgage |
| Housing Units | 1,444 | 1,604 |
| Median Property Value | $113,000 | $98,200 |
| Median Household Income | $62,656 | $115 |
| Monthly Housing Costs | $420 | $18 |
| Real Estate Taxes | $760 | $41 |
Property Value by Mortgage Status in Poplar Bluff
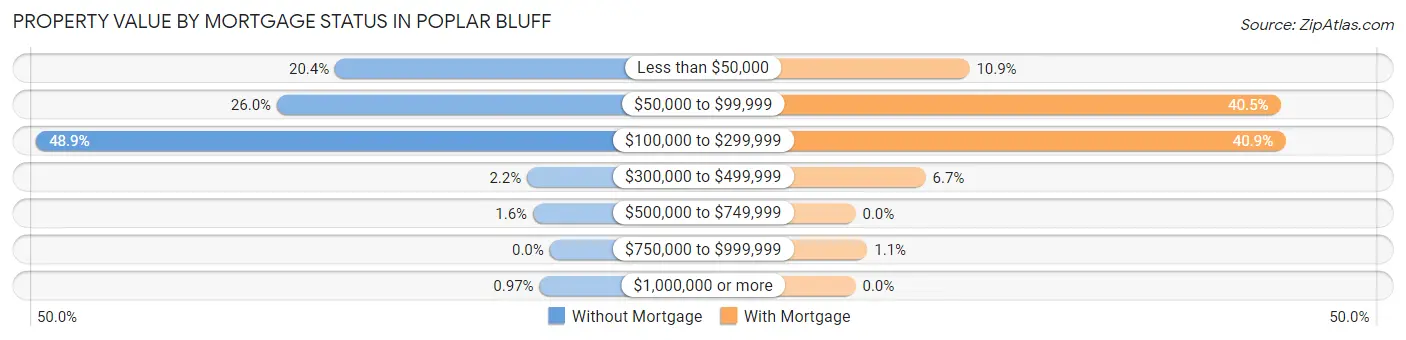
| Property Value | Without Mortgage | With Mortgage |
| Less than $50,000 | 295 (20.4%) | 174 (10.8%) |
| $50,000 to $99,999 | 375 (26.0%) | 649 (40.5%) |
| $100,000 to $299,999 | 706 (48.9%) | 656 (40.9%) |
| $300,000 to $499,999 | 31 (2.1%) | 107 (6.7%) |
| $500,000 to $749,999 | 23 (1.6%) | 0 (0.0%) |
| $750,000 to $999,999 | 0 (0.0%) | 18 (1.1%) |
| $1,000,000 or more | 14 (1.0%) | 0 (0.0%) |
| Total | 1,444 (100.0%) | 1,604 (100.0%) |
Household Income by Mortgage Status in Poplar Bluff
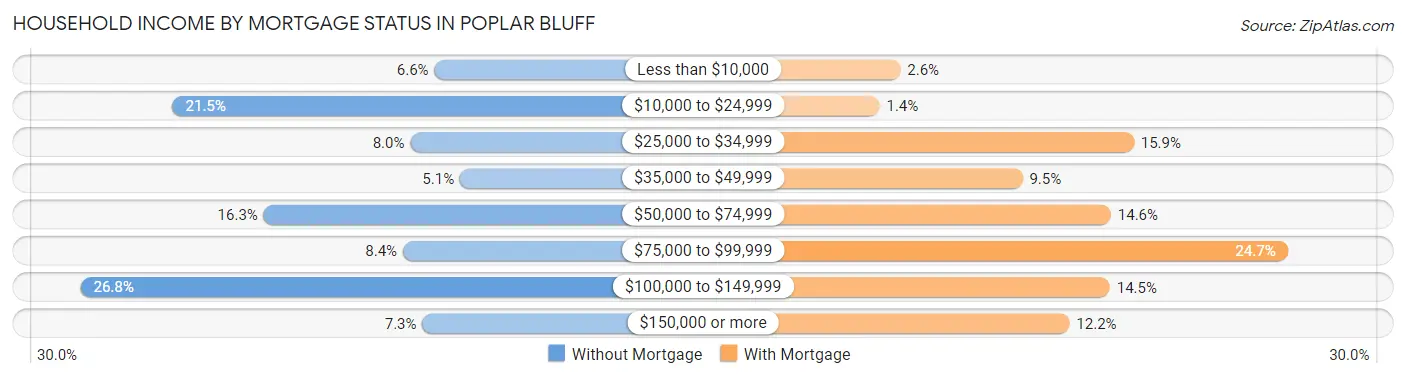
| Household Income | Without Mortgage | With Mortgage |
| Less than $10,000 | 95 (6.6%) | 41 (2.6%) |
| $10,000 to $24,999 | 311 (21.5%) | 22 (1.4%) |
| $25,000 to $34,999 | 115 (8.0%) | 255 (15.9%) |
| $35,000 to $49,999 | 74 (5.1%) | 153 (9.5%) |
| $50,000 to $74,999 | 236 (16.3%) | 234 (14.6%) |
| $75,000 to $99,999 | 121 (8.4%) | 396 (24.7%) |
| $100,000 to $149,999 | 387 (26.8%) | 233 (14.5%) |
| $150,000 or more | 105 (7.3%) | 196 (12.2%) |
| Total | 1,444 (100.0%) | 1,604 (100.0%) |
Property Value to Household Income Ratio in Poplar Bluff
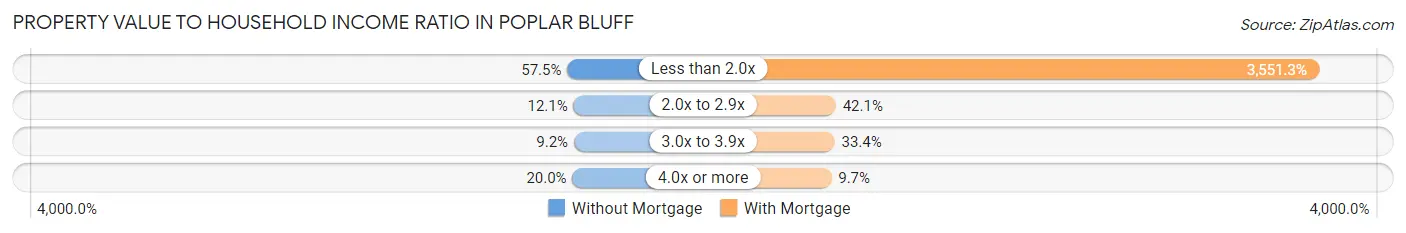
| Value-to-Income Ratio | Without Mortgage | With Mortgage |
| Less than 2.0x | 830 (57.5%) | 56,962 (3,551.3%) |
| 2.0x to 2.9x | 175 (12.1%) | 676 (42.1%) |
| 3.0x to 3.9x | 133 (9.2%) | 535 (33.4%) |
| 4.0x or more | 289 (20.0%) | 156 (9.7%) |
| Total | 1,444 (100.0%) | 1,604 (100.0%) |
Real Estate Taxes by Mortgage Status in Poplar Bluff
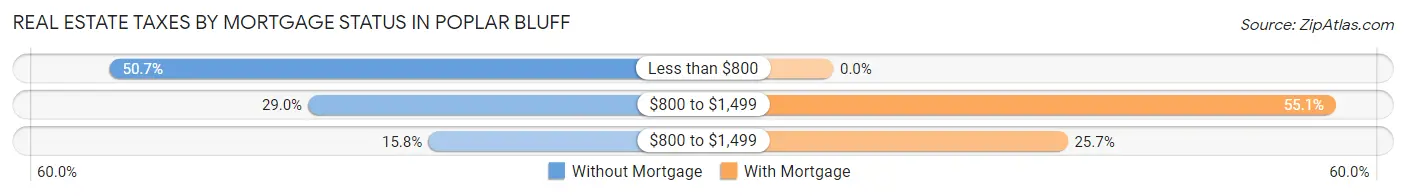
| Property Taxes | Without Mortgage | With Mortgage |
| Less than $800 | 732 (50.7%) | 0 (0.0%) |
| $800 to $1,499 | 418 (28.9%) | 884 (55.1%) |
| $800 to $1,499 | 228 (15.8%) | 412 (25.7%) |
| Total | 1,444 (100.0%) | 1,604 (100.0%) |
Health & Disability in Poplar Bluff
Health Insurance Coverage by Age in Poplar Bluff
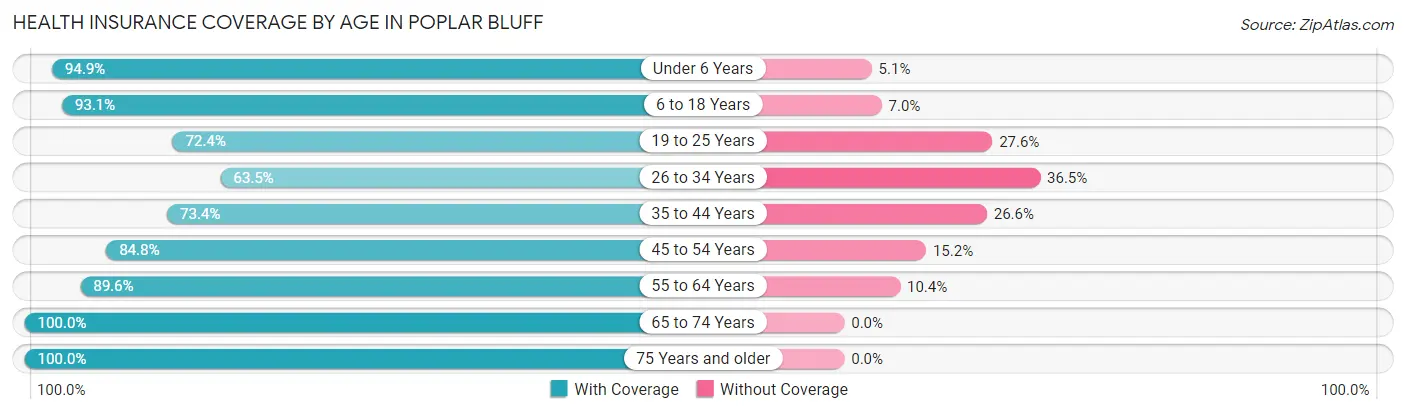
| Age Bracket | With Coverage | Without Coverage |
| Under 6 Years | 1,543 (94.9%) | 83 (5.1%) |
| 6 to 18 Years | 2,585 (93.0%) | 193 (7.0%) |
| 19 to 25 Years | 1,045 (72.4%) | 398 (27.6%) |
| 26 to 34 Years | 1,208 (63.5%) | 695 (36.5%) |
| 35 to 44 Years | 1,265 (73.4%) | 458 (26.6%) |
| 45 to 54 Years | 1,297 (84.8%) | 233 (15.2%) |
| 55 to 64 Years | 1,819 (89.6%) | 211 (10.4%) |
| 65 to 74 Years | 1,542 (100.0%) | 0 (0.0%) |
| 75 Years and older | 1,275 (100.0%) | 0 (0.0%) |
| Total | 13,579 (85.7%) | 2,271 (14.3%) |
Health Insurance Coverage by Citizenship Status in Poplar Bluff

| Citizenship Status | With Coverage | Without Coverage |
| Native Born | 1,543 (94.9%) | 83 (5.1%) |
| Foreign Born, Citizen | 2,585 (93.0%) | 193 (7.0%) |
| Foreign Born, not a Citizen | 1,045 (72.4%) | 398 (27.6%) |
Health Insurance Coverage by Household Income in Poplar Bluff
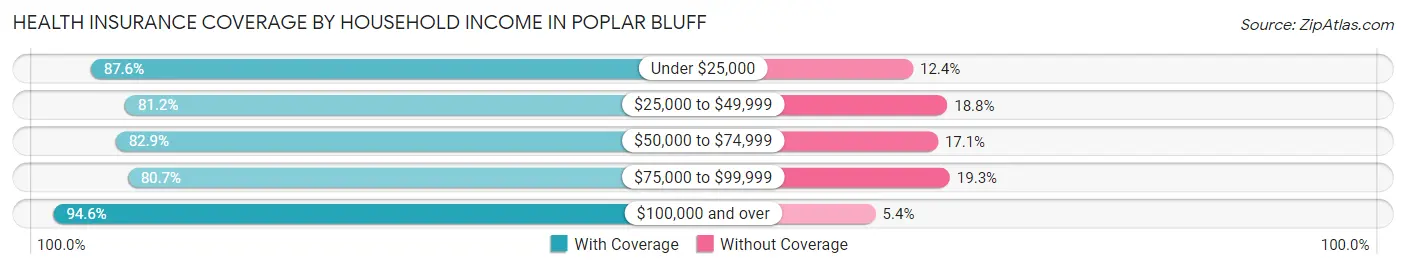
| Household Income | With Coverage | Without Coverage |
| Under $25,000 | 3,438 (87.6%) | 487 (12.4%) |
| $25,000 to $49,999 | 2,931 (81.2%) | 680 (18.8%) |
| $50,000 to $74,999 | 3,281 (82.9%) | 676 (17.1%) |
| $75,000 to $99,999 | 1,144 (80.7%) | 274 (19.3%) |
| $100,000 and over | 2,621 (94.6%) | 150 (5.4%) |
Public vs Private Health Insurance Coverage by Age in Poplar Bluff
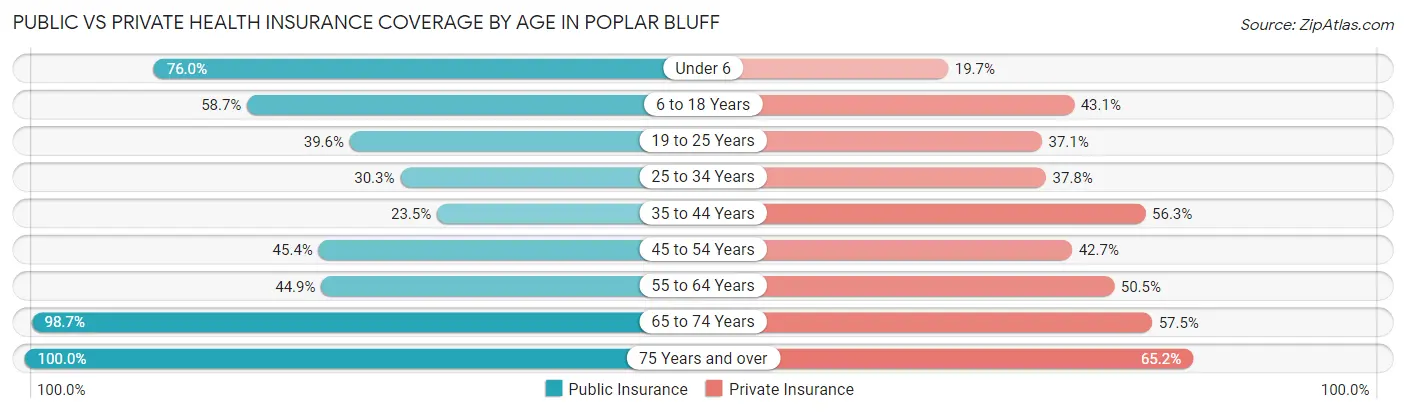
| Age Bracket | Public Insurance | Private Insurance |
| Under 6 | 1,236 (76.0%) | 320 (19.7%) |
| 6 to 18 Years | 1,630 (58.7%) | 1,196 (43.0%) |
| 19 to 25 Years | 572 (39.6%) | 535 (37.1%) |
| 25 to 34 Years | 576 (30.3%) | 720 (37.8%) |
| 35 to 44 Years | 404 (23.4%) | 970 (56.3%) |
| 45 to 54 Years | 695 (45.4%) | 653 (42.7%) |
| 55 to 64 Years | 912 (44.9%) | 1,025 (50.5%) |
| 65 to 74 Years | 1,522 (98.7%) | 887 (57.5%) |
| 75 Years and over | 1,275 (100.0%) | 831 (65.2%) |
| Total | 8,822 (55.7%) | 7,137 (45.0%) |
Disability Status by Sex by Age in Poplar Bluff
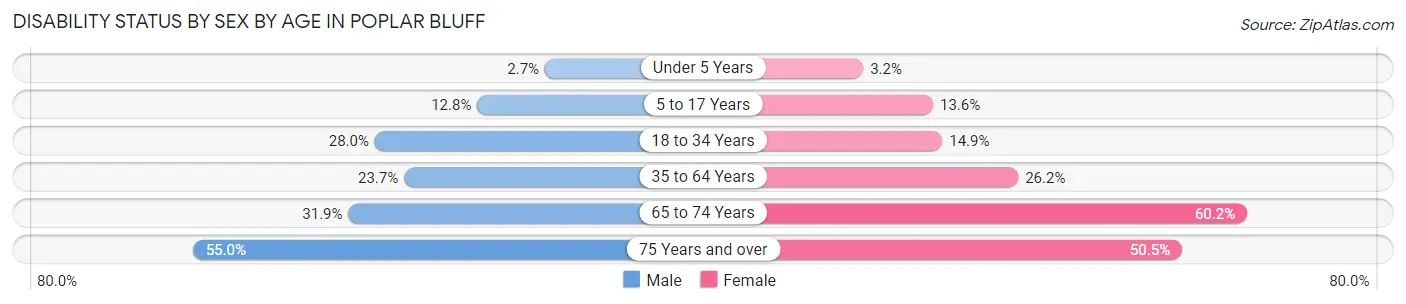
| Age Bracket | Male | Female |
| Under 5 Years | 20 (2.7%) | 19 (3.2%) |
| 5 to 17 Years | 177 (12.8%) | 196 (13.6%) |
| 18 to 34 Years | 514 (28.0%) | 262 (14.9%) |
| 35 to 64 Years | 578 (23.7%) | 744 (26.2%) |
| 65 to 74 Years | 219 (31.9%) | 515 (60.2%) |
| 75 Years and over | 219 (55.0%) | 443 (50.5%) |
Disability Class by Sex by Age in Poplar Bluff
Disability Class: Hearing Difficulty
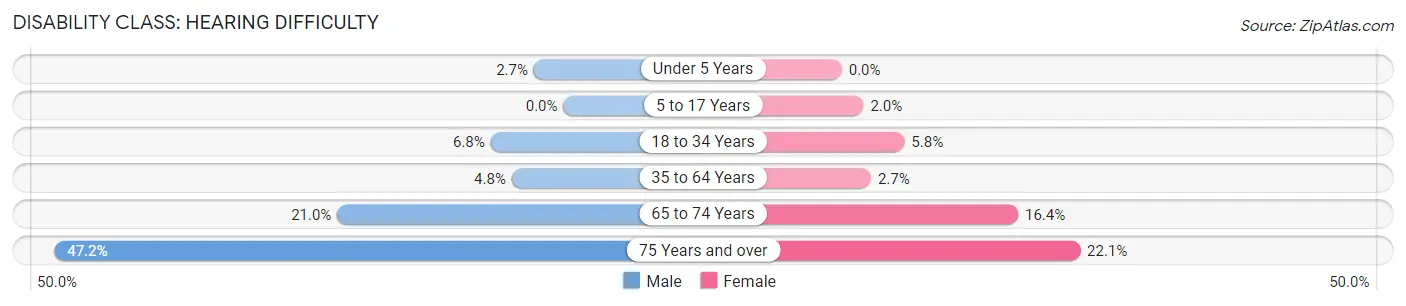
| Age Bracket | Male | Female |
| Under 5 Years | 20 (2.7%) | 0 (0.0%) |
| 5 to 17 Years | 0 (0.0%) | 29 (2.0%) |
| 18 to 34 Years | 124 (6.8%) | 102 (5.8%) |
| 35 to 64 Years | 117 (4.8%) | 77 (2.7%) |
| 65 to 74 Years | 144 (21.0%) | 140 (16.4%) |
| 75 Years and over | 188 (47.2%) | 194 (22.1%) |
Disability Class: Vision Difficulty
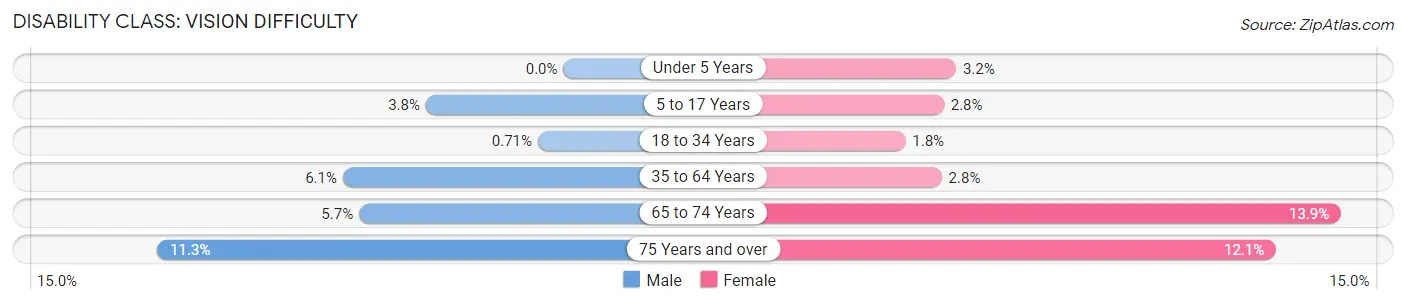
| Age Bracket | Male | Female |
| Under 5 Years | 0 (0.0%) | 19 (3.2%) |
| 5 to 17 Years | 53 (3.8%) | 41 (2.8%) |
| 18 to 34 Years | 13 (0.7%) | 31 (1.8%) |
| 35 to 64 Years | 150 (6.1%) | 79 (2.8%) |
| 65 to 74 Years | 39 (5.7%) | 119 (13.9%) |
| 75 Years and over | 45 (11.3%) | 106 (12.1%) |
Disability Class: Cognitive Difficulty
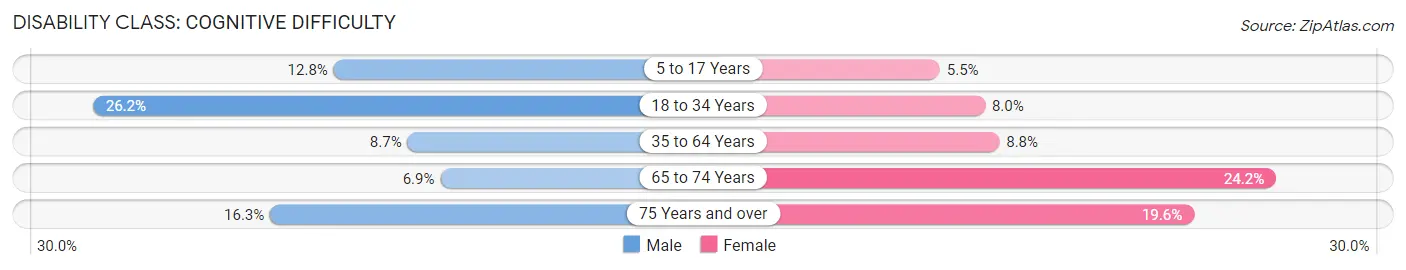
| Age Bracket | Male | Female |
| 5 to 17 Years | 177 (12.8%) | 79 (5.5%) |
| 18 to 34 Years | 481 (26.2%) | 140 (8.0%) |
| 35 to 64 Years | 212 (8.7%) | 249 (8.8%) |
| 65 to 74 Years | 47 (6.9%) | 207 (24.2%) |
| 75 Years and over | 65 (16.3%) | 172 (19.6%) |
Disability Class: Ambulatory Difficulty
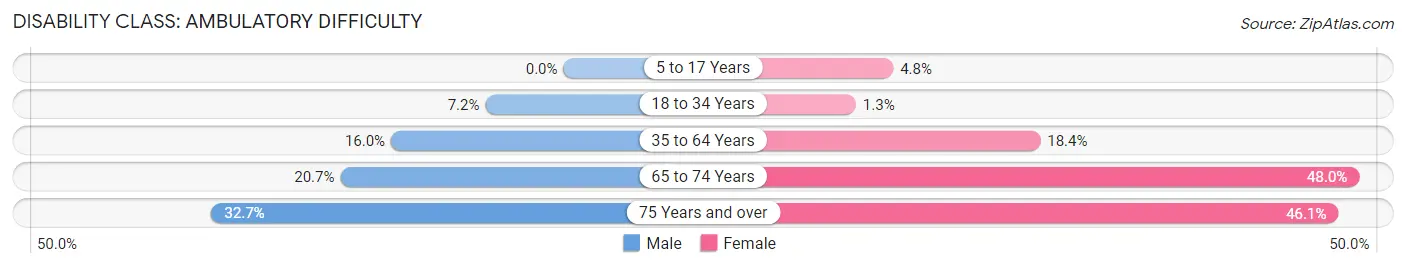
| Age Bracket | Male | Female |
| 5 to 17 Years | 0 (0.0%) | 69 (4.8%) |
| 18 to 34 Years | 133 (7.2%) | 23 (1.3%) |
| 35 to 64 Years | 391 (16.0%) | 523 (18.4%) |
| 65 to 74 Years | 142 (20.7%) | 411 (48.0%) |
| 75 Years and over | 130 (32.7%) | 404 (46.1%) |
Disability Class: Self-Care Difficulty
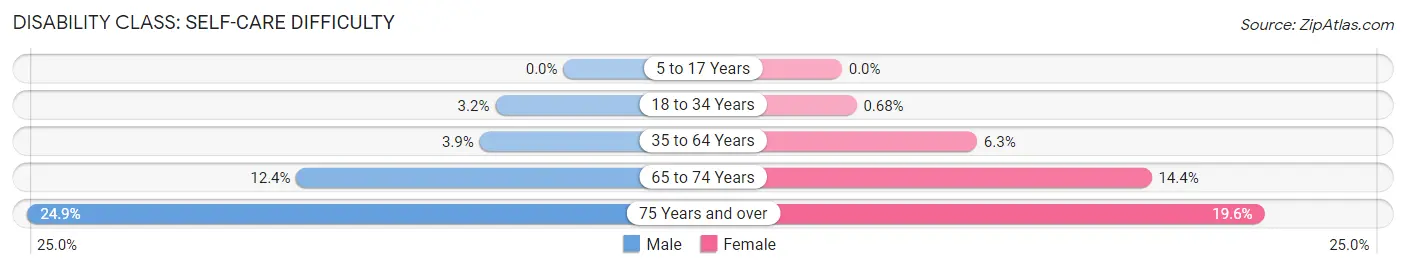
| Age Bracket | Male | Female |
| 5 to 17 Years | 0 (0.0%) | 0 (0.0%) |
| 18 to 34 Years | 58 (3.2%) | 12 (0.7%) |
| 35 to 64 Years | 95 (3.9%) | 178 (6.3%) |
| 65 to 74 Years | 85 (12.4%) | 123 (14.4%) |
| 75 Years and over | 99 (24.9%) | 172 (19.6%) |
Technology Access in Poplar Bluff
Computing Device Access in Poplar Bluff
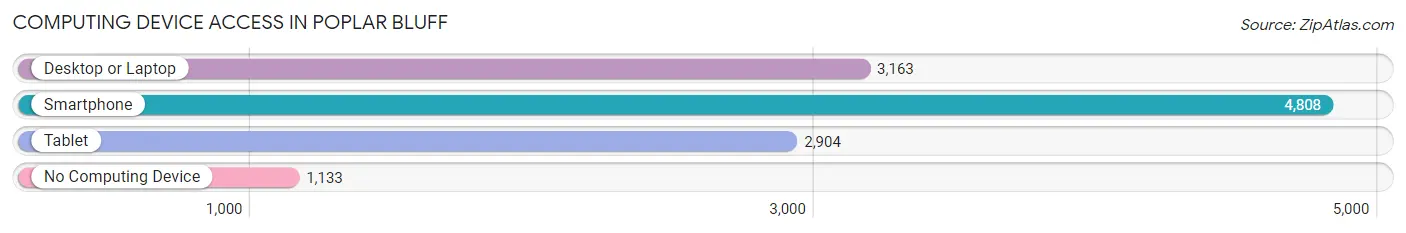
| Device Type | # Households | % Households |
| Desktop or Laptop | 3,163 | 50.5% |
| Smartphone | 4,808 | 76.8% |
| Tablet | 2,904 | 46.4% |
| No Computing Device | 1,133 | 18.1% |
| Total | 6,261 | 100.0% |
Internet Access in Poplar Bluff
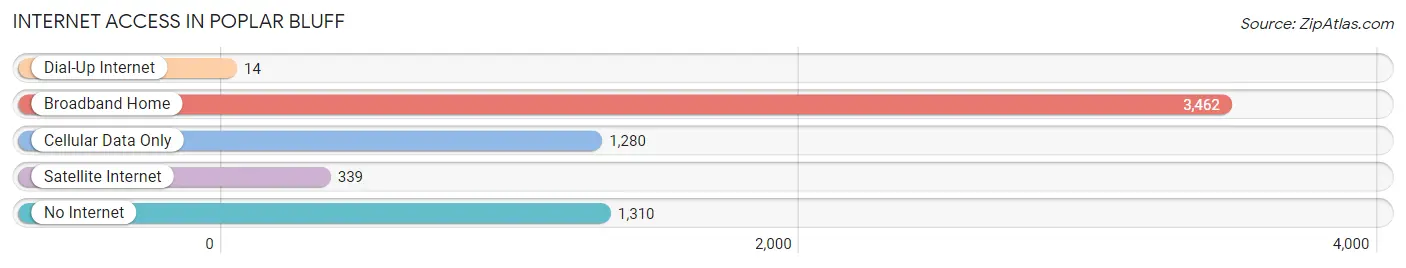
| Internet Type | # Households | % Households |
| Dial-Up Internet | 14 | 0.2% |
| Broadband Home | 3,462 | 55.3% |
| Cellular Data Only | 1,280 | 20.4% |
| Satellite Internet | 339 | 5.4% |
| No Internet | 1,310 | 20.9% |
| Total | 6,261 | 100.0% |
Poplar Bluff Summary
Poplar Bluff, Missouri is a city located in Butler County in the southeastern corner of the state. It is the county seat and the largest city in the county. The city is situated on the Black River and is located approximately 100 miles south of St. Louis and 100 miles north of Memphis, Tennessee. The city is part of the Poplar Bluff Micropolitan Statistical Area, which includes all of Butler County.
History
The area that is now Poplar Bluff was first settled in the early 1800s by settlers from the Carolinas and Virginia. The first permanent settlement was established in 1829 by William and Mary Ann Miller, who named the settlement Miller’s Bluff. The settlement was later renamed Poplar Bluff in 1837, after the abundance of poplar trees in the area.
The city was officially incorporated in 1855 and was designated as the county seat of Butler County in 1857. During the Civil War, Poplar Bluff was a major supply center for the Confederate Army. After the war, the city experienced a period of growth and development, with the establishment of several businesses, including a sawmill, a gristmill, and a brickyard.
Geography
Poplar Bluff is located in the southeastern corner of Missouri, in Butler County. The city is situated on the Black River and is located approximately 100 miles south of St. Louis and 100 miles north of Memphis, Tennessee. The city is part of the Poplar Bluff Micropolitan Statistical Area, which includes all of Butler County.
The city has a total area of 16.2 square miles, of which 16.1 square miles is land and 0.1 square miles is water. The city is located in the Ozark Plateau region of Missouri and is surrounded by rolling hills and forests.
Economy
Poplar Bluff’s economy is largely based on manufacturing and agriculture. The city is home to several manufacturing companies, including a paper mill, a furniture factory, and a plastics plant. The city is also home to several agricultural businesses, including a dairy farm, a hog farm, and a poultry farm.
The city is also home to several retail businesses, including several large shopping centers and a variety of restaurants. The city is also home to several medical facilities, including a hospital and several clinics.
Demographics
As of the 2010 census, Poplar Bluff had a population of 17,023. The racial makeup of the city was 79.2% White, 17.3% African American, 0.4% Native American, 0.7% Asian, 0.1% Pacific Islander, 0.7% from other races, and 1.6% from two or more races. Hispanic or Latino of any race were 2.2% of the population.
The median household income in Poplar Bluff was $32,917, and the median family income was $41,945. The per capita income for the city was $17,845. About 17.2% of the population was below the poverty line.
Poplar Bluff is served by the Poplar Bluff R-I School District, which includes four elementary schools, one middle school, and one high school. The city is also home to Three Rivers Community College, a two-year college offering associate degrees and certificate programs.
Common Questions
What is Per Capita Income in Poplar Bluff?
Per Capita income in Poplar Bluff is $20,797.
What is the Median Family Income in Poplar Bluff?
Median Family Income in Poplar Bluff is $48,510.
What is the Median Household income in Poplar Bluff?
Median Household Income in Poplar Bluff is $37,448.
What is Income or Wage Gap in Poplar Bluff?
Income or Wage Gap in Poplar Bluff is 25.7%.
Women in Poplar Bluff earn 74.3 cents for every dollar earned by a man.
What is Family Income Deficit in Poplar Bluff?
Family Income Deficit in Poplar Bluff is $11,478.
Families that are below poverty line in Poplar Bluff earn $11,478 less on average than the poverty threshold level.
What is Inequality or Gini Index in Poplar Bluff?
Inequality or Gini Index in Poplar Bluff is 0.48.
What is the Total Population of Poplar Bluff?
Total Population of Poplar Bluff is 16,313.
What is the Total Male Population of Poplar Bluff?
Total Male Population of Poplar Bluff is 7,742.
What is the Total Female Population of Poplar Bluff?
Total Female Population of Poplar Bluff is 8,571.
What is the Ratio of Males per 100 Females in Poplar Bluff?
There are 90.33 Males per 100 Females in Poplar Bluff.
What is the Ratio of Females per 100 Males in Poplar Bluff?
There are 110.71 Females per 100 Males in Poplar Bluff.
What is the Median Population Age in Poplar Bluff?
Median Population Age in Poplar Bluff is 36.0 Years.
What is the Average Family Size in Poplar Bluff
Average Family Size in Poplar Bluff is 3.3 People.
What is the Average Household Size in Poplar Bluff
Average Household Size in Poplar Bluff is 2.5 People.
How Large is the Labor Force in Poplar Bluff?
There are 6,357 People in the Labor Forcein in Poplar Bluff.
What is the Percentage of People in the Labor Force in Poplar Bluff?
50.0% of People are in the Labor Force in Poplar Bluff.
What is the Unemployment Rate in Poplar Bluff?
Unemployment Rate in Poplar Bluff is 5.9%.