Joplin, MO Map & Demographics
Joplin Map
Joplin Overview
$29,295
PER CAPITA INCOME
$61,782
AVG FAMILY INCOME
$50,996
AVG HOUSEHOLD INCOME
28.6%
WAGE / INCOME GAP [ % ]
71.4¢/ $1
WAGE / INCOME GAP [ $ ]
$9,251
FAMILY INCOME DEFICIT
0.48
INEQUALITY / GINI INDEX
51,848
TOTAL POPULATION
25,630
MALE POPULATION
26,218
FEMALE POPULATION
97.76
MALES / 100 FEMALES
102.29
FEMALES / 100 MALES
36.4
MEDIAN AGE
3.0
AVG FAMILY SIZE
2.4
AVG HOUSEHOLD SIZE
25,526
LABOR FORCE [ PEOPLE ]
61.4%
PERCENT IN LABOR FORCE
4.9%
UNEMPLOYMENT RATE
Joplin Area Codes
Income in Joplin
Income Overview in Joplin
Per Capita Income in Joplin is $29,295, while median incomes of families and households are $61,782 and $50,996 respectively.
| Characteristic | Number | Measure |
| Per Capita Income | 51,848 | $29,295 |
| Median Family Income | 12,115 | $61,782 |
| Mean Family Income | 12,115 | $87,510 |
| Median Household Income | 21,274 | $50,996 |
| Mean Household Income | 21,274 | $69,832 |
| Income Deficit | 12,115 | $9,251 |
| Wage / Income Gap (%) | 51,848 | 28.56% |
| Wage / Income Gap ($) | 51,848 | 71.44¢ per $1 |
| Gini / Inequality Index | 51,848 | 0.48 |
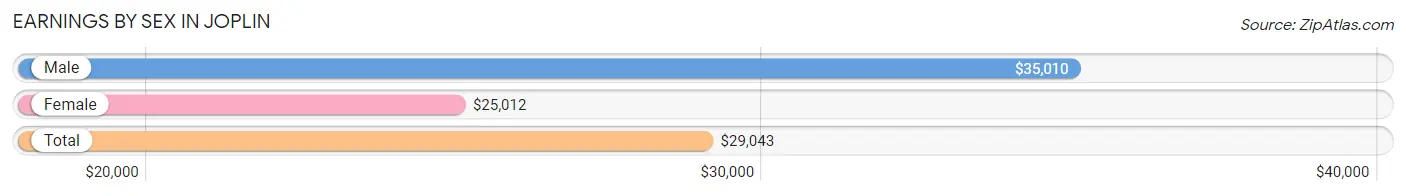
Earnings by Sex in Joplin
Average Earnings in Joplin are $29,043, $35,010 for men and $25,012 for women, a difference of 28.6%.
| Sex | Number | Average Earnings |
| Male | 14,413 (52.6%) | $35,010 |
| Female | 12,982 (47.4%) | $25,012 |
| Total | 27,395 (100.0%) | $29,043 |
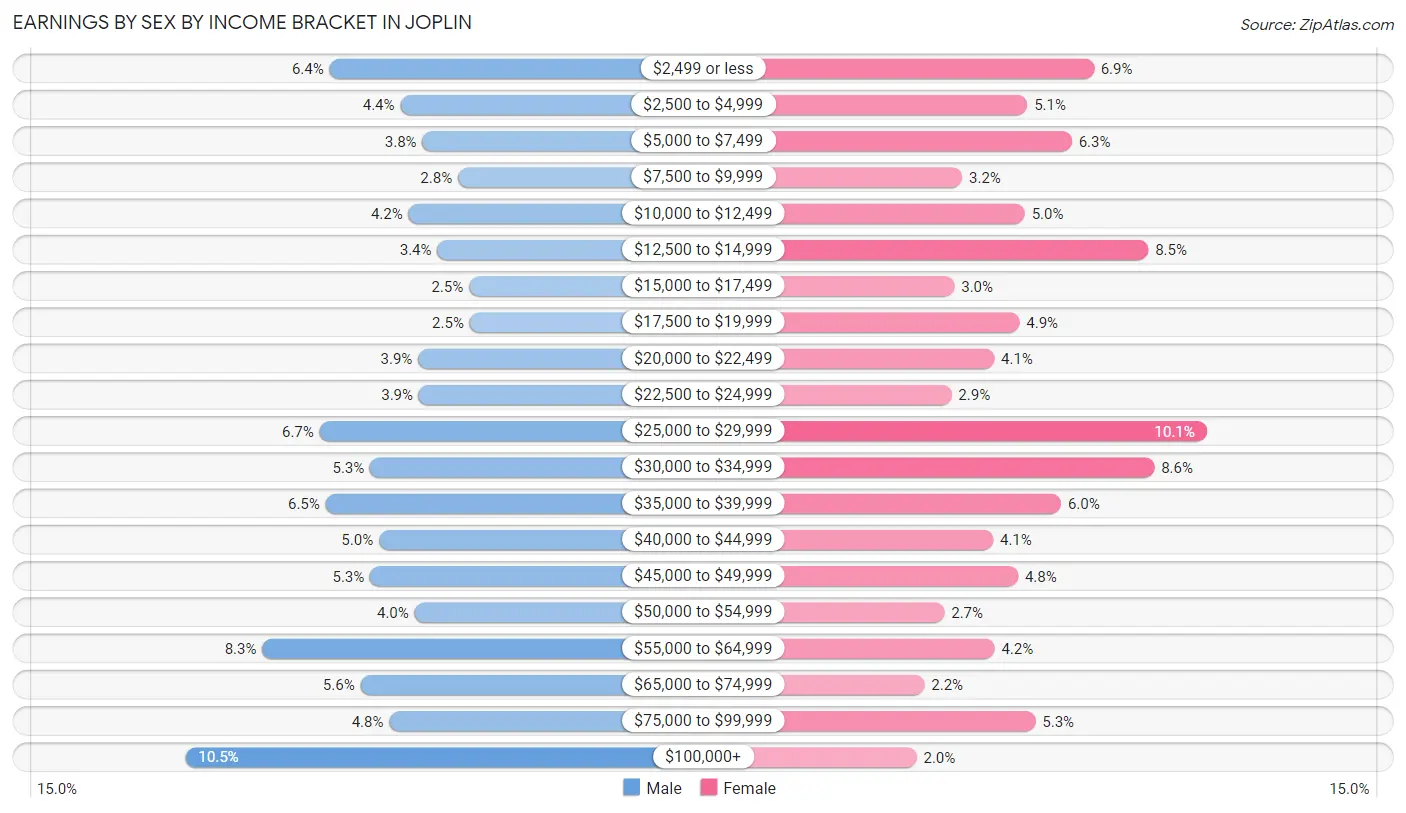
Earnings by Sex by Income Bracket in Joplin
The most common earnings brackets in Joplin are $100,000+ for men (1,510 | 10.5%) and $25,000 to $29,999 for women (1,312 | 10.1%).
| Income | Male | Female |
| $2,499 or less | 927 (6.4%) | 901 (6.9%) |
| $2,500 to $4,999 | 640 (4.4%) | 658 (5.1%) |
| $5,000 to $7,499 | 551 (3.8%) | 820 (6.3%) |
| $7,500 to $9,999 | 406 (2.8%) | 421 (3.2%) |
| $10,000 to $12,499 | 607 (4.2%) | 649 (5.0%) |
| $12,500 to $14,999 | 490 (3.4%) | 1,099 (8.5%) |
| $15,000 to $17,499 | 362 (2.5%) | 392 (3.0%) |
| $17,500 to $19,999 | 359 (2.5%) | 630 (4.9%) |
| $20,000 to $22,499 | 568 (3.9%) | 537 (4.1%) |
| $22,500 to $24,999 | 565 (3.9%) | 382 (2.9%) |
| $25,000 to $29,999 | 967 (6.7%) | 1,312 (10.1%) |
| $30,000 to $34,999 | 762 (5.3%) | 1,122 (8.6%) |
| $35,000 to $39,999 | 943 (6.5%) | 781 (6.0%) |
| $40,000 to $44,999 | 726 (5.0%) | 534 (4.1%) |
| $45,000 to $49,999 | 763 (5.3%) | 624 (4.8%) |
| $50,000 to $54,999 | 582 (4.0%) | 356 (2.7%) |
| $55,000 to $64,999 | 1,199 (8.3%) | 539 (4.2%) |
| $65,000 to $74,999 | 801 (5.6%) | 283 (2.2%) |
| $75,000 to $99,999 | 685 (4.8%) | 688 (5.3%) |
| $100,000+ | 1,510 (10.5%) | 254 (2.0%) |
| Total | 14,413 (100.0%) | 12,982 (100.0%) |
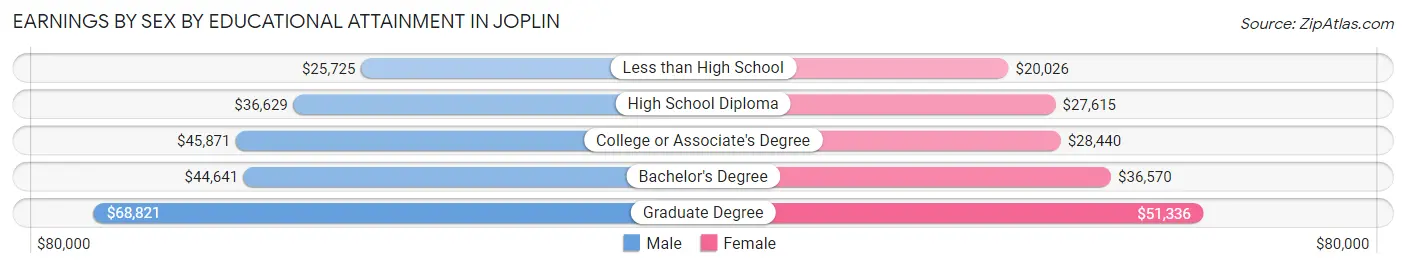
Earnings by Sex by Educational Attainment in Joplin
Average earnings in Joplin are $41,684 for men and $29,288 for women, a difference of 29.7%. Men with an educational attainment of graduate degree enjoy the highest average annual earnings of $68,821, while those with less than high school education earn the least with $25,725. Women with an educational attainment of graduate degree earn the most with the average annual earnings of $51,336, while those with less than high school education have the smallest earnings of $20,026.
| Educational Attainment | Male Income | Female Income |
| Less than High School | $25,725 | $20,026 |
| High School Diploma | $36,629 | $27,615 |
| College or Associate's Degree | $45,871 | $28,440 |
| Bachelor's Degree | $44,641 | $36,570 |
| Graduate Degree | $68,821 | $51,336 |
| Total | $41,684 | $29,288 |
Family Income in Joplin
Family Income Brackets in Joplin
According to the Joplin family income data, there are 2,532 families falling into the $50,000 to $74,999 income range, which is the most common income bracket and makes up 20.9% of all families. Conversely, the less than $10,000 income bracket is the least frequent group with only 412 families (3.4%) belonging to this category.
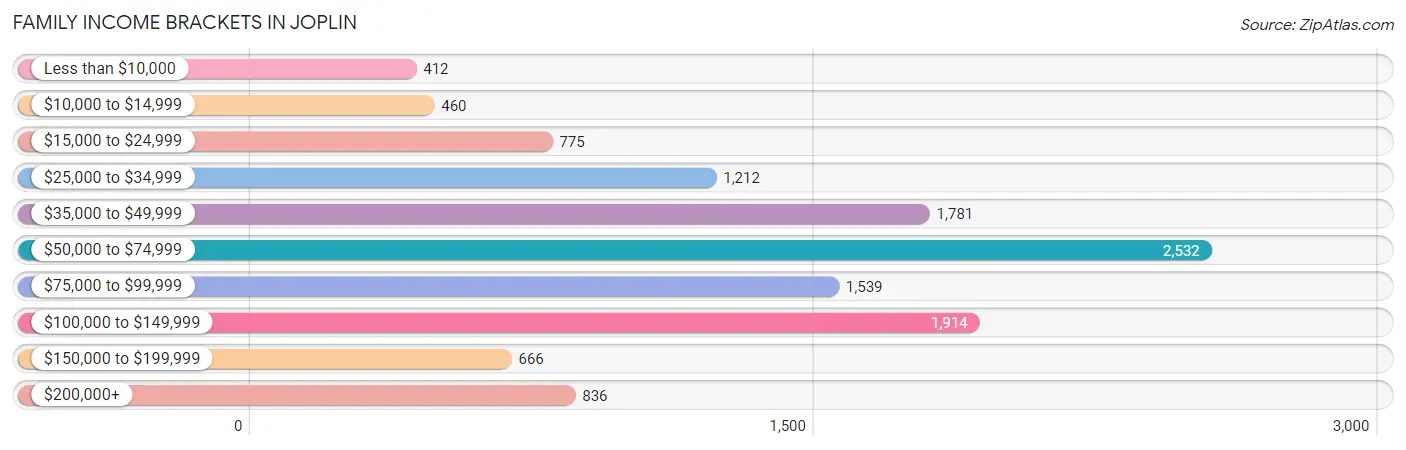
| Income Bracket | # Families | % Families |
| Less than $10,000 | 412 | 3.4% |
| $10,000 to $14,999 | 460 | 3.8% |
| $15,000 to $24,999 | 775 | 6.4% |
| $25,000 to $34,999 | 1,212 | 10.0% |
| $35,000 to $49,999 | 1,781 | 14.7% |
| $50,000 to $74,999 | 2,532 | 20.9% |
| $75,000 to $99,999 | 1,539 | 12.7% |
| $100,000 to $149,999 | 1,914 | 15.8% |
| $150,000 to $199,999 | 666 | 5.5% |
| $200,000+ | 836 | 6.9% |
Family Income by Famaliy Size in Joplin
4-person families (1,973 | 16.3%) account for the highest median family income in Joplin with $92,061 per family, while 2-person families (6,427 | 53.0%) have the highest median income of $27,946 per family member.
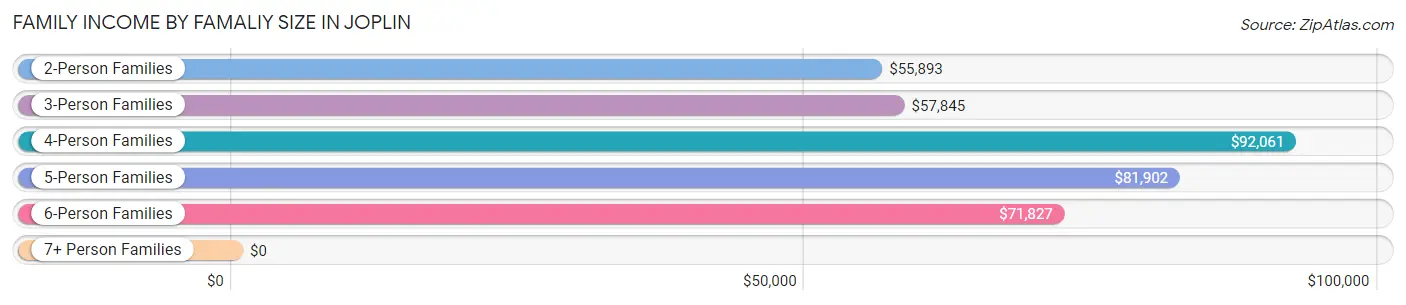
| Income Bracket | # Families | Median Income |
| 2-Person Families | 6,427 (53.0%) | $55,893 |
| 3-Person Families | 2,290 (18.9%) | $57,845 |
| 4-Person Families | 1,973 (16.3%) | $92,061 |
| 5-Person Families | 914 (7.5%) | $81,902 |
| 6-Person Families | 337 (2.8%) | $71,827 |
| 7+ Person Families | 174 (1.4%) | $0 |
| Total | 12,115 (100.0%) | $61,782 |
Family Income by Number of Earners in Joplin
The median family income in Joplin is $61,782, with families comprising 3+ earners (1,118) having the highest median family income of $112,717, while families with no earners (1,595) have the lowest median family income of $41,403, accounting for 9.2% and 13.2% of families, respectively.
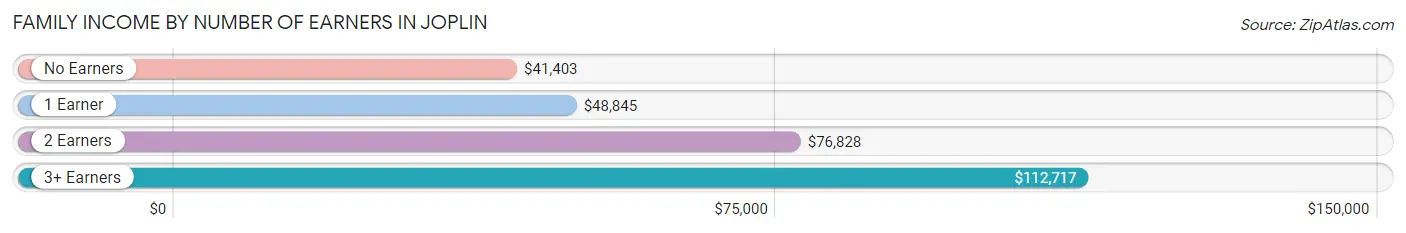
| Number of Earners | # Families | Median Income |
| No Earners | 1,595 (13.2%) | $41,403 |
| 1 Earner | 4,317 (35.6%) | $48,845 |
| 2 Earners | 5,085 (42.0%) | $76,828 |
| 3+ Earners | 1,118 (9.2%) | $112,717 |
| Total | 12,115 (100.0%) | $61,782 |
Household Income in Joplin
Household Income Brackets in Joplin
With 4,574 households falling in the category, the $50,000 to $74,999 income range is the most frequent in Joplin, accounting for 21.5% of all households. In contrast, only 787 households (3.7%) fall into the $150,000 to $199,999 income bracket, making it the least populous group.
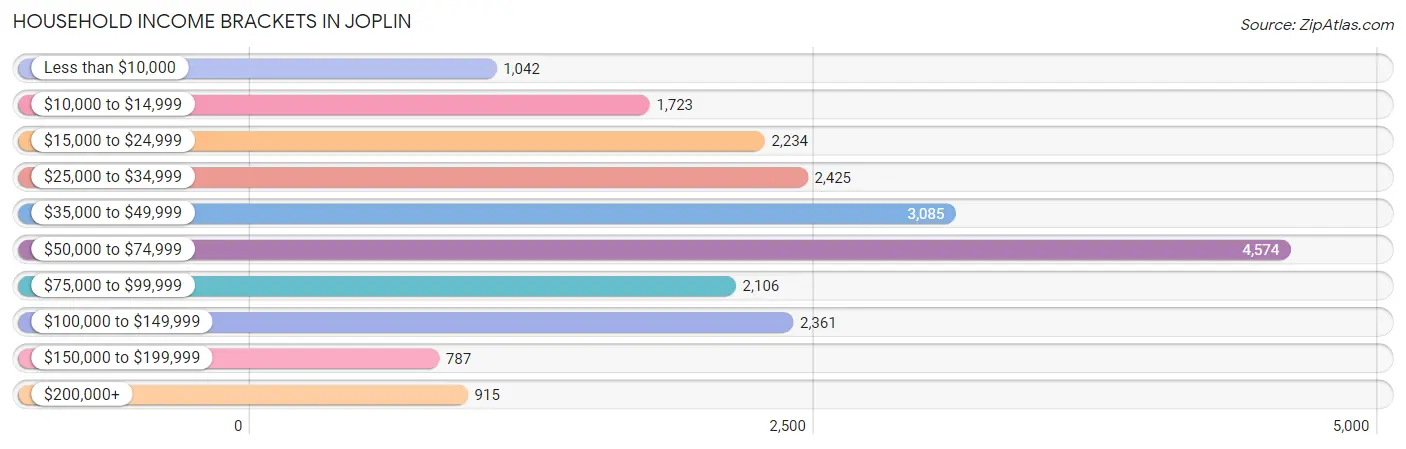
| Income Bracket | # Households | % Households |
| Less than $10,000 | 1,042 | 4.9% |
| $10,000 to $14,999 | 1,723 | 8.1% |
| $15,000 to $24,999 | 2,234 | 10.5% |
| $25,000 to $34,999 | 2,425 | 11.4% |
| $35,000 to $49,999 | 3,085 | 14.5% |
| $50,000 to $74,999 | 4,574 | 21.5% |
| $75,000 to $99,999 | 2,106 | 9.9% |
| $100,000 to $149,999 | 2,361 | 11.1% |
| $150,000 to $199,999 | 787 | 3.7% |
| $200,000+ | 915 | 4.3% |
Household Income by Householder Age in Joplin
The median household income in Joplin is $50,996, with the highest median household income of $57,866 found in the 25 to 44 years age bracket for the primary householder. A total of 6,886 households (32.4%) fall into this category. Meanwhile, the 15 to 24 years age bracket for the primary householder has the lowest median household income of $39,443, with 1,593 households (7.5%) in this group.
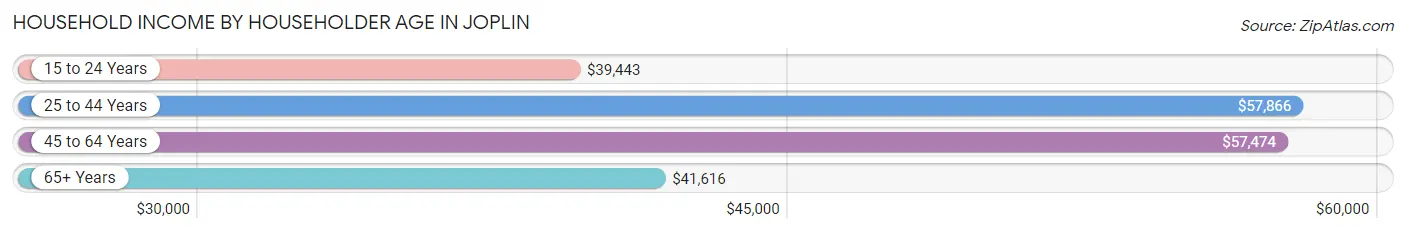
| Income Bracket | # Households | Median Income |
| 15 to 24 Years | 1,593 (7.5%) | $39,443 |
| 25 to 44 Years | 6,886 (32.4%) | $57,866 |
| 45 to 64 Years | 6,400 (30.1%) | $57,474 |
| 65+ Years | 6,395 (30.1%) | $41,616 |
| Total | 21,274 (100.0%) | $50,996 |
Poverty in Joplin
Income Below Poverty by Sex and Age in Joplin
With 17.2% poverty level for males and 17.4% for females among the residents of Joplin, 15 year old males and 18 to 24 year old females are the most vulnerable to poverty, with 142 males (39.4%) and 732 females (29.0%) in their respective age groups living below the poverty level.
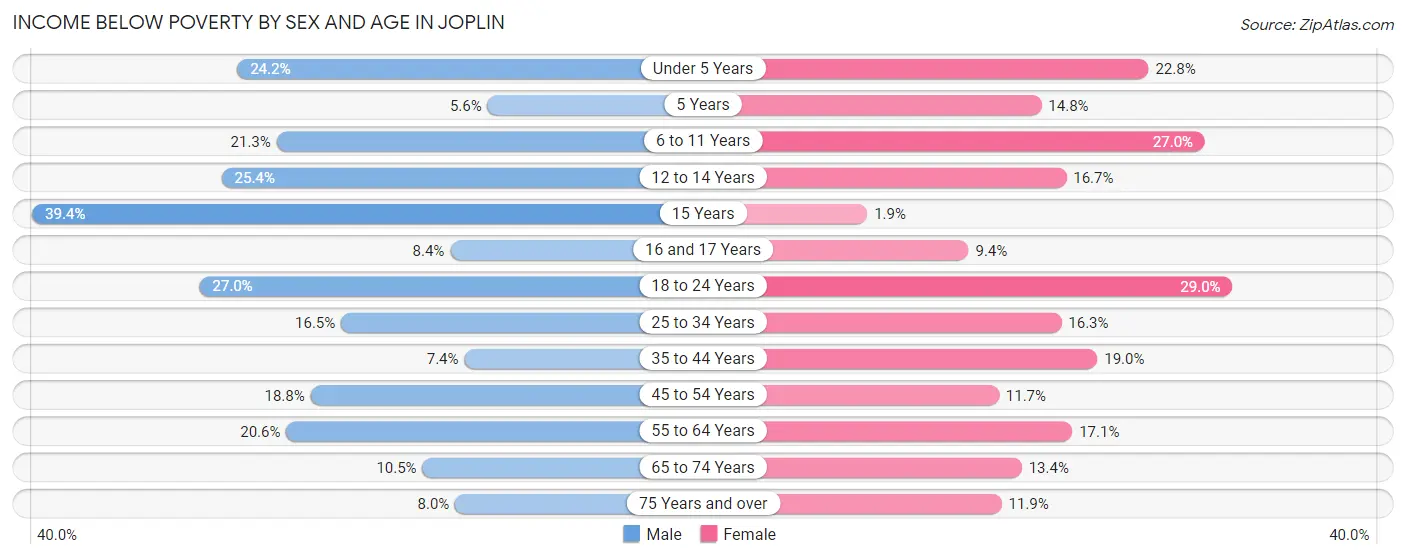
| Age Bracket | Male | Female |
| Under 5 Years | 444 (24.2%) | 301 (22.8%) |
| 5 Years | 21 (5.6%) | 67 (14.8%) |
| 6 to 11 Years | 324 (21.3%) | 486 (27.0%) |
| 12 to 14 Years | 260 (25.4%) | 152 (16.7%) |
| 15 Years | 142 (39.4%) | 8 (1.9%) |
| 16 and 17 Years | 49 (8.4%) | 53 (9.4%) |
| 18 to 24 Years | 660 (27.0%) | 732 (29.0%) |
| 25 to 34 Years | 670 (16.5%) | 566 (16.3%) |
| 35 to 44 Years | 225 (7.3%) | 543 (19.0%) |
| 45 to 54 Years | 526 (18.8%) | 288 (11.7%) |
| 55 to 64 Years | 604 (20.6%) | 511 (17.1%) |
| 65 to 74 Years | 242 (10.5%) | 409 (13.4%) |
| 75 Years and over | 130 (8.0%) | 275 (11.9%) |
| Total | 4,297 (17.2%) | 4,391 (17.4%) |
Income Above Poverty by Sex and Age in Joplin
According to the poverty statistics in Joplin, males aged 5 years and females aged 15 years are the age groups that are most secure financially, with 94.4% of males and 98.1% of females in these age groups living above the poverty line.
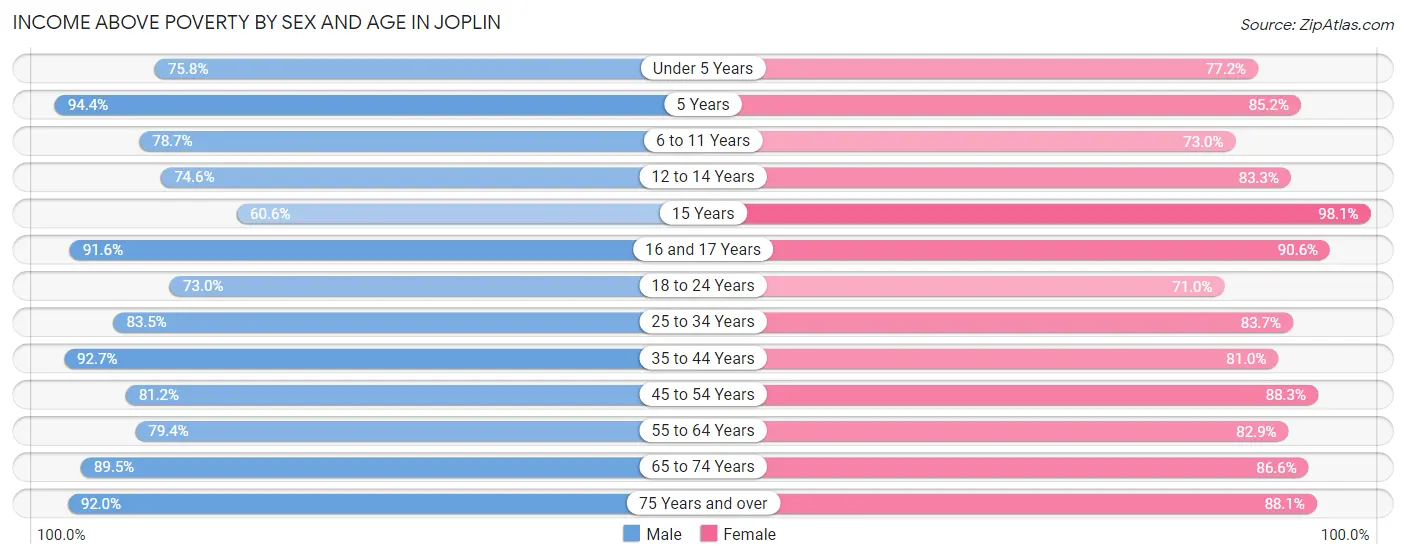
| Age Bracket | Male | Female |
| Under 5 Years | 1,390 (75.8%) | 1,021 (77.2%) |
| 5 Years | 352 (94.4%) | 385 (85.2%) |
| 6 to 11 Years | 1,198 (78.7%) | 1,317 (73.0%) |
| 12 to 14 Years | 765 (74.6%) | 760 (83.3%) |
| 15 Years | 218 (60.6%) | 415 (98.1%) |
| 16 and 17 Years | 534 (91.6%) | 510 (90.6%) |
| 18 to 24 Years | 1,783 (73.0%) | 1,792 (71.0%) |
| 25 to 34 Years | 3,391 (83.5%) | 2,907 (83.7%) |
| 35 to 44 Years | 2,837 (92.6%) | 2,319 (81.0%) |
| 45 to 54 Years | 2,277 (81.2%) | 2,181 (88.3%) |
| 55 to 64 Years | 2,332 (79.4%) | 2,475 (82.9%) |
| 65 to 74 Years | 2,071 (89.5%) | 2,653 (86.6%) |
| 75 Years and over | 1,488 (92.0%) | 2,044 (88.1%) |
| Total | 20,636 (82.8%) | 20,779 (82.6%) |
Income Below Poverty Among Married-Couple Families in Joplin
The poverty statistics for married-couple families in Joplin show that 6.3% or 538 of the total 8,525 families live below the poverty line. Families with 3 or 4 children have the highest poverty rate of 8.6%, comprising of 83 families. On the other hand, families with 5 or more children have the lowest poverty rate of 0.0%, which includes 0 families.
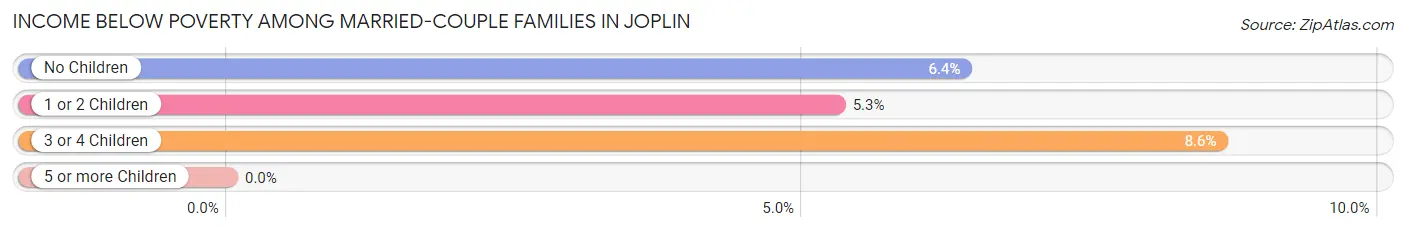
| Children | Above Poverty | Below Poverty |
| No Children | 4,764 (93.6%) | 325 (6.4%) |
| 1 or 2 Children | 2,328 (94.7%) | 130 (5.3%) |
| 3 or 4 Children | 880 (91.4%) | 83 (8.6%) |
| 5 or more Children | 15 (100.0%) | 0 (0.0%) |
| Total | 7,987 (93.7%) | 538 (6.3%) |
Income Below Poverty Among Single-Parent Households in Joplin
According to the poverty data in Joplin, 13.4% or 162 single-father households and 31.4% or 748 single-mother households are living below the poverty line. Among single-father households, those with 3 or 4 children have the highest poverty rate, with 32 households (43.8%) experiencing poverty. Likewise, among single-mother households, those with 5 or more children have the highest poverty rate, with 32 households (100.0%) falling below the poverty line.
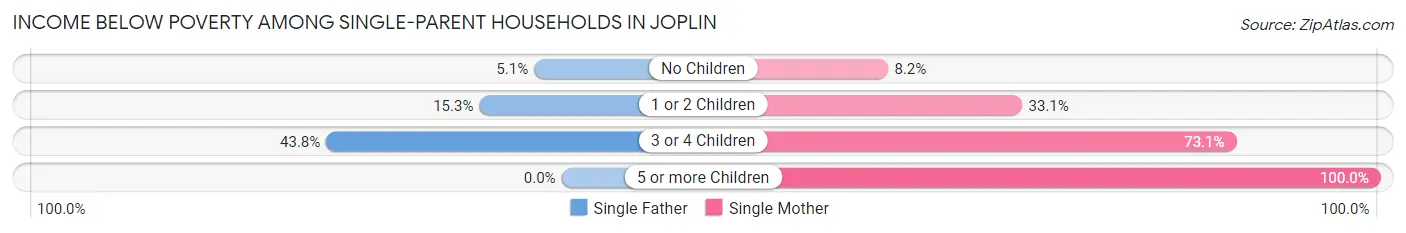
| Children | Single Father | Single Mother |
| No Children | 22 (5.1%) | 57 (8.2%) |
| 1 or 2 Children | 108 (15.3%) | 455 (33.1%) |
| 3 or 4 Children | 32 (43.8%) | 204 (73.1%) |
| 5 or more Children | 0 (0.0%) | 32 (100.0%) |
| Total | 162 (13.4%) | 748 (31.4%) |
Income Below Poverty Among Married-Couple vs Single-Parent Households in Joplin
The poverty data for Joplin shows that 538 of the married-couple family households (6.3%) and 910 of the single-parent households (25.4%) are living below the poverty level. Within the married-couple family households, those with 3 or 4 children have the highest poverty rate, with 83 households (8.6%) falling below the poverty line. Among the single-parent households, those with 5 or more children have the highest poverty rate, with 32 household (100.0%) living below poverty.
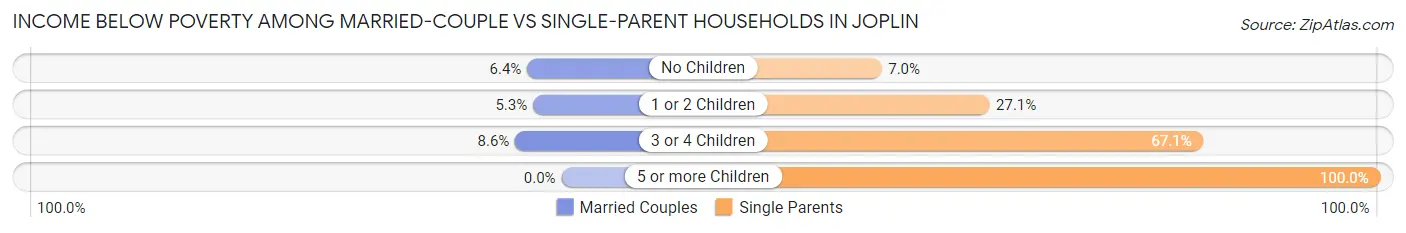
| Children | Married-Couple Families | Single-Parent Households |
| No Children | 325 (6.4%) | 79 (7.0%) |
| 1 or 2 Children | 130 (5.3%) | 563 (27.1%) |
| 3 or 4 Children | 83 (8.6%) | 236 (67.0%) |
| 5 or more Children | 0 (0.0%) | 32 (100.0%) |
| Total | 538 (6.3%) | 910 (25.4%) |
Race in Joplin
The most populous races in Joplin are White / Caucasian (44,019 | 84.9%), Hispanic or Latino (3,731 | 7.2%), and Two or more Races (3,681 | 7.1%).
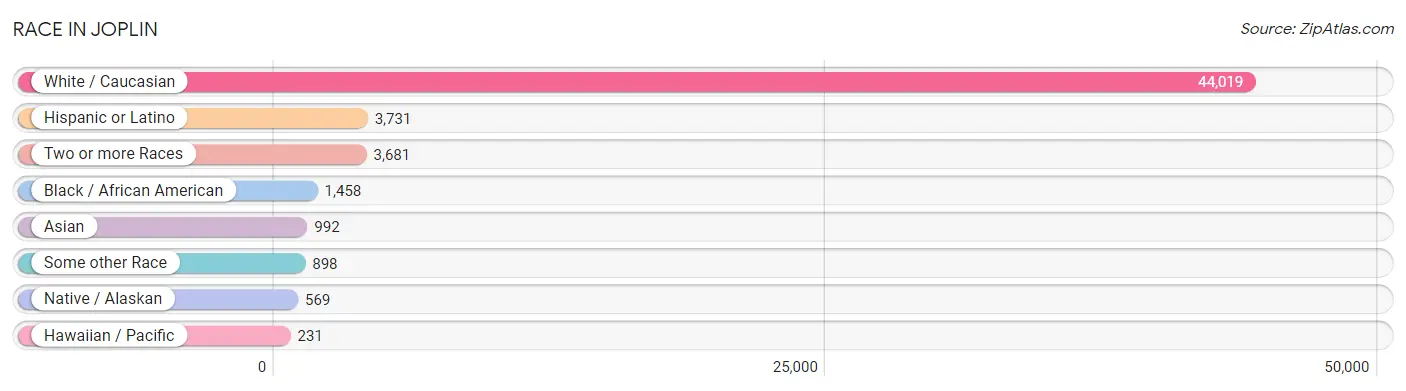
| Race | # Population | % Population |
| Asian | 992 | 1.9% |
| Black / African American | 1,458 | 2.8% |
| Hawaiian / Pacific | 231 | 0.4% |
| Hispanic or Latino | 3,731 | 7.2% |
| Native / Alaskan | 569 | 1.1% |
| White / Caucasian | 44,019 | 84.9% |
| Two or more Races | 3,681 | 7.1% |
| Some other Race | 898 | 1.7% |
| Total | 51,848 | 100.0% |
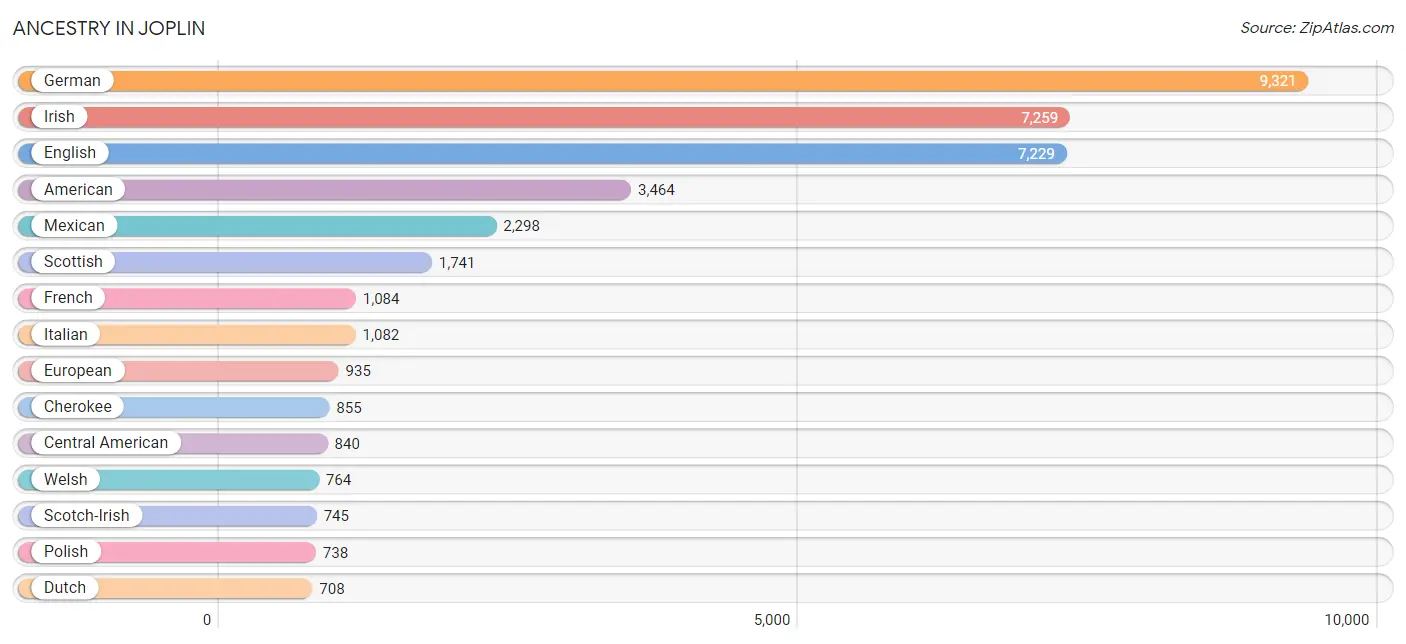
Ancestry in Joplin
The most populous ancestries reported in Joplin are German (9,321 | 18.0%), Irish (7,259 | 14.0%), English (7,229 | 13.9%), American (3,464 | 6.7%), and Mexican (2,298 | 4.4%), together accounting for 57.0% of all Joplin residents.
| Ancestry | # Population | % Population |
| African | 19 | 0.0% |
| American | 3,464 | 6.7% |
| Apache | 14 | 0.0% |
| Arab | 165 | 0.3% |
| Australian | 135 | 0.3% |
| Austrian | 35 | 0.1% |
| Bangladeshi | 8 | 0.0% |
| Belgian | 17 | 0.0% |
| Bermudan | 9 | 0.0% |
| Bhutanese | 34 | 0.1% |
| Blackfeet | 54 | 0.1% |
| Brazilian | 60 | 0.1% |
| British | 404 | 0.8% |
| Burmese | 58 | 0.1% |
| Canadian | 11 | 0.0% |
| Central American | 840 | 1.6% |
| Central American Indian | 13 | 0.0% |
| Cherokee | 855 | 1.7% |
| Chickasaw | 7 | 0.0% |
| Chippewa | 60 | 0.1% |
| Choctaw | 89 | 0.2% |
| Comanche | 13 | 0.0% |
| Costa Rican | 21 | 0.0% |
| Croatian | 6 | 0.0% |
| Cuban | 65 | 0.1% |
| Czech | 280 | 0.5% |
| Czechoslovakian | 17 | 0.0% |
| Danish | 130 | 0.3% |
| Dominican | 7 | 0.0% |
| Dutch | 708 | 1.4% |
| Dutch West Indian | 5 | 0.0% |
| Eastern European | 131 | 0.3% |
| Egyptian | 43 | 0.1% |
| English | 7,229 | 13.9% |
| European | 935 | 1.8% |
| Filipino | 13 | 0.0% |
| Finnish | 6 | 0.0% |
| French | 1,084 | 2.1% |
| French Canadian | 38 | 0.1% |
| German | 9,321 | 18.0% |
| Greek | 237 | 0.5% |
| Guamanian / Chamorro | 19 | 0.0% |
| Guatemalan | 486 | 0.9% |
| Haitian | 5 | 0.0% |
| Honduran | 168 | 0.3% |
| Hungarian | 30 | 0.1% |
| Indian (Asian) | 124 | 0.2% |
| Irish | 7,259 | 14.0% |
| Iroquois | 53 | 0.1% |
| Italian | 1,082 | 2.1% |
| Japanese | 35 | 0.1% |
| Jordanian | 100 | 0.2% |
| Kenyan | 51 | 0.1% |
| Korean | 78 | 0.2% |
| Latvian | 81 | 0.2% |
| Lebanese | 18 | 0.0% |
| Lithuanian | 47 | 0.1% |
| Menominee | 9 | 0.0% |
| Mexican | 2,298 | 4.4% |
| Mexican American Indian | 16 | 0.0% |
| Native Hawaiian | 10 | 0.0% |
| Navajo | 15 | 0.0% |
| New Zealander | 6 | 0.0% |
| Nicaraguan | 10 | 0.0% |
| Northern European | 24 | 0.1% |
| Norwegian | 187 | 0.4% |
| Osage | 15 | 0.0% |
| Ottawa | 4 | 0.0% |
| Pakistani | 47 | 0.1% |
| Panamanian | 46 | 0.1% |
| Pennsylvania German | 10 | 0.0% |
| Polish | 738 | 1.4% |
| Portuguese | 63 | 0.1% |
| Puerto Rican | 267 | 0.5% |
| Romanian | 34 | 0.1% |
| Russian | 294 | 0.6% |
| Salvadoran | 109 | 0.2% |
| Samoan | 49 | 0.1% |
| Scandinavian | 181 | 0.4% |
| Scotch-Irish | 745 | 1.4% |
| Scottish | 1,741 | 3.4% |
| Serbian | 6 | 0.0% |
| Sioux | 100 | 0.2% |
| Slovene | 39 | 0.1% |
| South African | 10 | 0.0% |
| South American | 29 | 0.1% |
| Spaniard | 157 | 0.3% |
| Spanish | 35 | 0.1% |
| Spanish American | 15 | 0.0% |
| Sri Lankan | 280 | 0.5% |
| Subsaharan African | 80 | 0.2% |
| Swedish | 304 | 0.6% |
| Swiss | 136 | 0.3% |
| Thai | 108 | 0.2% |
| Venezuelan | 29 | 0.1% |
| Welsh | 764 | 1.5% |
| Yugoslavian | 15 | 0.0% | View All 97 Rows |
Immigrants in Joplin
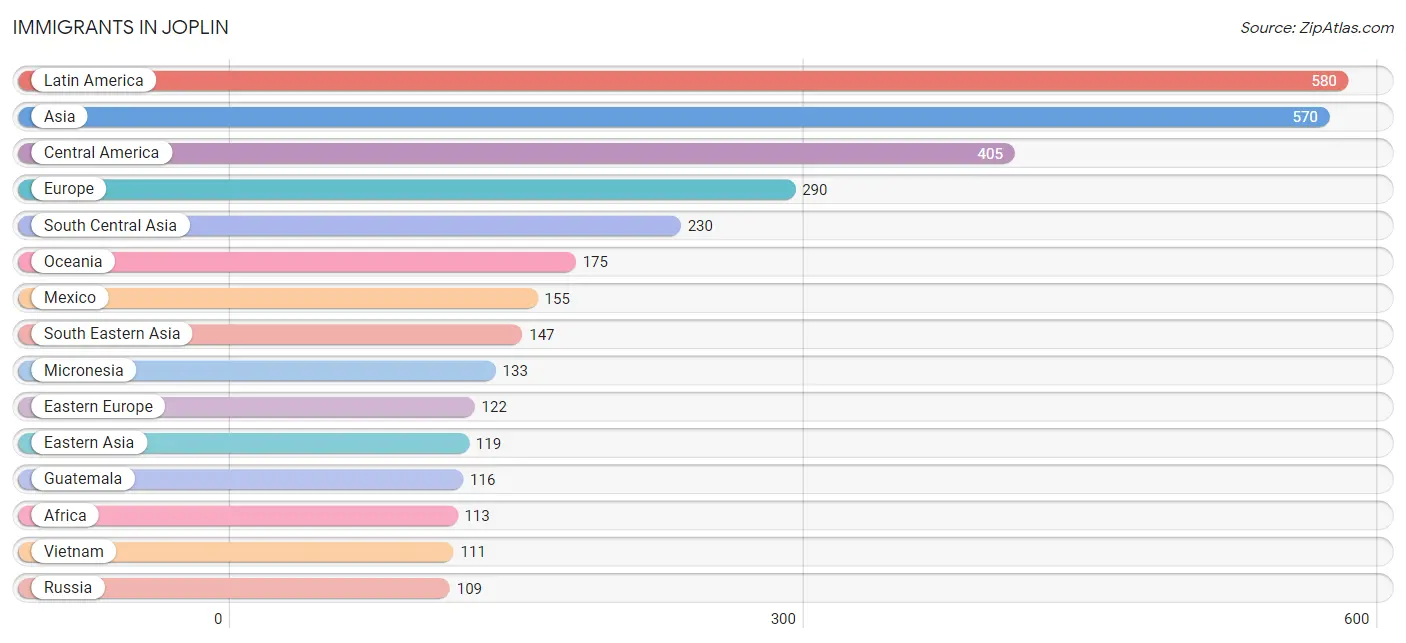
The most numerous immigrant groups reported in Joplin came from Latin America (580 | 1.1%), Asia (570 | 1.1%), Central America (405 | 0.8%), Europe (290 | 0.6%), and South Central Asia (230 | 0.4%), together accounting for 4.0% of all Joplin residents.
| Immigration Origin | # Population | % Population |
| Africa | 113 | 0.2% |
| Asia | 570 | 1.1% |
| Australia | 36 | 0.1% |
| Austria | 15 | 0.0% |
| Brazil | 75 | 0.1% |
| Canada | 18 | 0.0% |
| Caribbean | 71 | 0.1% |
| Central America | 405 | 0.8% |
| China | 97 | 0.2% |
| Costa Rica | 21 | 0.0% |
| Cuba | 65 | 0.1% |
| Dominican Republic | 6 | 0.0% |
| Eastern Africa | 51 | 0.1% |
| Eastern Asia | 119 | 0.2% |
| Eastern Europe | 122 | 0.2% |
| Egypt | 17 | 0.0% |
| El Salvador | 96 | 0.2% |
| England | 24 | 0.1% |
| Europe | 290 | 0.6% |
| France | 13 | 0.0% |
| Germany | 51 | 0.1% |
| Guatemala | 116 | 0.2% |
| Honduras | 10 | 0.0% |
| India | 32 | 0.1% |
| Ireland | 54 | 0.1% |
| Japan | 22 | 0.0% |
| Jordan | 54 | 0.1% |
| Kazakhstan | 6 | 0.0% |
| Kenya | 51 | 0.1% |
| Latin America | 580 | 1.1% |
| Latvia | 13 | 0.0% |
| Mexico | 155 | 0.3% |
| Micronesia | 133 | 0.3% |
| Nepal | 102 | 0.2% |
| Nigeria | 7 | 0.0% |
| Northern Africa | 55 | 0.1% |
| Northern Europe | 89 | 0.2% |
| Oceania | 175 | 0.3% |
| Pakistan | 90 | 0.2% |
| Philippines | 17 | 0.0% |
| Russia | 109 | 0.2% |
| Saudi Arabia | 10 | 0.0% |
| South America | 104 | 0.2% |
| South Central Asia | 230 | 0.4% |
| South Eastern Asia | 147 | 0.3% |
| Sudan | 38 | 0.1% |
| Syria | 10 | 0.0% |
| Taiwan | 18 | 0.0% |
| Thailand | 19 | 0.0% |
| Venezuela | 29 | 0.1% |
| Vietnam | 111 | 0.2% |
| Western Africa | 7 | 0.0% |
| Western Asia | 74 | 0.1% |
| Western Europe | 79 | 0.2% | View All 54 Rows |
Sex and Age in Joplin
Sex and Age in Joplin
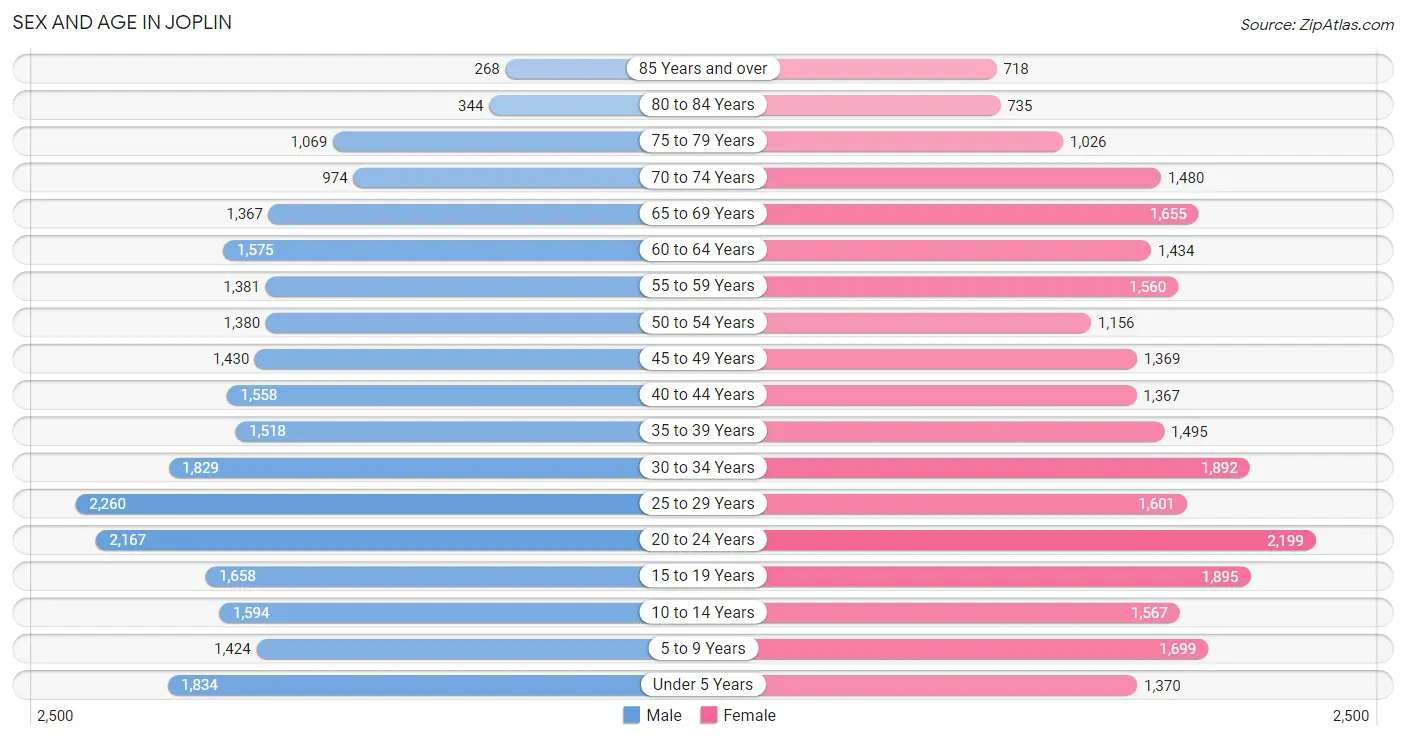
The most populous age groups in Joplin are 25 to 29 Years (2,260 | 8.8%) for men and 20 to 24 Years (2,199 | 8.4%) for women.
| Age Bracket | Male | Female |
| Under 5 Years | 1,834 (7.2%) | 1,370 (5.2%) |
| 5 to 9 Years | 1,424 (5.6%) | 1,699 (6.5%) |
| 10 to 14 Years | 1,594 (6.2%) | 1,567 (6.0%) |
| 15 to 19 Years | 1,658 (6.5%) | 1,895 (7.2%) |
| 20 to 24 Years | 2,167 (8.5%) | 2,199 (8.4%) |
| 25 to 29 Years | 2,260 (8.8%) | 1,601 (6.1%) |
| 30 to 34 Years | 1,829 (7.1%) | 1,892 (7.2%) |
| 35 to 39 Years | 1,518 (5.9%) | 1,495 (5.7%) |
| 40 to 44 Years | 1,558 (6.1%) | 1,367 (5.2%) |
| 45 to 49 Years | 1,430 (5.6%) | 1,369 (5.2%) |
| 50 to 54 Years | 1,380 (5.4%) | 1,156 (4.4%) |
| 55 to 59 Years | 1,381 (5.4%) | 1,560 (5.9%) |
| 60 to 64 Years | 1,575 (6.1%) | 1,434 (5.5%) |
| 65 to 69 Years | 1,367 (5.3%) | 1,655 (6.3%) |
| 70 to 74 Years | 974 (3.8%) | 1,480 (5.6%) |
| 75 to 79 Years | 1,069 (4.2%) | 1,026 (3.9%) |
| 80 to 84 Years | 344 (1.3%) | 735 (2.8%) |
| 85 Years and over | 268 (1.1%) | 718 (2.7%) |
| Total | 25,630 (100.0%) | 26,218 (100.0%) |
Families and Households in Joplin
Median Family Size in Joplin
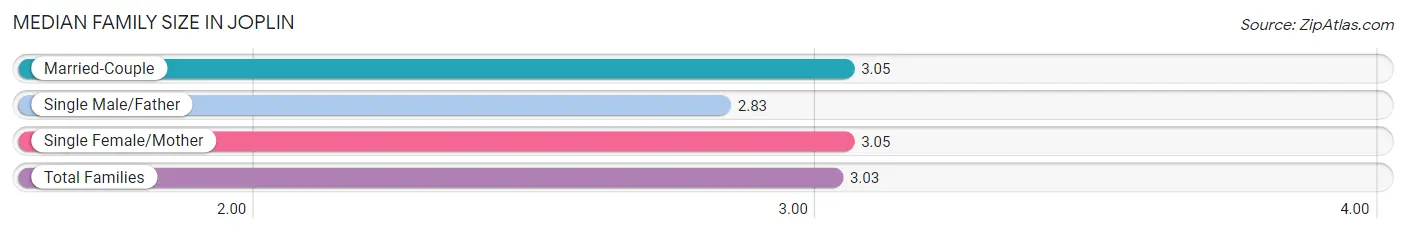
The median family size in Joplin is 3.03 persons per family, with married-couple families (8,525 | 70.4%) accounting for the largest median family size of 3.05 persons per family. On the other hand, single male/father families (1,208 | 10.0%) represent the smallest median family size with 2.83 persons per family.
| Family Type | # Families | Family Size |
| Married-Couple | 8,525 (70.4%) | 3.05 |
| Single Male/Father | 1,208 (10.0%) | 2.83 |
| Single Female/Mother | 2,382 (19.7%) | 3.05 |
| Total Families | 12,115 (100.0%) | 3.03 |
Median Household Size in Joplin
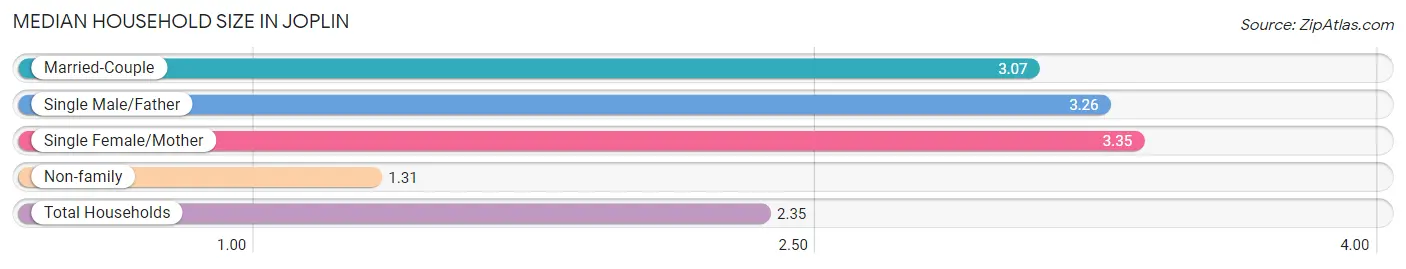
The median household size in Joplin is 2.35 persons per household, with single female/mother households (2,382 | 11.2%) accounting for the largest median household size of 3.35 persons per household. non-family households (9,159 | 43.0%) represent the smallest median household size with 1.31 persons per household.
| Household Type | # Households | Household Size |
| Married-Couple | 8,525 (40.1%) | 3.07 |
| Single Male/Father | 1,208 (5.7%) | 3.26 |
| Single Female/Mother | 2,382 (11.2%) | 3.35 |
| Non-family | 9,159 (43.0%) | 1.31 |
| Total Households | 21,274 (100.0%) | 2.35 |
Household Size by Marriage Status in Joplin
Out of a total of 21,274 households in Joplin, 12,115 (57.0%) are family households, while 9,159 (43.0%) are nonfamily households. The most numerous type of family households are 2-person households, comprising 5,803, and the most common type of nonfamily households are 1-person households, comprising 6,993.
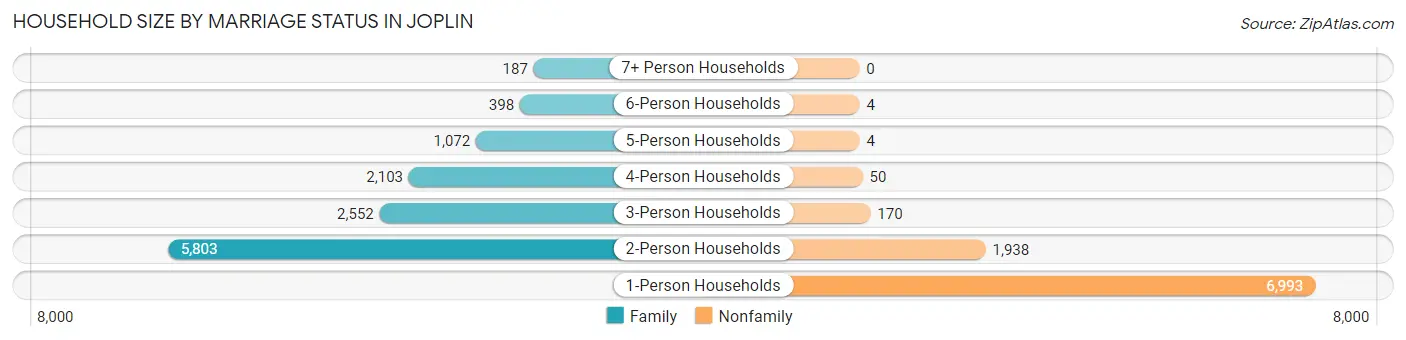
| Household Size | Family Households | Nonfamily Households |
| 1-Person Households | - | 6,993 (32.9%) |
| 2-Person Households | 5,803 (27.3%) | 1,938 (9.1%) |
| 3-Person Households | 2,552 (12.0%) | 170 (0.8%) |
| 4-Person Households | 2,103 (9.9%) | 50 (0.2%) |
| 5-Person Households | 1,072 (5.0%) | 4 (0.0%) |
| 6-Person Households | 398 (1.9%) | 4 (0.0%) |
| 7+ Person Households | 187 (0.9%) | 0 (0.0%) |
| Total | 12,115 (57.0%) | 9,159 (43.0%) |
Female Fertility in Joplin
Fertility by Age in Joplin
Average fertility rate in Joplin is 66.0 births per 1,000 women. Women in the age bracket of 20 to 34 years have the highest fertility rate with 109.0 births per 1,000 women. Women in the age bracket of 20 to 34 years acount for 77.3% of all women with births.
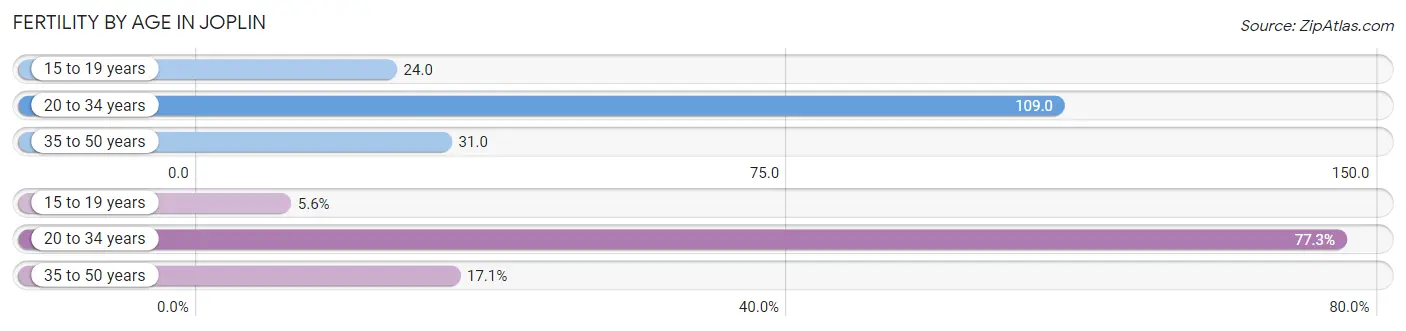
| Age Bracket | Women with Births | Births / 1,000 Women |
| 15 to 19 years | 45 (5.6%) | 24.0 |
| 20 to 34 years | 619 (77.3%) | 109.0 |
| 35 to 50 years | 137 (17.1%) | 31.0 |
| Total | 801 (100.0%) | 66.0 |
Fertility by Age by Marriage Status in Joplin
58.7% of women with births (801) in Joplin are married. The highest percentage of unmarried women with births falls into 15 to 19 years age bracket with 100.0% of them unmarried at the time of birth, while the lowest percentage of unmarried women with births belong to 35 to 50 years age bracket with 13.1% of them unmarried.
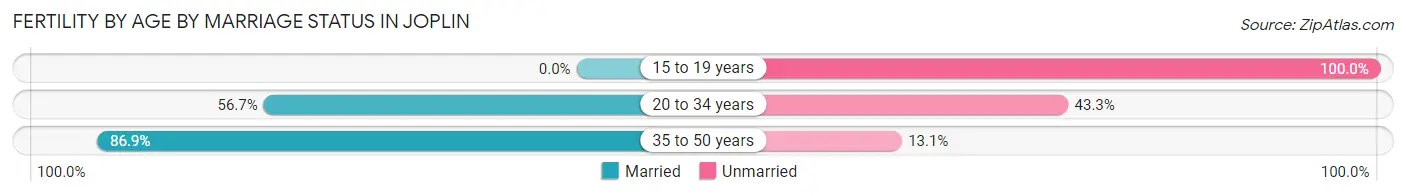
| Age Bracket | Married | Unmarried |
| 15 to 19 years | 0 (0.0%) | 45 (100.0%) |
| 20 to 34 years | 351 (56.7%) | 268 (43.3%) |
| 35 to 50 years | 119 (86.9%) | 18 (13.1%) |
| Total | 470 (58.7%) | 331 (41.3%) |
Fertility by Education in Joplin
Average fertility rate in Joplin is 66.0 births per 1,000 women. Women with the education attainment of graduate degree have the highest fertility rate of 111.0 births per 1,000 women, while women with the education attainment of college or associate's degree have the lowest fertility at 47.0 births per 1,000 women. Women with the education attainment of high school diploma represent 30.8% of all women with births.
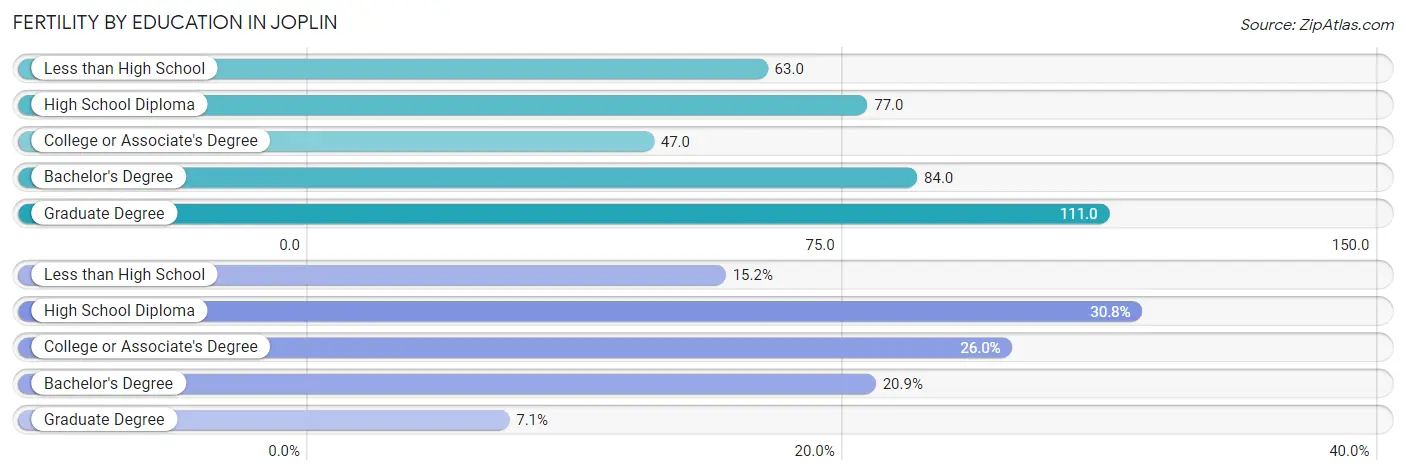
| Educational Attainment | Women with Births | Births / 1,000 Women |
| Less than High School | 122 (15.2%) | 63.0 |
| High School Diploma | 247 (30.8%) | 77.0 |
| College or Associate's Degree | 208 (26.0%) | 47.0 |
| Bachelor's Degree | 167 (20.8%) | 84.0 |
| Graduate Degree | 57 (7.1%) | 111.0 |
| Total | 801 (100.0%) | 66.0 |
Fertility by Education by Marriage Status in Joplin
41.3% of women with births in Joplin are unmarried. Women with the educational attainment of graduate degree are most likely to be married with 100.0% of them married at childbirth, while women with the educational attainment of high school diploma are least likely to be married with 66.0% of them unmarried at childbirth.
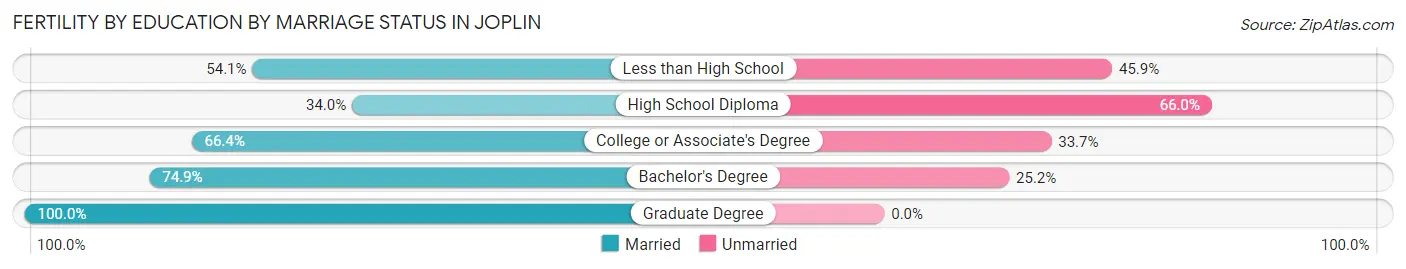
| Educational Attainment | Married | Unmarried |
| Less than High School | 66 (54.1%) | 56 (45.9%) |
| High School Diploma | 84 (34.0%) | 163 (66.0%) |
| College or Associate's Degree | 138 (66.3%) | 70 (33.7%) |
| Bachelor's Degree | 125 (74.9%) | 42 (25.2%) |
| Graduate Degree | 57 (100.0%) | 0 (0.0%) |
| Total | 470 (58.7%) | 331 (41.3%) |
Employment Characteristics in Joplin
Employment by Class of Employer in Joplin
Among the 23,562 employed individuals in Joplin, private company employees (16,321 | 69.3%), not-for-profit organizations (3,127 | 13.3%), and local government employees (1,112 | 4.7%) make up the most common classes of employment.
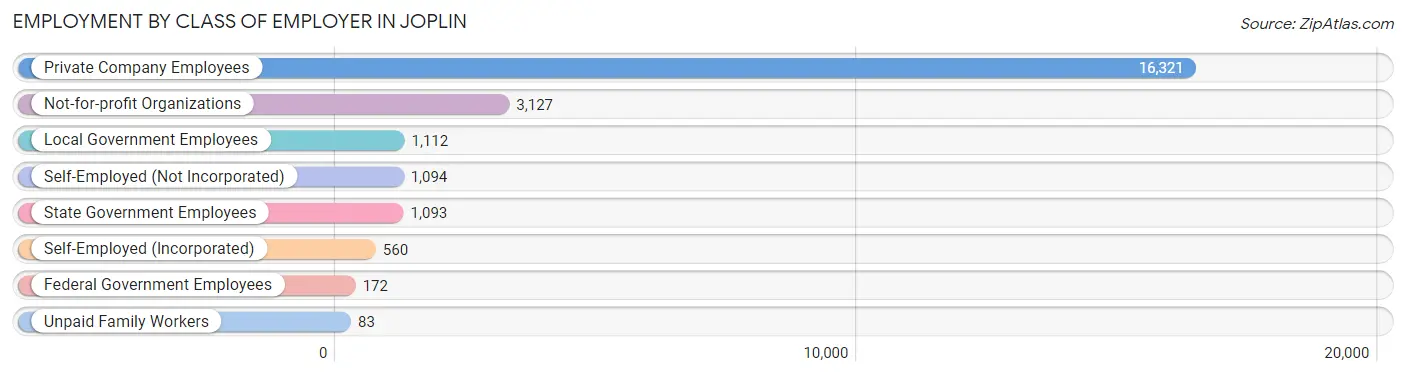
| Employer Class | # Employees | % Employees |
| Private Company Employees | 16,321 | 69.3% |
| Self-Employed (Incorporated) | 560 | 2.4% |
| Self-Employed (Not Incorporated) | 1,094 | 4.6% |
| Not-for-profit Organizations | 3,127 | 13.3% |
| Local Government Employees | 1,112 | 4.7% |
| State Government Employees | 1,093 | 4.6% |
| Federal Government Employees | 172 | 0.7% |
| Unpaid Family Workers | 83 | 0.4% |
| Total | 23,562 | 100.0% |
Employment Status by Age in Joplin
According to the labor force statistics for Joplin, out of the total population over 16 years of age (41,573), 61.4% or 25,526 individuals are in the labor force, with 4.9% or 1,251 of them unemployed. The age group with the highest labor force participation rate is 30 to 34 years, with 83.4% or 3,103 individuals in the labor force. Within the labor force, the 16 to 19 years age range has the highest percentage of unemployed individuals, with 20.6% or 320 of them being unemployed.
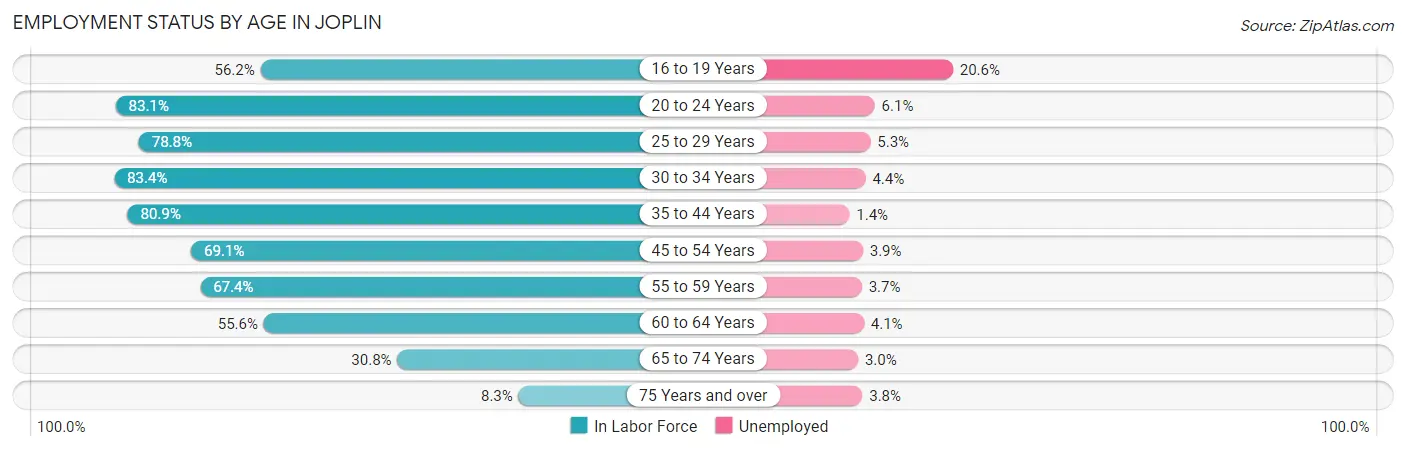
| Age Bracket | In Labor Force | Unemployed |
| 16 to 19 Years | 1,554 (56.2%) | 320 (20.6%) |
| 20 to 24 Years | 3,628 (83.1%) | 221 (6.1%) |
| 25 to 29 Years | 3,042 (78.8%) | 161 (5.3%) |
| 30 to 34 Years | 3,103 (83.4%) | 137 (4.4%) |
| 35 to 44 Years | 4,804 (80.9%) | 67 (1.4%) |
| 45 to 54 Years | 3,686 (69.1%) | 144 (3.9%) |
| 55 to 59 Years | 1,982 (67.4%) | 73 (3.7%) |
| 60 to 64 Years | 1,673 (55.6%) | 69 (4.1%) |
| 65 to 74 Years | 1,687 (30.8%) | 51 (3.0%) |
| 75 Years and over | 345 (8.3%) | 13 (3.8%) |
| Total | 25,526 (61.4%) | 1,251 (4.9%) |
Employment Status by Educational Attainment in Joplin
According to labor force statistics for Joplin, 73.8% of individuals (18,306) out of the total population between 25 and 64 years of age (24,805) are in the labor force, with 3.6% or 659 of them being unemployed. The group with the highest labor force participation rate are those with the educational attainment of bachelor's degree or higher, with 84.5% or 5,425 individuals in the labor force. Within the labor force, individuals with high school diploma education have the highest percentage of unemployment, with 4.8% or 275 of them being unemployed.
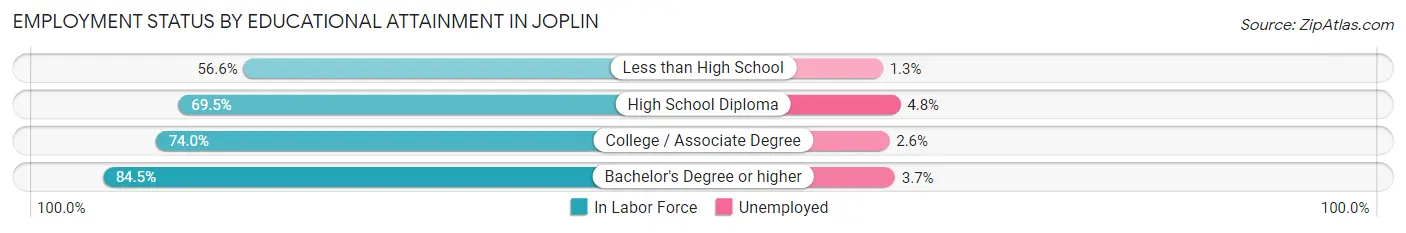
| Educational Attainment | In Labor Force | Unemployed |
| Less than High School | 1,187 (56.6%) | 27 (1.3%) |
| High School Diploma | 5,732 (69.5%) | 396 (4.8%) |
| College / Associate Degree | 5,950 (74.0%) | 209 (2.6%) |
| Bachelor's Degree or higher | 5,425 (84.5%) | 238 (3.7%) |
| Total | 18,306 (73.8%) | 893 (3.6%) |
Employment Occupations by Sex in Joplin
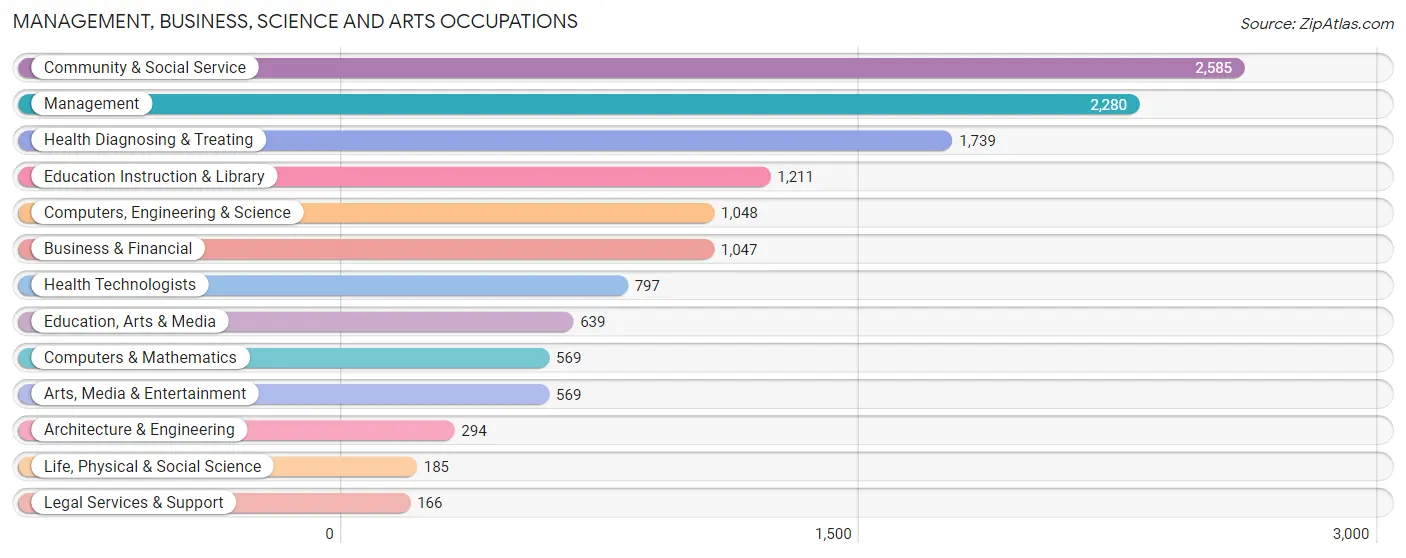
Management, Business, Science and Arts Occupations
The most common Management, Business, Science and Arts occupations in Joplin are Community & Social Service (2,585 | 10.7%), Management (2,280 | 9.4%), Health Diagnosing & Treating (1,739 | 7.2%), Education Instruction & Library (1,211 | 5.0%), and Computers, Engineering & Science (1,048 | 4.3%).
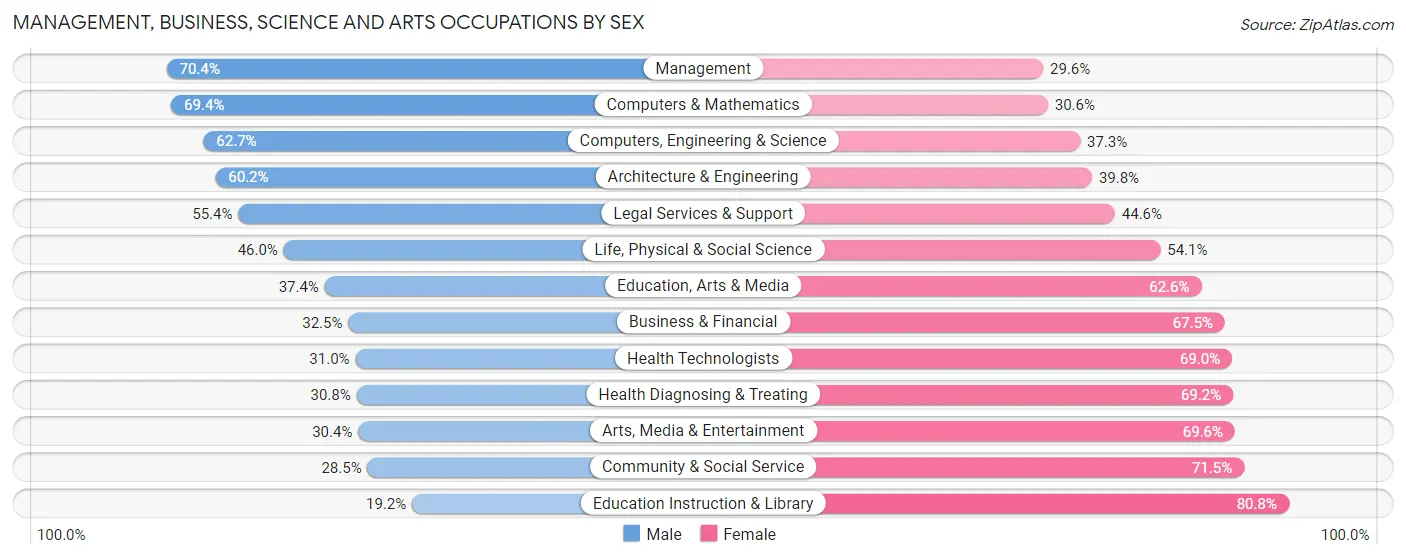
Management, Business, Science and Arts Occupations by Sex
Within the Management, Business, Science and Arts occupations in Joplin, the most male-oriented occupations are Management (70.4%), Computers & Mathematics (69.4%), and Computers, Engineering & Science (62.7%), while the most female-oriented occupations are Education Instruction & Library (80.8%), Community & Social Service (71.5%), and Arts, Media & Entertainment (69.6%).
| Occupation | Male | Female |
| Management | 1,605 (70.4%) | 675 (29.6%) |
| Business & Financial | 340 (32.5%) | 707 (67.5%) |
| Computers, Engineering & Science | 657 (62.7%) | 391 (37.3%) |
| Computers & Mathematics | 395 (69.4%) | 174 (30.6%) |
| Architecture & Engineering | 177 (60.2%) | 117 (39.8%) |
| Life, Physical & Social Science | 85 (46.0%) | 100 (54.0%) |
| Community & Social Service | 736 (28.5%) | 1,849 (71.5%) |
| Education, Arts & Media | 239 (37.4%) | 400 (62.6%) |
| Legal Services & Support | 92 (55.4%) | 74 (44.6%) |
| Education Instruction & Library | 232 (19.2%) | 979 (80.8%) |
| Arts, Media & Entertainment | 173 (30.4%) | 396 (69.6%) |
| Health Diagnosing & Treating | 535 (30.8%) | 1,204 (69.2%) |
| Health Technologists | 247 (31.0%) | 550 (69.0%) |
| Total (Category) | 3,873 (44.5%) | 4,826 (55.5%) |
| Total (Overall) | 12,742 (52.6%) | 11,499 (47.4%) |
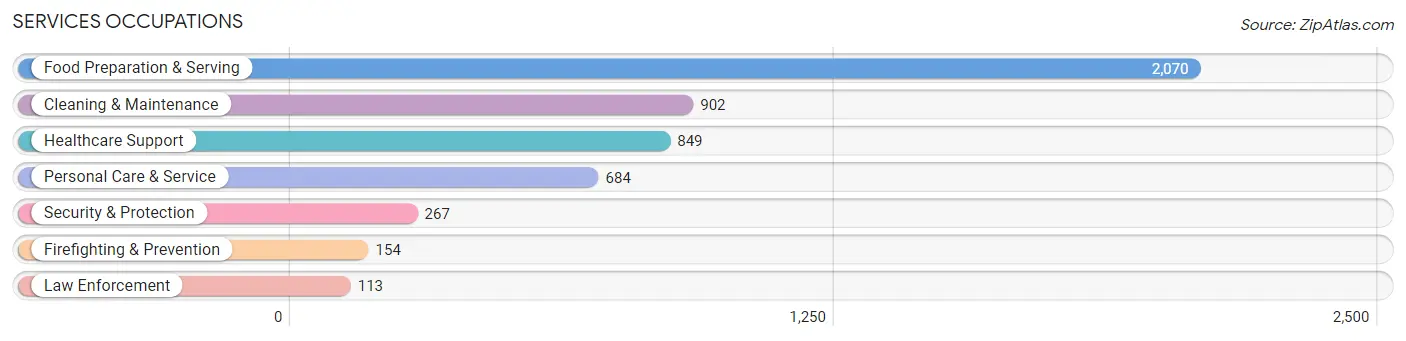
Services Occupations
The most common Services occupations in Joplin are Food Preparation & Serving (2,070 | 8.5%), Cleaning & Maintenance (902 | 3.7%), Healthcare Support (849 | 3.5%), Personal Care & Service (684 | 2.8%), and Security & Protection (267 | 1.1%).
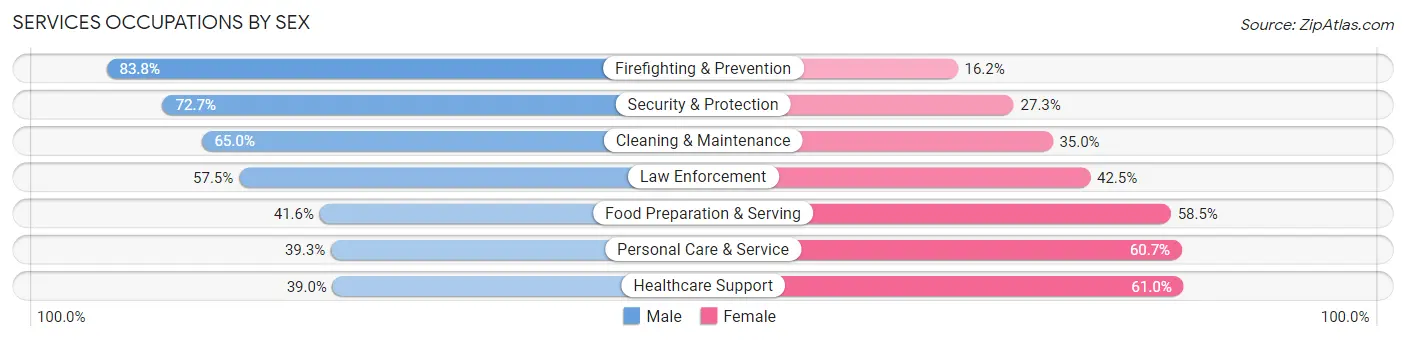
Services Occupations by Sex
Within the Services occupations in Joplin, the most male-oriented occupations are Firefighting & Prevention (83.8%), Security & Protection (72.7%), and Cleaning & Maintenance (65.0%), while the most female-oriented occupations are Healthcare Support (61.0%), Personal Care & Service (60.7%), and Food Preparation & Serving (58.5%).
| Occupation | Male | Female |
| Healthcare Support | 331 (39.0%) | 518 (61.0%) |
| Security & Protection | 194 (72.7%) | 73 (27.3%) |
| Firefighting & Prevention | 129 (83.8%) | 25 (16.2%) |
| Law Enforcement | 65 (57.5%) | 48 (42.5%) |
| Food Preparation & Serving | 860 (41.5%) | 1,210 (58.5%) |
| Cleaning & Maintenance | 586 (65.0%) | 316 (35.0%) |
| Personal Care & Service | 269 (39.3%) | 415 (60.7%) |
| Total (Category) | 2,240 (46.9%) | 2,532 (53.1%) |
| Total (Overall) | 12,742 (52.6%) | 11,499 (47.4%) |
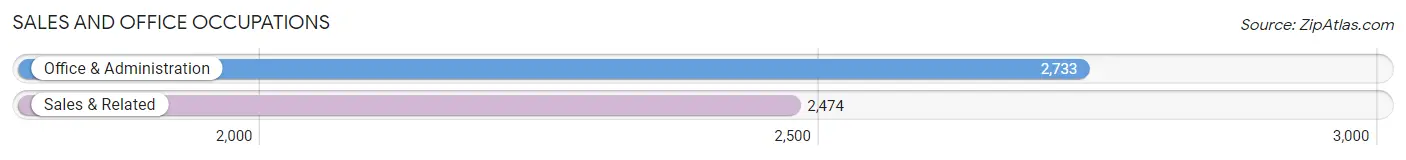
Sales and Office Occupations
The most common Sales and Office occupations in Joplin are Office & Administration (2,733 | 11.3%), and Sales & Related (2,474 | 10.2%).
Sales and Office Occupations by Sex
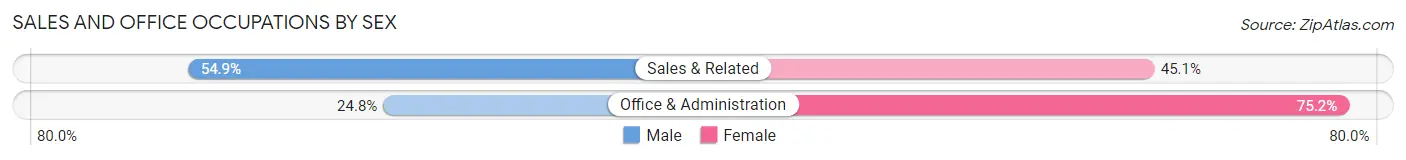
| Occupation | Male | Female |
| Sales & Related | 1,358 (54.9%) | 1,116 (45.1%) |
| Office & Administration | 679 (24.8%) | 2,054 (75.2%) |
| Total (Category) | 2,037 (39.1%) | 3,170 (60.9%) |
| Total (Overall) | 12,742 (52.6%) | 11,499 (47.4%) |
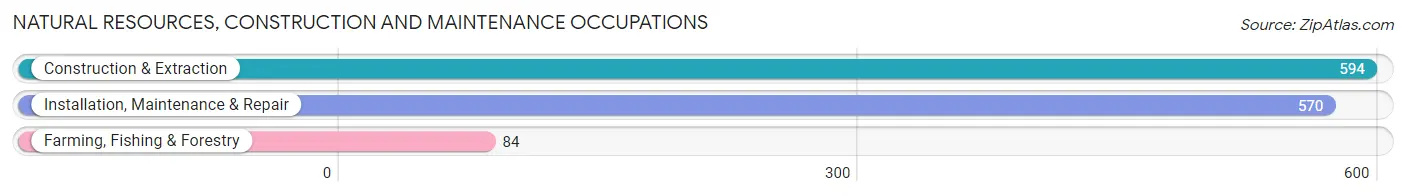
Natural Resources, Construction and Maintenance Occupations
The most common Natural Resources, Construction and Maintenance occupations in Joplin are Construction & Extraction (594 | 2.5%), Installation, Maintenance & Repair (570 | 2.4%), and Farming, Fishing & Forestry (84 | 0.4%).
Natural Resources, Construction and Maintenance Occupations by Sex
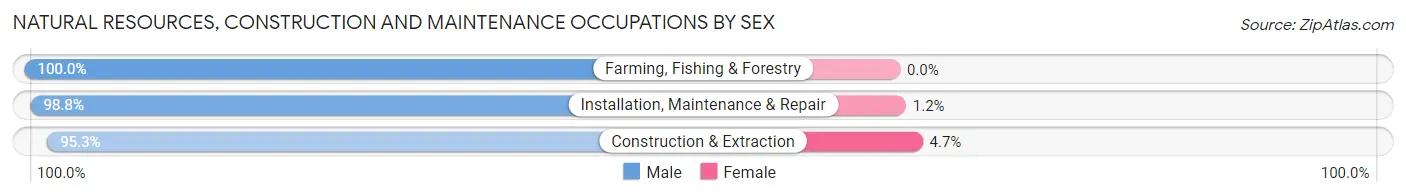
| Occupation | Male | Female |
| Farming, Fishing & Forestry | 84 (100.0%) | 0 (0.0%) |
| Construction & Extraction | 566 (95.3%) | 28 (4.7%) |
| Installation, Maintenance & Repair | 563 (98.8%) | 7 (1.2%) |
| Total (Category) | 1,213 (97.2%) | 35 (2.8%) |
| Total (Overall) | 12,742 (52.6%) | 11,499 (47.4%) |
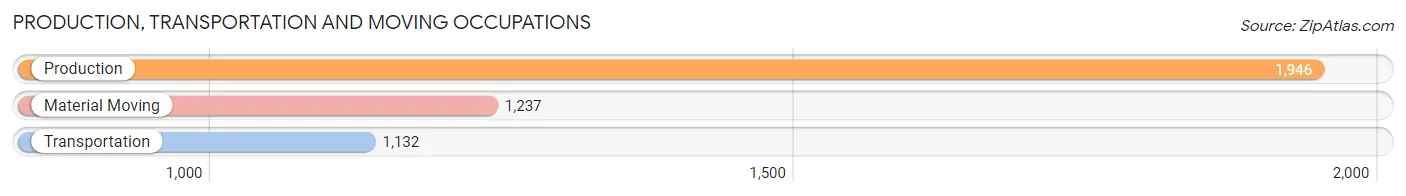
Production, Transportation and Moving Occupations
The most common Production, Transportation and Moving occupations in Joplin are Production (1,946 | 8.0%), Material Moving (1,237 | 5.1%), and Transportation (1,132 | 4.7%).
Production, Transportation and Moving Occupations by Sex
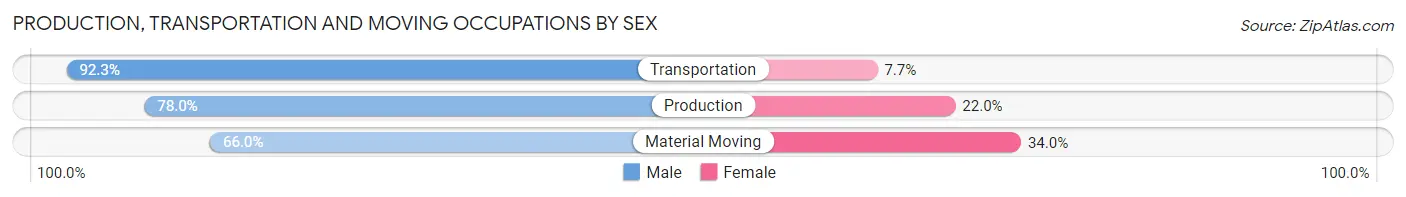
| Occupation | Male | Female |
| Production | 1,518 (78.0%) | 428 (22.0%) |
| Transportation | 1,045 (92.3%) | 87 (7.7%) |
| Material Moving | 816 (66.0%) | 421 (34.0%) |
| Total (Category) | 3,379 (78.3%) | 936 (21.7%) |
| Total (Overall) | 12,742 (52.6%) | 11,499 (47.4%) |
Employment Industries by Sex in Joplin
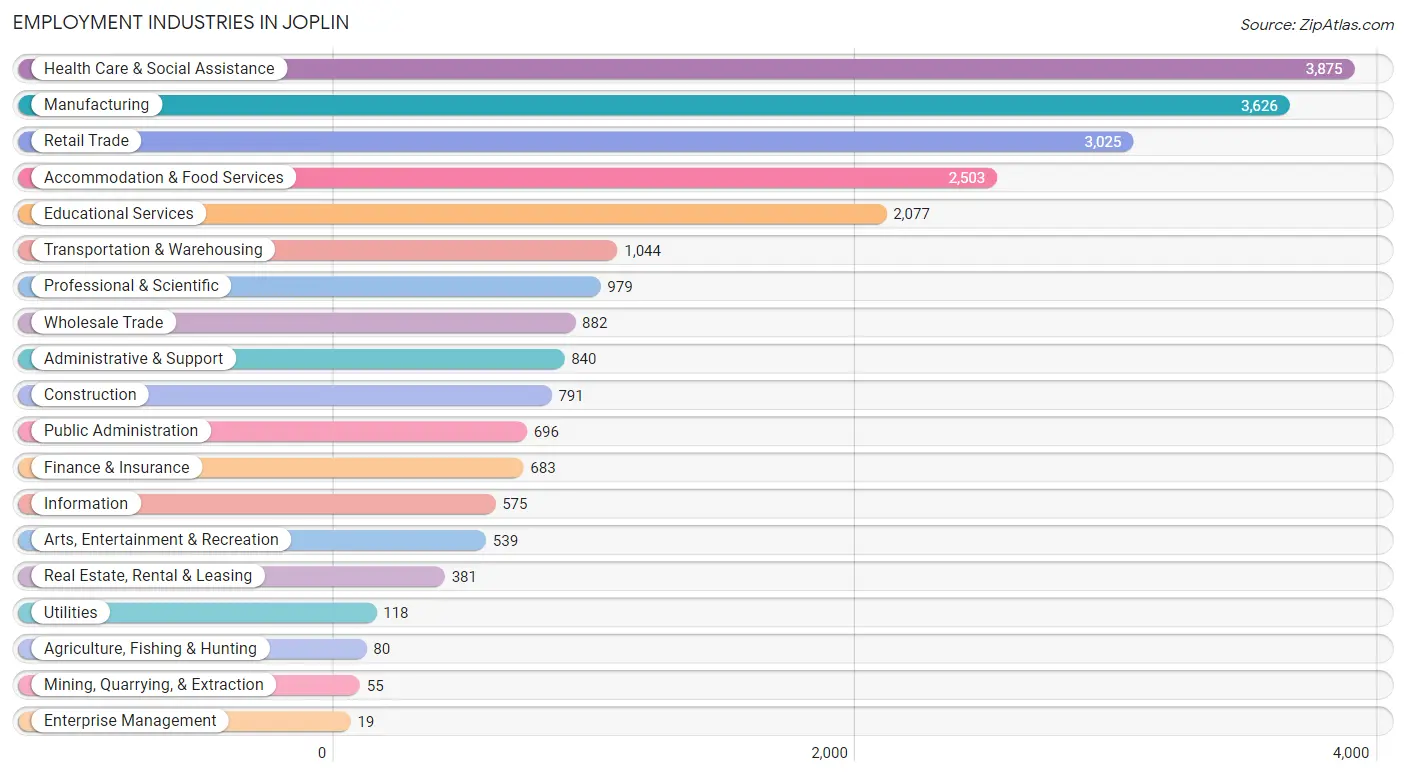
Employment Industries in Joplin
The major employment industries in Joplin include Health Care & Social Assistance (3,875 | 16.0%), Manufacturing (3,626 | 15.0%), Retail Trade (3,025 | 12.5%), Accommodation & Food Services (2,503 | 10.3%), and Educational Services (2,077 | 8.6%).
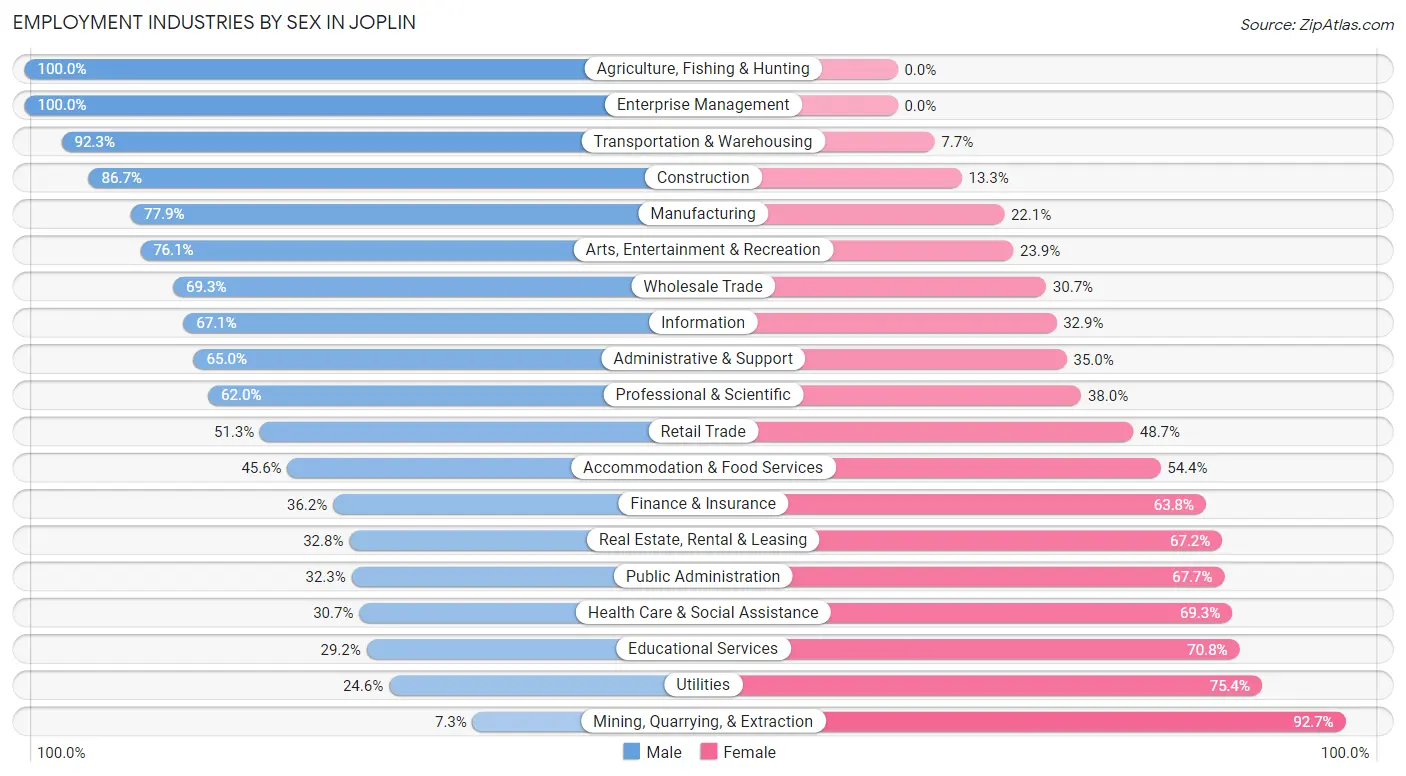
Employment Industries by Sex in Joplin
The Joplin industries that see more men than women are Agriculture, Fishing & Hunting (100.0%), Enterprise Management (100.0%), and Transportation & Warehousing (92.3%), whereas the industries that tend to have a higher number of women are Mining, Quarrying, & Extraction (92.7%), Utilities (75.4%), and Educational Services (70.8%).
| Industry | Male | Female |
| Agriculture, Fishing & Hunting | 80 (100.0%) | 0 (0.0%) |
| Mining, Quarrying, & Extraction | 4 (7.3%) | 51 (92.7%) |
| Construction | 686 (86.7%) | 105 (13.3%) |
| Manufacturing | 2,826 (77.9%) | 800 (22.1%) |
| Wholesale Trade | 611 (69.3%) | 271 (30.7%) |
| Retail Trade | 1,551 (51.3%) | 1,474 (48.7%) |
| Transportation & Warehousing | 964 (92.3%) | 80 (7.7%) |
| Utilities | 29 (24.6%) | 89 (75.4%) |
| Information | 386 (67.1%) | 189 (32.9%) |
| Finance & Insurance | 247 (36.2%) | 436 (63.8%) |
| Real Estate, Rental & Leasing | 125 (32.8%) | 256 (67.2%) |
| Professional & Scientific | 607 (62.0%) | 372 (38.0%) |
| Enterprise Management | 19 (100.0%) | 0 (0.0%) |
| Administrative & Support | 546 (65.0%) | 294 (35.0%) |
| Educational Services | 607 (29.2%) | 1,470 (70.8%) |
| Health Care & Social Assistance | 1,191 (30.7%) | 2,684 (69.3%) |
| Arts, Entertainment & Recreation | 410 (76.1%) | 129 (23.9%) |
| Accommodation & Food Services | 1,141 (45.6%) | 1,362 (54.4%) |
| Public Administration | 225 (32.3%) | 471 (67.7%) |
| Total | 12,742 (52.6%) | 11,499 (47.4%) |
Education in Joplin
School Enrollment in Joplin
The most common levels of schooling among the 12,404 students in Joplin are college / undergraduate (3,219 | 26.0%), middle school (2,787 | 22.5%), and high school (2,405 | 19.4%).
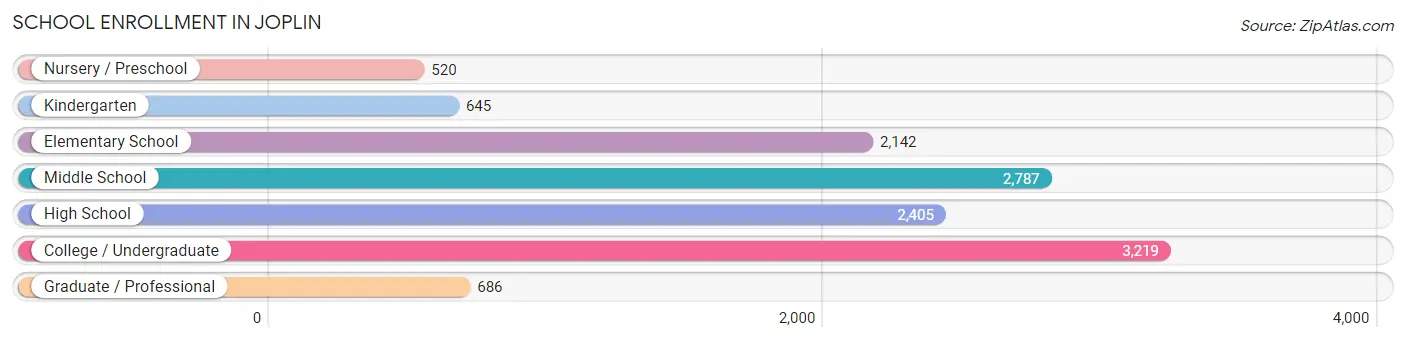
| School Level | # Students | % Students |
| Nursery / Preschool | 520 | 4.2% |
| Kindergarten | 645 | 5.2% |
| Elementary School | 2,142 | 17.3% |
| Middle School | 2,787 | 22.5% |
| High School | 2,405 | 19.4% |
| College / Undergraduate | 3,219 | 26.0% |
| Graduate / Professional | 686 | 5.5% |
| Total | 12,404 | 100.0% |
School Enrollment by Age by Funding Source in Joplin
Out of a total of 12,404 students who are enrolled in schools in Joplin, 2,444 (19.7%) attend a private institution, while the remaining 9,960 (80.3%) are enrolled in public schools. The age group of 25 to 34 year olds has the highest likelihood of being enrolled in private schools, with 385 (47.9% in the age bracket) enrolled. Conversely, the age group of 10 to 14 year olds has the lowest likelihood of being enrolled in a private school, with 2,800 (89.6% in the age bracket) attending a public institution.
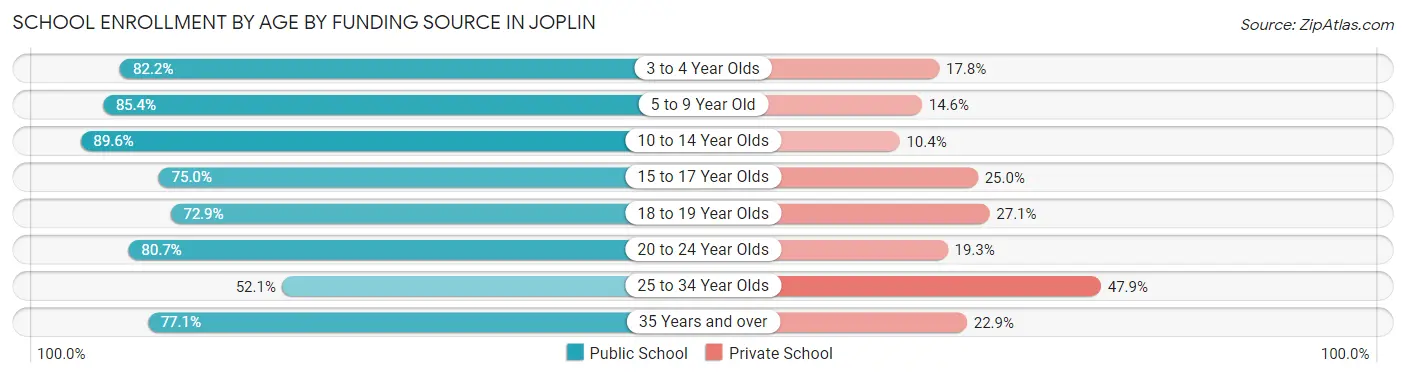
| Age Bracket | Public School | Private School |
| 3 to 4 Year Olds | 199 (82.2%) | 43 (17.8%) |
| 5 to 9 Year Old | 2,348 (85.4%) | 400 (14.6%) |
| 10 to 14 Year Olds | 2,800 (89.6%) | 325 (10.4%) |
| 15 to 17 Year Olds | 1,406 (75.0%) | 468 (25.0%) |
| 18 to 19 Year Olds | 969 (72.9%) | 361 (27.1%) |
| 20 to 24 Year Olds | 1,418 (80.7%) | 340 (19.3%) |
| 25 to 34 Year Olds | 419 (52.1%) | 385 (47.9%) |
| 35 Years and over | 403 (77.1%) | 120 (22.9%) |
| Total | 9,960 (80.3%) | 2,444 (19.7%) |
Educational Attainment by Field of Study in Joplin
Business (2,214 | 23.1%), education (1,713 | 17.9%), bio, nature & agricultural (894 | 9.3%), science & technology (881 | 9.2%), and arts & humanities (738 | 7.7%) are the most common fields of study among 9,575 individuals in Joplin who have obtained a bachelor's degree or higher.
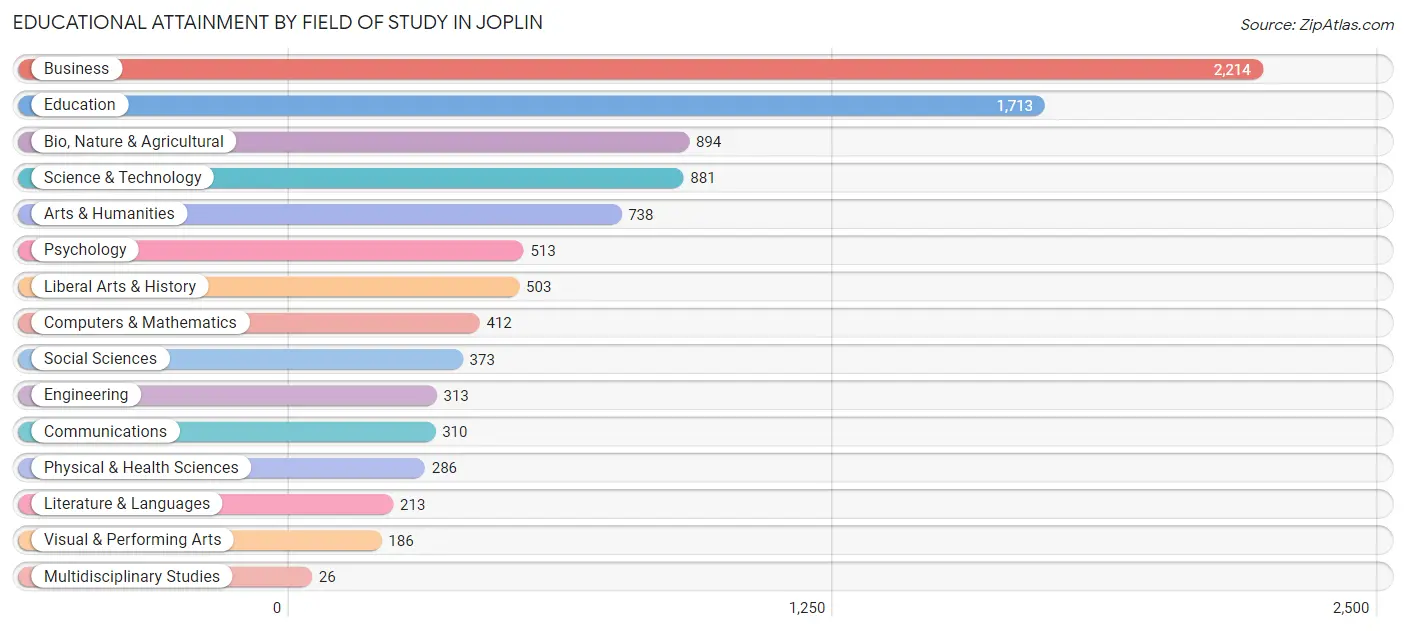
| Field of Study | # Graduates | % Graduates |
| Computers & Mathematics | 412 | 4.3% |
| Bio, Nature & Agricultural | 894 | 9.3% |
| Physical & Health Sciences | 286 | 3.0% |
| Psychology | 513 | 5.4% |
| Social Sciences | 373 | 3.9% |
| Engineering | 313 | 3.3% |
| Multidisciplinary Studies | 26 | 0.3% |
| Science & Technology | 881 | 9.2% |
| Business | 2,214 | 23.1% |
| Education | 1,713 | 17.9% |
| Literature & Languages | 213 | 2.2% |
| Liberal Arts & History | 503 | 5.2% |
| Visual & Performing Arts | 186 | 1.9% |
| Communications | 310 | 3.2% |
| Arts & Humanities | 738 | 7.7% |
| Total | 9,575 | 100.0% |
Transportation & Commute in Joplin
Vehicle Availability by Sex in Joplin
The most prevalent vehicle ownership categories in Joplin are males with 2 vehicles (5,847, accounting for 47.3%) and females with 2 vehicles (4,427, making up 55.4%).
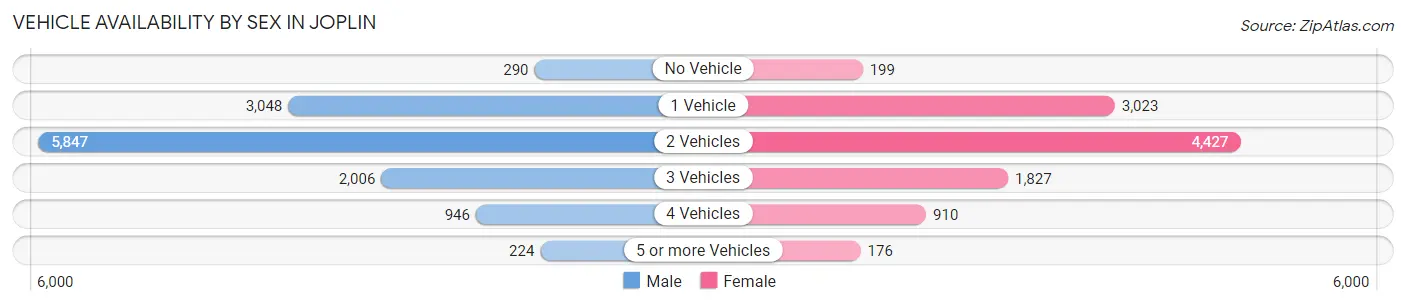
| Vehicles Available | Male | Female |
| No Vehicle | 290 (2.4%) | 199 (1.9%) |
| 1 Vehicle | 3,048 (24.7%) | 3,023 (28.6%) |
| 2 Vehicles | 5,847 (47.3%) | 4,427 (41.9%) |
| 3 Vehicles | 2,006 (16.2%) | 1,827 (17.3%) |
| 4 Vehicles | 946 (7.6%) | 910 (8.6%) |
| 5 or more Vehicles | 224 (1.8%) | 176 (1.7%) |
| Total | 12,361 (100.0%) | 10,562 (100.0%) |
Commute Time in Joplin
The most frequently occuring commute durations in Joplin are 10 to 14 minutes (5,943 commuters, 27.2%), 15 to 19 minutes (4,874 commuters, 22.3%), and 5 to 9 minutes (3,844 commuters, 17.6%).
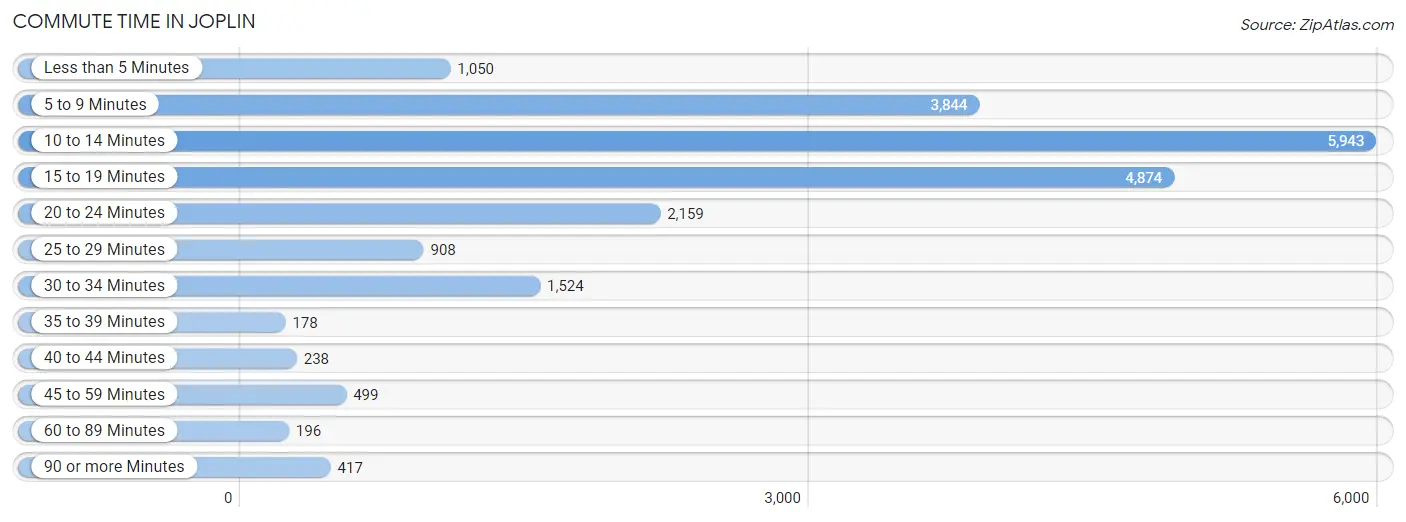
| Commute Time | # Commuters | % Commuters |
| Less than 5 Minutes | 1,050 | 4.8% |
| 5 to 9 Minutes | 3,844 | 17.6% |
| 10 to 14 Minutes | 5,943 | 27.2% |
| 15 to 19 Minutes | 4,874 | 22.3% |
| 20 to 24 Minutes | 2,159 | 9.9% |
| 25 to 29 Minutes | 908 | 4.2% |
| 30 to 34 Minutes | 1,524 | 7.0% |
| 35 to 39 Minutes | 178 | 0.8% |
| 40 to 44 Minutes | 238 | 1.1% |
| 45 to 59 Minutes | 499 | 2.3% |
| 60 to 89 Minutes | 196 | 0.9% |
| 90 or more Minutes | 417 | 1.9% |
Commute Time by Sex in Joplin
The most common commute times in Joplin are 10 to 14 minutes (2,968 commuters, 25.8%) for males and 10 to 14 minutes (2,975 commuters, 28.8%) for females.
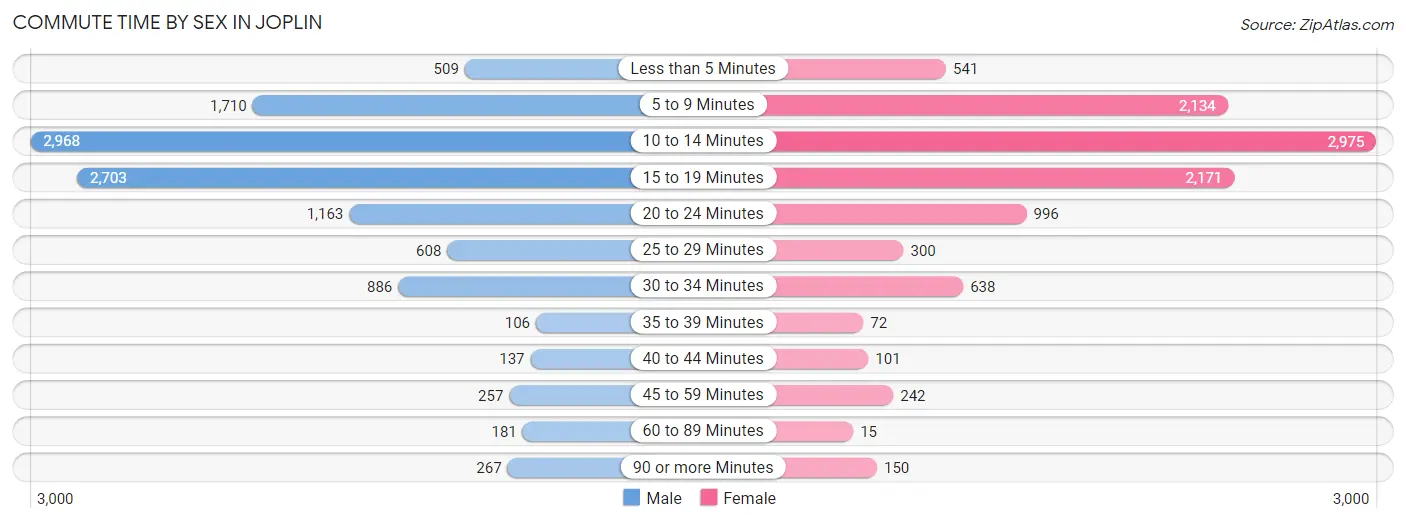
| Commute Time | Male | Female |
| Less than 5 Minutes | 509 (4.4%) | 541 (5.2%) |
| 5 to 9 Minutes | 1,710 (14.9%) | 2,134 (20.6%) |
| 10 to 14 Minutes | 2,968 (25.8%) | 2,975 (28.8%) |
| 15 to 19 Minutes | 2,703 (23.5%) | 2,171 (21.0%) |
| 20 to 24 Minutes | 1,163 (10.1%) | 996 (9.6%) |
| 25 to 29 Minutes | 608 (5.3%) | 300 (2.9%) |
| 30 to 34 Minutes | 886 (7.7%) | 638 (6.2%) |
| 35 to 39 Minutes | 106 (0.9%) | 72 (0.7%) |
| 40 to 44 Minutes | 137 (1.2%) | 101 (1.0%) |
| 45 to 59 Minutes | 257 (2.2%) | 242 (2.3%) |
| 60 to 89 Minutes | 181 (1.6%) | 15 (0.2%) |
| 90 or more Minutes | 267 (2.3%) | 150 (1.5%) |
Time of Departure to Work by Sex in Joplin
The most frequent times of departure to work in Joplin are 4:00 PM to 11:59 PM (1,514, 13.2%) for males and 7:30 AM to 7:59 AM (2,059, 19.9%) for females.
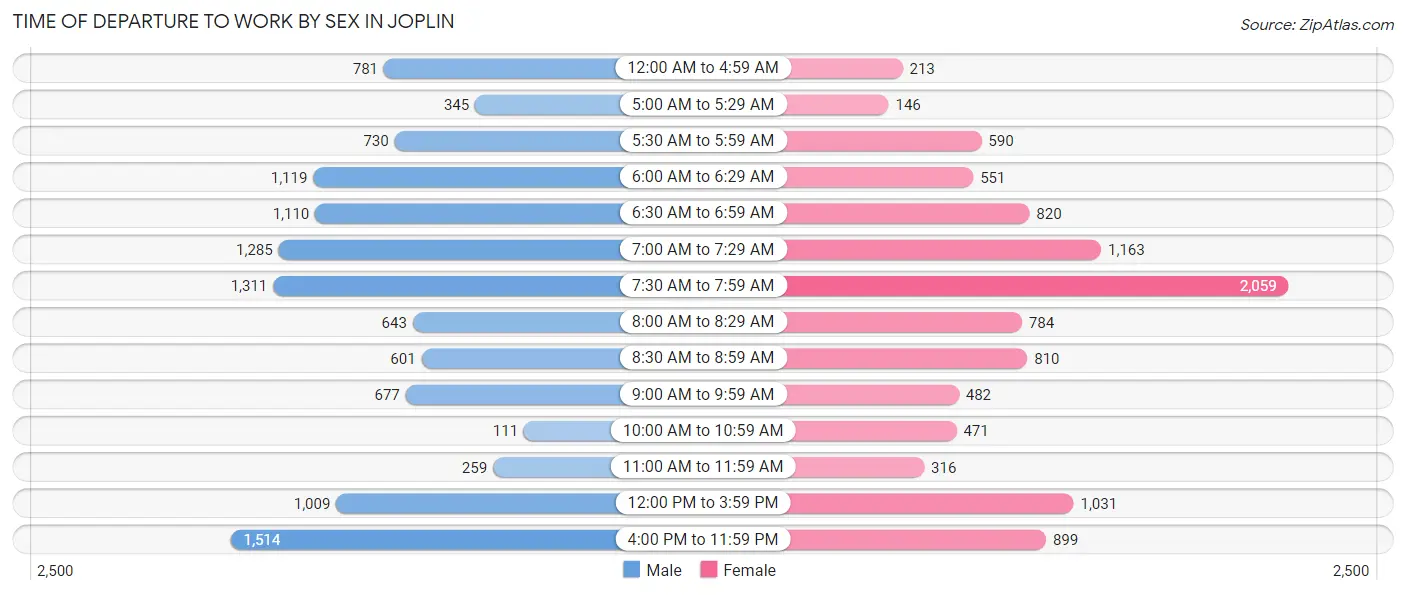
| Time of Departure | Male | Female |
| 12:00 AM to 4:59 AM | 781 (6.8%) | 213 (2.1%) |
| 5:00 AM to 5:29 AM | 345 (3.0%) | 146 (1.4%) |
| 5:30 AM to 5:59 AM | 730 (6.4%) | 590 (5.7%) |
| 6:00 AM to 6:29 AM | 1,119 (9.7%) | 551 (5.3%) |
| 6:30 AM to 6:59 AM | 1,110 (9.7%) | 820 (7.9%) |
| 7:00 AM to 7:29 AM | 1,285 (11.2%) | 1,163 (11.3%) |
| 7:30 AM to 7:59 AM | 1,311 (11.4%) | 2,059 (19.9%) |
| 8:00 AM to 8:29 AM | 643 (5.6%) | 784 (7.6%) |
| 8:30 AM to 8:59 AM | 601 (5.2%) | 810 (7.8%) |
| 9:00 AM to 9:59 AM | 677 (5.9%) | 482 (4.7%) |
| 10:00 AM to 10:59 AM | 111 (1.0%) | 471 (4.6%) |
| 11:00 AM to 11:59 AM | 259 (2.2%) | 316 (3.1%) |
| 12:00 PM to 3:59 PM | 1,009 (8.8%) | 1,031 (10.0%) |
| 4:00 PM to 11:59 PM | 1,514 (13.2%) | 899 (8.7%) |
| Total | 11,495 (100.0%) | 10,335 (100.0%) |
Housing Occupancy in Joplin
Occupancy by Ownership in Joplin
Of the total 21,274 dwellings in Joplin, owner-occupied units account for 12,245 (57.6%), while renter-occupied units make up 9,029 (42.4%).
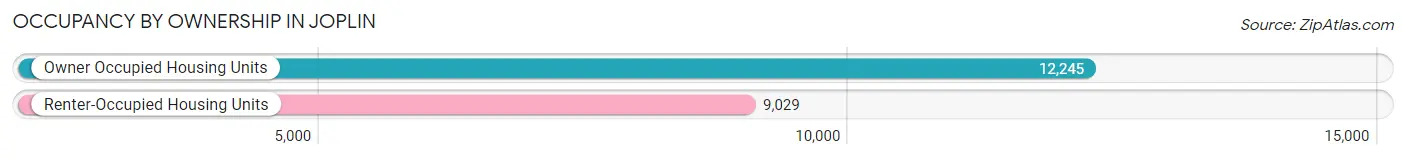
| Occupancy | # Housing Units | % Housing Units |
| Owner Occupied Housing Units | 12,245 | 57.6% |
| Renter-Occupied Housing Units | 9,029 | 42.4% |
| Total Occupied Housing Units | 21,274 | 100.0% |
Occupancy by Household Size in Joplin
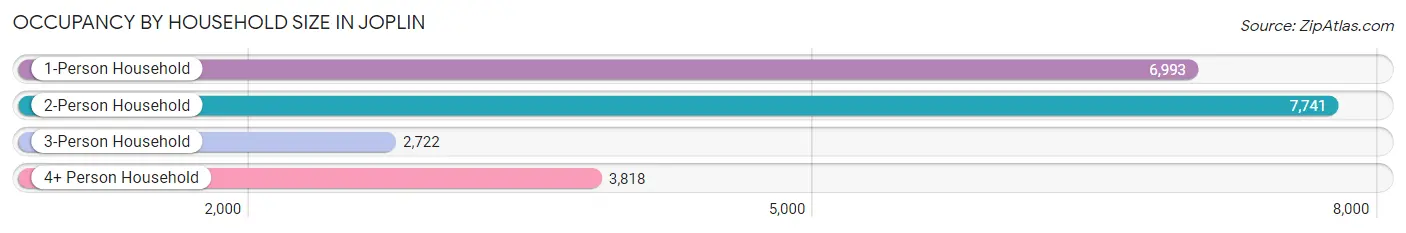
| Household Size | # Housing Units | % Housing Units |
| 1-Person Household | 6,993 | 32.9% |
| 2-Person Household | 7,741 | 36.4% |
| 3-Person Household | 2,722 | 12.8% |
| 4+ Person Household | 3,818 | 17.9% |
| Total Housing Units | 21,274 | 100.0% |
Occupancy by Ownership by Household Size in Joplin
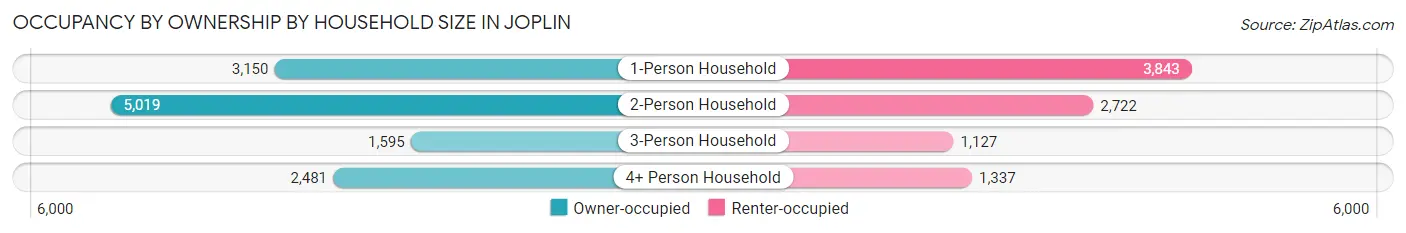
| Household Size | Owner-occupied | Renter-occupied |
| 1-Person Household | 3,150 (45.1%) | 3,843 (54.9%) |
| 2-Person Household | 5,019 (64.8%) | 2,722 (35.2%) |
| 3-Person Household | 1,595 (58.6%) | 1,127 (41.4%) |
| 4+ Person Household | 2,481 (65.0%) | 1,337 (35.0%) |
| Total Housing Units | 12,245 (57.6%) | 9,029 (42.4%) |
Occupancy by Educational Attainment in Joplin
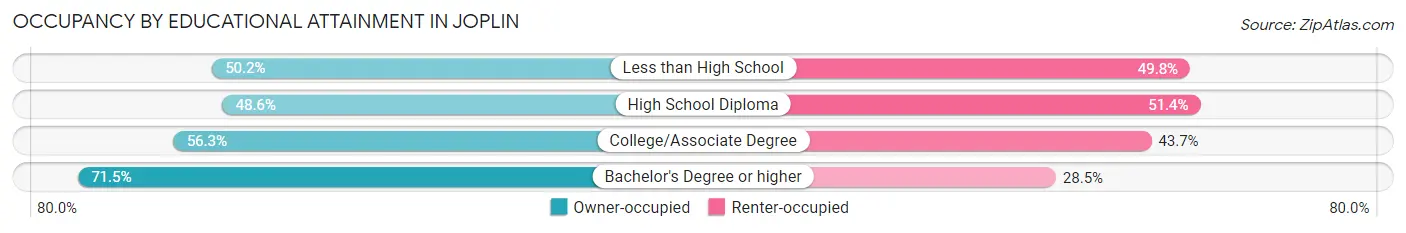
| Household Size | Owner-occupied | Renter-occupied |
| Less than High School | 925 (50.2%) | 916 (49.8%) |
| High School Diploma | 3,230 (48.6%) | 3,418 (51.4%) |
| College/Associate Degree | 3,905 (56.3%) | 3,026 (43.7%) |
| Bachelor's Degree or higher | 4,185 (71.5%) | 1,669 (28.5%) |
Occupancy by Age of Householder in Joplin
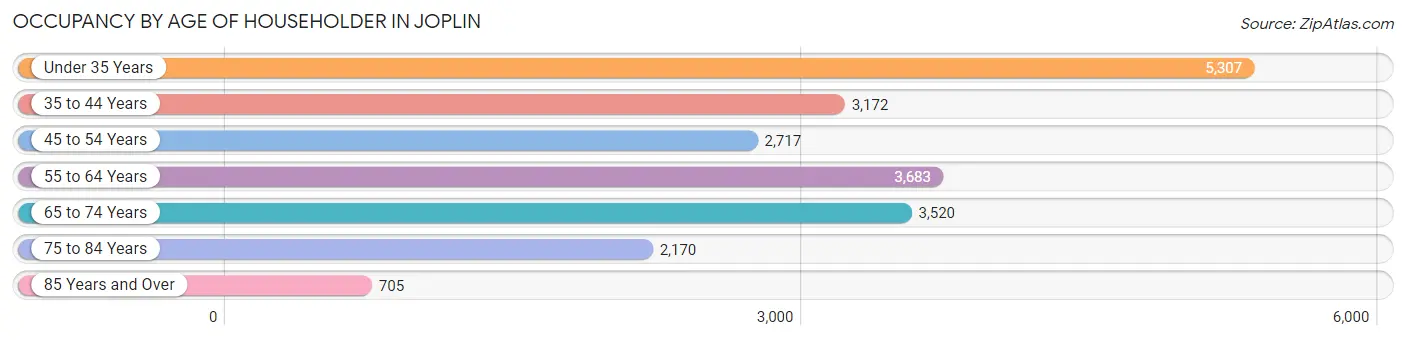
| Age Bracket | # Households | % Households |
| Under 35 Years | 5,307 | 24.9% |
| 35 to 44 Years | 3,172 | 14.9% |
| 45 to 54 Years | 2,717 | 12.8% |
| 55 to 64 Years | 3,683 | 17.3% |
| 65 to 74 Years | 3,520 | 16.6% |
| 75 to 84 Years | 2,170 | 10.2% |
| 85 Years and Over | 705 | 3.3% |
| Total | 21,274 | 100.0% |
Housing Finances in Joplin
Median Income by Occupancy in Joplin
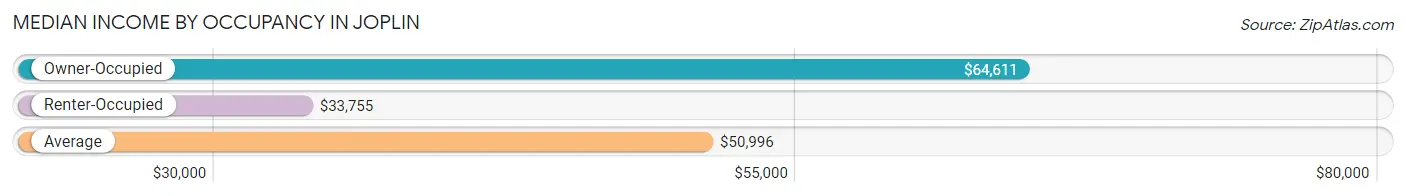
| Occupancy Type | # Households | Median Income |
| Owner-Occupied | 12,245 (57.6%) | $64,611 |
| Renter-Occupied | 9,029 (42.4%) | $33,755 |
| Average | 21,274 (100.0%) | $50,996 |
Occupancy by Householder Income Bracket in Joplin
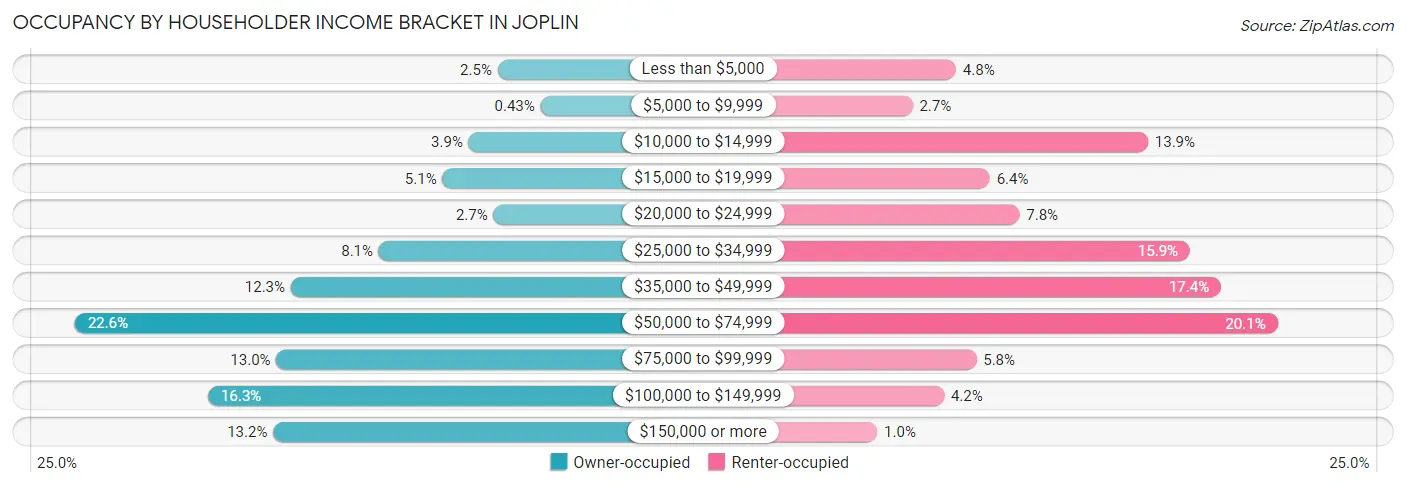
| Income Bracket | Owner-occupied | Renter-occupied |
| Less than $5,000 | 303 (2.5%) | 432 (4.8%) |
| $5,000 to $9,999 | 53 (0.4%) | 245 (2.7%) |
| $10,000 to $14,999 | 471 (3.8%) | 1,257 (13.9%) |
| $15,000 to $19,999 | 624 (5.1%) | 577 (6.4%) |
| $20,000 to $24,999 | 327 (2.7%) | 704 (7.8%) |
| $25,000 to $34,999 | 995 (8.1%) | 1,437 (15.9%) |
| $35,000 to $49,999 | 1,508 (12.3%) | 1,571 (17.4%) |
| $50,000 to $74,999 | 2,768 (22.6%) | 1,814 (20.1%) |
| $75,000 to $99,999 | 1,593 (13.0%) | 519 (5.8%) |
| $100,000 to $149,999 | 1,992 (16.3%) | 380 (4.2%) |
| $150,000 or more | 1,611 (13.2%) | 93 (1.0%) |
| Total | 12,245 (100.0%) | 9,029 (100.0%) |
Monthly Housing Cost Tiers in Joplin
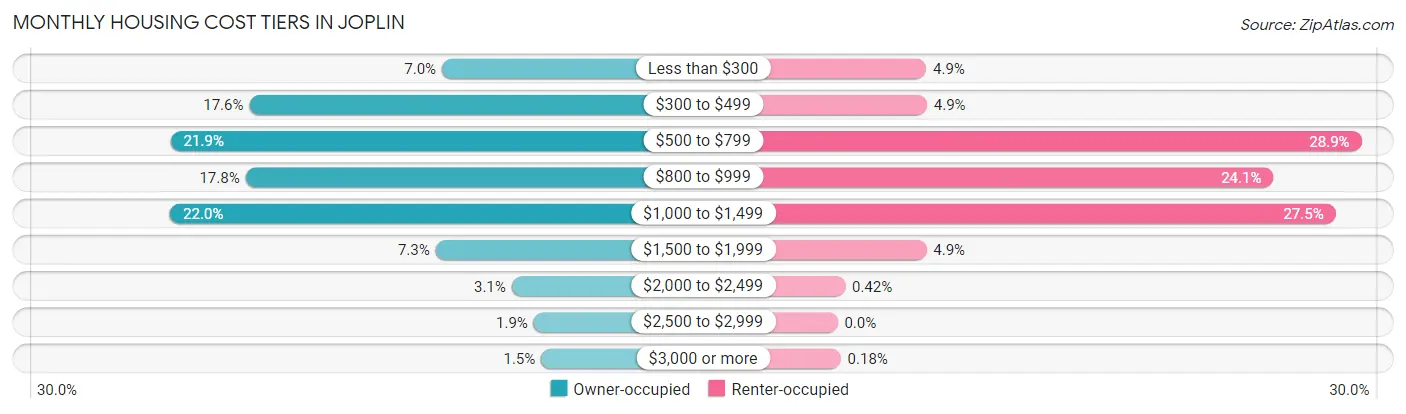
| Monthly Cost | Owner-occupied | Renter-occupied |
| Less than $300 | 851 (7.0%) | 442 (4.9%) |
| $300 to $499 | 2,154 (17.6%) | 446 (4.9%) |
| $500 to $799 | 2,687 (21.9%) | 2,613 (28.9%) |
| $800 to $999 | 2,180 (17.8%) | 2,173 (24.1%) |
| $1,000 to $1,499 | 2,689 (22.0%) | 2,484 (27.5%) |
| $1,500 to $1,999 | 894 (7.3%) | 443 (4.9%) |
| $2,000 to $2,499 | 380 (3.1%) | 38 (0.4%) |
| $2,500 to $2,999 | 230 (1.9%) | 0 (0.0%) |
| $3,000 or more | 180 (1.5%) | 16 (0.2%) |
| Total | 12,245 (100.0%) | 9,029 (100.0%) |
Physical Housing Characteristics in Joplin
Housing Structures in Joplin
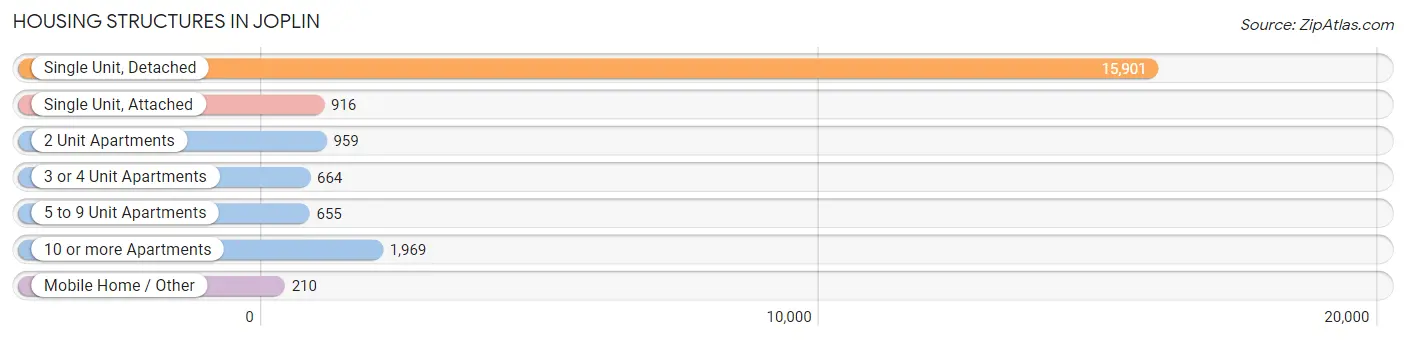
| Structure Type | # Housing Units | % Housing Units |
| Single Unit, Detached | 15,901 | 74.7% |
| Single Unit, Attached | 916 | 4.3% |
| 2 Unit Apartments | 959 | 4.5% |
| 3 or 4 Unit Apartments | 664 | 3.1% |
| 5 to 9 Unit Apartments | 655 | 3.1% |
| 10 or more Apartments | 1,969 | 9.3% |
| Mobile Home / Other | 210 | 1.0% |
| Total | 21,274 | 100.0% |
Housing Structures by Occupancy in Joplin
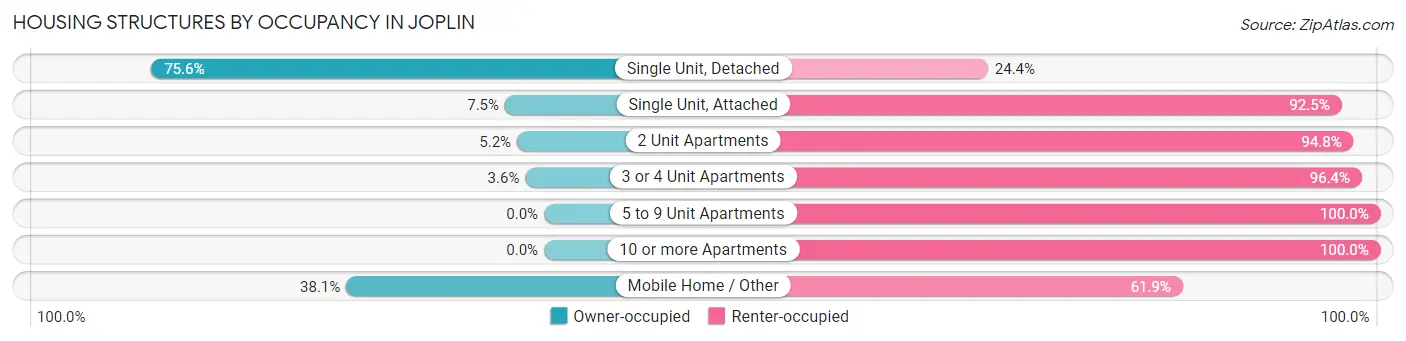
| Structure Type | Owner-occupied | Renter-occupied |
| Single Unit, Detached | 12,022 (75.6%) | 3,879 (24.4%) |
| Single Unit, Attached | 69 (7.5%) | 847 (92.5%) |
| 2 Unit Apartments | 50 (5.2%) | 909 (94.8%) |
| 3 or 4 Unit Apartments | 24 (3.6%) | 640 (96.4%) |
| 5 to 9 Unit Apartments | 0 (0.0%) | 655 (100.0%) |
| 10 or more Apartments | 0 (0.0%) | 1,969 (100.0%) |
| Mobile Home / Other | 80 (38.1%) | 130 (61.9%) |
| Total | 12,245 (57.6%) | 9,029 (42.4%) |
Housing Structures by Number of Rooms in Joplin
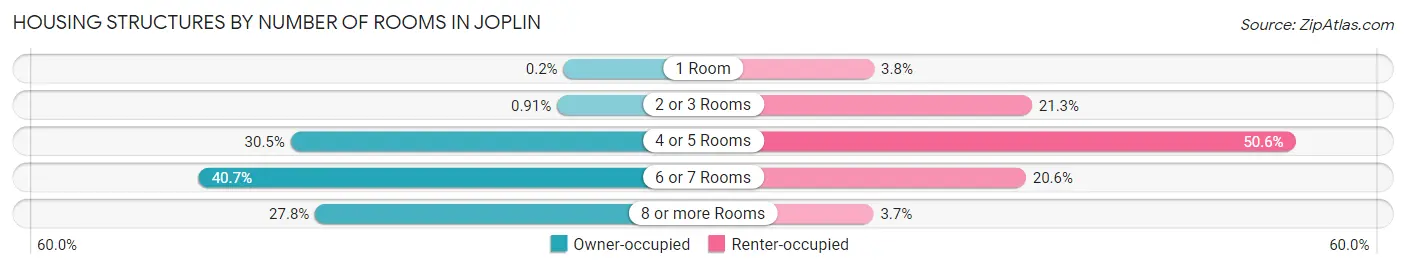
| Number of Rooms | Owner-occupied | Renter-occupied |
| 1 Room | 24 (0.2%) | 343 (3.8%) |
| 2 or 3 Rooms | 111 (0.9%) | 1,923 (21.3%) |
| 4 or 5 Rooms | 3,732 (30.5%) | 4,564 (50.5%) |
| 6 or 7 Rooms | 4,980 (40.7%) | 1,863 (20.6%) |
| 8 or more Rooms | 3,398 (27.8%) | 336 (3.7%) |
| Total | 12,245 (100.0%) | 9,029 (100.0%) |
Housing Structure by Heating Type in Joplin
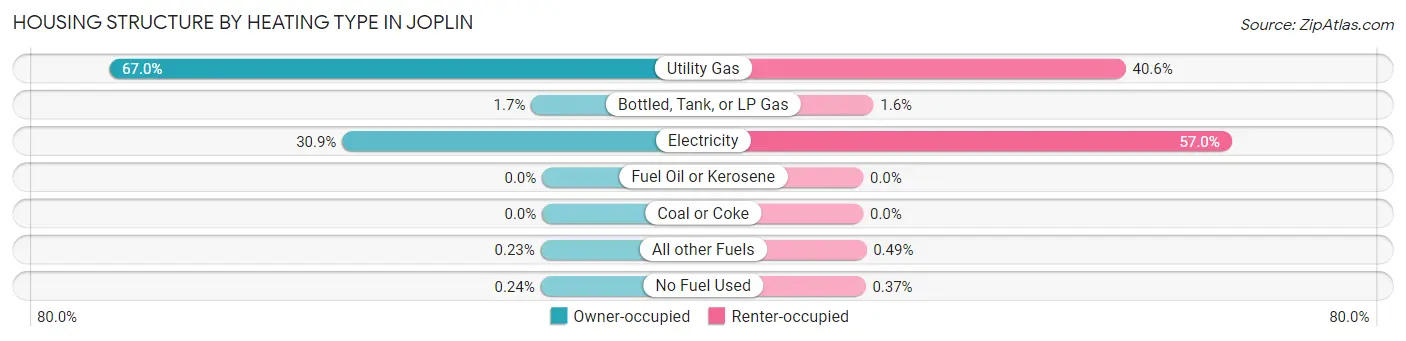
| Heating Type | Owner-occupied | Renter-occupied |
| Utility Gas | 8,198 (66.9%) | 3,664 (40.6%) |
| Bottled, Tank, or LP Gas | 206 (1.7%) | 144 (1.6%) |
| Electricity | 3,784 (30.9%) | 5,144 (57.0%) |
| Fuel Oil or Kerosene | 0 (0.0%) | 0 (0.0%) |
| Coal or Coke | 0 (0.0%) | 0 (0.0%) |
| All other Fuels | 28 (0.2%) | 44 (0.5%) |
| No Fuel Used | 29 (0.2%) | 33 (0.4%) |
| Total | 12,245 (100.0%) | 9,029 (100.0%) |
Household Vehicle Usage in Joplin
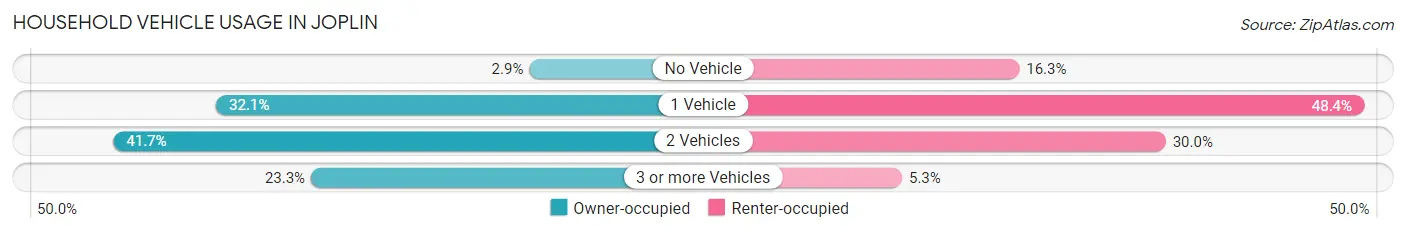
| Vehicles per Household | Owner-occupied | Renter-occupied |
| No Vehicle | 354 (2.9%) | 1,470 (16.3%) |
| 1 Vehicle | 3,933 (32.1%) | 4,374 (48.4%) |
| 2 Vehicles | 5,108 (41.7%) | 2,704 (29.9%) |
| 3 or more Vehicles | 2,850 (23.3%) | 481 (5.3%) |
| Total | 12,245 (100.0%) | 9,029 (100.0%) |
Real Estate & Mortgages in Joplin
Real Estate and Mortgage Overview in Joplin
| Characteristic | Without Mortgage | With Mortgage |
| Housing Units | 5,105 | 7,140 |
| Median Property Value | $142,500 | $148,400 |
| Median Household Income | $47,978 | $1,099 |
| Monthly Housing Costs | $462 | $168 |
| Real Estate Taxes | $1,014 | $140 |
Property Value by Mortgage Status in Joplin
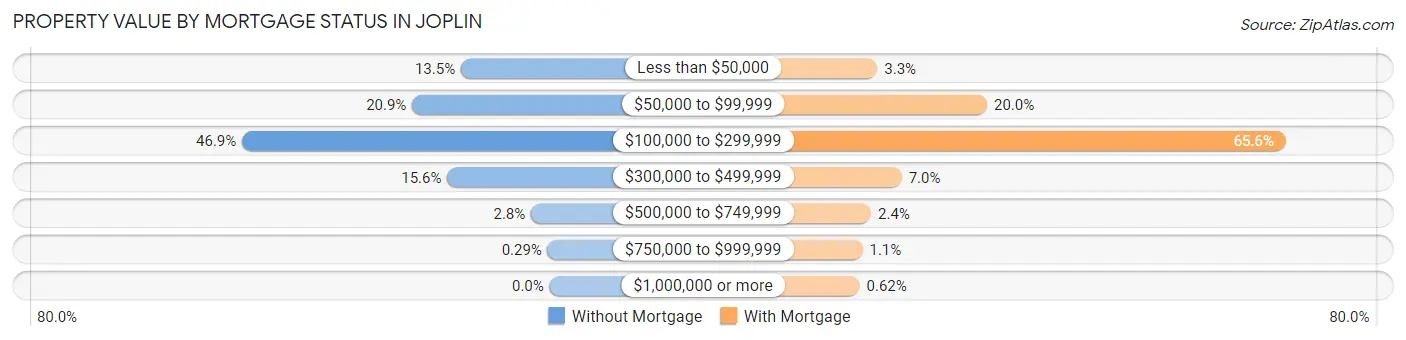
| Property Value | Without Mortgage | With Mortgage |
| Less than $50,000 | 689 (13.5%) | 237 (3.3%) |
| $50,000 to $99,999 | 1,069 (20.9%) | 1,431 (20.0%) |
| $100,000 to $299,999 | 2,392 (46.9%) | 4,680 (65.5%) |
| $300,000 to $499,999 | 796 (15.6%) | 503 (7.0%) |
| $500,000 to $749,999 | 144 (2.8%) | 169 (2.4%) |
| $750,000 to $999,999 | 15 (0.3%) | 76 (1.1%) |
| $1,000,000 or more | 0 (0.0%) | 44 (0.6%) |
| Total | 5,105 (100.0%) | 7,140 (100.0%) |
Household Income by Mortgage Status in Joplin
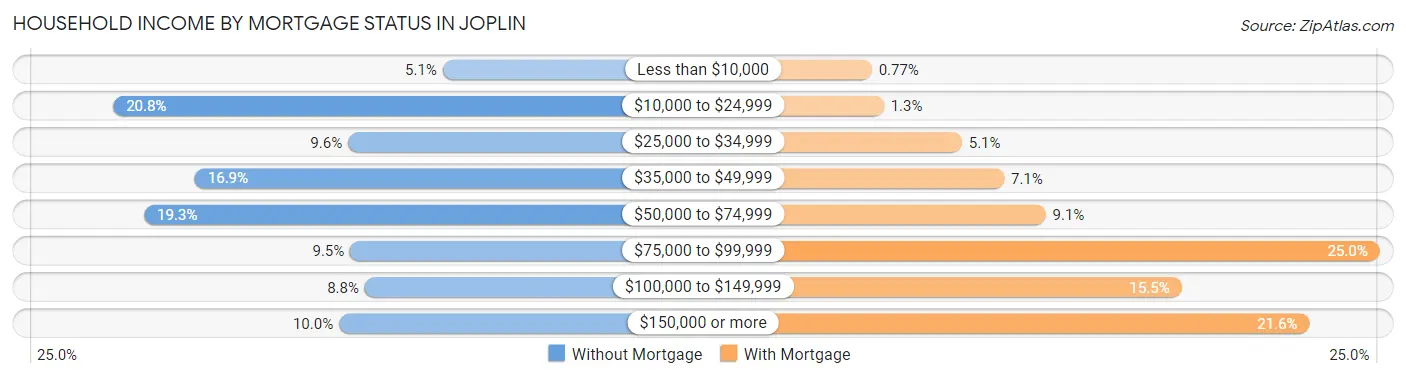
| Household Income | Without Mortgage | With Mortgage |
| Less than $10,000 | 260 (5.1%) | 55 (0.8%) |
| $10,000 to $24,999 | 1,061 (20.8%) | 96 (1.3%) |
| $25,000 to $34,999 | 490 (9.6%) | 361 (5.1%) |
| $35,000 to $49,999 | 862 (16.9%) | 505 (7.1%) |
| $50,000 to $74,999 | 986 (19.3%) | 646 (9.0%) |
| $75,000 to $99,999 | 485 (9.5%) | 1,782 (25.0%) |
| $100,000 to $149,999 | 449 (8.8%) | 1,108 (15.5%) |
| $150,000 or more | 512 (10.0%) | 1,543 (21.6%) |
| Total | 5,105 (100.0%) | 7,140 (100.0%) |
Property Value to Household Income Ratio in Joplin
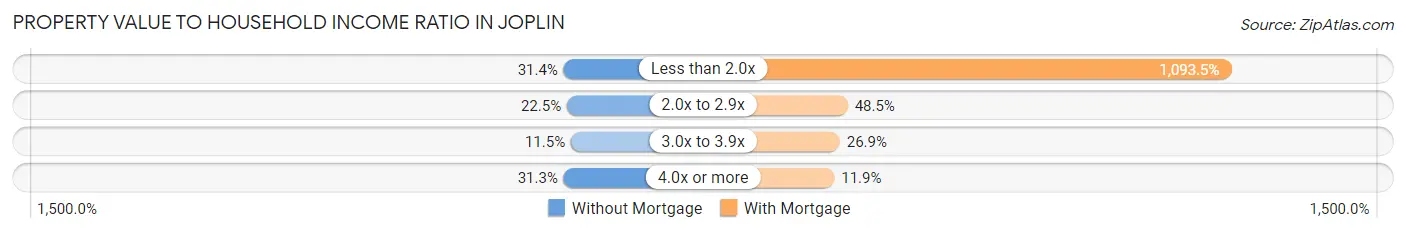
| Value-to-Income Ratio | Without Mortgage | With Mortgage |
| Less than 2.0x | 1,605 (31.4%) | 78,078 (1,093.5%) |
| 2.0x to 2.9x | 1,147 (22.5%) | 3,460 (48.5%) |
| 3.0x to 3.9x | 589 (11.5%) | 1,917 (26.9%) |
| 4.0x or more | 1,596 (31.3%) | 848 (11.9%) |
| Total | 5,105 (100.0%) | 7,140 (100.0%) |
Real Estate Taxes by Mortgage Status in Joplin
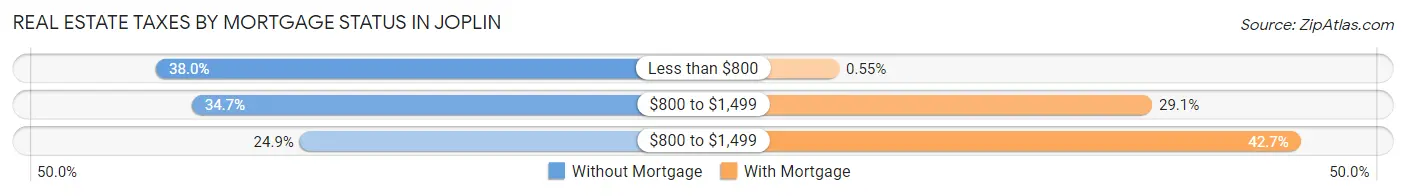
| Property Taxes | Without Mortgage | With Mortgage |
| Less than $800 | 1,939 (38.0%) | 39 (0.5%) |
| $800 to $1,499 | 1,773 (34.7%) | 2,080 (29.1%) |
| $800 to $1,499 | 1,270 (24.9%) | 3,048 (42.7%) |
| Total | 5,105 (100.0%) | 7,140 (100.0%) |
Health & Disability in Joplin
Health Insurance Coverage by Age in Joplin
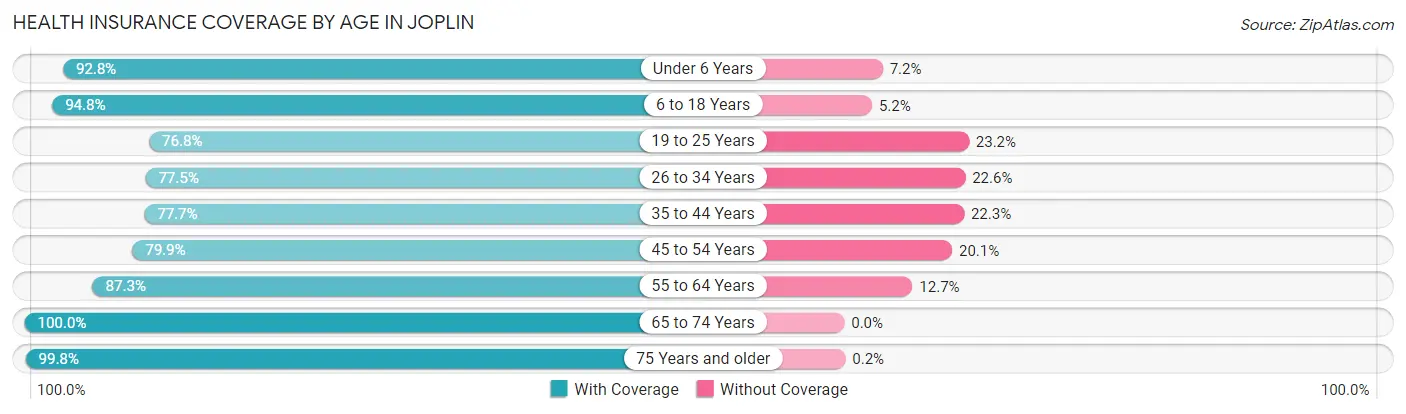
| Age Bracket | With Coverage | Without Coverage |
| Under 6 Years | 3,749 (92.8%) | 289 (7.2%) |
| 6 to 18 Years | 7,738 (94.8%) | 421 (5.2%) |
| 19 to 25 Years | 4,644 (76.8%) | 1,405 (23.2%) |
| 26 to 34 Years | 5,158 (77.4%) | 1,502 (22.6%) |
| 35 to 44 Years | 4,602 (77.7%) | 1,322 (22.3%) |
| 45 to 54 Years | 4,213 (79.9%) | 1,059 (20.1%) |
| 55 to 64 Years | 5,170 (87.3%) | 752 (12.7%) |
| 65 to 74 Years | 5,375 (100.0%) | 0 (0.0%) |
| 75 Years and older | 3,929 (99.8%) | 8 (0.2%) |
| Total | 44,578 (86.8%) | 6,758 (13.2%) |
Health Insurance Coverage by Citizenship Status in Joplin
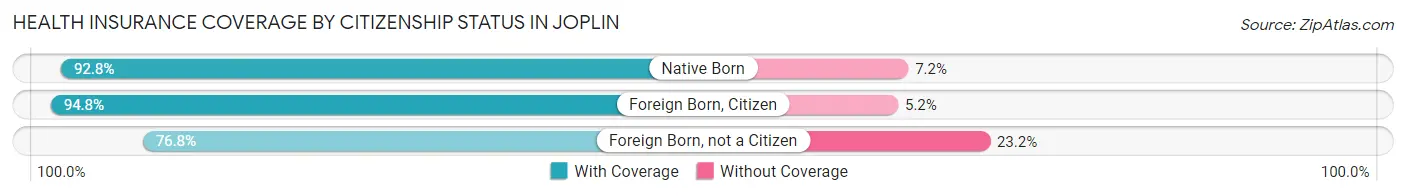
| Citizenship Status | With Coverage | Without Coverage |
| Native Born | 3,749 (92.8%) | 289 (7.2%) |
| Foreign Born, Citizen | 7,738 (94.8%) | 421 (5.2%) |
| Foreign Born, not a Citizen | 4,644 (76.8%) | 1,405 (23.2%) |
Health Insurance Coverage by Household Income in Joplin
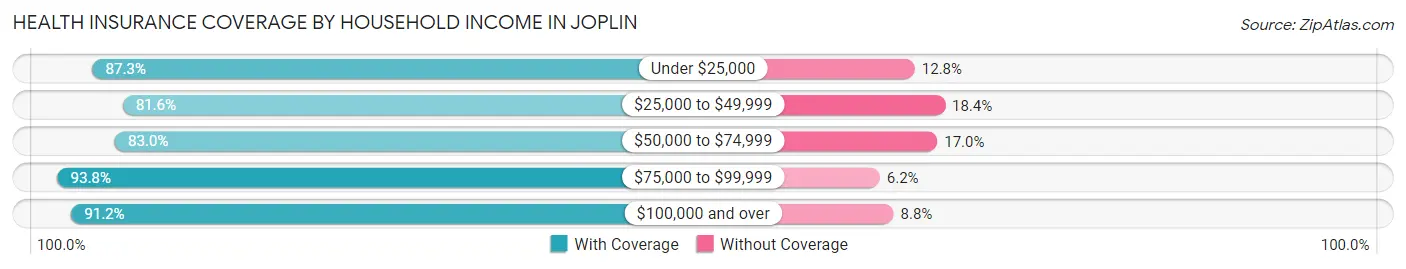
| Household Income | With Coverage | Without Coverage |
| Under $25,000 | 6,926 (87.3%) | 1,012 (12.8%) |
| $25,000 to $49,999 | 10,156 (81.6%) | 2,290 (18.4%) |
| $50,000 to $74,999 | 9,007 (83.0%) | 1,839 (17.0%) |
| $75,000 to $99,999 | 5,605 (93.8%) | 370 (6.2%) |
| $100,000 and over | 11,697 (91.2%) | 1,124 (8.8%) |
Public vs Private Health Insurance Coverage by Age in Joplin
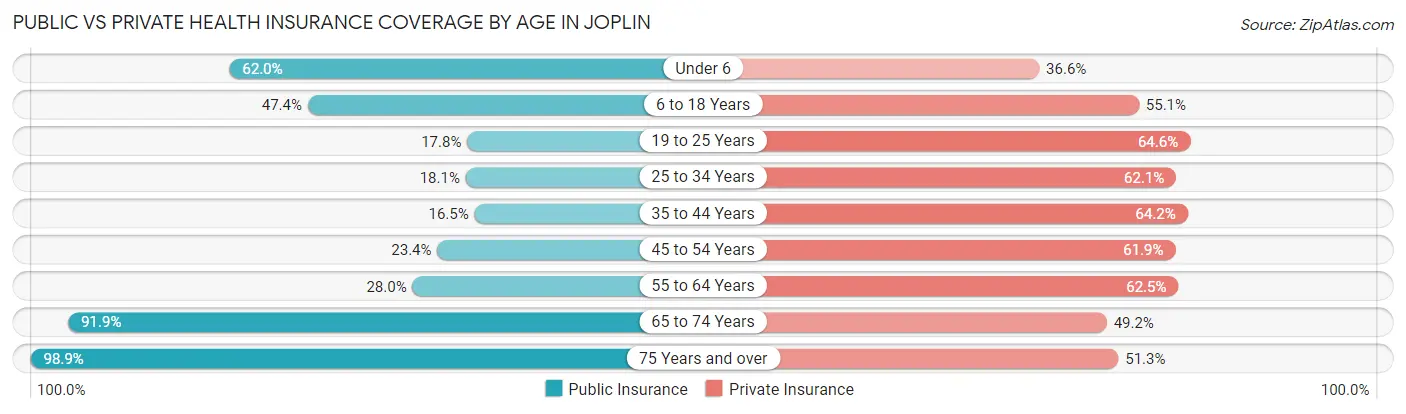
| Age Bracket | Public Insurance | Private Insurance |
| Under 6 | 2,503 (62.0%) | 1,479 (36.6%) |
| 6 to 18 Years | 3,871 (47.4%) | 4,499 (55.1%) |
| 19 to 25 Years | 1,079 (17.8%) | 3,909 (64.6%) |
| 25 to 34 Years | 1,207 (18.1%) | 4,133 (62.1%) |
| 35 to 44 Years | 976 (16.5%) | 3,802 (64.2%) |
| 45 to 54 Years | 1,233 (23.4%) | 3,263 (61.9%) |
| 55 to 64 Years | 1,658 (28.0%) | 3,699 (62.5%) |
| 65 to 74 Years | 4,942 (91.9%) | 2,643 (49.2%) |
| 75 Years and over | 3,894 (98.9%) | 2,021 (51.3%) |
| Total | 21,363 (41.6%) | 29,448 (57.4%) |
Disability Status by Sex by Age in Joplin
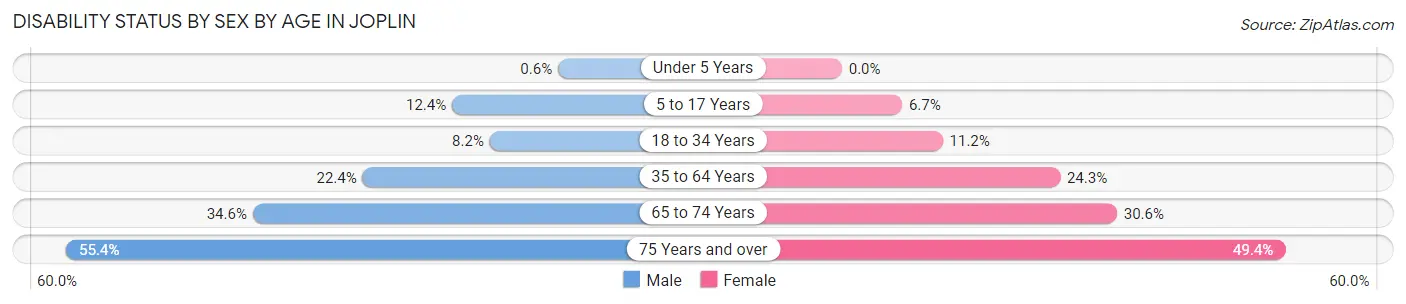
| Age Bracket | Male | Female |
| Under 5 Years | 11 (0.6%) | 0 (0.0%) |
| 5 to 17 Years | 491 (12.4%) | 285 (6.7%) |
| 18 to 34 Years | 565 (8.2%) | 741 (11.2%) |
| 35 to 64 Years | 1,968 (22.4%) | 2,021 (24.3%) |
| 65 to 74 Years | 800 (34.6%) | 938 (30.6%) |
| 75 Years and over | 896 (55.4%) | 1,145 (49.4%) |
Disability Class by Sex by Age in Joplin
Disability Class: Hearing Difficulty
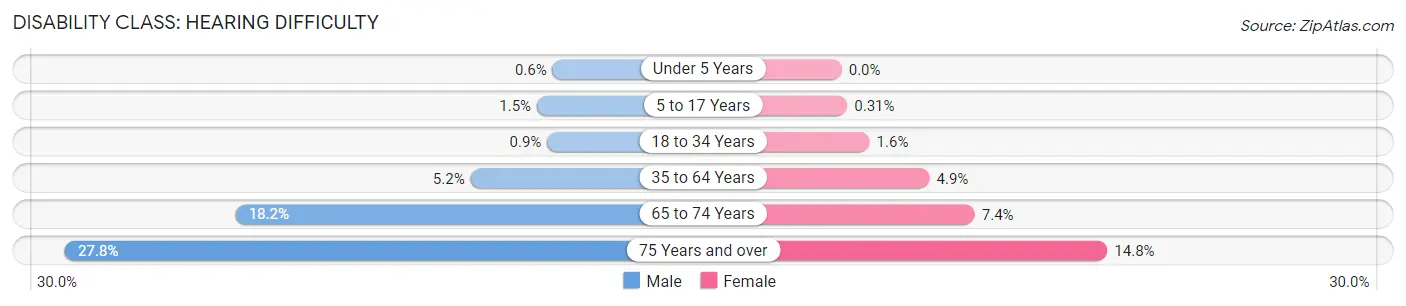
| Age Bracket | Male | Female |
| Under 5 Years | 11 (0.6%) | 0 (0.0%) |
| 5 to 17 Years | 58 (1.5%) | 13 (0.3%) |
| 18 to 34 Years | 62 (0.9%) | 102 (1.5%) |
| 35 to 64 Years | 455 (5.2%) | 407 (4.9%) |
| 65 to 74 Years | 422 (18.2%) | 227 (7.4%) |
| 75 Years and over | 449 (27.8%) | 343 (14.8%) |
Disability Class: Vision Difficulty
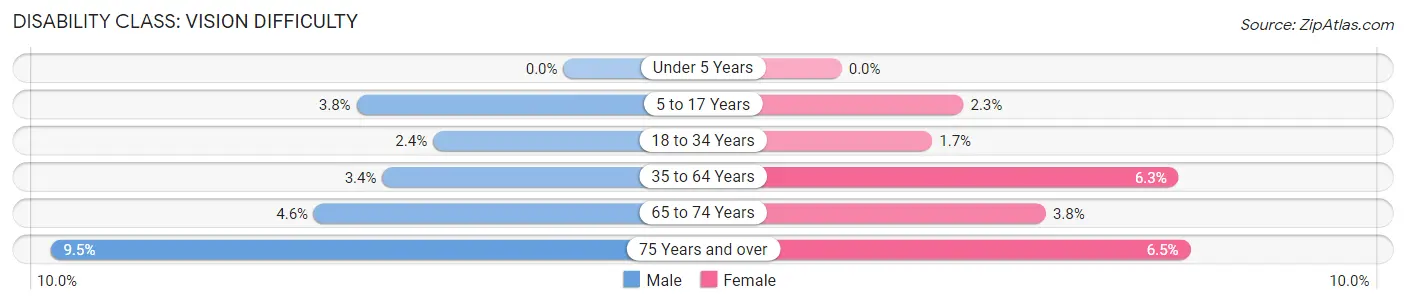
| Age Bracket | Male | Female |
| Under 5 Years | 0 (0.0%) | 0 (0.0%) |
| 5 to 17 Years | 152 (3.8%) | 96 (2.3%) |
| 18 to 34 Years | 167 (2.4%) | 111 (1.7%) |
| 35 to 64 Years | 296 (3.4%) | 520 (6.2%) |
| 65 to 74 Years | 107 (4.6%) | 116 (3.8%) |
| 75 Years and over | 154 (9.5%) | 150 (6.5%) |
Disability Class: Cognitive Difficulty
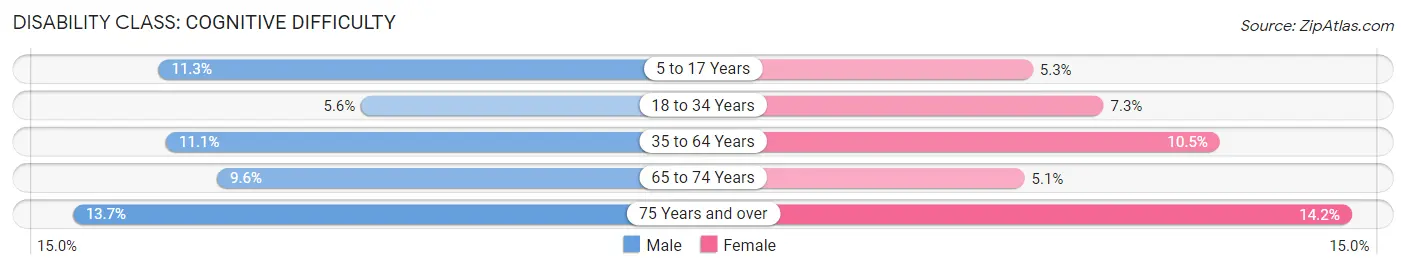
| Age Bracket | Male | Female |
| 5 to 17 Years | 446 (11.3%) | 226 (5.3%) |
| 18 to 34 Years | 388 (5.6%) | 481 (7.3%) |
| 35 to 64 Years | 973 (11.1%) | 875 (10.5%) |
| 65 to 74 Years | 223 (9.6%) | 156 (5.1%) |
| 75 Years and over | 221 (13.7%) | 329 (14.2%) |
Disability Class: Ambulatory Difficulty
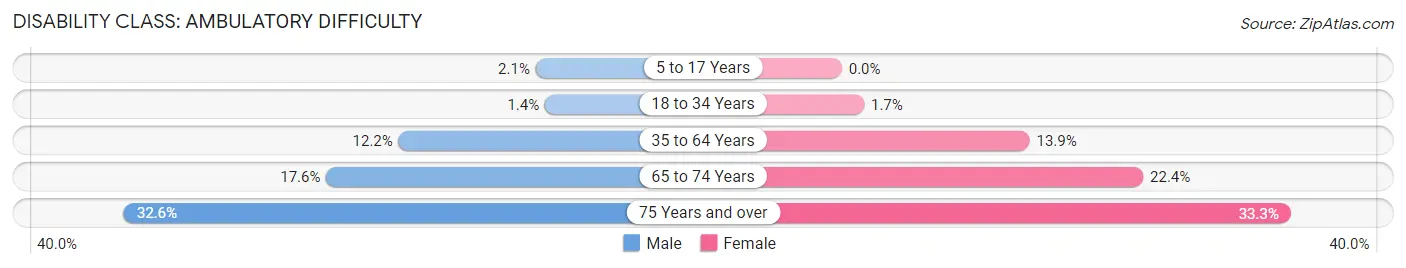
| Age Bracket | Male | Female |
| 5 to 17 Years | 81 (2.1%) | 0 (0.0%) |
| 18 to 34 Years | 94 (1.4%) | 109 (1.7%) |
| 35 to 64 Years | 1,076 (12.2%) | 1,159 (13.9%) |
| 65 to 74 Years | 407 (17.6%) | 685 (22.4%) |
| 75 Years and over | 528 (32.6%) | 773 (33.3%) |
Disability Class: Self-Care Difficulty
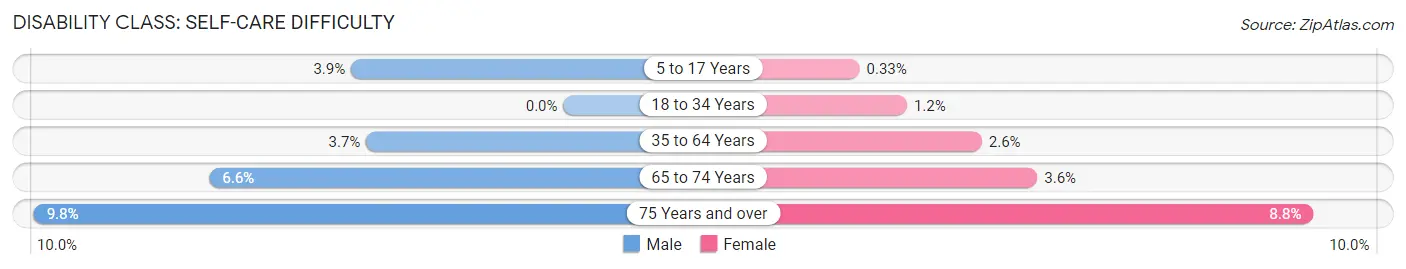
| Age Bracket | Male | Female |
| 5 to 17 Years | 156 (3.9%) | 14 (0.3%) |
| 18 to 34 Years | 0 (0.0%) | 80 (1.2%) |
| 35 to 64 Years | 322 (3.7%) | 216 (2.6%) |
| 65 to 74 Years | 152 (6.6%) | 111 (3.6%) |
| 75 Years and over | 159 (9.8%) | 203 (8.7%) |
Technology Access in Joplin
Computing Device Access in Joplin
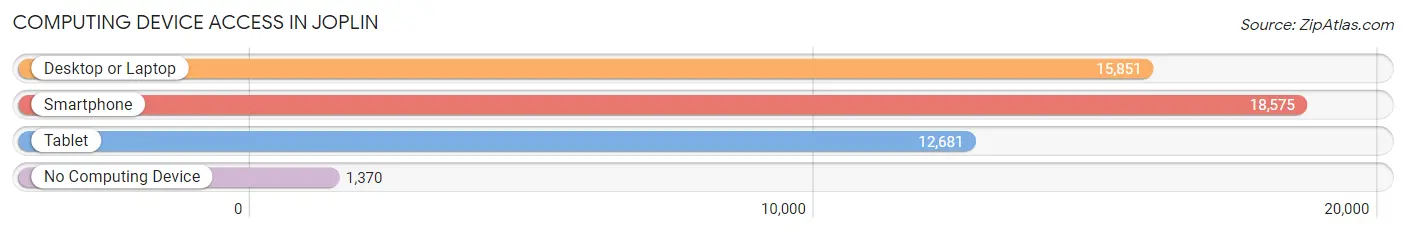
| Device Type | # Households | % Households |
| Desktop or Laptop | 15,851 | 74.5% |
| Smartphone | 18,575 | 87.3% |
| Tablet | 12,681 | 59.6% |
| No Computing Device | 1,370 | 6.4% |
| Total | 21,274 | 100.0% |
Internet Access in Joplin
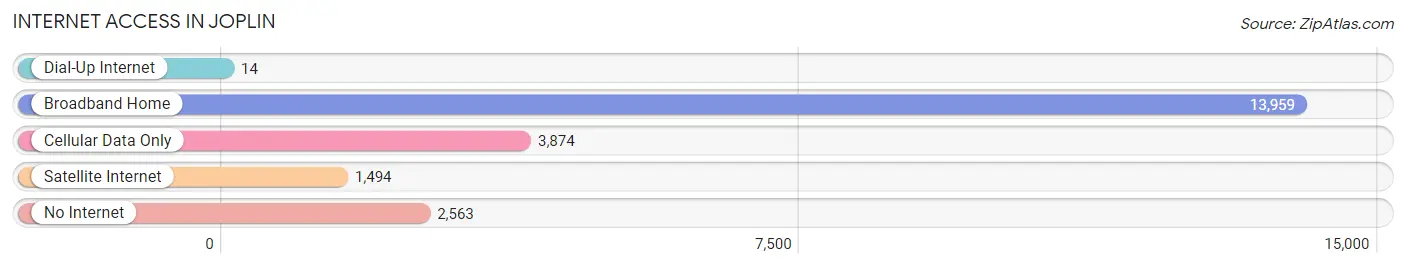
| Internet Type | # Households | % Households |
| Dial-Up Internet | 14 | 0.1% |
| Broadband Home | 13,959 | 65.6% |
| Cellular Data Only | 3,874 | 18.2% |
| Satellite Internet | 1,494 | 7.0% |
| No Internet | 2,563 | 12.0% |
| Total | 21,274 | 100.0% |
Joplin Summary
Joplin, Missouri is a city located in the southwestern corner of the state, in Jasper and Newton counties. It is the largest city in the four-county metropolitan area of Southwest Missouri, and the 14th largest city in the state. Joplin is known for its rich history, diverse geography, vibrant economy, and diverse demographics.
History
Joplin was founded in 1873 by John C. Cox, a former Confederate soldier. The city was named after the Reverend Harris Joplin, a Methodist minister who had served in the area. The city was incorporated in 1881 and quickly became a major center for lead and zinc mining. By the early 1900s, Joplin was the world’s largest producer of lead and zinc. The city was also home to a thriving African American community, which included a number of churches, businesses, and schools.
In the 1920s, Joplin experienced a period of rapid growth and development. The city was home to a number of large businesses, including the Joplin Globe newspaper, the Joplin Stockyards, and the Joplin Mining Company. The city also became a major center for the arts, with a number of theaters, galleries, and music venues.
In the 1950s, Joplin experienced a period of decline as the mining industry began to decline. The city’s population decreased from a peak of over 50,000 in 1950 to just over 30,000 in 2000. Despite this decline, Joplin has remained an important economic and cultural center in the region.
Geography
Joplin is located in the southwestern corner of Missouri, in Jasper and Newton counties. The city is situated on the Ozark Plateau, which is characterized by rolling hills and valleys. The city is located at the intersection of Interstate 44 and US Route 71.
The city is divided into four distinct geographic regions: the East Side, the West Side, the North Side, and the South Side. The East Side is the most developed area of the city, with a number of businesses, restaurants, and shopping centers. The West Side is the most residential area of the city, with a number of neighborhoods and parks. The North Side is the least developed area of the city, with a number of industrial sites and warehouses. The South Side is the most rural area of the city, with a number of farms and rural communities.
Economy
Joplin’s economy is largely based on manufacturing, healthcare, and retail. The city is home to a number of large manufacturing companies, including Leggett & Platt, Inc., EaglePicher Technologies, and Joplin Industries. The city is also home to a number of healthcare facilities, including Freeman Health System and Mercy Hospital Joplin. The city is also home to a number of retail stores, including Walmart, Target, and Kohl’s.
Joplin is also home to a number of educational institutions, including Missouri Southern State University, Ozark Christian College, and Crowder College. The city is also home to a number of cultural attractions, including the Joplin Museum Complex, the Joplin Little Theatre, and the Joplin Arts Center.
Demographics
As of the 2010 census, Joplin had a population of 50,150. The city is racially and ethnically diverse, with a population that is 54.3% White, 33.2% African American, 4.2% Hispanic or Latino, 2.2% Asian, and 0.7% Native American. The city is also home to a number of religious groups, including Christians (63.2%), non-religious (19.2%), and other religions (17.6%).
Joplin is also home to a number of immigrants, with a population that is 5.2% foreign-born. The city is also home to a number of LGBT individuals, with a population that is 4.2% LGBT. The median household income in Joplin is $37,845, and the median home value is $97,400.
Conclusion
Joplin, Missouri is a city with a rich history, diverse geography, vibrant economy, and diverse demographics. The city is home to a number of large businesses, healthcare facilities, educational institutions, and cultural attractions. The city is also home to a number of immigrants, LGBT individuals, and religious groups. Joplin is an important economic and cultural center in the region, and is an important part of the state of Missouri.
Common Questions
What is Per Capita Income in Joplin?
Per Capita income in Joplin is $29,295.
What is the Median Family Income in Joplin?
Median Family Income in Joplin is $61,782.
What is the Median Household income in Joplin?
Median Household Income in Joplin is $50,996.
What is Income or Wage Gap in Joplin?
Income or Wage Gap in Joplin is 28.6%.
Women in Joplin earn 71.4 cents for every dollar earned by a man.
What is Family Income Deficit in Joplin?
Family Income Deficit in Joplin is $9,251.
Families that are below poverty line in Joplin earn $9,251 less on average than the poverty threshold level.
What is Inequality or Gini Index in Joplin?
Inequality or Gini Index in Joplin is 0.48.
What is the Total Population of Joplin?
Total Population of Joplin is 51,848.
What is the Total Male Population of Joplin?
Total Male Population of Joplin is 25,630.
What is the Total Female Population of Joplin?
Total Female Population of Joplin is 26,218.
What is the Ratio of Males per 100 Females in Joplin?
There are 97.76 Males per 100 Females in Joplin.
What is the Ratio of Females per 100 Males in Joplin?
There are 102.29 Females per 100 Males in Joplin.
What is the Median Population Age in Joplin?
Median Population Age in Joplin is 36.4 Years.
What is the Average Family Size in Joplin
Average Family Size in Joplin is 3.0 People.
What is the Average Household Size in Joplin
Average Household Size in Joplin is 2.4 People.
How Large is the Labor Force in Joplin?
There are 25,526 People in the Labor Forcein in Joplin.
What is the Percentage of People in the Labor Force in Joplin?
61.4% of People are in the Labor Force in Joplin.
What is the Unemployment Rate in Joplin?
Unemployment Rate in Joplin is 4.9%.