Velda Village Hills, MO Map & Demographics
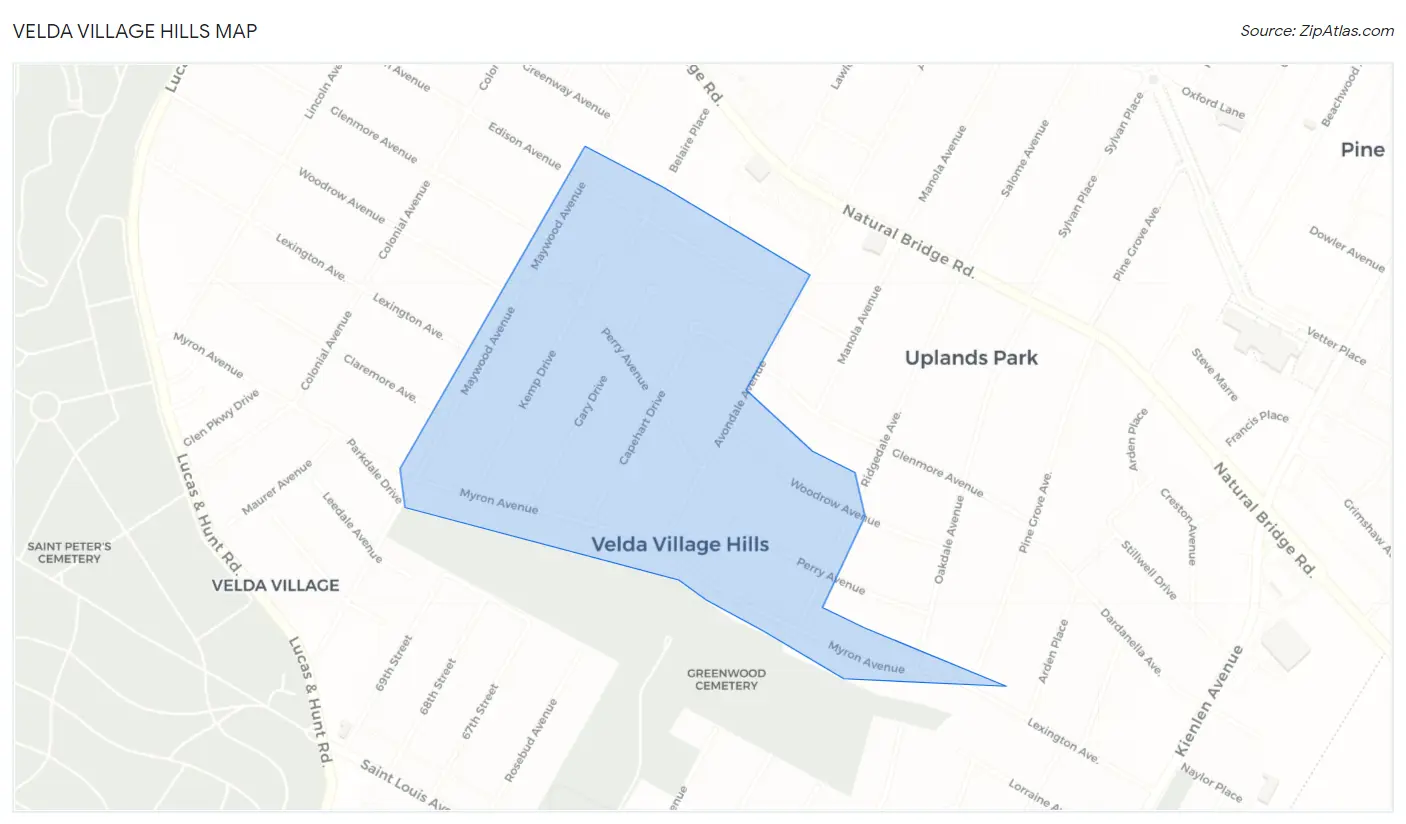
Velda Village Hills Map
Velda Village Hills Overview
$21,089
PER CAPITA INCOME
$44,063
AVG FAMILY INCOME
$39,444
AVG HOUSEHOLD INCOME
30.7%
WAGE / INCOME GAP [ % ]
69.3¢/ $1
WAGE / INCOME GAP [ $ ]
0.29
INEQUALITY / GINI INDEX
849
TOTAL POPULATION
344
MALE POPULATION
505
FEMALE POPULATION
68.12
MALES / 100 FEMALES
146.80
FEMALES / 100 MALES
47.4
MEDIAN AGE
2.6
AVG FAMILY SIZE
2.3
AVG HOUSEHOLD SIZE
393
LABOR FORCE [ PEOPLE ]
57.3%
PERCENT IN LABOR FORCE
16.5%
UNEMPLOYMENT RATE
Income in Velda Village Hills
Income Overview in Velda Village Hills
Per Capita Income in Velda Village Hills is $21,089, while median incomes of families and households are $44,063 and $39,444 respectively.
| Characteristic | Number | Measure |
| Per Capita Income | 849 | $21,089 |
| Median Family Income | 291 | $44,063 |
| Mean Family Income | 291 | $49,743 |
| Median Household Income | 372 | $39,444 |
| Mean Household Income | 372 | $47,676 |
| Income Deficit | 291 | $0 |
| Wage / Income Gap (%) | 849 | 30.72% |
| Wage / Income Gap ($) | 849 | 69.28¢ per $1 |
| Gini / Inequality Index | 849 | 0.29 |
Earnings by Sex in Velda Village Hills
Average Earnings in Velda Village Hills are $30,385, $21,836 for men and $31,519 for women, a difference of 30.7%.
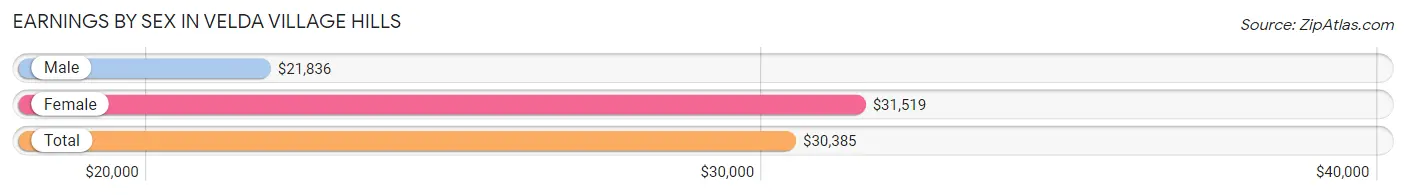
| Sex | Number | Average Earnings |
| Male | 117 (29.2%) | $21,836 |
| Female | 283 (70.8%) | $31,519 |
| Total | 400 (100.0%) | $30,385 |
Earnings by Sex by Income Bracket in Velda Village Hills
The most common earnings brackets in Velda Village Hills are $20,000 to $22,499 for men (32 | 27.4%) and $30,000 to $34,999 for women (117 | 41.3%).
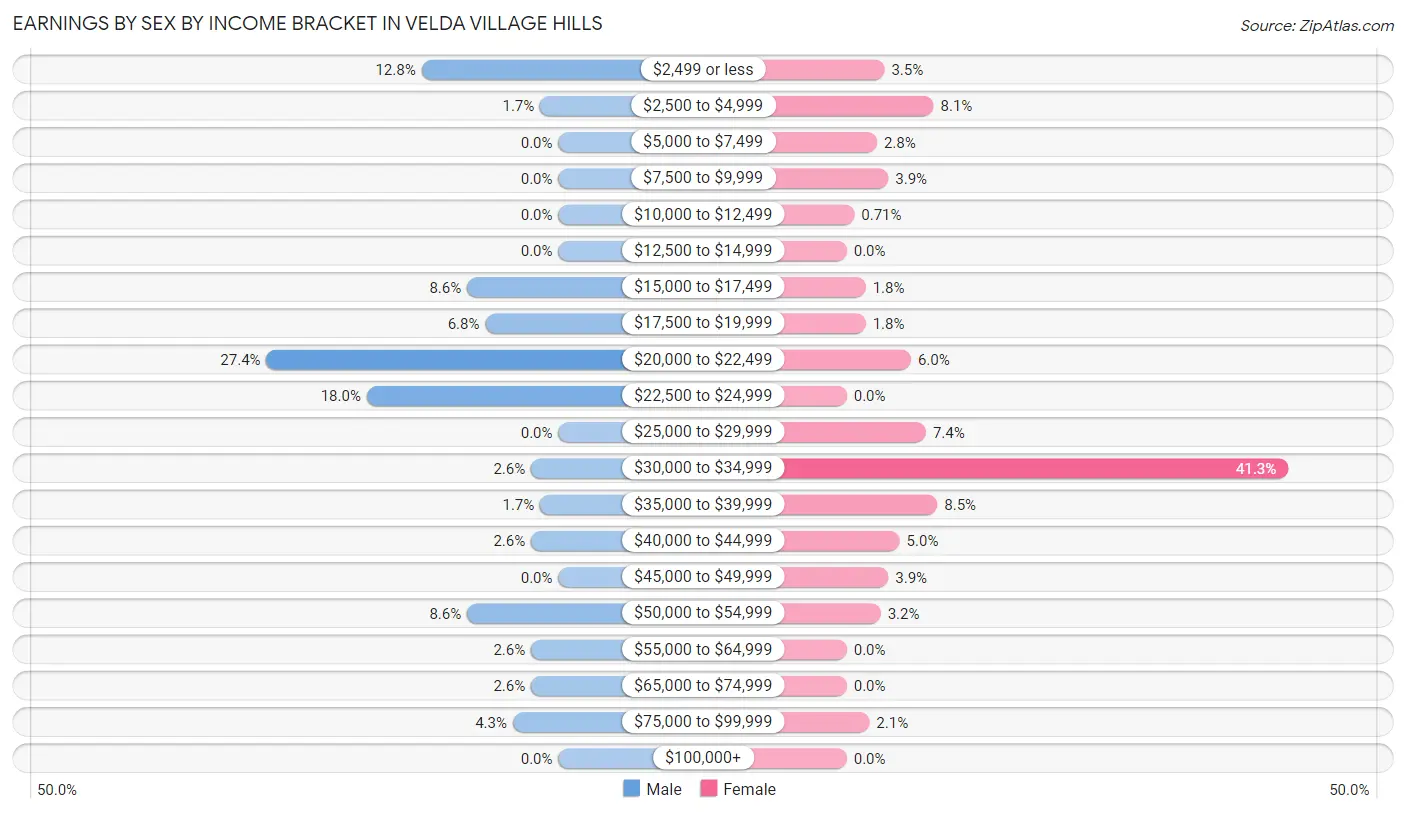
| Income | Male | Female |
| $2,499 or less | 15 (12.8%) | 10 (3.5%) |
| $2,500 to $4,999 | 2 (1.7%) | 23 (8.1%) |
| $5,000 to $7,499 | 0 (0.0%) | 8 (2.8%) |
| $7,500 to $9,999 | 0 (0.0%) | 11 (3.9%) |
| $10,000 to $12,499 | 0 (0.0%) | 2 (0.7%) |
| $12,500 to $14,999 | 0 (0.0%) | 0 (0.0%) |
| $15,000 to $17,499 | 10 (8.6%) | 5 (1.8%) |
| $17,500 to $19,999 | 8 (6.8%) | 5 (1.8%) |
| $20,000 to $22,499 | 32 (27.4%) | 17 (6.0%) |
| $22,500 to $24,999 | 21 (17.9%) | 0 (0.0%) |
| $25,000 to $29,999 | 0 (0.0%) | 21 (7.4%) |
| $30,000 to $34,999 | 3 (2.6%) | 117 (41.3%) |
| $35,000 to $39,999 | 2 (1.7%) | 24 (8.5%) |
| $40,000 to $44,999 | 3 (2.6%) | 14 (5.0%) |
| $45,000 to $49,999 | 0 (0.0%) | 11 (3.9%) |
| $50,000 to $54,999 | 10 (8.6%) | 9 (3.2%) |
| $55,000 to $64,999 | 3 (2.6%) | 0 (0.0%) |
| $65,000 to $74,999 | 3 (2.6%) | 0 (0.0%) |
| $75,000 to $99,999 | 5 (4.3%) | 6 (2.1%) |
| $100,000+ | 0 (0.0%) | 0 (0.0%) |
| Total | 117 (100.0%) | 283 (100.0%) |
Earnings by Sex by Educational Attainment in Velda Village Hills
Average earnings in Velda Village Hills are $22,070 for men and $32,212 for women, a difference of 31.5%. Men with an educational attainment of high school diploma enjoy the highest average annual earnings of $21,914, while those with high school diploma education earn the least with $21,914. Women with an educational attainment of bachelor's degree earn the most with the average annual earnings of $34,327, while those with high school diploma education have the smallest earnings of $30,649.
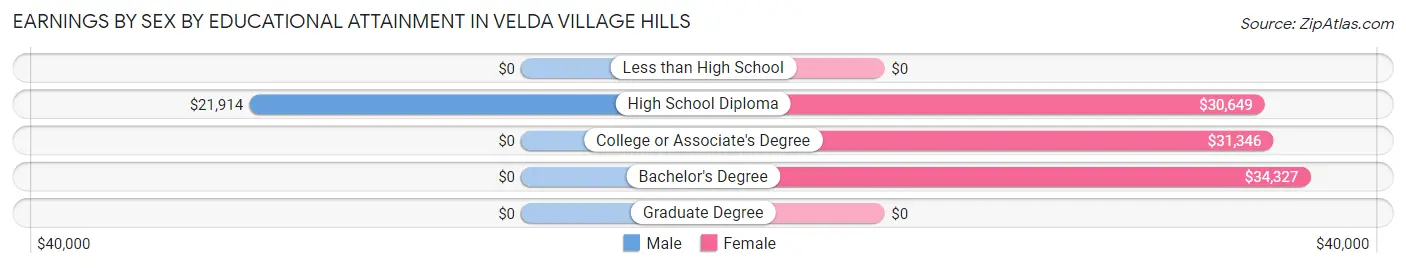
| Educational Attainment | Male Income | Female Income |
| Less than High School | - | - |
| High School Diploma | $21,914 | $30,649 |
| College or Associate's Degree | - | - |
| Bachelor's Degree | - | - |
| Graduate Degree | - | - |
| Total | $22,070 | $32,212 |
Family Income in Velda Village Hills
Family Income Brackets in Velda Village Hills
According to the Velda Village Hills family income data, there are 69 families falling into the $75,000 to $99,999 income range, which is the most common income bracket and makes up 23.7% of all families.
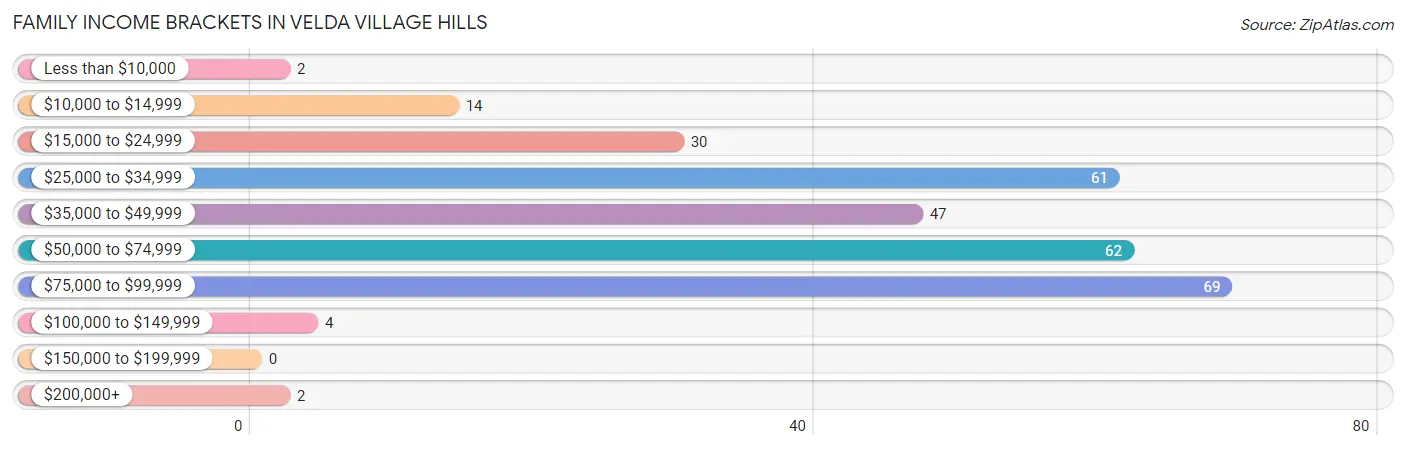
| Income Bracket | # Families | % Families |
| Less than $10,000 | 2 | 0.7% |
| $10,000 to $14,999 | 14 | 4.8% |
| $15,000 to $24,999 | 30 | 10.3% |
| $25,000 to $34,999 | 61 | 21.0% |
| $35,000 to $49,999 | 47 | 16.2% |
| $50,000 to $74,999 | 62 | 21.3% |
| $75,000 to $99,999 | 69 | 23.7% |
| $100,000 to $149,999 | 4 | 1.4% |
| $150,000 to $199,999 | 0 | 0.0% |
| $200,000+ | 2 | 0.7% |
Family Income by Famaliy Size in Velda Village Hills
3-person families (63 | 21.6%) account for the highest median family income in Velda Village Hills with $72,583 per family, while 3-person families (63 | 21.6%) have the highest median income of $24,194 per family member.
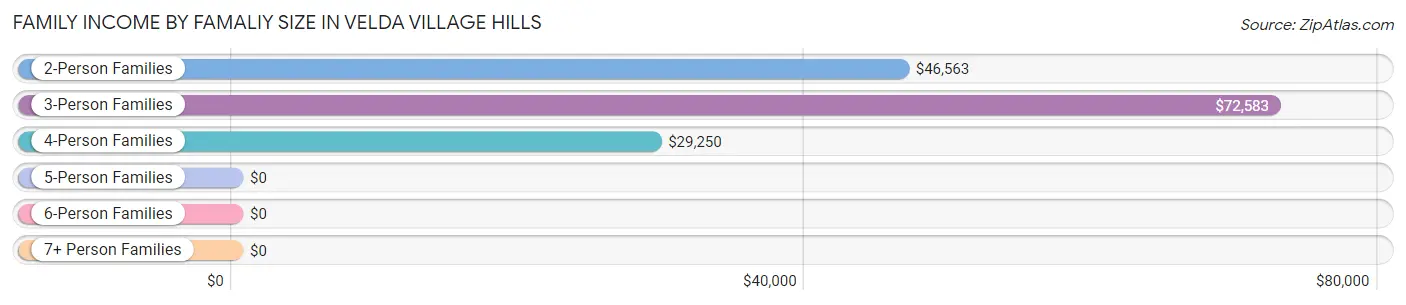
| Income Bracket | # Families | Median Income |
| 2-Person Families | 191 (65.6%) | $46,563 |
| 3-Person Families | 63 (21.6%) | $72,583 |
| 4-Person Families | 37 (12.7%) | $29,250 |
| 5-Person Families | 0 (0.0%) | $0 |
| 6-Person Families | 0 (0.0%) | $0 |
| 7+ Person Families | 0 (0.0%) | $0 |
| Total | 291 (100.0%) | $44,063 |
Family Income by Number of Earners in Velda Village Hills
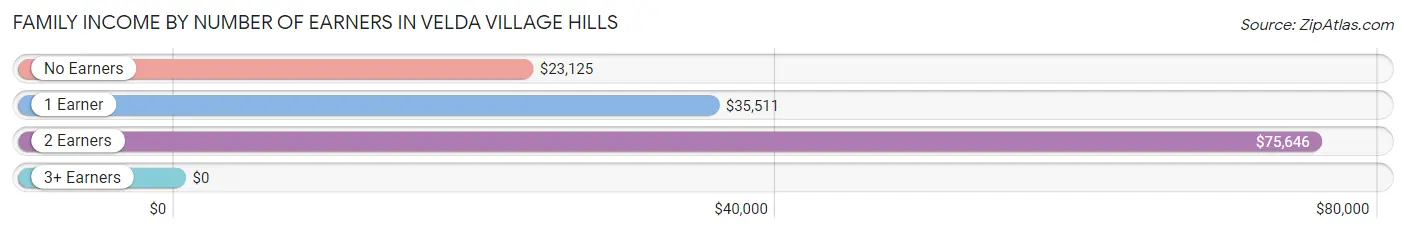
| Number of Earners | # Families | Median Income |
| No Earners | 40 (13.8%) | $23,125 |
| 1 Earner | 149 (51.2%) | $35,511 |
| 2 Earners | 97 (33.3%) | $75,646 |
| 3+ Earners | 5 (1.7%) | $0 |
| Total | 291 (100.0%) | $44,063 |
Household Income in Velda Village Hills
Household Income Brackets in Velda Village Hills
With 85 households falling in the category, the $25,000 to $34,999 income range is the most frequent in Velda Village Hills, accounting for 22.9% of all households.
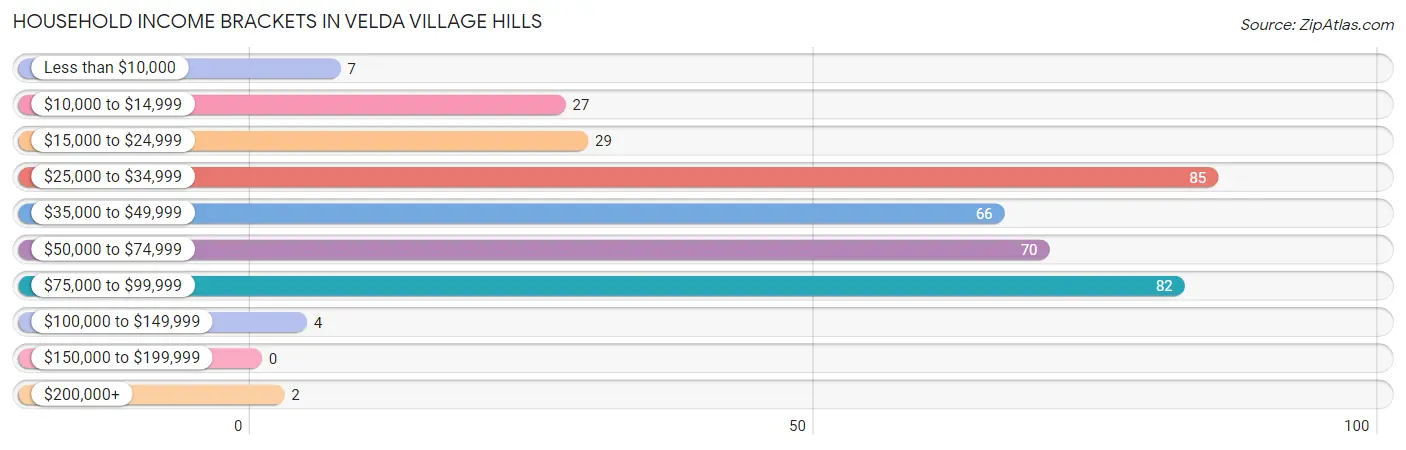
| Income Bracket | # Households | % Households |
| Less than $10,000 | 7 | 1.9% |
| $10,000 to $14,999 | 27 | 7.3% |
| $15,000 to $24,999 | 29 | 7.8% |
| $25,000 to $34,999 | 85 | 22.8% |
| $35,000 to $49,999 | 66 | 17.7% |
| $50,000 to $74,999 | 70 | 18.8% |
| $75,000 to $99,999 | 82 | 22.0% |
| $100,000 to $149,999 | 4 | 1.1% |
| $150,000 to $199,999 | 0 | 0.0% |
| $200,000+ | 2 | 0.5% |
Household Income by Householder Age in Velda Village Hills
The median household income in Velda Village Hills is $39,444, with the highest median household income of $53,289 found in the 45 to 64 years age bracket for the primary householder. A total of 176 households (47.3%) fall into this category.
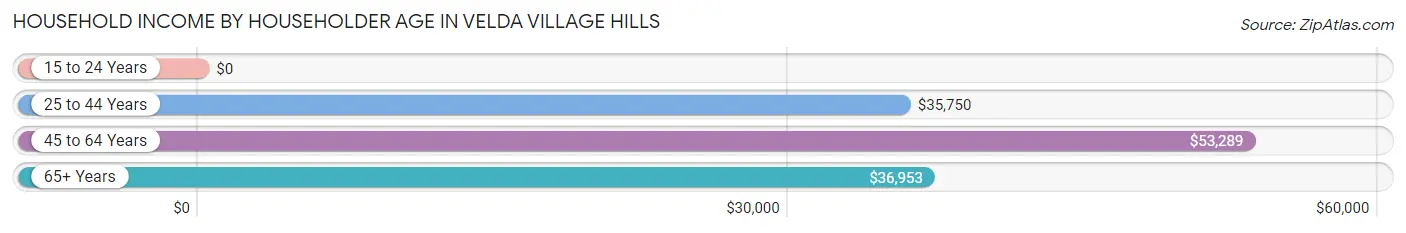
| Income Bracket | # Households | Median Income |
| 15 to 24 Years | 0 (0.0%) | $0 |
| 25 to 44 Years | 103 (27.7%) | $35,750 |
| 45 to 64 Years | 176 (47.3%) | $53,289 |
| 65+ Years | 93 (25.0%) | $36,953 |
| Total | 372 (100.0%) | $39,444 |
Poverty in Velda Village Hills
Income Below Poverty by Sex and Age in Velda Village Hills
With 20.3% poverty level for males and 18.8% for females among the residents of Velda Village Hills, under 5 year old males and 5 year old females are the most vulnerable to poverty, with 19 males (65.5%) and 12 females (100.0%) in their respective age groups living below the poverty level.
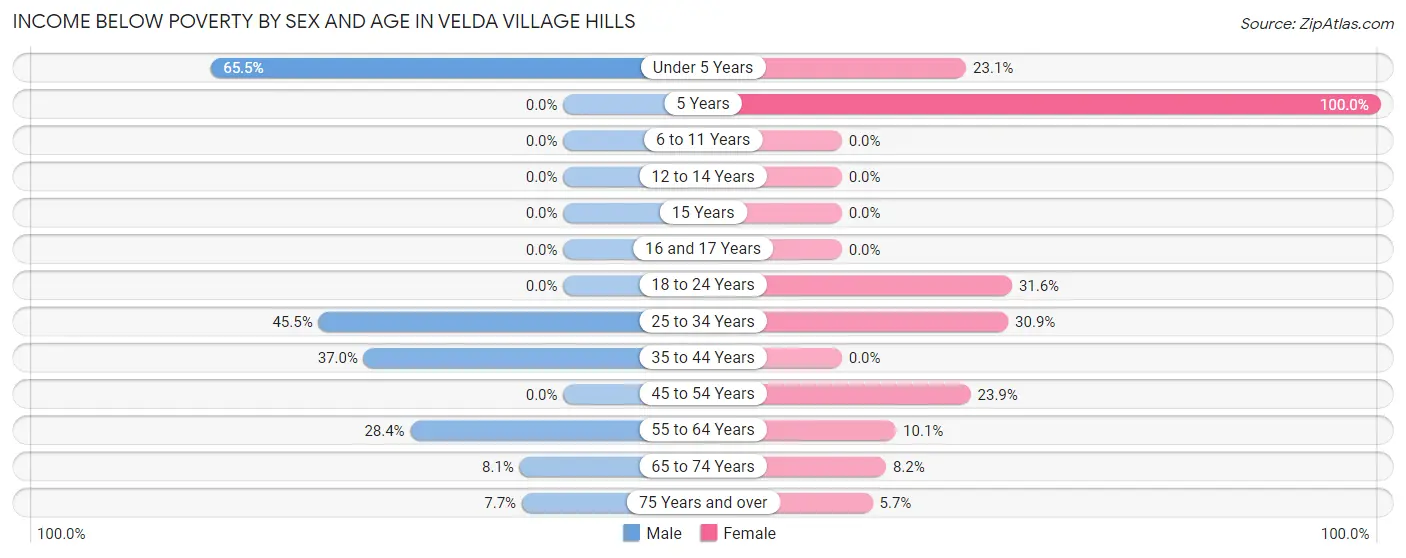
| Age Bracket | Male | Female |
| Under 5 Years | 19 (65.5%) | 15 (23.1%) |
| 5 Years | 0 (0.0%) | 12 (100.0%) |
| 6 to 11 Years | 0 (0.0%) | 0 (0.0%) |
| 12 to 14 Years | 0 (0.0%) | 0 (0.0%) |
| 15 Years | 0 (0.0%) | 0 (0.0%) |
| 16 and 17 Years | 0 (0.0%) | 0 (0.0%) |
| 18 to 24 Years | 0 (0.0%) | 18 (31.6%) |
| 25 to 34 Years | 15 (45.5%) | 21 (30.9%) |
| 35 to 44 Years | 10 (37.0%) | 0 (0.0%) |
| 45 to 54 Years | 0 (0.0%) | 11 (23.9%) |
| 55 to 64 Years | 21 (28.4%) | 11 (10.1%) |
| 65 to 74 Years | 3 (8.1%) | 5 (8.2%) |
| 75 Years and over | 2 (7.7%) | 2 (5.7%) |
| Total | 70 (20.3%) | 95 (18.8%) |
Income Above Poverty by Sex and Age in Velda Village Hills
According to the poverty statistics in Velda Village Hills, males aged 5 years and females aged 12 to 14 years are the age groups that are most secure financially, with 100.0% of males and 100.0% of females in these age groups living above the poverty line.
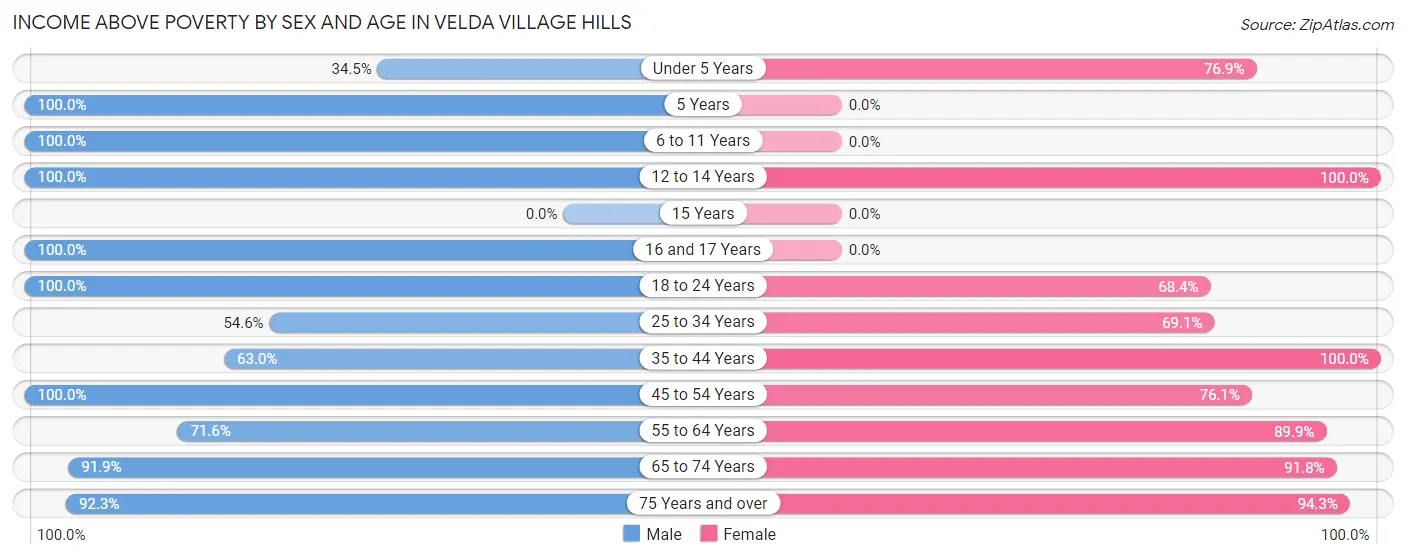
| Age Bracket | Male | Female |
| Under 5 Years | 10 (34.5%) | 50 (76.9%) |
| 5 Years | 11 (100.0%) | 0 (0.0%) |
| 6 to 11 Years | 15 (100.0%) | 0 (0.0%) |
| 12 to 14 Years | 12 (100.0%) | 19 (100.0%) |
| 15 Years | 0 (0.0%) | 0 (0.0%) |
| 16 and 17 Years | 25 (100.0%) | 0 (0.0%) |
| 18 to 24 Years | 9 (100.0%) | 39 (68.4%) |
| 25 to 34 Years | 18 (54.5%) | 47 (69.1%) |
| 35 to 44 Years | 17 (63.0%) | 33 (100.0%) |
| 45 to 54 Years | 46 (100.0%) | 35 (76.1%) |
| 55 to 64 Years | 53 (71.6%) | 98 (89.9%) |
| 65 to 74 Years | 34 (91.9%) | 56 (91.8%) |
| 75 Years and over | 24 (92.3%) | 33 (94.3%) |
| Total | 274 (79.6%) | 410 (81.2%) |
Income Below Poverty Among Married-Couple Families in Velda Village Hills
The poverty statistics for married-couple families in Velda Village Hills show that 18.3% or 13 of the total 71 families live below the poverty line. Families with no children have the highest poverty rate of 21.0%, comprising of 13 families. On the other hand, families with 1 or 2 children have the lowest poverty rate of 0.0%, which includes 0 families.
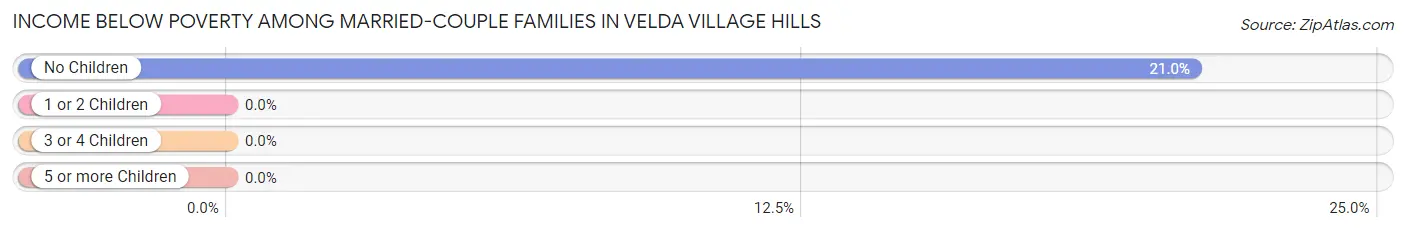
| Children | Above Poverty | Below Poverty |
| No Children | 49 (79.0%) | 13 (21.0%) |
| 1 or 2 Children | 9 (100.0%) | 0 (0.0%) |
| 3 or 4 Children | 0 (0.0%) | 0 (0.0%) |
| 5 or more Children | 0 (0.0%) | 0 (0.0%) |
| Total | 58 (81.7%) | 13 (18.3%) |
Income Below Poverty Among Single-Parent Households in Velda Village Hills
According to the poverty data in Velda Village Hills, 41.7% or 15 single-father households and 6.0% or 11 single-mother households are living below the poverty line. Among single-father households, those with 3 or 4 children have the highest poverty rate, with 15 households (100.0%) experiencing poverty. Likewise, among single-mother households, those with 1 or 2 children have the highest poverty rate, with 5 households (7.6%) falling below the poverty line.
| Children | Single Father | Single Mother |
| No Children | 0 (0.0%) | 6 (5.8%) |
| 1 or 2 Children | 0 (0.0%) | 5 (7.6%) |
| 3 or 4 Children | 15 (100.0%) | 0 (0.0%) |
| 5 or more Children | 0 (0.0%) | 0 (0.0%) |
| Total | 15 (41.7%) | 11 (6.0%) |
Income Below Poverty Among Married-Couple vs Single-Parent Households in Velda Village Hills
The poverty data for Velda Village Hills shows that 13 of the married-couple family households (18.3%) and 26 of the single-parent households (11.8%) are living below the poverty level. Within the married-couple family households, those with no children have the highest poverty rate, with 13 households (21.0%) falling below the poverty line. Among the single-parent households, those with 3 or 4 children have the highest poverty rate, with 15 household (50.0%) living below poverty.
| Children | Married-Couple Families | Single-Parent Households |
| No Children | 13 (21.0%) | 6 (5.3%) |
| 1 or 2 Children | 0 (0.0%) | 5 (6.6%) |
| 3 or 4 Children | 0 (0.0%) | 15 (50.0%) |
| 5 or more Children | 0 (0.0%) | 0 (0.0%) |
| Total | 13 (18.3%) | 26 (11.8%) |
Race in Velda Village Hills
The most populous races in Velda Village Hills are Black / African American (836 | 98.5%), Two or more Races (9 | 1.1%), and Hispanic or Latino (5 | 0.6%).
| Race | # Population | % Population |
| Asian | 0 | 0.0% |
| Black / African American | 836 | 98.5% |
| Hawaiian / Pacific | 0 | 0.0% |
| Hispanic or Latino | 5 | 0.6% |
| Native / Alaskan | 0 | 0.0% |
| White / Caucasian | 4 | 0.5% |
| Two or more Races | 9 | 1.1% |
| Some other Race | 0 | 0.0% |
| Total | 849 | 100.0% |
Ancestry in Velda Village Hills
The most populous ancestries reported in Velda Village Hills are American (48 | 5.7%), German (8 | 0.9%), Mexican (5 | 0.6%), Blackfeet (3 | 0.4%), and Seminole (3 | 0.4%), together accounting for 7.9% of all Velda Village Hills residents.
| Ancestry | # Population | % Population |
| African | 2 | 0.2% |
| American | 48 | 5.7% |
| Blackfeet | 3 | 0.4% |
| German | 8 | 0.9% |
| Irish | 2 | 0.2% |
| Italian | 2 | 0.2% |
| Mexican | 5 | 0.6% |
| Seminole | 3 | 0.4% |
| Subsaharan African | 2 | 0.2% | View All 9 Rows |
Immigrants in Velda Village Hills

| Immigration Origin | # Population | % Population | View All 0 Rows |
Sex and Age in Velda Village Hills
Sex and Age in Velda Village Hills
The most populous age groups in Velda Village Hills are 60 to 64 Years (68 | 19.8%) for men and 60 to 64 Years (88 | 17.4%) for women.
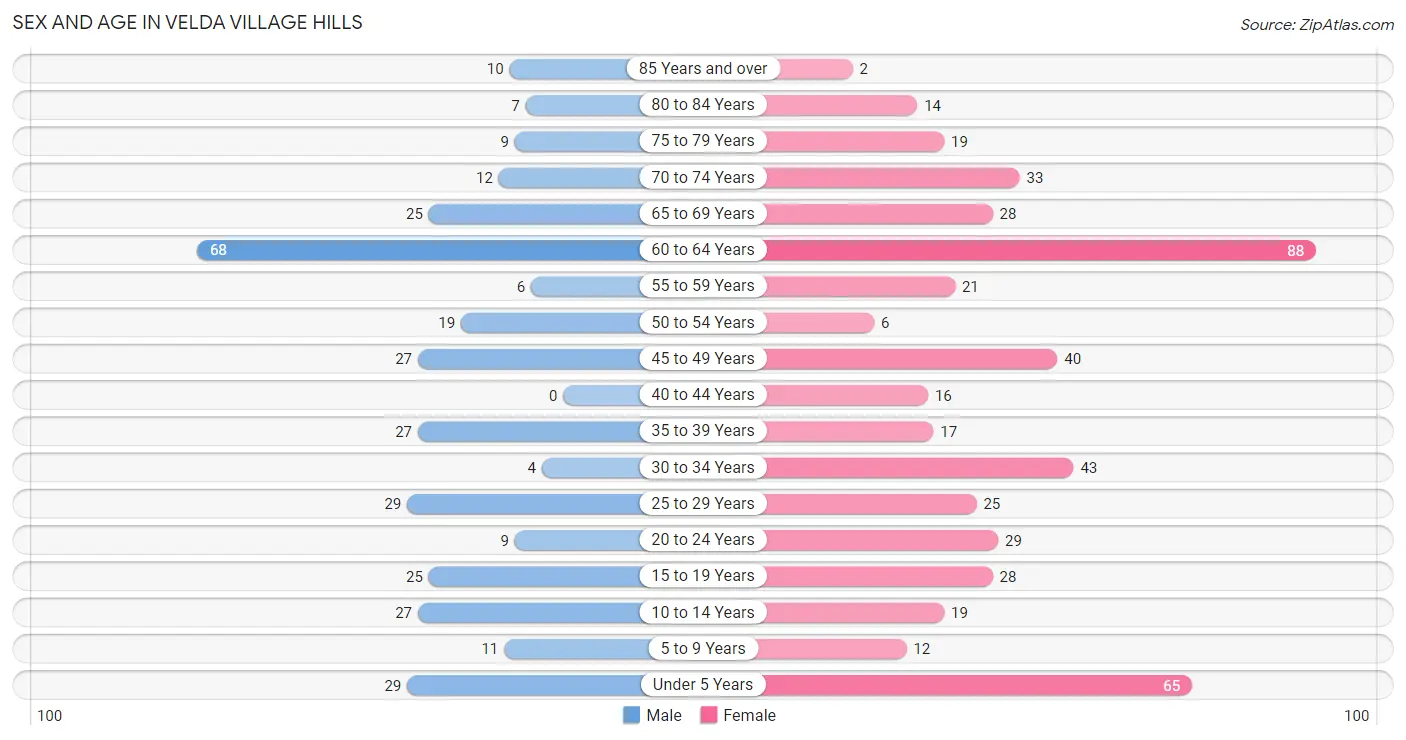
| Age Bracket | Male | Female |
| Under 5 Years | 29 (8.4%) | 65 (12.9%) |
| 5 to 9 Years | 11 (3.2%) | 12 (2.4%) |
| 10 to 14 Years | 27 (7.9%) | 19 (3.8%) |
| 15 to 19 Years | 25 (7.3%) | 28 (5.5%) |
| 20 to 24 Years | 9 (2.6%) | 29 (5.7%) |
| 25 to 29 Years | 29 (8.4%) | 25 (5.0%) |
| 30 to 34 Years | 4 (1.2%) | 43 (8.5%) |
| 35 to 39 Years | 27 (7.9%) | 17 (3.4%) |
| 40 to 44 Years | 0 (0.0%) | 16 (3.2%) |
| 45 to 49 Years | 27 (7.9%) | 40 (7.9%) |
| 50 to 54 Years | 19 (5.5%) | 6 (1.2%) |
| 55 to 59 Years | 6 (1.7%) | 21 (4.2%) |
| 60 to 64 Years | 68 (19.8%) | 88 (17.4%) |
| 65 to 69 Years | 25 (7.3%) | 28 (5.5%) |
| 70 to 74 Years | 12 (3.5%) | 33 (6.5%) |
| 75 to 79 Years | 9 (2.6%) | 19 (3.8%) |
| 80 to 84 Years | 7 (2.0%) | 14 (2.8%) |
| 85 Years and over | 10 (2.9%) | 2 (0.4%) |
| Total | 344 (100.0%) | 505 (100.0%) |
Families and Households in Velda Village Hills
Median Family Size in Velda Village Hills
The median family size in Velda Village Hills is 2.56 persons per family, with single male/father families (36 | 12.4%) accounting for the largest median family size of 2.94 persons per family. On the other hand, single female/mother families (184 | 63.2%) represent the smallest median family size with 2.48 persons per family.
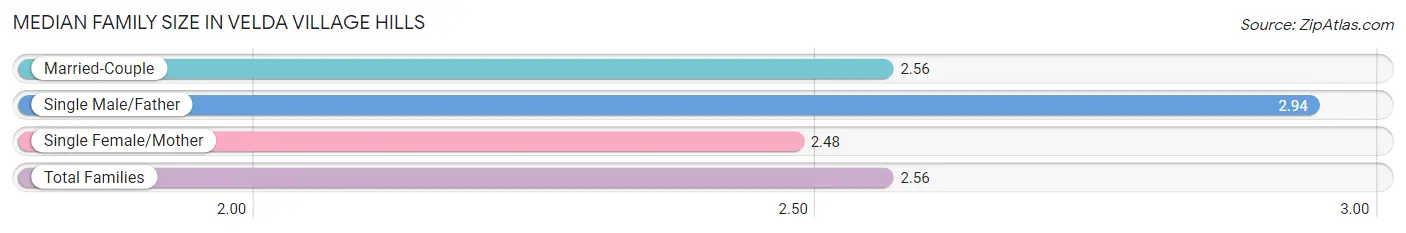
| Family Type | # Families | Family Size |
| Married-Couple | 71 (24.4%) | 2.56 |
| Single Male/Father | 36 (12.4%) | 2.94 |
| Single Female/Mother | 184 (63.2%) | 2.48 |
| Total Families | 291 (100.0%) | 2.56 |
Median Household Size in Velda Village Hills
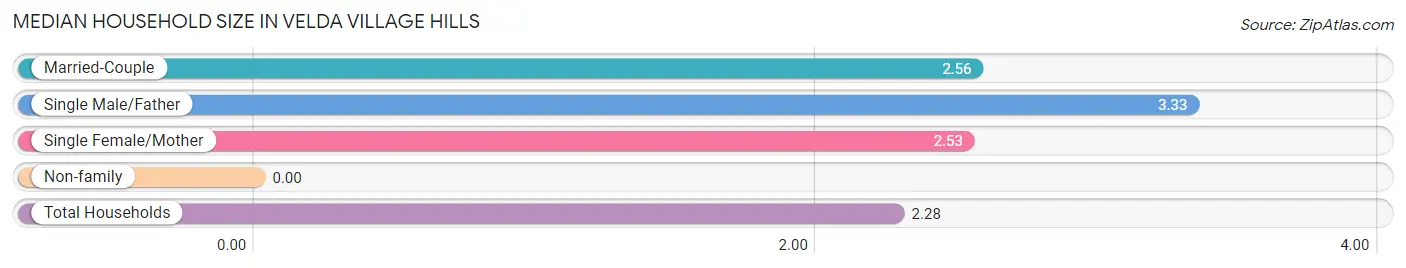
| Household Type | # Households | Household Size |
| Married-Couple | 71 (19.1%) | 2.56 |
| Single Male/Father | 36 (9.7%) | 3.33 |
| Single Female/Mother | 184 (49.5%) | 2.53 |
| Non-family | 81 (21.8%) | - |
| Total Households | 372 (100.0%) | 2.28 |
Household Size by Marriage Status in Velda Village Hills
Out of a total of 372 households in Velda Village Hills, 291 (78.2%) are family households, while 81 (21.8%) are nonfamily households. The most numerous type of family households are 2-person households, comprising 191, and the most common type of nonfamily households are 1-person households, comprising 81.
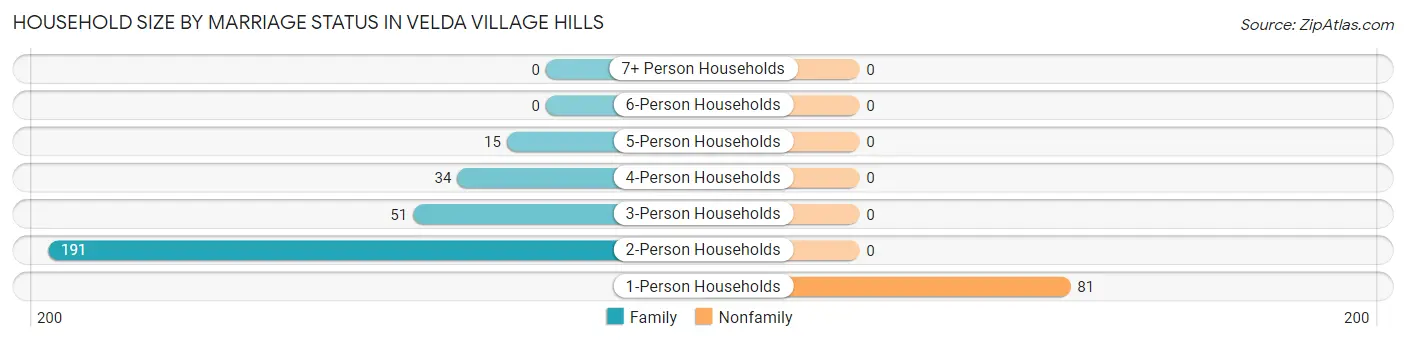
| Household Size | Family Households | Nonfamily Households |
| 1-Person Households | - | 81 (21.8%) |
| 2-Person Households | 191 (51.3%) | 0 (0.0%) |
| 3-Person Households | 51 (13.7%) | 0 (0.0%) |
| 4-Person Households | 34 (9.1%) | 0 (0.0%) |
| 5-Person Households | 15 (4.0%) | 0 (0.0%) |
| 6-Person Households | 0 (0.0%) | 0 (0.0%) |
| 7+ Person Households | 0 (0.0%) | 0 (0.0%) |
| Total | 291 (78.2%) | 81 (21.8%) |
Female Fertility in Velda Village Hills
Fertility by Age in Velda Village Hills
Average fertility rate in Velda Village Hills is 71.0 births per 1,000 women. Women in the age bracket of 20 to 34 years have the highest fertility rate with 144.0 births per 1,000 women. Women in the age bracket of 20 to 34 years acount for 100.0% of all women with births.
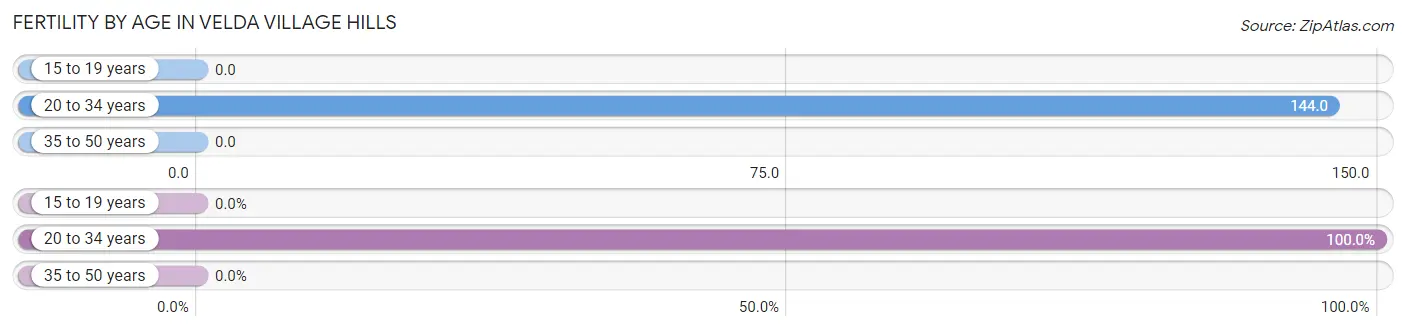
| Age Bracket | Women with Births | Births / 1,000 Women |
| 15 to 19 years | 0 (0.0%) | 0.0 |
| 20 to 34 years | 14 (100.0%) | 144.0 |
| 35 to 50 years | 0 (0.0%) | 0.0 |
| Total | 14 (100.0%) | 71.0 |
Fertility by Age by Marriage Status in Velda Village Hills
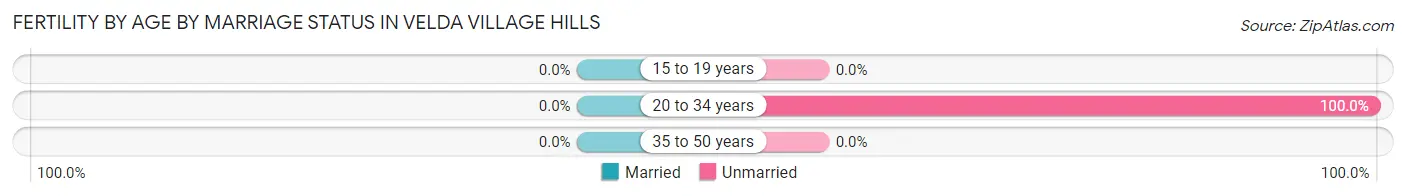
| Age Bracket | Married | Unmarried |
| 15 to 19 years | 0 (0.0%) | 0 (0.0%) |
| 20 to 34 years | 0 (0.0%) | 14 (100.0%) |
| 35 to 50 years | 0 (0.0%) | 0 (0.0%) |
| Total | 0 (0.0%) | 14 (100.0%) |
Fertility by Education in Velda Village Hills
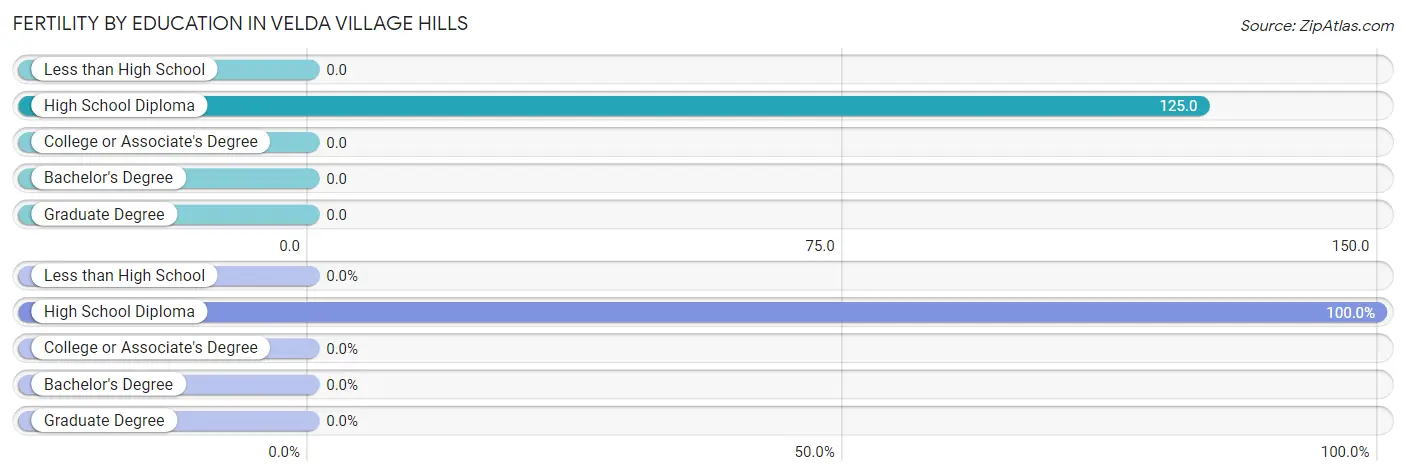
| Educational Attainment | Women with Births | Births / 1,000 Women |
| Less than High School | 0 (0.0%) | 0.0 |
| High School Diploma | 14 (100.0%) | 125.0 |
| College or Associate's Degree | 0 (0.0%) | 0.0 |
| Bachelor's Degree | 0 (0.0%) | 0.0 |
| Graduate Degree | 0 (0.0%) | 0.0 |
| Total | 14 (100.0%) | 71.0 |
Fertility by Education by Marriage Status in Velda Village Hills
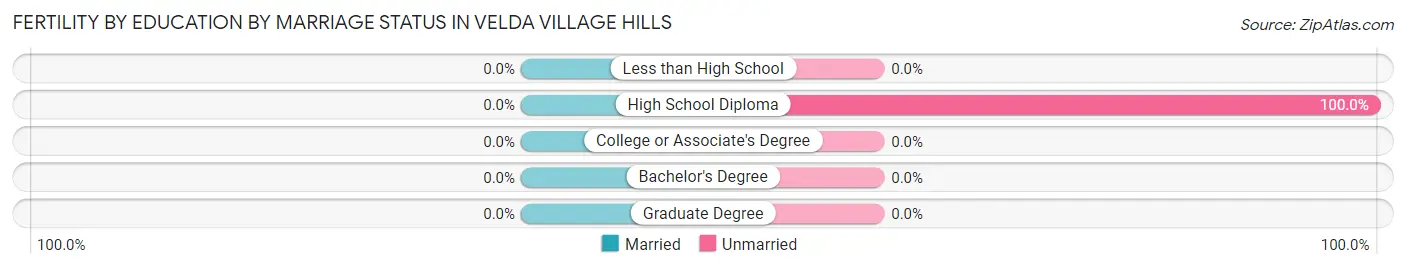
| Educational Attainment | Married | Unmarried |
| Less than High School | 0 (0.0%) | 0 (0.0%) |
| High School Diploma | 0 (0.0%) | 14 (100.0%) |
| College or Associate's Degree | 0 (0.0%) | 0 (0.0%) |
| Bachelor's Degree | 0 (0.0%) | 0 (0.0%) |
| Graduate Degree | 0 (0.0%) | 0 (0.0%) |
| Total | 0 (0.0%) | 14 (100.0%) |
Employment Characteristics in Velda Village Hills
Employment by Class of Employer in Velda Village Hills
Among the 324 employed individuals in Velda Village Hills, private company employees (191 | 59.0%), federal government employees (62 | 19.1%), and self-employed (not incorporated) (38 | 11.7%) make up the most common classes of employment.
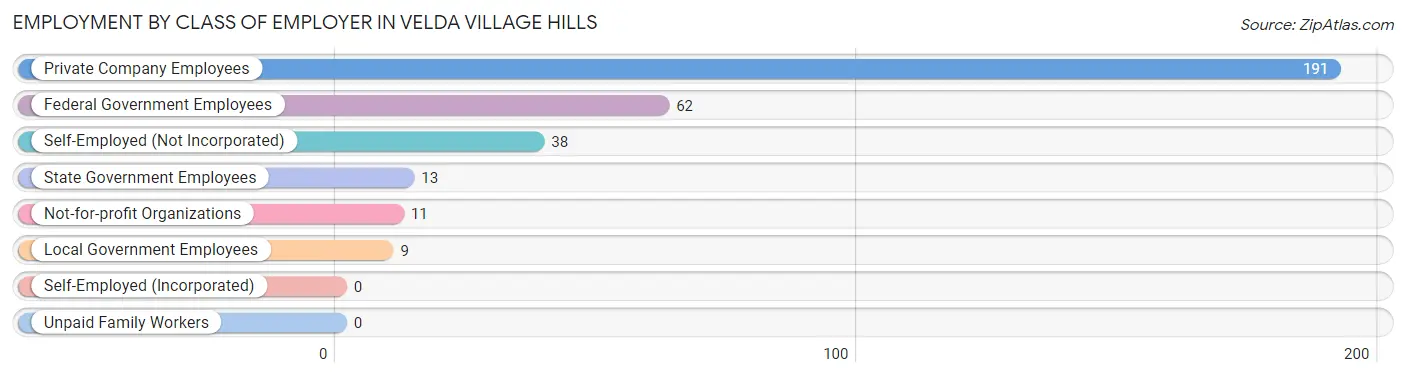
| Employer Class | # Employees | % Employees |
| Private Company Employees | 191 | 59.0% |
| Self-Employed (Incorporated) | 0 | 0.0% |
| Self-Employed (Not Incorporated) | 38 | 11.7% |
| Not-for-profit Organizations | 11 | 3.4% |
| Local Government Employees | 9 | 2.8% |
| State Government Employees | 13 | 4.0% |
| Federal Government Employees | 62 | 19.1% |
| Unpaid Family Workers | 0 | 0.0% |
| Total | 324 | 100.0% |
Employment Status by Age in Velda Village Hills
According to the labor force statistics for Velda Village Hills, out of the total population over 16 years of age (686), 57.3% or 393 individuals are in the labor force, with 16.5% or 65 of them unemployed. The age group with the highest labor force participation rate is 25 to 29 years, with 92.6% or 50 individuals in the labor force. Within the labor force, the 16 to 19 years age range has the highest percentage of unemployed individuals, with 71.9% or 23 of them being unemployed.
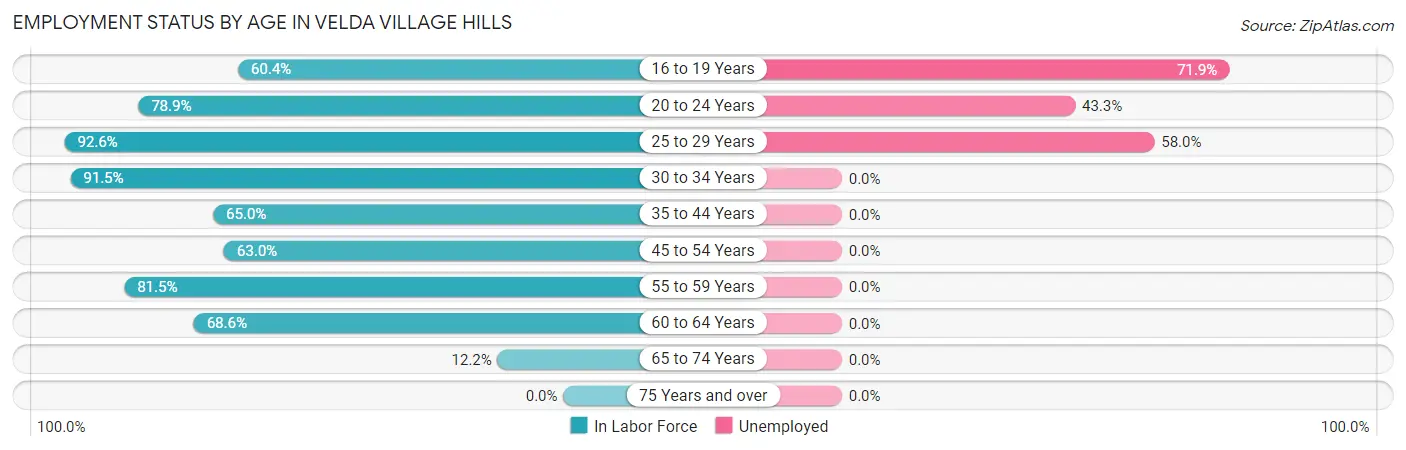
| Age Bracket | In Labor Force | Unemployed |
| 16 to 19 Years | 32 (60.4%) | 23 (71.9%) |
| 20 to 24 Years | 30 (78.9%) | 13 (43.3%) |
| 25 to 29 Years | 50 (92.6%) | 29 (58.0%) |
| 30 to 34 Years | 43 (91.5%) | 0 (0.0%) |
| 35 to 44 Years | 39 (65.0%) | 0 (0.0%) |
| 45 to 54 Years | 58 (63.0%) | 0 (0.0%) |
| 55 to 59 Years | 22 (81.5%) | 0 (0.0%) |
| 60 to 64 Years | 107 (68.6%) | 0 (0.0%) |
| 65 to 74 Years | 12 (12.2%) | 0 (0.0%) |
| 75 Years and over | 0 (0.0%) | 0 (0.0%) |
| Total | 393 (57.3%) | 65 (16.5%) |
Employment Status by Educational Attainment in Velda Village Hills
According to labor force statistics for Velda Village Hills, 73.2% of individuals (319) out of the total population between 25 and 64 years of age (436) are in the labor force, with 9.1% or 29 of them being unemployed. The group with the highest labor force participation rate are those with the educational attainment of bachelor's degree or higher, with 100.0% or 88 individuals in the labor force. Within the labor force, individuals with less than high school education have the highest percentage of unemployment, with 100.0% or 15 of them being unemployed.
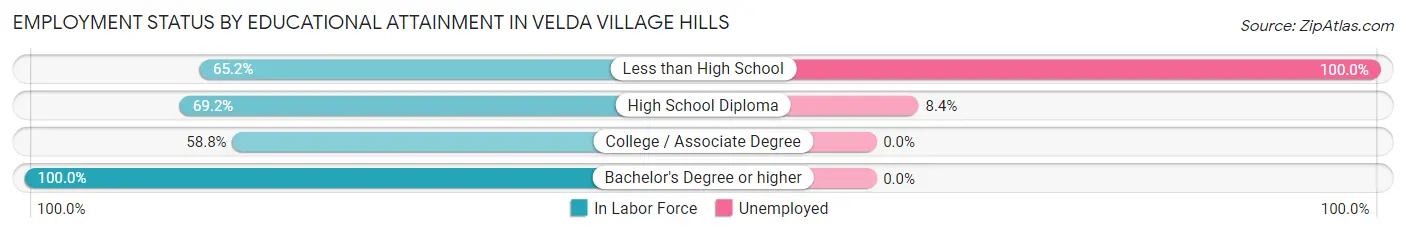
| Educational Attainment | In Labor Force | Unemployed |
| Less than High School | 15 (65.2%) | 23 (100.0%) |
| High School Diploma | 166 (69.2%) | 20 (8.4%) |
| College / Associate Degree | 50 (58.8%) | 0 (0.0%) |
| Bachelor's Degree or higher | 88 (100.0%) | 0 (0.0%) |
| Total | 319 (73.2%) | 40 (9.1%) |
Employment Occupations by Sex in Velda Village Hills
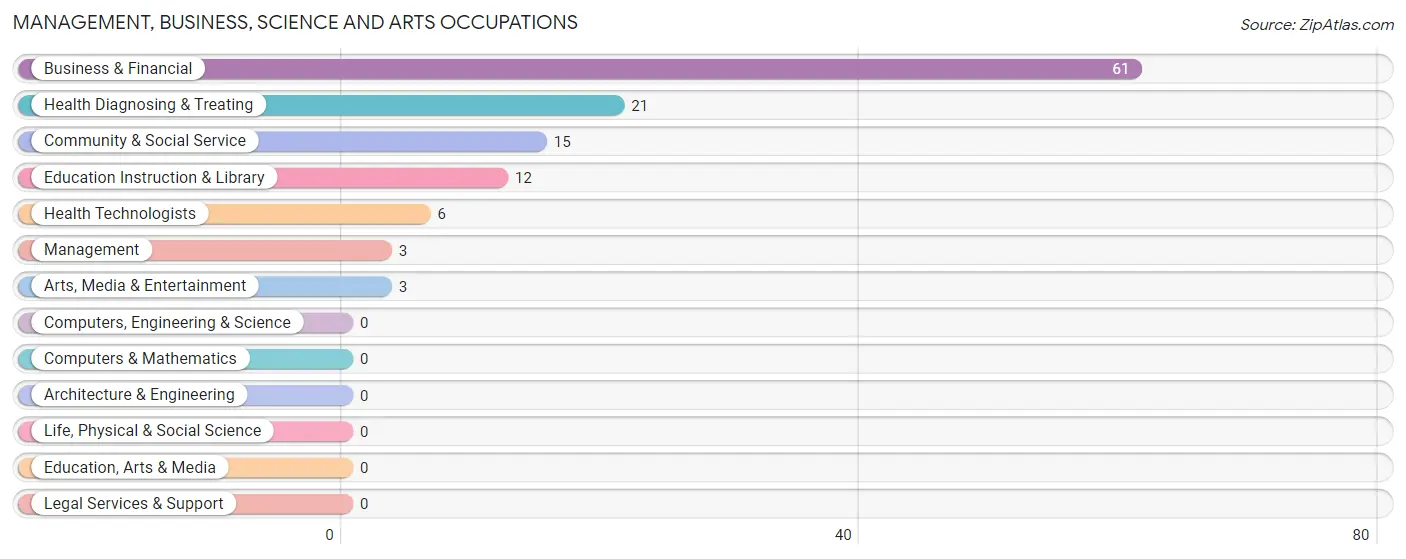
Management, Business, Science and Arts Occupations
The most common Management, Business, Science and Arts occupations in Velda Village Hills are Business & Financial (61 | 18.6%), Health Diagnosing & Treating (21 | 6.4%), Community & Social Service (15 | 4.6%), Education Instruction & Library (12 | 3.7%), and Health Technologists (6 | 1.8%).
Management, Business, Science and Arts Occupations by Sex
Within the Management, Business, Science and Arts occupations in Velda Village Hills, the most male-oriented occupations are Education Instruction & Library (50.0%), and Community & Social Service (40.0%), while the most female-oriented occupations are Management (100.0%), Business & Financial (100.0%), and Arts, Media & Entertainment (100.0%).
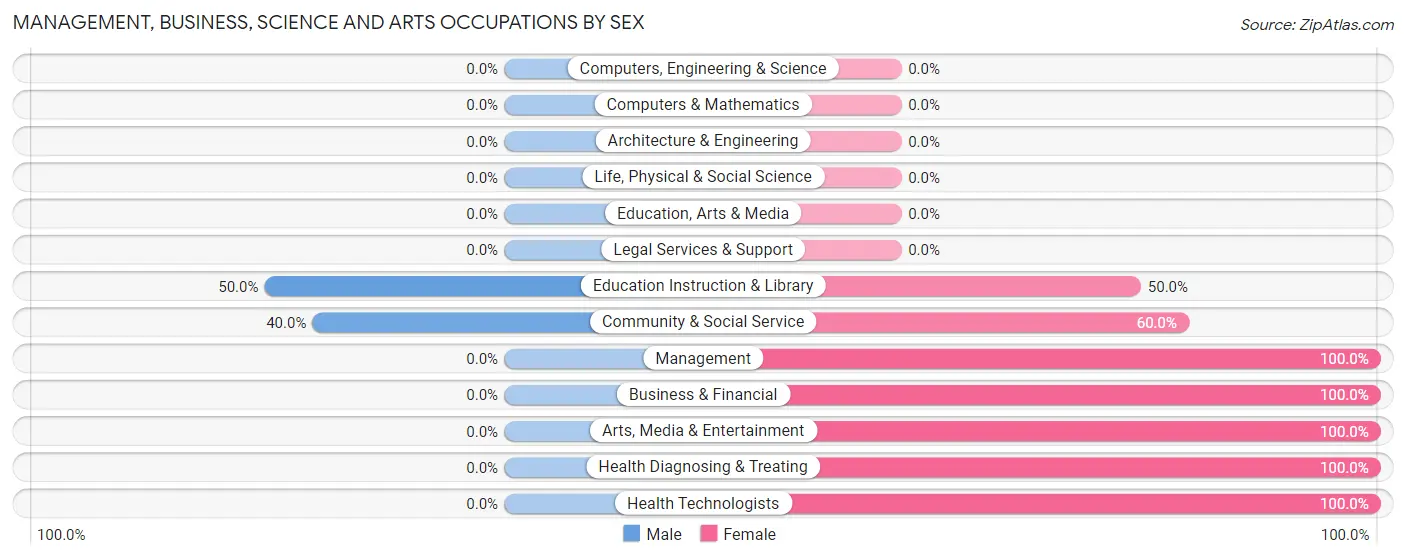
| Occupation | Male | Female |
| Management | 0 (0.0%) | 3 (100.0%) |
| Business & Financial | 0 (0.0%) | 61 (100.0%) |
| Computers, Engineering & Science | 0 (0.0%) | 0 (0.0%) |
| Computers & Mathematics | 0 (0.0%) | 0 (0.0%) |
| Architecture & Engineering | 0 (0.0%) | 0 (0.0%) |
| Life, Physical & Social Science | 0 (0.0%) | 0 (0.0%) |
| Community & Social Service | 6 (40.0%) | 9 (60.0%) |
| Education, Arts & Media | 0 (0.0%) | 0 (0.0%) |
| Legal Services & Support | 0 (0.0%) | 0 (0.0%) |
| Education Instruction & Library | 6 (50.0%) | 6 (50.0%) |
| Arts, Media & Entertainment | 0 (0.0%) | 3 (100.0%) |
| Health Diagnosing & Treating | 0 (0.0%) | 21 (100.0%) |
| Health Technologists | 0 (0.0%) | 6 (100.0%) |
| Total (Category) | 6 (6.0%) | 94 (94.0%) |
| Total (Overall) | 99 (30.2%) | 229 (69.8%) |
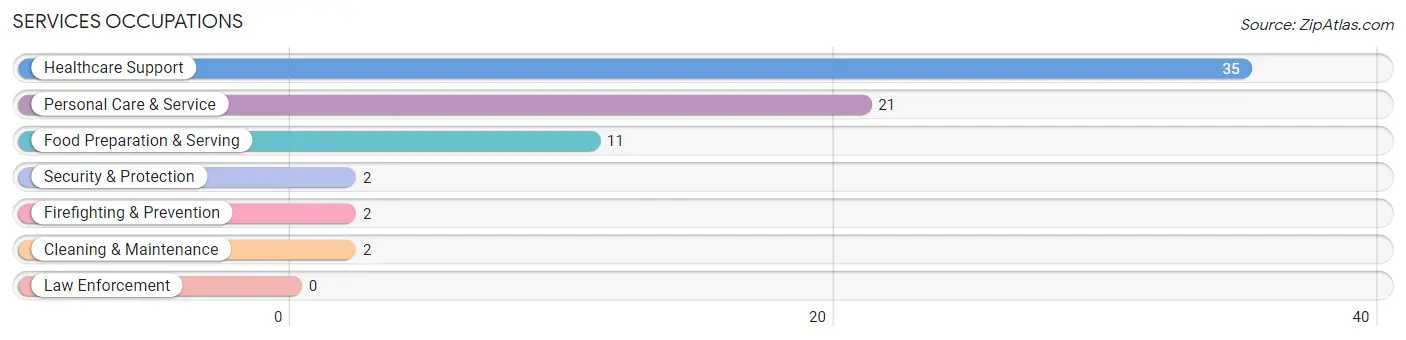
Services Occupations
The most common Services occupations in Velda Village Hills are Healthcare Support (35 | 10.7%), Personal Care & Service (21 | 6.4%), Food Preparation & Serving (11 | 3.4%), Security & Protection (2 | 0.6%), and Firefighting & Prevention (2 | 0.6%).
Services Occupations by Sex
Within the Services occupations in Velda Village Hills, the most male-oriented occupations are Cleaning & Maintenance (100.0%), and Healthcare Support (5.7%), while the most female-oriented occupations are Security & Protection (100.0%), Firefighting & Prevention (100.0%), and Food Preparation & Serving (100.0%).
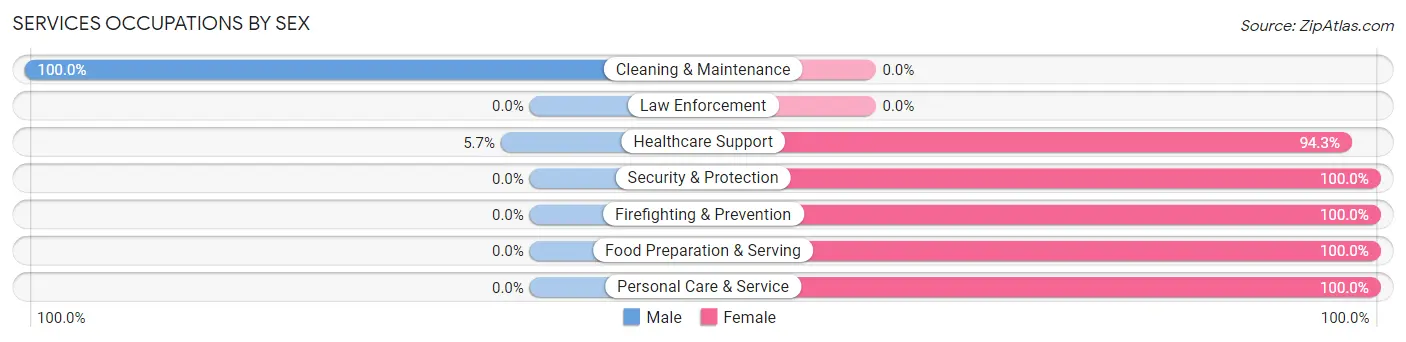
| Occupation | Male | Female |
| Healthcare Support | 2 (5.7%) | 33 (94.3%) |
| Security & Protection | 0 (0.0%) | 2 (100.0%) |
| Firefighting & Prevention | 0 (0.0%) | 2 (100.0%) |
| Law Enforcement | 0 (0.0%) | 0 (0.0%) |
| Food Preparation & Serving | 0 (0.0%) | 11 (100.0%) |
| Cleaning & Maintenance | 2 (100.0%) | 0 (0.0%) |
| Personal Care & Service | 0 (0.0%) | 21 (100.0%) |
| Total (Category) | 4 (5.6%) | 67 (94.4%) |
| Total (Overall) | 99 (30.2%) | 229 (69.8%) |
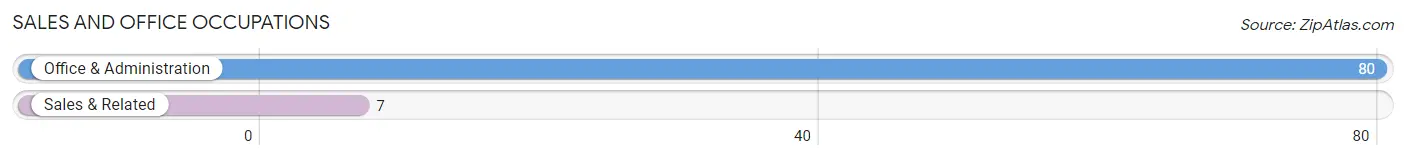
Sales and Office Occupations
The most common Sales and Office occupations in Velda Village Hills are Office & Administration (80 | 24.4%), and Sales & Related (7 | 2.1%).
Sales and Office Occupations by Sex
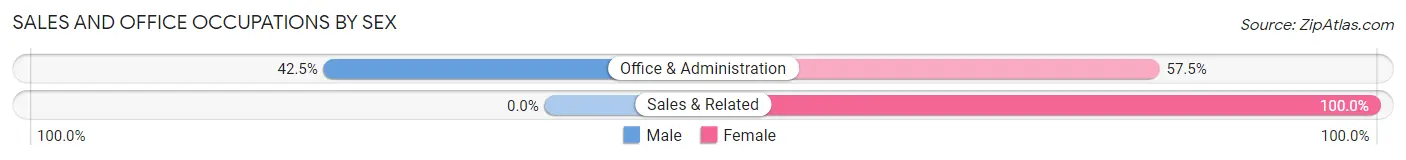
| Occupation | Male | Female |
| Sales & Related | 0 (0.0%) | 7 (100.0%) |
| Office & Administration | 34 (42.5%) | 46 (57.5%) |
| Total (Category) | 34 (39.1%) | 53 (60.9%) |
| Total (Overall) | 99 (30.2%) | 229 (69.8%) |
Natural Resources, Construction and Maintenance Occupations
The most common Natural Resources, Construction and Maintenance occupations in Velda Village Hills are , and Installation, Maintenance & Repair (34 | 10.4%).
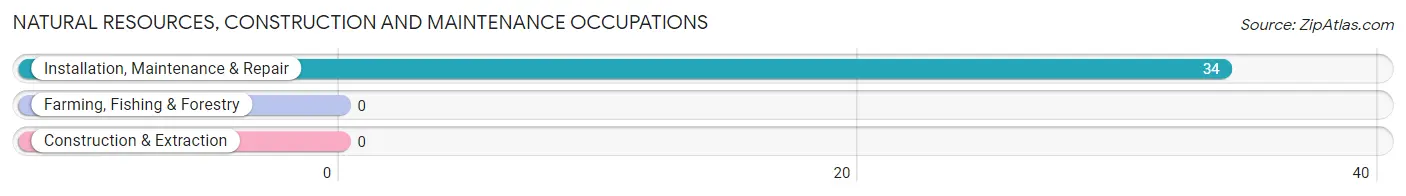
Natural Resources, Construction and Maintenance Occupations by Sex
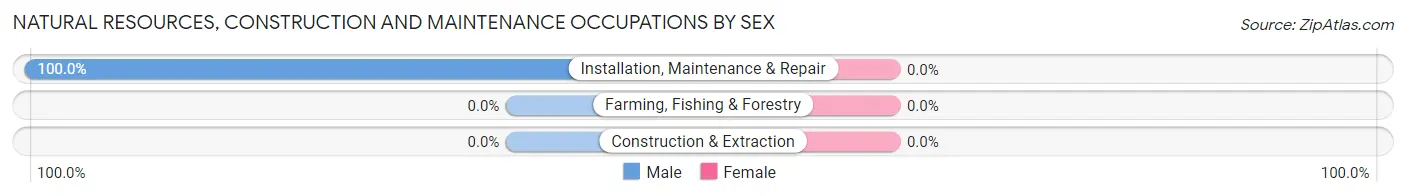
| Occupation | Male | Female |
| Farming, Fishing & Forestry | 0 (0.0%) | 0 (0.0%) |
| Construction & Extraction | 0 (0.0%) | 0 (0.0%) |
| Installation, Maintenance & Repair | 34 (100.0%) | 0 (0.0%) |
| Total (Category) | 34 (100.0%) | 0 (0.0%) |
| Total (Overall) | 99 (30.2%) | 229 (69.8%) |
Production, Transportation and Moving Occupations
The most common Production, Transportation and Moving occupations in Velda Village Hills are Material Moving (24 | 7.3%), Transportation (8 | 2.4%), and Production (4 | 1.2%).
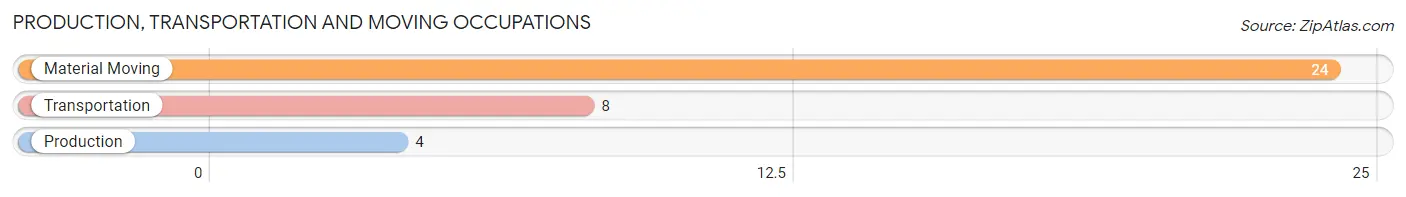
Production, Transportation and Moving Occupations by Sex
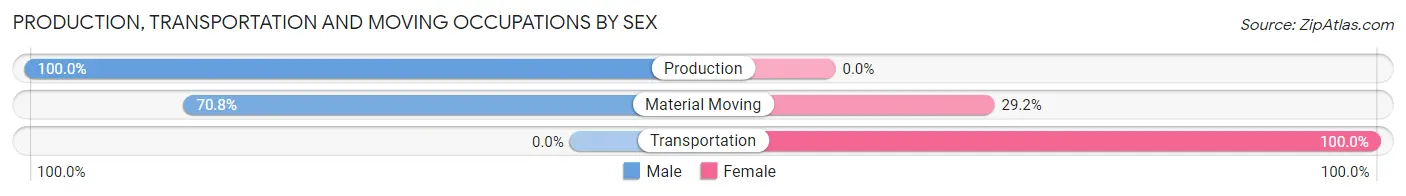
| Occupation | Male | Female |
| Production | 4 (100.0%) | 0 (0.0%) |
| Transportation | 0 (0.0%) | 8 (100.0%) |
| Material Moving | 17 (70.8%) | 7 (29.2%) |
| Total (Category) | 21 (58.3%) | 15 (41.7%) |
| Total (Overall) | 99 (30.2%) | 229 (69.8%) |
Employment Industries by Sex in Velda Village Hills
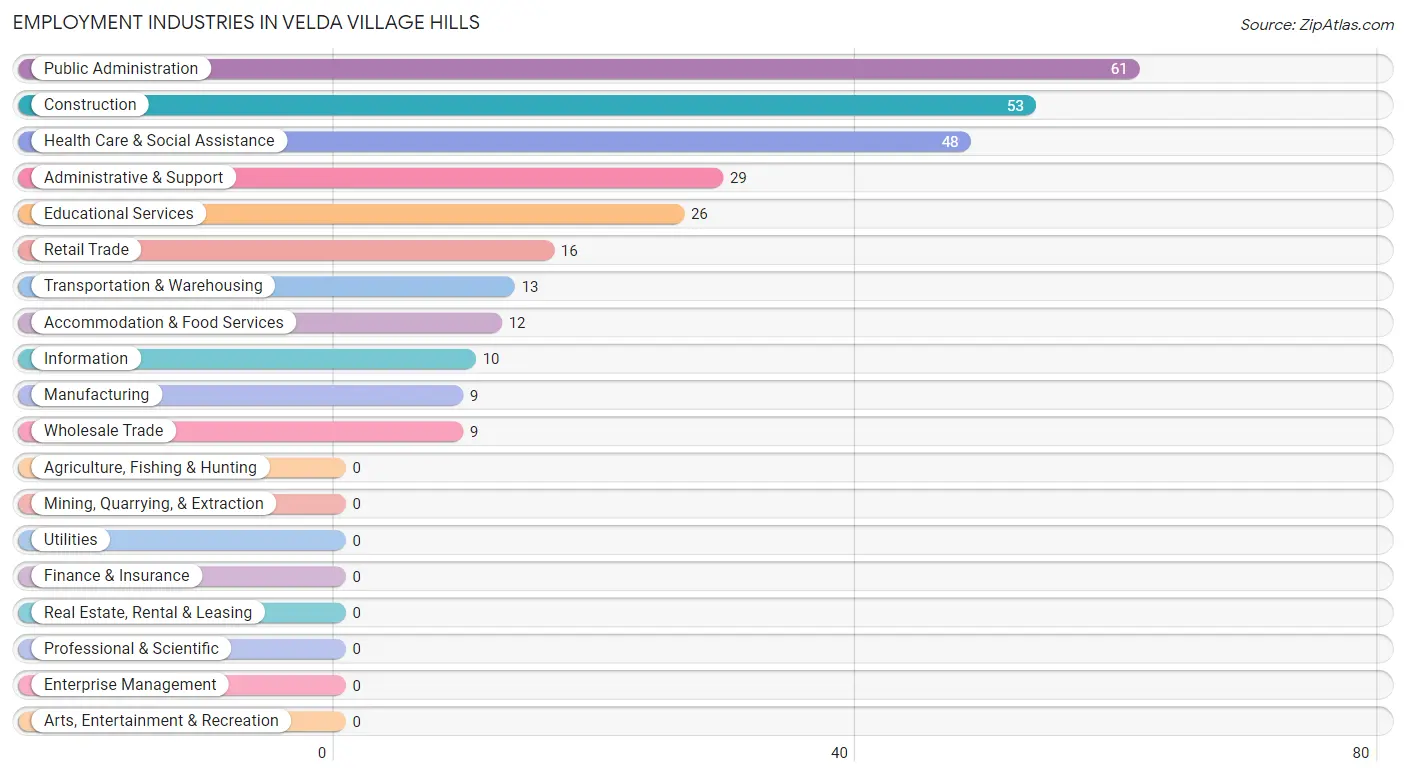
Employment Industries in Velda Village Hills
The major employment industries in Velda Village Hills include Public Administration (61 | 18.6%), Construction (53 | 16.2%), Health Care & Social Assistance (48 | 14.6%), Administrative & Support (29 | 8.8%), and Educational Services (26 | 7.9%).
Employment Industries by Sex in Velda Village Hills
The Velda Village Hills industries that see more men than women are Construction (100.0%), Information (100.0%), and Manufacturing (66.7%), whereas the industries that tend to have a higher number of women are Wholesale Trade (100.0%), Public Administration (100.0%), and Health Care & Social Assistance (95.8%).
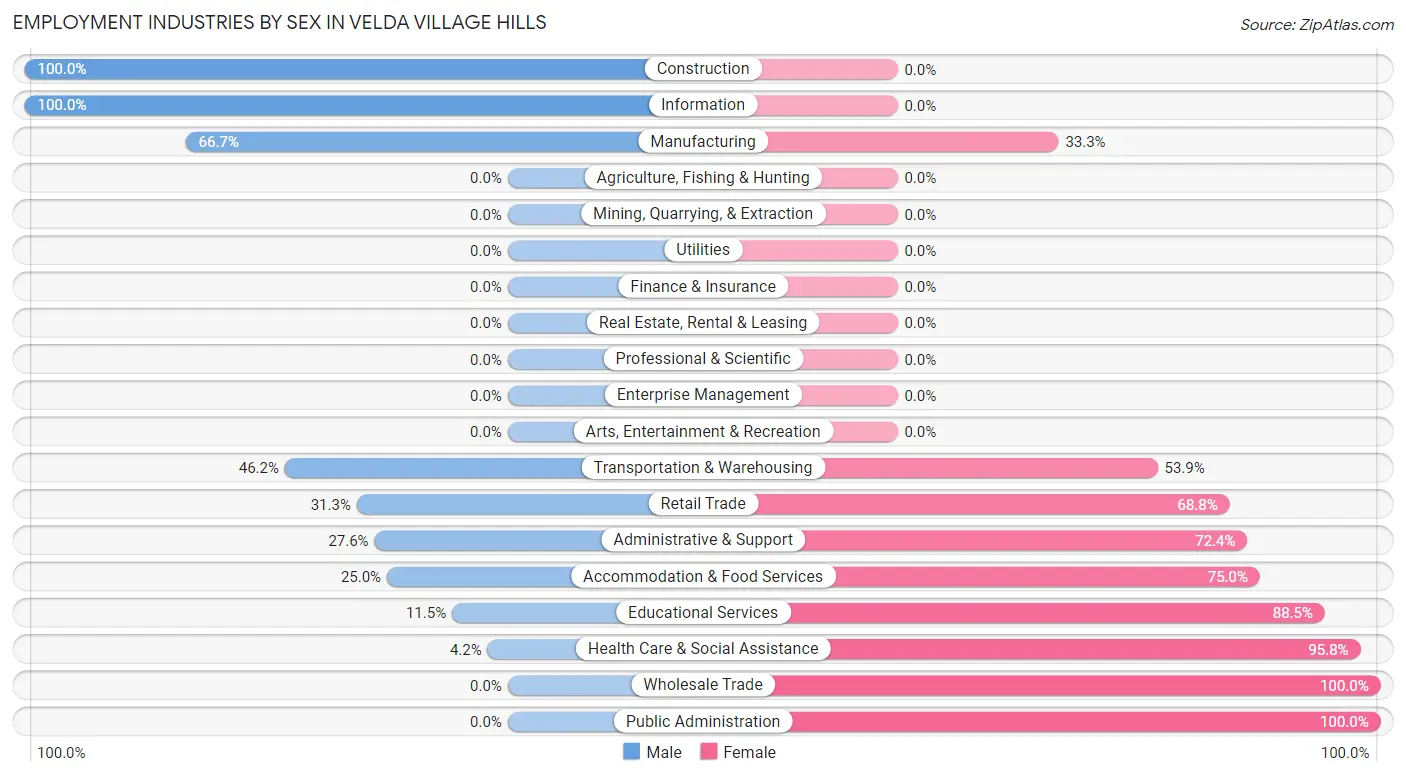
| Industry | Male | Female |
| Agriculture, Fishing & Hunting | 0 (0.0%) | 0 (0.0%) |
| Mining, Quarrying, & Extraction | 0 (0.0%) | 0 (0.0%) |
| Construction | 53 (100.0%) | 0 (0.0%) |
| Manufacturing | 6 (66.7%) | 3 (33.3%) |
| Wholesale Trade | 0 (0.0%) | 9 (100.0%) |
| Retail Trade | 5 (31.2%) | 11 (68.8%) |
| Transportation & Warehousing | 6 (46.2%) | 7 (53.8%) |
| Utilities | 0 (0.0%) | 0 (0.0%) |
| Information | 10 (100.0%) | 0 (0.0%) |
| Finance & Insurance | 0 (0.0%) | 0 (0.0%) |
| Real Estate, Rental & Leasing | 0 (0.0%) | 0 (0.0%) |
| Professional & Scientific | 0 (0.0%) | 0 (0.0%) |
| Enterprise Management | 0 (0.0%) | 0 (0.0%) |
| Administrative & Support | 8 (27.6%) | 21 (72.4%) |
| Educational Services | 3 (11.5%) | 23 (88.5%) |
| Health Care & Social Assistance | 2 (4.2%) | 46 (95.8%) |
| Arts, Entertainment & Recreation | 0 (0.0%) | 0 (0.0%) |
| Accommodation & Food Services | 3 (25.0%) | 9 (75.0%) |
| Public Administration | 0 (0.0%) | 61 (100.0%) |
| Total | 99 (30.2%) | 229 (69.8%) |
Education in Velda Village Hills
School Enrollment in Velda Village Hills
The most common levels of schooling among the 107 students in Velda Village Hills are middle school (31 | 29.0%), nursery / preschool (25 | 23.4%), and high school (25 | 23.4%).
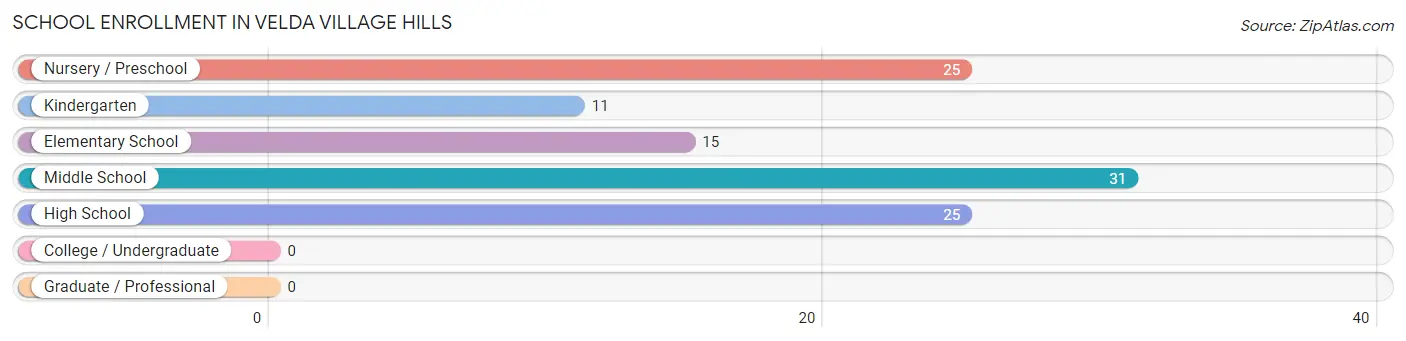
| School Level | # Students | % Students |
| Nursery / Preschool | 25 | 23.4% |
| Kindergarten | 11 | 10.3% |
| Elementary School | 15 | 14.0% |
| Middle School | 31 | 29.0% |
| High School | 25 | 23.4% |
| College / Undergraduate | 0 | 0.0% |
| Graduate / Professional | 0 | 0.0% |
| Total | 107 | 100.0% |
School Enrollment by Age by Funding Source in Velda Village Hills
Out of a total of 107 students who are enrolled in schools in Velda Village Hills, 25 (23.4%) attend a private institution, while the remaining 82 (76.6%) are enrolled in public schools. The age group of 15 to 17 year olds has the highest likelihood of being enrolled in private schools, with 15 (60.0% in the age bracket) enrolled. Conversely, the age group of 3 to 4 year olds has the lowest likelihood of being enrolled in a private school, with 25 (100.0% in the age bracket) attending a public institution.
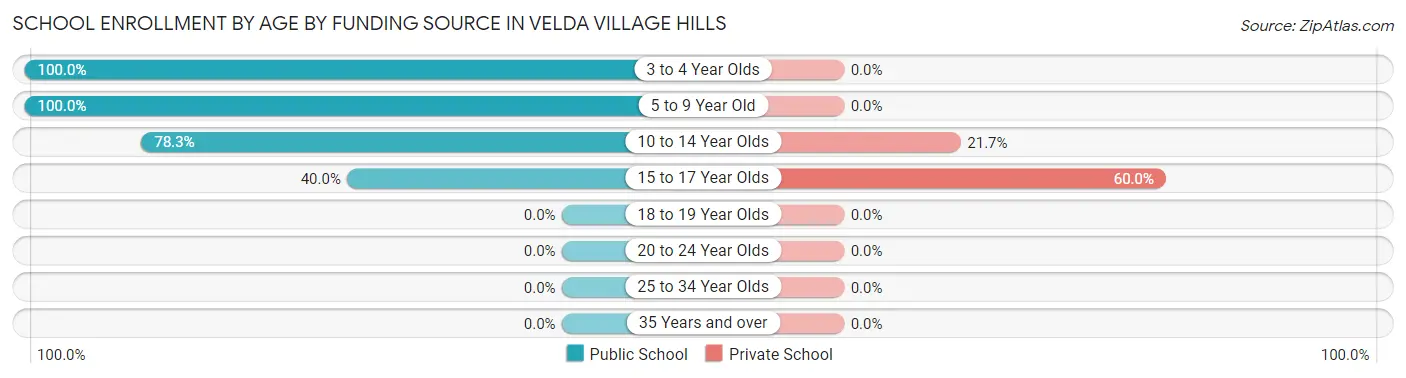
| Age Bracket | Public School | Private School |
| 3 to 4 Year Olds | 25 (100.0%) | 0 (0.0%) |
| 5 to 9 Year Old | 11 (100.0%) | 0 (0.0%) |
| 10 to 14 Year Olds | 36 (78.3%) | 10 (21.7%) |
| 15 to 17 Year Olds | 10 (40.0%) | 15 (60.0%) |
| 18 to 19 Year Olds | 0 (0.0%) | 0 (0.0%) |
| 20 to 24 Year Olds | 0 (0.0%) | 0 (0.0%) |
| 25 to 34 Year Olds | 0 (0.0%) | 0 (0.0%) |
| 35 Years and over | 0 (0.0%) | 0 (0.0%) |
| Total | 82 (76.6%) | 25 (23.4%) |
Educational Attainment by Field of Study in Velda Village Hills
Computers & mathematics (52 | 48.6%), science & technology (18 | 16.8%), business (13 | 12.1%), education (9 | 8.4%), and visual & performing arts (7 | 6.5%) are the most common fields of study among 107 individuals in Velda Village Hills who have obtained a bachelor's degree or higher.
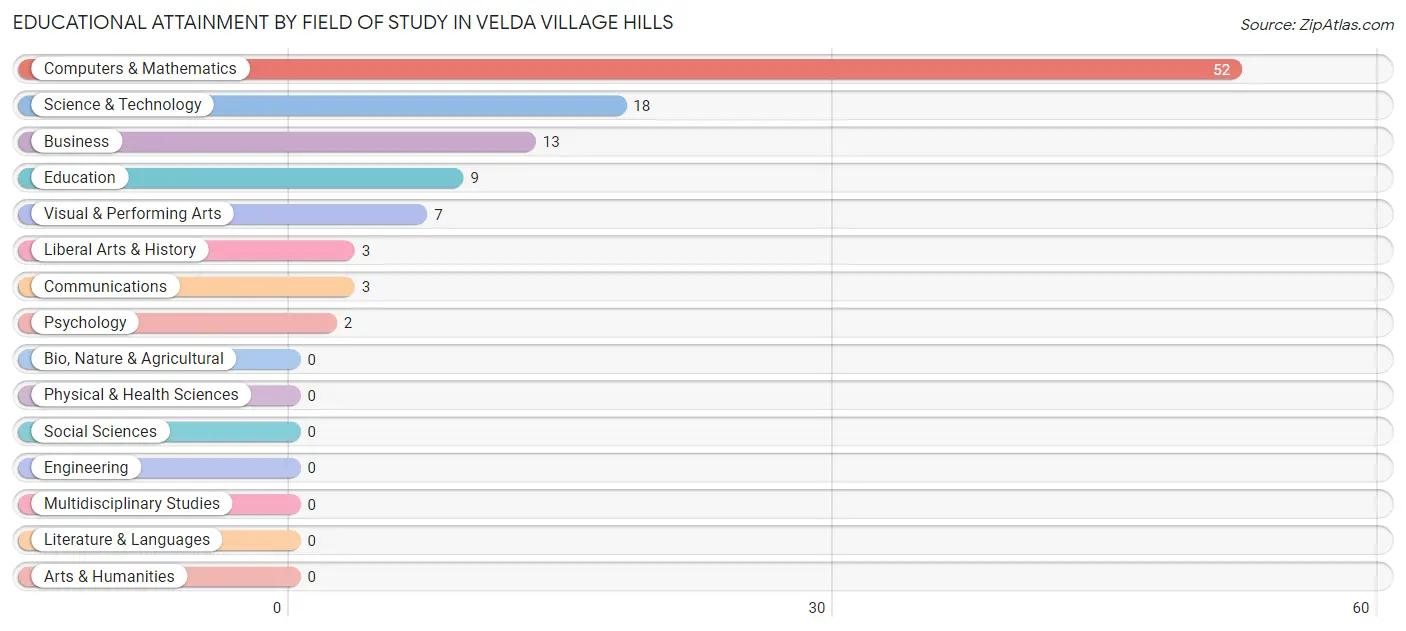
| Field of Study | # Graduates | % Graduates |
| Computers & Mathematics | 52 | 48.6% |
| Bio, Nature & Agricultural | 0 | 0.0% |
| Physical & Health Sciences | 0 | 0.0% |
| Psychology | 2 | 1.9% |
| Social Sciences | 0 | 0.0% |
| Engineering | 0 | 0.0% |
| Multidisciplinary Studies | 0 | 0.0% |
| Science & Technology | 18 | 16.8% |
| Business | 13 | 12.1% |
| Education | 9 | 8.4% |
| Literature & Languages | 0 | 0.0% |
| Liberal Arts & History | 3 | 2.8% |
| Visual & Performing Arts | 7 | 6.5% |
| Communications | 3 | 2.8% |
| Arts & Humanities | 0 | 0.0% |
| Total | 107 | 100.0% |
Transportation & Commute in Velda Village Hills
Vehicle Availability by Sex in Velda Village Hills
The most prevalent vehicle ownership categories in Velda Village Hills are males with 2 vehicles (65, accounting for 65.7%) and females with 2 vehicles (102, making up 28.9%).
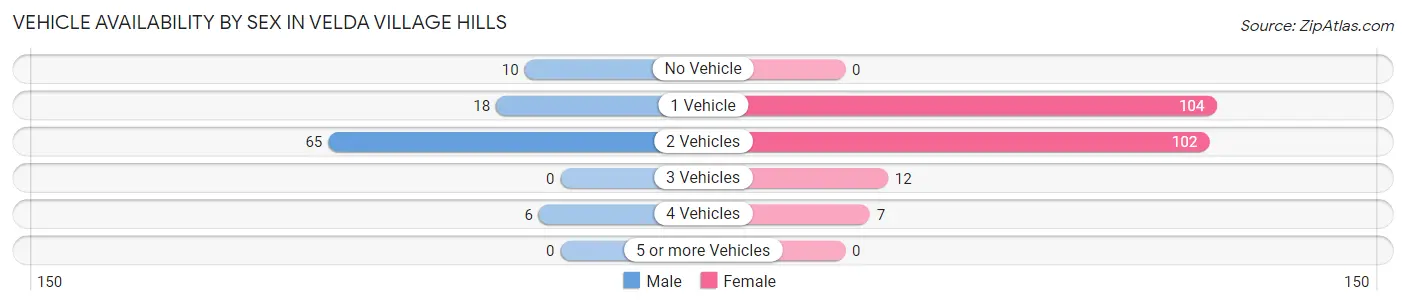
| Vehicles Available | Male | Female |
| No Vehicle | 10 (10.1%) | 0 (0.0%) |
| 1 Vehicle | 18 (18.2%) | 104 (46.2%) |
| 2 Vehicles | 65 (65.7%) | 102 (45.3%) |
| 3 Vehicles | 0 (0.0%) | 12 (5.3%) |
| 4 Vehicles | 6 (6.1%) | 7 (3.1%) |
| 5 or more Vehicles | 0 (0.0%) | 0 (0.0%) |
| Total | 99 (100.0%) | 225 (100.0%) |
Commute Time in Velda Village Hills
The most frequently occuring commute durations in Velda Village Hills are 20 to 24 minutes (100 commuters, 38.8%), 15 to 19 minutes (79 commuters, 30.6%), and 30 to 34 minutes (45 commuters, 17.4%).
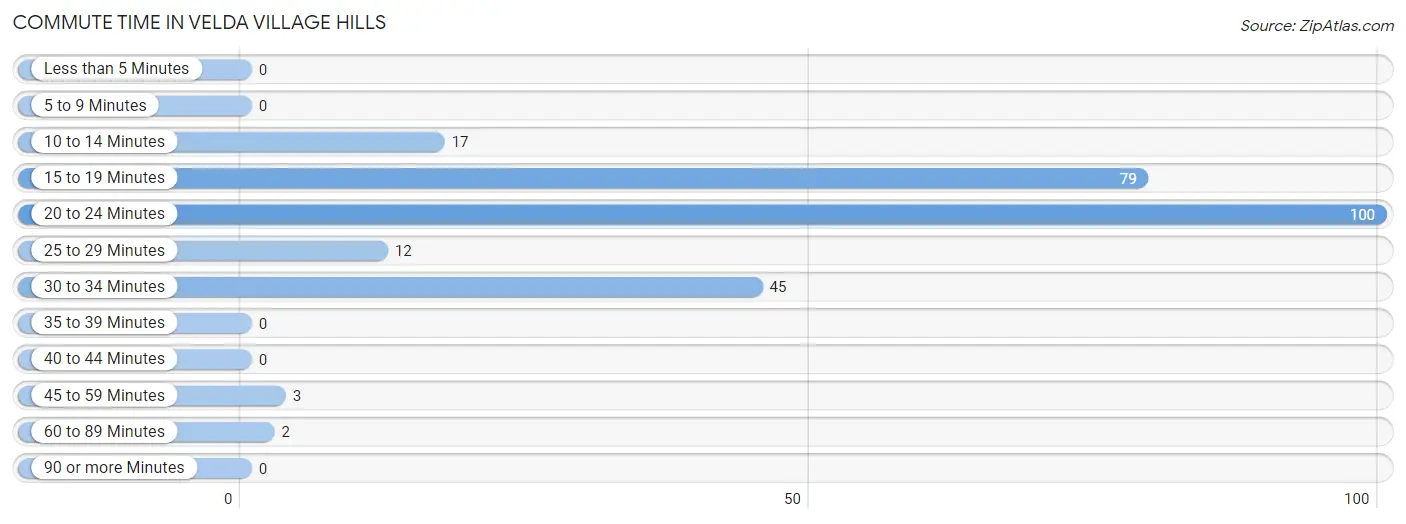
| Commute Time | # Commuters | % Commuters |
| Less than 5 Minutes | 0 | 0.0% |
| 5 to 9 Minutes | 0 | 0.0% |
| 10 to 14 Minutes | 17 | 6.6% |
| 15 to 19 Minutes | 79 | 30.6% |
| 20 to 24 Minutes | 100 | 38.8% |
| 25 to 29 Minutes | 12 | 4.6% |
| 30 to 34 Minutes | 45 | 17.4% |
| 35 to 39 Minutes | 0 | 0.0% |
| 40 to 44 Minutes | 0 | 0.0% |
| 45 to 59 Minutes | 3 | 1.2% |
| 60 to 89 Minutes | 2 | 0.8% |
| 90 or more Minutes | 0 | 0.0% |
Commute Time by Sex in Velda Village Hills
The most common commute times in Velda Village Hills are 15 to 19 minutes (32 commuters, 32.3%) for males and 20 to 24 minutes (76 commuters, 47.8%) for females.
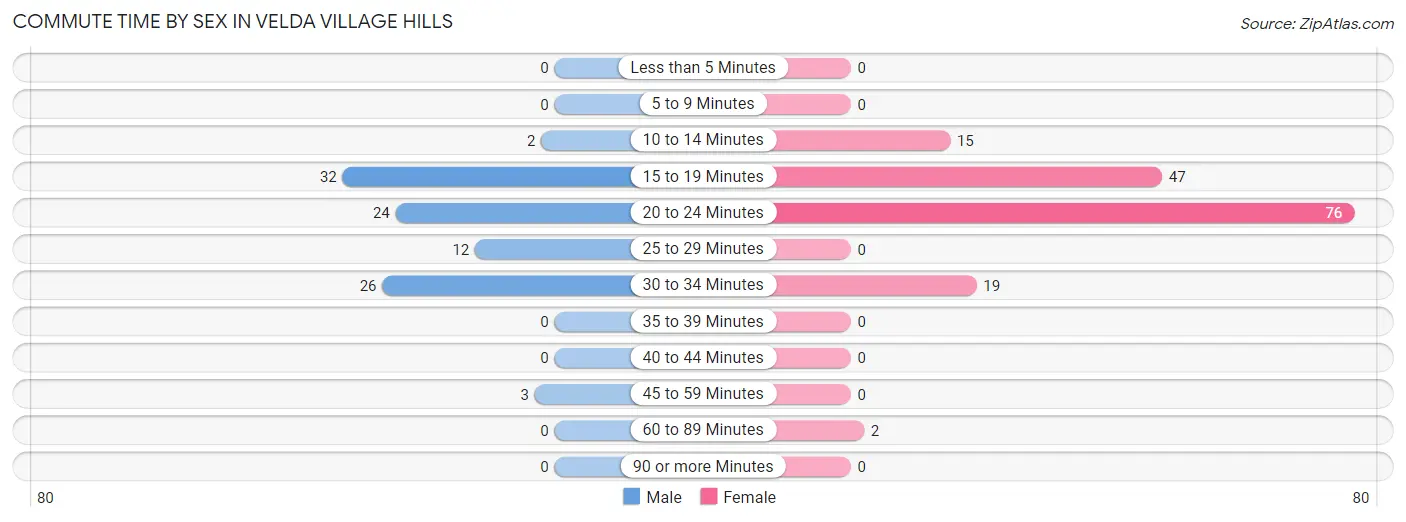
| Commute Time | Male | Female |
| Less than 5 Minutes | 0 (0.0%) | 0 (0.0%) |
| 5 to 9 Minutes | 0 (0.0%) | 0 (0.0%) |
| 10 to 14 Minutes | 2 (2.0%) | 15 (9.4%) |
| 15 to 19 Minutes | 32 (32.3%) | 47 (29.6%) |
| 20 to 24 Minutes | 24 (24.2%) | 76 (47.8%) |
| 25 to 29 Minutes | 12 (12.1%) | 0 (0.0%) |
| 30 to 34 Minutes | 26 (26.3%) | 19 (11.9%) |
| 35 to 39 Minutes | 0 (0.0%) | 0 (0.0%) |
| 40 to 44 Minutes | 0 (0.0%) | 0 (0.0%) |
| 45 to 59 Minutes | 3 (3.0%) | 0 (0.0%) |
| 60 to 89 Minutes | 0 (0.0%) | 2 (1.3%) |
| 90 or more Minutes | 0 (0.0%) | 0 (0.0%) |
Time of Departure to Work by Sex in Velda Village Hills
The most frequent times of departure to work in Velda Village Hills are 8:00 AM to 8:29 AM (36, 36.4%) for males and 8:00 AM to 8:29 AM (37, 23.3%) for females.
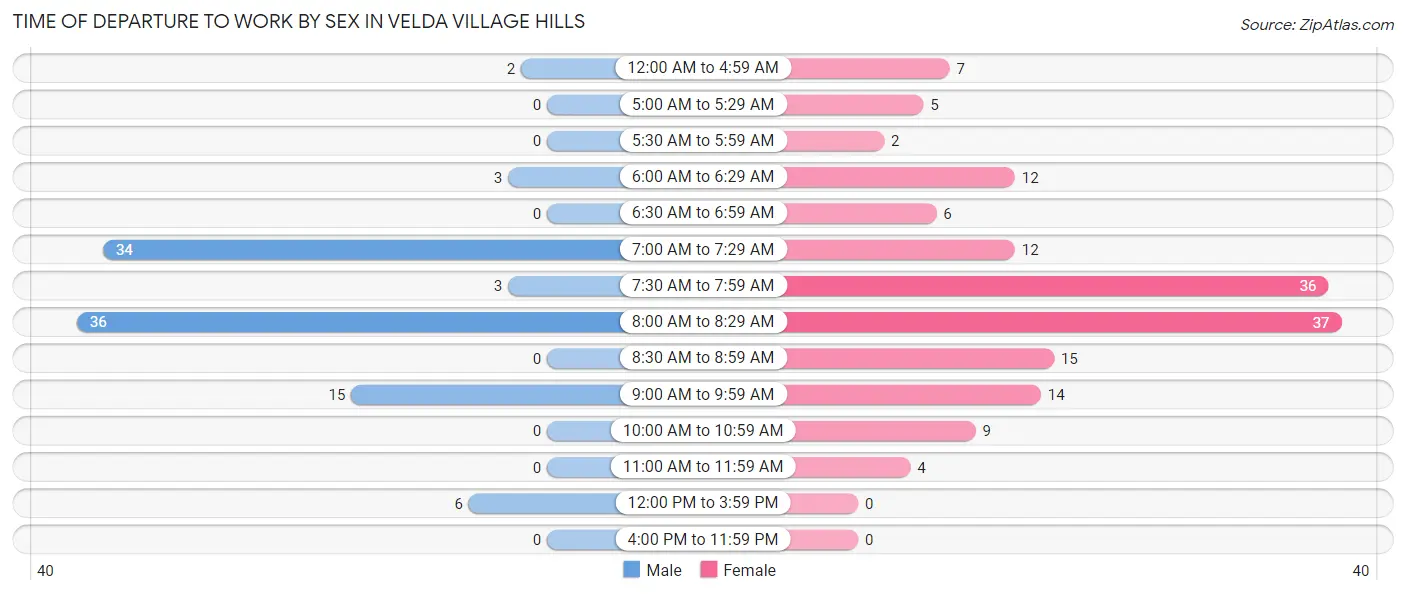
| Time of Departure | Male | Female |
| 12:00 AM to 4:59 AM | 2 (2.0%) | 7 (4.4%) |
| 5:00 AM to 5:29 AM | 0 (0.0%) | 5 (3.1%) |
| 5:30 AM to 5:59 AM | 0 (0.0%) | 2 (1.3%) |
| 6:00 AM to 6:29 AM | 3 (3.0%) | 12 (7.5%) |
| 6:30 AM to 6:59 AM | 0 (0.0%) | 6 (3.8%) |
| 7:00 AM to 7:29 AM | 34 (34.3%) | 12 (7.5%) |
| 7:30 AM to 7:59 AM | 3 (3.0%) | 36 (22.6%) |
| 8:00 AM to 8:29 AM | 36 (36.4%) | 37 (23.3%) |
| 8:30 AM to 8:59 AM | 0 (0.0%) | 15 (9.4%) |
| 9:00 AM to 9:59 AM | 15 (15.1%) | 14 (8.8%) |
| 10:00 AM to 10:59 AM | 0 (0.0%) | 9 (5.7%) |
| 11:00 AM to 11:59 AM | 0 (0.0%) | 4 (2.5%) |
| 12:00 PM to 3:59 PM | 6 (6.1%) | 0 (0.0%) |
| 4:00 PM to 11:59 PM | 0 (0.0%) | 0 (0.0%) |
| Total | 99 (100.0%) | 159 (100.0%) |
Housing Occupancy in Velda Village Hills
Occupancy by Ownership in Velda Village Hills
Of the total 372 dwellings in Velda Village Hills, owner-occupied units account for 212 (57.0%), while renter-occupied units make up 160 (43.0%).
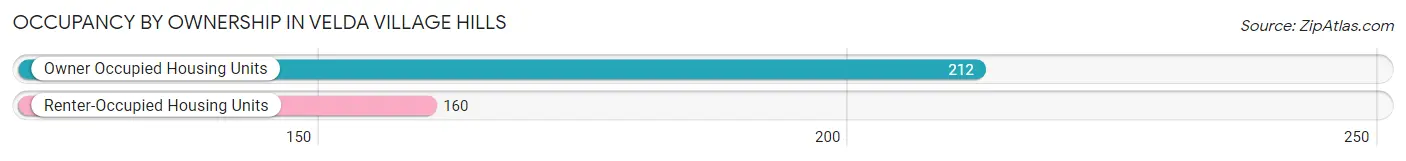
| Occupancy | # Housing Units | % Housing Units |
| Owner Occupied Housing Units | 212 | 57.0% |
| Renter-Occupied Housing Units | 160 | 43.0% |
| Total Occupied Housing Units | 372 | 100.0% |
Occupancy by Household Size in Velda Village Hills
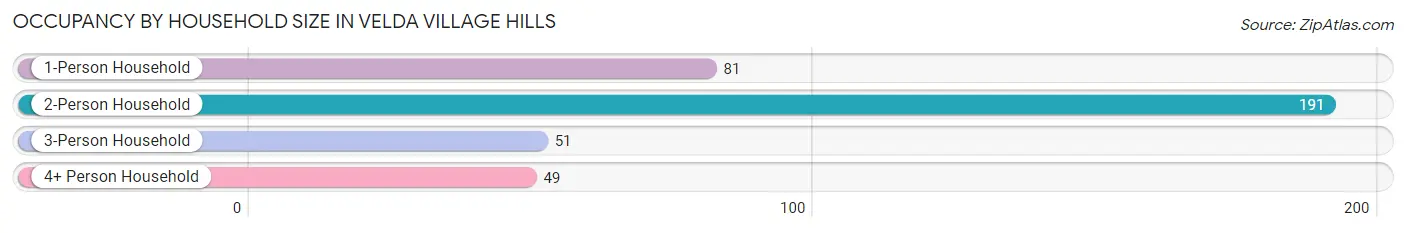
| Household Size | # Housing Units | % Housing Units |
| 1-Person Household | 81 | 21.8% |
| 2-Person Household | 191 | 51.3% |
| 3-Person Household | 51 | 13.7% |
| 4+ Person Household | 49 | 13.2% |
| Total Housing Units | 372 | 100.0% |
Occupancy by Ownership by Household Size in Velda Village Hills
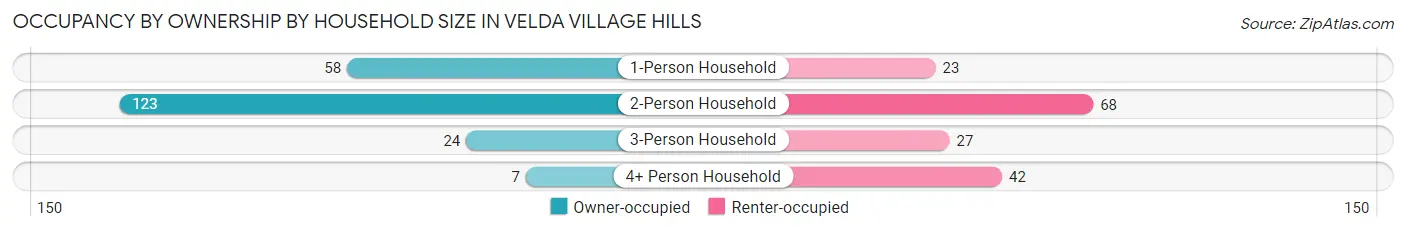
| Household Size | Owner-occupied | Renter-occupied |
| 1-Person Household | 58 (71.6%) | 23 (28.4%) |
| 2-Person Household | 123 (64.4%) | 68 (35.6%) |
| 3-Person Household | 24 (47.1%) | 27 (52.9%) |
| 4+ Person Household | 7 (14.3%) | 42 (85.7%) |
| Total Housing Units | 212 (57.0%) | 160 (43.0%) |
Occupancy by Educational Attainment in Velda Village Hills
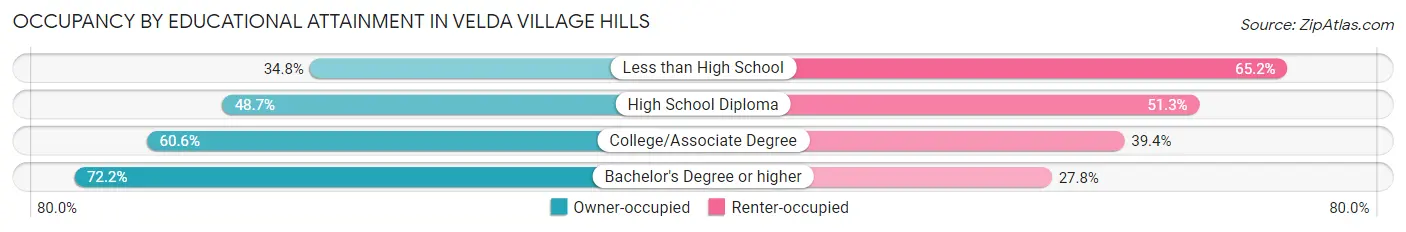
| Household Size | Owner-occupied | Renter-occupied |
| Less than High School | 8 (34.8%) | 15 (65.2%) |
| High School Diploma | 77 (48.7%) | 81 (51.3%) |
| College/Associate Degree | 57 (60.6%) | 37 (39.4%) |
| Bachelor's Degree or higher | 70 (72.2%) | 27 (27.8%) |
Occupancy by Age of Householder in Velda Village Hills
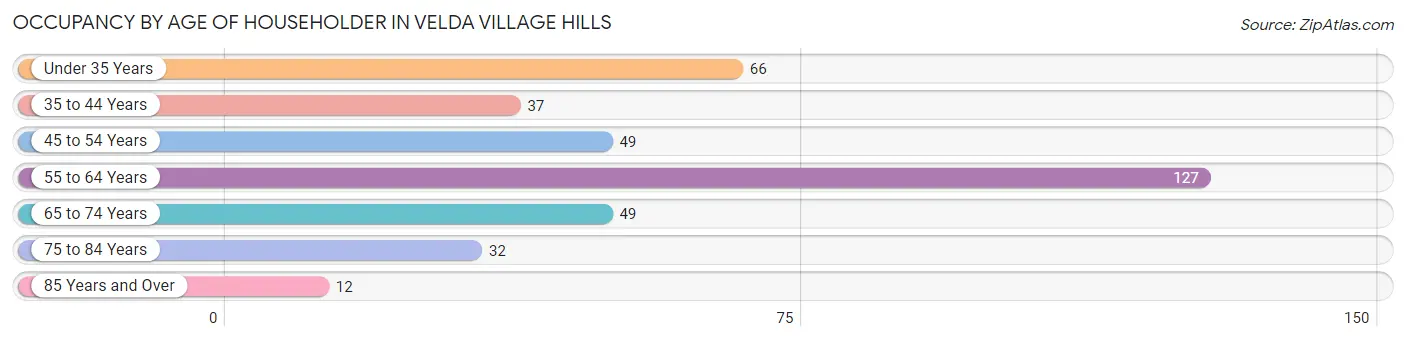
| Age Bracket | # Households | % Households |
| Under 35 Years | 66 | 17.7% |
| 35 to 44 Years | 37 | 10.0% |
| 45 to 54 Years | 49 | 13.2% |
| 55 to 64 Years | 127 | 34.1% |
| 65 to 74 Years | 49 | 13.2% |
| 75 to 84 Years | 32 | 8.6% |
| 85 Years and Over | 12 | 3.2% |
| Total | 372 | 100.0% |
Housing Finances in Velda Village Hills
Median Income by Occupancy in Velda Village Hills
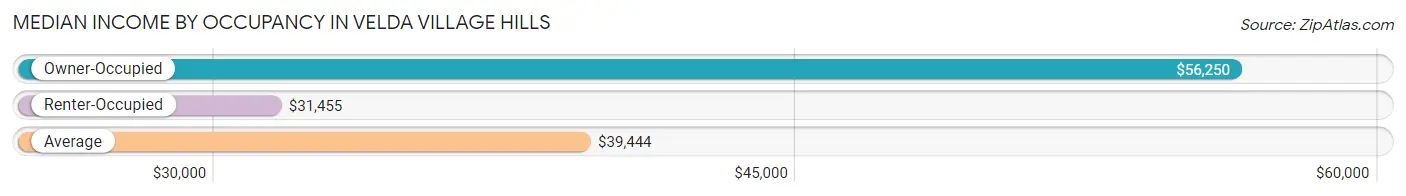
| Occupancy Type | # Households | Median Income |
| Owner-Occupied | 212 (57.0%) | $56,250 |
| Renter-Occupied | 160 (43.0%) | $31,455 |
| Average | 372 (100.0%) | $39,444 |
Occupancy by Householder Income Bracket in Velda Village Hills
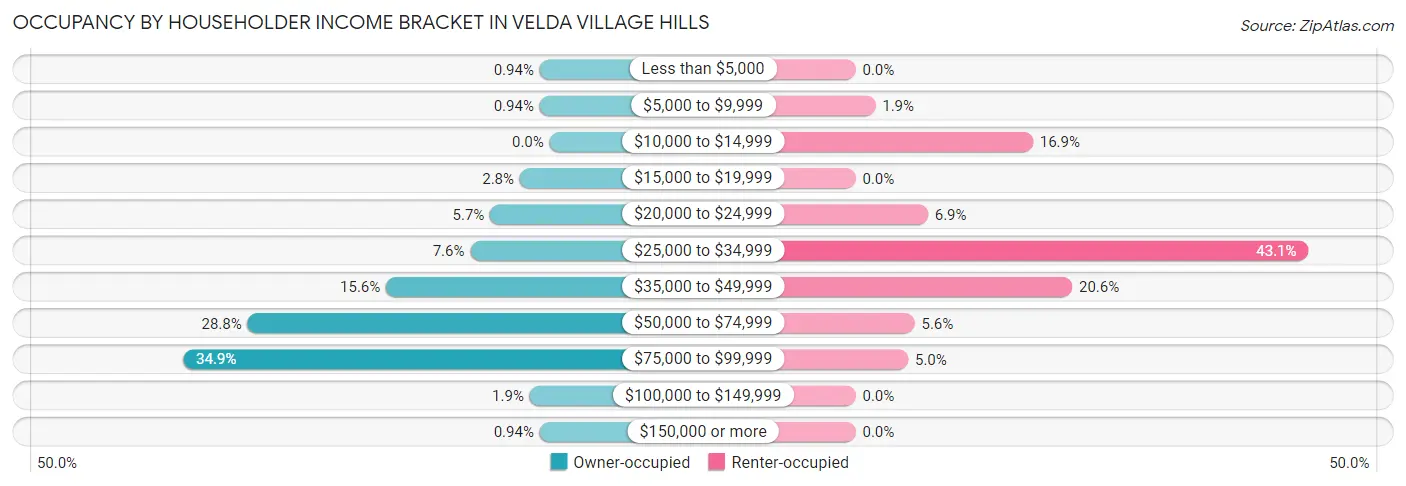
| Income Bracket | Owner-occupied | Renter-occupied |
| Less than $5,000 | 2 (0.9%) | 0 (0.0%) |
| $5,000 to $9,999 | 2 (0.9%) | 3 (1.9%) |
| $10,000 to $14,999 | 0 (0.0%) | 27 (16.9%) |
| $15,000 to $19,999 | 6 (2.8%) | 0 (0.0%) |
| $20,000 to $24,999 | 12 (5.7%) | 11 (6.9%) |
| $25,000 to $34,999 | 16 (7.5%) | 69 (43.1%) |
| $35,000 to $49,999 | 33 (15.6%) | 33 (20.6%) |
| $50,000 to $74,999 | 61 (28.8%) | 9 (5.6%) |
| $75,000 to $99,999 | 74 (34.9%) | 8 (5.0%) |
| $100,000 to $149,999 | 4 (1.9%) | 0 (0.0%) |
| $150,000 or more | 2 (0.9%) | 0 (0.0%) |
| Total | 212 (100.0%) | 160 (100.0%) |
Monthly Housing Cost Tiers in Velda Village Hills
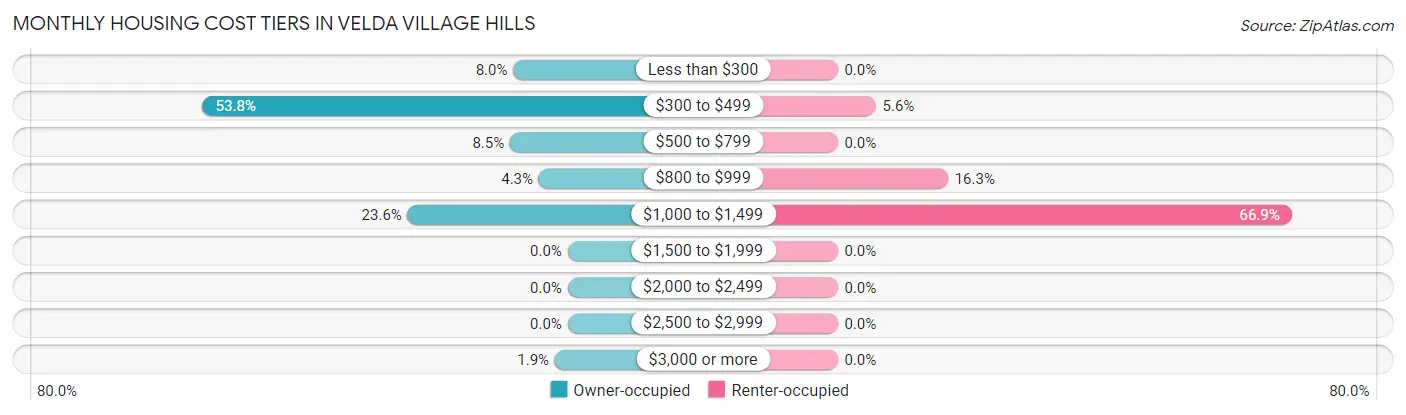
| Monthly Cost | Owner-occupied | Renter-occupied |
| Less than $300 | 17 (8.0%) | 0 (0.0%) |
| $300 to $499 | 114 (53.8%) | 9 (5.6%) |
| $500 to $799 | 18 (8.5%) | 0 (0.0%) |
| $800 to $999 | 9 (4.3%) | 26 (16.3%) |
| $1,000 to $1,499 | 50 (23.6%) | 107 (66.9%) |
| $1,500 to $1,999 | 0 (0.0%) | 0 (0.0%) |
| $2,000 to $2,499 | 0 (0.0%) | 0 (0.0%) |
| $2,500 to $2,999 | 0 (0.0%) | 0 (0.0%) |
| $3,000 or more | 4 (1.9%) | 0 (0.0%) |
| Total | 212 (100.0%) | 160 (100.0%) |
Physical Housing Characteristics in Velda Village Hills
Housing Structures in Velda Village Hills
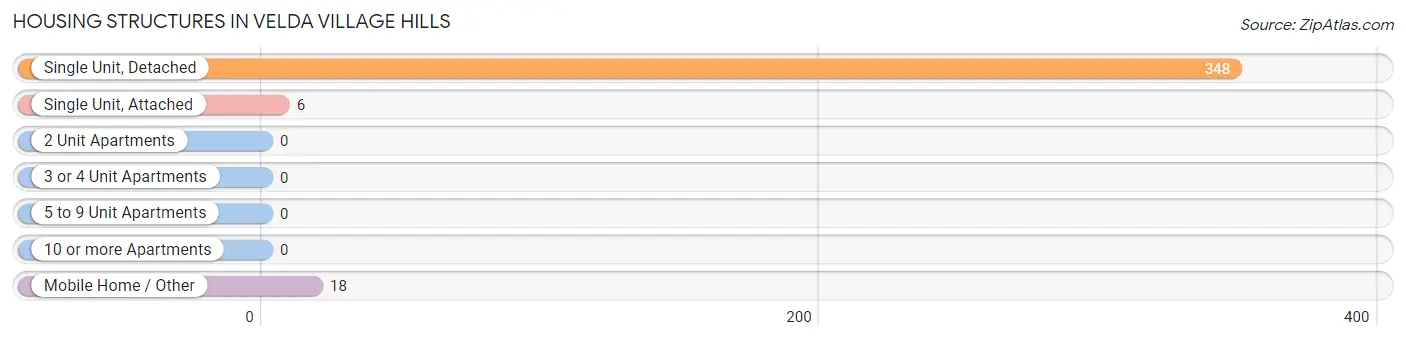
| Structure Type | # Housing Units | % Housing Units |
| Single Unit, Detached | 348 | 93.5% |
| Single Unit, Attached | 6 | 1.6% |
| 2 Unit Apartments | 0 | 0.0% |
| 3 or 4 Unit Apartments | 0 | 0.0% |
| 5 to 9 Unit Apartments | 0 | 0.0% |
| 10 or more Apartments | 0 | 0.0% |
| Mobile Home / Other | 18 | 4.8% |
| Total | 372 | 100.0% |
Housing Structures by Occupancy in Velda Village Hills
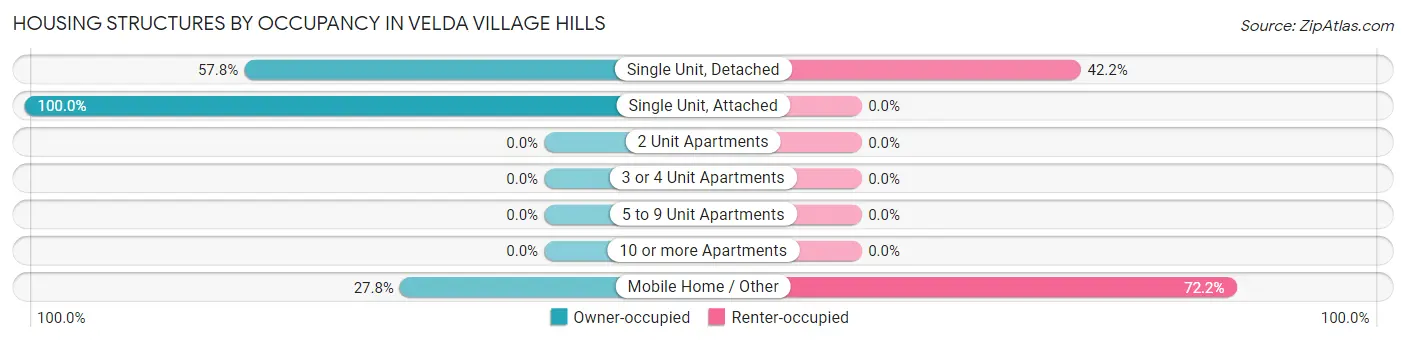
| Structure Type | Owner-occupied | Renter-occupied |
| Single Unit, Detached | 201 (57.8%) | 147 (42.2%) |
| Single Unit, Attached | 6 (100.0%) | 0 (0.0%) |
| 2 Unit Apartments | 0 (0.0%) | 0 (0.0%) |
| 3 or 4 Unit Apartments | 0 (0.0%) | 0 (0.0%) |
| 5 to 9 Unit Apartments | 0 (0.0%) | 0 (0.0%) |
| 10 or more Apartments | 0 (0.0%) | 0 (0.0%) |
| Mobile Home / Other | 5 (27.8%) | 13 (72.2%) |
| Total | 212 (57.0%) | 160 (43.0%) |
Housing Structures by Number of Rooms in Velda Village Hills
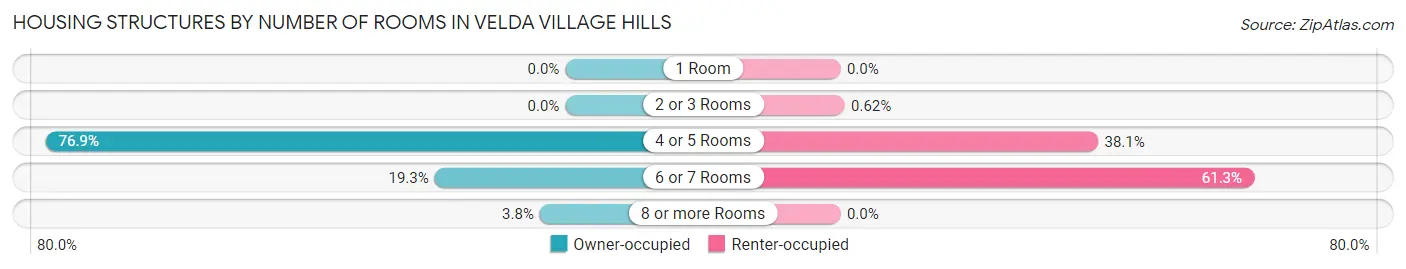
| Number of Rooms | Owner-occupied | Renter-occupied |
| 1 Room | 0 (0.0%) | 0 (0.0%) |
| 2 or 3 Rooms | 0 (0.0%) | 1 (0.6%) |
| 4 or 5 Rooms | 163 (76.9%) | 61 (38.1%) |
| 6 or 7 Rooms | 41 (19.3%) | 98 (61.3%) |
| 8 or more Rooms | 8 (3.8%) | 0 (0.0%) |
| Total | 212 (100.0%) | 160 (100.0%) |
Housing Structure by Heating Type in Velda Village Hills
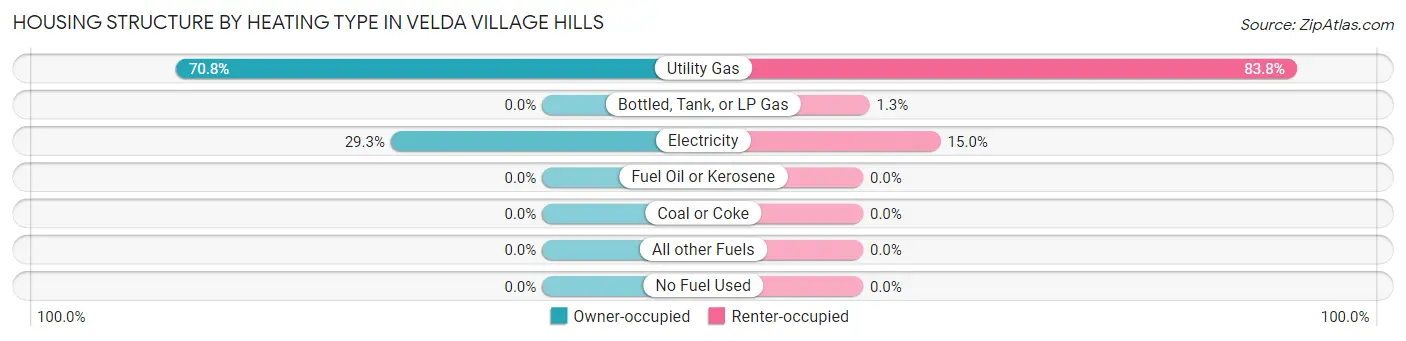
| Heating Type | Owner-occupied | Renter-occupied |
| Utility Gas | 150 (70.8%) | 134 (83.8%) |
| Bottled, Tank, or LP Gas | 0 (0.0%) | 2 (1.3%) |
| Electricity | 62 (29.2%) | 24 (15.0%) |
| Fuel Oil or Kerosene | 0 (0.0%) | 0 (0.0%) |
| Coal or Coke | 0 (0.0%) | 0 (0.0%) |
| All other Fuels | 0 (0.0%) | 0 (0.0%) |
| No Fuel Used | 0 (0.0%) | 0 (0.0%) |
| Total | 212 (100.0%) | 160 (100.0%) |
Household Vehicle Usage in Velda Village Hills
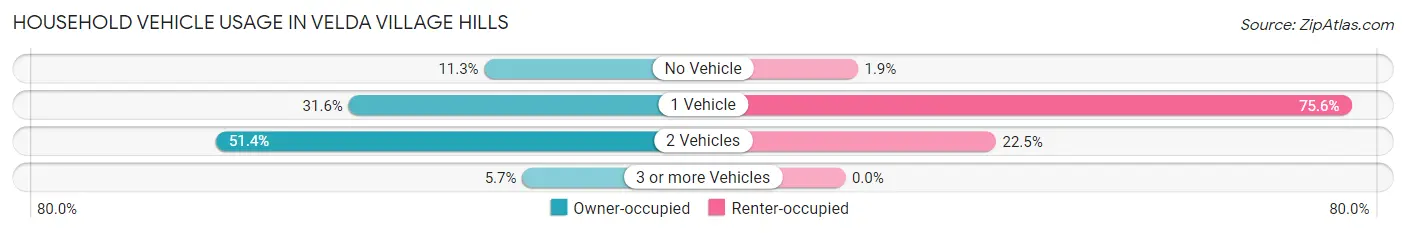
| Vehicles per Household | Owner-occupied | Renter-occupied |
| No Vehicle | 24 (11.3%) | 3 (1.9%) |
| 1 Vehicle | 67 (31.6%) | 121 (75.6%) |
| 2 Vehicles | 109 (51.4%) | 36 (22.5%) |
| 3 or more Vehicles | 12 (5.7%) | 0 (0.0%) |
| Total | 212 (100.0%) | 160 (100.0%) |
Real Estate & Mortgages in Velda Village Hills
Real Estate and Mortgage Overview in Velda Village Hills
| Characteristic | Without Mortgage | With Mortgage |
| Housing Units | 135 | 77 |
| Median Property Value | $40,900 | $50,900 |
| Median Household Income | $75,457 | $0 |
| Monthly Housing Costs | $380 | $2 |
| Real Estate Taxes | $805 | $3 |
Property Value by Mortgage Status in Velda Village Hills
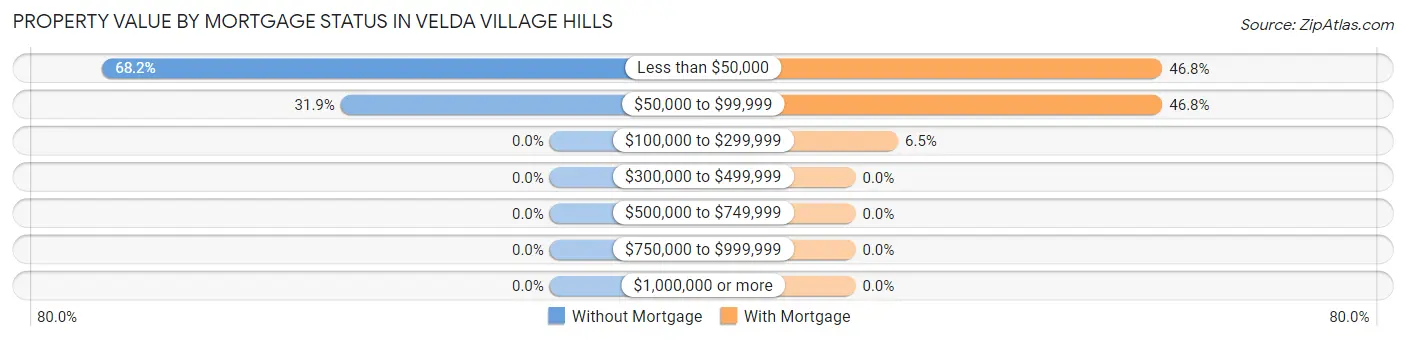
| Property Value | Without Mortgage | With Mortgage |
| Less than $50,000 | 92 (68.1%) | 36 (46.8%) |
| $50,000 to $99,999 | 43 (31.9%) | 36 (46.8%) |
| $100,000 to $299,999 | 0 (0.0%) | 5 (6.5%) |
| $300,000 to $499,999 | 0 (0.0%) | 0 (0.0%) |
| $500,000 to $749,999 | 0 (0.0%) | 0 (0.0%) |
| $750,000 to $999,999 | 0 (0.0%) | 0 (0.0%) |
| $1,000,000 or more | 0 (0.0%) | 0 (0.0%) |
| Total | 135 (100.0%) | 77 (100.0%) |
Household Income by Mortgage Status in Velda Village Hills
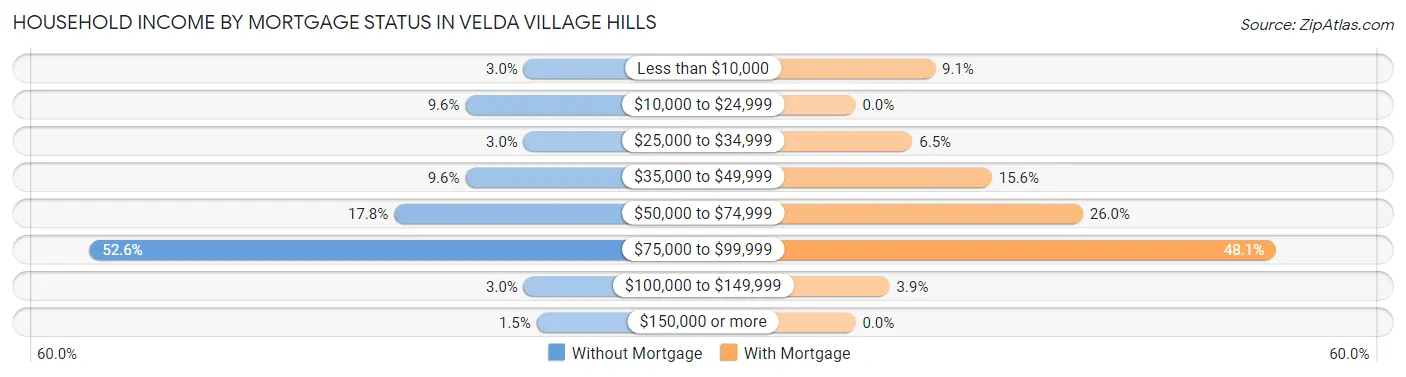
| Household Income | Without Mortgage | With Mortgage |
| Less than $10,000 | 4 (3.0%) | 7 (9.1%) |
| $10,000 to $24,999 | 13 (9.6%) | 0 (0.0%) |
| $25,000 to $34,999 | 4 (3.0%) | 5 (6.5%) |
| $35,000 to $49,999 | 13 (9.6%) | 12 (15.6%) |
| $50,000 to $74,999 | 24 (17.8%) | 20 (26.0%) |
| $75,000 to $99,999 | 71 (52.6%) | 37 (48.0%) |
| $100,000 to $149,999 | 4 (3.0%) | 3 (3.9%) |
| $150,000 or more | 2 (1.5%) | 0 (0.0%) |
| Total | 135 (100.0%) | 77 (100.0%) |
Property Value to Household Income Ratio in Velda Village Hills
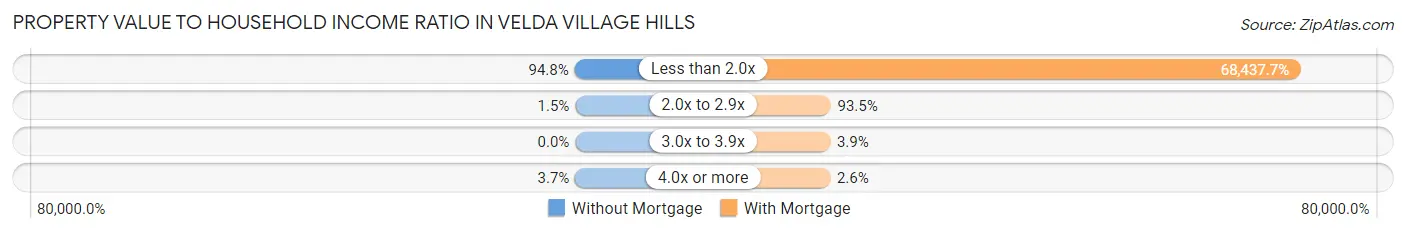
| Value-to-Income Ratio | Without Mortgage | With Mortgage |
| Less than 2.0x | 128 (94.8%) | 52,697 (68,437.7%) |
| 2.0x to 2.9x | 2 (1.5%) | 72 (93.5%) |
| 3.0x to 3.9x | 0 (0.0%) | 3 (3.9%) |
| 4.0x or more | 5 (3.7%) | 2 (2.6%) |
| Total | 135 (100.0%) | 77 (100.0%) |
Real Estate Taxes by Mortgage Status in Velda Village Hills
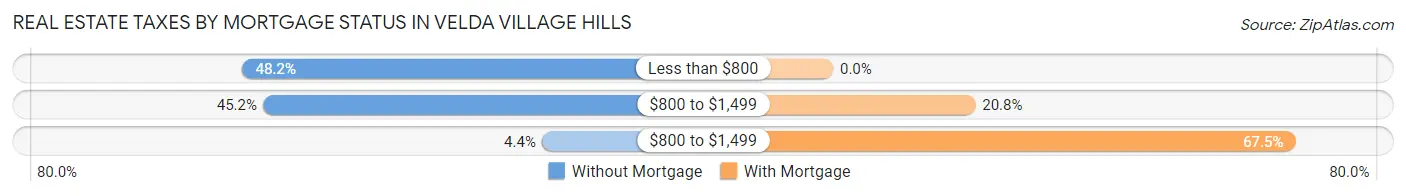
| Property Taxes | Without Mortgage | With Mortgage |
| Less than $800 | 65 (48.1%) | 0 (0.0%) |
| $800 to $1,499 | 61 (45.2%) | 16 (20.8%) |
| $800 to $1,499 | 6 (4.4%) | 52 (67.5%) |
| Total | 135 (100.0%) | 77 (100.0%) |
Health & Disability in Velda Village Hills
Health Insurance Coverage by Age in Velda Village Hills
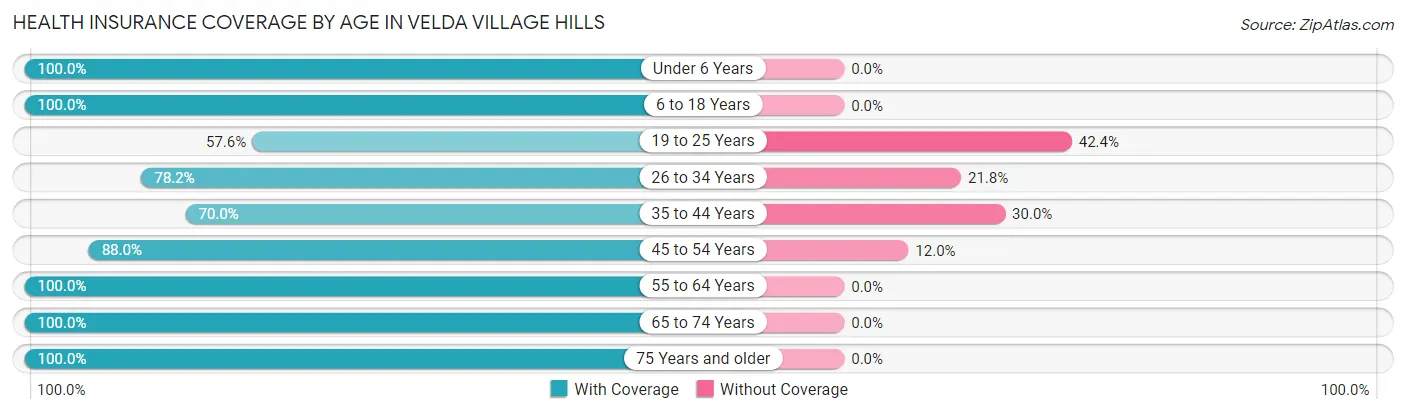
| Age Bracket | With Coverage | Without Coverage |
| Under 6 Years | 117 (100.0%) | 0 (0.0%) |
| 6 to 18 Years | 71 (100.0%) | 0 (0.0%) |
| 19 to 25 Years | 38 (57.6%) | 28 (42.4%) |
| 26 to 34 Years | 79 (78.2%) | 22 (21.8%) |
| 35 to 44 Years | 42 (70.0%) | 18 (30.0%) |
| 45 to 54 Years | 81 (88.0%) | 11 (12.0%) |
| 55 to 64 Years | 183 (100.0%) | 0 (0.0%) |
| 65 to 74 Years | 98 (100.0%) | 0 (0.0%) |
| 75 Years and older | 61 (100.0%) | 0 (0.0%) |
| Total | 770 (90.7%) | 79 (9.3%) |
Health Insurance Coverage by Citizenship Status in Velda Village Hills
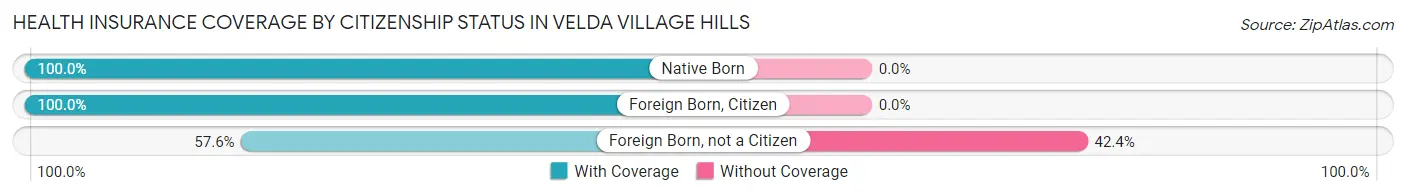
| Citizenship Status | With Coverage | Without Coverage |
| Native Born | 117 (100.0%) | 0 (0.0%) |
| Foreign Born, Citizen | 71 (100.0%) | 0 (0.0%) |
| Foreign Born, not a Citizen | 38 (57.6%) | 28 (42.4%) |
Health Insurance Coverage by Household Income in Velda Village Hills
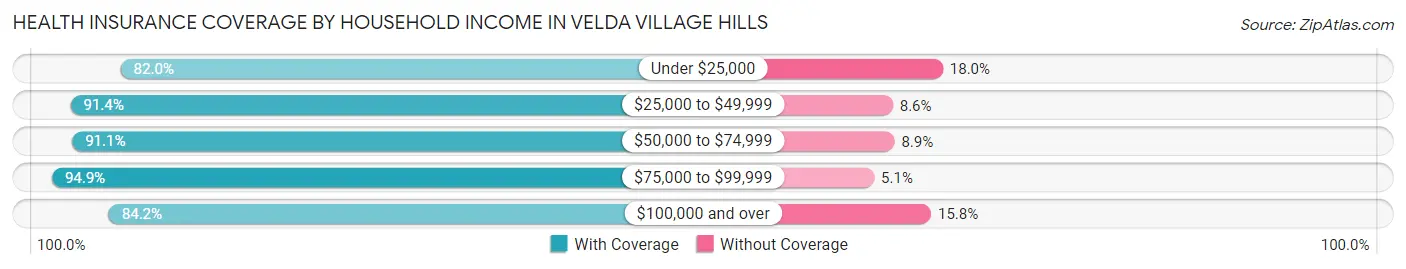
| Household Income | With Coverage | Without Coverage |
| Under $25,000 | 82 (82.0%) | 18 (18.0%) |
| $25,000 to $49,999 | 371 (91.4%) | 35 (8.6%) |
| $50,000 to $74,999 | 153 (91.1%) | 15 (8.9%) |
| $75,000 to $99,999 | 148 (94.9%) | 8 (5.1%) |
| $100,000 and over | 16 (84.2%) | 3 (15.8%) |
Public vs Private Health Insurance Coverage by Age in Velda Village Hills
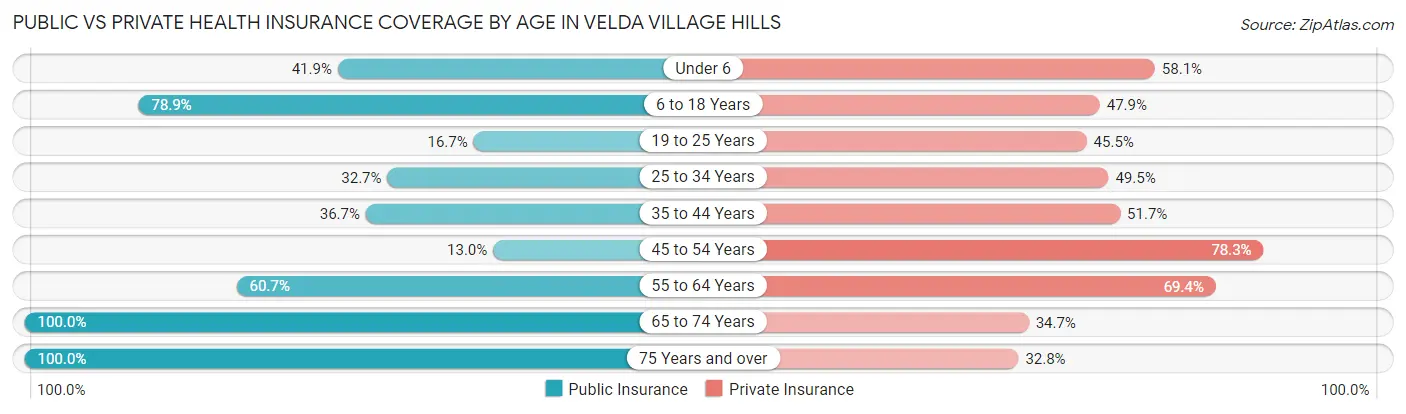
| Age Bracket | Public Insurance | Private Insurance |
| Under 6 | 49 (41.9%) | 68 (58.1%) |
| 6 to 18 Years | 56 (78.9%) | 34 (47.9%) |
| 19 to 25 Years | 11 (16.7%) | 30 (45.5%) |
| 25 to 34 Years | 33 (32.7%) | 50 (49.5%) |
| 35 to 44 Years | 22 (36.7%) | 31 (51.7%) |
| 45 to 54 Years | 12 (13.0%) | 72 (78.3%) |
| 55 to 64 Years | 111 (60.7%) | 127 (69.4%) |
| 65 to 74 Years | 98 (100.0%) | 34 (34.7%) |
| 75 Years and over | 61 (100.0%) | 20 (32.8%) |
| Total | 453 (53.4%) | 466 (54.9%) |
Disability Status by Sex by Age in Velda Village Hills
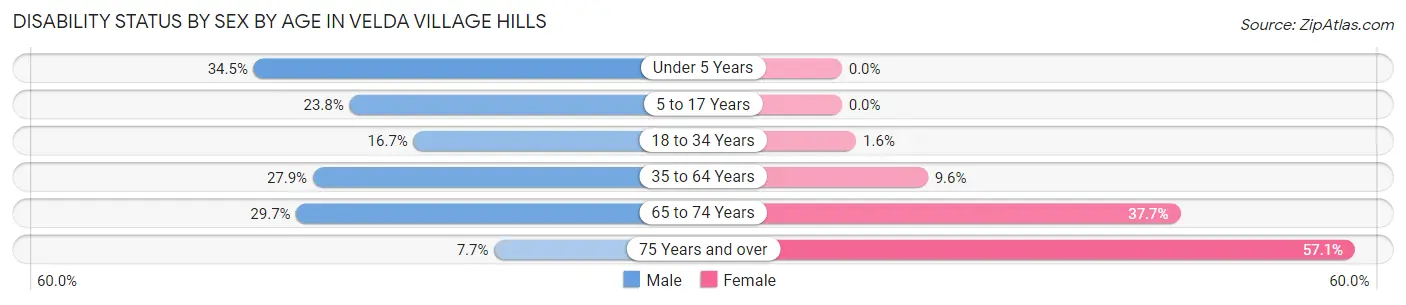
| Age Bracket | Male | Female |
| Under 5 Years | 10 (34.5%) | 0 (0.0%) |
| 5 to 17 Years | 15 (23.8%) | 0 (0.0%) |
| 18 to 34 Years | 7 (16.7%) | 2 (1.6%) |
| 35 to 64 Years | 41 (27.9%) | 18 (9.6%) |
| 65 to 74 Years | 11 (29.7%) | 23 (37.7%) |
| 75 Years and over | 2 (7.7%) | 20 (57.1%) |
Disability Class by Sex by Age in Velda Village Hills
Disability Class: Hearing Difficulty
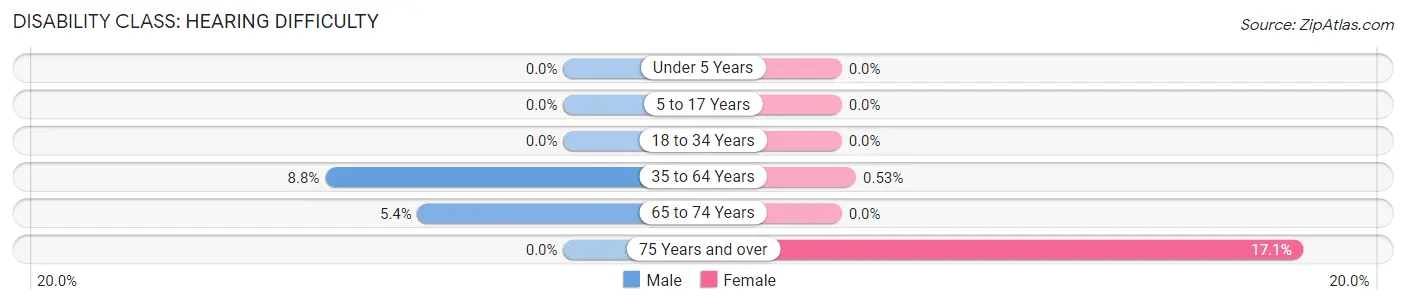
| Age Bracket | Male | Female |
| Under 5 Years | 0 (0.0%) | 0 (0.0%) |
| 5 to 17 Years | 0 (0.0%) | 0 (0.0%) |
| 18 to 34 Years | 0 (0.0%) | 0 (0.0%) |
| 35 to 64 Years | 13 (8.8%) | 1 (0.5%) |
| 65 to 74 Years | 2 (5.4%) | 0 (0.0%) |
| 75 Years and over | 0 (0.0%) | 6 (17.1%) |
Disability Class: Vision Difficulty
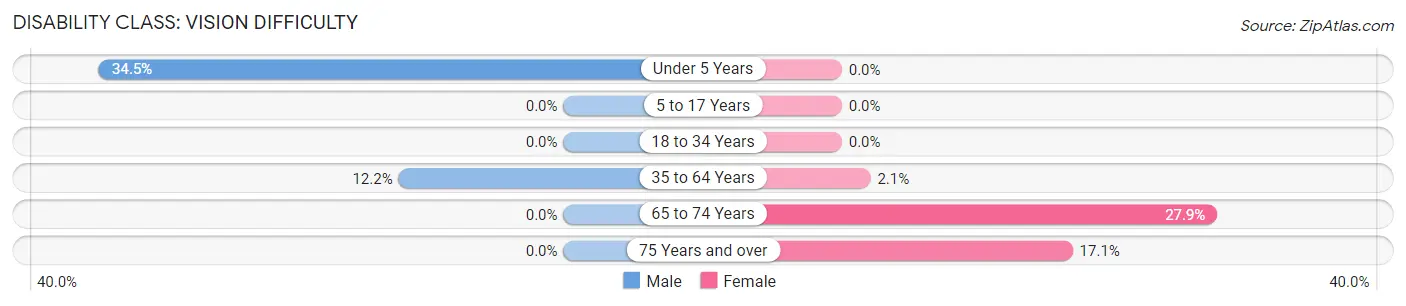
| Age Bracket | Male | Female |
| Under 5 Years | 10 (34.5%) | 0 (0.0%) |
| 5 to 17 Years | 0 (0.0%) | 0 (0.0%) |
| 18 to 34 Years | 0 (0.0%) | 0 (0.0%) |
| 35 to 64 Years | 18 (12.2%) | 4 (2.1%) |
| 65 to 74 Years | 0 (0.0%) | 17 (27.9%) |
| 75 Years and over | 0 (0.0%) | 6 (17.1%) |
Disability Class: Cognitive Difficulty
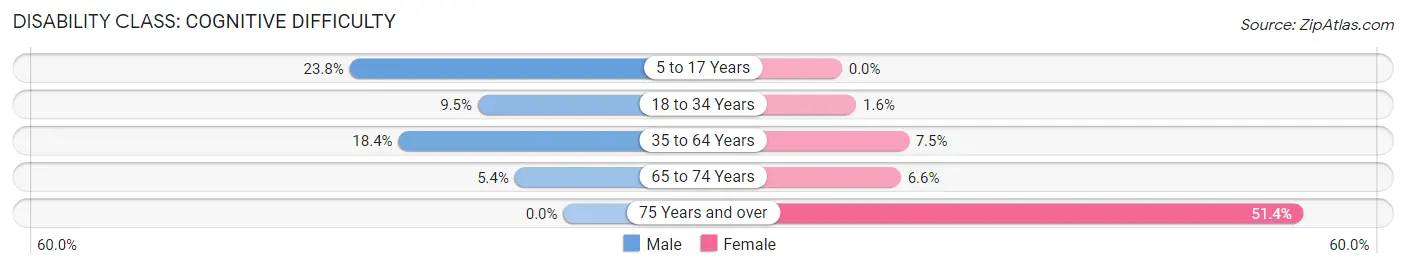
| Age Bracket | Male | Female |
| 5 to 17 Years | 15 (23.8%) | 0 (0.0%) |
| 18 to 34 Years | 4 (9.5%) | 2 (1.6%) |
| 35 to 64 Years | 27 (18.4%) | 14 (7.4%) |
| 65 to 74 Years | 2 (5.4%) | 4 (6.6%) |
| 75 Years and over | 0 (0.0%) | 18 (51.4%) |
Disability Class: Ambulatory Difficulty
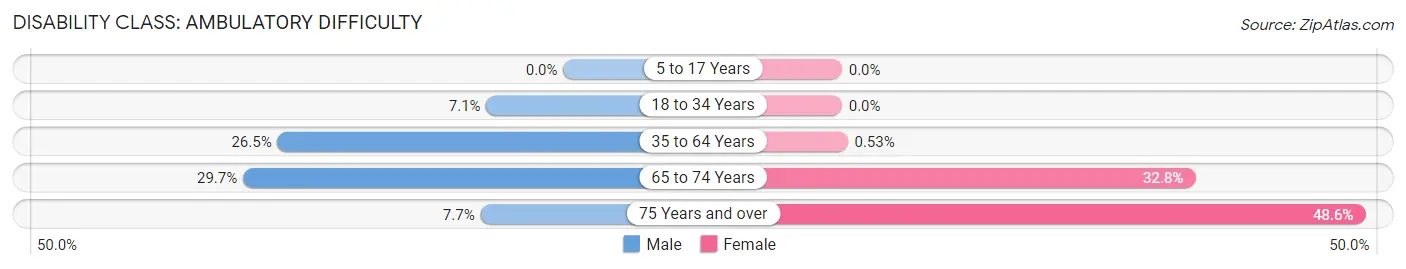
| Age Bracket | Male | Female |
| 5 to 17 Years | 0 (0.0%) | 0 (0.0%) |
| 18 to 34 Years | 3 (7.1%) | 0 (0.0%) |
| 35 to 64 Years | 39 (26.5%) | 1 (0.5%) |
| 65 to 74 Years | 11 (29.7%) | 20 (32.8%) |
| 75 Years and over | 2 (7.7%) | 17 (48.6%) |
Disability Class: Self-Care Difficulty
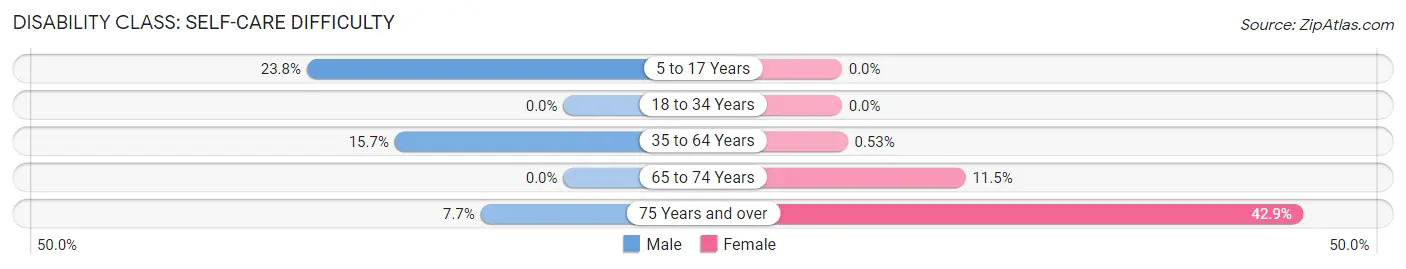
| Age Bracket | Male | Female |
| 5 to 17 Years | 15 (23.8%) | 0 (0.0%) |
| 18 to 34 Years | 0 (0.0%) | 0 (0.0%) |
| 35 to 64 Years | 23 (15.7%) | 1 (0.5%) |
| 65 to 74 Years | 0 (0.0%) | 7 (11.5%) |
| 75 Years and over | 2 (7.7%) | 15 (42.9%) |
Technology Access in Velda Village Hills
Computing Device Access in Velda Village Hills
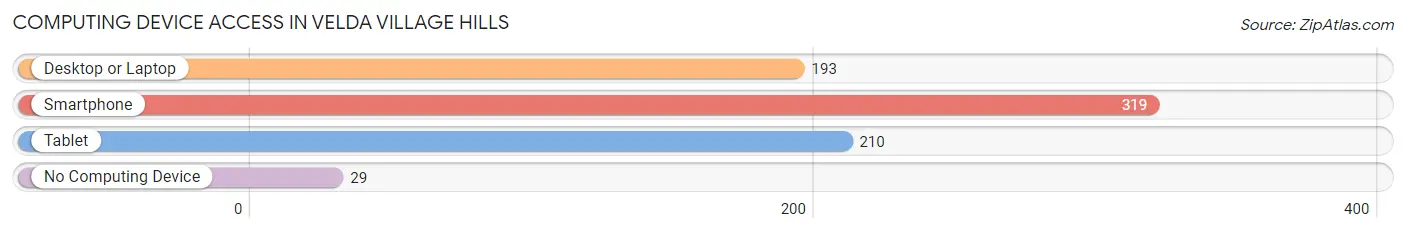
| Device Type | # Households | % Households |
| Desktop or Laptop | 193 | 51.9% |
| Smartphone | 319 | 85.8% |
| Tablet | 210 | 56.5% |
| No Computing Device | 29 | 7.8% |
| Total | 372 | 100.0% |
Internet Access in Velda Village Hills
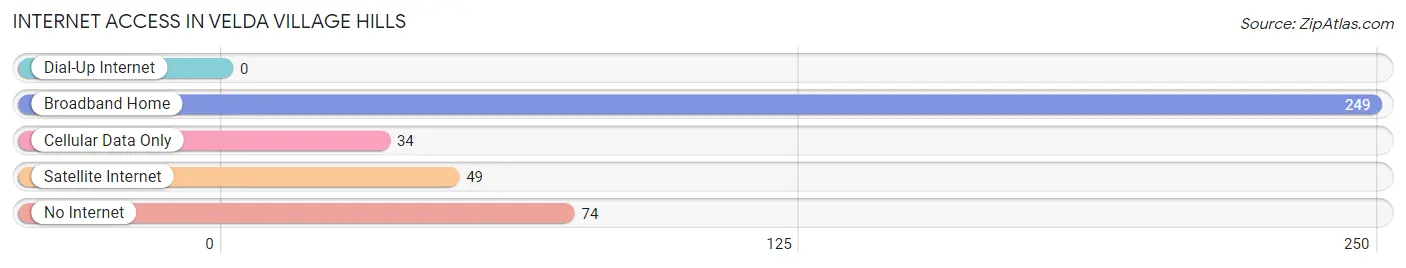
| Internet Type | # Households | % Households |
| Dial-Up Internet | 0 | 0.0% |
| Broadband Home | 249 | 66.9% |
| Cellular Data Only | 34 | 9.1% |
| Satellite Internet | 49 | 13.2% |
| No Internet | 74 | 19.9% |
| Total | 372 | 100.0% |
Velda Village Hills Summary
Velda Village Hills is a small city located in St. Louis County, Missouri. It is situated in the northwest corner of the county, just south of the city of St. Louis. The city was incorporated in 1949 and has a population of approximately 4,000 people.
Geography
Velda Village Hills is located in the northwest corner of St. Louis County, Missouri. It is situated on the banks of the Missouri River, just south of the city of St. Louis. The city is bordered by the cities of St. Louis, Jennings, and Normandy. The city covers an area of 1.2 square miles and is located at an elevation of 590 feet.
The city is located in a humid continental climate zone, with hot summers and cold winters. The average annual temperature is around 54 degrees Fahrenheit, with an average high of around 80 degrees in the summer and an average low of around 30 degrees in the winter. The average annual precipitation is around 40 inches.
Economy
Velda Village Hills is primarily a residential community, with most of its residents employed in the nearby cities of St. Louis and Jennings. The city does have some light industry, including a few small manufacturing plants and warehouses. The city also has a few retail stores, restaurants, and other businesses.
Demographics
As of the 2010 census, Velda Village Hills had a population of 4,000 people. The racial makeup of the city was 79.3% White, 15.2% African American, 0.3% Native American, 0.7% Asian, 0.1% Pacific Islander, and 4.4% from other races. Hispanic or Latino of any race were 2.2% of the population.
The median household income in Velda Village Hills was $37,917, and the median family income was $45,938. The per capita income was $19,945. About 11.2% of families and 13.3% of the population were below the poverty line, including 17.2% of those under age 18 and 8.3% of those age 65 or over.
Conclusion
Velda Village Hills is a small city located in St. Louis County, Missouri. It is situated on the banks of the Missouri River, just south of the city of St. Louis. The city was incorporated in 1949 and has a population of approximately 4,000 people. The city is primarily a residential community, with most of its residents employed in the nearby cities of St. Louis and Jennings. The city does have some light industry, including a few small manufacturing plants and warehouses. The racial makeup of the city is 79.3% White, 15.2% African American, 0.3% Native American, 0.7% Asian, 0.1% Pacific Islander, and 4.4% from other races. The median household income in Velda Village Hills was $37,917, and the median family income was $45,938. The city is located in a humid continental climate zone, with hot summers and cold winters.
Common Questions
What is Per Capita Income in Velda Village Hills?
Per Capita income in Velda Village Hills is $21,089.
What is the Median Family Income in Velda Village Hills?
Median Family Income in Velda Village Hills is $44,063.
What is the Median Household income in Velda Village Hills?
Median Household Income in Velda Village Hills is $39,444.
What is Income or Wage Gap in Velda Village Hills?
Income or Wage Gap in Velda Village Hills is 30.7%.
Women in Velda Village Hills earn 69.3 cents for every dollar earned by a man.
What is Inequality or Gini Index in Velda Village Hills?
Inequality or Gini Index in Velda Village Hills is 0.29.
What is the Total Population of Velda Village Hills?
Total Population of Velda Village Hills is 849.
What is the Total Male Population of Velda Village Hills?
Total Male Population of Velda Village Hills is 344.
What is the Total Female Population of Velda Village Hills?
Total Female Population of Velda Village Hills is 505.
What is the Ratio of Males per 100 Females in Velda Village Hills?
There are 68.12 Males per 100 Females in Velda Village Hills.
What is the Ratio of Females per 100 Males in Velda Village Hills?
There are 146.80 Females per 100 Males in Velda Village Hills.
What is the Median Population Age in Velda Village Hills?
Median Population Age in Velda Village Hills is 47.4 Years.
What is the Average Family Size in Velda Village Hills
Average Family Size in Velda Village Hills is 2.6 People.
What is the Average Household Size in Velda Village Hills
Average Household Size in Velda Village Hills is 2.3 People.
How Large is the Labor Force in Velda Village Hills?
There are 393 People in the Labor Forcein in Velda Village Hills.
What is the Percentage of People in the Labor Force in Velda Village Hills?
57.3% of People are in the Labor Force in Velda Village Hills.
What is the Unemployment Rate in Velda Village Hills?
Unemployment Rate in Velda Village Hills is 16.5%.