Mehlville, MO Map & Demographics
Mehlville Map
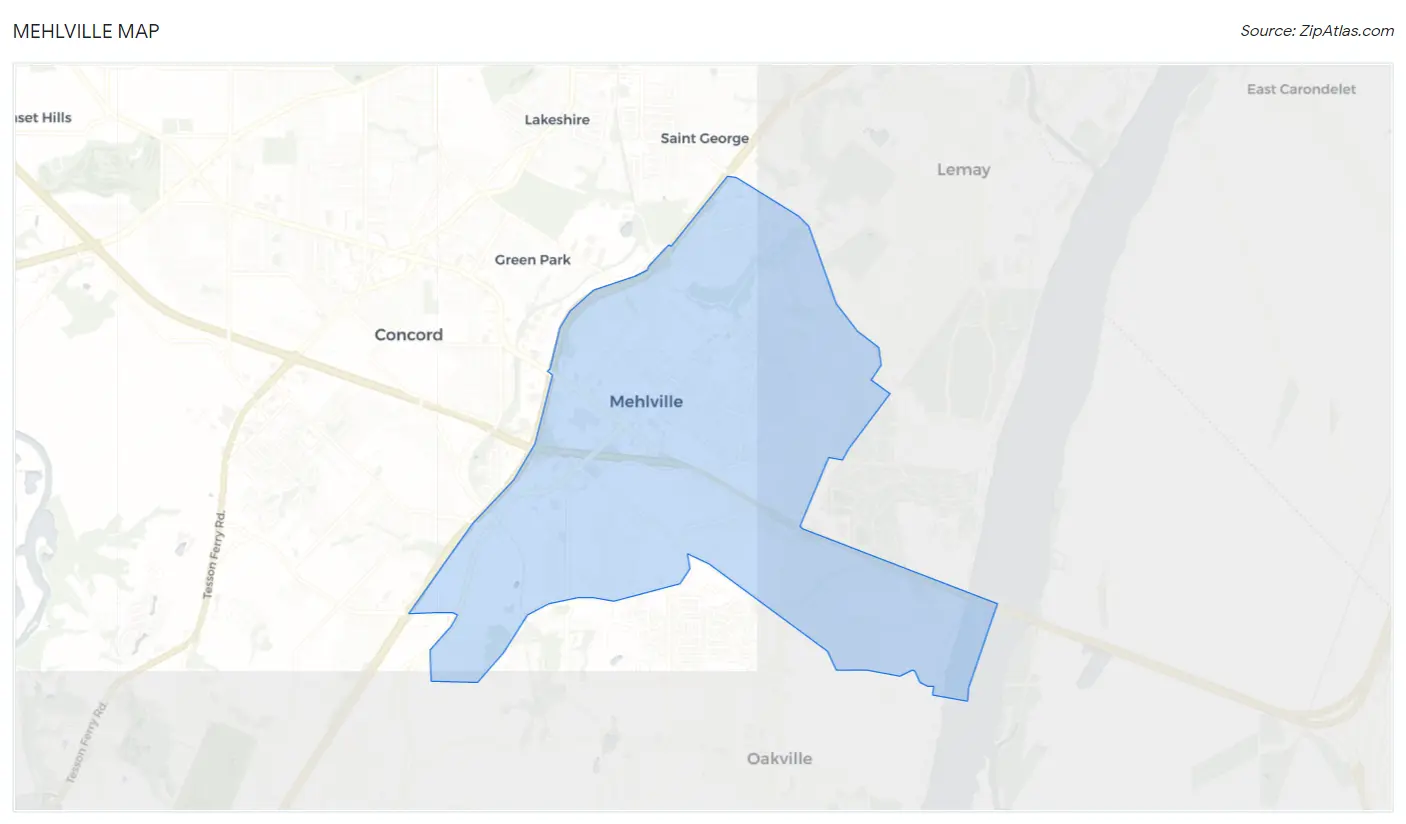
Mehlville Overview
$37,142
PER CAPITA INCOME
$85,133
AVG FAMILY INCOME
$63,123
AVG HOUSEHOLD INCOME
25.4%
WAGE / INCOME GAP [ % ]
74.6¢/ $1
WAGE / INCOME GAP [ $ ]
$11,532
FAMILY INCOME DEFICIT
0.39
INEQUALITY / GINI INDEX
29,089
TOTAL POPULATION
14,517
MALE POPULATION
14,572
FEMALE POPULATION
99.62
MALES / 100 FEMALES
100.38
FEMALES / 100 MALES
42.0
MEDIAN AGE
2.8
AVG FAMILY SIZE
2.2
AVG HOUSEHOLD SIZE
15,391
LABOR FORCE [ PEOPLE ]
63.3%
PERCENT IN LABOR FORCE
3.8%
UNEMPLOYMENT RATE
Income in Mehlville
Income Overview in Mehlville
Per Capita Income in Mehlville is $37,142, while median incomes of families and households are $85,133 and $63,123 respectively.
| Characteristic | Number | Measure |
| Per Capita Income | 29,089 | $37,142 |
| Median Family Income | 7,559 | $85,133 |
| Mean Family Income | 7,559 | $99,668 |
| Median Household Income | 13,112 | $63,123 |
| Mean Household Income | 13,112 | $80,792 |
| Income Deficit | 7,559 | $11,532 |
| Wage / Income Gap (%) | 29,089 | 25.39% |
| Wage / Income Gap ($) | 29,089 | 74.61¢ per $1 |
| Gini / Inequality Index | 29,089 | 0.39 |
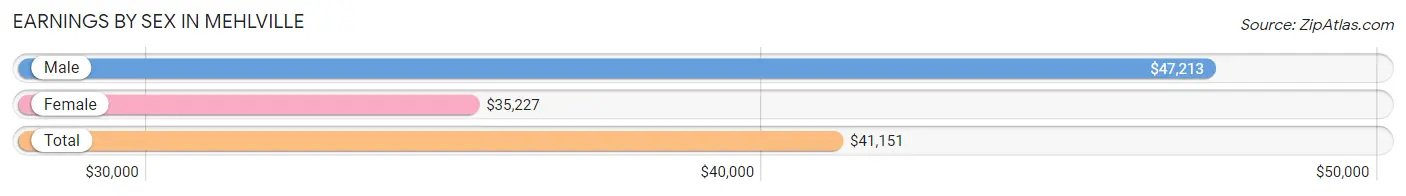
Earnings by Sex in Mehlville
Average Earnings in Mehlville are $41,151, $47,213 for men and $35,227 for women, a difference of 25.4%.
| Sex | Number | Average Earnings |
| Male | 8,534 (52.3%) | $47,213 |
| Female | 7,785 (47.7%) | $35,227 |
| Total | 16,319 (100.0%) | $41,151 |
Earnings by Sex by Income Bracket in Mehlville
The most common earnings brackets in Mehlville are $100,000+ for men (1,110 | 13.0%) and $55,000 to $64,999 for women (934 | 12.0%).
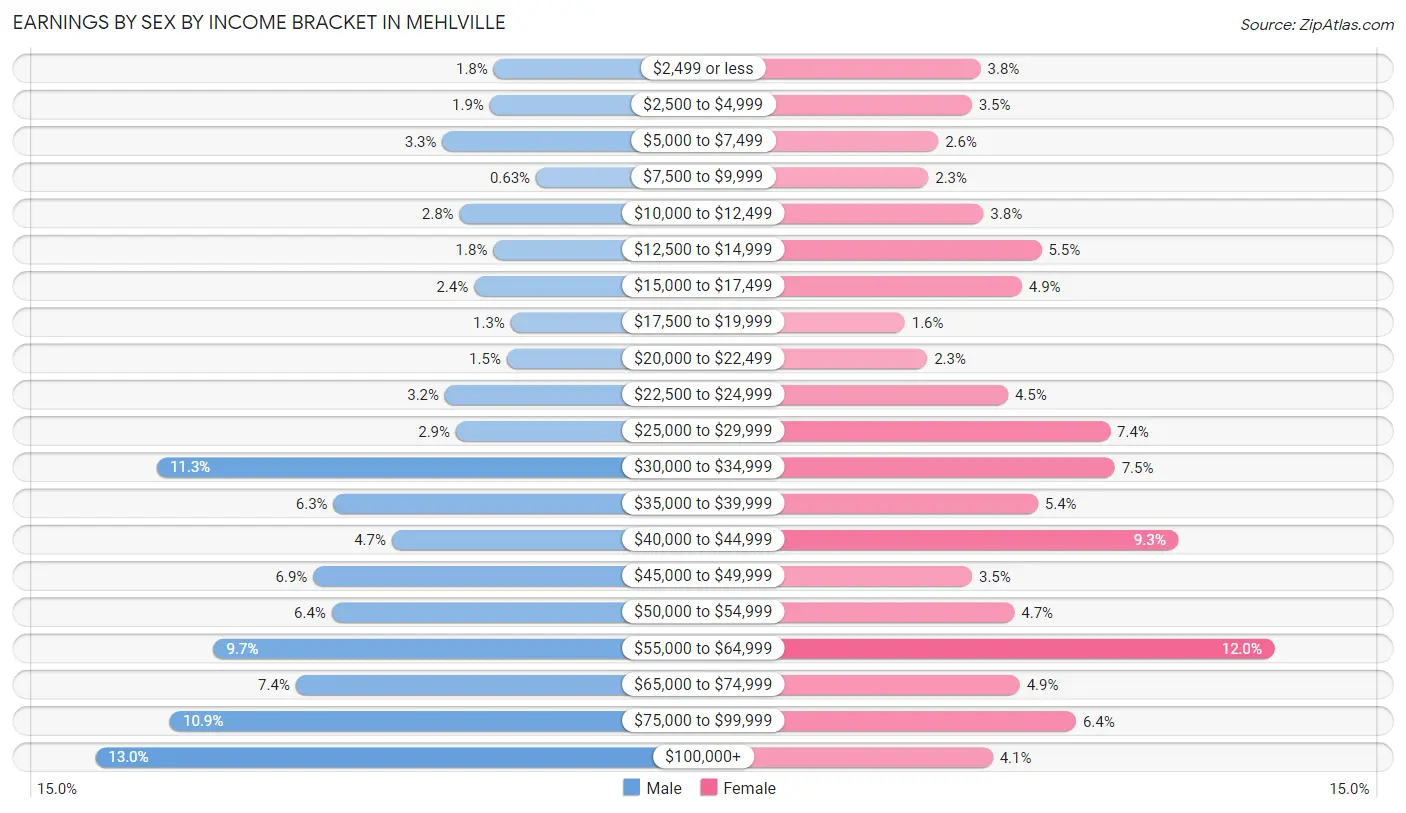
| Income | Male | Female |
| $2,499 or less | 155 (1.8%) | 293 (3.8%) |
| $2,500 to $4,999 | 165 (1.9%) | 273 (3.5%) |
| $5,000 to $7,499 | 278 (3.3%) | 200 (2.6%) |
| $7,500 to $9,999 | 54 (0.6%) | 178 (2.3%) |
| $10,000 to $12,499 | 237 (2.8%) | 299 (3.8%) |
| $12,500 to $14,999 | 156 (1.8%) | 426 (5.5%) |
| $15,000 to $17,499 | 202 (2.4%) | 383 (4.9%) |
| $17,500 to $19,999 | 114 (1.3%) | 127 (1.6%) |
| $20,000 to $22,499 | 124 (1.5%) | 176 (2.3%) |
| $22,500 to $24,999 | 272 (3.2%) | 353 (4.5%) |
| $25,000 to $29,999 | 246 (2.9%) | 576 (7.4%) |
| $30,000 to $34,999 | 963 (11.3%) | 586 (7.5%) |
| $35,000 to $39,999 | 539 (6.3%) | 418 (5.4%) |
| $40,000 to $44,999 | 399 (4.7%) | 724 (9.3%) |
| $45,000 to $49,999 | 588 (6.9%) | 274 (3.5%) |
| $50,000 to $54,999 | 544 (6.4%) | 367 (4.7%) |
| $55,000 to $64,999 | 827 (9.7%) | 934 (12.0%) |
| $65,000 to $74,999 | 630 (7.4%) | 378 (4.9%) |
| $75,000 to $99,999 | 931 (10.9%) | 501 (6.4%) |
| $100,000+ | 1,110 (13.0%) | 319 (4.1%) |
| Total | 8,534 (100.0%) | 7,785 (100.0%) |
Earnings by Sex by Educational Attainment in Mehlville
Average earnings in Mehlville are $52,000 for men and $40,845 for women, a difference of 21.4%. Men with an educational attainment of graduate degree enjoy the highest average annual earnings of $75,313, while those with high school diploma education earn the least with $39,399. Women with an educational attainment of graduate degree earn the most with the average annual earnings of $56,287, while those with less than high school education have the smallest earnings of $30,655.
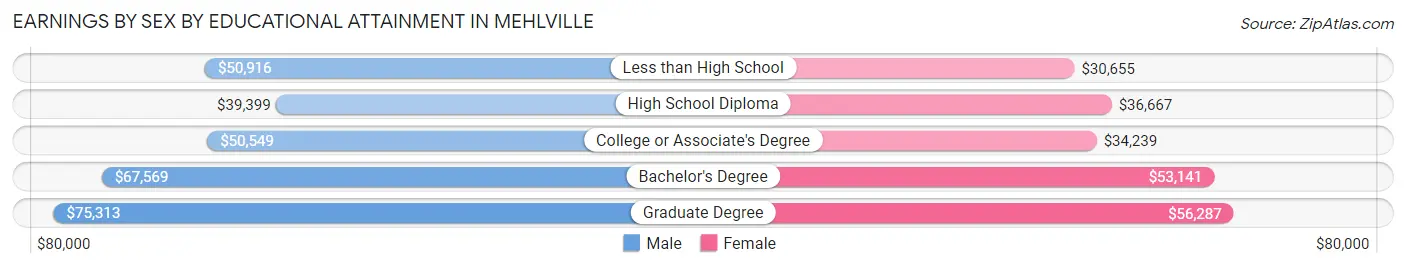
| Educational Attainment | Male Income | Female Income |
| Less than High School | $50,916 | $30,655 |
| High School Diploma | $39,399 | $36,667 |
| College or Associate's Degree | $50,549 | $34,239 |
| Bachelor's Degree | $67,569 | $53,141 |
| Graduate Degree | $75,313 | $56,287 |
| Total | $52,000 | $40,845 |
Family Income in Mehlville
Family Income Brackets in Mehlville
According to the Mehlville family income data, there are 1,648 families falling into the $100,000 to $149,999 income range, which is the most common income bracket and makes up 21.8% of all families. Conversely, the $15,000 to $24,999 income bracket is the least frequent group with only 60 families (0.8%) belonging to this category.
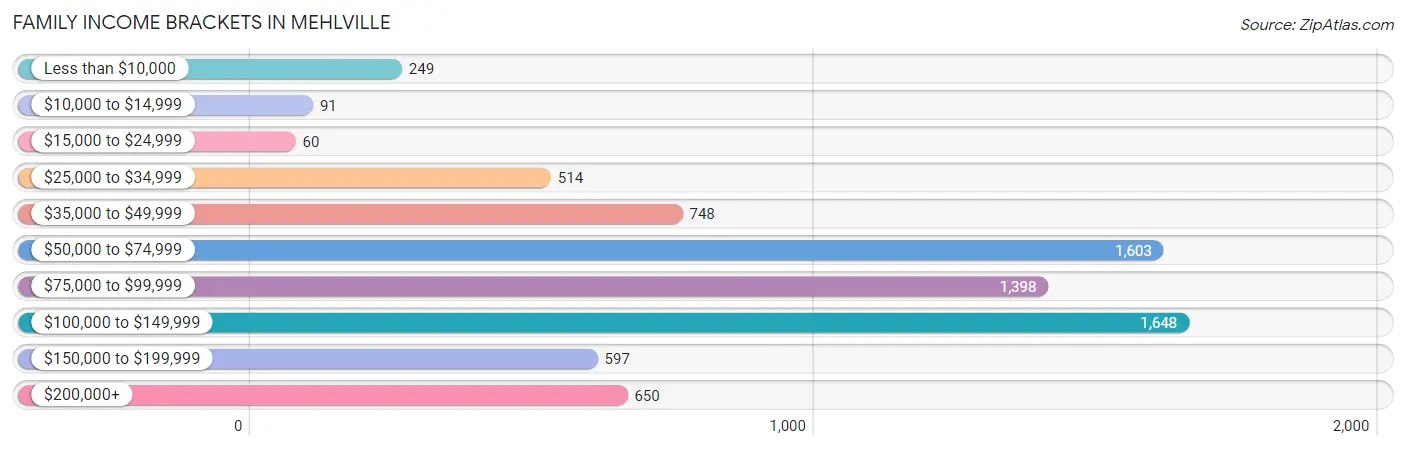
| Income Bracket | # Families | % Families |
| Less than $10,000 | 249 | 3.3% |
| $10,000 to $14,999 | 91 | 1.2% |
| $15,000 to $24,999 | 60 | 0.8% |
| $25,000 to $34,999 | 514 | 6.8% |
| $35,000 to $49,999 | 748 | 9.9% |
| $50,000 to $74,999 | 1,603 | 21.2% |
| $75,000 to $99,999 | 1,398 | 18.5% |
| $100,000 to $149,999 | 1,648 | 21.8% |
| $150,000 to $199,999 | 597 | 7.9% |
| $200,000+ | 650 | 8.6% |
Family Income by Famaliy Size in Mehlville
4-person families (825 | 10.9%) account for the highest median family income in Mehlville with $137,614 per family, while 2-person families (4,154 | 54.9%) have the highest median income of $34,594 per family member.
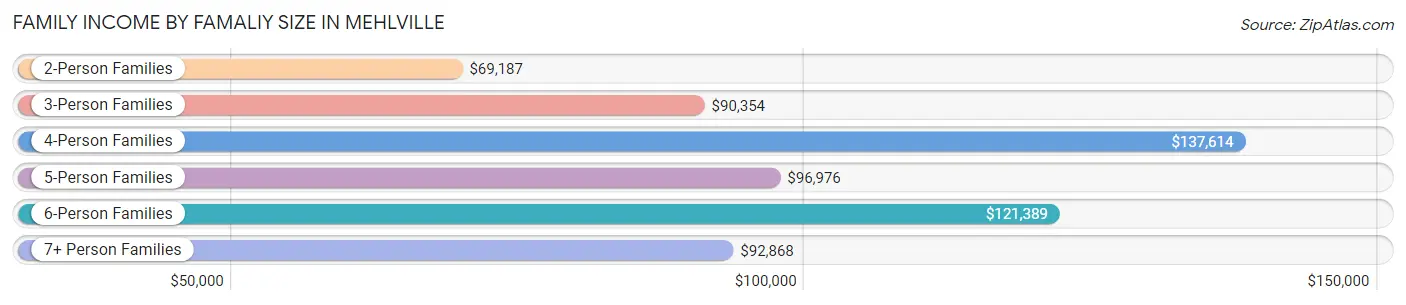
| Income Bracket | # Families | Median Income |
| 2-Person Families | 4,154 (54.9%) | $69,187 |
| 3-Person Families | 2,108 (27.9%) | $90,354 |
| 4-Person Families | 825 (10.9%) | $137,614 |
| 5-Person Families | 345 (4.6%) | $96,976 |
| 6-Person Families | 50 (0.7%) | $121,389 |
| 7+ Person Families | 77 (1.0%) | $92,868 |
| Total | 7,559 (100.0%) | $85,133 |
Family Income by Number of Earners in Mehlville
The median family income in Mehlville is $85,133, with families comprising 3+ earners (782) having the highest median family income of $121,029, while families with no earners (1,481) have the lowest median family income of $55,891, accounting for 10.3% and 19.6% of families, respectively.
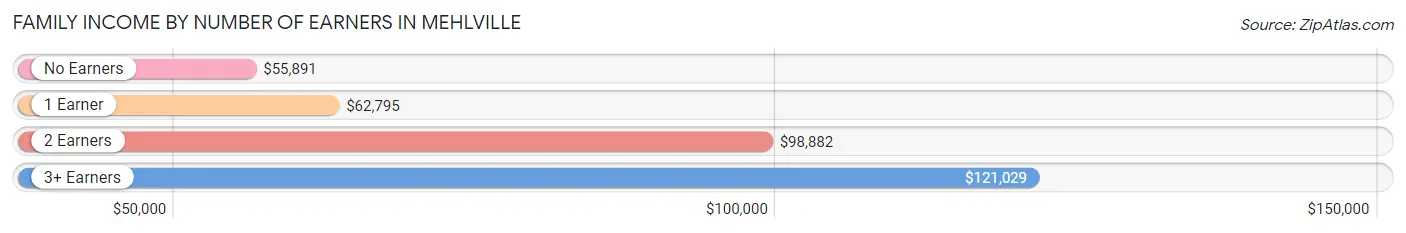
| Number of Earners | # Families | Median Income |
| No Earners | 1,481 (19.6%) | $55,891 |
| 1 Earner | 2,095 (27.7%) | $62,795 |
| 2 Earners | 3,201 (42.3%) | $98,882 |
| 3+ Earners | 782 (10.3%) | $121,029 |
| Total | 7,559 (100.0%) | $85,133 |
Household Income in Mehlville
Household Income Brackets in Mehlville
With 2,793 households falling in the category, the $50,000 to $74,999 income range is the most frequent in Mehlville, accounting for 21.3% of all households. In contrast, only 275 households (2.1%) fall into the $10,000 to $14,999 income bracket, making it the least populous group.
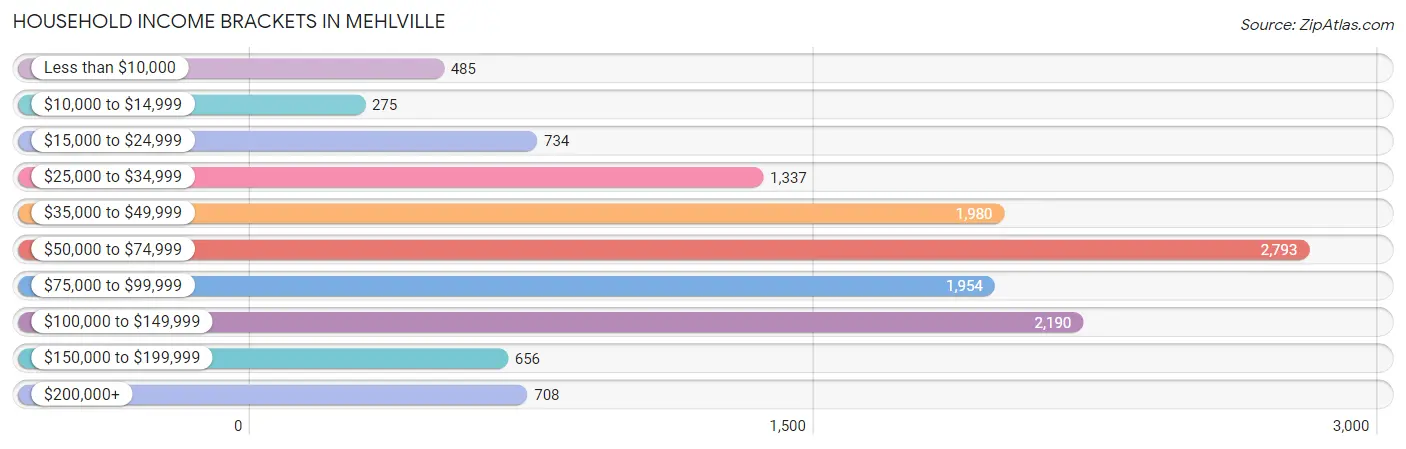
| Income Bracket | # Households | % Households |
| Less than $10,000 | 485 | 3.7% |
| $10,000 to $14,999 | 275 | 2.1% |
| $15,000 to $24,999 | 734 | 5.6% |
| $25,000 to $34,999 | 1,337 | 10.2% |
| $35,000 to $49,999 | 1,980 | 15.1% |
| $50,000 to $74,999 | 2,793 | 21.3% |
| $75,000 to $99,999 | 1,954 | 14.9% |
| $100,000 to $149,999 | 2,190 | 16.7% |
| $150,000 to $199,999 | 656 | 5.0% |
| $200,000+ | 708 | 5.4% |
Household Income by Householder Age in Mehlville
The median household income in Mehlville is $63,123, with the highest median household income of $83,371 found in the 45 to 64 years age bracket for the primary householder. A total of 4,487 households (34.2%) fall into this category. Meanwhile, the 15 to 24 years age bracket for the primary householder has the lowest median household income of $46,797, with 625 households (4.8%) in this group.
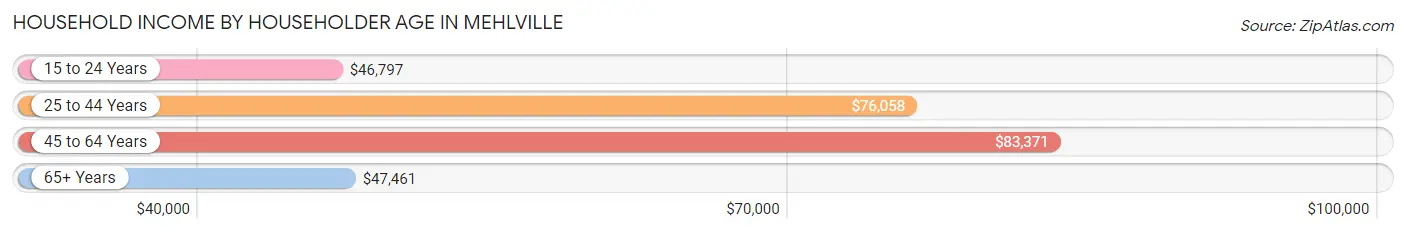
| Income Bracket | # Households | Median Income |
| 15 to 24 Years | 625 (4.8%) | $46,797 |
| 25 to 44 Years | 3,850 (29.4%) | $76,058 |
| 45 to 64 Years | 4,487 (34.2%) | $83,371 |
| 65+ Years | 4,150 (31.7%) | $47,461 |
| Total | 13,112 (100.0%) | $63,123 |
Poverty in Mehlville
Income Below Poverty by Sex and Age in Mehlville
With 6.1% poverty level for males and 9.4% for females among the residents of Mehlville, 5 year old males and 12 to 14 year old females are the most vulnerable to poverty, with 71 males (30.5%) and 77 females (20.3%) in their respective age groups living below the poverty level.
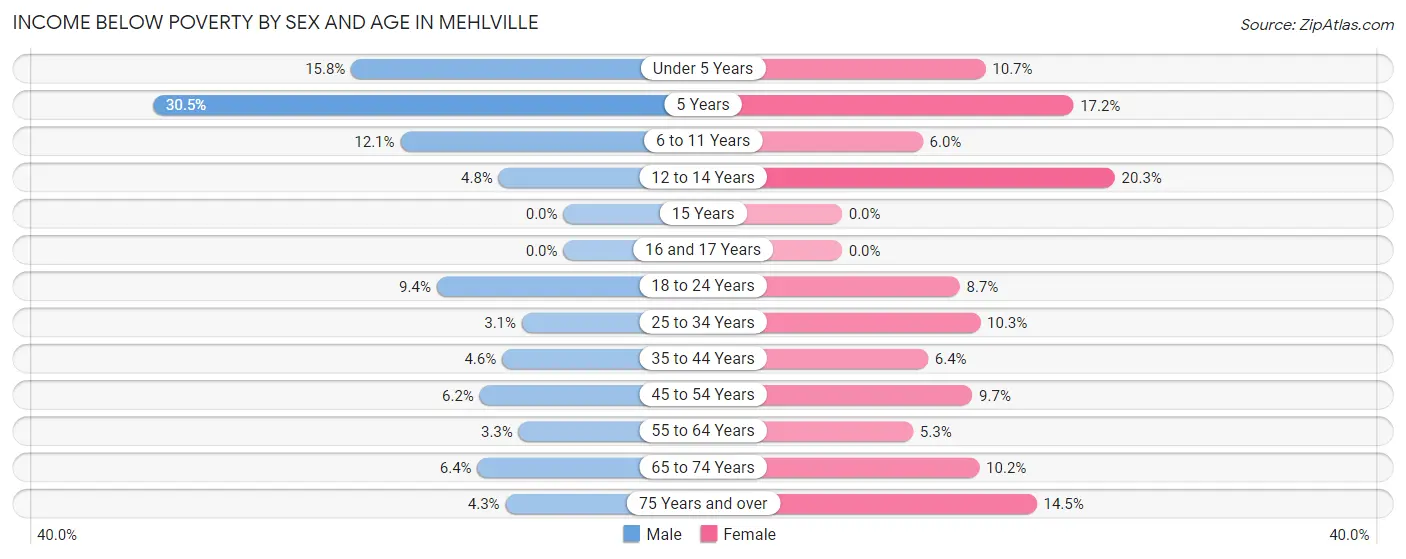
| Age Bracket | Male | Female |
| Under 5 Years | 141 (15.8%) | 65 (10.7%) |
| 5 Years | 71 (30.5%) | 28 (17.2%) |
| 6 to 11 Years | 65 (12.1%) | 45 (6.0%) |
| 12 to 14 Years | 12 (4.8%) | 77 (20.3%) |
| 15 Years | 0 (0.0%) | 0 (0.0%) |
| 16 and 17 Years | 0 (0.0%) | 0 (0.0%) |
| 18 to 24 Years | 111 (9.4%) | 125 (8.7%) |
| 25 to 34 Years | 67 (3.1%) | 193 (10.3%) |
| 35 to 44 Years | 83 (4.5%) | 89 (6.4%) |
| 45 to 54 Years | 99 (6.2%) | 173 (9.7%) |
| 55 to 64 Years | 72 (3.3%) | 113 (5.3%) |
| 65 to 74 Years | 91 (6.4%) | 192 (10.2%) |
| 75 Years and over | 41 (4.3%) | 252 (14.5%) |
| Total | 853 (6.1%) | 1,352 (9.4%) |
Income Above Poverty by Sex and Age in Mehlville
According to the poverty statistics in Mehlville, males aged 15 years and females aged 15 years are the age groups that are most secure financially, with 100.0% of males and 100.0% of females in these age groups living above the poverty line.
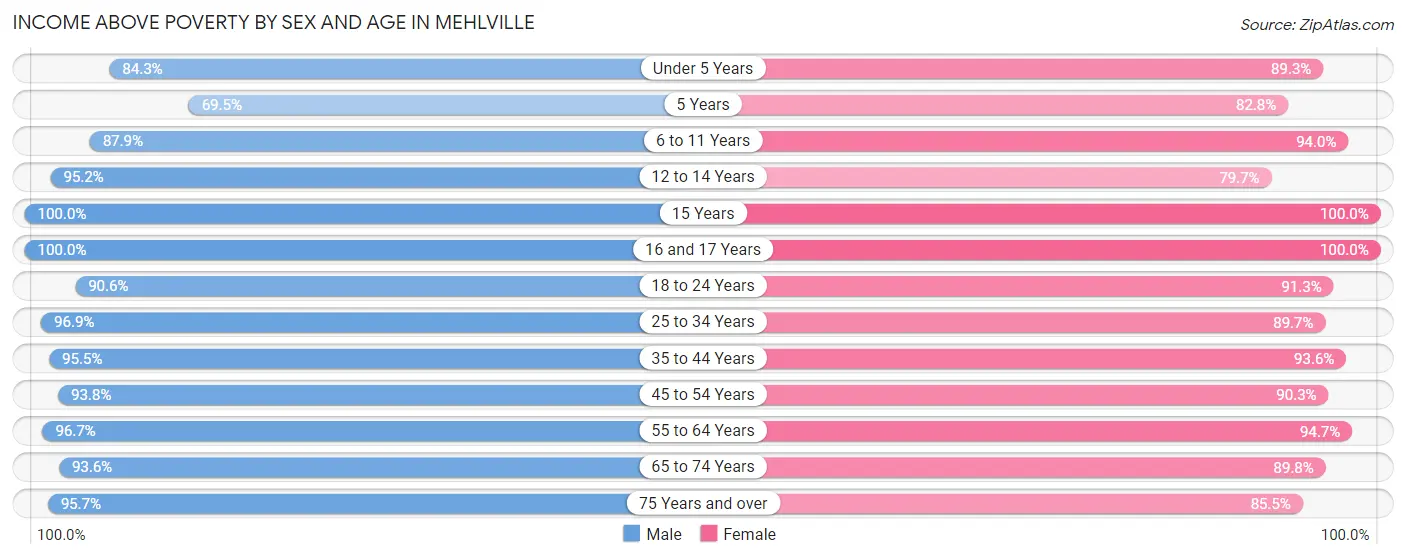
| Age Bracket | Male | Female |
| Under 5 Years | 754 (84.3%) | 545 (89.3%) |
| 5 Years | 162 (69.5%) | 135 (82.8%) |
| 6 to 11 Years | 472 (87.9%) | 705 (94.0%) |
| 12 to 14 Years | 238 (95.2%) | 303 (79.7%) |
| 15 Years | 201 (100.0%) | 59 (100.0%) |
| 16 and 17 Years | 424 (100.0%) | 207 (100.0%) |
| 18 to 24 Years | 1,070 (90.6%) | 1,306 (91.3%) |
| 25 to 34 Years | 2,109 (96.9%) | 1,686 (89.7%) |
| 35 to 44 Years | 1,741 (95.5%) | 1,303 (93.6%) |
| 45 to 54 Years | 1,496 (93.8%) | 1,614 (90.3%) |
| 55 to 64 Years | 2,099 (96.7%) | 2,027 (94.7%) |
| 65 to 74 Years | 1,336 (93.6%) | 1,690 (89.8%) |
| 75 Years and over | 913 (95.7%) | 1,491 (85.5%) |
| Total | 13,015 (93.9%) | 13,071 (90.6%) |
Income Below Poverty Among Married-Couple Families in Mehlville
The poverty statistics for married-couple families in Mehlville show that 1.5% or 81 of the total 5,561 families live below the poverty line. Families with no children have the highest poverty rate of 1.8%, comprising of 69 families. On the other hand, families with 3 or 4 children have the lowest poverty rate of 0.0%, which includes 0 families.
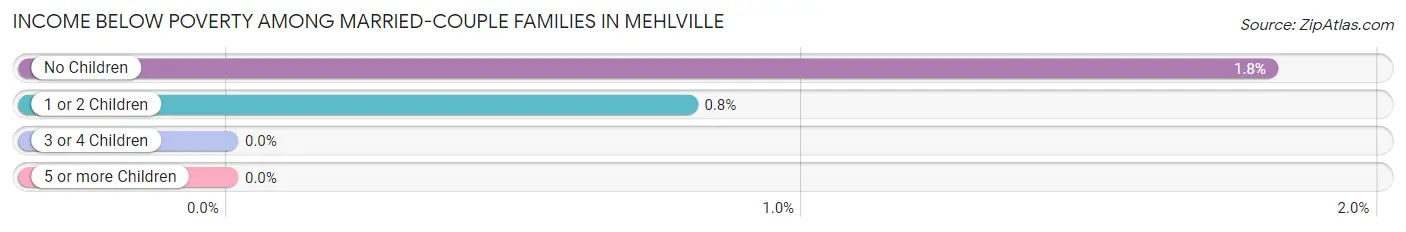
| Children | Above Poverty | Below Poverty |
| No Children | 3,743 (98.2%) | 69 (1.8%) |
| 1 or 2 Children | 1,497 (99.2%) | 12 (0.8%) |
| 3 or 4 Children | 180 (100.0%) | 0 (0.0%) |
| 5 or more Children | 60 (100.0%) | 0 (0.0%) |
| Total | 5,480 (98.5%) | 81 (1.5%) |
Income Below Poverty Among Single-Parent Households in Mehlville
According to the poverty data in Mehlville, 8.4% or 42 single-father households and 19.9% or 297 single-mother households are living below the poverty line. Among single-father households, those with 3 or 4 children have the highest poverty rate, with 13 households (68.4%) experiencing poverty. Likewise, among single-mother households, those with 3 or 4 children have the highest poverty rate, with 24 households (100.0%) falling below the poverty line.
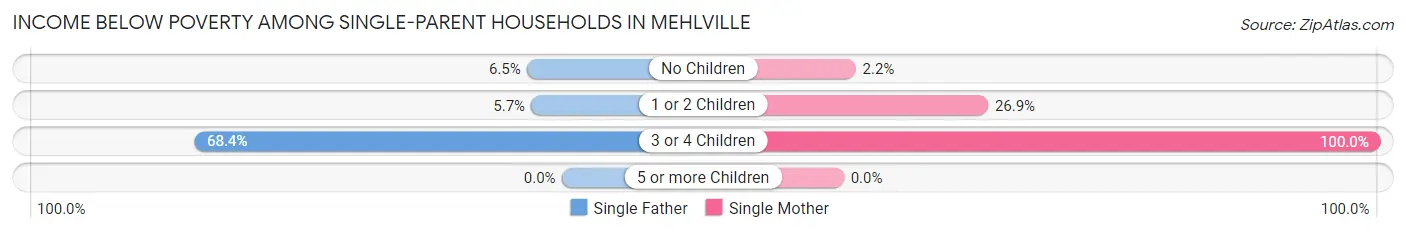
| Children | Single Father | Single Mother |
| No Children | 12 (6.5%) | 11 (2.2%) |
| 1 or 2 Children | 17 (5.7%) | 262 (26.9%) |
| 3 or 4 Children | 13 (68.4%) | 24 (100.0%) |
| 5 or more Children | 0 (0.0%) | 0 (0.0%) |
| Total | 42 (8.4%) | 297 (19.9%) |
Income Below Poverty Among Married-Couple vs Single-Parent Households in Mehlville
The poverty data for Mehlville shows that 81 of the married-couple family households (1.5%) and 339 of the single-parent households (17.0%) are living below the poverty level. Within the married-couple family households, those with no children have the highest poverty rate, with 69 households (1.8%) falling below the poverty line. Among the single-parent households, those with 3 or 4 children have the highest poverty rate, with 37 household (86.1%) living below poverty.
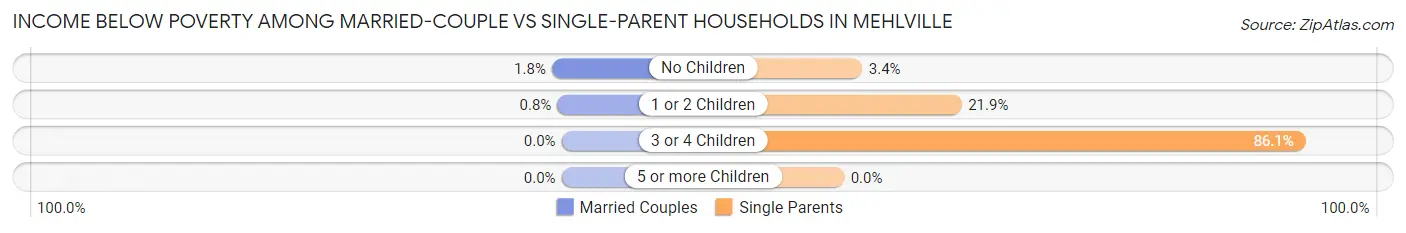
| Children | Married-Couple Families | Single-Parent Households |
| No Children | 69 (1.8%) | 23 (3.4%) |
| 1 or 2 Children | 12 (0.8%) | 279 (21.9%) |
| 3 or 4 Children | 0 (0.0%) | 37 (86.1%) |
| 5 or more Children | 0 (0.0%) | 0 (0.0%) |
| Total | 81 (1.5%) | 339 (17.0%) |
Race in Mehlville
The most populous races in Mehlville are White / Caucasian (25,947 | 89.2%), Black / African American (1,600 | 5.5%), and Two or more Races (812 | 2.8%).
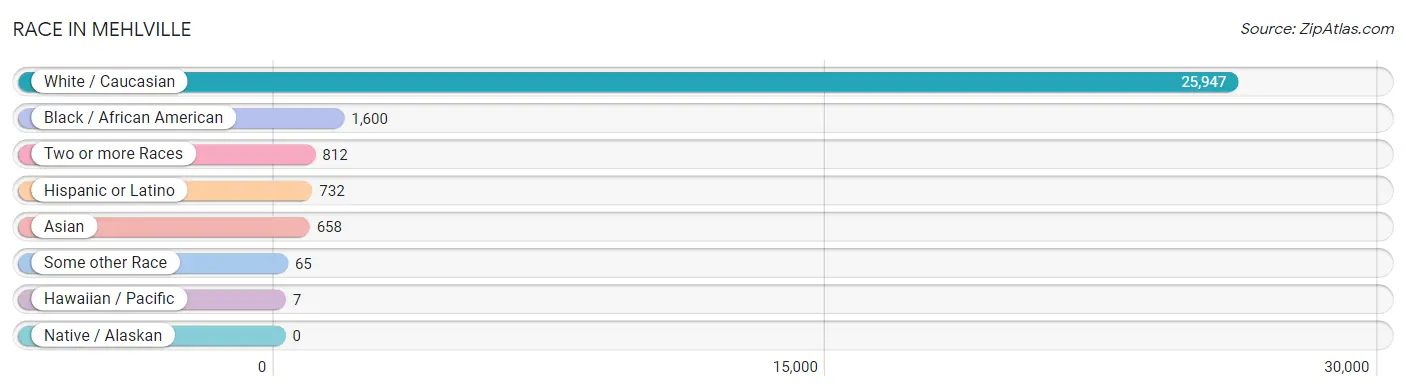
| Race | # Population | % Population |
| Asian | 658 | 2.3% |
| Black / African American | 1,600 | 5.5% |
| Hawaiian / Pacific | 7 | 0.0% |
| Hispanic or Latino | 732 | 2.5% |
| Native / Alaskan | 0 | 0.0% |
| White / Caucasian | 25,947 | 89.2% |
| Two or more Races | 812 | 2.8% |
| Some other Race | 65 | 0.2% |
| Total | 29,089 | 100.0% |
Ancestry in Mehlville
The most populous ancestries reported in Mehlville are German (8,946 | 30.7%), Irish (4,126 | 14.2%), English (2,356 | 8.1%), Yugoslavian (2,308 | 7.9%), and American (1,603 | 5.5%), together accounting for 66.5% of all Mehlville residents.
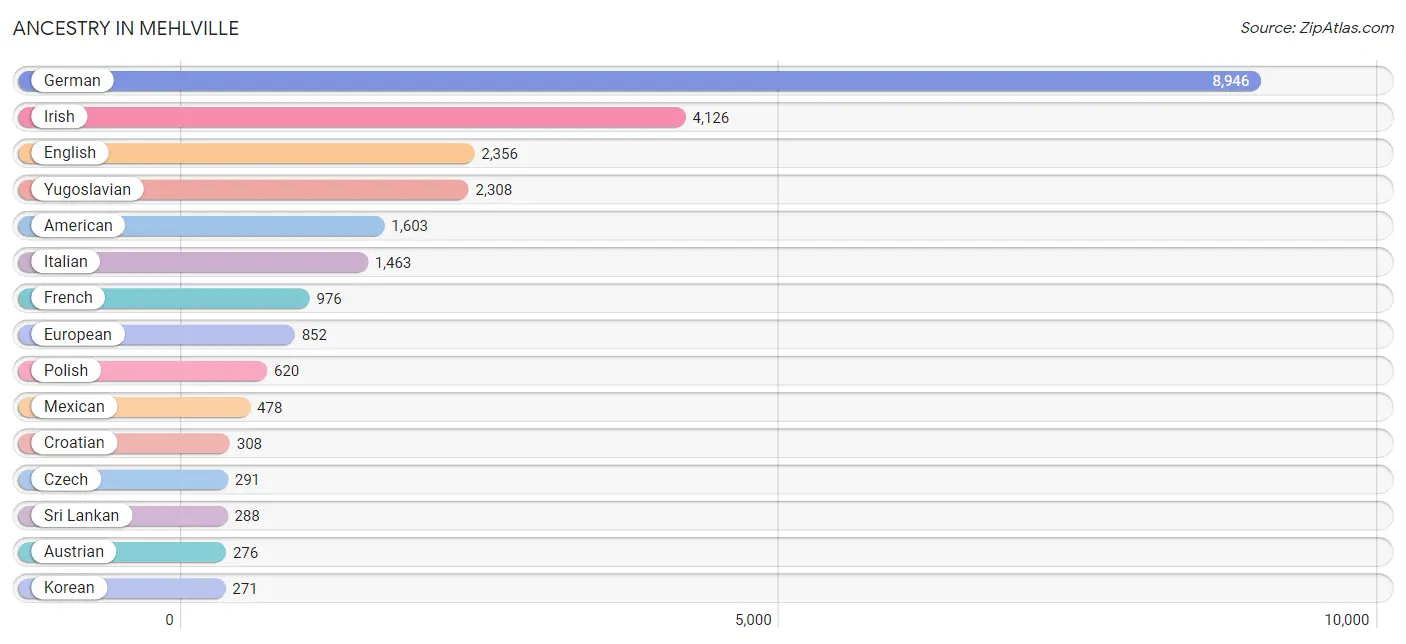
| Ancestry | # Population | % Population |
| African | 20 | 0.1% |
| Albanian | 187 | 0.6% |
| American | 1,603 | 5.5% |
| Arab | 176 | 0.6% |
| Argentinean | 1 | 0.0% |
| Armenian | 36 | 0.1% |
| Austrian | 276 | 0.9% |
| Belgian | 51 | 0.2% |
| Bhutanese | 22 | 0.1% |
| Bolivian | 32 | 0.1% |
| British | 65 | 0.2% |
| Burmese | 69 | 0.2% |
| Cajun | 20 | 0.1% |
| Canadian | 25 | 0.1% |
| Central American | 8 | 0.0% |
| Cherokee | 19 | 0.1% |
| Croatian | 308 | 1.1% |
| Czech | 291 | 1.0% |
| Danish | 46 | 0.2% |
| Dutch | 231 | 0.8% |
| Eastern European | 45 | 0.2% |
| English | 2,356 | 8.1% |
| Ethiopian | 51 | 0.2% |
| European | 852 | 2.9% |
| French | 976 | 3.4% |
| French Canadian | 11 | 0.0% |
| German | 8,946 | 30.7% |
| Greek | 46 | 0.2% |
| Hungarian | 255 | 0.9% |
| Indian (Asian) | 66 | 0.2% |
| Inupiat | 8 | 0.0% |
| Irish | 4,126 | 14.2% |
| Italian | 1,463 | 5.0% |
| Jamaican | 79 | 0.3% |
| Korean | 271 | 0.9% |
| Lebanese | 143 | 0.5% |
| Lithuanian | 32 | 0.1% |
| Macedonian | 16 | 0.1% |
| Mexican | 478 | 1.6% |
| Moroccan | 21 | 0.1% |
| Nicaraguan | 8 | 0.0% |
| Norwegian | 90 | 0.3% |
| Osage | 5 | 0.0% |
| Palestinian | 19 | 0.1% |
| Peruvian | 54 | 0.2% |
| Polish | 620 | 2.1% |
| Portuguese | 28 | 0.1% |
| Puerto Rican | 1 | 0.0% |
| Russian | 89 | 0.3% |
| Samoan | 7 | 0.0% |
| Scotch-Irish | 248 | 0.9% |
| Scottish | 165 | 0.6% |
| Serbian | 13 | 0.0% |
| Slavic | 19 | 0.1% |
| Slovak | 81 | 0.3% |
| Slovene | 12 | 0.0% |
| Somali | 88 | 0.3% |
| South American | 106 | 0.4% |
| Spaniard | 128 | 0.4% |
| Spanish | 11 | 0.0% |
| Sri Lankan | 288 | 1.0% |
| Subsaharan African | 159 | 0.5% |
| Swedish | 140 | 0.5% |
| Swiss | 98 | 0.3% |
| Thai | 122 | 0.4% |
| Turkish | 90 | 0.3% |
| Ukrainian | 14 | 0.1% |
| Venezuelan | 19 | 0.1% |
| Welsh | 94 | 0.3% |
| Yugoslavian | 2,308 | 7.9% | View All 70 Rows |
Immigrants in Mehlville
The most numerous immigrant groups reported in Mehlville came from Europe (2,537 | 8.7%), Eastern Europe (2,116 | 7.3%), Bosnia and Herzegovina (1,815 | 6.2%), Asia (502 | 1.7%), and South Eastern Asia (379 | 1.3%), together accounting for 25.3% of all Mehlville residents.
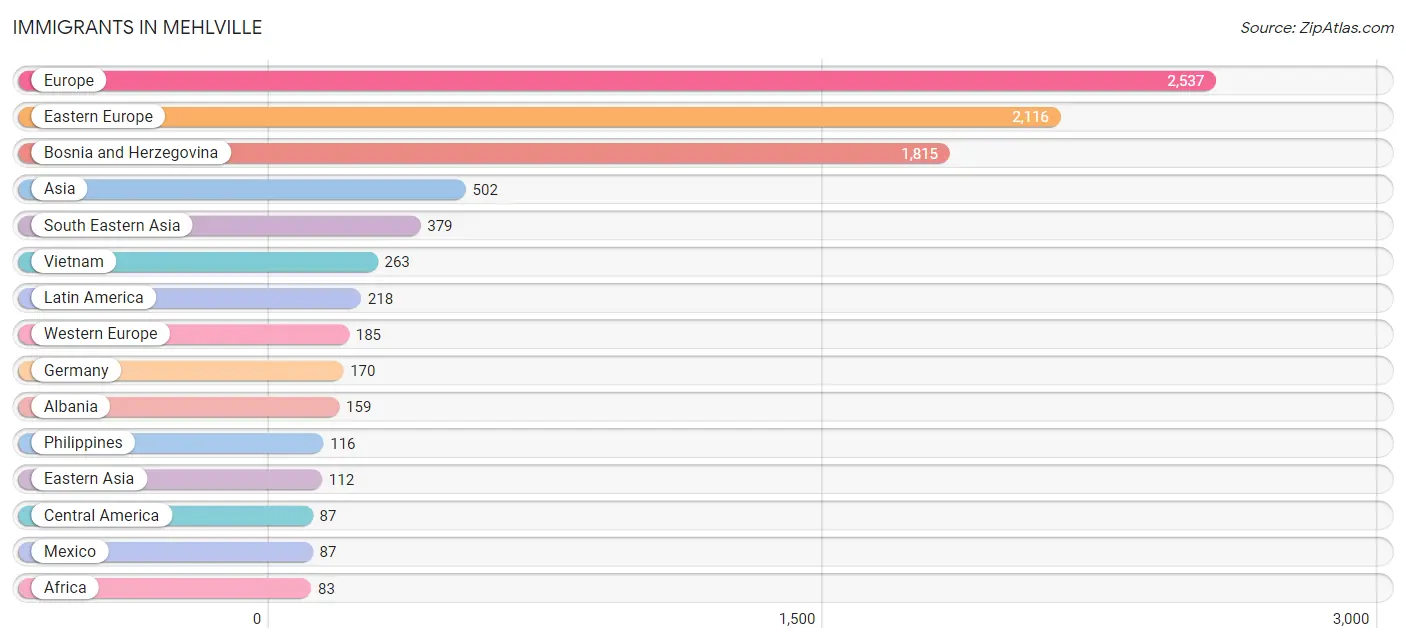
| Immigration Origin | # Population | % Population |
| Africa | 83 | 0.3% |
| Albania | 159 | 0.5% |
| Argentina | 1 | 0.0% |
| Asia | 502 | 1.7% |
| Austria | 15 | 0.1% |
| Bolivia | 32 | 0.1% |
| Bosnia and Herzegovina | 1,815 | 6.2% |
| Canada | 7 | 0.0% |
| Caribbean | 79 | 0.3% |
| Central America | 87 | 0.3% |
| China | 43 | 0.2% |
| Croatia | 72 | 0.3% |
| Eastern Africa | 51 | 0.2% |
| Eastern Asia | 112 | 0.4% |
| Eastern Europe | 2,116 | 7.3% |
| Ethiopia | 51 | 0.2% |
| Europe | 2,537 | 8.7% |
| Germany | 170 | 0.6% |
| Greece | 7 | 0.0% |
| Italy | 12 | 0.0% |
| Jamaica | 79 | 0.3% |
| Korea | 69 | 0.2% |
| Latin America | 218 | 0.7% |
| Mexico | 87 | 0.3% |
| Nigeria | 32 | 0.1% |
| Philippines | 116 | 0.4% |
| Russia | 48 | 0.2% |
| South America | 52 | 0.2% |
| South Eastern Asia | 379 | 1.3% |
| Southern Europe | 55 | 0.2% |
| Spain | 36 | 0.1% |
| Venezuela | 19 | 0.1% |
| Vietnam | 263 | 0.9% |
| Western Africa | 32 | 0.1% |
| Western Europe | 185 | 0.6% | View All 35 Rows |
Sex and Age in Mehlville
Sex and Age in Mehlville
The most populous age groups in Mehlville are 25 to 29 Years (1,247 | 8.6%) for men and 55 to 59 Years (1,149 | 7.9%) for women.
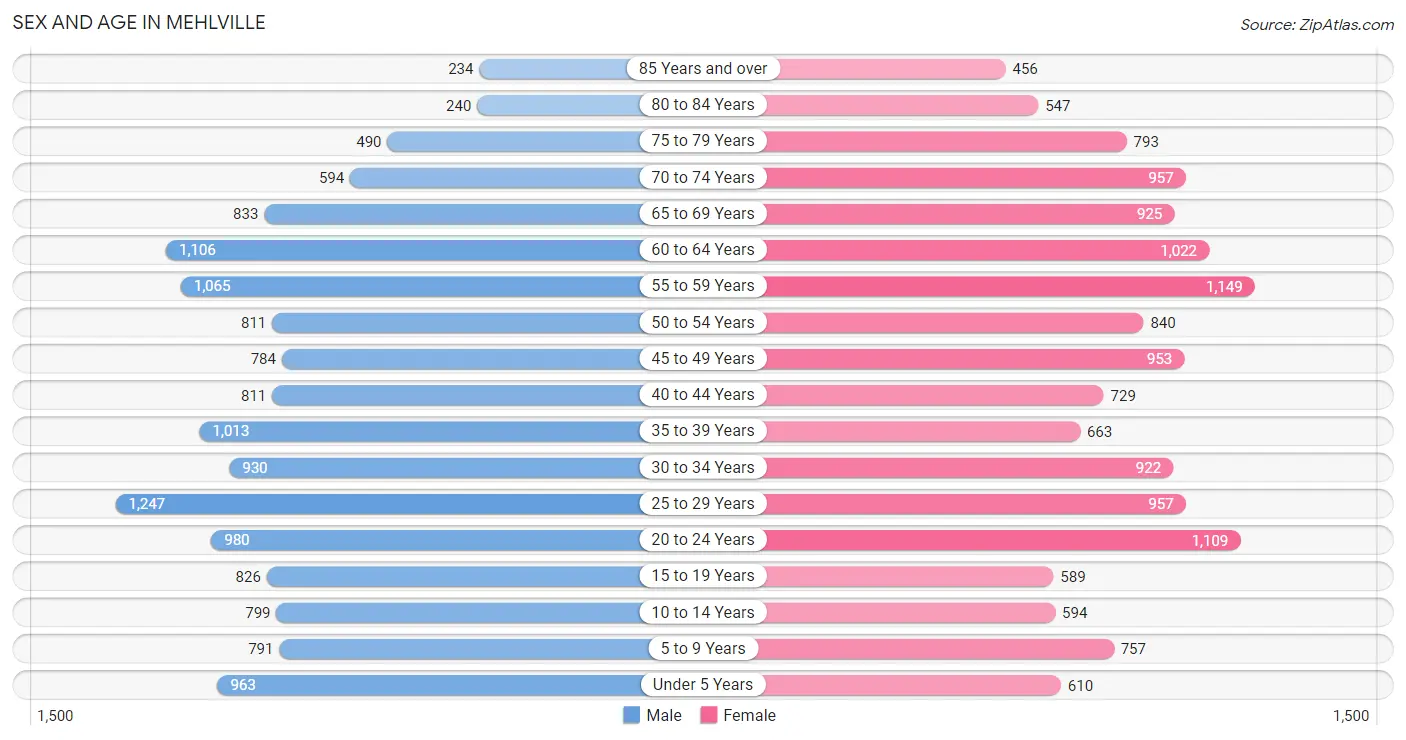
| Age Bracket | Male | Female |
| Under 5 Years | 963 (6.6%) | 610 (4.2%) |
| 5 to 9 Years | 791 (5.4%) | 757 (5.2%) |
| 10 to 14 Years | 799 (5.5%) | 594 (4.1%) |
| 15 to 19 Years | 826 (5.7%) | 589 (4.0%) |
| 20 to 24 Years | 980 (6.8%) | 1,109 (7.6%) |
| 25 to 29 Years | 1,247 (8.6%) | 957 (6.6%) |
| 30 to 34 Years | 930 (6.4%) | 922 (6.3%) |
| 35 to 39 Years | 1,013 (7.0%) | 663 (4.5%) |
| 40 to 44 Years | 811 (5.6%) | 729 (5.0%) |
| 45 to 49 Years | 784 (5.4%) | 953 (6.5%) |
| 50 to 54 Years | 811 (5.6%) | 840 (5.8%) |
| 55 to 59 Years | 1,065 (7.3%) | 1,149 (7.9%) |
| 60 to 64 Years | 1,106 (7.6%) | 1,022 (7.0%) |
| 65 to 69 Years | 833 (5.7%) | 925 (6.4%) |
| 70 to 74 Years | 594 (4.1%) | 957 (6.6%) |
| 75 to 79 Years | 490 (3.4%) | 793 (5.4%) |
| 80 to 84 Years | 240 (1.7%) | 547 (3.7%) |
| 85 Years and over | 234 (1.6%) | 456 (3.1%) |
| Total | 14,517 (100.0%) | 14,572 (100.0%) |
Families and Households in Mehlville
Median Family Size in Mehlville
The median family size in Mehlville is 2.79 persons per family, with married-couple families (5,561 | 73.6%) accounting for the largest median family size of 2.85 persons per family. On the other hand, single male/father families (503 | 6.7%) represent the smallest median family size with 2.44 persons per family.
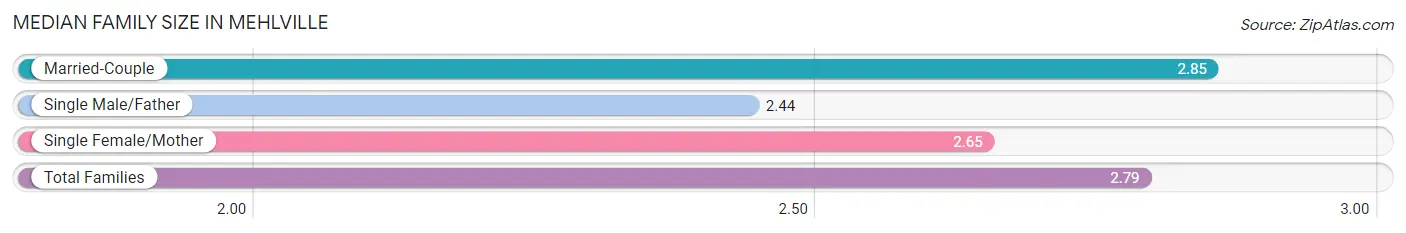
| Family Type | # Families | Family Size |
| Married-Couple | 5,561 (73.6%) | 2.85 |
| Single Male/Father | 503 (6.7%) | 2.44 |
| Single Female/Mother | 1,495 (19.8%) | 2.65 |
| Total Families | 7,559 (100.0%) | 2.79 |
Median Household Size in Mehlville
The median household size in Mehlville is 2.20 persons per household, with married-couple households (5,561 | 42.4%) accounting for the largest median household size of 2.96 persons per household. non-family households (5,553 | 42.3%) represent the smallest median household size with 1.19 persons per household.
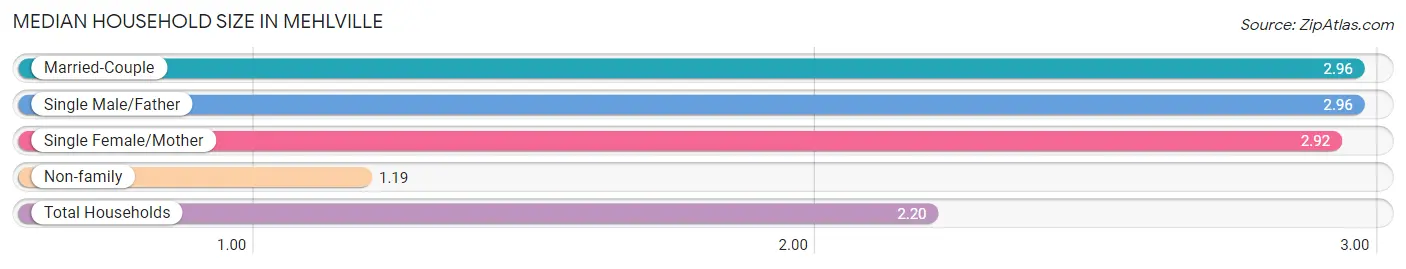
| Household Type | # Households | Household Size |
| Married-Couple | 5,561 (42.4%) | 2.96 |
| Single Male/Father | 503 (3.8%) | 2.96 |
| Single Female/Mother | 1,495 (11.4%) | 2.92 |
| Non-family | 5,553 (42.3%) | 1.19 |
| Total Households | 13,112 (100.0%) | 2.20 |
Household Size by Marriage Status in Mehlville
Out of a total of 13,112 households in Mehlville, 7,559 (57.7%) are family households, while 5,553 (42.3%) are nonfamily households. The most numerous type of family households are 2-person households, comprising 3,658, and the most common type of nonfamily households are 1-person households, comprising 4,738.
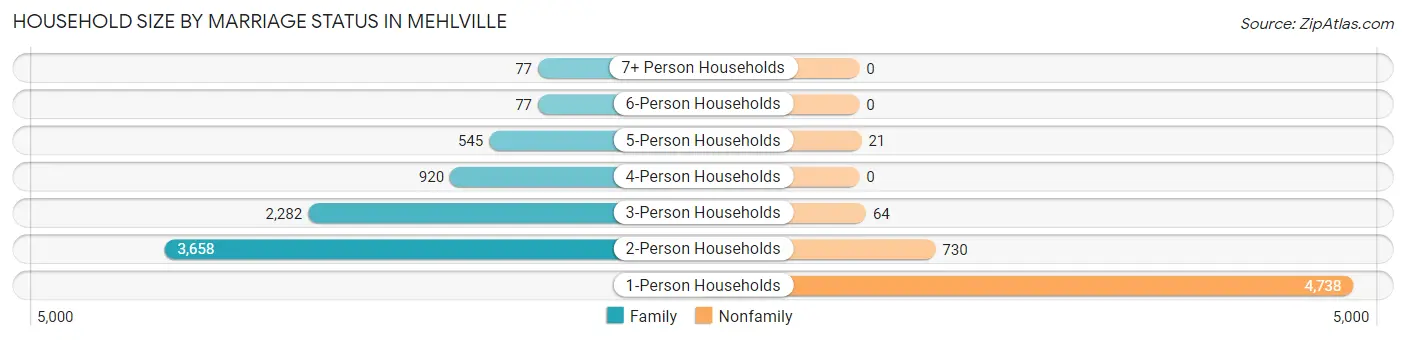
| Household Size | Family Households | Nonfamily Households |
| 1-Person Households | - | 4,738 (36.1%) |
| 2-Person Households | 3,658 (27.9%) | 730 (5.6%) |
| 3-Person Households | 2,282 (17.4%) | 64 (0.5%) |
| 4-Person Households | 920 (7.0%) | 0 (0.0%) |
| 5-Person Households | 545 (4.2%) | 21 (0.2%) |
| 6-Person Households | 77 (0.6%) | 0 (0.0%) |
| 7+ Person Households | 77 (0.6%) | 0 (0.0%) |
| Total | 7,559 (57.7%) | 5,553 (42.3%) |
Female Fertility in Mehlville
Fertility by Age in Mehlville
Average fertility rate in Mehlville is 46.0 births per 1,000 women. Women in the age bracket of 20 to 34 years have the highest fertility rate with 83.0 births per 1,000 women. Women in the age bracket of 20 to 34 years acount for 88.8% of all women with births.
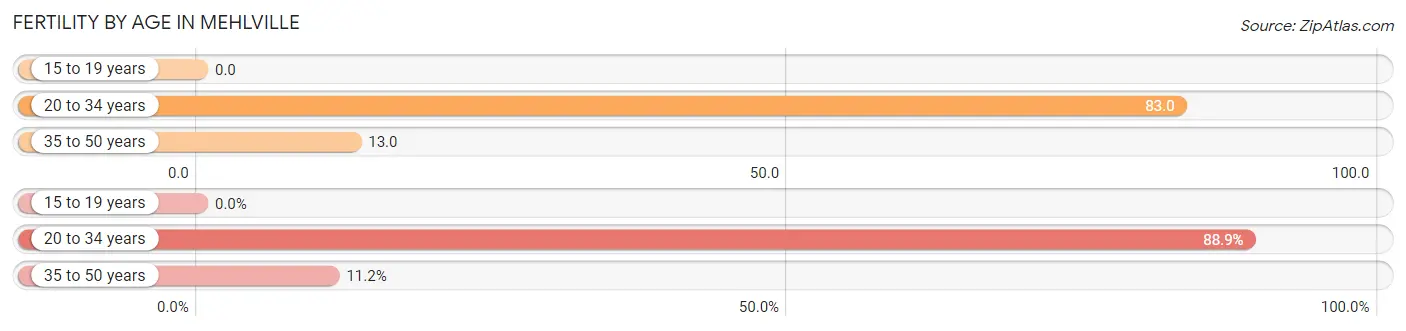
| Age Bracket | Women with Births | Births / 1,000 Women |
| 15 to 19 years | 0 (0.0%) | 0.0 |
| 20 to 34 years | 247 (88.8%) | 83.0 |
| 35 to 50 years | 31 (11.2%) | 13.0 |
| Total | 278 (100.0%) | 46.0 |
Fertility by Age by Marriage Status in Mehlville
46.8% of women with births (278) in Mehlville are married. The highest percentage of unmarried women with births falls into 20 to 34 years age bracket with 59.9% of them unmarried at the time of birth, while the lowest percentage of unmarried women with births belong to 35 to 50 years age bracket with 0.0% of them unmarried.
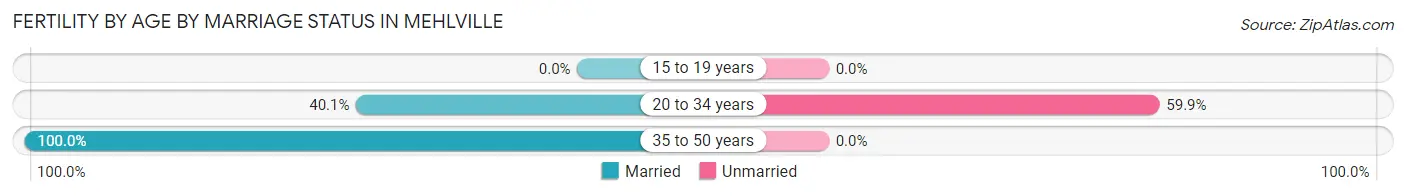
| Age Bracket | Married | Unmarried |
| 15 to 19 years | 0 (0.0%) | 0 (0.0%) |
| 20 to 34 years | 99 (40.1%) | 148 (59.9%) |
| 35 to 50 years | 31 (100.0%) | 0 (0.0%) |
| Total | 130 (46.8%) | 148 (53.2%) |
Fertility by Education in Mehlville
Average fertility rate in Mehlville is 46.0 births per 1,000 women. Women with the education attainment of high school diploma have the highest fertility rate of 72.0 births per 1,000 women, while women with the education attainment of graduate degree have the lowest fertility at 22.0 births per 1,000 women. Women with the education attainment of college or associate's degree represent 40.3% of all women with births.
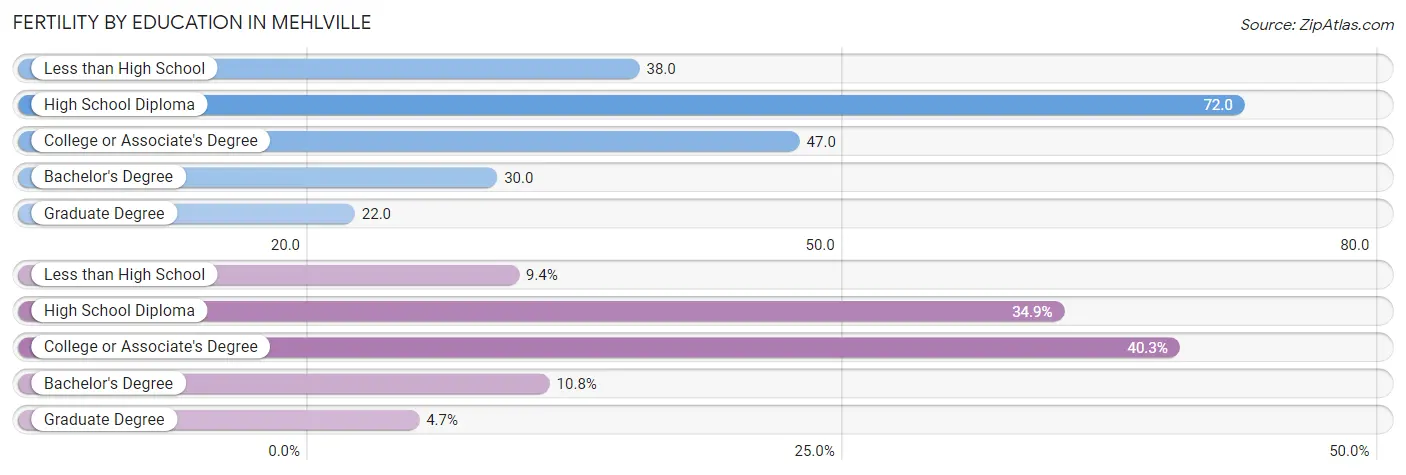
| Educational Attainment | Women with Births | Births / 1,000 Women |
| Less than High School | 26 (9.3%) | 38.0 |
| High School Diploma | 97 (34.9%) | 72.0 |
| College or Associate's Degree | 112 (40.3%) | 47.0 |
| Bachelor's Degree | 30 (10.8%) | 30.0 |
| Graduate Degree | 13 (4.7%) | 22.0 |
| Total | 278 (100.0%) | 46.0 |
Fertility by Education by Marriage Status in Mehlville
53.2% of women with births in Mehlville are unmarried. Women with the educational attainment of graduate degree are most likely to be married with 100.0% of them married at childbirth, while women with the educational attainment of less than high school are least likely to be married with 80.8% of them unmarried at childbirth.
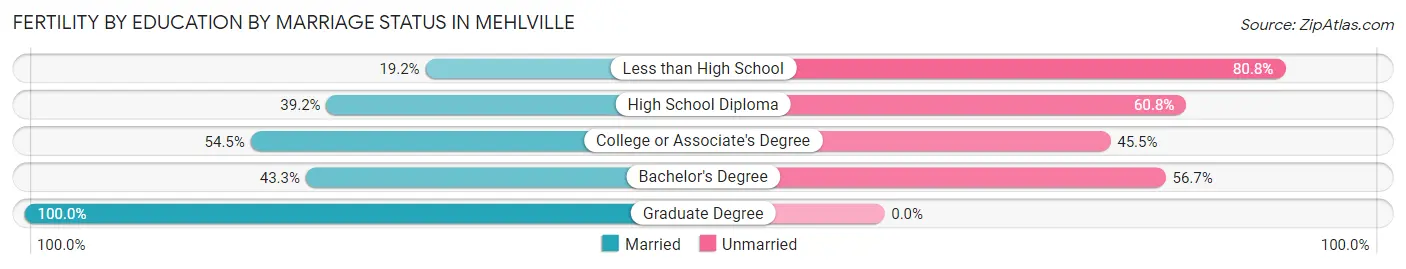
| Educational Attainment | Married | Unmarried |
| Less than High School | 5 (19.2%) | 21 (80.8%) |
| High School Diploma | 38 (39.2%) | 59 (60.8%) |
| College or Associate's Degree | 61 (54.5%) | 51 (45.5%) |
| Bachelor's Degree | 13 (43.3%) | 17 (56.7%) |
| Graduate Degree | 13 (100.0%) | 0 (0.0%) |
| Total | 130 (46.8%) | 148 (53.2%) |
Employment Characteristics in Mehlville
Employment by Class of Employer in Mehlville
Among the 14,358 employed individuals in Mehlville, private company employees (11,000 | 76.6%), not-for-profit organizations (1,226 | 8.5%), and local government employees (740 | 5.1%) make up the most common classes of employment.
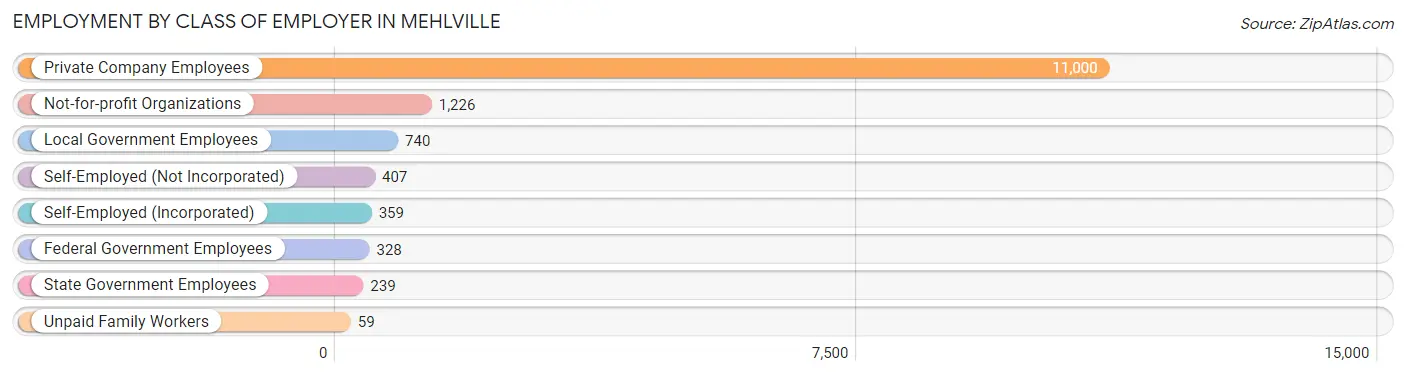
| Employer Class | # Employees | % Employees |
| Private Company Employees | 11,000 | 76.6% |
| Self-Employed (Incorporated) | 359 | 2.5% |
| Self-Employed (Not Incorporated) | 407 | 2.8% |
| Not-for-profit Organizations | 1,226 | 8.5% |
| Local Government Employees | 740 | 5.1% |
| State Government Employees | 239 | 1.7% |
| Federal Government Employees | 328 | 2.3% |
| Unpaid Family Workers | 59 | 0.4% |
| Total | 14,358 | 100.0% |
Employment Status by Age in Mehlville
According to the labor force statistics for Mehlville, out of the total population over 16 years of age (24,315), 63.3% or 15,391 individuals are in the labor force, with 3.8% or 585 of them unemployed. The age group with the highest labor force participation rate is 35 to 44 years, with 91.2% or 2,933 individuals in the labor force. Within the labor force, the 65 to 74 years age range has the highest percentage of unemployed individuals, with 11.0% or 69 of them being unemployed.
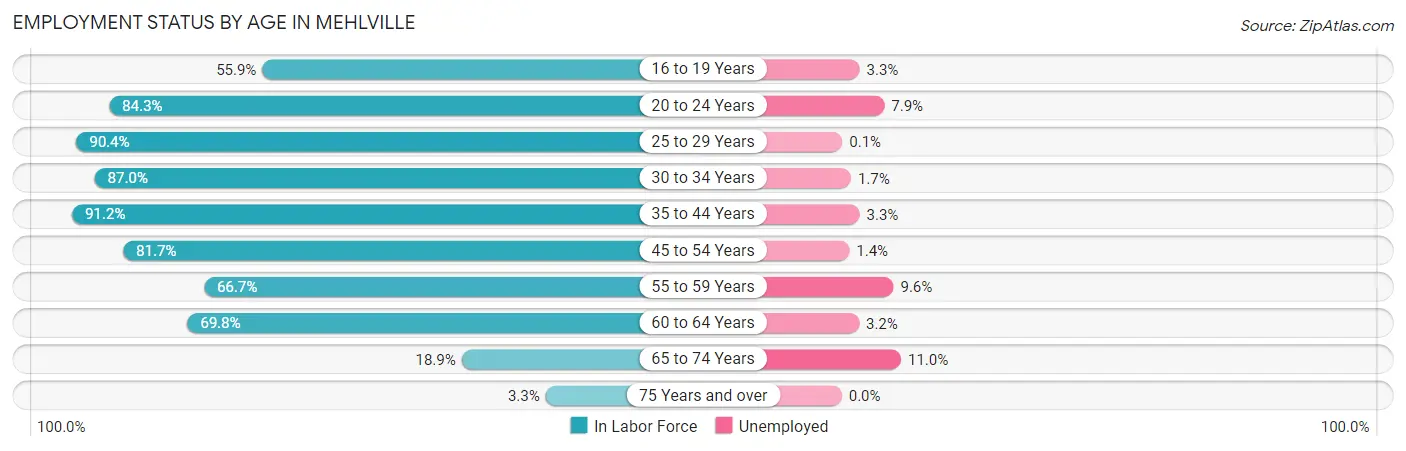
| Age Bracket | In Labor Force | Unemployed |
| 16 to 19 Years | 646 (55.9%) | 21 (3.3%) |
| 20 to 24 Years | 1,761 (84.3%) | 139 (7.9%) |
| 25 to 29 Years | 1,992 (90.4%) | 2 (0.1%) |
| 30 to 34 Years | 1,611 (87.0%) | 27 (1.7%) |
| 35 to 44 Years | 2,933 (91.2%) | 97 (3.3%) |
| 45 to 54 Years | 2,768 (81.7%) | 39 (1.4%) |
| 55 to 59 Years | 1,477 (66.7%) | 142 (9.6%) |
| 60 to 64 Years | 1,485 (69.8%) | 48 (3.2%) |
| 65 to 74 Years | 625 (18.9%) | 69 (11.0%) |
| 75 Years and over | 91 (3.3%) | 0 (0.0%) |
| Total | 15,391 (63.3%) | 585 (3.8%) |
Employment Status by Educational Attainment in Mehlville
According to labor force statistics for Mehlville, 81.8% of individuals (12,272) out of the total population between 25 and 64 years of age (15,002) are in the labor force, with 2.9% or 356 of them being unemployed. The group with the highest labor force participation rate are those with the educational attainment of bachelor's degree or higher, with 90.0% or 4,505 individuals in the labor force. Within the labor force, individuals with college / associate degree education have the highest percentage of unemployment, with 6.6% or 252 of them being unemployed.
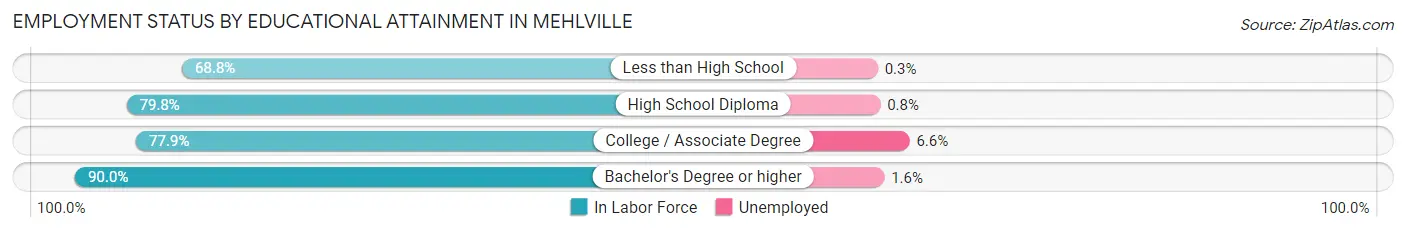
| Educational Attainment | In Labor Force | Unemployed |
| Less than High School | 746 (68.8%) | 3 (0.3%) |
| High School Diploma | 3,194 (79.8%) | 32 (0.8%) |
| College / Associate Degree | 3,824 (77.9%) | 324 (6.6%) |
| Bachelor's Degree or higher | 4,505 (90.0%) | 80 (1.6%) |
| Total | 12,272 (81.8%) | 435 (2.9%) |
Employment Occupations by Sex in Mehlville
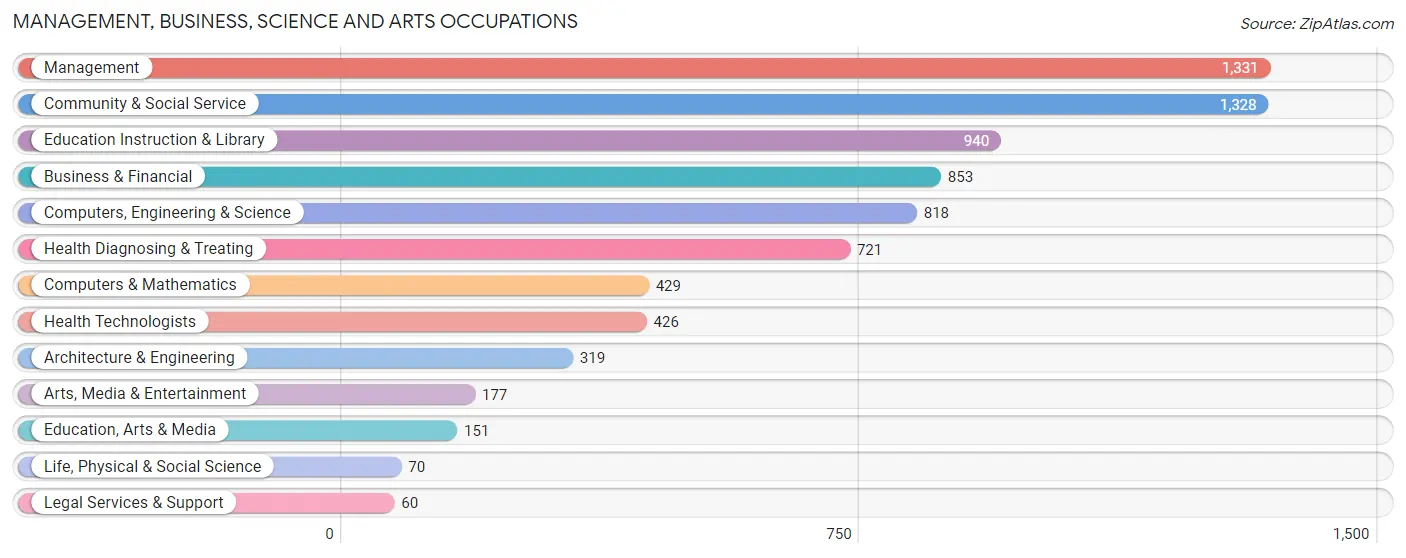
Management, Business, Science and Arts Occupations
The most common Management, Business, Science and Arts occupations in Mehlville are Management (1,331 | 9.0%), Community & Social Service (1,328 | 9.0%), Education Instruction & Library (940 | 6.4%), Business & Financial (853 | 5.8%), and Computers, Engineering & Science (818 | 5.5%).
Management, Business, Science and Arts Occupations by Sex
Within the Management, Business, Science and Arts occupations in Mehlville, the most male-oriented occupations are Architecture & Engineering (86.2%), Computers & Mathematics (85.3%), and Computers, Engineering & Science (78.4%), while the most female-oriented occupations are Life, Physical & Social Science (100.0%), Legal Services & Support (100.0%), and Health Technologists (81.9%).
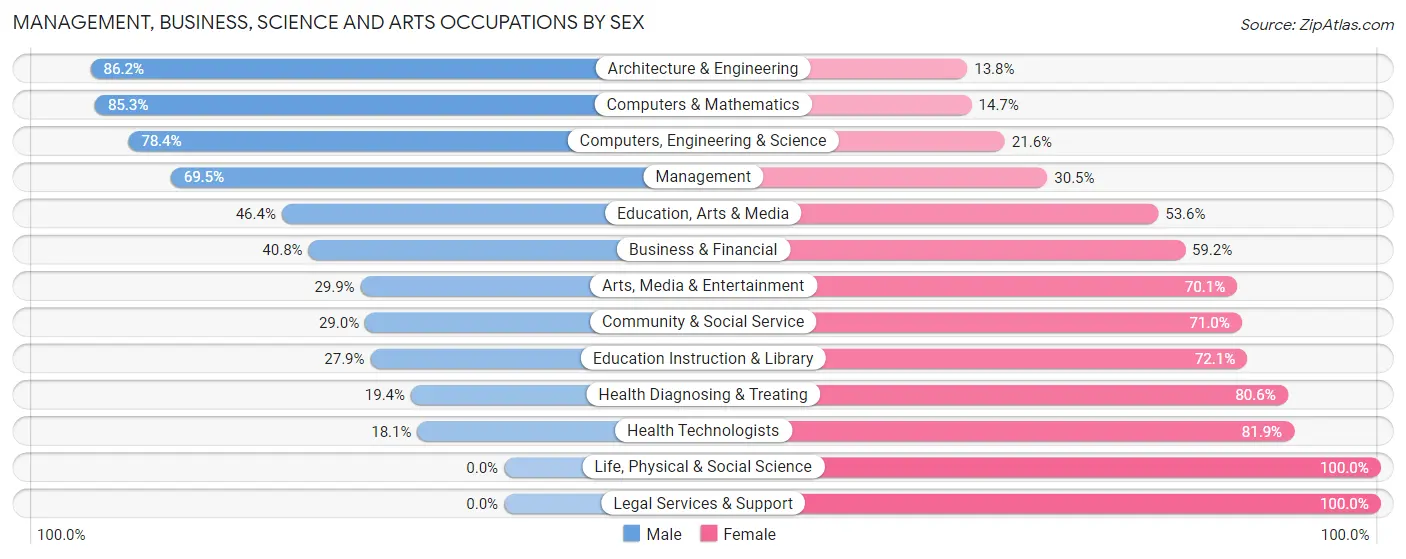
| Occupation | Male | Female |
| Management | 925 (69.5%) | 406 (30.5%) |
| Business & Financial | 348 (40.8%) | 505 (59.2%) |
| Computers, Engineering & Science | 641 (78.4%) | 177 (21.6%) |
| Computers & Mathematics | 366 (85.3%) | 63 (14.7%) |
| Architecture & Engineering | 275 (86.2%) | 44 (13.8%) |
| Life, Physical & Social Science | 0 (0.0%) | 70 (100.0%) |
| Community & Social Service | 385 (29.0%) | 943 (71.0%) |
| Education, Arts & Media | 70 (46.4%) | 81 (53.6%) |
| Legal Services & Support | 0 (0.0%) | 60 (100.0%) |
| Education Instruction & Library | 262 (27.9%) | 678 (72.1%) |
| Arts, Media & Entertainment | 53 (29.9%) | 124 (70.1%) |
| Health Diagnosing & Treating | 140 (19.4%) | 581 (80.6%) |
| Health Technologists | 77 (18.1%) | 349 (81.9%) |
| Total (Category) | 2,439 (48.3%) | 2,612 (51.7%) |
| Total (Overall) | 7,719 (52.1%) | 7,091 (47.9%) |
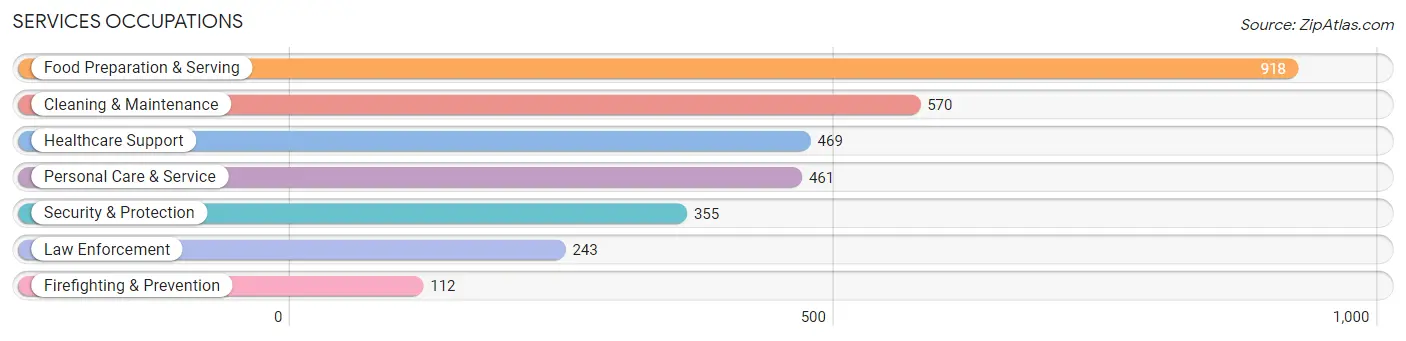
Services Occupations
The most common Services occupations in Mehlville are Food Preparation & Serving (918 | 6.2%), Cleaning & Maintenance (570 | 3.8%), Healthcare Support (469 | 3.2%), Personal Care & Service (461 | 3.1%), and Security & Protection (355 | 2.4%).
Services Occupations by Sex
Within the Services occupations in Mehlville, the most male-oriented occupations are Law Enforcement (93.8%), Security & Protection (93.0%), and Firefighting & Prevention (91.1%), while the most female-oriented occupations are Healthcare Support (90.4%), Food Preparation & Serving (62.7%), and Personal Care & Service (52.3%).
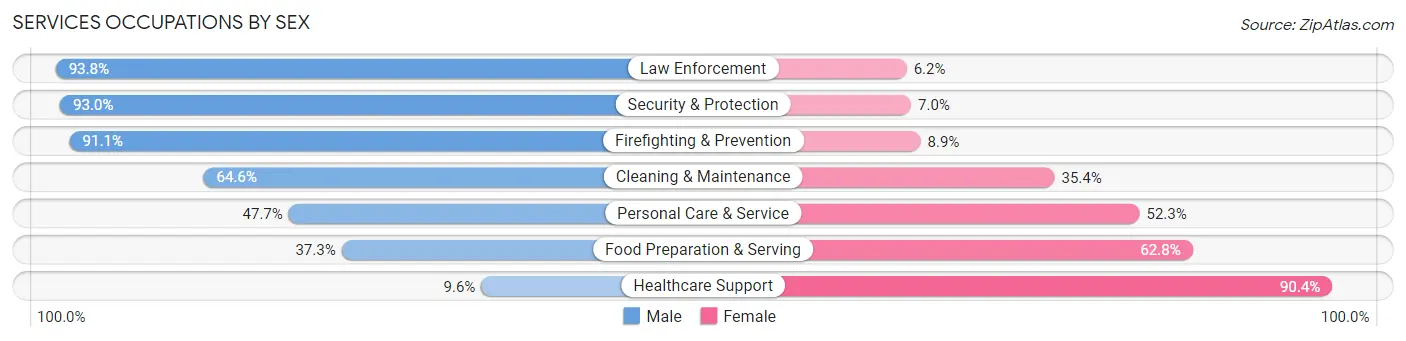
| Occupation | Male | Female |
| Healthcare Support | 45 (9.6%) | 424 (90.4%) |
| Security & Protection | 330 (93.0%) | 25 (7.0%) |
| Firefighting & Prevention | 102 (91.1%) | 10 (8.9%) |
| Law Enforcement | 228 (93.8%) | 15 (6.2%) |
| Food Preparation & Serving | 342 (37.2%) | 576 (62.7%) |
| Cleaning & Maintenance | 368 (64.6%) | 202 (35.4%) |
| Personal Care & Service | 220 (47.7%) | 241 (52.3%) |
| Total (Category) | 1,305 (47.1%) | 1,468 (52.9%) |
| Total (Overall) | 7,719 (52.1%) | 7,091 (47.9%) |
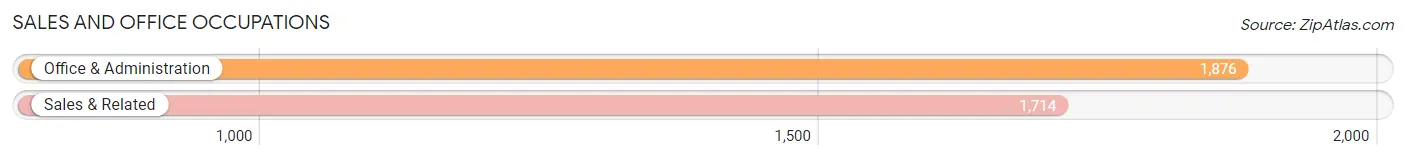
Sales and Office Occupations
The most common Sales and Office occupations in Mehlville are Office & Administration (1,876 | 12.7%), and Sales & Related (1,714 | 11.6%).
Sales and Office Occupations by Sex
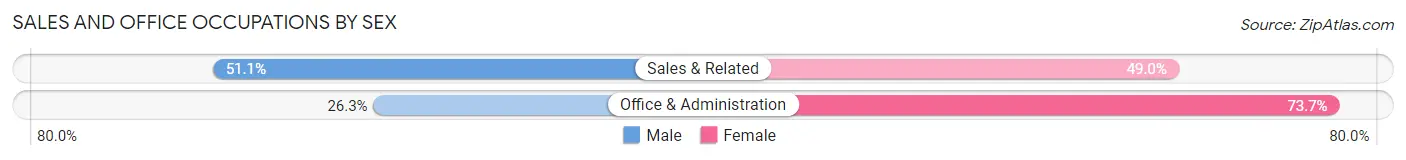
| Occupation | Male | Female |
| Sales & Related | 875 (51.0%) | 839 (48.9%) |
| Office & Administration | 494 (26.3%) | 1,382 (73.7%) |
| Total (Category) | 1,369 (38.1%) | 2,221 (61.9%) |
| Total (Overall) | 7,719 (52.1%) | 7,091 (47.9%) |
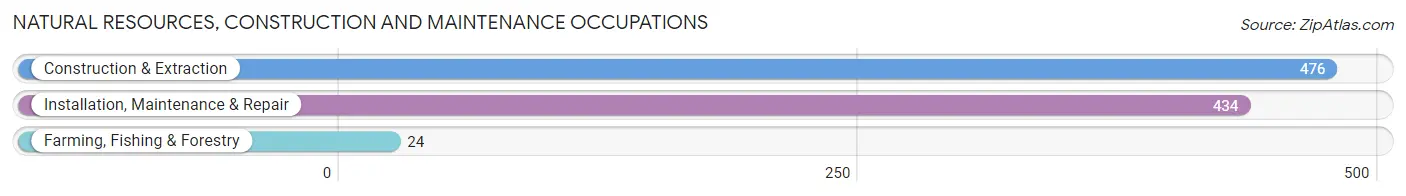
Natural Resources, Construction and Maintenance Occupations
The most common Natural Resources, Construction and Maintenance occupations in Mehlville are Construction & Extraction (476 | 3.2%), Installation, Maintenance & Repair (434 | 2.9%), and Farming, Fishing & Forestry (24 | 0.2%).
Natural Resources, Construction and Maintenance Occupations by Sex
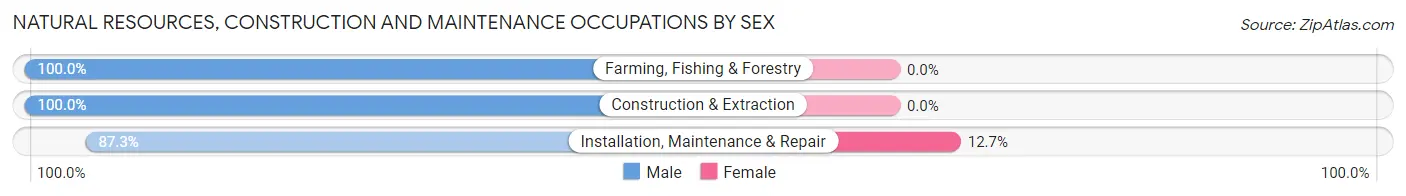
| Occupation | Male | Female |
| Farming, Fishing & Forestry | 24 (100.0%) | 0 (0.0%) |
| Construction & Extraction | 476 (100.0%) | 0 (0.0%) |
| Installation, Maintenance & Repair | 379 (87.3%) | 55 (12.7%) |
| Total (Category) | 879 (94.1%) | 55 (5.9%) |
| Total (Overall) | 7,719 (52.1%) | 7,091 (47.9%) |
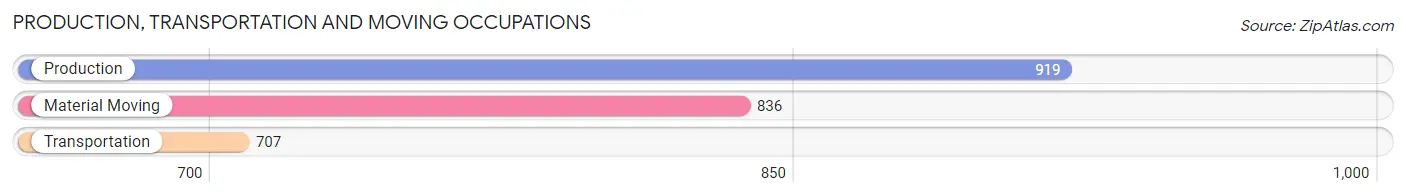
Production, Transportation and Moving Occupations
The most common Production, Transportation and Moving occupations in Mehlville are Production (919 | 6.2%), Material Moving (836 | 5.6%), and Transportation (707 | 4.8%).
Production, Transportation and Moving Occupations by Sex
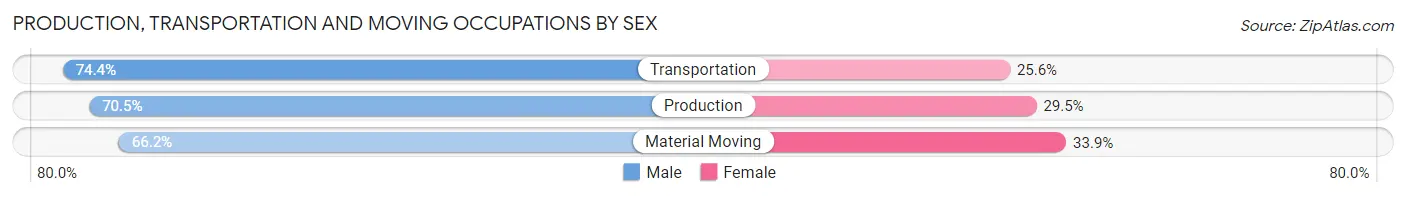
| Occupation | Male | Female |
| Production | 648 (70.5%) | 271 (29.5%) |
| Transportation | 526 (74.4%) | 181 (25.6%) |
| Material Moving | 553 (66.1%) | 283 (33.9%) |
| Total (Category) | 1,727 (70.2%) | 735 (29.8%) |
| Total (Overall) | 7,719 (52.1%) | 7,091 (47.9%) |
Employment Industries by Sex in Mehlville
Employment Industries in Mehlville
The major employment industries in Mehlville include Retail Trade (2,051 | 13.9%), Health Care & Social Assistance (1,919 | 13.0%), Manufacturing (1,292 | 8.7%), Accommodation & Food Services (1,140 | 7.7%), and Educational Services (1,046 | 7.1%).
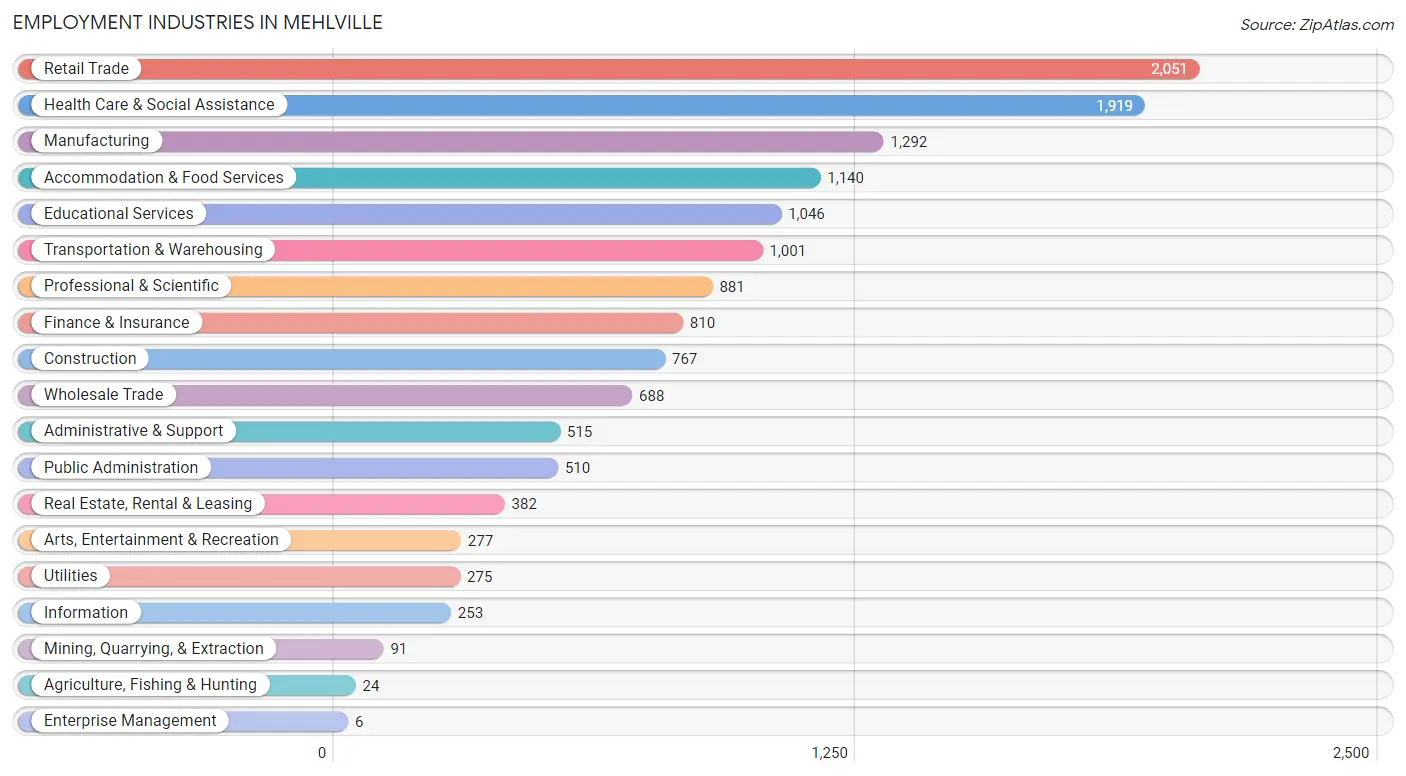
Employment Industries by Sex in Mehlville
The Mehlville industries that see more men than women are Agriculture, Fishing & Hunting (100.0%), Enterprise Management (100.0%), and Construction (92.8%), whereas the industries that tend to have a higher number of women are Educational Services (80.3%), Real Estate, Rental & Leasing (73.3%), and Health Care & Social Assistance (69.3%).
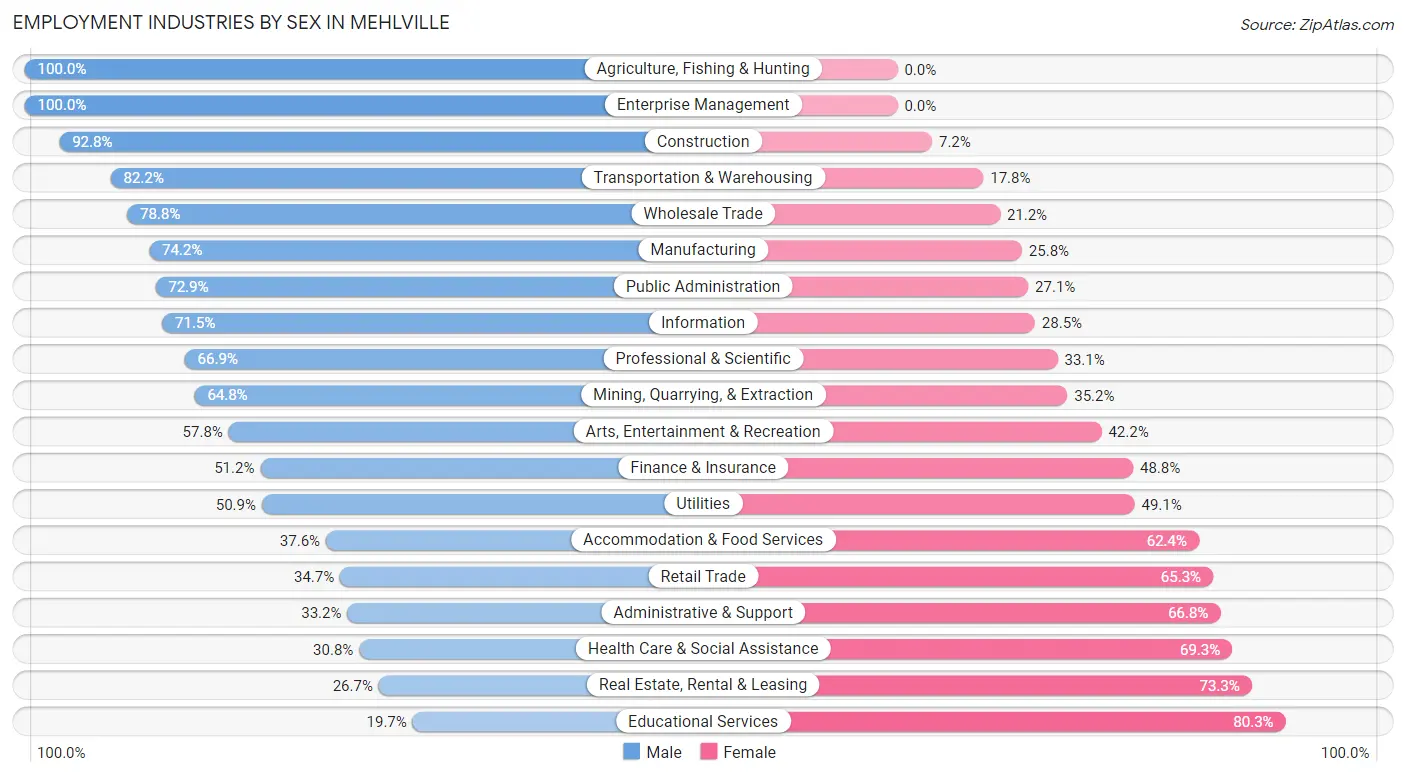
| Industry | Male | Female |
| Agriculture, Fishing & Hunting | 24 (100.0%) | 0 (0.0%) |
| Mining, Quarrying, & Extraction | 59 (64.8%) | 32 (35.2%) |
| Construction | 712 (92.8%) | 55 (7.2%) |
| Manufacturing | 959 (74.2%) | 333 (25.8%) |
| Wholesale Trade | 542 (78.8%) | 146 (21.2%) |
| Retail Trade | 712 (34.7%) | 1,339 (65.3%) |
| Transportation & Warehousing | 823 (82.2%) | 178 (17.8%) |
| Utilities | 140 (50.9%) | 135 (49.1%) |
| Information | 181 (71.5%) | 72 (28.5%) |
| Finance & Insurance | 415 (51.2%) | 395 (48.8%) |
| Real Estate, Rental & Leasing | 102 (26.7%) | 280 (73.3%) |
| Professional & Scientific | 589 (66.9%) | 292 (33.1%) |
| Enterprise Management | 6 (100.0%) | 0 (0.0%) |
| Administrative & Support | 171 (33.2%) | 344 (66.8%) |
| Educational Services | 206 (19.7%) | 840 (80.3%) |
| Health Care & Social Assistance | 590 (30.7%) | 1,329 (69.3%) |
| Arts, Entertainment & Recreation | 160 (57.8%) | 117 (42.2%) |
| Accommodation & Food Services | 429 (37.6%) | 711 (62.4%) |
| Public Administration | 372 (72.9%) | 138 (27.1%) |
| Total | 7,719 (52.1%) | 7,091 (47.9%) |
Education in Mehlville
School Enrollment in Mehlville
The most common levels of schooling among the 5,821 students in Mehlville are college / undergraduate (1,335 | 22.9%), middle school (1,266 | 21.7%), and high school (1,137 | 19.5%).
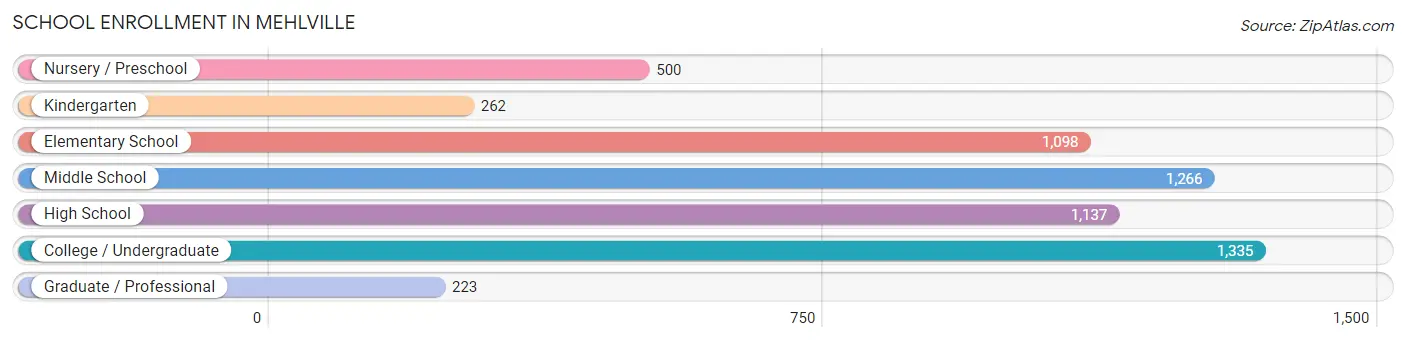
| School Level | # Students | % Students |
| Nursery / Preschool | 500 | 8.6% |
| Kindergarten | 262 | 4.5% |
| Elementary School | 1,098 | 18.9% |
| Middle School | 1,266 | 21.7% |
| High School | 1,137 | 19.5% |
| College / Undergraduate | 1,335 | 22.9% |
| Graduate / Professional | 223 | 3.8% |
| Total | 5,821 | 100.0% |
School Enrollment by Age by Funding Source in Mehlville
Out of a total of 5,821 students who are enrolled in schools in Mehlville, 1,374 (23.6%) attend a private institution, while the remaining 4,447 (76.4%) are enrolled in public schools. The age group of 3 to 4 year olds has the highest likelihood of being enrolled in private schools, with 202 (48.2% in the age bracket) enrolled. Conversely, the age group of 15 to 17 year olds has the lowest likelihood of being enrolled in a private school, with 773 (86.8% in the age bracket) attending a public institution.
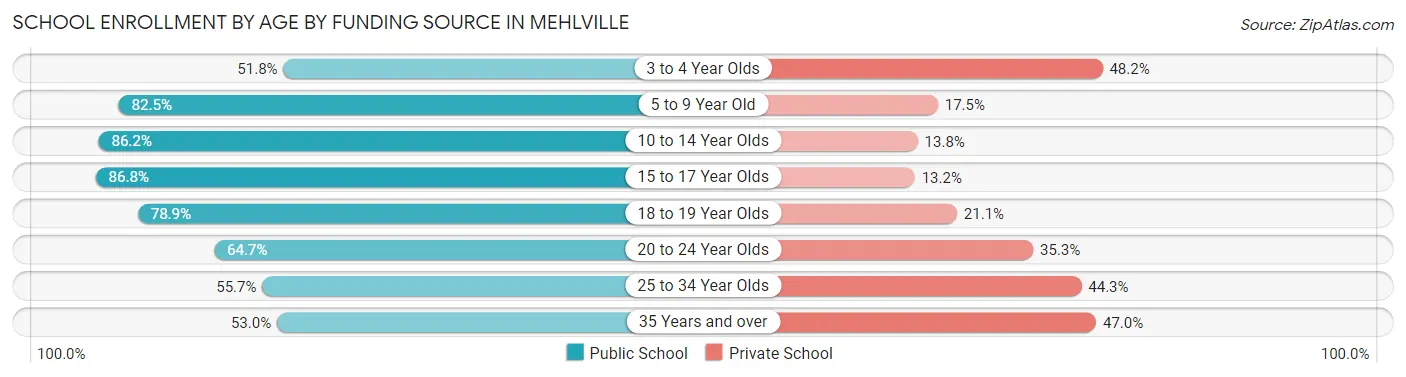
| Age Bracket | Public School | Private School |
| 3 to 4 Year Olds | 217 (51.8%) | 202 (48.2%) |
| 5 to 9 Year Old | 1,134 (82.5%) | 241 (17.5%) |
| 10 to 14 Year Olds | 1,201 (86.2%) | 192 (13.8%) |
| 15 to 17 Year Olds | 773 (86.8%) | 118 (13.2%) |
| 18 to 19 Year Olds | 318 (78.9%) | 85 (21.1%) |
| 20 to 24 Year Olds | 462 (64.7%) | 252 (35.3%) |
| 25 to 34 Year Olds | 209 (55.7%) | 166 (44.3%) |
| 35 Years and over | 133 (53.0%) | 118 (47.0%) |
| Total | 4,447 (76.4%) | 1,374 (23.6%) |
Educational Attainment by Field of Study in Mehlville
Business (1,840 | 26.8%), education (1,145 | 16.7%), arts & humanities (726 | 10.6%), science & technology (514 | 7.5%), and engineering (380 | 5.5%) are the most common fields of study among 6,865 individuals in Mehlville who have obtained a bachelor's degree or higher.
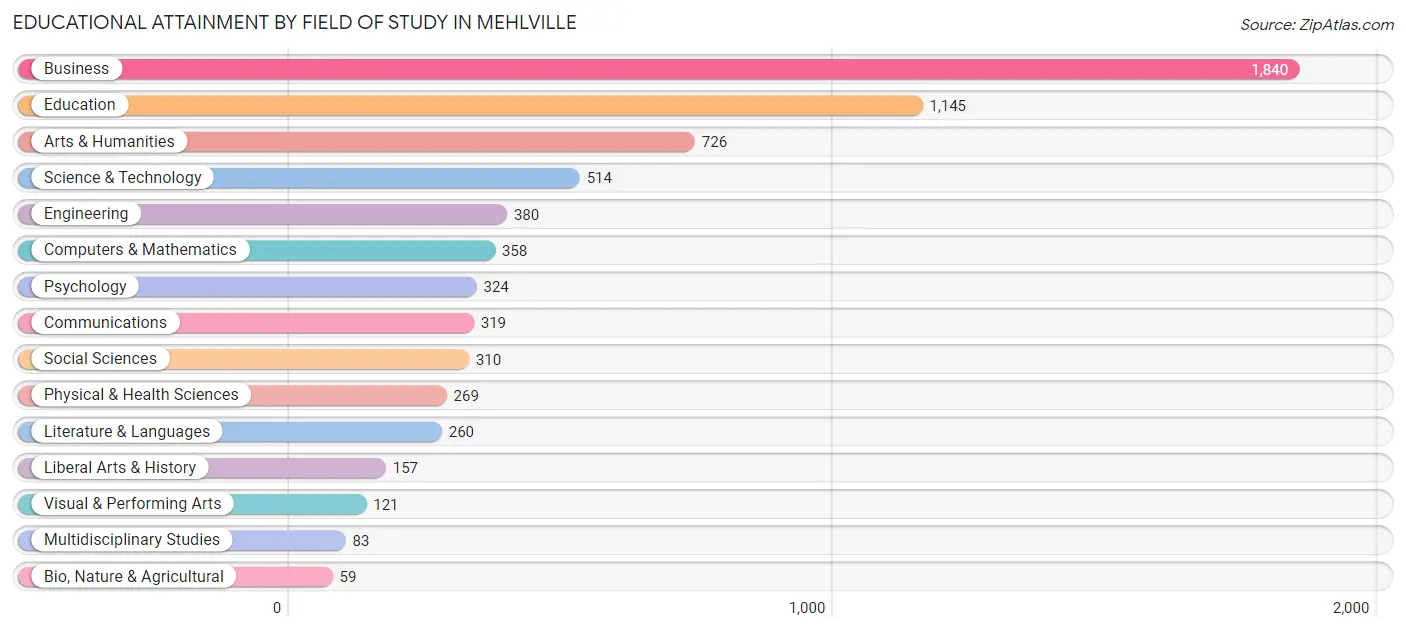
| Field of Study | # Graduates | % Graduates |
| Computers & Mathematics | 358 | 5.2% |
| Bio, Nature & Agricultural | 59 | 0.9% |
| Physical & Health Sciences | 269 | 3.9% |
| Psychology | 324 | 4.7% |
| Social Sciences | 310 | 4.5% |
| Engineering | 380 | 5.5% |
| Multidisciplinary Studies | 83 | 1.2% |
| Science & Technology | 514 | 7.5% |
| Business | 1,840 | 26.8% |
| Education | 1,145 | 16.7% |
| Literature & Languages | 260 | 3.8% |
| Liberal Arts & History | 157 | 2.3% |
| Visual & Performing Arts | 121 | 1.8% |
| Communications | 319 | 4.6% |
| Arts & Humanities | 726 | 10.6% |
| Total | 6,865 | 100.0% |
Transportation & Commute in Mehlville
Vehicle Availability by Sex in Mehlville
The most prevalent vehicle ownership categories in Mehlville are males with 2 vehicles (3,302, accounting for 43.0%) and females with 2 vehicles (2,785, making up 49.5%).
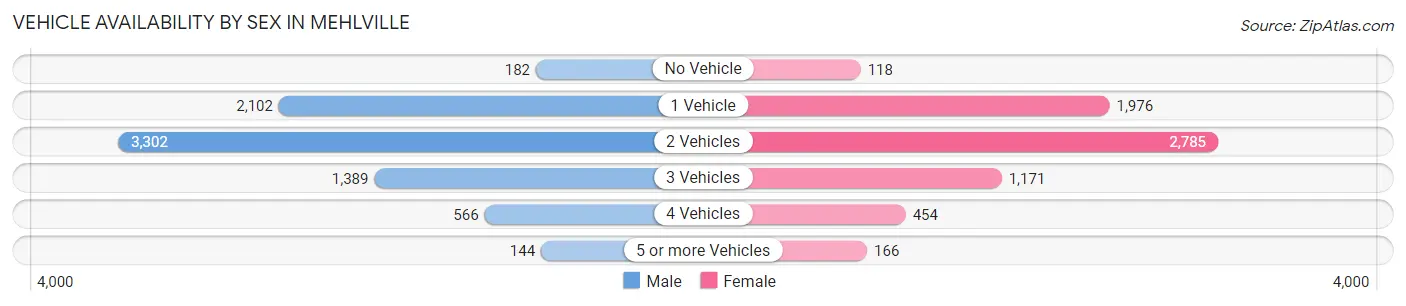
| Vehicles Available | Male | Female |
| No Vehicle | 182 (2.4%) | 118 (1.8%) |
| 1 Vehicle | 2,102 (27.4%) | 1,976 (29.6%) |
| 2 Vehicles | 3,302 (43.0%) | 2,785 (41.7%) |
| 3 Vehicles | 1,389 (18.1%) | 1,171 (17.6%) |
| 4 Vehicles | 566 (7.4%) | 454 (6.8%) |
| 5 or more Vehicles | 144 (1.9%) | 166 (2.5%) |
| Total | 7,685 (100.0%) | 6,670 (100.0%) |
Commute Time in Mehlville
The most frequently occuring commute durations in Mehlville are 30 to 34 minutes (2,569 commuters, 19.0%), 15 to 19 minutes (2,070 commuters, 15.3%), and 10 to 14 minutes (1,924 commuters, 14.3%).
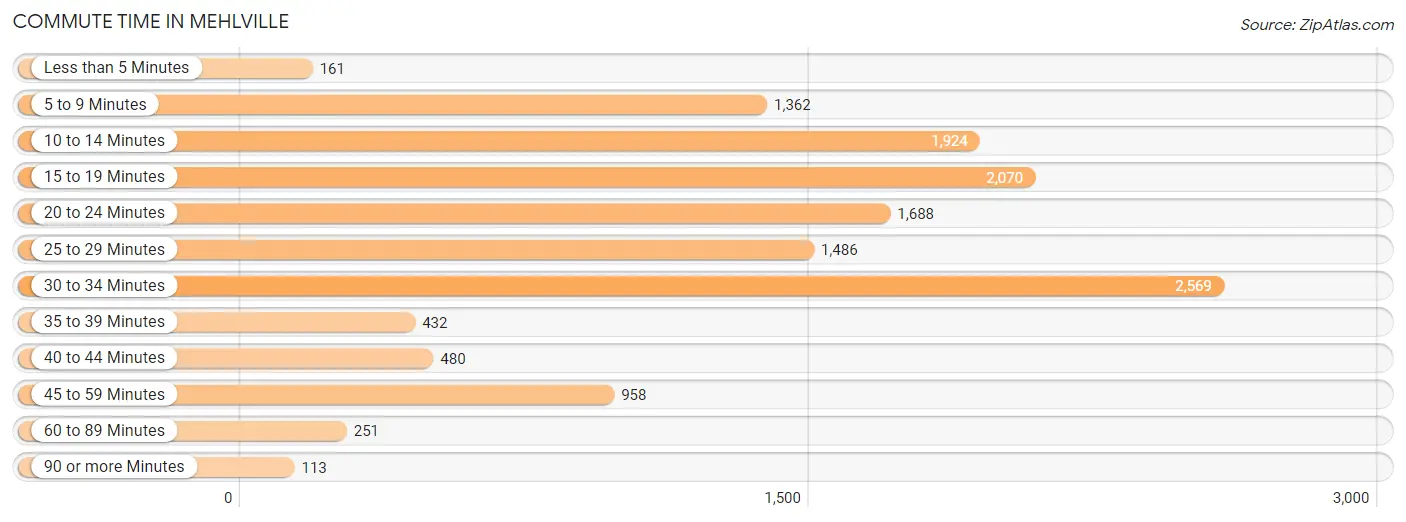
| Commute Time | # Commuters | % Commuters |
| Less than 5 Minutes | 161 | 1.2% |
| 5 to 9 Minutes | 1,362 | 10.1% |
| 10 to 14 Minutes | 1,924 | 14.3% |
| 15 to 19 Minutes | 2,070 | 15.3% |
| 20 to 24 Minutes | 1,688 | 12.5% |
| 25 to 29 Minutes | 1,486 | 11.0% |
| 30 to 34 Minutes | 2,569 | 19.0% |
| 35 to 39 Minutes | 432 | 3.2% |
| 40 to 44 Minutes | 480 | 3.6% |
| 45 to 59 Minutes | 958 | 7.1% |
| 60 to 89 Minutes | 251 | 1.9% |
| 90 or more Minutes | 113 | 0.8% |
Commute Time by Sex in Mehlville
The most common commute times in Mehlville are 30 to 34 minutes (1,294 commuters, 17.6%) for males and 30 to 34 minutes (1,275 commuters, 20.7%) for females.
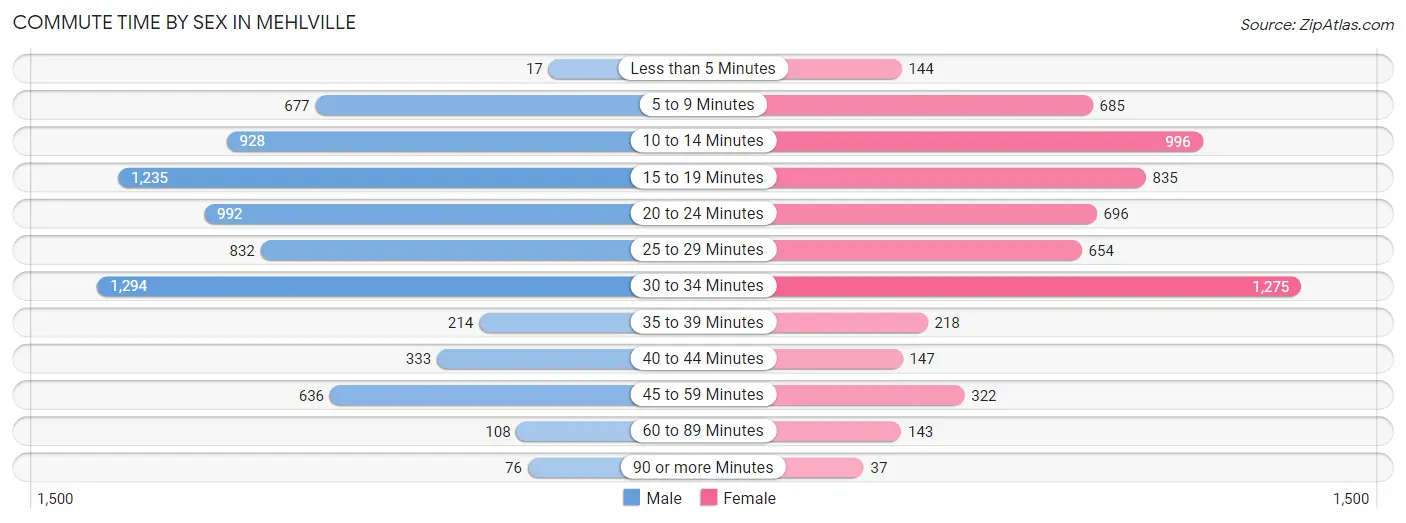
| Commute Time | Male | Female |
| Less than 5 Minutes | 17 (0.2%) | 144 (2.3%) |
| 5 to 9 Minutes | 677 (9.2%) | 685 (11.1%) |
| 10 to 14 Minutes | 928 (12.6%) | 996 (16.2%) |
| 15 to 19 Minutes | 1,235 (16.8%) | 835 (13.6%) |
| 20 to 24 Minutes | 992 (13.5%) | 696 (11.3%) |
| 25 to 29 Minutes | 832 (11.3%) | 654 (10.6%) |
| 30 to 34 Minutes | 1,294 (17.6%) | 1,275 (20.7%) |
| 35 to 39 Minutes | 214 (2.9%) | 218 (3.5%) |
| 40 to 44 Minutes | 333 (4.5%) | 147 (2.4%) |
| 45 to 59 Minutes | 636 (8.7%) | 322 (5.2%) |
| 60 to 89 Minutes | 108 (1.5%) | 143 (2.3%) |
| 90 or more Minutes | 76 (1.0%) | 37 (0.6%) |
Time of Departure to Work by Sex in Mehlville
The most frequent times of departure to work in Mehlville are 7:00 AM to 7:29 AM (1,080, 14.7%) for males and 7:00 AM to 7:29 AM (1,083, 17.6%) for females.
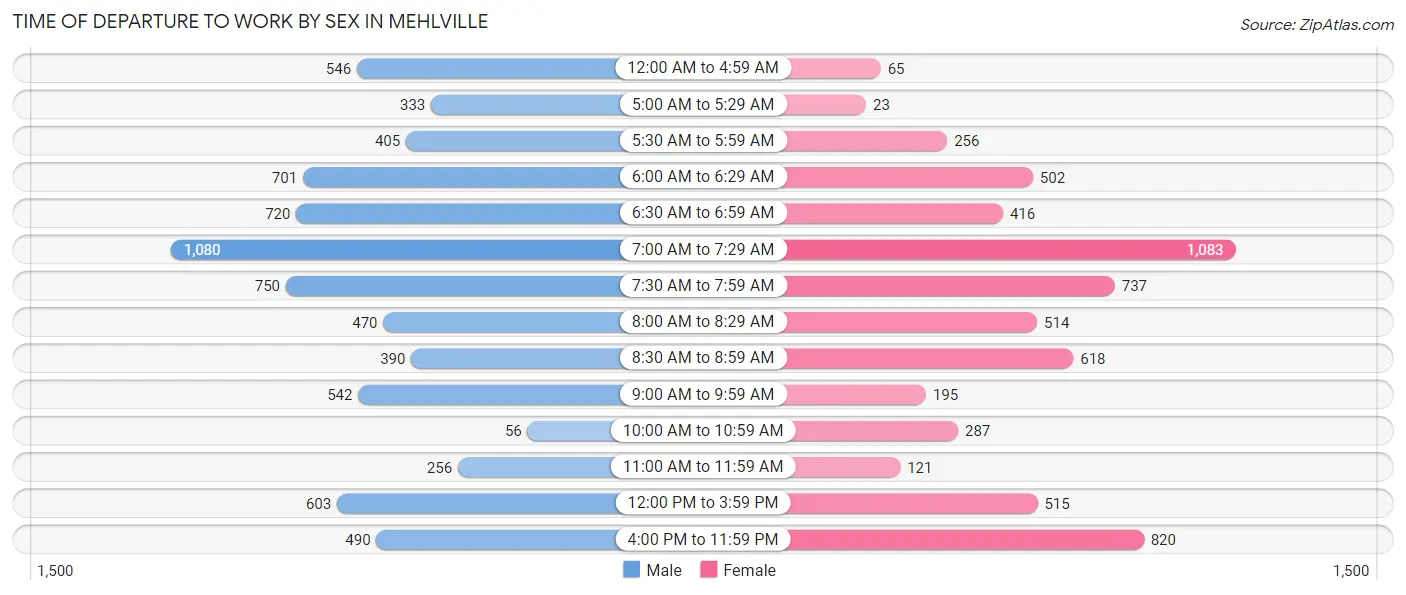
| Time of Departure | Male | Female |
| 12:00 AM to 4:59 AM | 546 (7.4%) | 65 (1.1%) |
| 5:00 AM to 5:29 AM | 333 (4.5%) | 23 (0.4%) |
| 5:30 AM to 5:59 AM | 405 (5.5%) | 256 (4.2%) |
| 6:00 AM to 6:29 AM | 701 (9.6%) | 502 (8.2%) |
| 6:30 AM to 6:59 AM | 720 (9.8%) | 416 (6.8%) |
| 7:00 AM to 7:29 AM | 1,080 (14.7%) | 1,083 (17.6%) |
| 7:30 AM to 7:59 AM | 750 (10.2%) | 737 (12.0%) |
| 8:00 AM to 8:29 AM | 470 (6.4%) | 514 (8.4%) |
| 8:30 AM to 8:59 AM | 390 (5.3%) | 618 (10.1%) |
| 9:00 AM to 9:59 AM | 542 (7.4%) | 195 (3.2%) |
| 10:00 AM to 10:59 AM | 56 (0.8%) | 287 (4.7%) |
| 11:00 AM to 11:59 AM | 256 (3.5%) | 121 (2.0%) |
| 12:00 PM to 3:59 PM | 603 (8.2%) | 515 (8.4%) |
| 4:00 PM to 11:59 PM | 490 (6.7%) | 820 (13.3%) |
| Total | 7,342 (100.0%) | 6,152 (100.0%) |
Housing Occupancy in Mehlville
Occupancy by Ownership in Mehlville
Of the total 13,112 dwellings in Mehlville, owner-occupied units account for 8,415 (64.2%), while renter-occupied units make up 4,697 (35.8%).
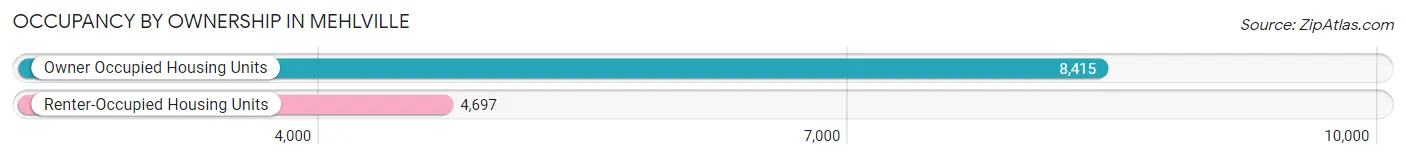
| Occupancy | # Housing Units | % Housing Units |
| Owner Occupied Housing Units | 8,415 | 64.2% |
| Renter-Occupied Housing Units | 4,697 | 35.8% |
| Total Occupied Housing Units | 13,112 | 100.0% |
Occupancy by Household Size in Mehlville
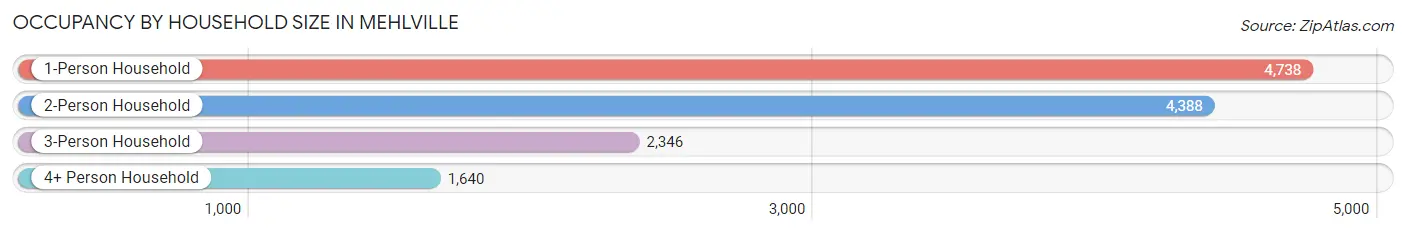
| Household Size | # Housing Units | % Housing Units |
| 1-Person Household | 4,738 | 36.1% |
| 2-Person Household | 4,388 | 33.5% |
| 3-Person Household | 2,346 | 17.9% |
| 4+ Person Household | 1,640 | 12.5% |
| Total Housing Units | 13,112 | 100.0% |
Occupancy by Ownership by Household Size in Mehlville
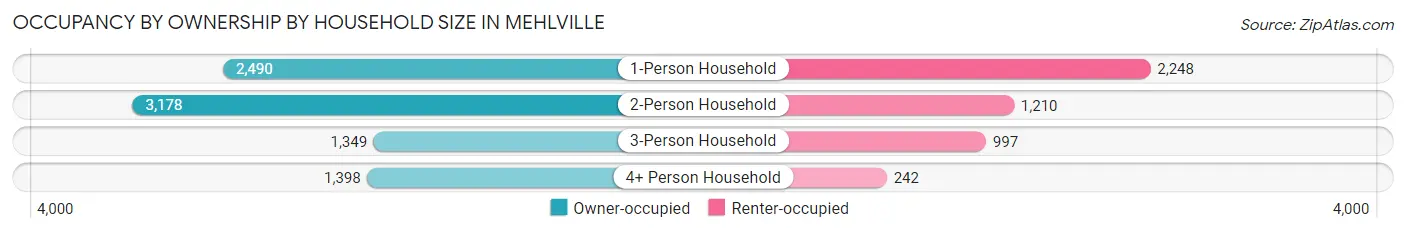
| Household Size | Owner-occupied | Renter-occupied |
| 1-Person Household | 2,490 (52.5%) | 2,248 (47.4%) |
| 2-Person Household | 3,178 (72.4%) | 1,210 (27.6%) |
| 3-Person Household | 1,349 (57.5%) | 997 (42.5%) |
| 4+ Person Household | 1,398 (85.2%) | 242 (14.8%) |
| Total Housing Units | 8,415 (64.2%) | 4,697 (35.8%) |
Occupancy by Educational Attainment in Mehlville
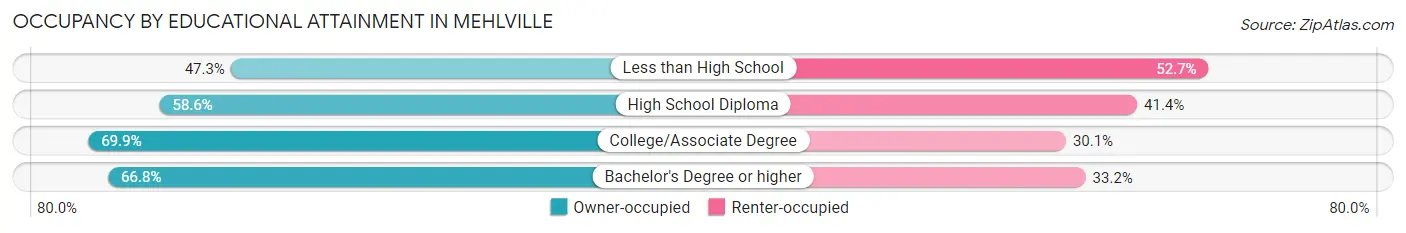
| Household Size | Owner-occupied | Renter-occupied |
| Less than High School | 448 (47.3%) | 499 (52.7%) |
| High School Diploma | 2,069 (58.6%) | 1,461 (41.4%) |
| College/Associate Degree | 2,959 (69.9%) | 1,274 (30.1%) |
| Bachelor's Degree or higher | 2,939 (66.8%) | 1,463 (33.2%) |
Occupancy by Age of Householder in Mehlville
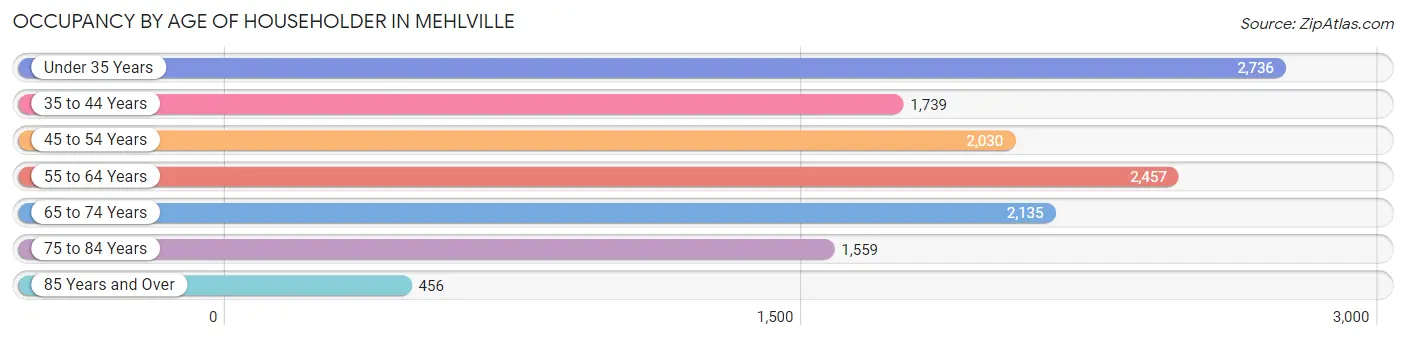
| Age Bracket | # Households | % Households |
| Under 35 Years | 2,736 | 20.9% |
| 35 to 44 Years | 1,739 | 13.3% |
| 45 to 54 Years | 2,030 | 15.5% |
| 55 to 64 Years | 2,457 | 18.7% |
| 65 to 74 Years | 2,135 | 16.3% |
| 75 to 84 Years | 1,559 | 11.9% |
| 85 Years and Over | 456 | 3.5% |
| Total | 13,112 | 100.0% |
Housing Finances in Mehlville
Median Income by Occupancy in Mehlville
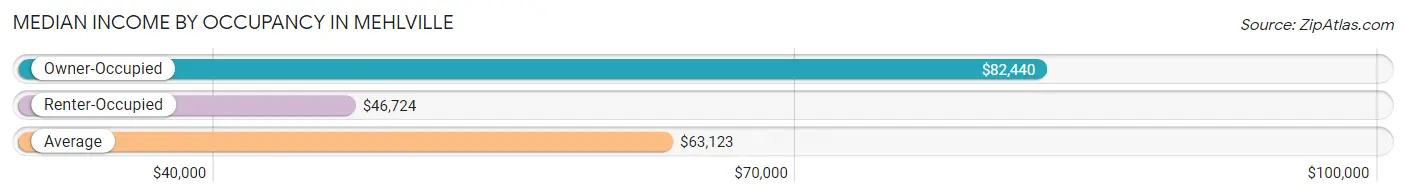
| Occupancy Type | # Households | Median Income |
| Owner-Occupied | 8,415 (64.2%) | $82,440 |
| Renter-Occupied | 4,697 (35.8%) | $46,724 |
| Average | 13,112 (100.0%) | $63,123 |
Occupancy by Householder Income Bracket in Mehlville
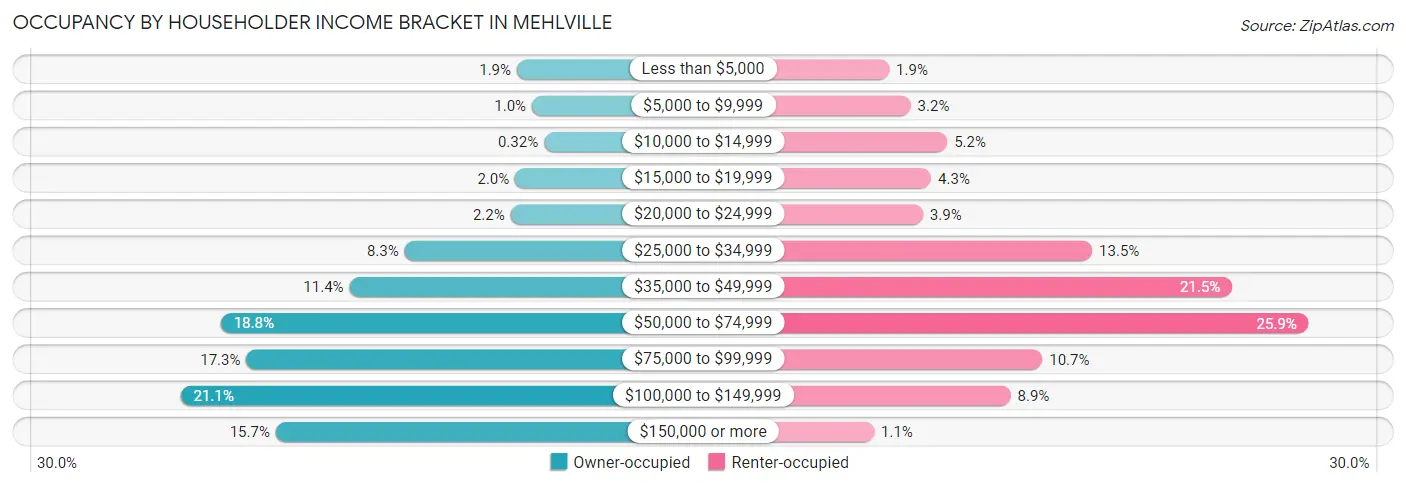
| Income Bracket | Owner-occupied | Renter-occupied |
| Less than $5,000 | 157 (1.9%) | 90 (1.9%) |
| $5,000 to $9,999 | 85 (1.0%) | 148 (3.2%) |
| $10,000 to $14,999 | 27 (0.3%) | 246 (5.2%) |
| $15,000 to $19,999 | 166 (2.0%) | 203 (4.3%) |
| $20,000 to $24,999 | 188 (2.2%) | 181 (3.8%) |
| $25,000 to $34,999 | 698 (8.3%) | 635 (13.5%) |
| $35,000 to $49,999 | 963 (11.4%) | 1,011 (21.5%) |
| $50,000 to $74,999 | 1,581 (18.8%) | 1,216 (25.9%) |
| $75,000 to $99,999 | 1,458 (17.3%) | 501 (10.7%) |
| $100,000 to $149,999 | 1,775 (21.1%) | 416 (8.9%) |
| $150,000 or more | 1,317 (15.7%) | 50 (1.1%) |
| Total | 8,415 (100.0%) | 4,697 (100.0%) |
Monthly Housing Cost Tiers in Mehlville
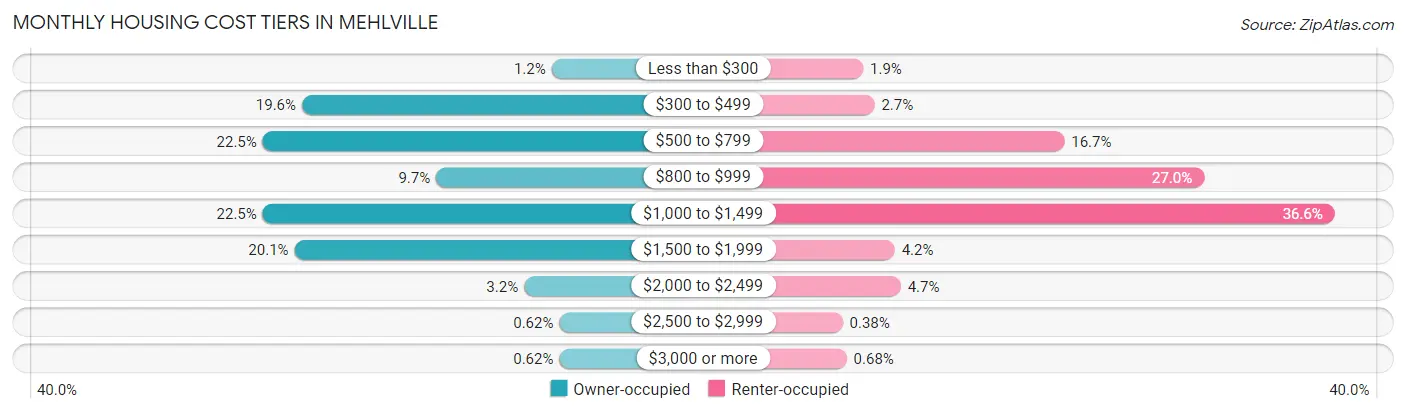
| Monthly Cost | Owner-occupied | Renter-occupied |
| Less than $300 | 100 (1.2%) | 89 (1.9%) |
| $300 to $499 | 1,648 (19.6%) | 128 (2.7%) |
| $500 to $799 | 1,891 (22.5%) | 785 (16.7%) |
| $800 to $999 | 816 (9.7%) | 1,268 (27.0%) |
| $1,000 to $1,499 | 1,891 (22.5%) | 1,720 (36.6%) |
| $1,500 to $1,999 | 1,694 (20.1%) | 198 (4.2%) |
| $2,000 to $2,499 | 271 (3.2%) | 219 (4.7%) |
| $2,500 to $2,999 | 52 (0.6%) | 18 (0.4%) |
| $3,000 or more | 52 (0.6%) | 32 (0.7%) |
| Total | 8,415 (100.0%) | 4,697 (100.0%) |
Physical Housing Characteristics in Mehlville
Housing Structures in Mehlville
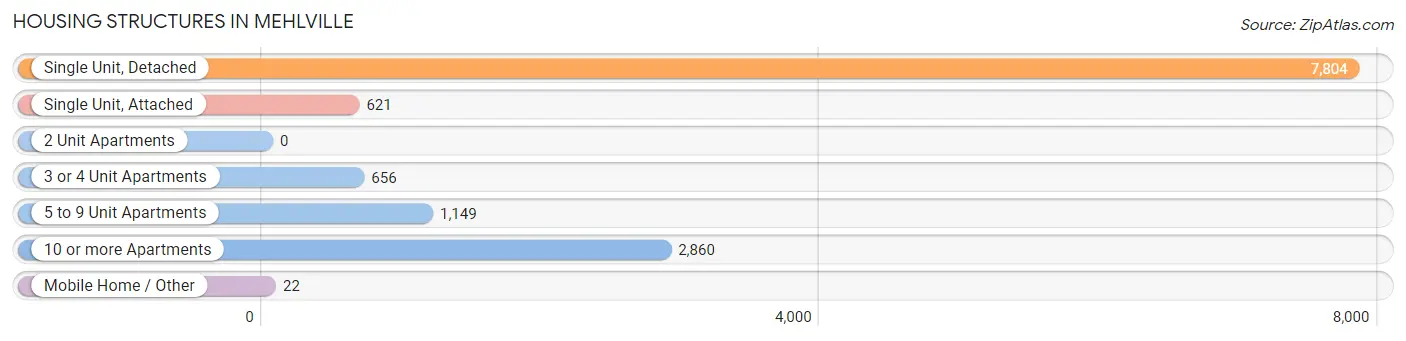
| Structure Type | # Housing Units | % Housing Units |
| Single Unit, Detached | 7,804 | 59.5% |
| Single Unit, Attached | 621 | 4.7% |
| 2 Unit Apartments | 0 | 0.0% |
| 3 or 4 Unit Apartments | 656 | 5.0% |
| 5 to 9 Unit Apartments | 1,149 | 8.8% |
| 10 or more Apartments | 2,860 | 21.8% |
| Mobile Home / Other | 22 | 0.2% |
| Total | 13,112 | 100.0% |
Housing Structures by Occupancy in Mehlville
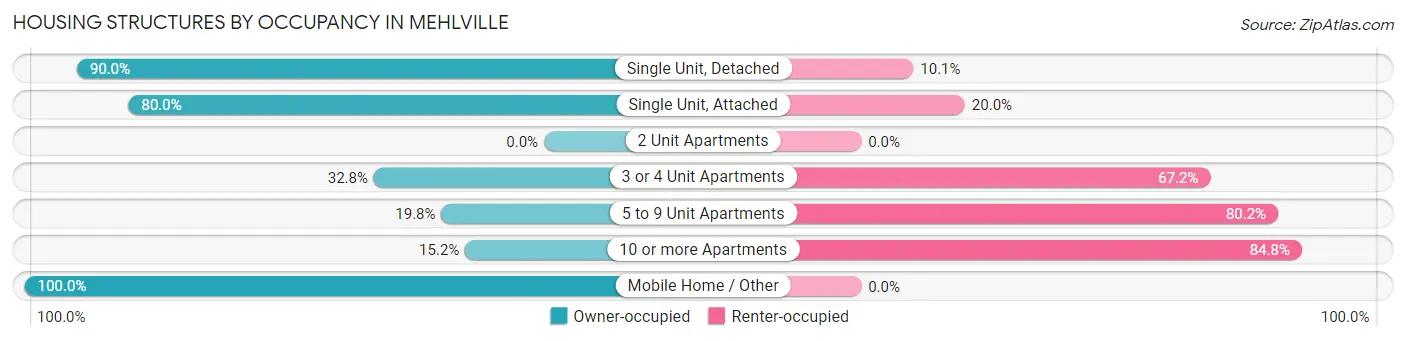
| Structure Type | Owner-occupied | Renter-occupied |
| Single Unit, Detached | 7,020 (89.9%) | 784 (10.1%) |
| Single Unit, Attached | 497 (80.0%) | 124 (20.0%) |
| 2 Unit Apartments | 0 (0.0%) | 0 (0.0%) |
| 3 or 4 Unit Apartments | 215 (32.8%) | 441 (67.2%) |
| 5 to 9 Unit Apartments | 227 (19.8%) | 922 (80.2%) |
| 10 or more Apartments | 434 (15.2%) | 2,426 (84.8%) |
| Mobile Home / Other | 22 (100.0%) | 0 (0.0%) |
| Total | 8,415 (64.2%) | 4,697 (35.8%) |
Housing Structures by Number of Rooms in Mehlville
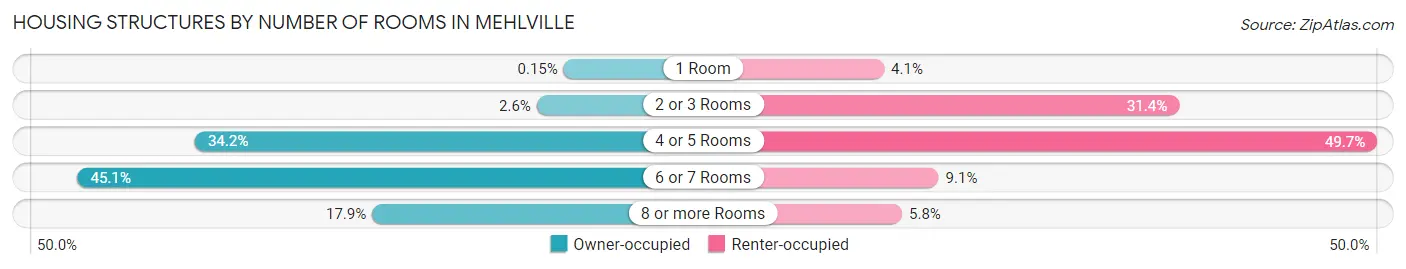
| Number of Rooms | Owner-occupied | Renter-occupied |
| 1 Room | 13 (0.2%) | 192 (4.1%) |
| 2 or 3 Rooms | 222 (2.6%) | 1,473 (31.4%) |
| 4 or 5 Rooms | 2,881 (34.2%) | 2,333 (49.7%) |
| 6 or 7 Rooms | 3,795 (45.1%) | 429 (9.1%) |
| 8 or more Rooms | 1,504 (17.9%) | 270 (5.8%) |
| Total | 8,415 (100.0%) | 4,697 (100.0%) |
Housing Structure by Heating Type in Mehlville
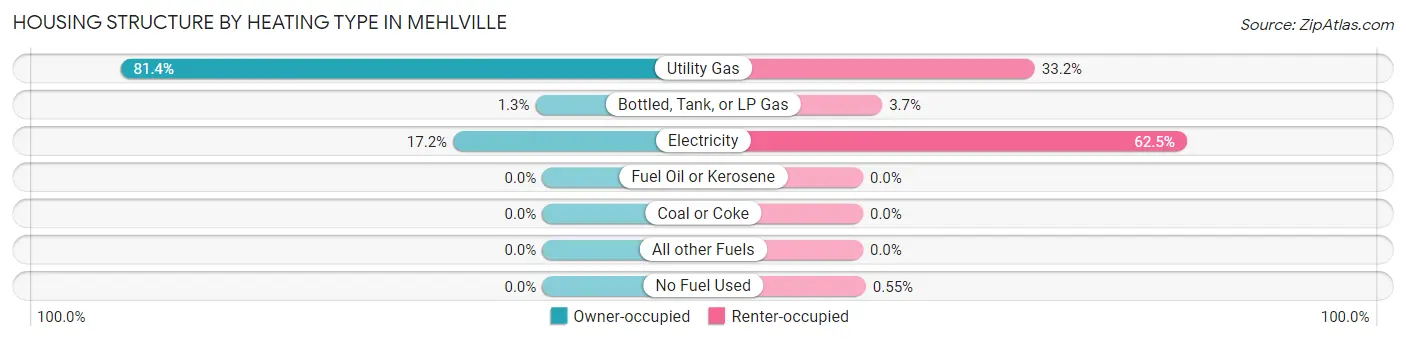
| Heating Type | Owner-occupied | Renter-occupied |
| Utility Gas | 6,853 (81.4%) | 1,560 (33.2%) |
| Bottled, Tank, or LP Gas | 111 (1.3%) | 174 (3.7%) |
| Electricity | 1,451 (17.2%) | 2,937 (62.5%) |
| Fuel Oil or Kerosene | 0 (0.0%) | 0 (0.0%) |
| Coal or Coke | 0 (0.0%) | 0 (0.0%) |
| All other Fuels | 0 (0.0%) | 0 (0.0%) |
| No Fuel Used | 0 (0.0%) | 26 (0.5%) |
| Total | 8,415 (100.0%) | 4,697 (100.0%) |
Household Vehicle Usage in Mehlville
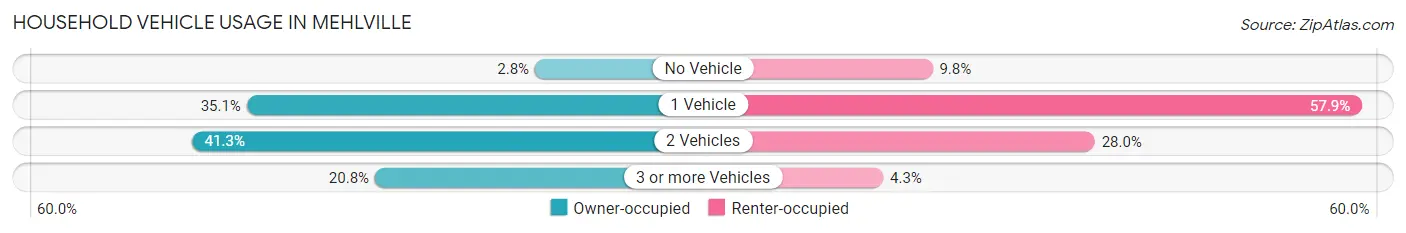
| Vehicles per Household | Owner-occupied | Renter-occupied |
| No Vehicle | 238 (2.8%) | 461 (9.8%) |
| 1 Vehicle | 2,955 (35.1%) | 2,721 (57.9%) |
| 2 Vehicles | 3,475 (41.3%) | 1,314 (28.0%) |
| 3 or more Vehicles | 1,747 (20.8%) | 201 (4.3%) |
| Total | 8,415 (100.0%) | 4,697 (100.0%) |
Real Estate & Mortgages in Mehlville
Real Estate and Mortgage Overview in Mehlville
| Characteristic | Without Mortgage | With Mortgage |
| Housing Units | 3,699 | 4,716 |
| Median Property Value | $195,300 | $195,400 |
| Median Household Income | $62,269 | $893 |
| Monthly Housing Costs | $516 | $29 |
| Real Estate Taxes | $2,245 | $37 |
Property Value by Mortgage Status in Mehlville
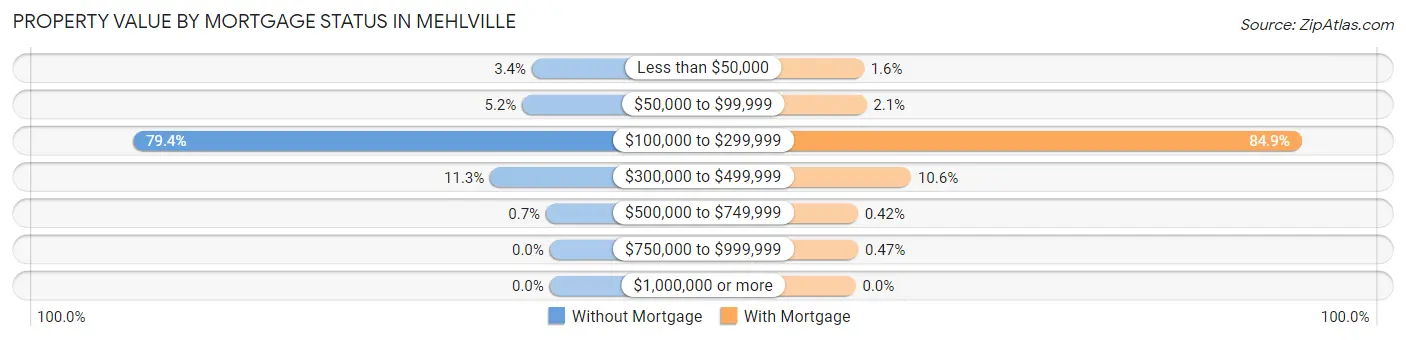
| Property Value | Without Mortgage | With Mortgage |
| Less than $50,000 | 125 (3.4%) | 73 (1.5%) |
| $50,000 to $99,999 | 194 (5.2%) | 97 (2.1%) |
| $100,000 to $299,999 | 2,935 (79.3%) | 4,006 (84.9%) |
| $300,000 to $499,999 | 419 (11.3%) | 498 (10.6%) |
| $500,000 to $749,999 | 26 (0.7%) | 20 (0.4%) |
| $750,000 to $999,999 | 0 (0.0%) | 22 (0.5%) |
| $1,000,000 or more | 0 (0.0%) | 0 (0.0%) |
| Total | 3,699 (100.0%) | 4,716 (100.0%) |
Household Income by Mortgage Status in Mehlville
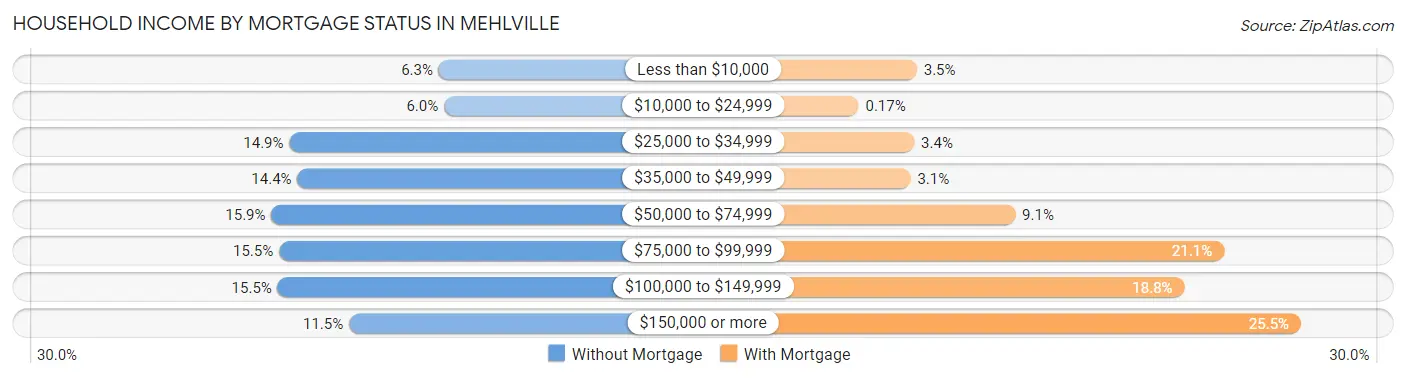
| Household Income | Without Mortgage | With Mortgage |
| Less than $10,000 | 234 (6.3%) | 165 (3.5%) |
| $10,000 to $24,999 | 223 (6.0%) | 8 (0.2%) |
| $25,000 to $34,999 | 550 (14.9%) | 158 (3.4%) |
| $35,000 to $49,999 | 533 (14.4%) | 148 (3.1%) |
| $50,000 to $74,999 | 588 (15.9%) | 430 (9.1%) |
| $75,000 to $99,999 | 572 (15.5%) | 993 (21.1%) |
| $100,000 to $149,999 | 575 (15.5%) | 886 (18.8%) |
| $150,000 or more | 424 (11.5%) | 1,200 (25.5%) |
| Total | 3,699 (100.0%) | 4,716 (100.0%) |
Property Value to Household Income Ratio in Mehlville
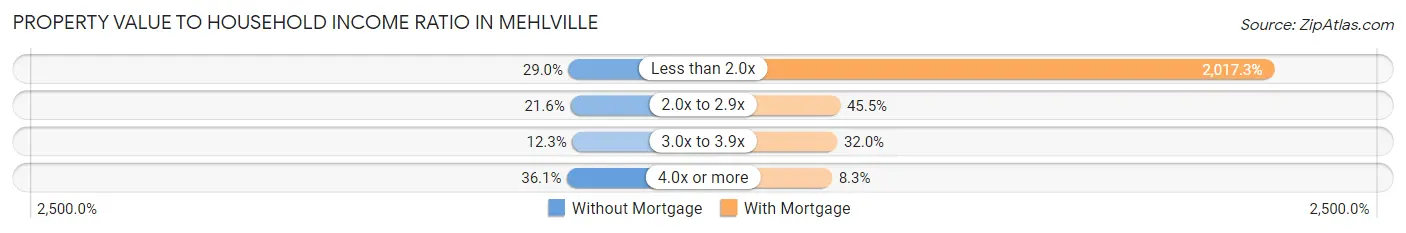
| Value-to-Income Ratio | Without Mortgage | With Mortgage |
| Less than 2.0x | 1,071 (28.9%) | 95,134 (2,017.3%) |
| 2.0x to 2.9x | 797 (21.5%) | 2,146 (45.5%) |
| 3.0x to 3.9x | 453 (12.2%) | 1,507 (32.0%) |
| 4.0x or more | 1,335 (36.1%) | 389 (8.3%) |
| Total | 3,699 (100.0%) | 4,716 (100.0%) |
Real Estate Taxes by Mortgage Status in Mehlville
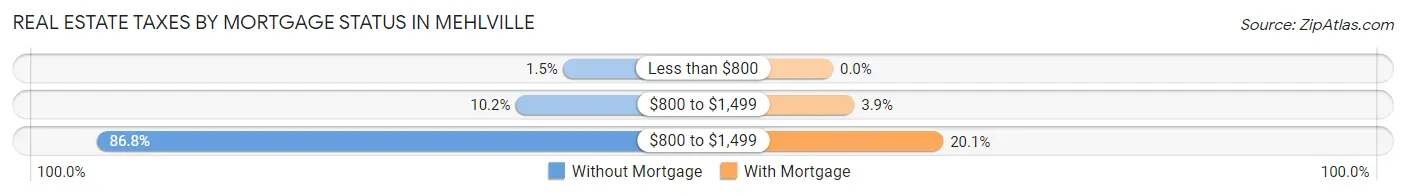
| Property Taxes | Without Mortgage | With Mortgage |
| Less than $800 | 57 (1.5%) | 0 (0.0%) |
| $800 to $1,499 | 377 (10.2%) | 183 (3.9%) |
| $800 to $1,499 | 3,212 (86.8%) | 949 (20.1%) |
| Total | 3,699 (100.0%) | 4,716 (100.0%) |
Health & Disability in Mehlville
Health Insurance Coverage by Age in Mehlville
| Age Bracket | With Coverage | Without Coverage |
| Under 6 Years | 1,958 (99.4%) | 11 (0.6%) |
| 6 to 18 Years | 3,599 (98.2%) | 65 (1.8%) |
| 19 to 25 Years | 2,136 (79.0%) | 566 (20.9%) |
| 26 to 34 Years | 3,345 (89.5%) | 392 (10.5%) |
| 35 to 44 Years | 2,907 (90.4%) | 309 (9.6%) |
| 45 to 54 Years | 3,160 (93.4%) | 222 (6.6%) |
| 55 to 64 Years | 3,993 (92.6%) | 318 (7.4%) |
| 65 to 74 Years | 3,270 (98.8%) | 39 (1.2%) |
| 75 Years and older | 2,697 (100.0%) | 0 (0.0%) |
| Total | 27,065 (93.4%) | 1,922 (6.6%) |
Health Insurance Coverage by Citizenship Status in Mehlville
| Citizenship Status | With Coverage | Without Coverage |
| Native Born | 1,958 (99.4%) | 11 (0.6%) |
| Foreign Born, Citizen | 3,599 (98.2%) | 65 (1.8%) |
| Foreign Born, not a Citizen | 2,136 (79.0%) | 566 (20.9%) |
Health Insurance Coverage by Household Income in Mehlville
| Household Income | With Coverage | Without Coverage |
| Under $25,000 | 1,774 (86.0%) | 290 (14.1%) |
| $25,000 to $49,999 | 4,874 (90.9%) | 488 (9.1%) |
| $50,000 to $74,999 | 5,450 (89.9%) | 614 (10.1%) |
| $75,000 to $99,999 | 4,656 (93.9%) | 305 (6.1%) |
| $100,000 and over | 10,231 (97.9%) | 222 (2.1%) |
Public vs Private Health Insurance Coverage by Age in Mehlville
| Age Bracket | Public Insurance | Private Insurance |
| Under 6 | 689 (35.0%) | 1,337 (67.9%) |
| 6 to 18 Years | 1,354 (36.9%) | 2,263 (61.8%) |
| 19 to 25 Years | 226 (8.4%) | 1,938 (71.7%) |
| 25 to 34 Years | 659 (17.6%) | 2,846 (76.2%) |
| 35 to 44 Years | 198 (6.2%) | 2,839 (88.3%) |
| 45 to 54 Years | 614 (18.1%) | 2,690 (79.5%) |
| 55 to 64 Years | 677 (15.7%) | 3,420 (79.3%) |
| 65 to 74 Years | 3,215 (97.2%) | 1,278 (38.6%) |
| 75 Years and over | 2,665 (98.8%) | 1,725 (64.0%) |
| Total | 10,297 (35.5%) | 20,336 (70.2%) |
Disability Status by Sex by Age in Mehlville
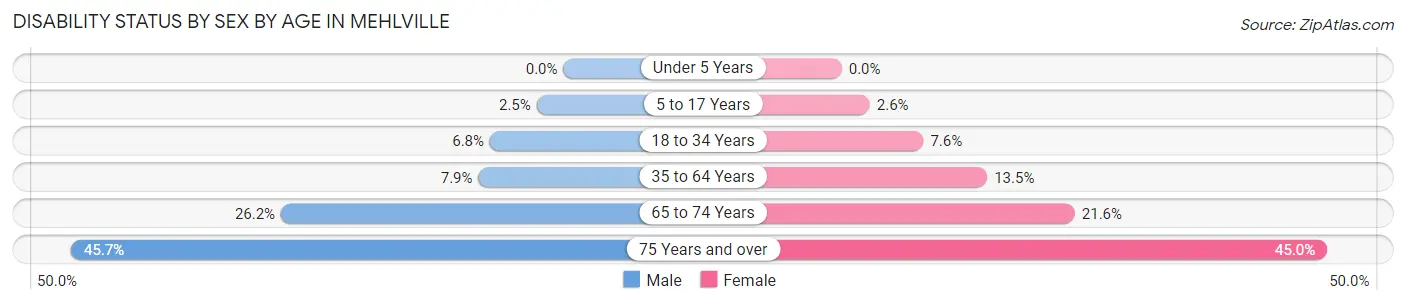
| Age Bracket | Male | Female |
| Under 5 Years | 0 (0.0%) | 0 (0.0%) |
| 5 to 17 Years | 55 (2.5%) | 42 (2.6%) |
| 18 to 34 Years | 229 (6.8%) | 251 (7.6%) |
| 35 to 64 Years | 441 (7.9%) | 718 (13.5%) |
| 65 to 74 Years | 374 (26.2%) | 407 (21.6%) |
| 75 Years and over | 436 (45.7%) | 785 (45.0%) |
Disability Class by Sex by Age in Mehlville
Disability Class: Hearing Difficulty
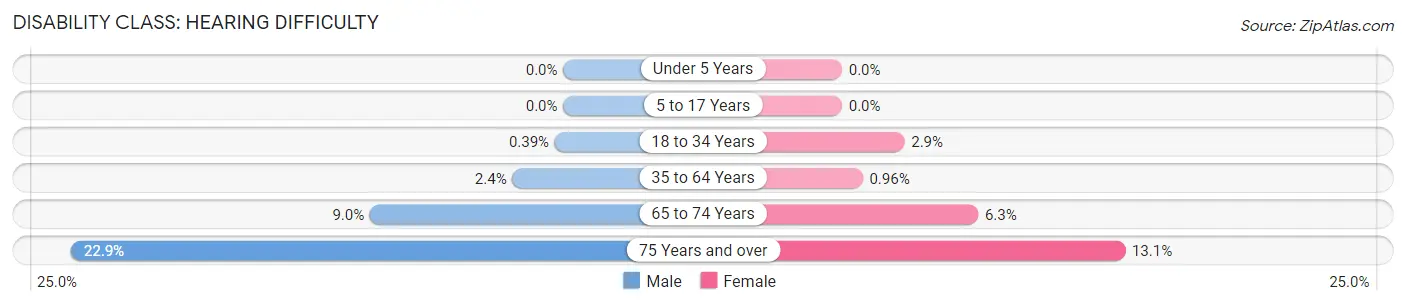
| Age Bracket | Male | Female |
| Under 5 Years | 0 (0.0%) | 0 (0.0%) |
| 5 to 17 Years | 0 (0.0%) | 0 (0.0%) |
| 18 to 34 Years | 13 (0.4%) | 96 (2.9%) |
| 35 to 64 Years | 132 (2.4%) | 51 (1.0%) |
| 65 to 74 Years | 128 (9.0%) | 119 (6.3%) |
| 75 Years and over | 218 (22.9%) | 229 (13.1%) |
Disability Class: Vision Difficulty
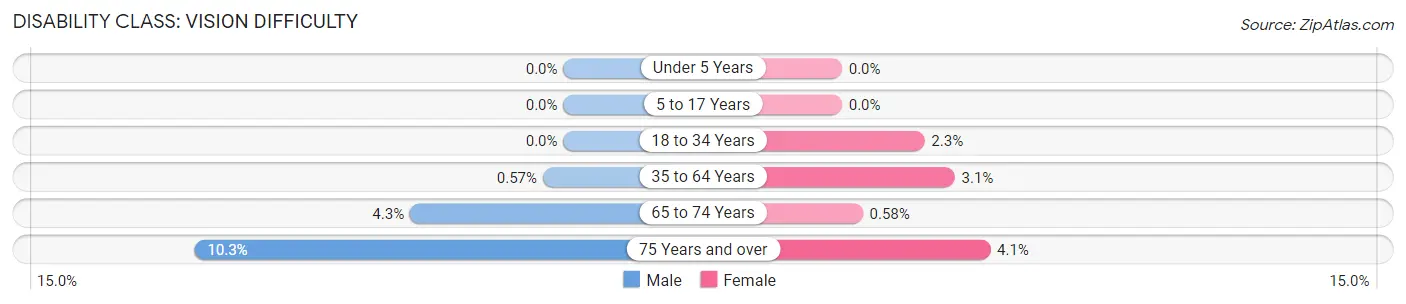
| Age Bracket | Male | Female |
| Under 5 Years | 0 (0.0%) | 0 (0.0%) |
| 5 to 17 Years | 0 (0.0%) | 0 (0.0%) |
| 18 to 34 Years | 0 (0.0%) | 76 (2.3%) |
| 35 to 64 Years | 32 (0.6%) | 167 (3.1%) |
| 65 to 74 Years | 61 (4.3%) | 11 (0.6%) |
| 75 Years and over | 98 (10.3%) | 72 (4.1%) |
Disability Class: Cognitive Difficulty
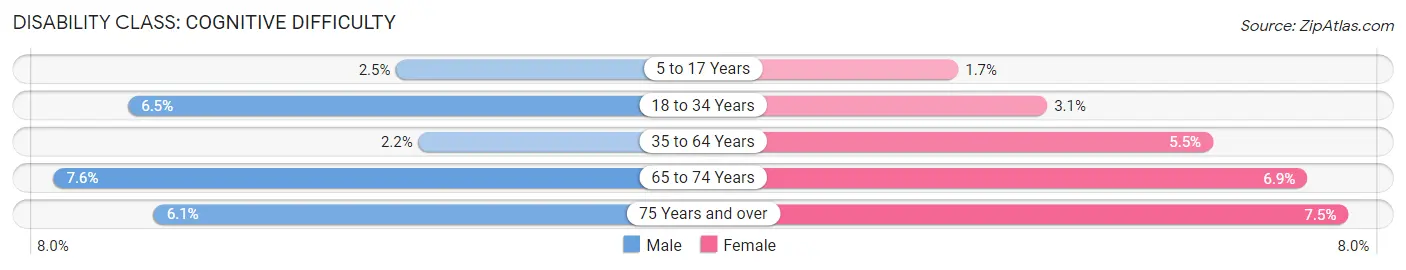
| Age Bracket | Male | Female |
| 5 to 17 Years | 55 (2.5%) | 28 (1.7%) |
| 18 to 34 Years | 217 (6.5%) | 101 (3.0%) |
| 35 to 64 Years | 120 (2.1%) | 293 (5.5%) |
| 65 to 74 Years | 108 (7.6%) | 130 (6.9%) |
| 75 Years and over | 58 (6.1%) | 131 (7.5%) |
Disability Class: Ambulatory Difficulty
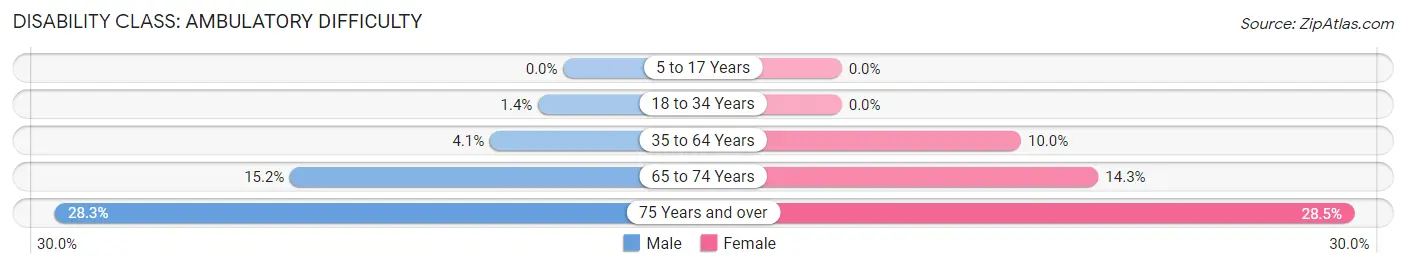
| Age Bracket | Male | Female |
| 5 to 17 Years | 0 (0.0%) | 0 (0.0%) |
| 18 to 34 Years | 47 (1.4%) | 0 (0.0%) |
| 35 to 64 Years | 228 (4.1%) | 531 (10.0%) |
| 65 to 74 Years | 217 (15.2%) | 269 (14.3%) |
| 75 Years and over | 270 (28.3%) | 497 (28.5%) |
Disability Class: Self-Care Difficulty
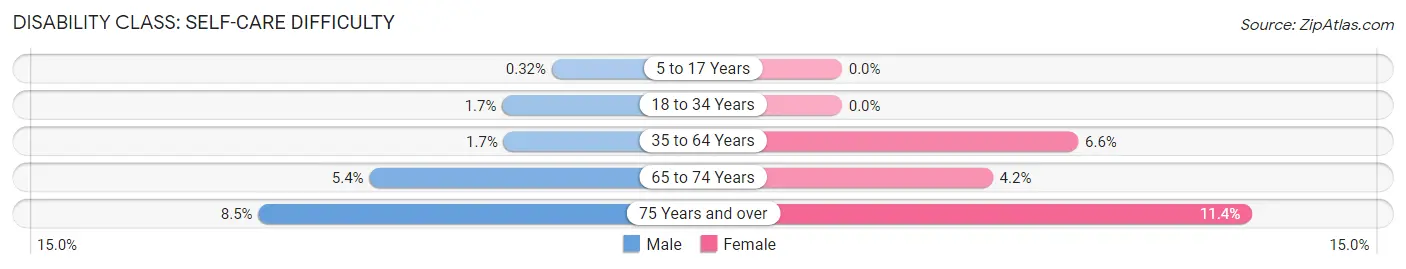
| Age Bracket | Male | Female |
| 5 to 17 Years | 7 (0.3%) | 0 (0.0%) |
| 18 to 34 Years | 57 (1.7%) | 0 (0.0%) |
| 35 to 64 Years | 93 (1.7%) | 350 (6.6%) |
| 65 to 74 Years | 77 (5.4%) | 79 (4.2%) |
| 75 Years and over | 81 (8.5%) | 199 (11.4%) |
Technology Access in Mehlville
Computing Device Access in Mehlville
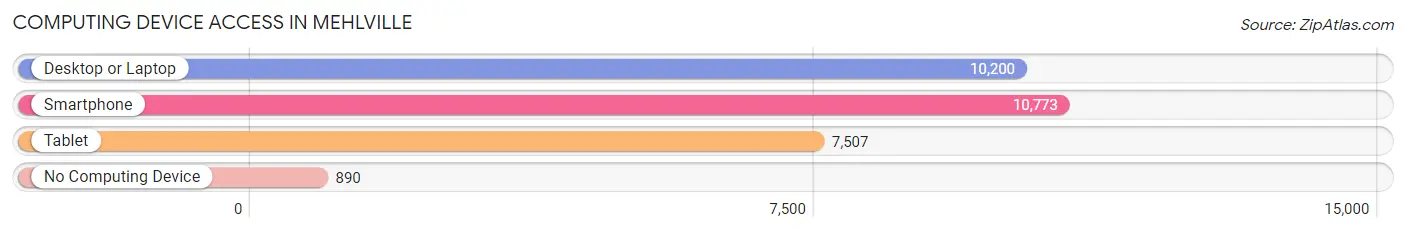
| Device Type | # Households | % Households |
| Desktop or Laptop | 10,200 | 77.8% |
| Smartphone | 10,773 | 82.2% |
| Tablet | 7,507 | 57.3% |
| No Computing Device | 890 | 6.8% |
| Total | 13,112 | 100.0% |
Internet Access in Mehlville
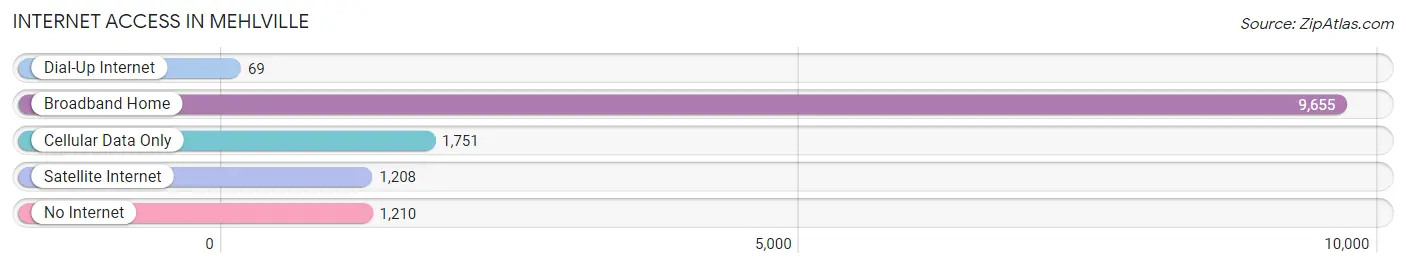
| Internet Type | # Households | % Households |
| Dial-Up Internet | 69 | 0.5% |
| Broadband Home | 9,655 | 73.6% |
| Cellular Data Only | 1,751 | 13.4% |
| Satellite Internet | 1,208 | 9.2% |
| No Internet | 1,210 | 9.2% |
| Total | 13,112 | 100.0% |
Mehlville Summary
Mehlville, Missouri is a small unincorporated community located in St. Louis County, Missouri. It is situated in the south-central part of the county, just south of the city of St. Louis. The population of Mehlville was estimated to be around 28,000 in 2020.
History
Mehlville was founded in 1855 by German immigrant John Mehl. He purchased a large tract of land in the area and began to develop it into a small farming community. The town was originally known as Mehlville Station, and was the site of a stop on the St. Louis and Iron Mountain Railroad. The town was officially incorporated in 1892, and the name was changed to Mehlville.
Geography
Mehlville is located in St. Louis County, Missouri, in the south-central part of the county. It is situated just south of the city of St. Louis, and is bordered by the towns of Oakville, Lemay, and Affton. The town is situated on the banks of the Meramec River, and is surrounded by rolling hills and wooded areas.
Economy
Mehlville’s economy is largely based on the service industry, with many businesses providing services to the surrounding communities. The town is home to several large retail stores, including Walmart, Target, and Lowe’s. There are also several restaurants and bars in the area, as well as a few small businesses.
Demographics
As of the 2020 census, the population of Mehlville was estimated to be around 28,000. The racial makeup of the town was 87.3% White, 8.2% African American, 1.2% Asian, and 3.3% from other races. The median household income in Mehlville was $60,845, and the median home value was $179,000.
Mehlville is a small, close-knit community with a strong sense of community and pride. The town is home to several parks and recreational areas, as well as a variety of local businesses and services. The town is also home to several churches, schools, and other organizations that serve the community. Mehlville is a great place to live, work, and raise a family.
Common Questions
What is Per Capita Income in Mehlville?
Per Capita income in Mehlville is $37,142.
What is the Median Family Income in Mehlville?
Median Family Income in Mehlville is $85,133.
What is the Median Household income in Mehlville?
Median Household Income in Mehlville is $63,123.
What is Income or Wage Gap in Mehlville?
Income or Wage Gap in Mehlville is 25.4%.
Women in Mehlville earn 74.6 cents for every dollar earned by a man.
What is Family Income Deficit in Mehlville?
Family Income Deficit in Mehlville is $11,532.
Families that are below poverty line in Mehlville earn $11,532 less on average than the poverty threshold level.
What is Inequality or Gini Index in Mehlville?
Inequality or Gini Index in Mehlville is 0.39.
What is the Total Population of Mehlville?
Total Population of Mehlville is 29,089.
What is the Total Male Population of Mehlville?
Total Male Population of Mehlville is 14,517.
What is the Total Female Population of Mehlville?
Total Female Population of Mehlville is 14,572.
What is the Ratio of Males per 100 Females in Mehlville?
There are 99.62 Males per 100 Females in Mehlville.
What is the Ratio of Females per 100 Males in Mehlville?
There are 100.38 Females per 100 Males in Mehlville.
What is the Median Population Age in Mehlville?
Median Population Age in Mehlville is 42.0 Years.
What is the Average Family Size in Mehlville
Average Family Size in Mehlville is 2.8 People.
What is the Average Household Size in Mehlville
Average Household Size in Mehlville is 2.2 People.
How Large is the Labor Force in Mehlville?
There are 15,391 People in the Labor Forcein in Mehlville.
What is the Percentage of People in the Labor Force in Mehlville?
63.3% of People are in the Labor Force in Mehlville.
What is the Unemployment Rate in Mehlville?
Unemployment Rate in Mehlville is 3.8%.