Norwood Court, MO Map & Demographics
Norwood Court Map
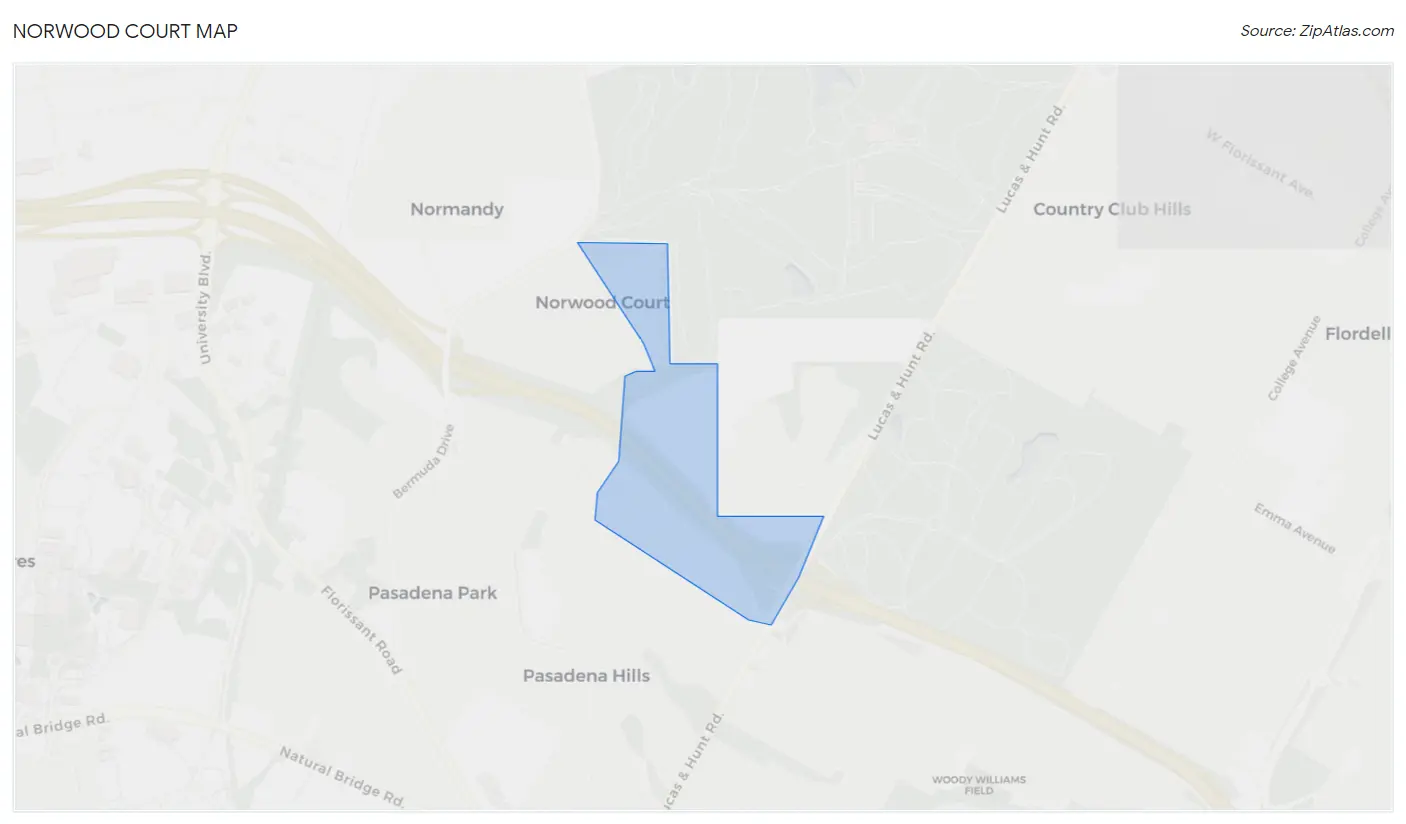
Norwood Court Overview
$29,851
PER CAPITA INCOME
$47,589
AVG FAMILY INCOME
$38,073
AVG HOUSEHOLD INCOME
38.4%
WAGE / INCOME GAP [ % ]
61.6¢/ $1
WAGE / INCOME GAP [ $ ]
0.30
INEQUALITY / GINI INDEX
830
TOTAL POPULATION
277
MALE POPULATION
553
FEMALE POPULATION
50.09
MALES / 100 FEMALES
199.64
FEMALES / 100 MALES
35.8
MEDIAN AGE
2.8
AVG FAMILY SIZE
1.4
AVG HOUSEHOLD SIZE
588
LABOR FORCE [ PEOPLE ]
81.8%
PERCENT IN LABOR FORCE
8.7%
UNEMPLOYMENT RATE
Norwood Court Area Codes
Income in Norwood Court
Income Overview in Norwood Court
Per Capita Income in Norwood Court is $29,851, while median incomes of families and households are $47,589 and $38,073 respectively.
| Characteristic | Number | Measure |
| Per Capita Income | 830 | $29,851 |
| Median Family Income | 105 | $47,589 |
| Mean Family Income | 105 | $49,906 |
| Median Household Income | 602 | $38,073 |
| Mean Household Income | 602 | $41,043 |
| Income Deficit | 105 | $0 |
| Wage / Income Gap (%) | 830 | 38.44% |
| Wage / Income Gap ($) | 830 | 61.56¢ per $1 |
| Gini / Inequality Index | 830 | 0.30 |
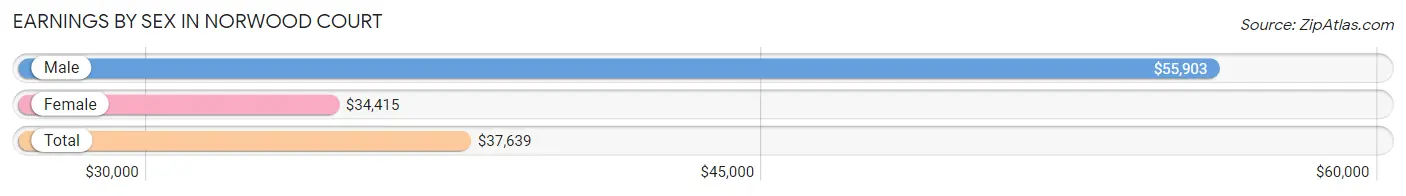
Earnings by Sex in Norwood Court
Average Earnings in Norwood Court are $37,639, $55,903 for men and $34,415 for women, a difference of 38.4%.
| Sex | Number | Average Earnings |
| Male | 129 (22.7%) | $55,903 |
| Female | 439 (77.3%) | $34,415 |
| Total | 568 (100.0%) | $37,639 |
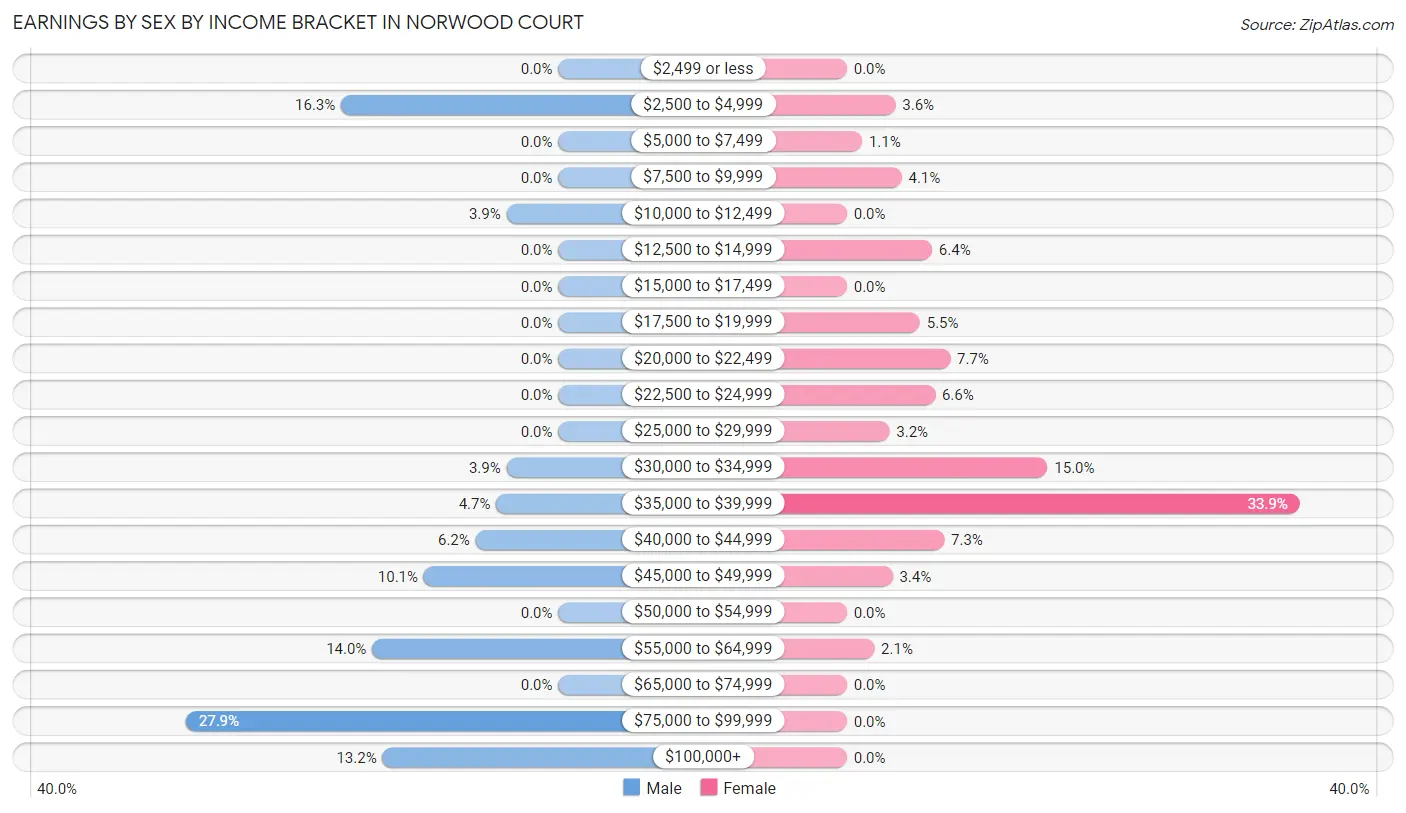
Earnings by Sex by Income Bracket in Norwood Court
The most common earnings brackets in Norwood Court are $75,000 to $99,999 for men (36 | 27.9%) and $35,000 to $39,999 for women (149 | 33.9%).
| Income | Male | Female |
| $2,499 or less | 0 (0.0%) | 0 (0.0%) |
| $2,500 to $4,999 | 21 (16.3%) | 16 (3.6%) |
| $5,000 to $7,499 | 0 (0.0%) | 5 (1.1%) |
| $7,500 to $9,999 | 0 (0.0%) | 18 (4.1%) |
| $10,000 to $12,499 | 5 (3.9%) | 0 (0.0%) |
| $12,500 to $14,999 | 0 (0.0%) | 28 (6.4%) |
| $15,000 to $17,499 | 0 (0.0%) | 0 (0.0%) |
| $17,500 to $19,999 | 0 (0.0%) | 24 (5.5%) |
| $20,000 to $22,499 | 0 (0.0%) | 34 (7.7%) |
| $22,500 to $24,999 | 0 (0.0%) | 29 (6.6%) |
| $25,000 to $29,999 | 0 (0.0%) | 14 (3.2%) |
| $30,000 to $34,999 | 5 (3.9%) | 66 (15.0%) |
| $35,000 to $39,999 | 6 (4.6%) | 149 (33.9%) |
| $40,000 to $44,999 | 8 (6.2%) | 32 (7.3%) |
| $45,000 to $49,999 | 13 (10.1%) | 15 (3.4%) |
| $50,000 to $54,999 | 0 (0.0%) | 0 (0.0%) |
| $55,000 to $64,999 | 18 (14.0%) | 9 (2.1%) |
| $65,000 to $74,999 | 0 (0.0%) | 0 (0.0%) |
| $75,000 to $99,999 | 36 (27.9%) | 0 (0.0%) |
| $100,000+ | 17 (13.2%) | 0 (0.0%) |
| Total | 129 (100.0%) | 439 (100.0%) |
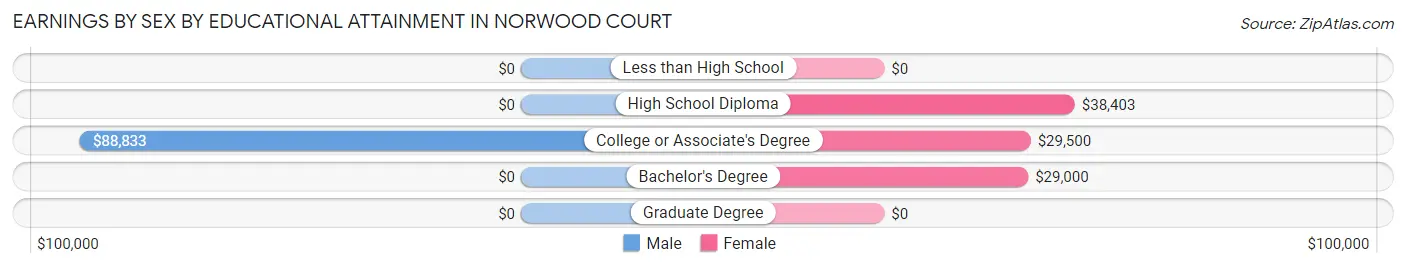
Earnings by Sex by Educational Attainment in Norwood Court
Average earnings in Norwood Court are $80,417 for men and $37,795 for women, a difference of 53.0%. Men with an educational attainment of college or associate's degree enjoy the highest average annual earnings of $88,833, while those with college or associate's degree education earn the least with $88,833. Women with an educational attainment of high school diploma earn the most with the average annual earnings of $38,403, while those with bachelor's degree education have the smallest earnings of $29,000.
| Educational Attainment | Male Income | Female Income |
| Less than High School | - | - |
| High School Diploma | - | - |
| College or Associate's Degree | $88,833 | $29,500 |
| Bachelor's Degree | - | - |
| Graduate Degree | - | - |
| Total | $80,417 | $37,795 |
Family Income in Norwood Court
Family Income Brackets in Norwood Court
According to the Norwood Court family income data, there are 26 families falling into the $25,000 to $34,999 income range, which is the most common income bracket and makes up 24.8% of all families.
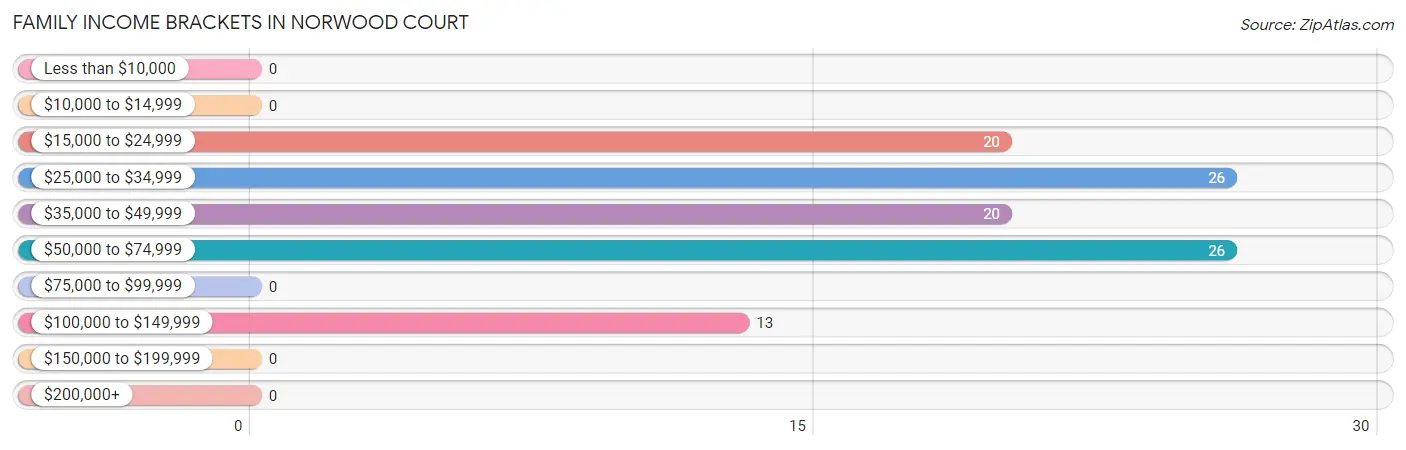
| Income Bracket | # Families | % Families |
| Less than $10,000 | 0 | 0.0% |
| $10,000 to $14,999 | 0 | 0.0% |
| $15,000 to $24,999 | 20 | 19.0% |
| $25,000 to $34,999 | 26 | 24.8% |
| $35,000 to $49,999 | 20 | 19.0% |
| $50,000 to $74,999 | 26 | 24.8% |
| $75,000 to $99,999 | 0 | 0.0% |
| $100,000 to $149,999 | 13 | 12.4% |
| $150,000 to $199,999 | 0 | 0.0% |
| $200,000+ | 0 | 0.0% |
Family Income by Famaliy Size in Norwood Court
2-person families (65 | 61.9%) account for the highest median family income in Norwood Court with $36,042 per family, while 2-person families (65 | 61.9%) have the highest median income of $18,021 per family member.
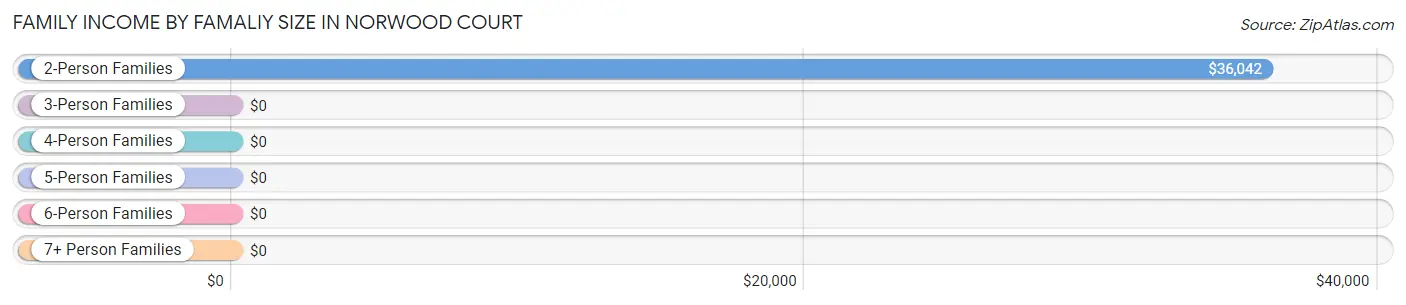
| Income Bracket | # Families | Median Income |
| 2-Person Families | 65 (61.9%) | $36,042 |
| 3-Person Families | 12 (11.4%) | $0 |
| 4-Person Families | 22 (20.9%) | $0 |
| 5-Person Families | 5 (4.8%) | $0 |
| 6-Person Families | 1 (0.9%) | $0 |
| 7+ Person Families | 0 (0.0%) | $0 |
| Total | 105 (100.0%) | $47,589 |
Family Income by Number of Earners in Norwood Court
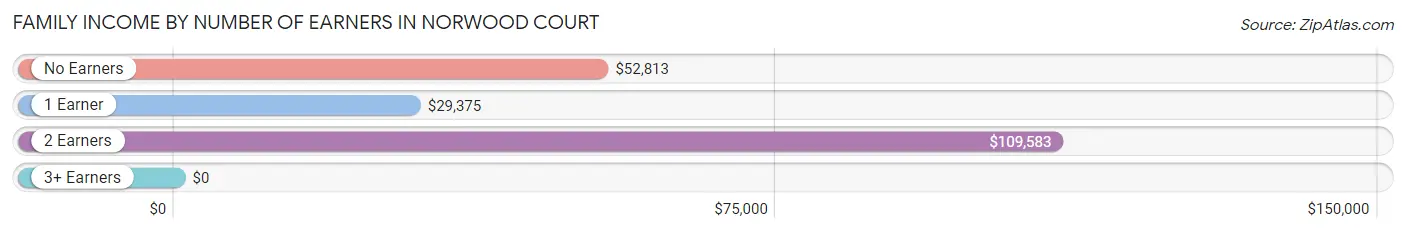
| Number of Earners | # Families | Median Income |
| No Earners | 22 (20.9%) | $52,813 |
| 1 Earner | 62 (59.1%) | $29,375 |
| 2 Earners | 21 (20.0%) | $109,583 |
| 3+ Earners | 0 (0.0%) | $0 |
| Total | 105 (100.0%) | $47,589 |
Household Income in Norwood Court
Household Income Brackets in Norwood Court
With 243 households falling in the category, the $35,000 to $49,999 income range is the most frequent in Norwood Court, accounting for 40.4% of all households.
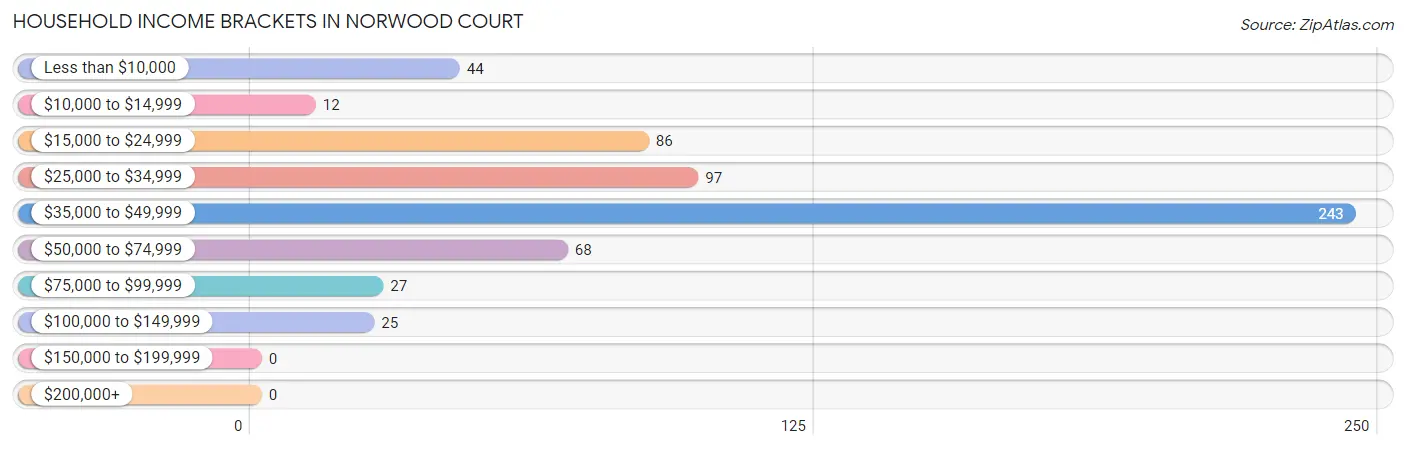
| Income Bracket | # Households | % Households |
| Less than $10,000 | 44 | 7.3% |
| $10,000 to $14,999 | 12 | 2.0% |
| $15,000 to $24,999 | 86 | 14.3% |
| $25,000 to $34,999 | 97 | 16.1% |
| $35,000 to $49,999 | 243 | 40.4% |
| $50,000 to $74,999 | 68 | 11.3% |
| $75,000 to $99,999 | 27 | 4.5% |
| $100,000 to $149,999 | 25 | 4.2% |
| $150,000 to $199,999 | 0 | 0.0% |
| $200,000+ | 0 | 0.0% |
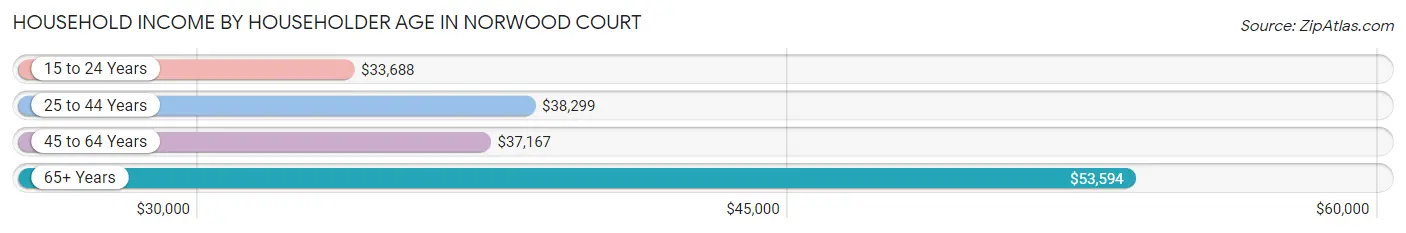
Household Income by Householder Age in Norwood Court
The median household income in Norwood Court is $38,073, with the highest median household income of $53,594 found in the 65+ years age bracket for the primary householder. A total of 85 households (14.1%) fall into this category. Meanwhile, the 15 to 24 years age bracket for the primary householder has the lowest median household income of $33,688, with 61 households (10.1%) in this group.
| Income Bracket | # Households | Median Income |
| 15 to 24 Years | 61 (10.1%) | $33,688 |
| 25 to 44 Years | 260 (43.2%) | $38,299 |
| 45 to 64 Years | 196 (32.6%) | $37,167 |
| 65+ Years | 85 (14.1%) | $53,594 |
| Total | 602 (100.0%) | $38,073 |
Poverty in Norwood Court
Income Below Poverty by Sex and Age in Norwood Court
With 21.7% poverty level for males and 18.1% for females among the residents of Norwood Court, 5 year old males and under 5 year old females are the most vulnerable to poverty, with 14 males (100.0%) and 15 females (100.0%) in their respective age groups living below the poverty level.
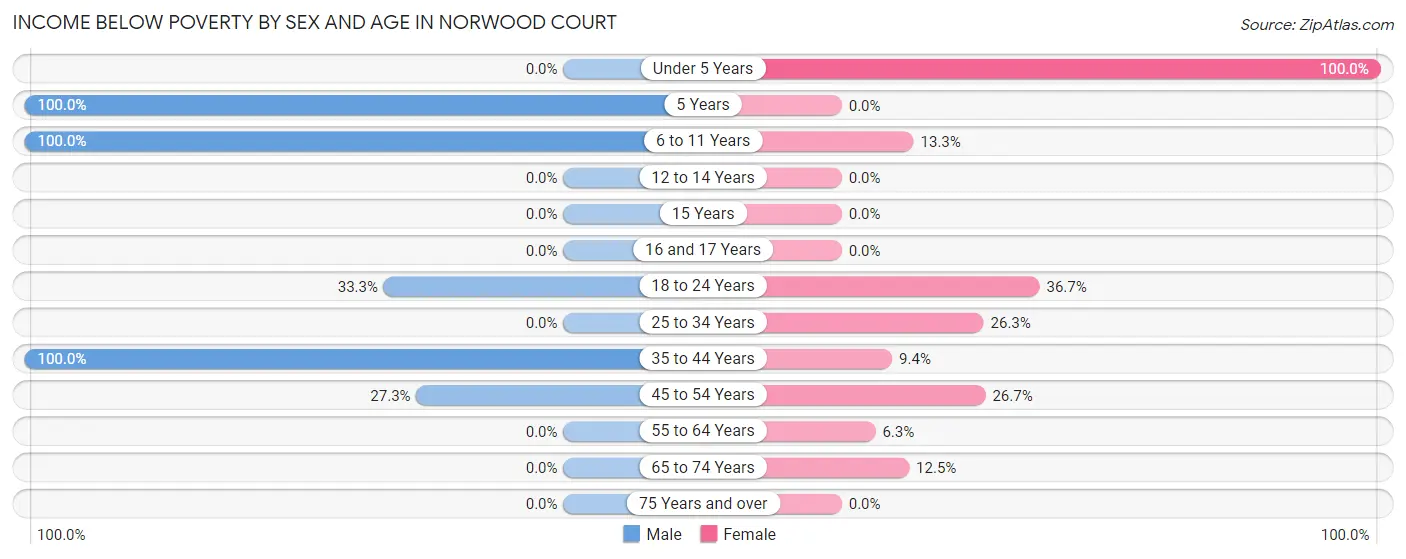
| Age Bracket | Male | Female |
| Under 5 Years | 0 (0.0%) | 15 (100.0%) |
| 5 Years | 14 (100.0%) | 0 (0.0%) |
| 6 to 11 Years | 15 (100.0%) | 2 (13.3%) |
| 12 to 14 Years | 0 (0.0%) | 0 (0.0%) |
| 15 Years | 0 (0.0%) | 0 (0.0%) |
| 16 and 17 Years | 0 (0.0%) | 0 (0.0%) |
| 18 to 24 Years | 7 (33.3%) | 29 (36.7%) |
| 25 to 34 Years | 0 (0.0%) | 15 (26.3%) |
| 35 to 44 Years | 9 (100.0%) | 20 (9.3%) |
| 45 to 54 Years | 15 (27.3%) | 12 (26.7%) |
| 55 to 64 Years | 0 (0.0%) | 4 (6.2%) |
| 65 to 74 Years | 0 (0.0%) | 3 (12.5%) |
| 75 Years and over | 0 (0.0%) | 0 (0.0%) |
| Total | 60 (21.7%) | 100 (18.1%) |
Income Above Poverty by Sex and Age in Norwood Court
According to the poverty statistics in Norwood Court, males aged under 5 years and females aged 12 to 14 years are the age groups that are most secure financially, with 100.0% of males and 100.0% of females in these age groups living above the poverty line.
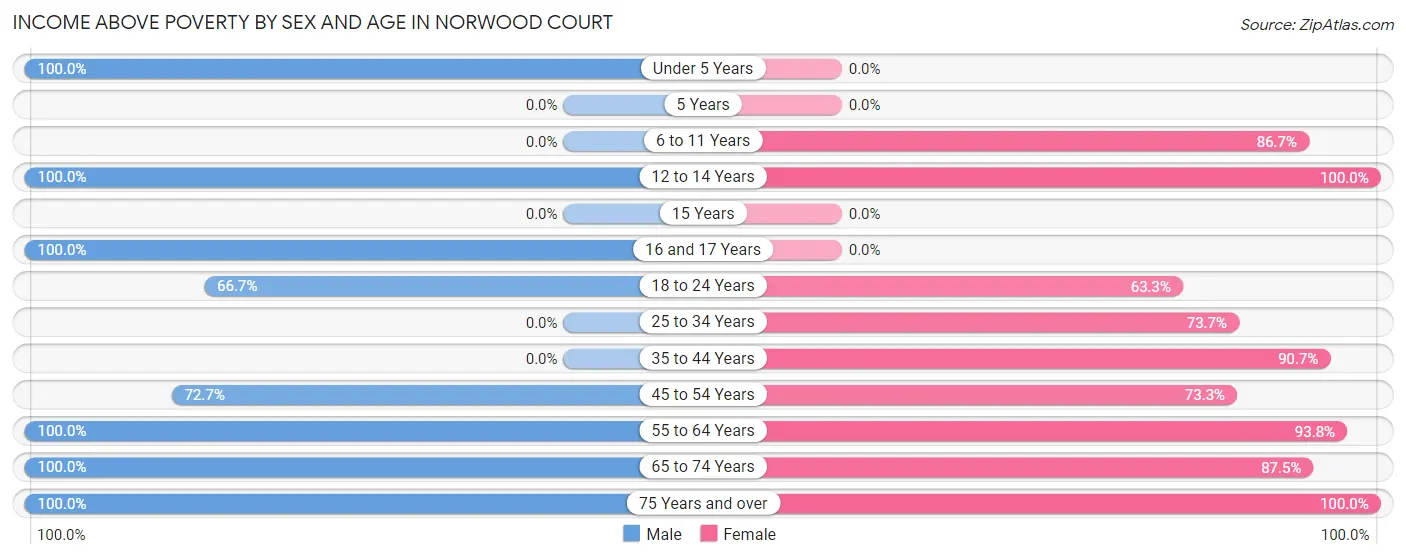
| Age Bracket | Male | Female |
| Under 5 Years | 29 (100.0%) | 0 (0.0%) |
| 5 Years | 0 (0.0%) | 0 (0.0%) |
| 6 to 11 Years | 0 (0.0%) | 13 (86.7%) |
| 12 to 14 Years | 8 (100.0%) | 15 (100.0%) |
| 15 Years | 0 (0.0%) | 0 (0.0%) |
| 16 and 17 Years | 13 (100.0%) | 0 (0.0%) |
| 18 to 24 Years | 14 (66.7%) | 50 (63.3%) |
| 25 to 34 Years | 0 (0.0%) | 42 (73.7%) |
| 35 to 44 Years | 0 (0.0%) | 194 (90.6%) |
| 45 to 54 Years | 40 (72.7%) | 33 (73.3%) |
| 55 to 64 Years | 58 (100.0%) | 60 (93.8%) |
| 65 to 74 Years | 40 (100.0%) | 21 (87.5%) |
| 75 Years and over | 15 (100.0%) | 25 (100.0%) |
| Total | 217 (78.3%) | 453 (81.9%) |
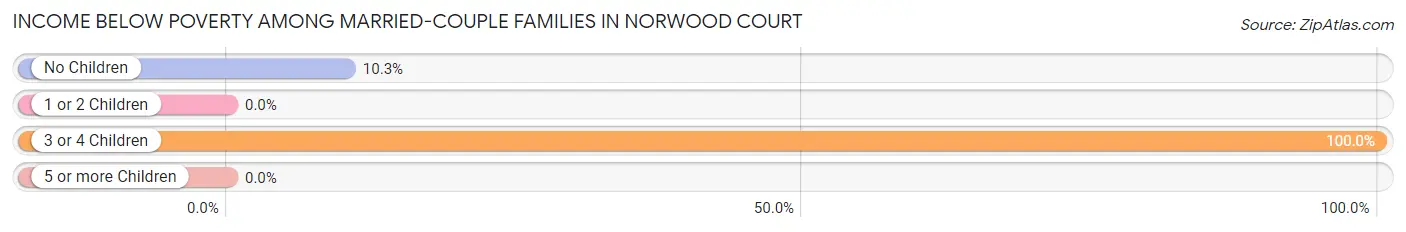
Income Below Poverty Among Married-Couple Families in Norwood Court
The poverty statistics for married-couple families in Norwood Court show that 11.1% or 5 of the total 45 families live below the poverty line. Families with 3 or 4 children have the highest poverty rate of 100.0%, comprising of 1 families. On the other hand, families with 1 or 2 children have the lowest poverty rate of 0.0%, which includes 0 families.
| Children | Above Poverty | Below Poverty |
| No Children | 35 (89.7%) | 4 (10.3%) |
| 1 or 2 Children | 5 (100.0%) | 0 (0.0%) |
| 3 or 4 Children | 0 (0.0%) | 1 (100.0%) |
| 5 or more Children | 0 (0.0%) | 0 (0.0%) |
| Total | 40 (88.9%) | 5 (11.1%) |
Income Below Poverty Among Single-Parent Households in Norwood Court
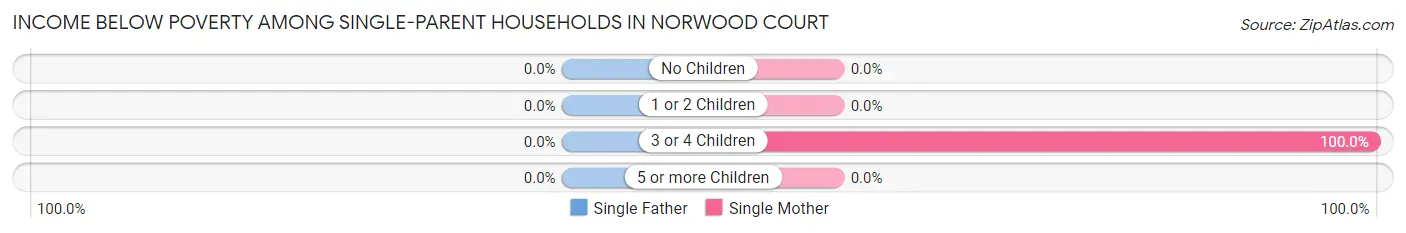
| Children | Single Father | Single Mother |
| No Children | 0 (0.0%) | 0 (0.0%) |
| 1 or 2 Children | 0 (0.0%) | 0 (0.0%) |
| 3 or 4 Children | 0 (0.0%) | 15 (100.0%) |
| 5 or more Children | 0 (0.0%) | 0 (0.0%) |
| Total | 0 (0.0%) | 15 (27.8%) |
Income Below Poverty Among Married-Couple vs Single-Parent Households in Norwood Court
The poverty data for Norwood Court shows that 5 of the married-couple family households (11.1%) and 15 of the single-parent households (25.0%) are living below the poverty level. Within the married-couple family households, those with 3 or 4 children have the highest poverty rate, with 1 households (100.0%) falling below the poverty line. Among the single-parent households, those with 3 or 4 children have the highest poverty rate, with 15 household (100.0%) living below poverty.
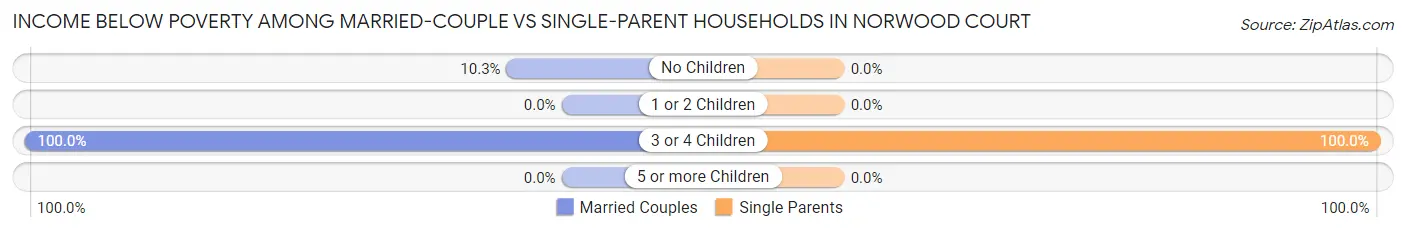
| Children | Married-Couple Families | Single-Parent Households |
| No Children | 4 (10.3%) | 0 (0.0%) |
| 1 or 2 Children | 0 (0.0%) | 0 (0.0%) |
| 3 or 4 Children | 1 (100.0%) | 15 (100.0%) |
| 5 or more Children | 0 (0.0%) | 0 (0.0%) |
| Total | 5 (11.1%) | 15 (25.0%) |
Race in Norwood Court
The most populous races in Norwood Court are Black / African American (611 | 73.6%), White / Caucasian (196 | 23.6%), and Two or more Races (23 | 2.8%).
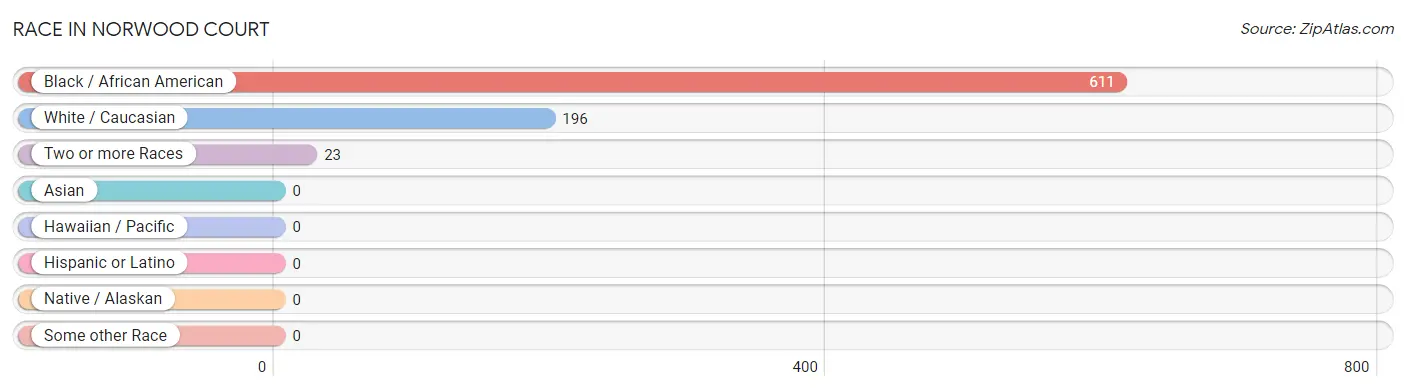
| Race | # Population | % Population |
| Asian | 0 | 0.0% |
| Black / African American | 611 | 73.6% |
| Hawaiian / Pacific | 0 | 0.0% |
| Hispanic or Latino | 0 | 0.0% |
| Native / Alaskan | 0 | 0.0% |
| White / Caucasian | 196 | 23.6% |
| Two or more Races | 23 | 2.8% |
| Some other Race | 0 | 0.0% |
| Total | 830 | 100.0% |
Ancestry in Norwood Court
The most populous ancestries reported in Norwood Court are American (40 | 4.8%), German (21 | 2.5%), Subsaharan African (18 | 2.2%), Italian (16 | 1.9%), and African (13 | 1.6%), together accounting for 13.0% of all Norwood Court residents.
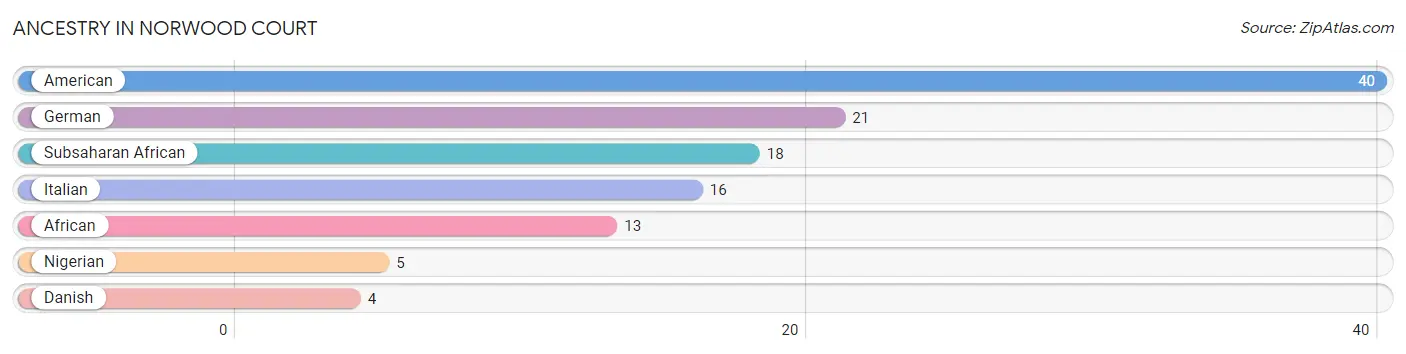
| Ancestry | # Population | % Population |
| African | 13 | 1.6% |
| American | 40 | 4.8% |
| Danish | 4 | 0.5% |
| German | 21 | 2.5% |
| Italian | 16 | 1.9% |
| Nigerian | 5 | 0.6% |
| Subsaharan African | 18 | 2.2% | View All 7 Rows |
Immigrants in Norwood Court
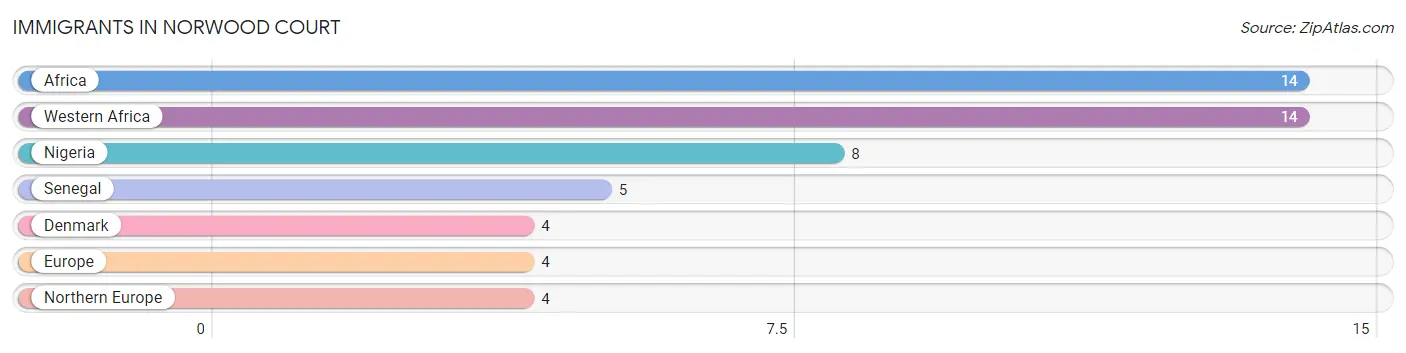
The most numerous immigrant groups reported in Norwood Court came from Africa (14 | 1.7%), Western Africa (14 | 1.7%), Nigeria (8 | 1.0%), Senegal (5 | 0.6%), and Denmark (4 | 0.5%), together accounting for 5.4% of all Norwood Court residents.
| Immigration Origin | # Population | % Population |
| Africa | 14 | 1.7% |
| Denmark | 4 | 0.5% |
| Europe | 4 | 0.5% |
| Nigeria | 8 | 1.0% |
| Northern Europe | 4 | 0.5% |
| Senegal | 5 | 0.6% |
| Western Africa | 14 | 1.7% | View All 7 Rows |
Sex and Age in Norwood Court
Sex and Age in Norwood Court
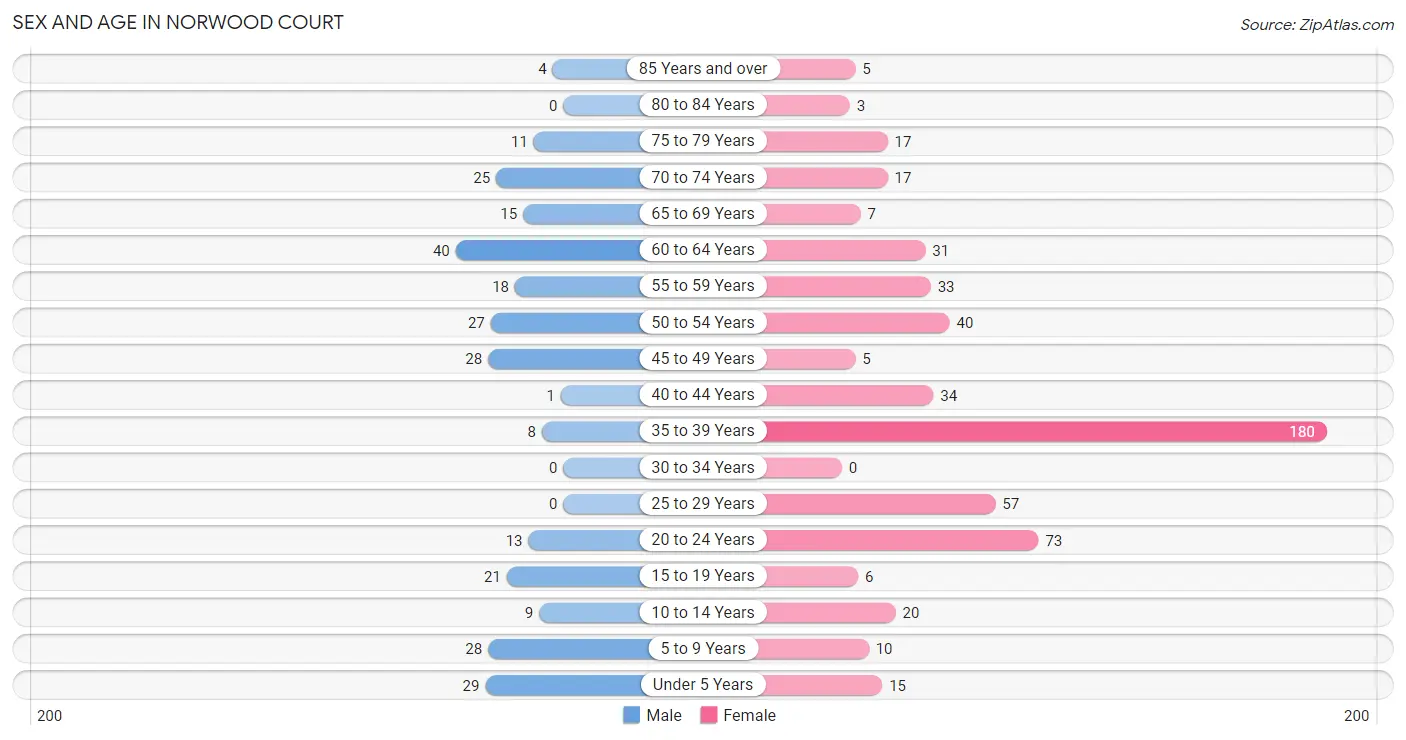
The most populous age groups in Norwood Court are 60 to 64 Years (40 | 14.4%) for men and 35 to 39 Years (180 | 32.6%) for women.
| Age Bracket | Male | Female |
| Under 5 Years | 29 (10.5%) | 15 (2.7%) |
| 5 to 9 Years | 28 (10.1%) | 10 (1.8%) |
| 10 to 14 Years | 9 (3.3%) | 20 (3.6%) |
| 15 to 19 Years | 21 (7.6%) | 6 (1.1%) |
| 20 to 24 Years | 13 (4.7%) | 73 (13.2%) |
| 25 to 29 Years | 0 (0.0%) | 57 (10.3%) |
| 30 to 34 Years | 0 (0.0%) | 0 (0.0%) |
| 35 to 39 Years | 8 (2.9%) | 180 (32.6%) |
| 40 to 44 Years | 1 (0.4%) | 34 (6.1%) |
| 45 to 49 Years | 28 (10.1%) | 5 (0.9%) |
| 50 to 54 Years | 27 (9.8%) | 40 (7.2%) |
| 55 to 59 Years | 18 (6.5%) | 33 (6.0%) |
| 60 to 64 Years | 40 (14.4%) | 31 (5.6%) |
| 65 to 69 Years | 15 (5.4%) | 7 (1.3%) |
| 70 to 74 Years | 25 (9.0%) | 17 (3.1%) |
| 75 to 79 Years | 11 (4.0%) | 17 (3.1%) |
| 80 to 84 Years | 0 (0.0%) | 3 (0.5%) |
| 85 Years and over | 4 (1.4%) | 5 (0.9%) |
| Total | 277 (100.0%) | 553 (100.0%) |
Families and Households in Norwood Court
Median Family Size in Norwood Court
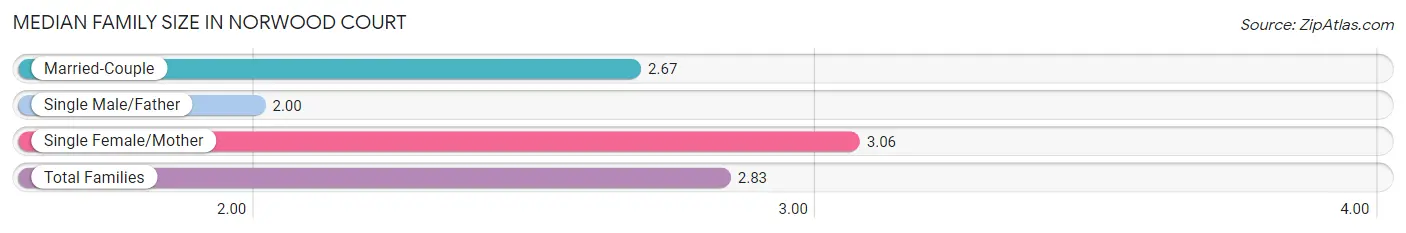
The median family size in Norwood Court is 2.83 persons per family, with single female/mother families (54 | 51.4%) accounting for the largest median family size of 3.06 persons per family. On the other hand, single male/father families (6 | 5.7%) represent the smallest median family size with 2.00 persons per family.
| Family Type | # Families | Family Size |
| Married-Couple | 45 (42.9%) | 2.67 |
| Single Male/Father | 6 (5.7%) | 2.00 |
| Single Female/Mother | 54 (51.4%) | 3.06 |
| Total Families | 105 (100.0%) | 2.83 |
Median Household Size in Norwood Court
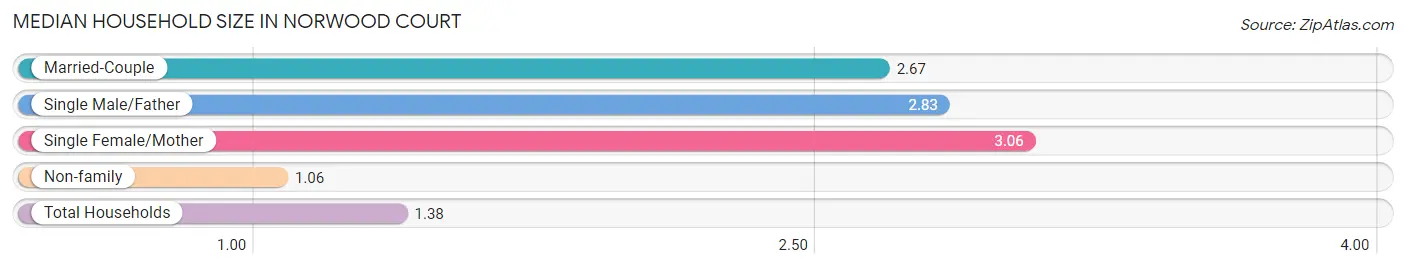
The median household size in Norwood Court is 1.38 persons per household, with single female/mother households (54 | 9.0%) accounting for the largest median household size of 3.06 persons per household. non-family households (497 | 82.6%) represent the smallest median household size with 1.06 persons per household.
| Household Type | # Households | Household Size |
| Married-Couple | 45 (7.5%) | 2.67 |
| Single Male/Father | 6 (1.0%) | 2.83 |
| Single Female/Mother | 54 (9.0%) | 3.06 |
| Non-family | 497 (82.6%) | 1.06 |
| Total Households | 602 (100.0%) | 1.38 |
Household Size by Marriage Status in Norwood Court
Out of a total of 602 households in Norwood Court, 105 (17.4%) are family households, while 497 (82.6%) are nonfamily households. The most numerous type of family households are 2-person households, comprising 59, and the most common type of nonfamily households are 1-person households, comprising 466.
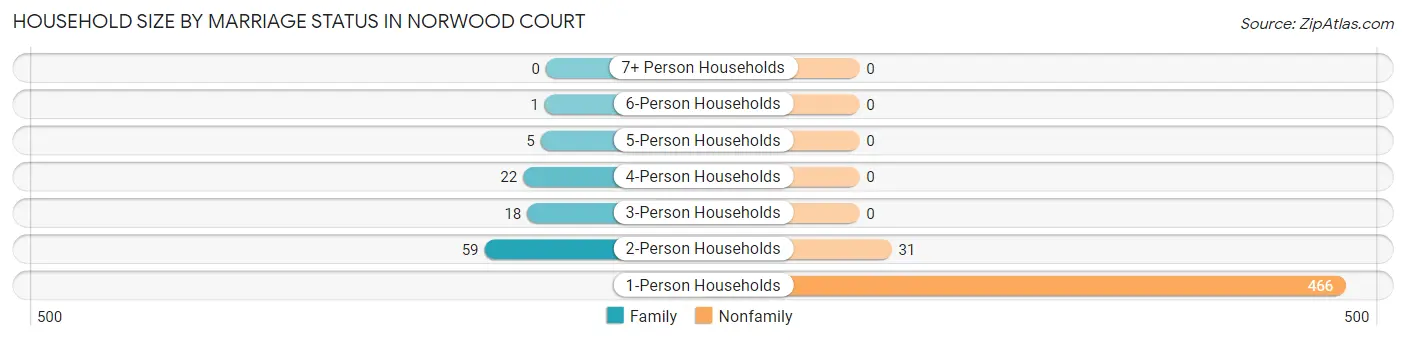
| Household Size | Family Households | Nonfamily Households |
| 1-Person Households | - | 466 (77.4%) |
| 2-Person Households | 59 (9.8%) | 31 (5.1%) |
| 3-Person Households | 18 (3.0%) | 0 (0.0%) |
| 4-Person Households | 22 (3.6%) | 0 (0.0%) |
| 5-Person Households | 5 (0.8%) | 0 (0.0%) |
| 6-Person Households | 1 (0.2%) | 0 (0.0%) |
| 7+ Person Households | 0 (0.0%) | 0 (0.0%) |
| Total | 105 (17.4%) | 497 (82.6%) |
Female Fertility in Norwood Court
Fertility by Age in Norwood Court
Average fertility rate in Norwood Court is 40.0 births per 1,000 women. Women in the age bracket of 20 to 34 years have the highest fertility rate with 115.0 births per 1,000 women. Women in the age bracket of 20 to 34 years acount for 100.0% of all women with births.
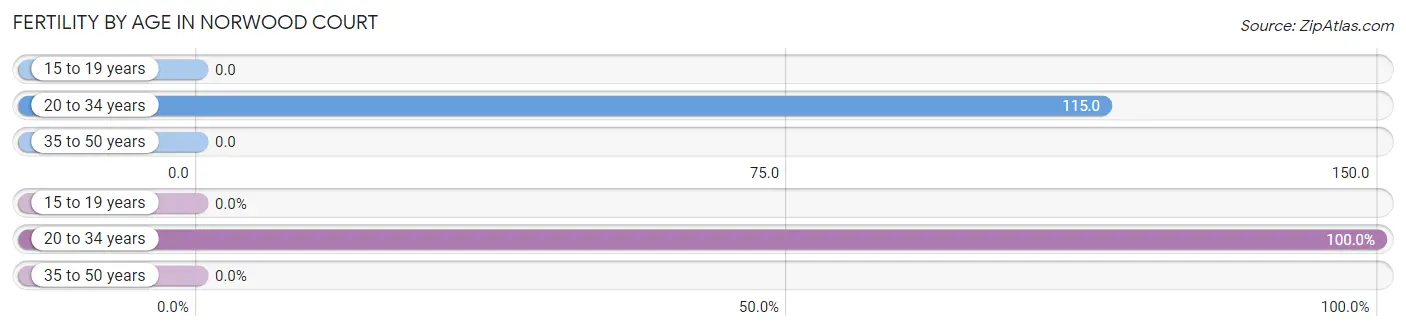
| Age Bracket | Women with Births | Births / 1,000 Women |
| 15 to 19 years | 0 (0.0%) | 0.0 |
| 20 to 34 years | 15 (100.0%) | 115.0 |
| 35 to 50 years | 0 (0.0%) | 0.0 |
| Total | 15 (100.0%) | 40.0 |
Fertility by Age by Marriage Status in Norwood Court
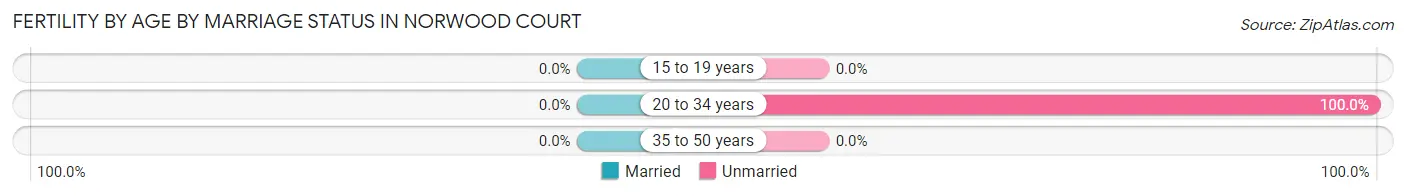
| Age Bracket | Married | Unmarried |
| 15 to 19 years | 0 (0.0%) | 0 (0.0%) |
| 20 to 34 years | 0 (0.0%) | 15 (100.0%) |
| 35 to 50 years | 0 (0.0%) | 0 (0.0%) |
| Total | 0 (0.0%) | 15 (100.0%) |
Fertility by Education in Norwood Court
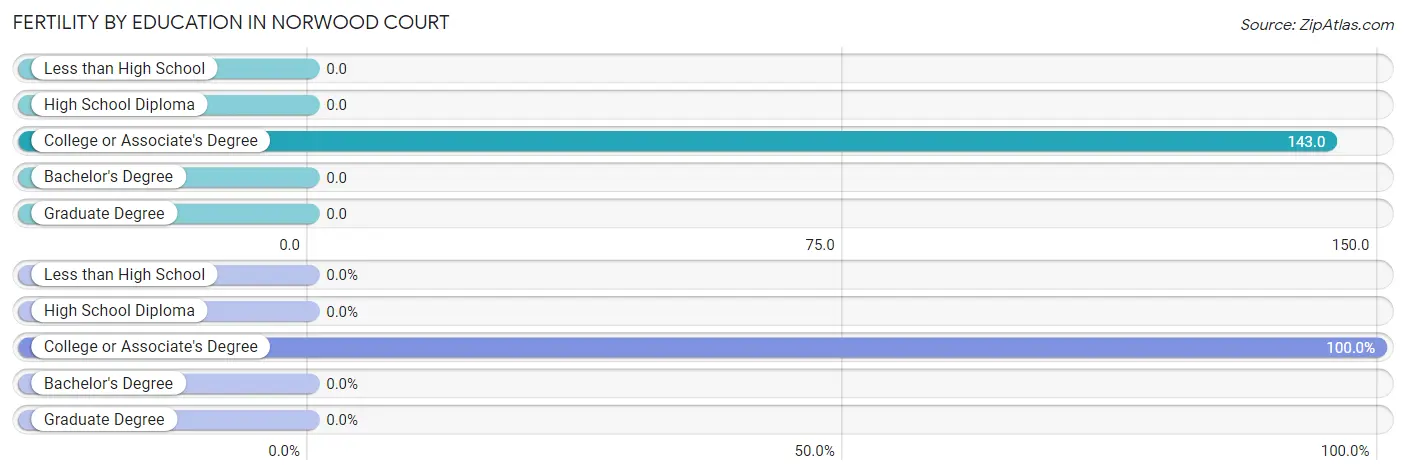
| Educational Attainment | Women with Births | Births / 1,000 Women |
| Less than High School | 0 (0.0%) | 0.0 |
| High School Diploma | 0 (0.0%) | 0.0 |
| College or Associate's Degree | 15 (100.0%) | 143.0 |
| Bachelor's Degree | 0 (0.0%) | 0.0 |
| Graduate Degree | 0 (0.0%) | 0.0 |
| Total | 15 (100.0%) | 40.0 |
Fertility by Education by Marriage Status in Norwood Court
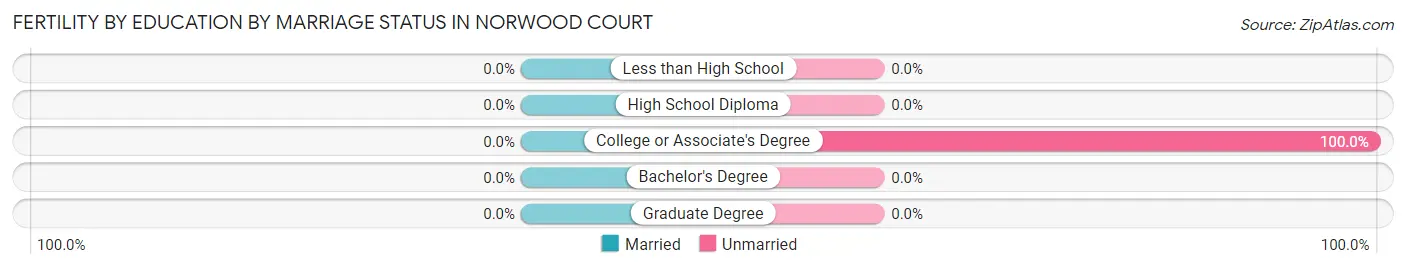
| Educational Attainment | Married | Unmarried |
| Less than High School | 0 (0.0%) | 0 (0.0%) |
| High School Diploma | 0 (0.0%) | 0 (0.0%) |
| College or Associate's Degree | 0 (0.0%) | 15 (100.0%) |
| Bachelor's Degree | 0 (0.0%) | 0 (0.0%) |
| Graduate Degree | 0 (0.0%) | 0 (0.0%) |
| Total | 0 (0.0%) | 15 (100.0%) |
Employment Characteristics in Norwood Court
Employment by Class of Employer in Norwood Court
Among the 537 employed individuals in Norwood Court, private company employees (385 | 71.7%), not-for-profit organizations (44 | 8.2%), and self-employed (incorporated) (36 | 6.7%) make up the most common classes of employment.
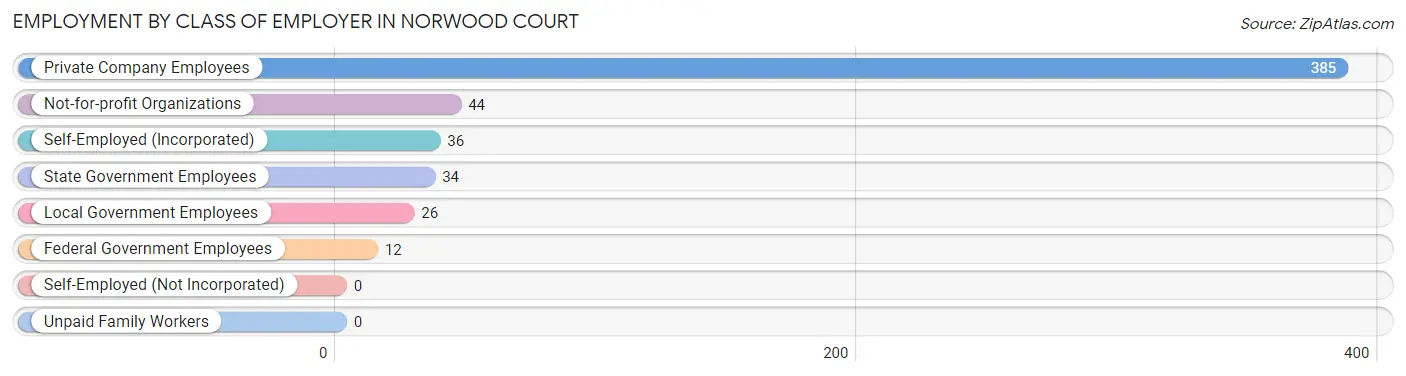
| Employer Class | # Employees | % Employees |
| Private Company Employees | 385 | 71.7% |
| Self-Employed (Incorporated) | 36 | 6.7% |
| Self-Employed (Not Incorporated) | 0 | 0.0% |
| Not-for-profit Organizations | 44 | 8.2% |
| Local Government Employees | 26 | 4.8% |
| State Government Employees | 34 | 6.3% |
| Federal Government Employees | 12 | 2.2% |
| Unpaid Family Workers | 0 | 0.0% |
| Total | 537 | 100.0% |
Employment Status by Age in Norwood Court
According to the labor force statistics for Norwood Court, out of the total population over 16 years of age (719), 81.8% or 588 individuals are in the labor force, with 8.7% or 51 of them unemployed. The age group with the highest labor force participation rate is 16 to 19 years, with 100.0% or 27 individuals in the labor force. Within the labor force, the 65 to 74 years age range has the highest percentage of unemployed individuals, with 29.4% or 10 of them being unemployed.
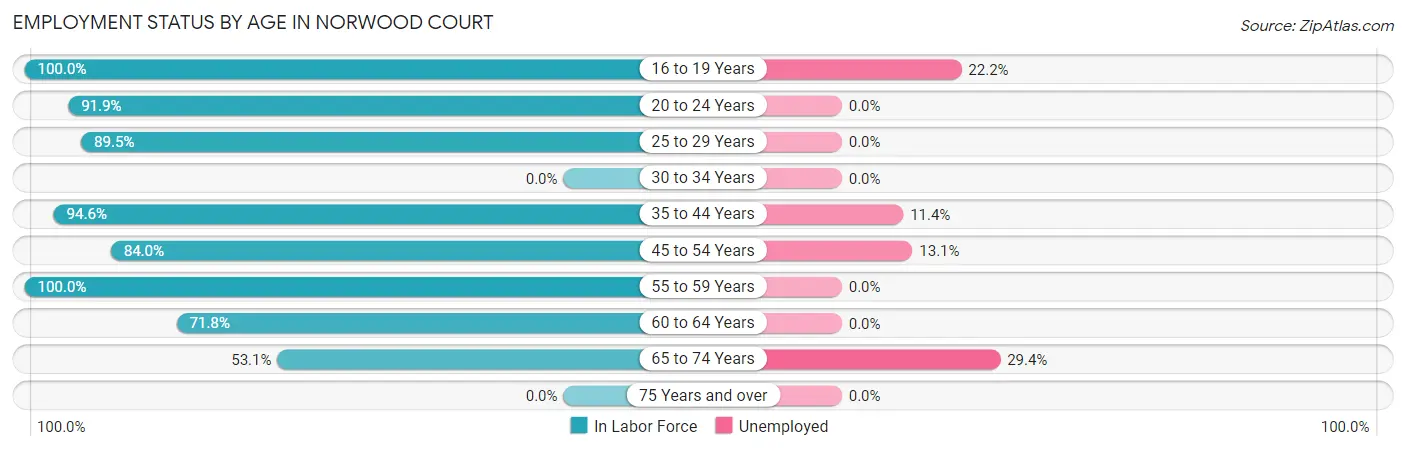
| Age Bracket | In Labor Force | Unemployed |
| 16 to 19 Years | 27 (100.0%) | 6 (22.2%) |
| 20 to 24 Years | 79 (91.9%) | 0 (0.0%) |
| 25 to 29 Years | 51 (89.5%) | 0 (0.0%) |
| 30 to 34 Years | 0 (0.0%) | 0 (0.0%) |
| 35 to 44 Years | 211 (94.6%) | 24 (11.4%) |
| 45 to 54 Years | 84 (84.0%) | 11 (13.1%) |
| 55 to 59 Years | 51 (100.0%) | 0 (0.0%) |
| 60 to 64 Years | 51 (71.8%) | 0 (0.0%) |
| 65 to 74 Years | 34 (53.1%) | 10 (29.4%) |
| 75 Years and over | 0 (0.0%) | 0 (0.0%) |
| Total | 588 (81.8%) | 51 (8.7%) |
Employment Status by Educational Attainment in Norwood Court
According to labor force statistics for Norwood Court, 89.2% of individuals (448) out of the total population between 25 and 64 years of age (502) are in the labor force, with 7.8% or 35 of them being unemployed. The group with the highest labor force participation rate are those with the educational attainment of college / associate degree, with 96.2% or 127 individuals in the labor force. Within the labor force, individuals with high school diploma education have the highest percentage of unemployment, with 10.3% or 28 of them being unemployed.
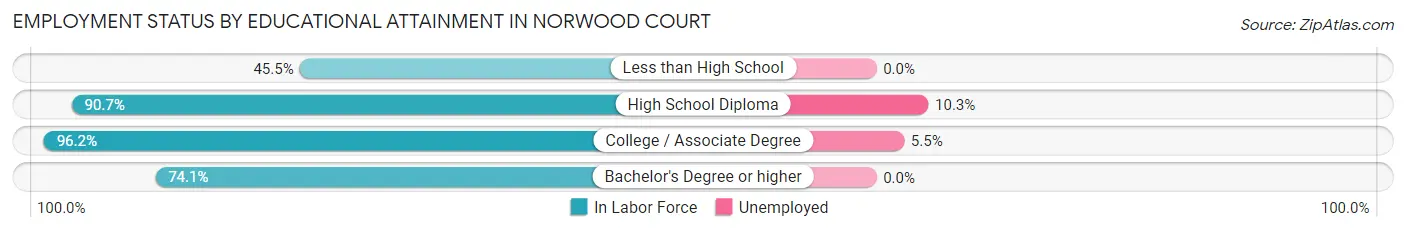
| Educational Attainment | In Labor Force | Unemployed |
| Less than High School | 5 (45.5%) | 0 (0.0%) |
| High School Diploma | 273 (90.7%) | 31 (10.3%) |
| College / Associate Degree | 127 (96.2%) | 7 (5.5%) |
| Bachelor's Degree or higher | 43 (74.1%) | 0 (0.0%) |
| Total | 448 (89.2%) | 39 (7.8%) |
Employment Occupations by Sex in Norwood Court
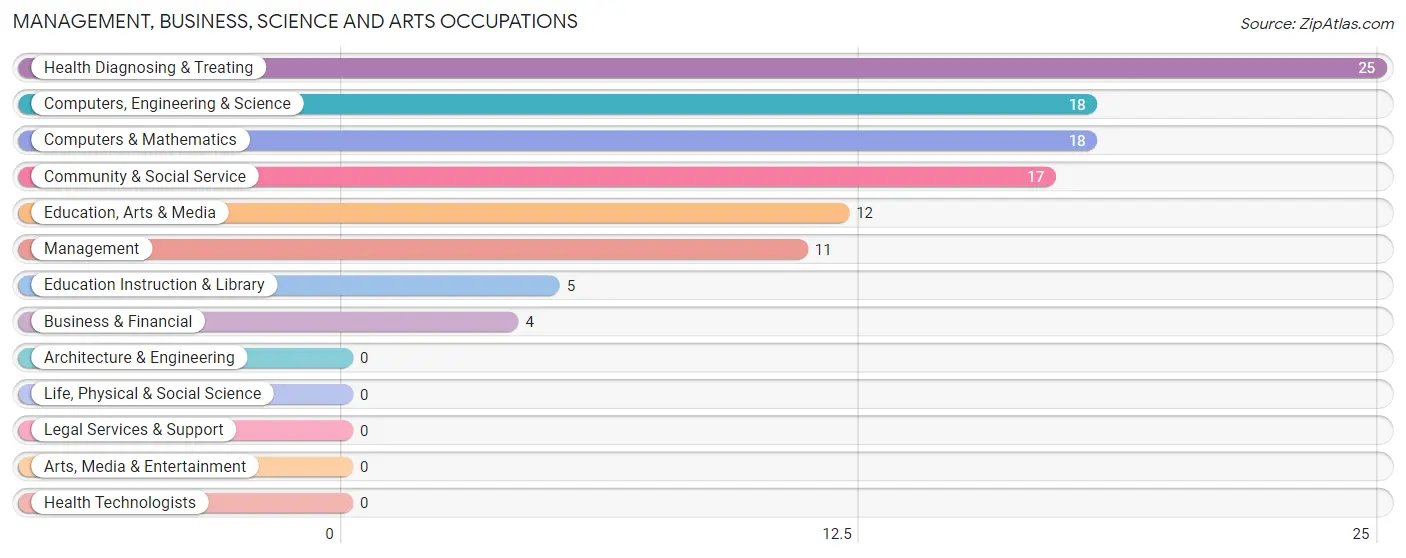
Management, Business, Science and Arts Occupations
The most common Management, Business, Science and Arts occupations in Norwood Court are Health Diagnosing & Treating (25 | 4.7%), Computers, Engineering & Science (18 | 3.4%), Computers & Mathematics (18 | 3.4%), Community & Social Service (17 | 3.2%), and Education, Arts & Media (12 | 2.2%).
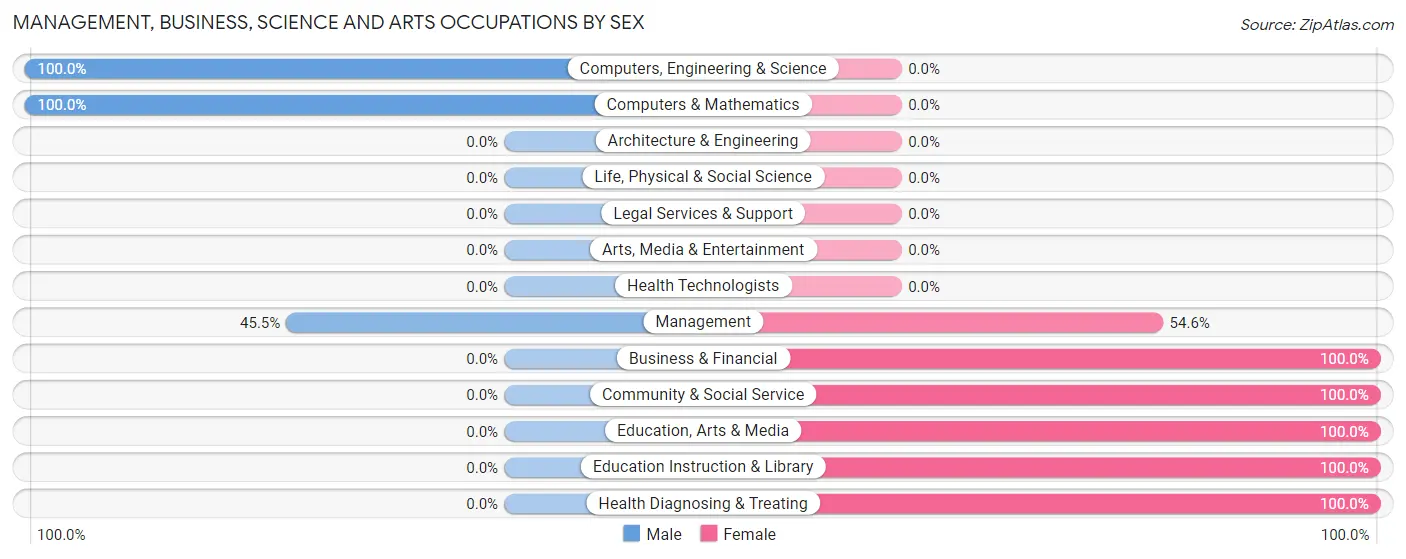
Management, Business, Science and Arts Occupations by Sex
Within the Management, Business, Science and Arts occupations in Norwood Court, the most male-oriented occupations are Computers, Engineering & Science (100.0%), Computers & Mathematics (100.0%), and Management (45.5%), while the most female-oriented occupations are Business & Financial (100.0%), Community & Social Service (100.0%), and Education, Arts & Media (100.0%).
| Occupation | Male | Female |
| Management | 5 (45.5%) | 6 (54.5%) |
| Business & Financial | 0 (0.0%) | 4 (100.0%) |
| Computers, Engineering & Science | 18 (100.0%) | 0 (0.0%) |
| Computers & Mathematics | 18 (100.0%) | 0 (0.0%) |
| Architecture & Engineering | 0 (0.0%) | 0 (0.0%) |
| Life, Physical & Social Science | 0 (0.0%) | 0 (0.0%) |
| Community & Social Service | 0 (0.0%) | 17 (100.0%) |
| Education, Arts & Media | 0 (0.0%) | 12 (100.0%) |
| Legal Services & Support | 0 (0.0%) | 0 (0.0%) |
| Education Instruction & Library | 0 (0.0%) | 5 (100.0%) |
| Arts, Media & Entertainment | 0 (0.0%) | 0 (0.0%) |
| Health Diagnosing & Treating | 0 (0.0%) | 25 (100.0%) |
| Health Technologists | 0 (0.0%) | 0 (0.0%) |
| Total (Category) | 23 (30.7%) | 52 (69.3%) |
| Total (Overall) | 129 (24.0%) | 408 (76.0%) |
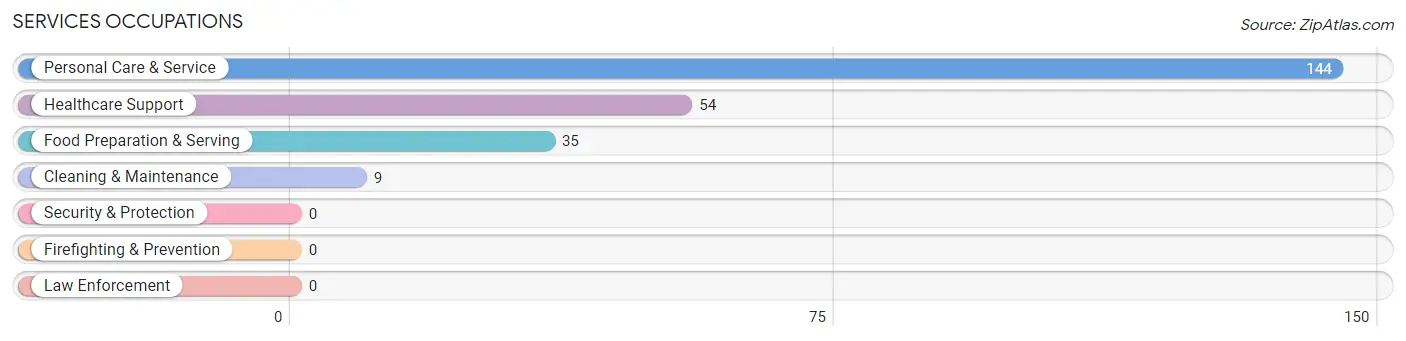
Services Occupations
The most common Services occupations in Norwood Court are Personal Care & Service (144 | 26.8%), Healthcare Support (54 | 10.1%), Food Preparation & Serving (35 | 6.5%), and Cleaning & Maintenance (9 | 1.7%).
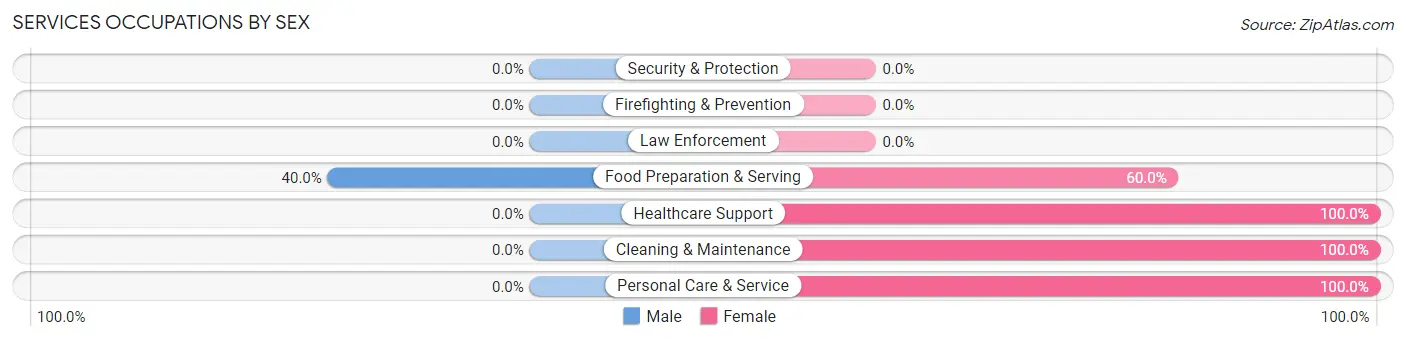
Services Occupations by Sex
| Occupation | Male | Female |
| Healthcare Support | 0 (0.0%) | 54 (100.0%) |
| Security & Protection | 0 (0.0%) | 0 (0.0%) |
| Firefighting & Prevention | 0 (0.0%) | 0 (0.0%) |
| Law Enforcement | 0 (0.0%) | 0 (0.0%) |
| Food Preparation & Serving | 14 (40.0%) | 21 (60.0%) |
| Cleaning & Maintenance | 0 (0.0%) | 9 (100.0%) |
| Personal Care & Service | 0 (0.0%) | 144 (100.0%) |
| Total (Category) | 14 (5.8%) | 228 (94.2%) |
| Total (Overall) | 129 (24.0%) | 408 (76.0%) |
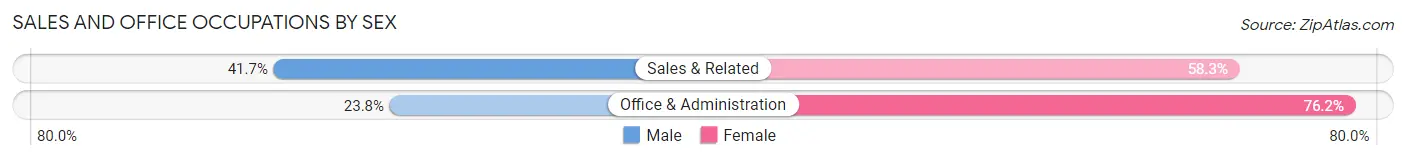
Sales and Office Occupations
The most common Sales and Office occupations in Norwood Court are Office & Administration (84 | 15.6%), and Sales & Related (12 | 2.2%).
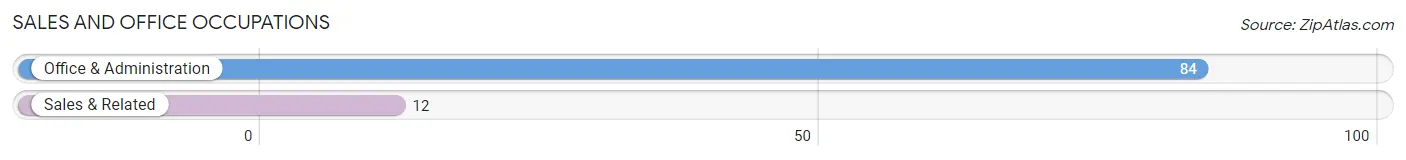
Sales and Office Occupations by Sex
| Occupation | Male | Female |
| Sales & Related | 5 (41.7%) | 7 (58.3%) |
| Office & Administration | 20 (23.8%) | 64 (76.2%) |
| Total (Category) | 25 (26.0%) | 71 (74.0%) |
| Total (Overall) | 129 (24.0%) | 408 (76.0%) |
Natural Resources, Construction and Maintenance Occupations
The most common Natural Resources, Construction and Maintenance occupations in Norwood Court are , and Construction & Extraction (19 | 3.5%).
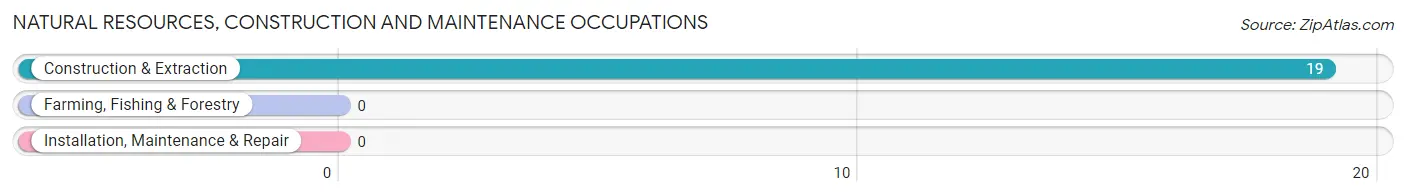
Natural Resources, Construction and Maintenance Occupations by Sex
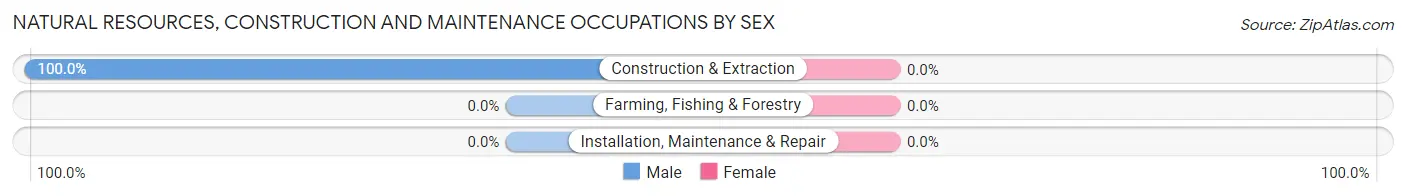
| Occupation | Male | Female |
| Farming, Fishing & Forestry | 0 (0.0%) | 0 (0.0%) |
| Construction & Extraction | 19 (100.0%) | 0 (0.0%) |
| Installation, Maintenance & Repair | 0 (0.0%) | 0 (0.0%) |
| Total (Category) | 19 (100.0%) | 0 (0.0%) |
| Total (Overall) | 129 (24.0%) | 408 (76.0%) |
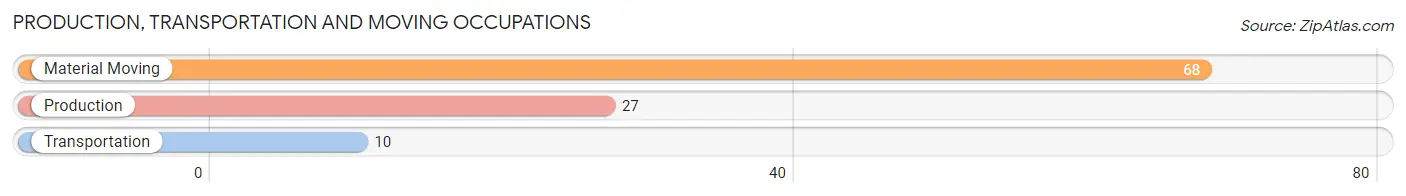
Production, Transportation and Moving Occupations
The most common Production, Transportation and Moving occupations in Norwood Court are Material Moving (68 | 12.7%), Production (27 | 5.0%), and Transportation (10 | 1.9%).
Production, Transportation and Moving Occupations by Sex
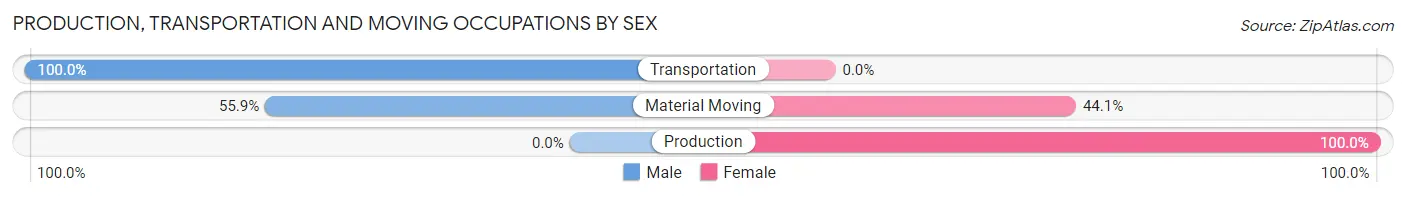
| Occupation | Male | Female |
| Production | 0 (0.0%) | 27 (100.0%) |
| Transportation | 10 (100.0%) | 0 (0.0%) |
| Material Moving | 38 (55.9%) | 30 (44.1%) |
| Total (Category) | 48 (45.7%) | 57 (54.3%) |
| Total (Overall) | 129 (24.0%) | 408 (76.0%) |
Employment Industries by Sex in Norwood Court
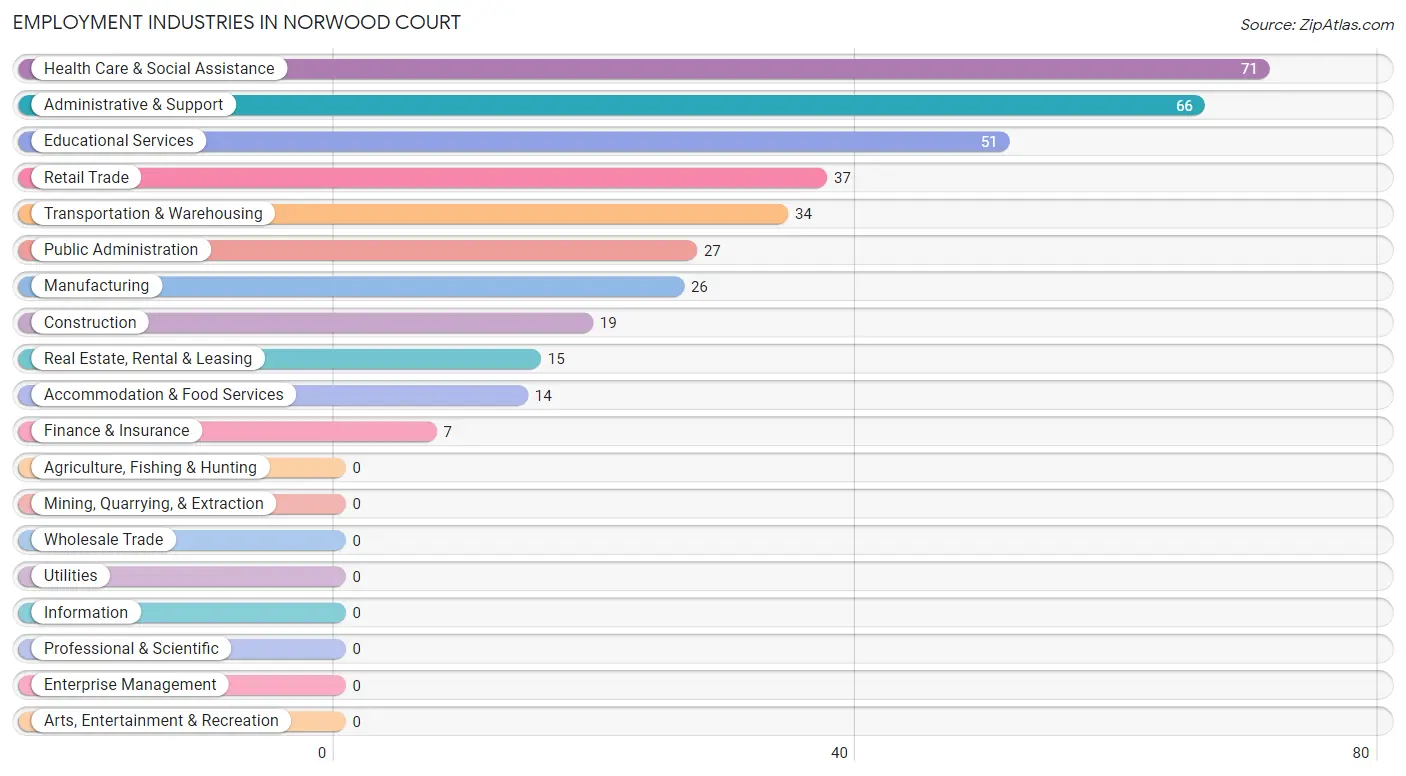
Employment Industries in Norwood Court
The major employment industries in Norwood Court include Health Care & Social Assistance (71 | 13.2%), Administrative & Support (66 | 12.3%), Educational Services (51 | 9.5%), Retail Trade (37 | 6.9%), and Transportation & Warehousing (34 | 6.3%).
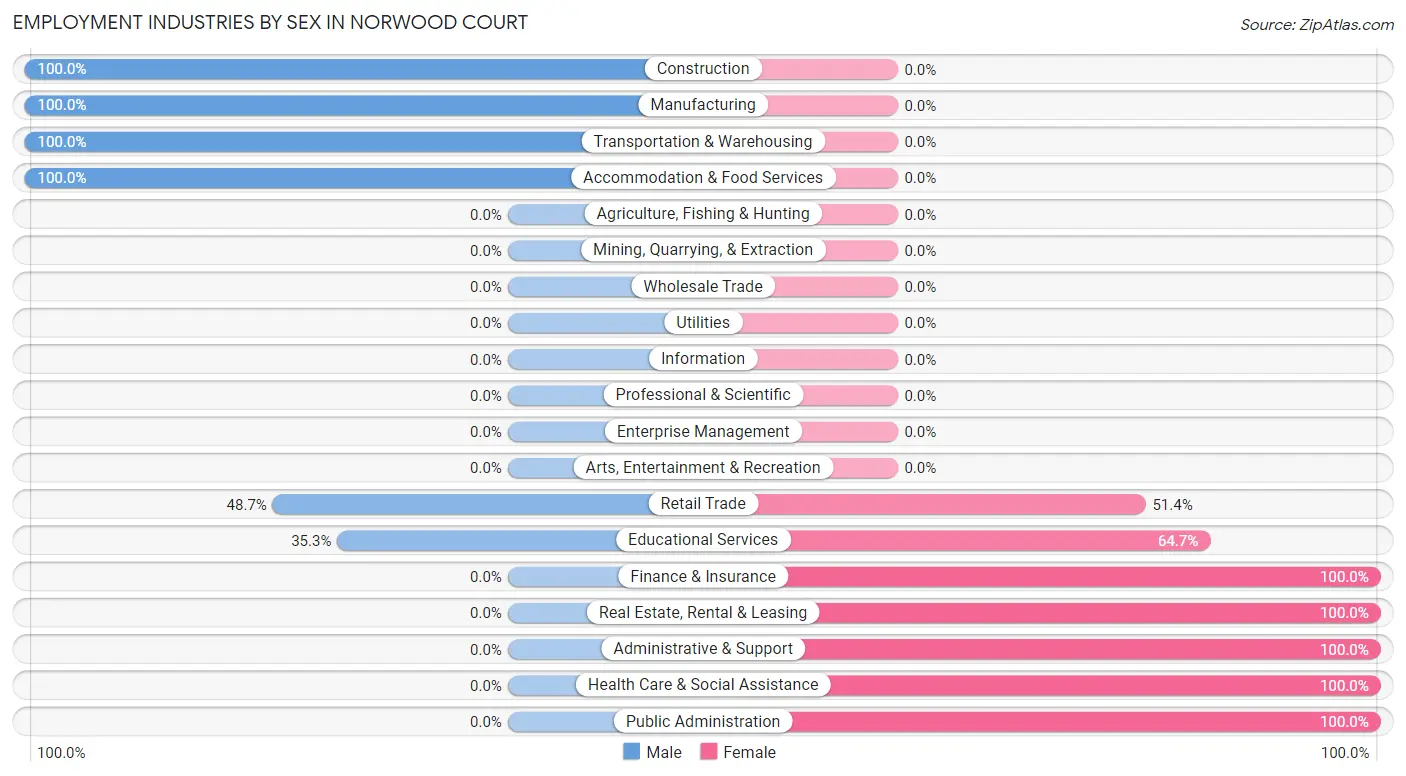
Employment Industries by Sex in Norwood Court
The Norwood Court industries that see more men than women are Construction (100.0%), Manufacturing (100.0%), and Transportation & Warehousing (100.0%), whereas the industries that tend to have a higher number of women are Finance & Insurance (100.0%), Real Estate, Rental & Leasing (100.0%), and Administrative & Support (100.0%).
| Industry | Male | Female |
| Agriculture, Fishing & Hunting | 0 (0.0%) | 0 (0.0%) |
| Mining, Quarrying, & Extraction | 0 (0.0%) | 0 (0.0%) |
| Construction | 19 (100.0%) | 0 (0.0%) |
| Manufacturing | 26 (100.0%) | 0 (0.0%) |
| Wholesale Trade | 0 (0.0%) | 0 (0.0%) |
| Retail Trade | 18 (48.6%) | 19 (51.3%) |
| Transportation & Warehousing | 34 (100.0%) | 0 (0.0%) |
| Utilities | 0 (0.0%) | 0 (0.0%) |
| Information | 0 (0.0%) | 0 (0.0%) |
| Finance & Insurance | 0 (0.0%) | 7 (100.0%) |
| Real Estate, Rental & Leasing | 0 (0.0%) | 15 (100.0%) |
| Professional & Scientific | 0 (0.0%) | 0 (0.0%) |
| Enterprise Management | 0 (0.0%) | 0 (0.0%) |
| Administrative & Support | 0 (0.0%) | 66 (100.0%) |
| Educational Services | 18 (35.3%) | 33 (64.7%) |
| Health Care & Social Assistance | 0 (0.0%) | 71 (100.0%) |
| Arts, Entertainment & Recreation | 0 (0.0%) | 0 (0.0%) |
| Accommodation & Food Services | 14 (100.0%) | 0 (0.0%) |
| Public Administration | 0 (0.0%) | 27 (100.0%) |
| Total | 129 (24.0%) | 408 (76.0%) |
Education in Norwood Court
School Enrollment in Norwood Court
The most common levels of schooling among the 139 students in Norwood Court are college / undergraduate (44 | 31.7%), middle school (29 | 20.9%), and elementary school (24 | 17.3%).
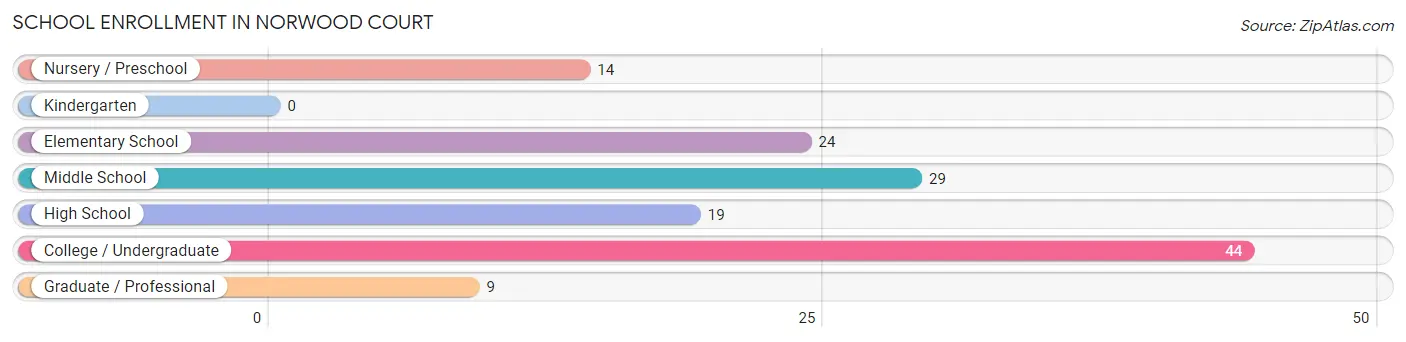
| School Level | # Students | % Students |
| Nursery / Preschool | 14 | 10.1% |
| Kindergarten | 0 | 0.0% |
| Elementary School | 24 | 17.3% |
| Middle School | 29 | 20.9% |
| High School | 19 | 13.7% |
| College / Undergraduate | 44 | 31.7% |
| Graduate / Professional | 9 | 6.5% |
| Total | 139 | 100.0% |
School Enrollment by Age by Funding Source in Norwood Court
Out of a total of 139 students who are enrolled in schools in Norwood Court, 15 (10.8%) attend a private institution, while the remaining 124 (89.2%) are enrolled in public schools. The age group of 15 to 17 year olds has the highest likelihood of being enrolled in private schools, with 13 (100.0% in the age bracket) enrolled. Conversely, the age group of 5 to 9 year old has the lowest likelihood of being enrolled in a private school, with 38 (100.0% in the age bracket) attending a public institution.
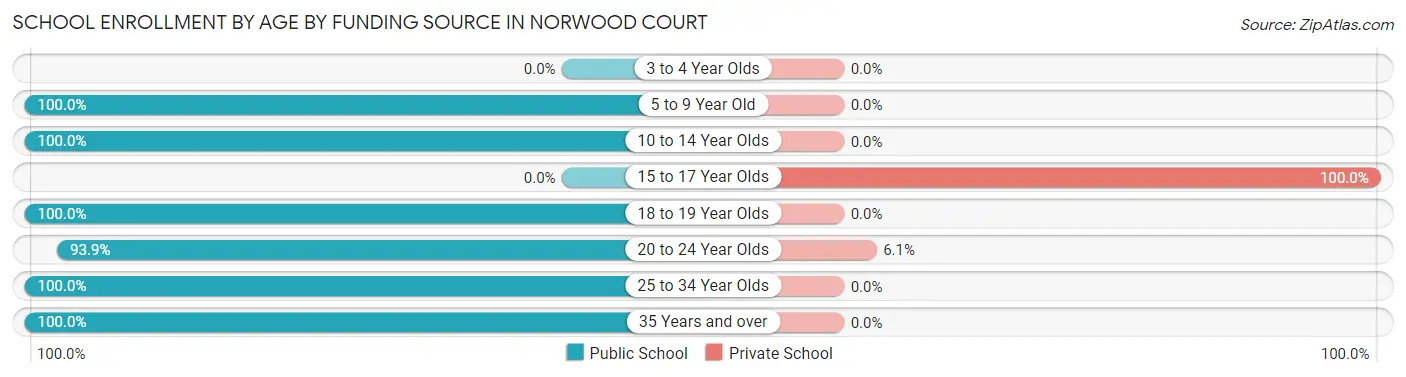
| Age Bracket | Public School | Private School |
| 3 to 4 Year Olds | 0 (0.0%) | 0 (0.0%) |
| 5 to 9 Year Old | 38 (100.0%) | 0 (0.0%) |
| 10 to 14 Year Olds | 29 (100.0%) | 0 (0.0%) |
| 15 to 17 Year Olds | 0 (0.0%) | 13 (100.0%) |
| 18 to 19 Year Olds | 6 (100.0%) | 0 (0.0%) |
| 20 to 24 Year Olds | 31 (93.9%) | 2 (6.1%) |
| 25 to 34 Year Olds | 11 (100.0%) | 0 (0.0%) |
| 35 Years and over | 9 (100.0%) | 0 (0.0%) |
| Total | 124 (89.2%) | 15 (10.8%) |
Educational Attainment by Field of Study in Norwood Court
Business (27 | 27.3%), communications (23 | 23.2%), science & technology (13 | 13.1%), bio, nature & agricultural (11 | 11.1%), and education (9 | 9.1%) are the most common fields of study among 99 individuals in Norwood Court who have obtained a bachelor's degree or higher.
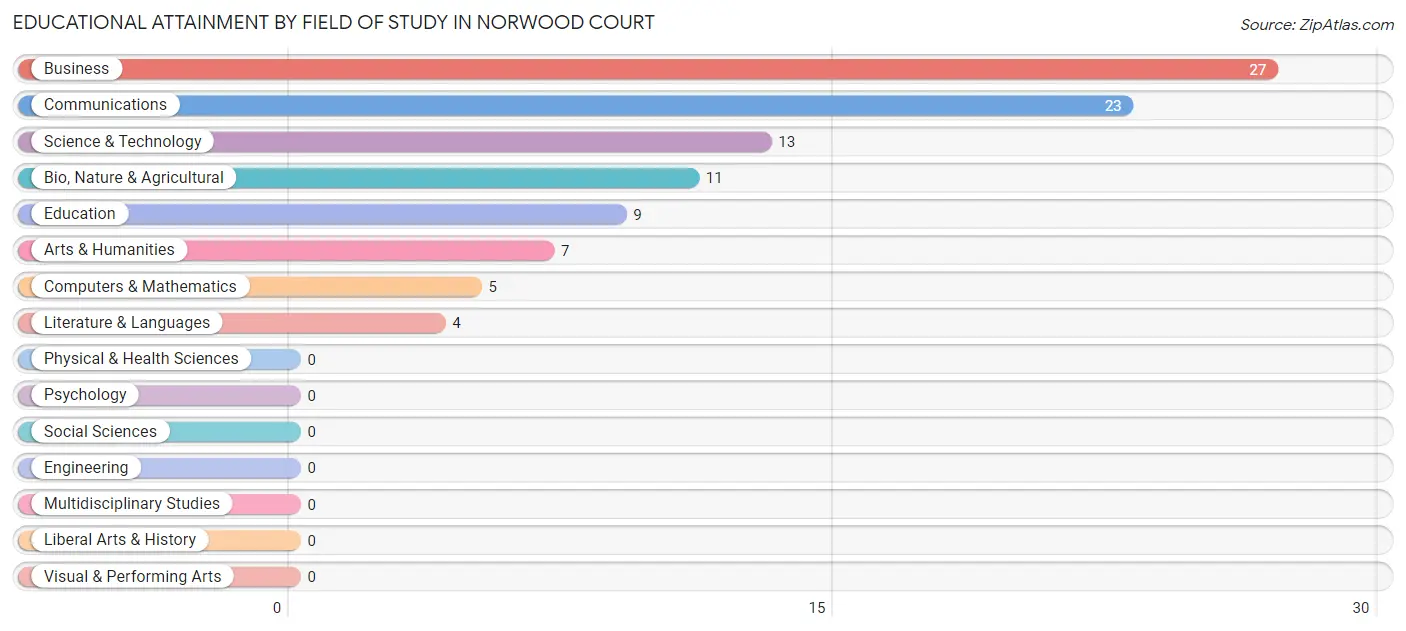
| Field of Study | # Graduates | % Graduates |
| Computers & Mathematics | 5 | 5.1% |
| Bio, Nature & Agricultural | 11 | 11.1% |
| Physical & Health Sciences | 0 | 0.0% |
| Psychology | 0 | 0.0% |
| Social Sciences | 0 | 0.0% |
| Engineering | 0 | 0.0% |
| Multidisciplinary Studies | 0 | 0.0% |
| Science & Technology | 13 | 13.1% |
| Business | 27 | 27.3% |
| Education | 9 | 9.1% |
| Literature & Languages | 4 | 4.0% |
| Liberal Arts & History | 0 | 0.0% |
| Visual & Performing Arts | 0 | 0.0% |
| Communications | 23 | 23.2% |
| Arts & Humanities | 7 | 7.1% |
| Total | 99 | 100.0% |
Transportation & Commute in Norwood Court
Vehicle Availability by Sex in Norwood Court
The most prevalent vehicle ownership categories in Norwood Court are males with 1 vehicle (109, accounting for 84.5%) and females with 1 vehicle (373, making up 26.7%).
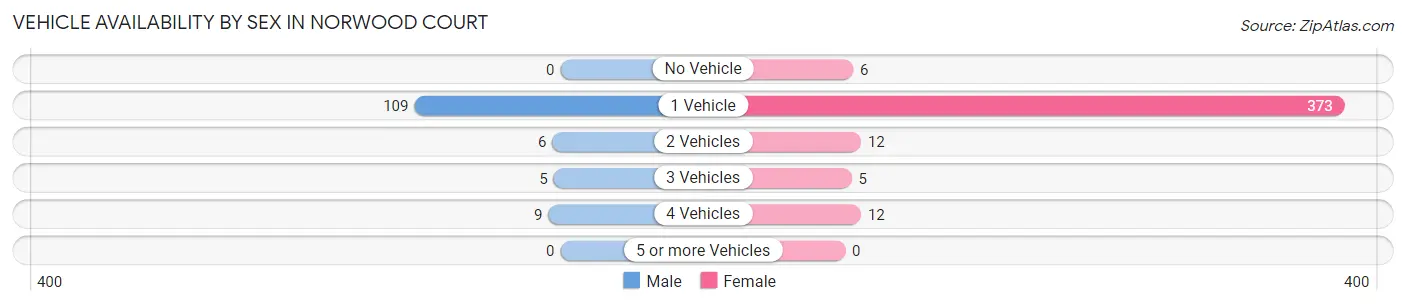
| Vehicles Available | Male | Female |
| No Vehicle | 0 (0.0%) | 6 (1.5%) |
| 1 Vehicle | 109 (84.5%) | 373 (91.4%) |
| 2 Vehicles | 6 (4.6%) | 12 (2.9%) |
| 3 Vehicles | 5 (3.9%) | 5 (1.2%) |
| 4 Vehicles | 9 (7.0%) | 12 (2.9%) |
| 5 or more Vehicles | 0 (0.0%) | 0 (0.0%) |
| Total | 129 (100.0%) | 408 (100.0%) |
Commute Time in Norwood Court
The most frequently occuring commute durations in Norwood Court are 20 to 24 minutes (214 commuters, 40.7%), 15 to 19 minutes (108 commuters, 20.5%), and 10 to 14 minutes (63 commuters, 12.0%).
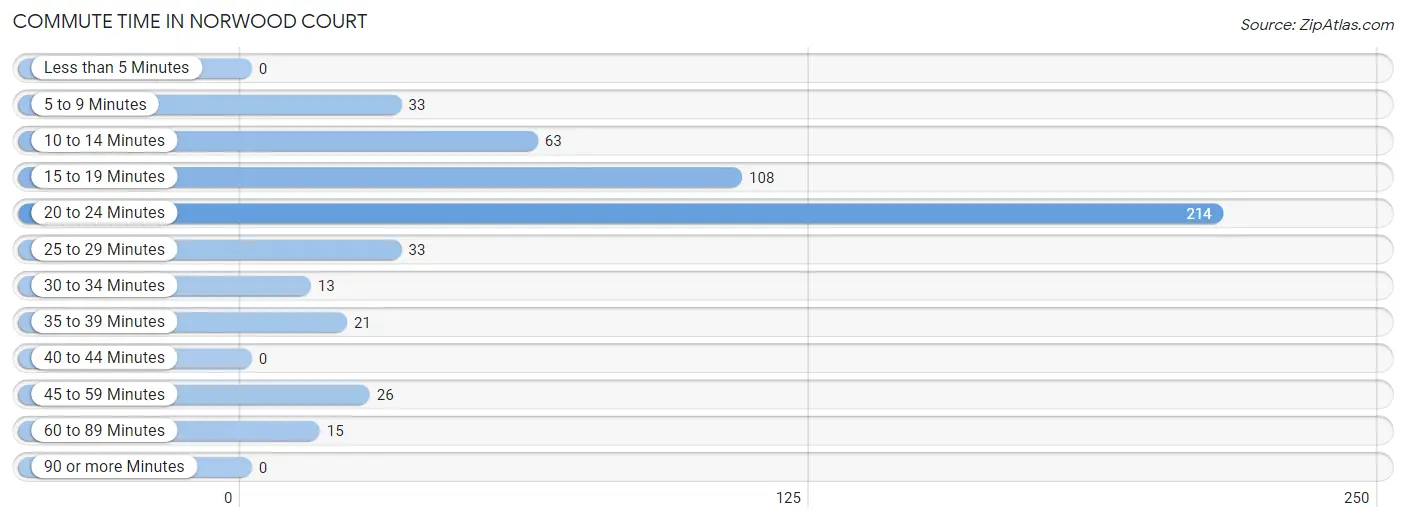
| Commute Time | # Commuters | % Commuters |
| Less than 5 Minutes | 0 | 0.0% |
| 5 to 9 Minutes | 33 | 6.3% |
| 10 to 14 Minutes | 63 | 12.0% |
| 15 to 19 Minutes | 108 | 20.5% |
| 20 to 24 Minutes | 214 | 40.7% |
| 25 to 29 Minutes | 33 | 6.3% |
| 30 to 34 Minutes | 13 | 2.5% |
| 35 to 39 Minutes | 21 | 4.0% |
| 40 to 44 Minutes | 0 | 0.0% |
| 45 to 59 Minutes | 26 | 4.9% |
| 60 to 89 Minutes | 15 | 2.9% |
| 90 or more Minutes | 0 | 0.0% |
Commute Time by Sex in Norwood Court
The most common commute times in Norwood Court are 10 to 14 minutes (30 commuters, 23.3%) for males and 20 to 24 minutes (186 commuters, 46.9%) for females.
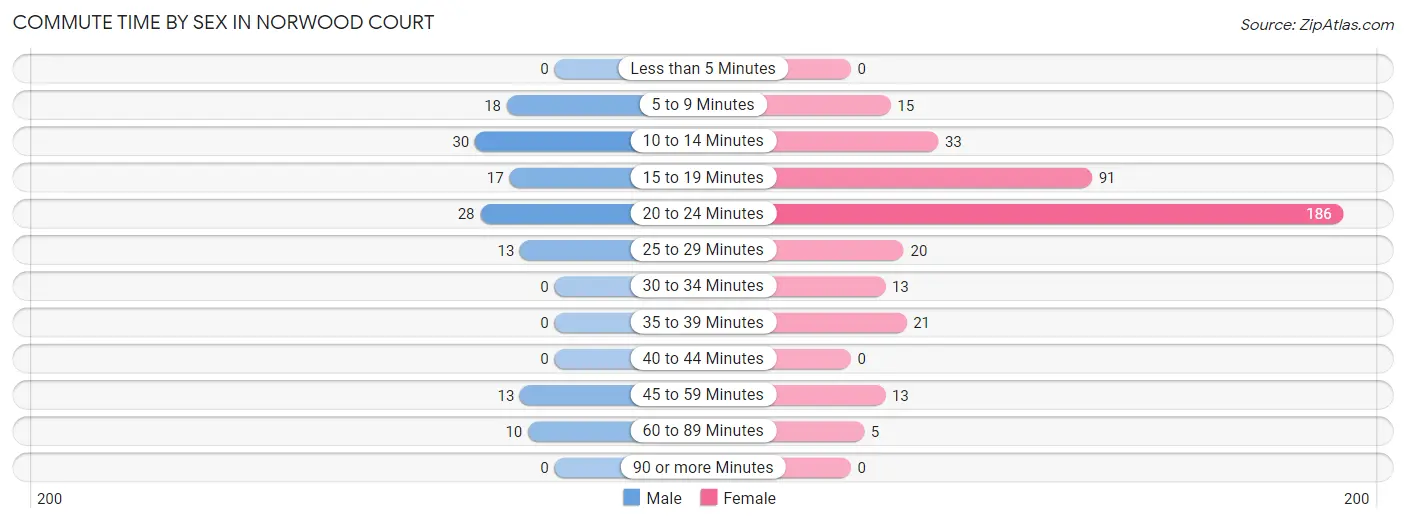
| Commute Time | Male | Female |
| Less than 5 Minutes | 0 (0.0%) | 0 (0.0%) |
| 5 to 9 Minutes | 18 (14.0%) | 15 (3.8%) |
| 10 to 14 Minutes | 30 (23.3%) | 33 (8.3%) |
| 15 to 19 Minutes | 17 (13.2%) | 91 (22.9%) |
| 20 to 24 Minutes | 28 (21.7%) | 186 (46.9%) |
| 25 to 29 Minutes | 13 (10.1%) | 20 (5.0%) |
| 30 to 34 Minutes | 0 (0.0%) | 13 (3.3%) |
| 35 to 39 Minutes | 0 (0.0%) | 21 (5.3%) |
| 40 to 44 Minutes | 0 (0.0%) | 0 (0.0%) |
| 45 to 59 Minutes | 13 (10.1%) | 13 (3.3%) |
| 60 to 89 Minutes | 10 (7.7%) | 5 (1.3%) |
| 90 or more Minutes | 0 (0.0%) | 0 (0.0%) |
Time of Departure to Work by Sex in Norwood Court
The most frequent times of departure to work in Norwood Court are 7:30 AM to 7:59 AM (33, 25.6%) for males and 8:00 AM to 8:29 AM (181, 45.6%) for females.
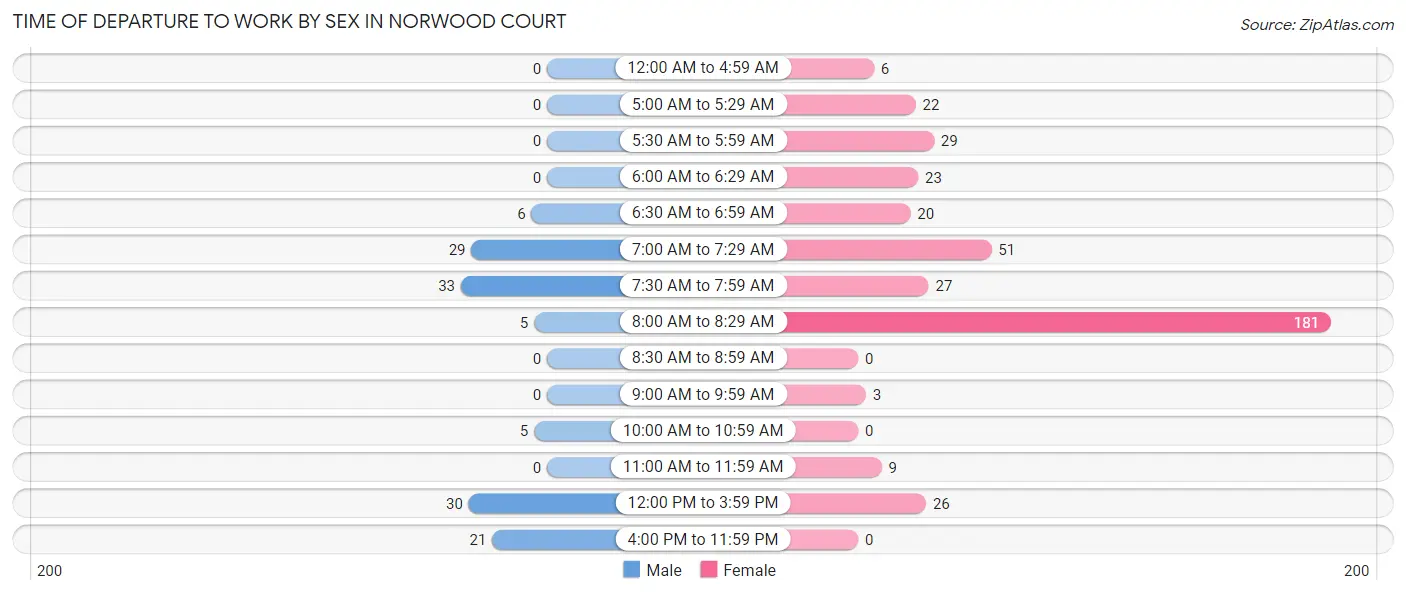
| Time of Departure | Male | Female |
| 12:00 AM to 4:59 AM | 0 (0.0%) | 6 (1.5%) |
| 5:00 AM to 5:29 AM | 0 (0.0%) | 22 (5.5%) |
| 5:30 AM to 5:59 AM | 0 (0.0%) | 29 (7.3%) |
| 6:00 AM to 6:29 AM | 0 (0.0%) | 23 (5.8%) |
| 6:30 AM to 6:59 AM | 6 (4.6%) | 20 (5.0%) |
| 7:00 AM to 7:29 AM | 29 (22.5%) | 51 (12.9%) |
| 7:30 AM to 7:59 AM | 33 (25.6%) | 27 (6.8%) |
| 8:00 AM to 8:29 AM | 5 (3.9%) | 181 (45.6%) |
| 8:30 AM to 8:59 AM | 0 (0.0%) | 0 (0.0%) |
| 9:00 AM to 9:59 AM | 0 (0.0%) | 3 (0.8%) |
| 10:00 AM to 10:59 AM | 5 (3.9%) | 0 (0.0%) |
| 11:00 AM to 11:59 AM | 0 (0.0%) | 9 (2.3%) |
| 12:00 PM to 3:59 PM | 30 (23.3%) | 26 (6.6%) |
| 4:00 PM to 11:59 PM | 21 (16.3%) | 0 (0.0%) |
| Total | 129 (100.0%) | 397 (100.0%) |
Housing Occupancy in Norwood Court
Occupancy by Ownership in Norwood Court
Of the total 602 dwellings in Norwood Court, owner-occupied units account for 69 (11.5%), while renter-occupied units make up 533 (88.5%).
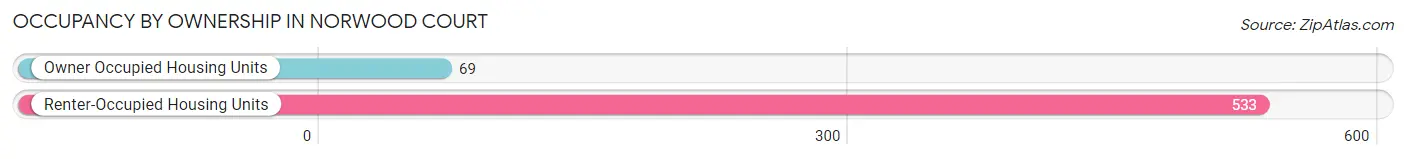
| Occupancy | # Housing Units | % Housing Units |
| Owner Occupied Housing Units | 69 | 11.5% |
| Renter-Occupied Housing Units | 533 | 88.5% |
| Total Occupied Housing Units | 602 | 100.0% |
Occupancy by Household Size in Norwood Court
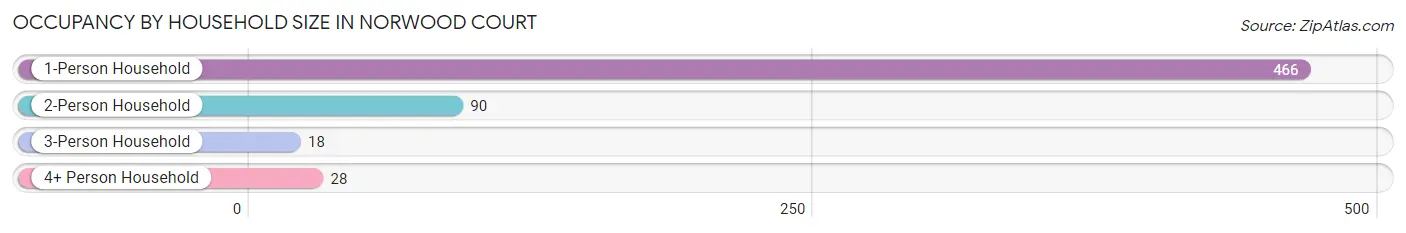
| Household Size | # Housing Units | % Housing Units |
| 1-Person Household | 466 | 77.4% |
| 2-Person Household | 90 | 14.9% |
| 3-Person Household | 18 | 3.0% |
| 4+ Person Household | 28 | 4.6% |
| Total Housing Units | 602 | 100.0% |
Occupancy by Ownership by Household Size in Norwood Court
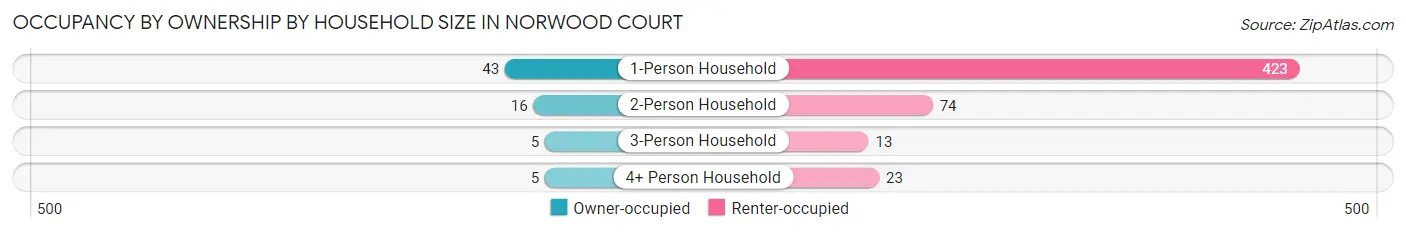
| Household Size | Owner-occupied | Renter-occupied |
| 1-Person Household | 43 (9.2%) | 423 (90.8%) |
| 2-Person Household | 16 (17.8%) | 74 (82.2%) |
| 3-Person Household | 5 (27.8%) | 13 (72.2%) |
| 4+ Person Household | 5 (17.9%) | 23 (82.1%) |
| Total Housing Units | 69 (11.5%) | 533 (88.5%) |
Occupancy by Educational Attainment in Norwood Court
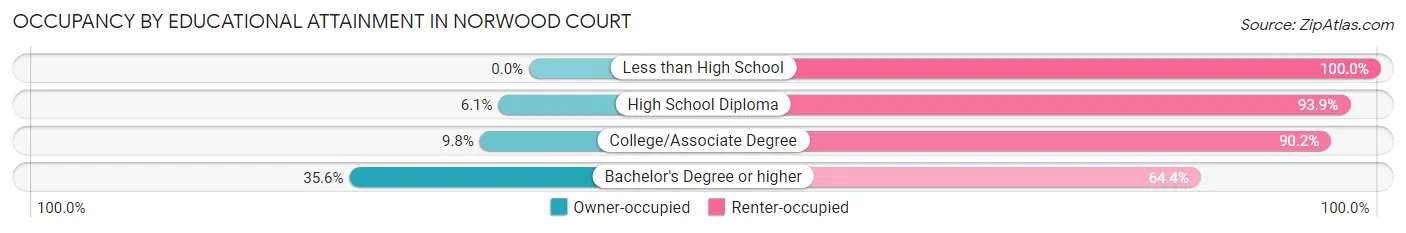
| Household Size | Owner-occupied | Renter-occupied |
| Less than High School | 0 (0.0%) | 8 (100.0%) |
| High School Diploma | 19 (6.1%) | 294 (93.9%) |
| College/Associate Degree | 19 (9.8%) | 175 (90.2%) |
| Bachelor's Degree or higher | 31 (35.6%) | 56 (64.4%) |
Occupancy by Age of Householder in Norwood Court
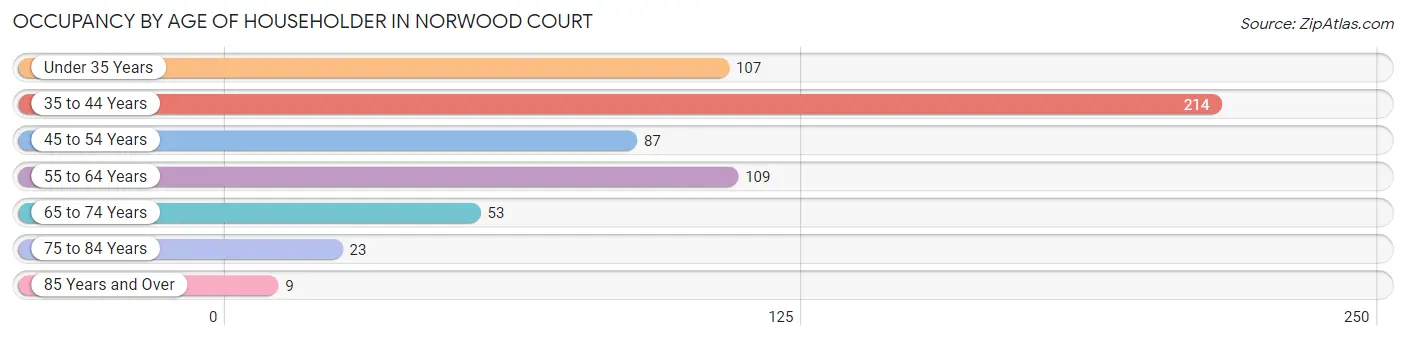
| Age Bracket | # Households | % Households |
| Under 35 Years | 107 | 17.8% |
| 35 to 44 Years | 214 | 35.5% |
| 45 to 54 Years | 87 | 14.4% |
| 55 to 64 Years | 109 | 18.1% |
| 65 to 74 Years | 53 | 8.8% |
| 75 to 84 Years | 23 | 3.8% |
| 85 Years and Over | 9 | 1.5% |
| Total | 602 | 100.0% |
Housing Finances in Norwood Court
Median Income by Occupancy in Norwood Court
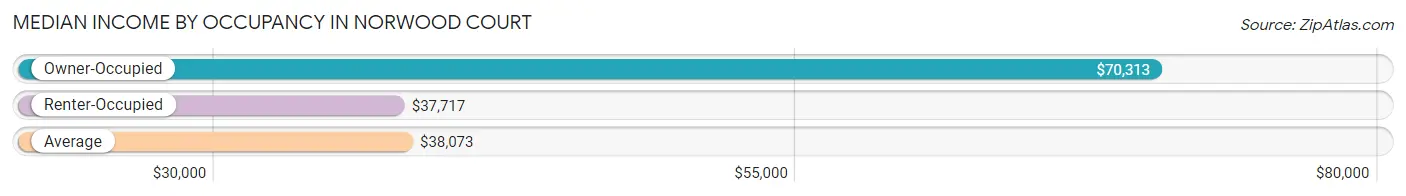
| Occupancy Type | # Households | Median Income |
| Owner-Occupied | 69 (11.5%) | $70,313 |
| Renter-Occupied | 533 (88.5%) | $37,717 |
| Average | 602 (100.0%) | $38,073 |
Occupancy by Householder Income Bracket in Norwood Court
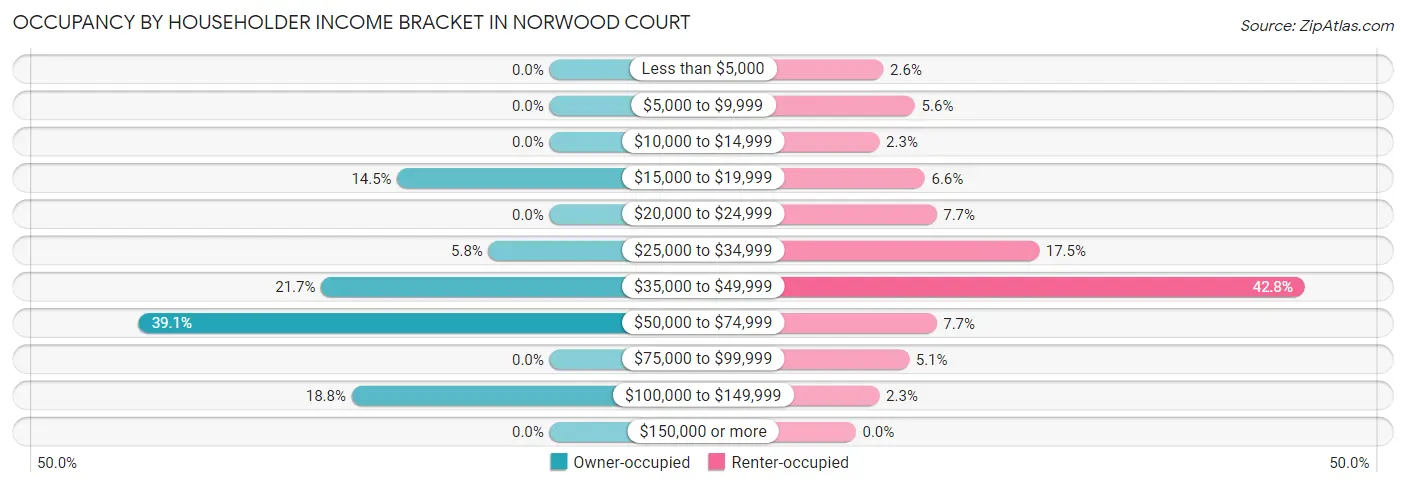
| Income Bracket | Owner-occupied | Renter-occupied |
| Less than $5,000 | 0 (0.0%) | 14 (2.6%) |
| $5,000 to $9,999 | 0 (0.0%) | 30 (5.6%) |
| $10,000 to $14,999 | 0 (0.0%) | 12 (2.2%) |
| $15,000 to $19,999 | 10 (14.5%) | 35 (6.6%) |
| $20,000 to $24,999 | 0 (0.0%) | 41 (7.7%) |
| $25,000 to $34,999 | 4 (5.8%) | 93 (17.4%) |
| $35,000 to $49,999 | 15 (21.7%) | 228 (42.8%) |
| $50,000 to $74,999 | 27 (39.1%) | 41 (7.7%) |
| $75,000 to $99,999 | 0 (0.0%) | 27 (5.1%) |
| $100,000 to $149,999 | 13 (18.8%) | 12 (2.2%) |
| $150,000 or more | 0 (0.0%) | 0 (0.0%) |
| Total | 69 (100.0%) | 533 (100.0%) |
Monthly Housing Cost Tiers in Norwood Court
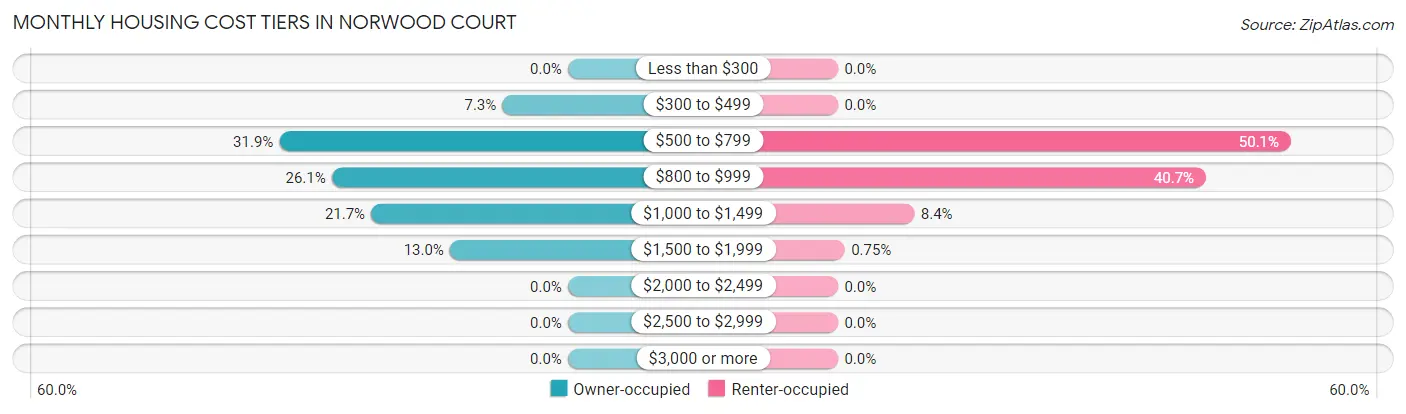
| Monthly Cost | Owner-occupied | Renter-occupied |
| Less than $300 | 0 (0.0%) | 0 (0.0%) |
| $300 to $499 | 5 (7.2%) | 0 (0.0%) |
| $500 to $799 | 22 (31.9%) | 267 (50.1%) |
| $800 to $999 | 18 (26.1%) | 217 (40.7%) |
| $1,000 to $1,499 | 15 (21.7%) | 45 (8.4%) |
| $1,500 to $1,999 | 9 (13.0%) | 4 (0.7%) |
| $2,000 to $2,499 | 0 (0.0%) | 0 (0.0%) |
| $2,500 to $2,999 | 0 (0.0%) | 0 (0.0%) |
| $3,000 or more | 0 (0.0%) | 0 (0.0%) |
| Total | 69 (100.0%) | 533 (100.0%) |
Physical Housing Characteristics in Norwood Court
Housing Structures in Norwood Court
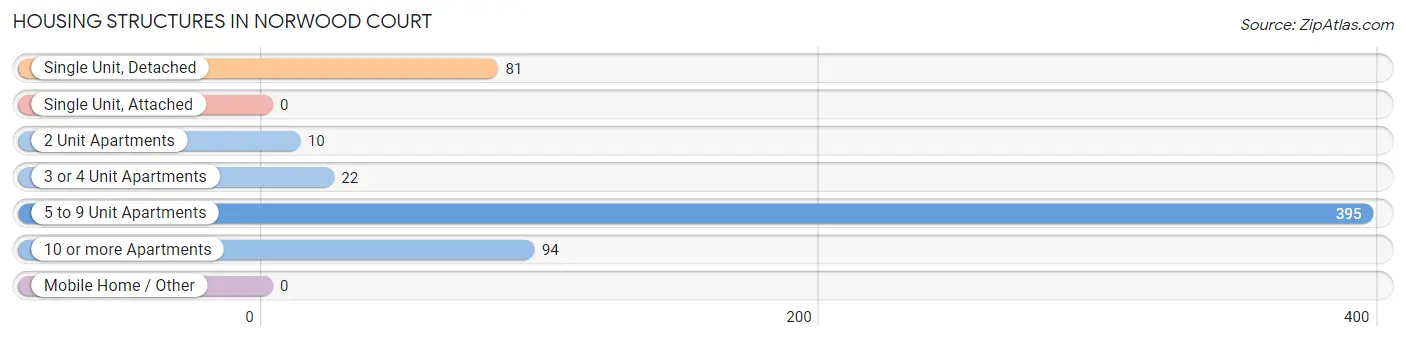
| Structure Type | # Housing Units | % Housing Units |
| Single Unit, Detached | 81 | 13.5% |
| Single Unit, Attached | 0 | 0.0% |
| 2 Unit Apartments | 10 | 1.7% |
| 3 or 4 Unit Apartments | 22 | 3.6% |
| 5 to 9 Unit Apartments | 395 | 65.6% |
| 10 or more Apartments | 94 | 15.6% |
| Mobile Home / Other | 0 | 0.0% |
| Total | 602 | 100.0% |
Housing Structures by Occupancy in Norwood Court
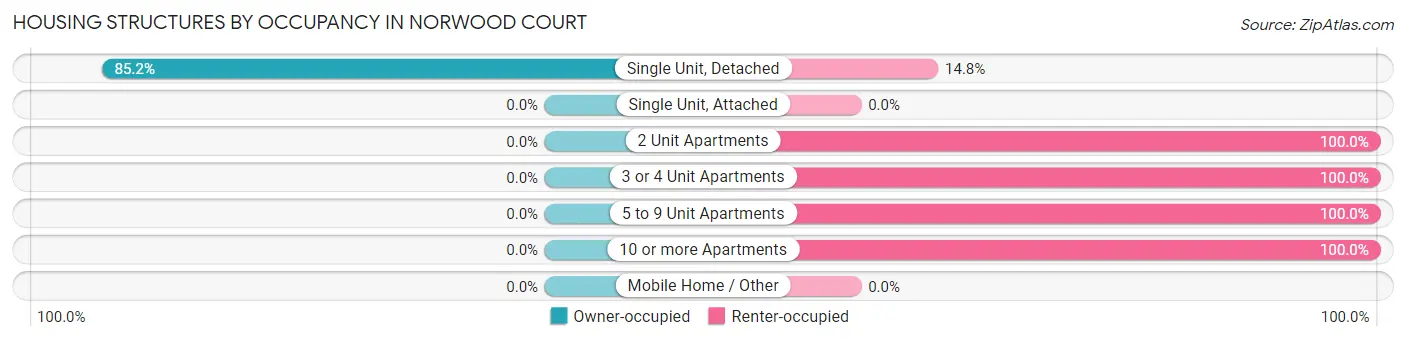
| Structure Type | Owner-occupied | Renter-occupied |
| Single Unit, Detached | 69 (85.2%) | 12 (14.8%) |
| Single Unit, Attached | 0 (0.0%) | 0 (0.0%) |
| 2 Unit Apartments | 0 (0.0%) | 10 (100.0%) |
| 3 or 4 Unit Apartments | 0 (0.0%) | 22 (100.0%) |
| 5 to 9 Unit Apartments | 0 (0.0%) | 395 (100.0%) |
| 10 or more Apartments | 0 (0.0%) | 94 (100.0%) |
| Mobile Home / Other | 0 (0.0%) | 0 (0.0%) |
| Total | 69 (11.5%) | 533 (88.5%) |
Housing Structures by Number of Rooms in Norwood Court
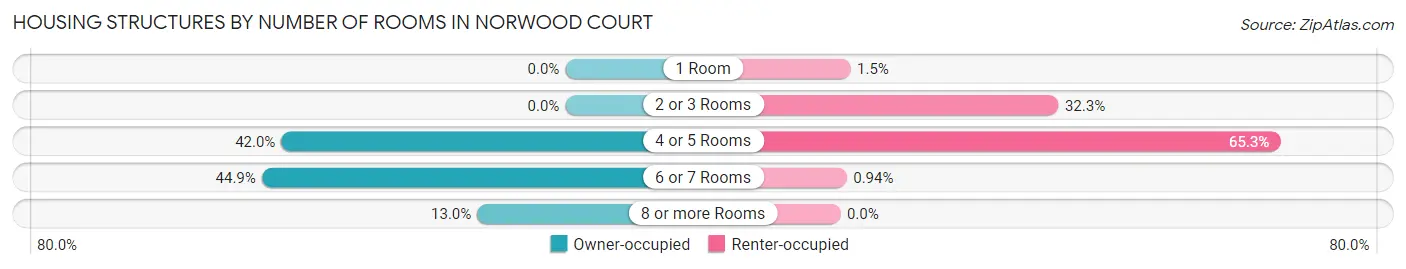
| Number of Rooms | Owner-occupied | Renter-occupied |
| 1 Room | 0 (0.0%) | 8 (1.5%) |
| 2 or 3 Rooms | 0 (0.0%) | 172 (32.3%) |
| 4 or 5 Rooms | 29 (42.0%) | 348 (65.3%) |
| 6 or 7 Rooms | 31 (44.9%) | 5 (0.9%) |
| 8 or more Rooms | 9 (13.0%) | 0 (0.0%) |
| Total | 69 (100.0%) | 533 (100.0%) |
Housing Structure by Heating Type in Norwood Court
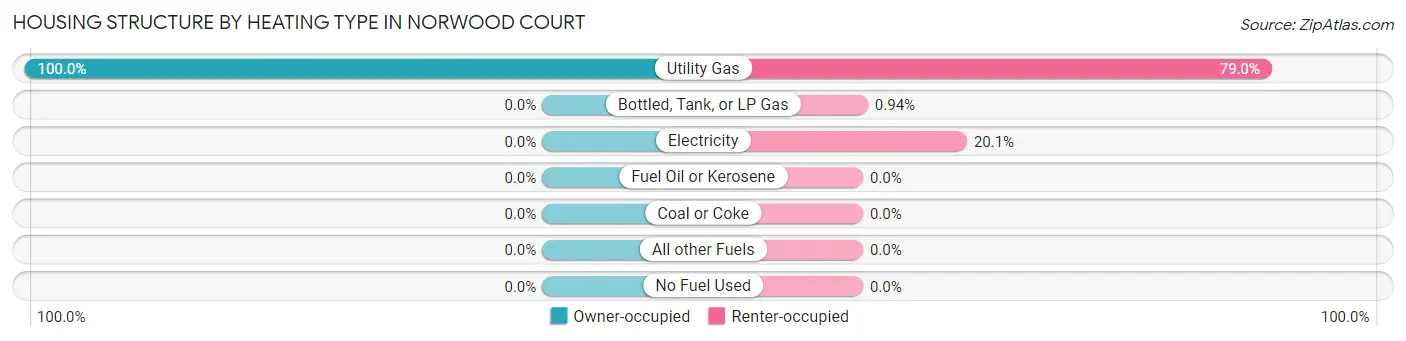
| Heating Type | Owner-occupied | Renter-occupied |
| Utility Gas | 69 (100.0%) | 421 (79.0%) |
| Bottled, Tank, or LP Gas | 0 (0.0%) | 5 (0.9%) |
| Electricity | 0 (0.0%) | 107 (20.1%) |
| Fuel Oil or Kerosene | 0 (0.0%) | 0 (0.0%) |
| Coal or Coke | 0 (0.0%) | 0 (0.0%) |
| All other Fuels | 0 (0.0%) | 0 (0.0%) |
| No Fuel Used | 0 (0.0%) | 0 (0.0%) |
| Total | 69 (100.0%) | 533 (100.0%) |
Household Vehicle Usage in Norwood Court
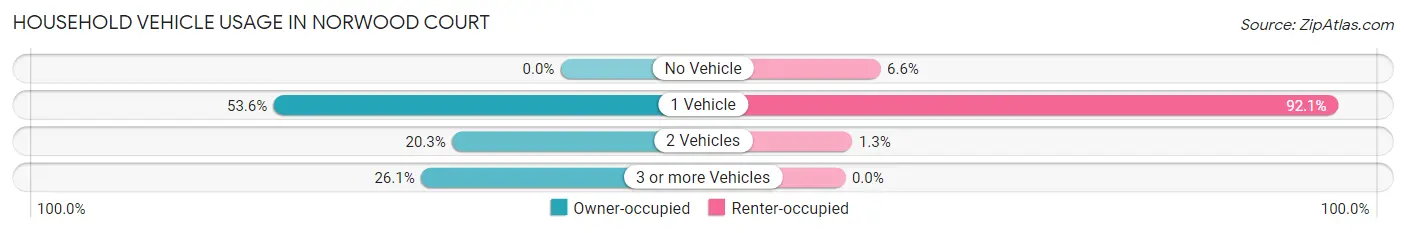
| Vehicles per Household | Owner-occupied | Renter-occupied |
| No Vehicle | 0 (0.0%) | 35 (6.6%) |
| 1 Vehicle | 37 (53.6%) | 491 (92.1%) |
| 2 Vehicles | 14 (20.3%) | 7 (1.3%) |
| 3 or more Vehicles | 18 (26.1%) | 0 (0.0%) |
| Total | 69 (100.0%) | 533 (100.0%) |
Real Estate & Mortgages in Norwood Court
Real Estate and Mortgage Overview in Norwood Court
| Characteristic | Without Mortgage | With Mortgage |
| Housing Units | 5 | 64 |
| Median Property Value | - | - |
| Median Household Income | - | - |
| Monthly Housing Costs | - | - |
| Real Estate Taxes | - | - |
Property Value by Mortgage Status in Norwood Court
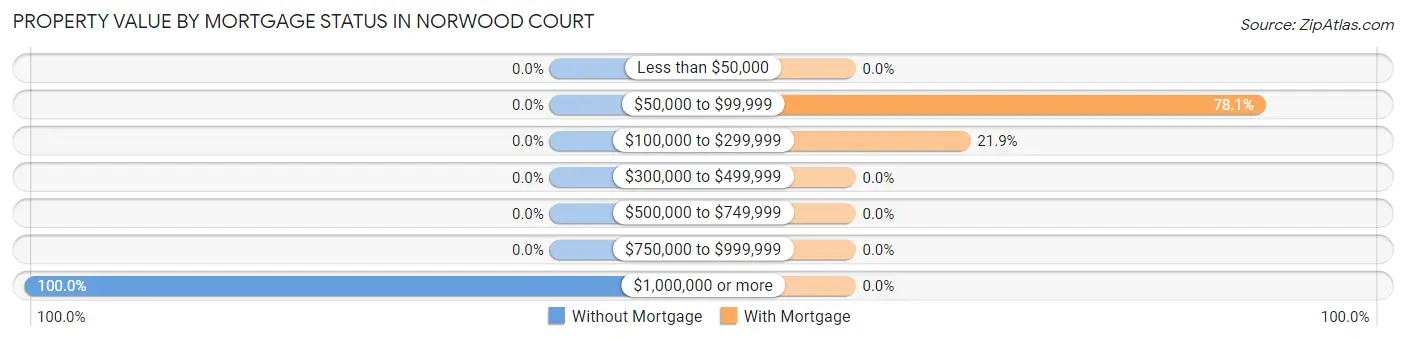
| Property Value | Without Mortgage | With Mortgage |
| Less than $50,000 | 0 (0.0%) | 0 (0.0%) |
| $50,000 to $99,999 | 0 (0.0%) | 50 (78.1%) |
| $100,000 to $299,999 | 0 (0.0%) | 14 (21.9%) |
| $300,000 to $499,999 | 0 (0.0%) | 0 (0.0%) |
| $500,000 to $749,999 | 0 (0.0%) | 0 (0.0%) |
| $750,000 to $999,999 | 0 (0.0%) | 0 (0.0%) |
| $1,000,000 or more | 5 (100.0%) | 0 (0.0%) |
| Total | 5 (100.0%) | 64 (100.0%) |
Household Income by Mortgage Status in Norwood Court
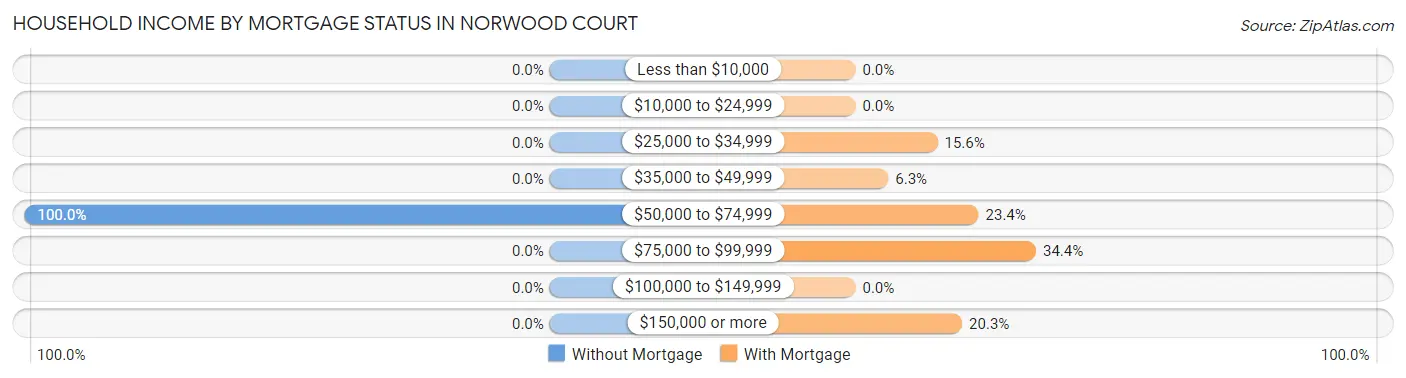
| Household Income | Without Mortgage | With Mortgage |
| Less than $10,000 | 0 (0.0%) | 0 (0.0%) |
| $10,000 to $24,999 | 0 (0.0%) | 0 (0.0%) |
| $25,000 to $34,999 | 0 (0.0%) | 10 (15.6%) |
| $35,000 to $49,999 | 0 (0.0%) | 4 (6.2%) |
| $50,000 to $74,999 | 5 (100.0%) | 15 (23.4%) |
| $75,000 to $99,999 | 0 (0.0%) | 22 (34.4%) |
| $100,000 to $149,999 | 0 (0.0%) | 0 (0.0%) |
| $150,000 or more | 0 (0.0%) | 13 (20.3%) |
| Total | 5 (100.0%) | 64 (100.0%) |
Property Value to Household Income Ratio in Norwood Court
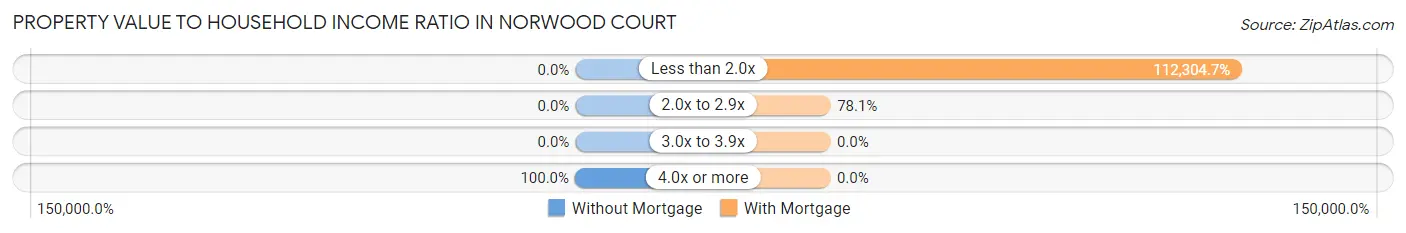
| Value-to-Income Ratio | Without Mortgage | With Mortgage |
| Less than 2.0x | 0 (0.0%) | 71,875 (112,304.7%) |
| 2.0x to 2.9x | 0 (0.0%) | 50 (78.1%) |
| 3.0x to 3.9x | 0 (0.0%) | 0 (0.0%) |
| 4.0x or more | 5 (100.0%) | 0 (0.0%) |
| Total | 5 (100.0%) | 64 (100.0%) |
Real Estate Taxes by Mortgage Status in Norwood Court
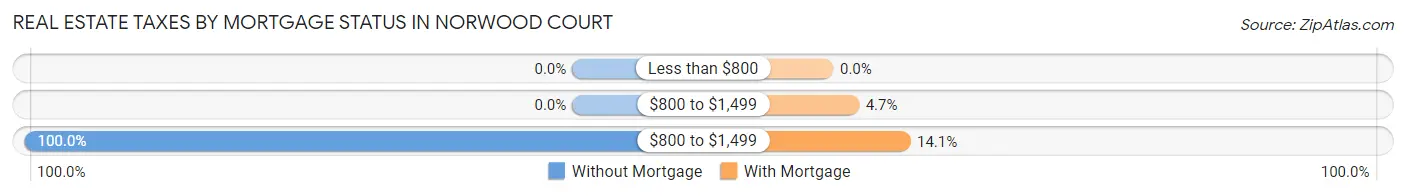
| Property Taxes | Without Mortgage | With Mortgage |
| Less than $800 | 0 (0.0%) | 0 (0.0%) |
| $800 to $1,499 | 0 (0.0%) | 3 (4.7%) |
| $800 to $1,499 | 5 (100.0%) | 9 (14.1%) |
| Total | 5 (100.0%) | 64 (100.0%) |
Health & Disability in Norwood Court
Health Insurance Coverage by Age in Norwood Court
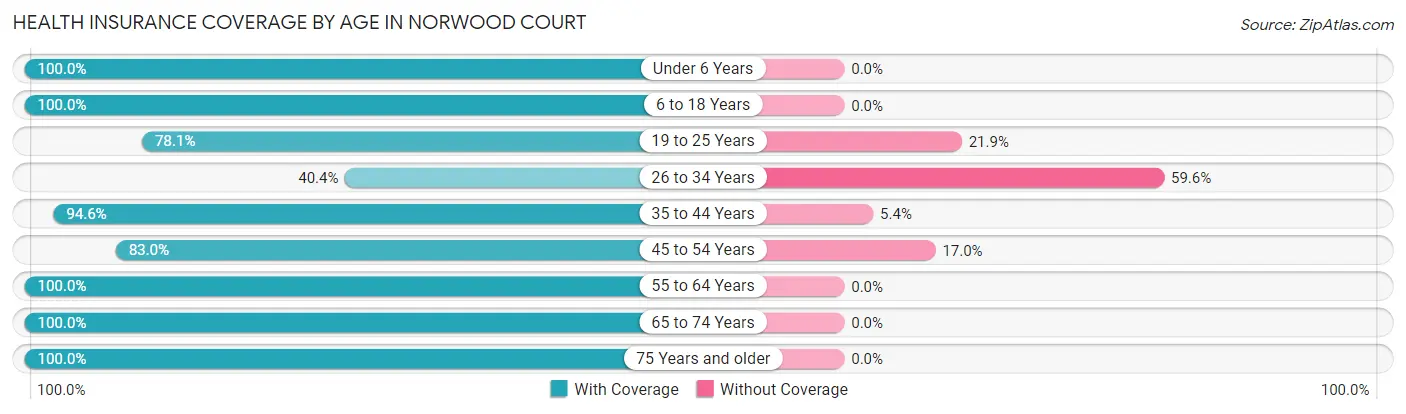
| Age Bracket | With Coverage | Without Coverage |
| Under 6 Years | 58 (100.0%) | 0 (0.0%) |
| 6 to 18 Years | 66 (100.0%) | 0 (0.0%) |
| 19 to 25 Years | 82 (78.1%) | 23 (21.9%) |
| 26 to 34 Years | 21 (40.4%) | 31 (59.6%) |
| 35 to 44 Years | 211 (94.6%) | 12 (5.4%) |
| 45 to 54 Years | 83 (83.0%) | 17 (17.0%) |
| 55 to 64 Years | 122 (100.0%) | 0 (0.0%) |
| 65 to 74 Years | 64 (100.0%) | 0 (0.0%) |
| 75 Years and older | 40 (100.0%) | 0 (0.0%) |
| Total | 747 (90.0%) | 83 (10.0%) |
Health Insurance Coverage by Citizenship Status in Norwood Court
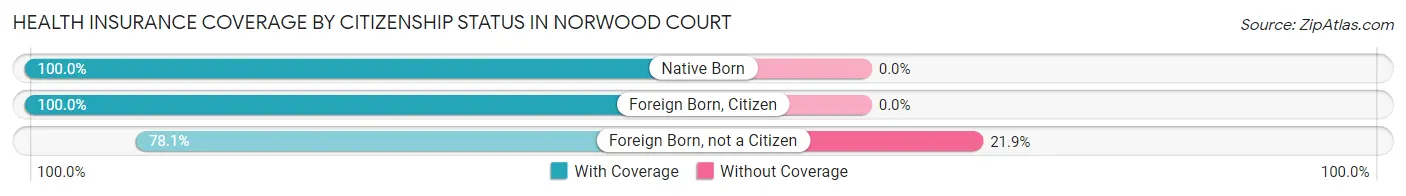
| Citizenship Status | With Coverage | Without Coverage |
| Native Born | 58 (100.0%) | 0 (0.0%) |
| Foreign Born, Citizen | 66 (100.0%) | 0 (0.0%) |
| Foreign Born, not a Citizen | 82 (78.1%) | 23 (21.9%) |
Health Insurance Coverage by Household Income in Norwood Court
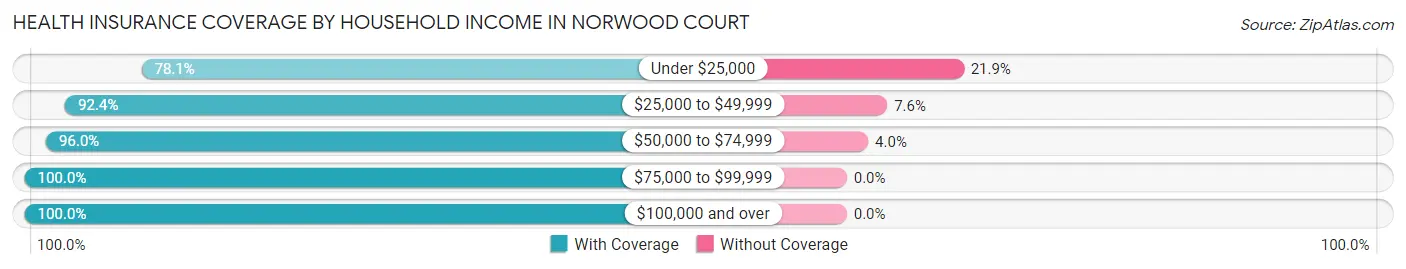
| Household Income | With Coverage | Without Coverage |
| Under $25,000 | 164 (78.1%) | 46 (21.9%) |
| $25,000 to $49,999 | 391 (92.4%) | 32 (7.6%) |
| $50,000 to $74,999 | 120 (96.0%) | 5 (4.0%) |
| $75,000 to $99,999 | 27 (100.0%) | 0 (0.0%) |
| $100,000 and over | 45 (100.0%) | 0 (0.0%) |
Public vs Private Health Insurance Coverage by Age in Norwood Court
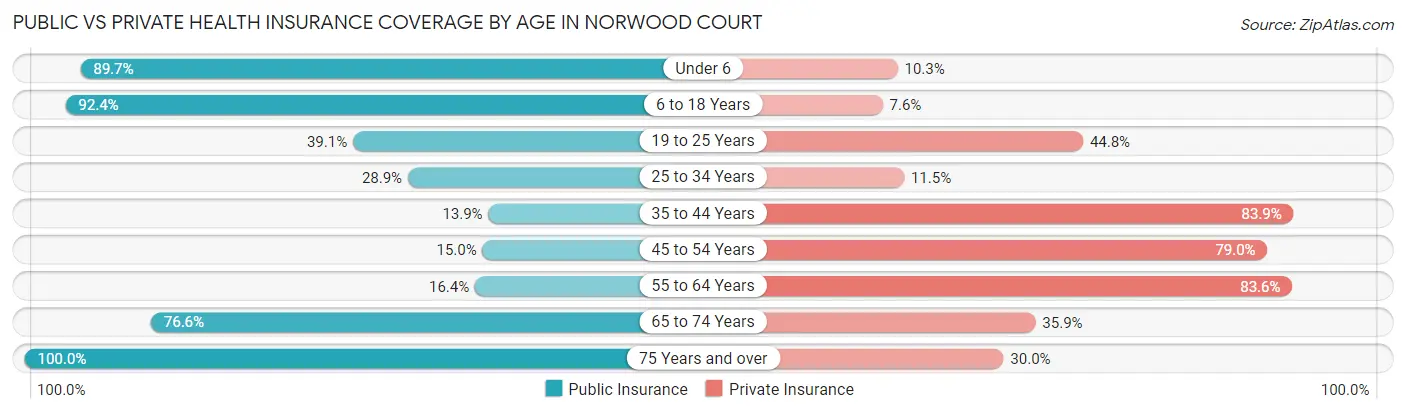
| Age Bracket | Public Insurance | Private Insurance |
| Under 6 | 52 (89.7%) | 6 (10.3%) |
| 6 to 18 Years | 61 (92.4%) | 5 (7.6%) |
| 19 to 25 Years | 41 (39.1%) | 47 (44.8%) |
| 25 to 34 Years | 15 (28.8%) | 6 (11.5%) |
| 35 to 44 Years | 31 (13.9%) | 187 (83.9%) |
| 45 to 54 Years | 15 (15.0%) | 79 (79.0%) |
| 55 to 64 Years | 20 (16.4%) | 102 (83.6%) |
| 65 to 74 Years | 49 (76.6%) | 23 (35.9%) |
| 75 Years and over | 40 (100.0%) | 12 (30.0%) |
| Total | 324 (39.0%) | 467 (56.3%) |
Disability Status by Sex by Age in Norwood Court
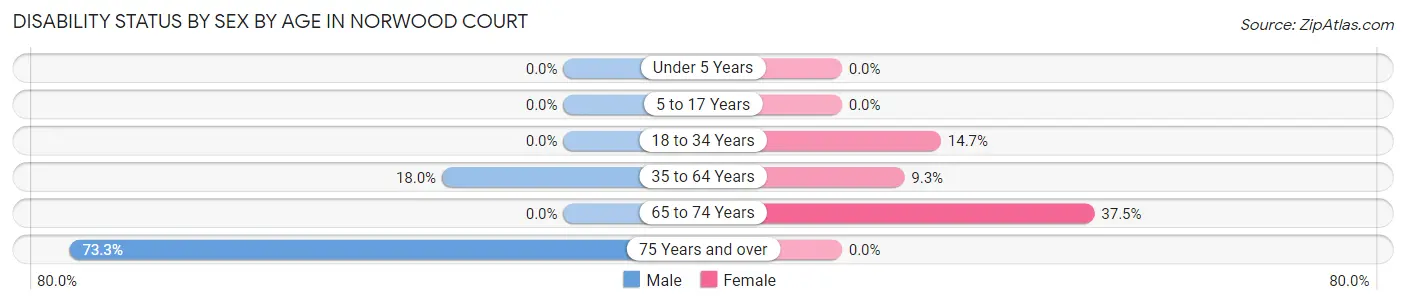
| Age Bracket | Male | Female |
| Under 5 Years | 0 (0.0%) | 0 (0.0%) |
| 5 to 17 Years | 0 (0.0%) | 0 (0.0%) |
| 18 to 34 Years | 0 (0.0%) | 20 (14.7%) |
| 35 to 64 Years | 22 (18.0%) | 30 (9.3%) |
| 65 to 74 Years | 0 (0.0%) | 9 (37.5%) |
| 75 Years and over | 11 (73.3%) | 0 (0.0%) |
Disability Class by Sex by Age in Norwood Court
Disability Class: Hearing Difficulty
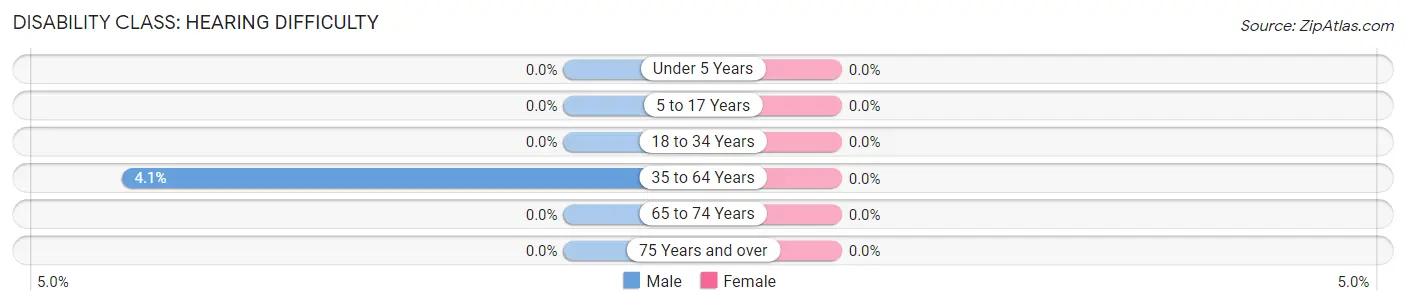
| Age Bracket | Male | Female |
| Under 5 Years | 0 (0.0%) | 0 (0.0%) |
| 5 to 17 Years | 0 (0.0%) | 0 (0.0%) |
| 18 to 34 Years | 0 (0.0%) | 0 (0.0%) |
| 35 to 64 Years | 5 (4.1%) | 0 (0.0%) |
| 65 to 74 Years | 0 (0.0%) | 0 (0.0%) |
| 75 Years and over | 0 (0.0%) | 0 (0.0%) |
Disability Class: Vision Difficulty
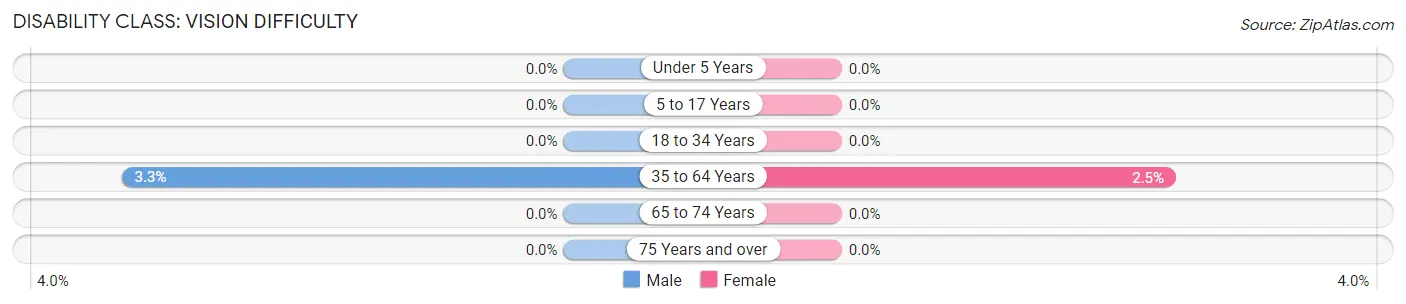
| Age Bracket | Male | Female |
| Under 5 Years | 0 (0.0%) | 0 (0.0%) |
| 5 to 17 Years | 0 (0.0%) | 0 (0.0%) |
| 18 to 34 Years | 0 (0.0%) | 0 (0.0%) |
| 35 to 64 Years | 4 (3.3%) | 8 (2.5%) |
| 65 to 74 Years | 0 (0.0%) | 0 (0.0%) |
| 75 Years and over | 0 (0.0%) | 0 (0.0%) |
Disability Class: Cognitive Difficulty
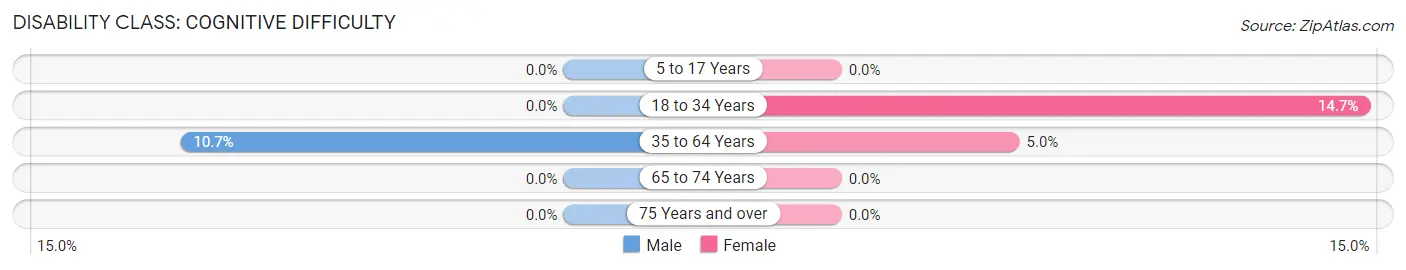
| Age Bracket | Male | Female |
| 5 to 17 Years | 0 (0.0%) | 0 (0.0%) |
| 18 to 34 Years | 0 (0.0%) | 20 (14.7%) |
| 35 to 64 Years | 13 (10.7%) | 16 (5.0%) |
| 65 to 74 Years | 0 (0.0%) | 0 (0.0%) |
| 75 Years and over | 0 (0.0%) | 0 (0.0%) |
Disability Class: Ambulatory Difficulty
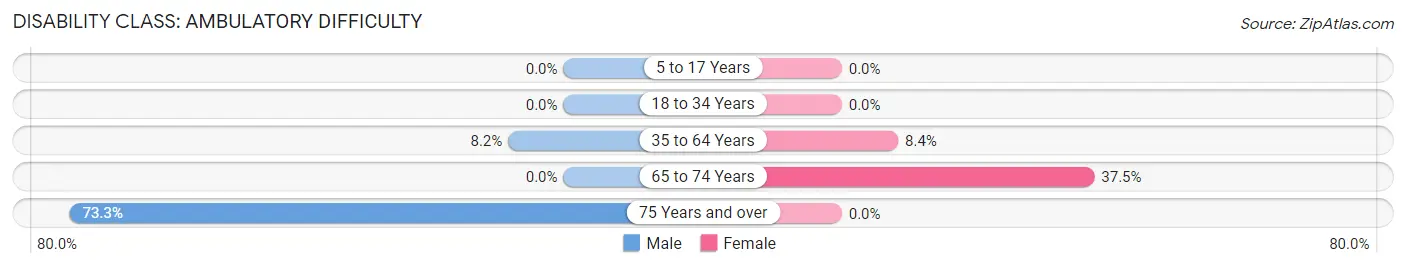
| Age Bracket | Male | Female |
| 5 to 17 Years | 0 (0.0%) | 0 (0.0%) |
| 18 to 34 Years | 0 (0.0%) | 0 (0.0%) |
| 35 to 64 Years | 10 (8.2%) | 27 (8.4%) |
| 65 to 74 Years | 0 (0.0%) | 9 (37.5%) |
| 75 Years and over | 11 (73.3%) | 0 (0.0%) |
Disability Class: Self-Care Difficulty
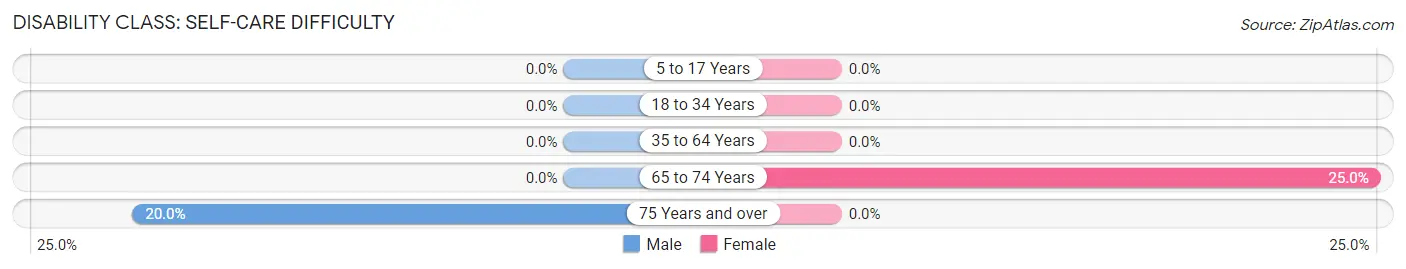
| Age Bracket | Male | Female |
| 5 to 17 Years | 0 (0.0%) | 0 (0.0%) |
| 18 to 34 Years | 0 (0.0%) | 0 (0.0%) |
| 35 to 64 Years | 0 (0.0%) | 0 (0.0%) |
| 65 to 74 Years | 0 (0.0%) | 6 (25.0%) |
| 75 Years and over | 3 (20.0%) | 0 (0.0%) |
Technology Access in Norwood Court
Computing Device Access in Norwood Court
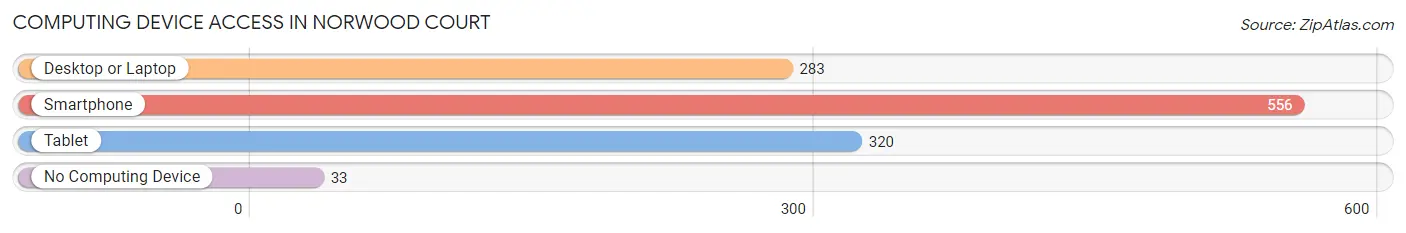
| Device Type | # Households | % Households |
| Desktop or Laptop | 283 | 47.0% |
| Smartphone | 556 | 92.4% |
| Tablet | 320 | 53.2% |
| No Computing Device | 33 | 5.5% |
| Total | 602 | 100.0% |
Internet Access in Norwood Court
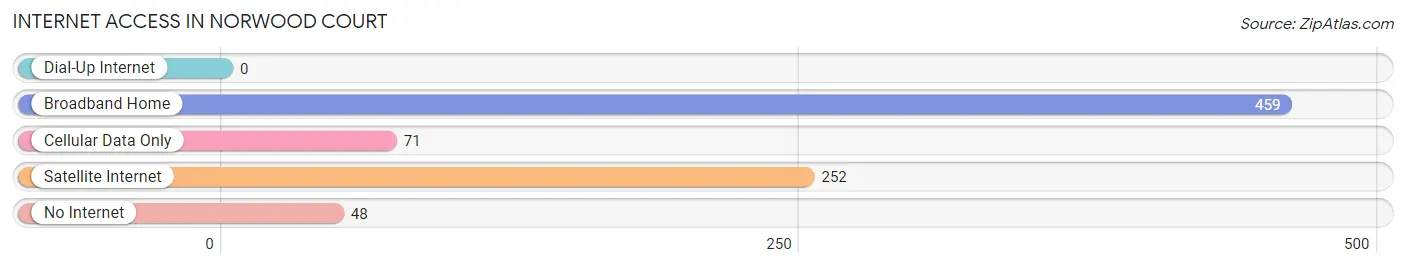
| Internet Type | # Households | % Households |
| Dial-Up Internet | 0 | 0.0% |
| Broadband Home | 459 | 76.2% |
| Cellular Data Only | 71 | 11.8% |
| Satellite Internet | 252 | 41.9% |
| No Internet | 48 | 8.0% |
| Total | 602 | 100.0% |
Norwood Court Summary
Norwood Court is a small, unincorporated community located in St. Louis County, Missouri. It is situated just south of the city of St. Louis, and is bordered by the cities of Jennings, Dellwood, and Ferguson. The community is home to approximately 1,000 people, and is part of the Greater St. Louis metropolitan area.
History
Norwood Court was founded in the early 1900s as a small farming community. The area was originally part of the larger town of Jennings, but was annexed by St. Louis County in the 1950s. The community was named after the Norwood family, who were among the first settlers in the area.
In the late 1960s, Norwood Court began to experience rapid growth as the city of St. Louis expanded outward. The area became a popular destination for African-American families looking for affordable housing. By the 1970s, the community had become a predominantly African-American neighborhood.
Geography
Norwood Court is located in the northern part of St. Louis County, just south of the city of St. Louis. It is bordered by the cities of Jennings, Dellwood, and Ferguson. The community is situated on a flat plain, with an elevation of approximately 500 feet above sea level.
The climate in Norwood Court is typical of the Midwest, with hot, humid summers and cold, snowy winters. The average annual temperature is around 50 degrees Fahrenheit, with an average annual precipitation of around 40 inches.
Economy
The economy of Norwood Court is largely based on the service industry. Many of the residents are employed in the retail, hospitality, and healthcare sectors. There are also a number of small businesses located in the community, including restaurants, convenience stores, and auto repair shops.
The median household income in Norwood Court is around $30,000, which is slightly lower than the national average. The unemployment rate is also higher than the national average, at around 8%.
Demographics
As of the 2010 census, the population of Norwood Court was 1,000. The racial makeup of the community was 95.5% African-American, 2.5% White, 0.5% Asian, and 1.5% other. The median age of the population was 33.
The majority of the population is Christian, with the largest denominations being Baptist and Methodist. The median household income is around $30,000, and the median home value is around $90,000.
Conclusion
Norwood Court is a small, unincorporated community located in St. Louis County, Missouri. It is situated just south of the city of St. Louis, and is bordered by the cities of Jennings, Dellwood, and Ferguson. The community is home to approximately 1,000 people, and is part of the Greater St. Louis metropolitan area. The economy of Norwood Court is largely based on the service industry, and the population is predominantly African-American. The median household income is around $30,000, and the median home value is around $90,000.
Common Questions
What is Per Capita Income in Norwood Court?
Per Capita income in Norwood Court is $29,851.
What is the Median Family Income in Norwood Court?
Median Family Income in Norwood Court is $47,589.
What is the Median Household income in Norwood Court?
Median Household Income in Norwood Court is $38,073.
What is Income or Wage Gap in Norwood Court?
Income or Wage Gap in Norwood Court is 38.4%.
Women in Norwood Court earn 61.6 cents for every dollar earned by a man.
What is Inequality or Gini Index in Norwood Court?
Inequality or Gini Index in Norwood Court is 0.30.
What is the Total Population of Norwood Court?
Total Population of Norwood Court is 830.
What is the Total Male Population of Norwood Court?
Total Male Population of Norwood Court is 277.
What is the Total Female Population of Norwood Court?
Total Female Population of Norwood Court is 553.
What is the Ratio of Males per 100 Females in Norwood Court?
There are 50.09 Males per 100 Females in Norwood Court.
What is the Ratio of Females per 100 Males in Norwood Court?
There are 199.64 Females per 100 Males in Norwood Court.
What is the Median Population Age in Norwood Court?
Median Population Age in Norwood Court is 35.8 Years.
What is the Average Family Size in Norwood Court
Average Family Size in Norwood Court is 2.8 People.
What is the Average Household Size in Norwood Court
Average Household Size in Norwood Court is 1.4 People.
How Large is the Labor Force in Norwood Court?
There are 588 People in the Labor Forcein in Norwood Court.
What is the Percentage of People in the Labor Force in Norwood Court?
81.8% of People are in the Labor Force in Norwood Court.
What is the Unemployment Rate in Norwood Court?
Unemployment Rate in Norwood Court is 8.7%.