Bel Ridge, MO Map & Demographics
Bel Ridge Map
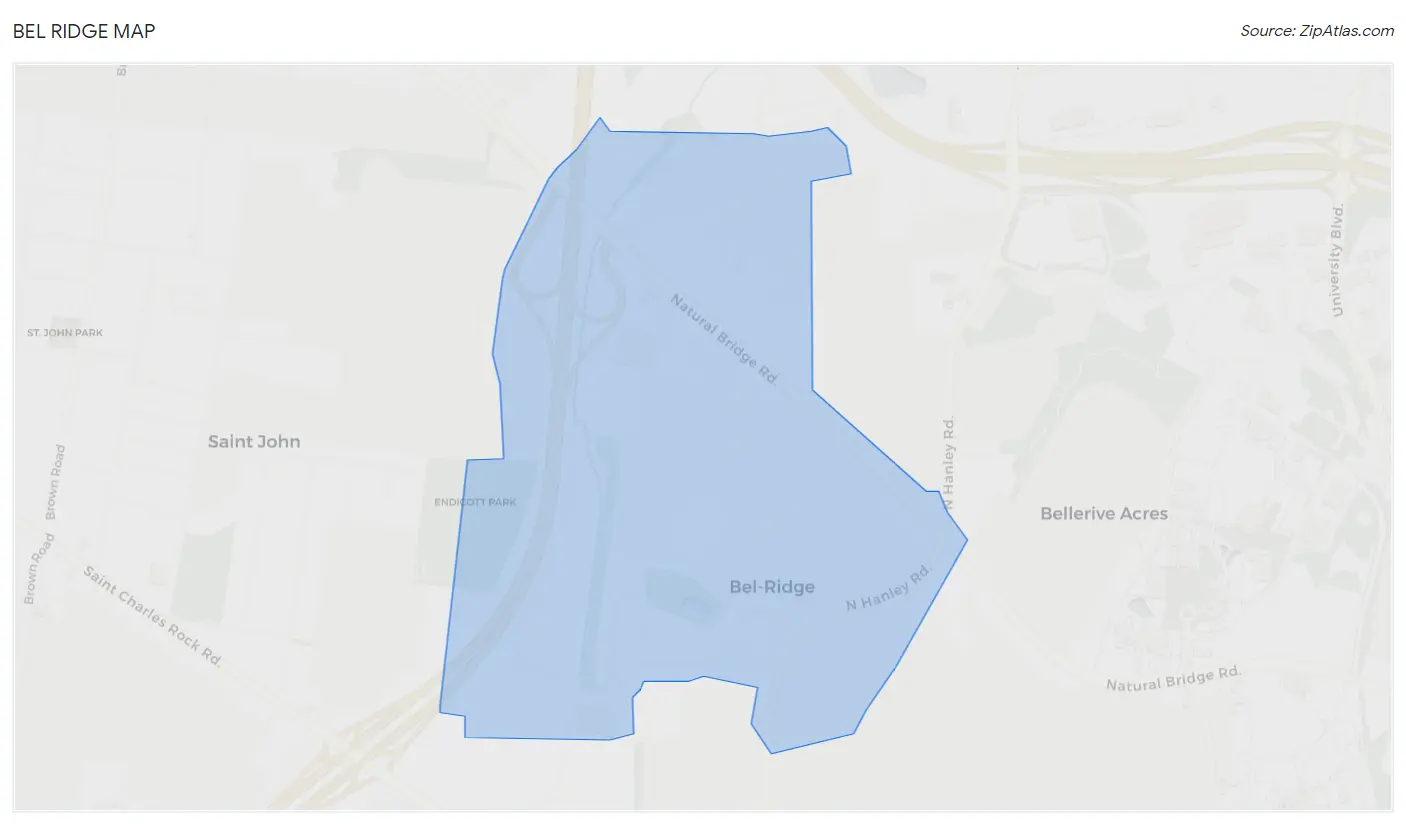
Bel Ridge Overview
$18,608
PER CAPITA INCOME
$43,705
AVG FAMILY INCOME
$38,642
AVG HOUSEHOLD INCOME
14.6%
WAGE / INCOME GAP [ % ]
85.4¢/ $1
WAGE / INCOME GAP [ $ ]
0.40
INEQUALITY / GINI INDEX
2,687
TOTAL POPULATION
1,096
MALE POPULATION
1,591
FEMALE POPULATION
68.89
MALES / 100 FEMALES
145.16
FEMALES / 100 MALES
28.5
MEDIAN AGE
3.6
AVG FAMILY SIZE
2.8
AVG HOUSEHOLD SIZE
1,203
LABOR FORCE [ PEOPLE ]
62.1%
PERCENT IN LABOR FORCE
18.3%
UNEMPLOYMENT RATE
Income in Bel Ridge
Income Overview in Bel Ridge
Per Capita Income in Bel Ridge is $18,608, while median incomes of families and households are $43,705 and $38,642 respectively.
| Characteristic | Number | Measure |
| Per Capita Income | 2,687 | $18,608 |
| Median Family Income | 607 | $43,705 |
| Mean Family Income | 607 | $59,711 |
| Median Household Income | 951 | $38,642 |
| Mean Household Income | 951 | $50,065 |
| Income Deficit | 607 | $0 |
| Wage / Income Gap (%) | 2,687 | 14.59% |
| Wage / Income Gap ($) | 2,687 | 85.41¢ per $1 |
| Gini / Inequality Index | 2,687 | 0.40 |
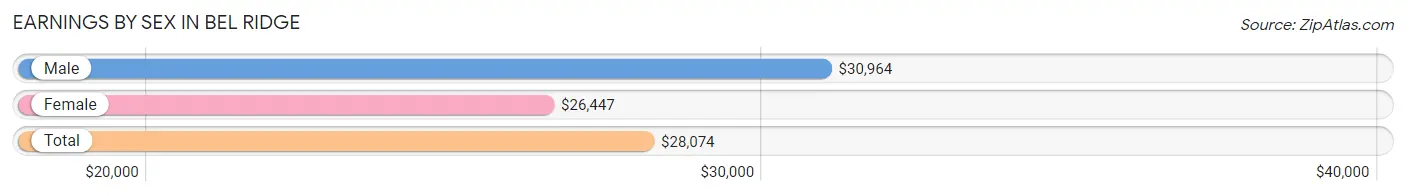
Earnings by Sex in Bel Ridge
Average Earnings in Bel Ridge are $28,074, $30,964 for men and $26,447 for women, a difference of 14.6%.
| Sex | Number | Average Earnings |
| Male | 439 (32.8%) | $30,964 |
| Female | 898 (67.2%) | $26,447 |
| Total | 1,337 (100.0%) | $28,074 |
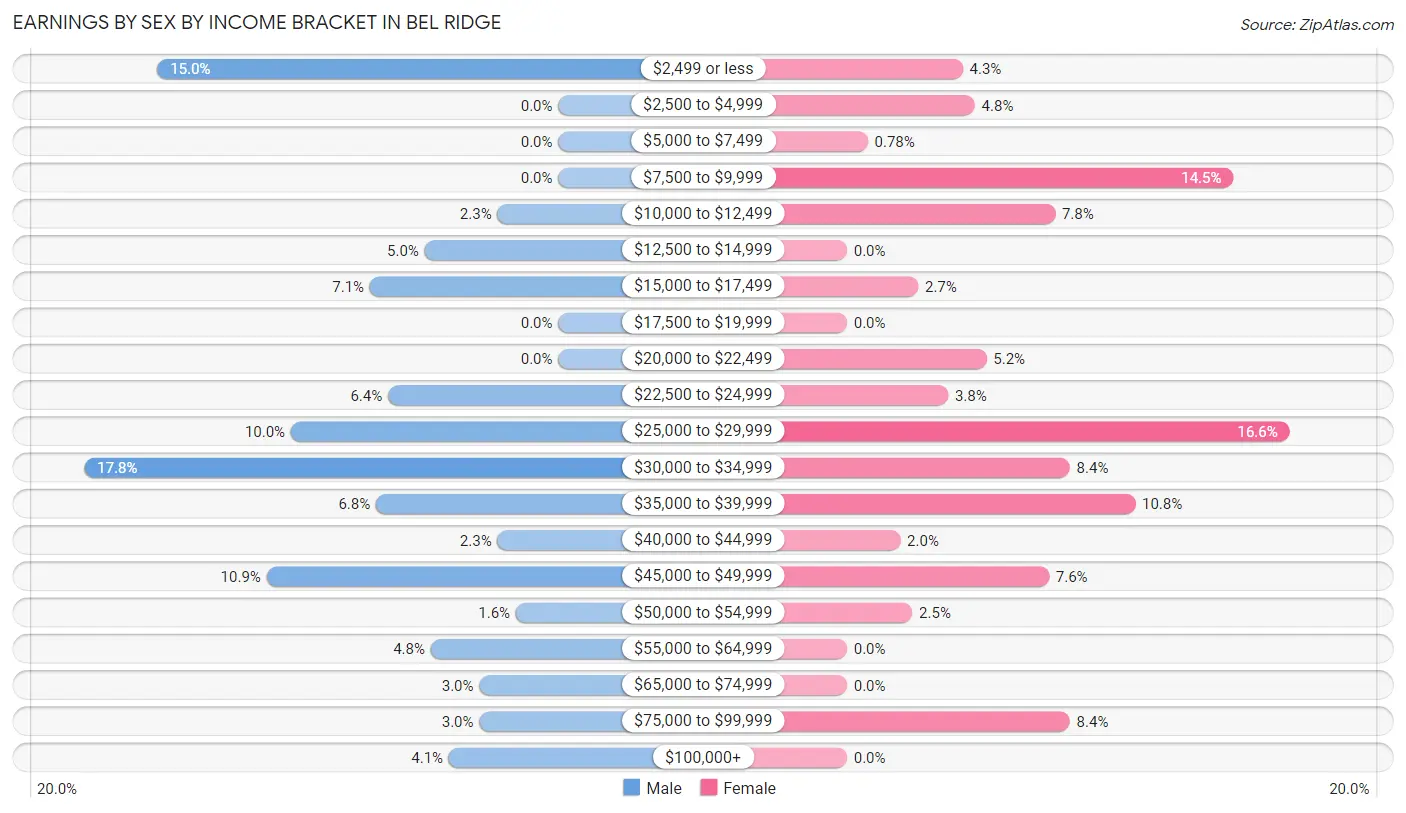
Earnings by Sex by Income Bracket in Bel Ridge
The most common earnings brackets in Bel Ridge are $30,000 to $34,999 for men (78 | 17.8%) and $25,000 to $29,999 for women (149 | 16.6%).
| Income | Male | Female |
| $2,499 or less | 66 (15.0%) | 39 (4.3%) |
| $2,500 to $4,999 | 0 (0.0%) | 43 (4.8%) |
| $5,000 to $7,499 | 0 (0.0%) | 7 (0.8%) |
| $7,500 to $9,999 | 0 (0.0%) | 130 (14.5%) |
| $10,000 to $12,499 | 10 (2.3%) | 70 (7.8%) |
| $12,500 to $14,999 | 22 (5.0%) | 0 (0.0%) |
| $15,000 to $17,499 | 31 (7.1%) | 24 (2.7%) |
| $17,500 to $19,999 | 0 (0.0%) | 0 (0.0%) |
| $20,000 to $22,499 | 0 (0.0%) | 47 (5.2%) |
| $22,500 to $24,999 | 28 (6.4%) | 34 (3.8%) |
| $25,000 to $29,999 | 44 (10.0%) | 149 (16.6%) |
| $30,000 to $34,999 | 78 (17.8%) | 75 (8.4%) |
| $35,000 to $39,999 | 30 (6.8%) | 97 (10.8%) |
| $40,000 to $44,999 | 10 (2.3%) | 18 (2.0%) |
| $45,000 to $49,999 | 48 (10.9%) | 68 (7.6%) |
| $50,000 to $54,999 | 7 (1.6%) | 22 (2.5%) |
| $55,000 to $64,999 | 21 (4.8%) | 0 (0.0%) |
| $65,000 to $74,999 | 13 (3.0%) | 0 (0.0%) |
| $75,000 to $99,999 | 13 (3.0%) | 75 (8.4%) |
| $100,000+ | 18 (4.1%) | 0 (0.0%) |
| Total | 439 (100.0%) | 898 (100.0%) |
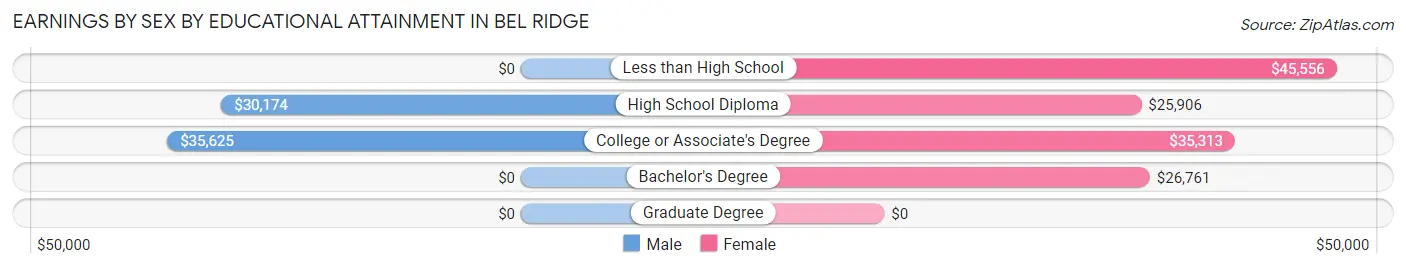
Earnings by Sex by Educational Attainment in Bel Ridge
Average earnings in Bel Ridge are $32,448 for men and $29,318 for women, a difference of 9.7%. Men with an educational attainment of college or associate's degree enjoy the highest average annual earnings of $35,625, while those with high school diploma education earn the least with $30,174. Women with an educational attainment of less than high school earn the most with the average annual earnings of $45,556, while those with high school diploma education have the smallest earnings of $25,906.
| Educational Attainment | Male Income | Female Income |
| Less than High School | - | - |
| High School Diploma | $30,174 | $25,906 |
| College or Associate's Degree | $35,625 | $35,313 |
| Bachelor's Degree | - | - |
| Graduate Degree | - | - |
| Total | $32,448 | $29,318 |
Family Income in Bel Ridge
Family Income Brackets in Bel Ridge
According to the Bel Ridge family income data, there are 250 families falling into the $35,000 to $49,999 income range, which is the most common income bracket and makes up 41.2% of all families.
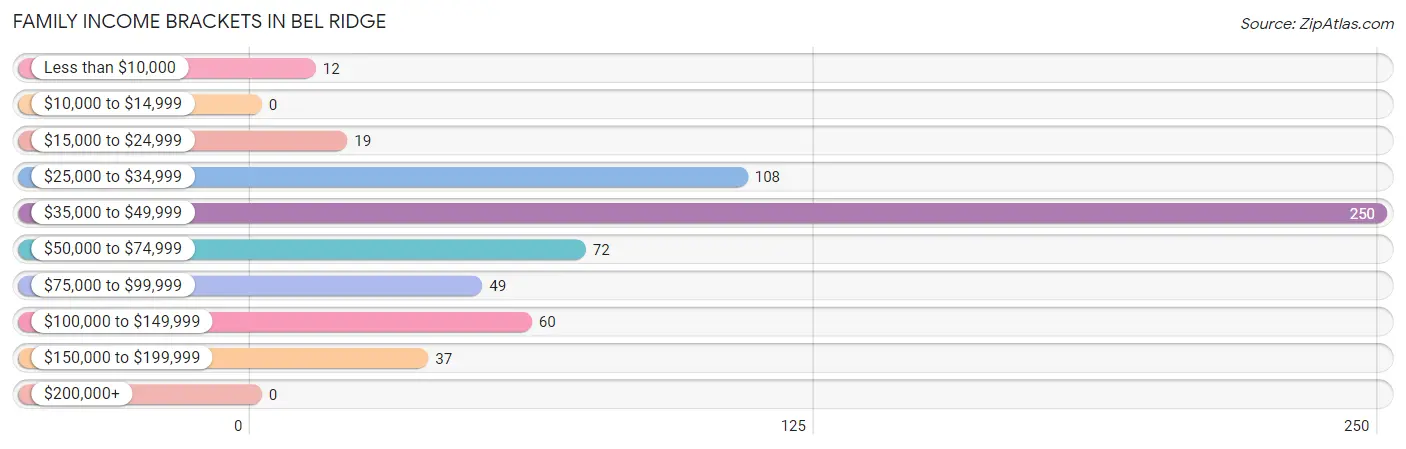
| Income Bracket | # Families | % Families |
| Less than $10,000 | 12 | 2.0% |
| $10,000 to $14,999 | 0 | 0.0% |
| $15,000 to $24,999 | 19 | 3.1% |
| $25,000 to $34,999 | 108 | 17.8% |
| $35,000 to $49,999 | 250 | 41.2% |
| $50,000 to $74,999 | 72 | 11.9% |
| $75,000 to $99,999 | 49 | 8.1% |
| $100,000 to $149,999 | 60 | 9.9% |
| $150,000 to $199,999 | 37 | 6.1% |
| $200,000+ | 0 | 0.0% |
Family Income by Famaliy Size in Bel Ridge
2-person families (322 | 53.0%) account for the highest median family income in Bel Ridge with $39,778 per family, while 2-person families (322 | 53.0%) have the highest median income of $19,889 per family member.

| Income Bracket | # Families | Median Income |
| 2-Person Families | 322 (53.0%) | $39,778 |
| 3-Person Families | 134 (22.1%) | $38,983 |
| 4-Person Families | 57 (9.4%) | $0 |
| 5-Person Families | 33 (5.4%) | $0 |
| 6-Person Families | 9 (1.5%) | $0 |
| 7+ Person Families | 52 (8.6%) | $0 |
| Total | 607 (100.0%) | $43,705 |
Family Income by Number of Earners in Bel Ridge

| Number of Earners | # Families | Median Income |
| No Earners | 26 (4.3%) | $0 |
| 1 Earner | 363 (59.8%) | $38,948 |
| 2 Earners | 160 (26.4%) | $66,500 |
| 3+ Earners | 58 (9.6%) | $0 |
| Total | 607 (100.0%) | $43,705 |
Household Income in Bel Ridge
Household Income Brackets in Bel Ridge
With 253 households falling in the category, the $35,000 to $49,999 income range is the most frequent in Bel Ridge, accounting for 26.6% of all households. In contrast, only 6 households (0.6%) fall into the $200,000+ income bracket, making it the least populous group.
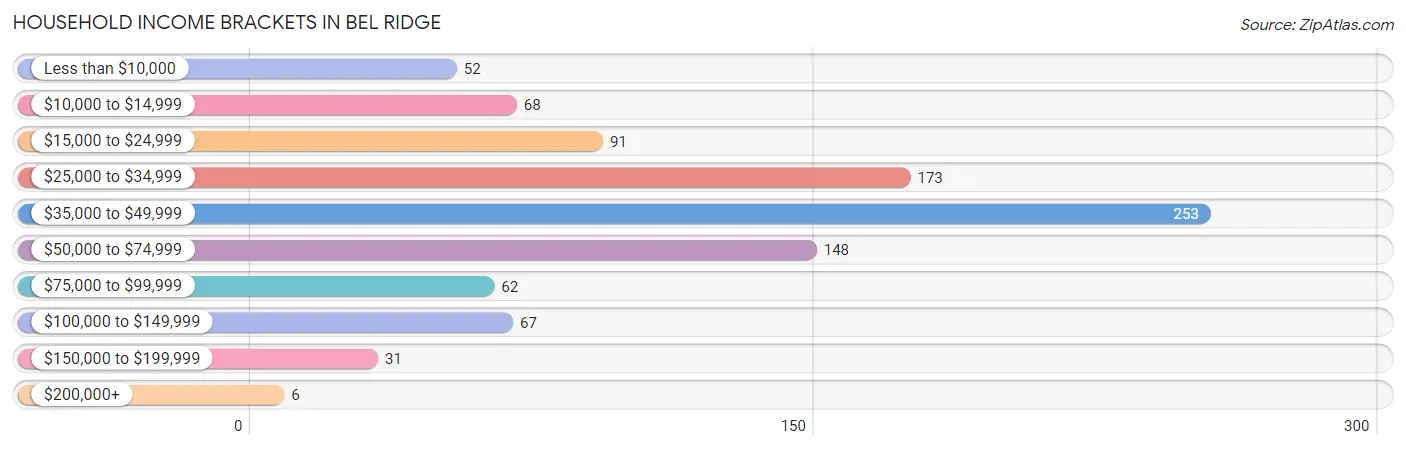
| Income Bracket | # Households | % Households |
| Less than $10,000 | 52 | 5.5% |
| $10,000 to $14,999 | 68 | 7.2% |
| $15,000 to $24,999 | 91 | 9.6% |
| $25,000 to $34,999 | 173 | 18.2% |
| $35,000 to $49,999 | 253 | 26.6% |
| $50,000 to $74,999 | 148 | 15.6% |
| $75,000 to $99,999 | 62 | 6.5% |
| $100,000 to $149,999 | 67 | 7.0% |
| $150,000 to $199,999 | 31 | 3.3% |
| $200,000+ | 6 | 0.6% |
Household Income by Householder Age in Bel Ridge
The median household income in Bel Ridge is $38,642, with the highest median household income of $48,831 found in the 25 to 44 years age bracket for the primary householder. A total of 365 households (38.4%) fall into this category. Meanwhile, the 15 to 24 years age bracket for the primary householder has the lowest median household income of $0, with 44 households (4.6%) in this group.
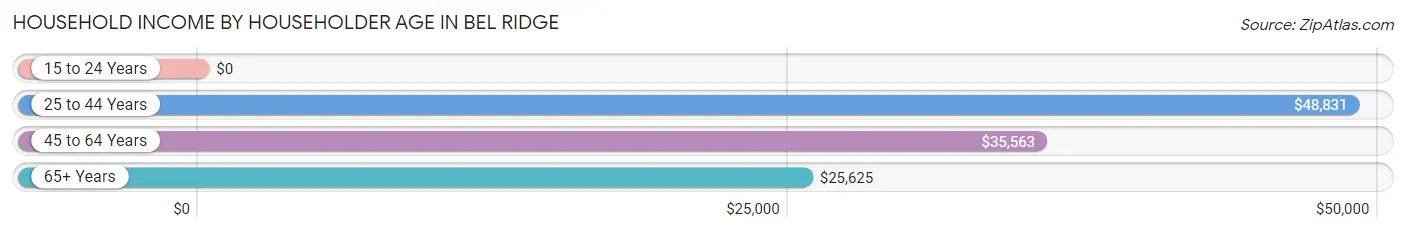
| Income Bracket | # Households | Median Income |
| 15 to 24 Years | 44 (4.6%) | $0 |
| 25 to 44 Years | 365 (38.4%) | $48,831 |
| 45 to 64 Years | 356 (37.4%) | $35,563 |
| 65+ Years | 186 (19.6%) | $25,625 |
| Total | 951 (100.0%) | $38,642 |
Poverty in Bel Ridge
Income Below Poverty by Sex and Age in Bel Ridge
With 22.8% poverty level for males and 24.8% for females among the residents of Bel Ridge, 18 to 24 year old males and 6 to 11 year old females are the most vulnerable to poverty, with 72 males (79.1%) and 55 females (45.1%) in their respective age groups living below the poverty level.
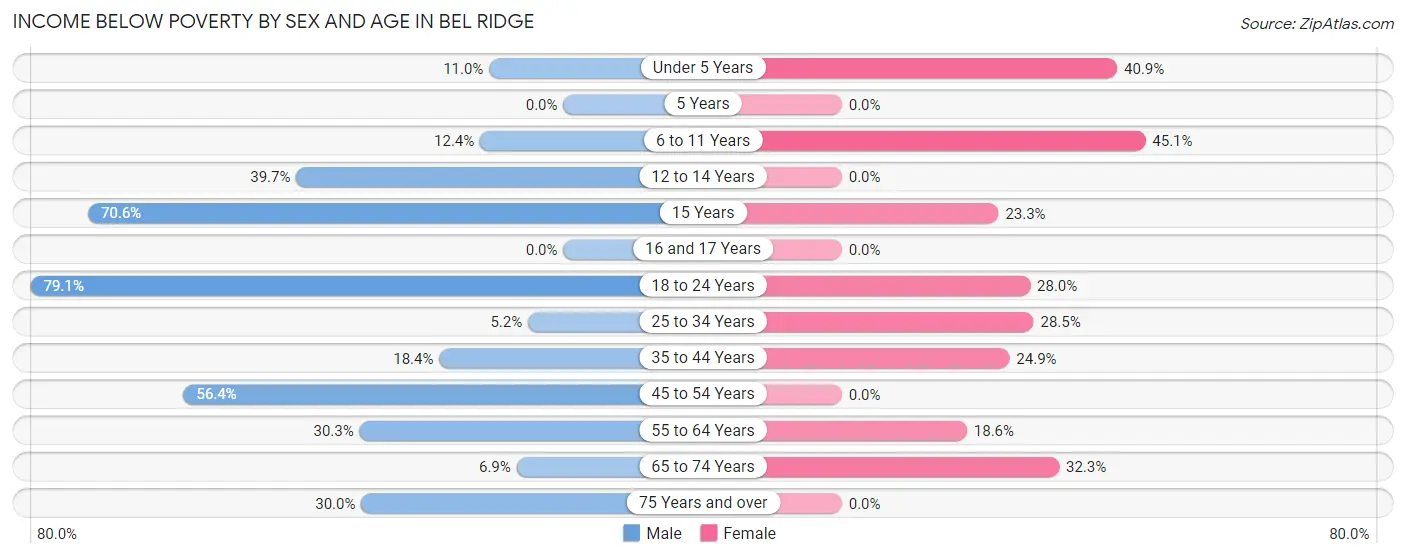
| Age Bracket | Male | Female |
| Under 5 Years | 12 (11.0%) | 56 (40.9%) |
| 5 Years | 0 (0.0%) | 0 (0.0%) |
| 6 to 11 Years | 11 (12.4%) | 55 (45.1%) |
| 12 to 14 Years | 46 (39.7%) | 0 (0.0%) |
| 15 Years | 12 (70.6%) | 30 (23.3%) |
| 16 and 17 Years | 0 (0.0%) | 0 (0.0%) |
| 18 to 24 Years | 72 (79.1%) | 85 (28.0%) |
| 25 to 34 Years | 10 (5.2%) | 45 (28.5%) |
| 35 to 44 Years | 28 (18.4%) | 55 (24.9%) |
| 45 to 54 Years | 22 (56.4%) | 0 (0.0%) |
| 55 to 64 Years | 23 (30.3%) | 26 (18.6%) |
| 65 to 74 Years | 5 (6.9%) | 40 (32.3%) |
| 75 Years and over | 6 (30.0%) | 0 (0.0%) |
| Total | 247 (22.8%) | 392 (24.8%) |
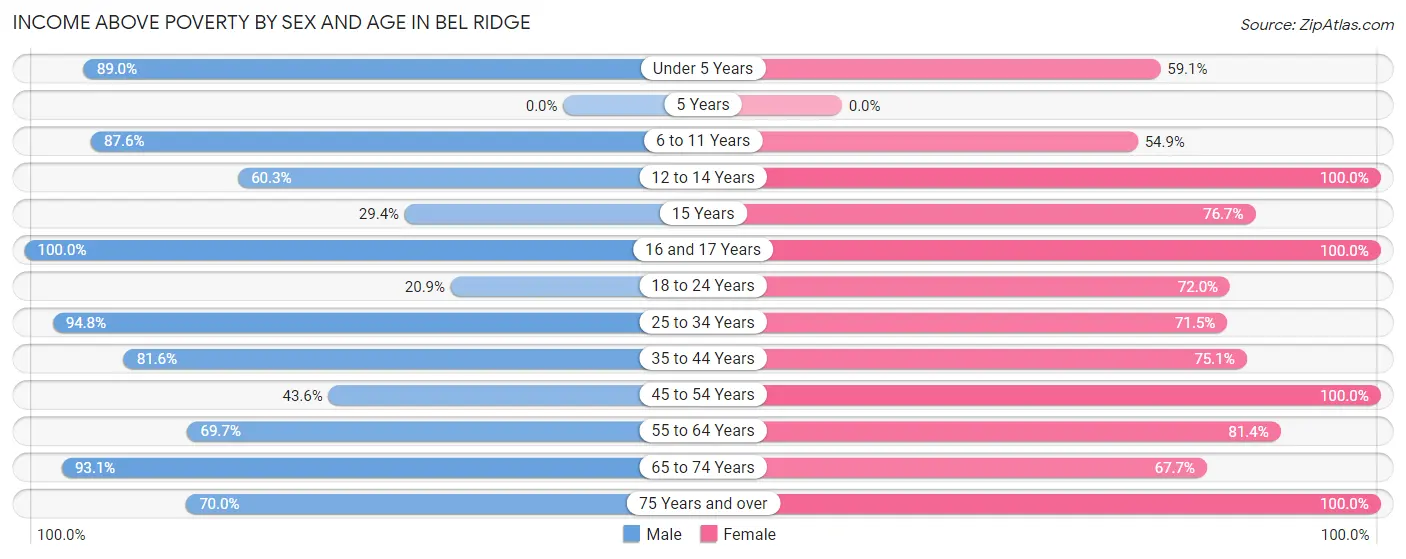
Income Above Poverty by Sex and Age in Bel Ridge
According to the poverty statistics in Bel Ridge, males aged 16 and 17 years and females aged 12 to 14 years are the age groups that are most secure financially, with 100.0% of males and 100.0% of females in these age groups living above the poverty line.
| Age Bracket | Male | Female |
| Under 5 Years | 97 (89.0%) | 81 (59.1%) |
| 5 Years | 0 (0.0%) | 0 (0.0%) |
| 6 to 11 Years | 78 (87.6%) | 67 (54.9%) |
| 12 to 14 Years | 70 (60.3%) | 8 (100.0%) |
| 15 Years | 5 (29.4%) | 99 (76.7%) |
| 16 and 17 Years | 112 (100.0%) | 10 (100.0%) |
| 18 to 24 Years | 19 (20.9%) | 219 (72.0%) |
| 25 to 34 Years | 181 (94.8%) | 113 (71.5%) |
| 35 to 44 Years | 124 (81.6%) | 166 (75.1%) |
| 45 to 54 Years | 17 (43.6%) | 188 (100.0%) |
| 55 to 64 Years | 53 (69.7%) | 114 (81.4%) |
| 65 to 74 Years | 67 (93.1%) | 84 (67.7%) |
| 75 Years and over | 14 (70.0%) | 40 (100.0%) |
| Total | 837 (77.2%) | 1,189 (75.2%) |
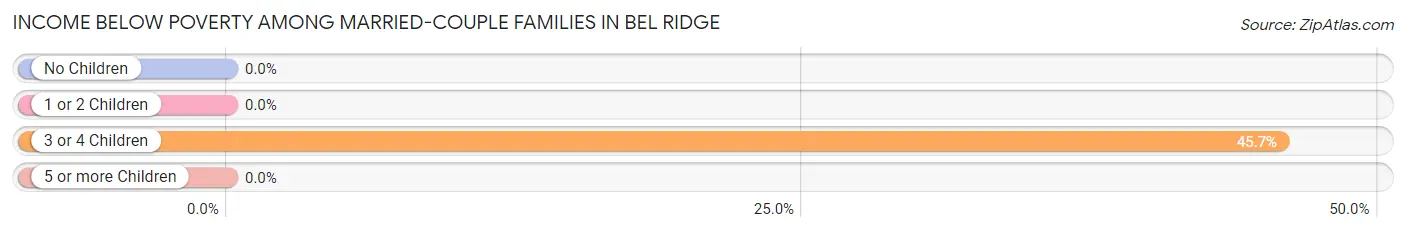
Income Below Poverty Among Married-Couple Families in Bel Ridge
The poverty statistics for married-couple families in Bel Ridge show that 19.0% or 43 of the total 226 families live below the poverty line. Families with 3 or 4 children have the highest poverty rate of 45.7%, comprising of 43 families. On the other hand, families with no children have the lowest poverty rate of 0.0%, which includes 0 families.
| Children | Above Poverty | Below Poverty |
| No Children | 114 (100.0%) | 0 (0.0%) |
| 1 or 2 Children | 18 (100.0%) | 0 (0.0%) |
| 3 or 4 Children | 51 (54.3%) | 43 (45.7%) |
| 5 or more Children | 0 (0.0%) | 0 (0.0%) |
| Total | 183 (81.0%) | 43 (19.0%) |
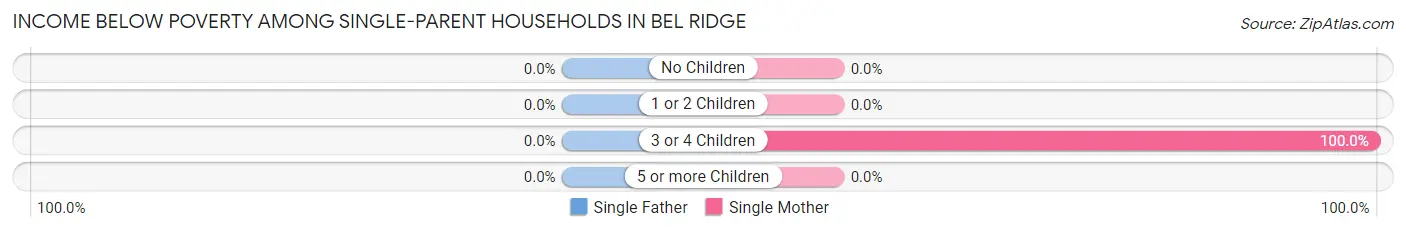
Income Below Poverty Among Single-Parent Households in Bel Ridge
| Children | Single Father | Single Mother |
| No Children | 0 (0.0%) | 0 (0.0%) |
| 1 or 2 Children | 0 (0.0%) | 0 (0.0%) |
| 3 or 4 Children | 0 (0.0%) | 12 (100.0%) |
| 5 or more Children | 0 (0.0%) | 0 (0.0%) |
| Total | 0 (0.0%) | 12 (3.7%) |
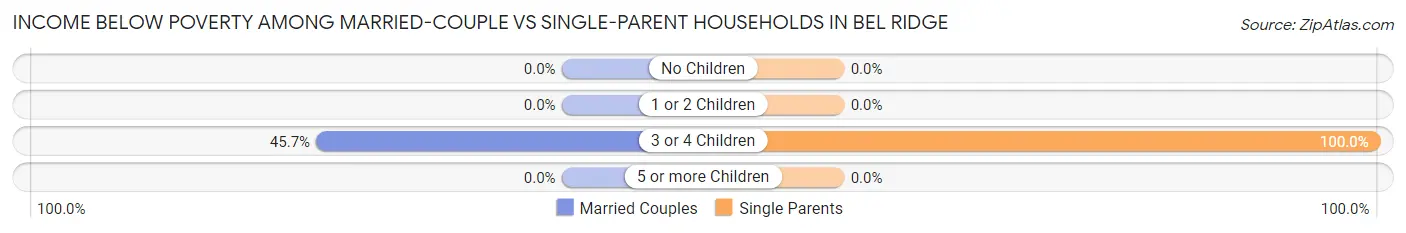
Income Below Poverty Among Married-Couple vs Single-Parent Households in Bel Ridge
The poverty data for Bel Ridge shows that 43 of the married-couple family households (19.0%) and 12 of the single-parent households (3.2%) are living below the poverty level. Within the married-couple family households, those with 3 or 4 children have the highest poverty rate, with 43 households (45.7%) falling below the poverty line. Among the single-parent households, those with 3 or 4 children have the highest poverty rate, with 12 household (100.0%) living below poverty.
| Children | Married-Couple Families | Single-Parent Households |
| No Children | 0 (0.0%) | 0 (0.0%) |
| 1 or 2 Children | 0 (0.0%) | 0 (0.0%) |
| 3 or 4 Children | 43 (45.7%) | 12 (100.0%) |
| 5 or more Children | 0 (0.0%) | 0 (0.0%) |
| Total | 43 (19.0%) | 12 (3.2%) |
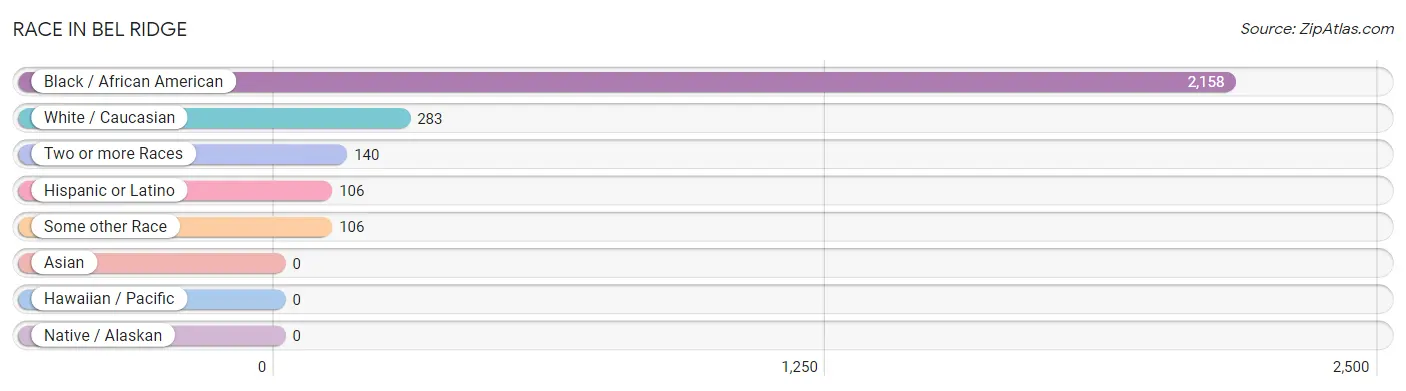
Race in Bel Ridge
The most populous races in Bel Ridge are Black / African American (2,158 | 80.3%), White / Caucasian (283 | 10.5%), and Two or more Races (140 | 5.2%).
| Race | # Population | % Population |
| Asian | 0 | 0.0% |
| Black / African American | 2,158 | 80.3% |
| Hawaiian / Pacific | 0 | 0.0% |
| Hispanic or Latino | 106 | 3.9% |
| Native / Alaskan | 0 | 0.0% |
| White / Caucasian | 283 | 10.5% |
| Two or more Races | 140 | 5.2% |
| Some other Race | 106 | 3.9% |
| Total | 2,687 | 100.0% |
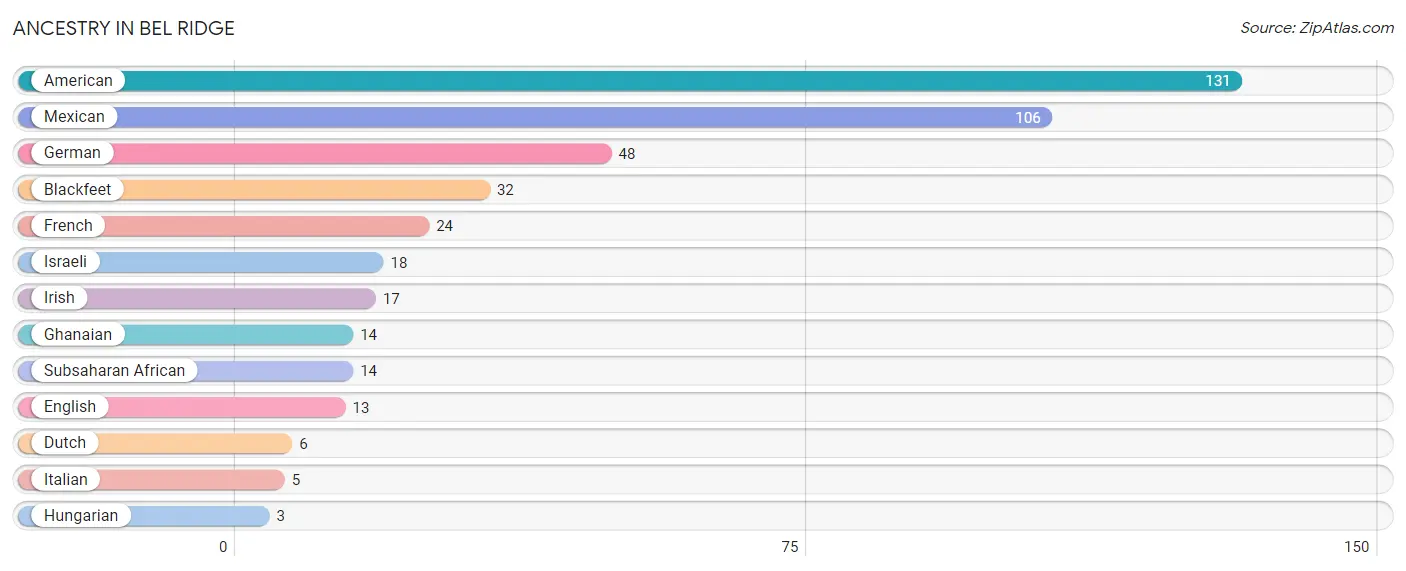
Ancestry in Bel Ridge
The most populous ancestries reported in Bel Ridge are American (131 | 4.9%), Mexican (106 | 3.9%), German (48 | 1.8%), Blackfeet (32 | 1.2%), and French (24 | 0.9%), together accounting for 12.7% of all Bel Ridge residents.
| Ancestry | # Population | % Population |
| American | 131 | 4.9% |
| Blackfeet | 32 | 1.2% |
| Dutch | 6 | 0.2% |
| English | 13 | 0.5% |
| French | 24 | 0.9% |
| German | 48 | 1.8% |
| Ghanaian | 14 | 0.5% |
| Hungarian | 3 | 0.1% |
| Irish | 17 | 0.6% |
| Israeli | 18 | 0.7% |
| Italian | 5 | 0.2% |
| Mexican | 106 | 3.9% |
| Subsaharan African | 14 | 0.5% | View All 13 Rows |
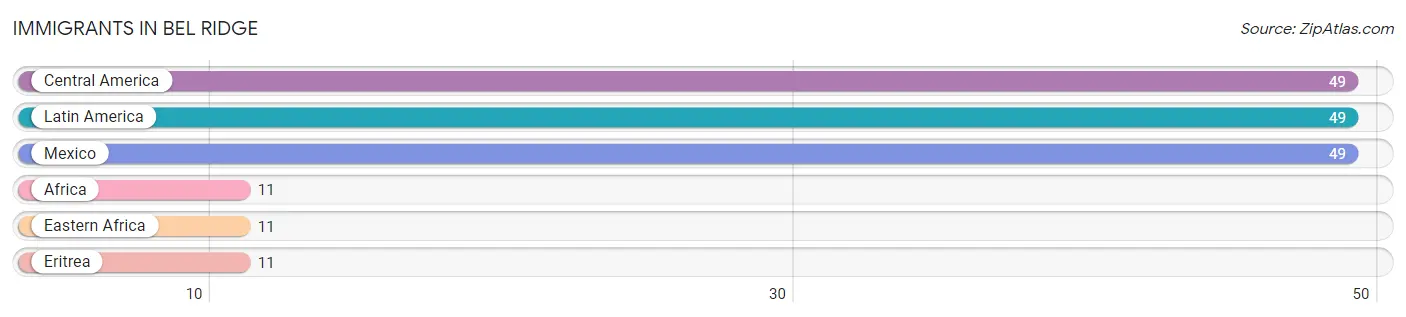
Immigrants in Bel Ridge
The most numerous immigrant groups reported in Bel Ridge came from Central America (49 | 1.8%), Latin America (49 | 1.8%), Mexico (49 | 1.8%), Africa (11 | 0.4%), and Eastern Africa (11 | 0.4%), together accounting for 6.3% of all Bel Ridge residents.
| Immigration Origin | # Population | % Population |
| Africa | 11 | 0.4% |
| Central America | 49 | 1.8% |
| Eastern Africa | 11 | 0.4% |
| Eritrea | 11 | 0.4% |
| Latin America | 49 | 1.8% |
| Mexico | 49 | 1.8% | View All 6 Rows |
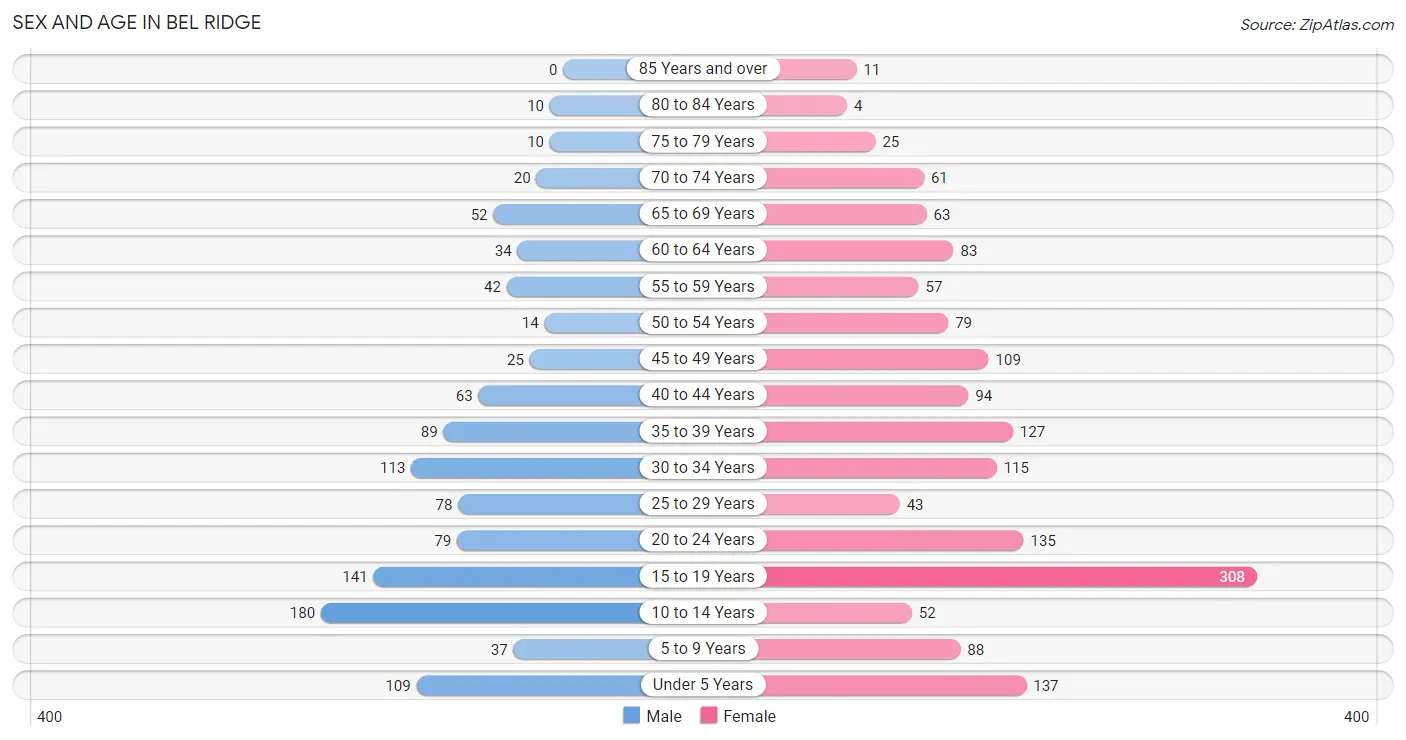
Sex and Age in Bel Ridge
Sex and Age in Bel Ridge
The most populous age groups in Bel Ridge are 10 to 14 Years (180 | 16.4%) for men and 15 to 19 Years (308 | 19.4%) for women.
| Age Bracket | Male | Female |
| Under 5 Years | 109 (10.0%) | 137 (8.6%) |
| 5 to 9 Years | 37 (3.4%) | 88 (5.5%) |
| 10 to 14 Years | 180 (16.4%) | 52 (3.3%) |
| 15 to 19 Years | 141 (12.9%) | 308 (19.4%) |
| 20 to 24 Years | 79 (7.2%) | 135 (8.5%) |
| 25 to 29 Years | 78 (7.1%) | 43 (2.7%) |
| 30 to 34 Years | 113 (10.3%) | 115 (7.2%) |
| 35 to 39 Years | 89 (8.1%) | 127 (8.0%) |
| 40 to 44 Years | 63 (5.8%) | 94 (5.9%) |
| 45 to 49 Years | 25 (2.3%) | 109 (6.9%) |
| 50 to 54 Years | 14 (1.3%) | 79 (5.0%) |
| 55 to 59 Years | 42 (3.8%) | 57 (3.6%) |
| 60 to 64 Years | 34 (3.1%) | 83 (5.2%) |
| 65 to 69 Years | 52 (4.7%) | 63 (4.0%) |
| 70 to 74 Years | 20 (1.8%) | 61 (3.8%) |
| 75 to 79 Years | 10 (0.9%) | 25 (1.6%) |
| 80 to 84 Years | 10 (0.9%) | 4 (0.3%) |
| 85 Years and over | 0 (0.0%) | 11 (0.7%) |
| Total | 1,096 (100.0%) | 1,591 (100.0%) |
Families and Households in Bel Ridge
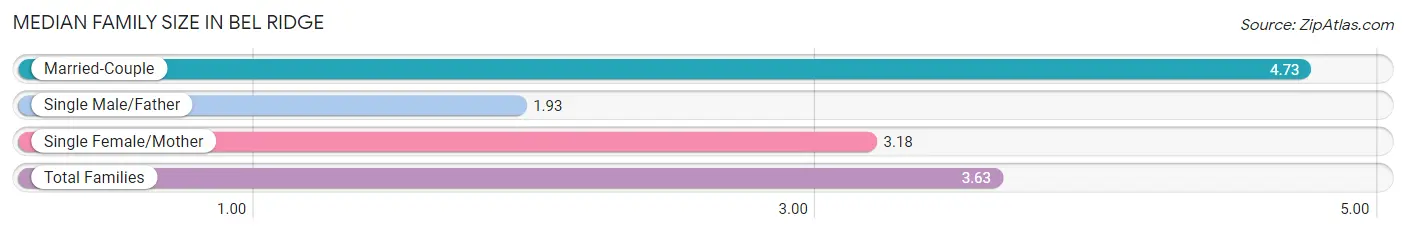
Median Family Size in Bel Ridge
The median family size in Bel Ridge is 3.63 persons per family, with married-couple families (226 | 37.2%) accounting for the largest median family size of 4.73 persons per family. On the other hand, single male/father families (60 | 9.9%) represent the smallest median family size with 1.93 persons per family.
| Family Type | # Families | Family Size |
| Married-Couple | 226 (37.2%) | 4.73 |
| Single Male/Father | 60 (9.9%) | 1.93 |
| Single Female/Mother | 321 (52.9%) | 3.18 |
| Total Families | 607 (100.0%) | 3.63 |
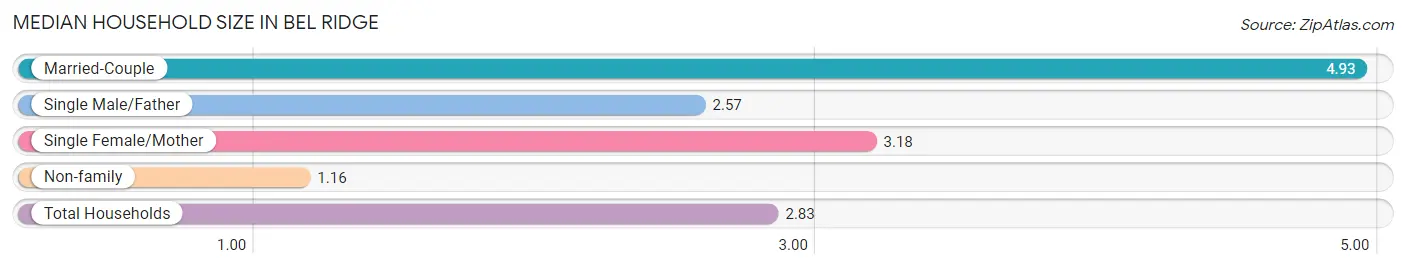
Median Household Size in Bel Ridge
The median household size in Bel Ridge is 2.83 persons per household, with married-couple households (226 | 23.8%) accounting for the largest median household size of 4.93 persons per household. non-family households (344 | 36.2%) represent the smallest median household size with 1.16 persons per household.
| Household Type | # Households | Household Size |
| Married-Couple | 226 (23.8%) | 4.93 |
| Single Male/Father | 60 (6.3%) | 2.57 |
| Single Female/Mother | 321 (33.8%) | 3.18 |
| Non-family | 344 (36.2%) | 1.16 |
| Total Households | 951 (100.0%) | 2.83 |
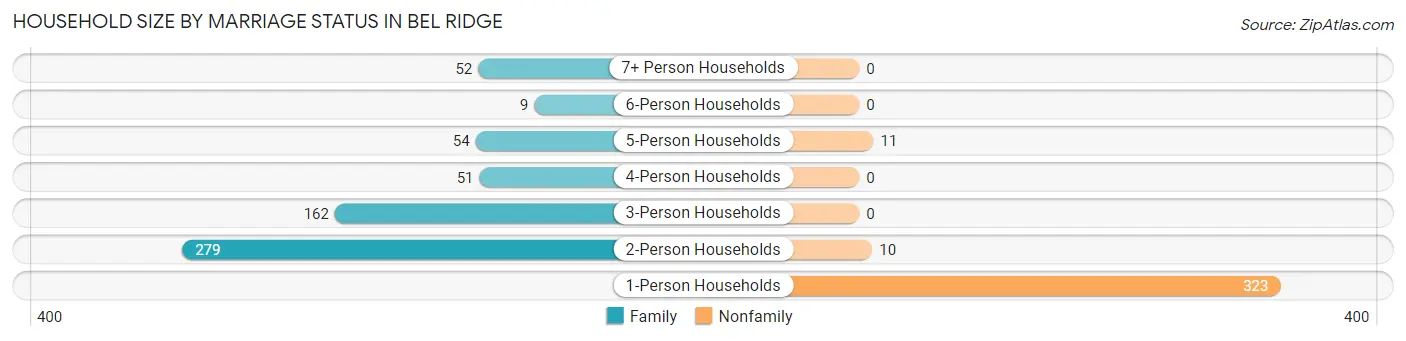
Household Size by Marriage Status in Bel Ridge
Out of a total of 951 households in Bel Ridge, 607 (63.8%) are family households, while 344 (36.2%) are nonfamily households. The most numerous type of family households are 2-person households, comprising 279, and the most common type of nonfamily households are 1-person households, comprising 323.
| Household Size | Family Households | Nonfamily Households |
| 1-Person Households | - | 323 (34.0%) |
| 2-Person Households | 279 (29.3%) | 10 (1.1%) |
| 3-Person Households | 162 (17.0%) | 0 (0.0%) |
| 4-Person Households | 51 (5.4%) | 0 (0.0%) |
| 5-Person Households | 54 (5.7%) | 11 (1.2%) |
| 6-Person Households | 9 (0.9%) | 0 (0.0%) |
| 7+ Person Households | 52 (5.5%) | 0 (0.0%) |
| Total | 607 (63.8%) | 344 (36.2%) |
Female Fertility in Bel Ridge
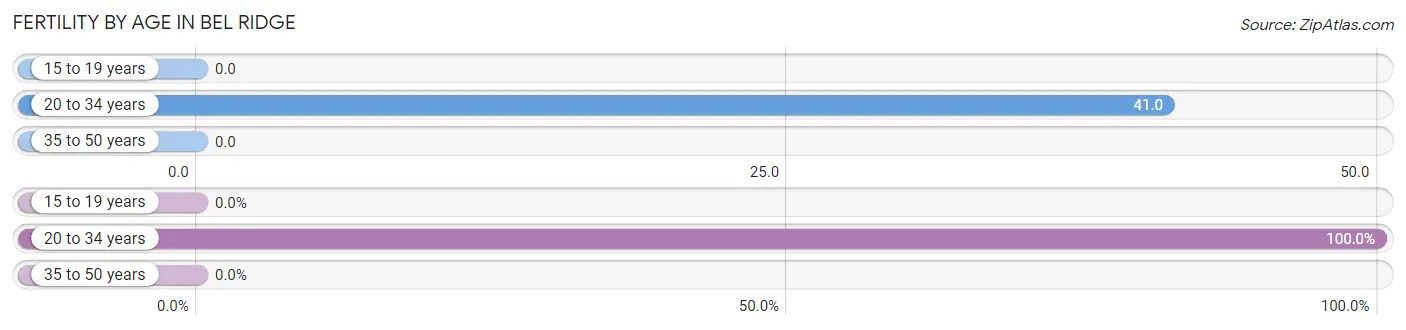
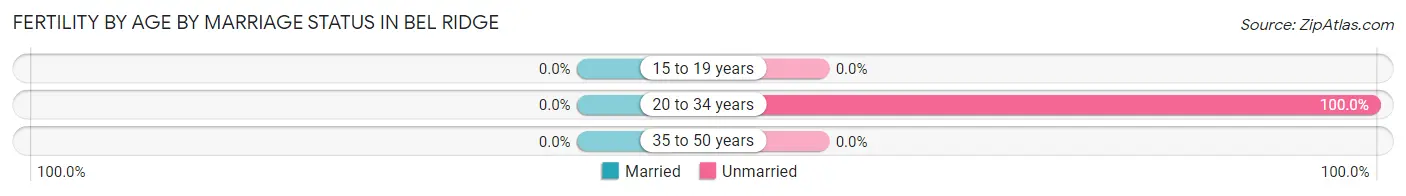
Fertility by Age in Bel Ridge
Average fertility rate in Bel Ridge is 13.0 births per 1,000 women. Women in the age bracket of 20 to 34 years have the highest fertility rate with 41.0 births per 1,000 women. Women in the age bracket of 20 to 34 years acount for 100.0% of all women with births.
| Age Bracket | Women with Births | Births / 1,000 Women |
| 15 to 19 years | 0 (0.0%) | 0.0 |
| 20 to 34 years | 12 (100.0%) | 41.0 |
| 35 to 50 years | 0 (0.0%) | 0.0 |
| Total | 12 (100.0%) | 13.0 |
Fertility by Age by Marriage Status in Bel Ridge
| Age Bracket | Married | Unmarried |
| 15 to 19 years | 0 (0.0%) | 0 (0.0%) |
| 20 to 34 years | 0 (0.0%) | 12 (100.0%) |
| 35 to 50 years | 0 (0.0%) | 0 (0.0%) |
| Total | 0 (0.0%) | 12 (100.0%) |
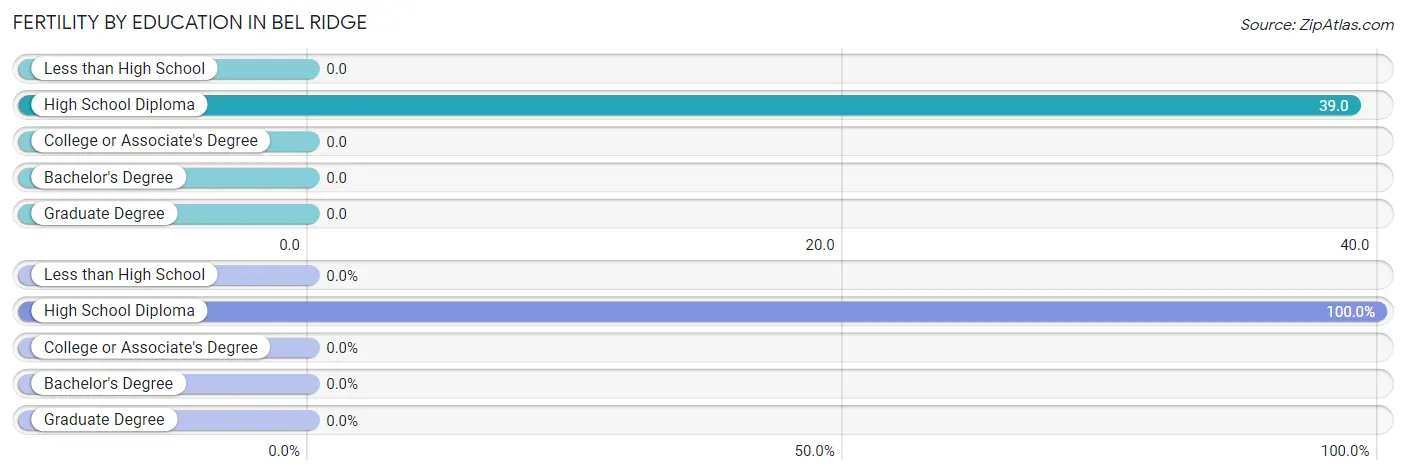
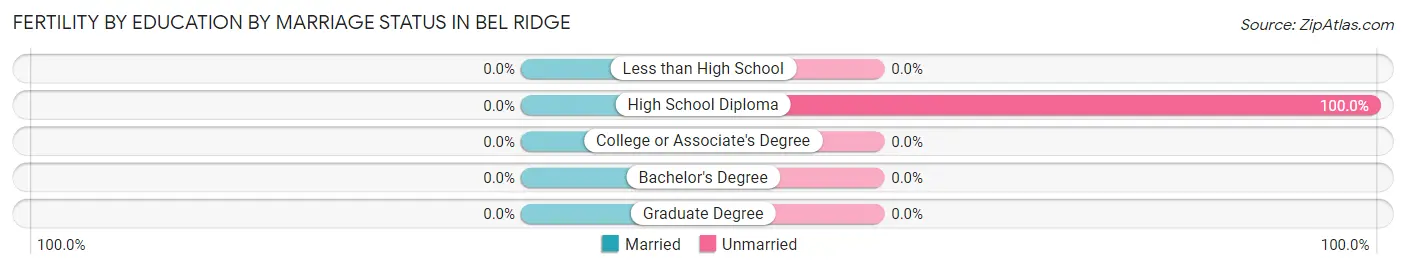
Fertility by Education in Bel Ridge
| Educational Attainment | Women with Births | Births / 1,000 Women |
| Less than High School | 0 (0.0%) | 0.0 |
| High School Diploma | 12 (100.0%) | 39.0 |
| College or Associate's Degree | 0 (0.0%) | 0.0 |
| Bachelor's Degree | 0 (0.0%) | 0.0 |
| Graduate Degree | 0 (0.0%) | 0.0 |
| Total | 12 (100.0%) | 13.0 |
Fertility by Education by Marriage Status in Bel Ridge
| Educational Attainment | Married | Unmarried |
| Less than High School | 0 (0.0%) | 0 (0.0%) |
| High School Diploma | 0 (0.0%) | 12 (100.0%) |
| College or Associate's Degree | 0 (0.0%) | 0 (0.0%) |
| Bachelor's Degree | 0 (0.0%) | 0 (0.0%) |
| Graduate Degree | 0 (0.0%) | 0 (0.0%) |
| Total | 0 (0.0%) | 12 (100.0%) |
Employment Characteristics in Bel Ridge
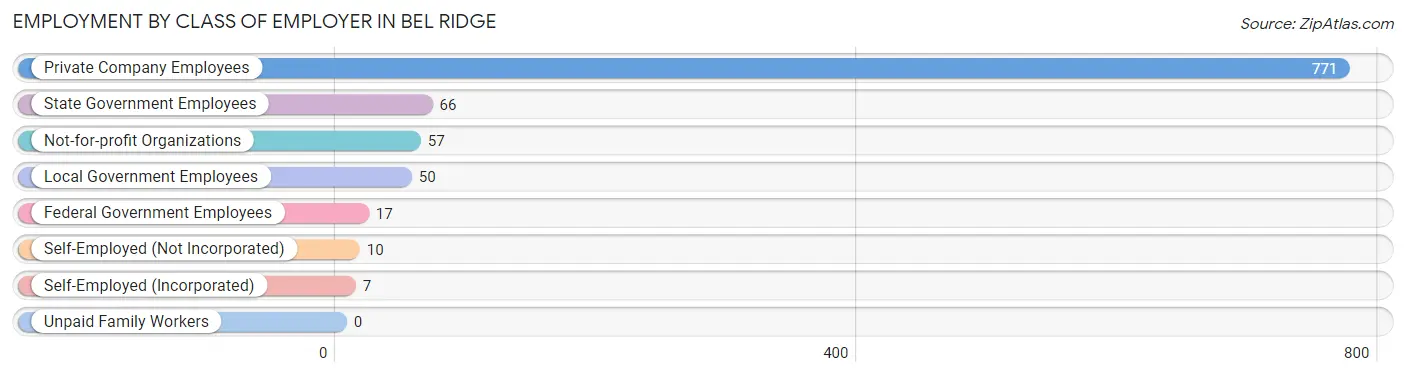
Employment by Class of Employer in Bel Ridge
Among the 978 employed individuals in Bel Ridge, private company employees (771 | 78.8%), state government employees (66 | 6.8%), and not-for-profit organizations (57 | 5.8%) make up the most common classes of employment.
| Employer Class | # Employees | % Employees |
| Private Company Employees | 771 | 78.8% |
| Self-Employed (Incorporated) | 7 | 0.7% |
| Self-Employed (Not Incorporated) | 10 | 1.0% |
| Not-for-profit Organizations | 57 | 5.8% |
| Local Government Employees | 50 | 5.1% |
| State Government Employees | 66 | 6.8% |
| Federal Government Employees | 17 | 1.7% |
| Unpaid Family Workers | 0 | 0.0% |
| Total | 978 | 100.0% |
Employment Status by Age in Bel Ridge
According to the labor force statistics for Bel Ridge, out of the total population over 16 years of age (1,938), 62.1% or 1,203 individuals are in the labor force, with 18.3% or 220 of them unemployed. The age group with the highest labor force participation rate is 45 to 54 years, with 93.0% or 211 individuals in the labor force. Within the labor force, the 16 to 19 years age range has the highest percentage of unemployed individuals, with 95.2% or 140 of them being unemployed.
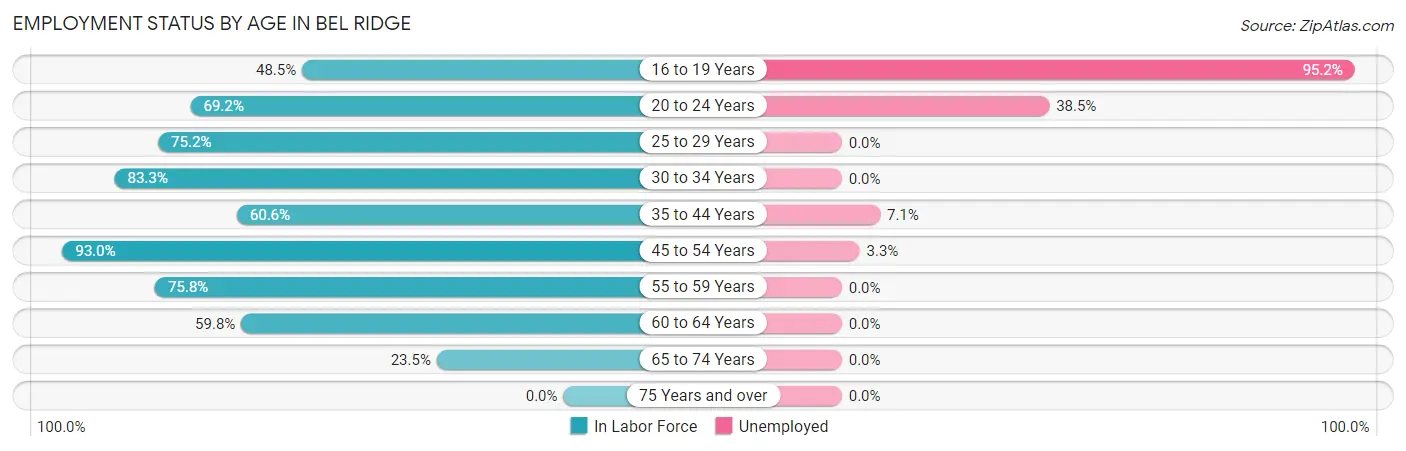
| Age Bracket | In Labor Force | Unemployed |
| 16 to 19 Years | 147 (48.5%) | 140 (95.2%) |
| 20 to 24 Years | 148 (69.2%) | 57 (38.5%) |
| 25 to 29 Years | 91 (75.2%) | 0 (0.0%) |
| 30 to 34 Years | 190 (83.3%) | 0 (0.0%) |
| 35 to 44 Years | 226 (60.6%) | 16 (7.1%) |
| 45 to 54 Years | 211 (93.0%) | 7 (3.3%) |
| 55 to 59 Years | 75 (75.8%) | 0 (0.0%) |
| 60 to 64 Years | 70 (59.8%) | 0 (0.0%) |
| 65 to 74 Years | 46 (23.5%) | 0 (0.0%) |
| 75 Years and over | 0 (0.0%) | 0 (0.0%) |
| Total | 1,203 (62.1%) | 220 (18.3%) |
Employment Status by Educational Attainment in Bel Ridge
According to labor force statistics for Bel Ridge, 74.1% of individuals (863) out of the total population between 25 and 64 years of age (1,165) are in the labor force, with 2.7% or 23 of them being unemployed. The group with the highest labor force participation rate are those with the educational attainment of bachelor's degree or higher, with 100.0% or 158 individuals in the labor force. Within the labor force, individuals with less than high school education have the highest percentage of unemployment, with 6.5% or 7 of them being unemployed.
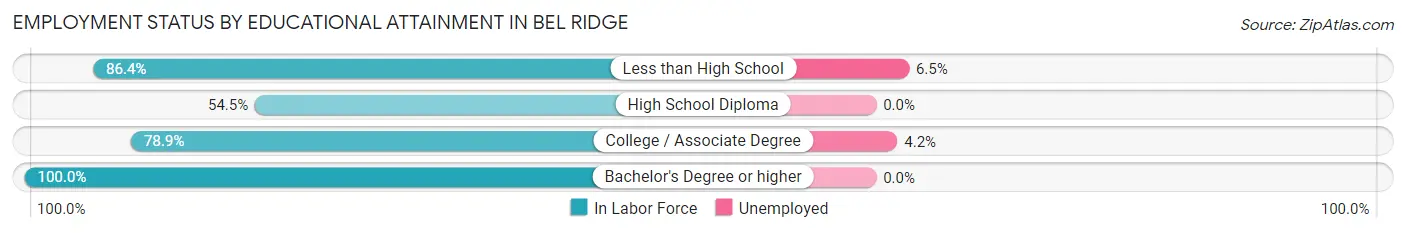
| Educational Attainment | In Labor Force | Unemployed |
| Less than High School | 108 (86.4%) | 8 (6.5%) |
| High School Diploma | 220 (54.5%) | 0 (0.0%) |
| College / Associate Degree | 377 (78.9%) | 20 (4.2%) |
| Bachelor's Degree or higher | 158 (100.0%) | 0 (0.0%) |
| Total | 863 (74.1%) | 31 (2.7%) |
Employment Occupations by Sex in Bel Ridge
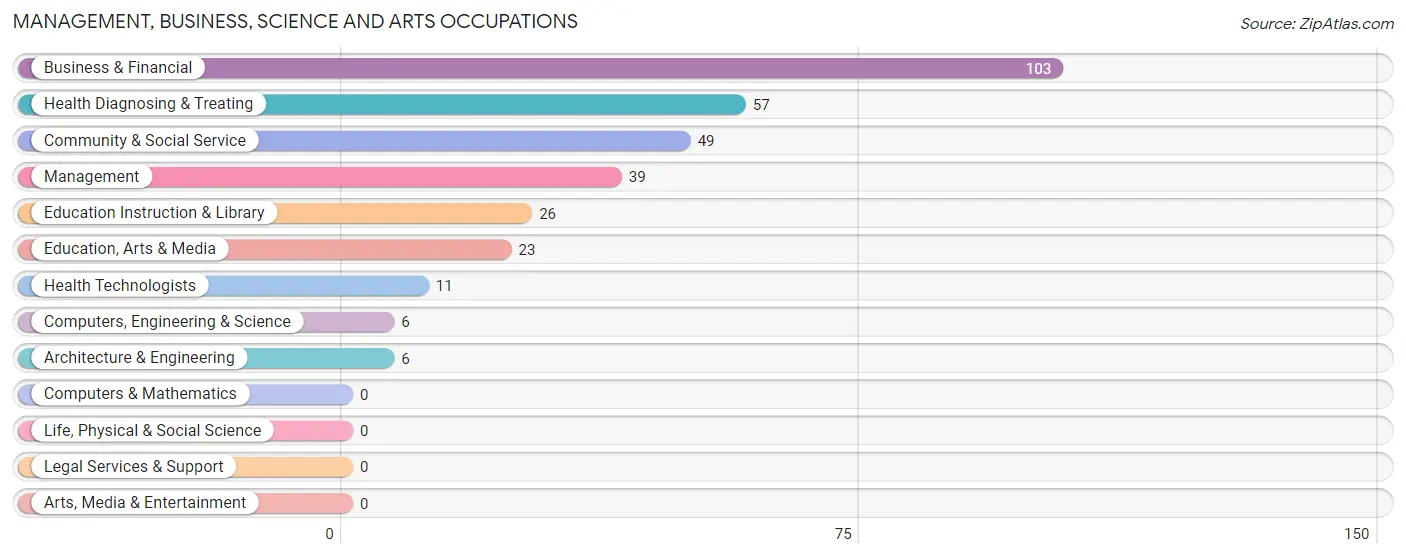
Management, Business, Science and Arts Occupations
The most common Management, Business, Science and Arts occupations in Bel Ridge are Business & Financial (103 | 10.5%), Health Diagnosing & Treating (57 | 5.8%), Community & Social Service (49 | 5.0%), Management (39 | 4.0%), and Education Instruction & Library (26 | 2.6%).
Management, Business, Science and Arts Occupations by Sex
Within the Management, Business, Science and Arts occupations in Bel Ridge, the most male-oriented occupations are Computers, Engineering & Science (100.0%), Architecture & Engineering (100.0%), and Management (46.2%), while the most female-oriented occupations are Business & Financial (100.0%), Community & Social Service (100.0%), and Education, Arts & Media (100.0%).
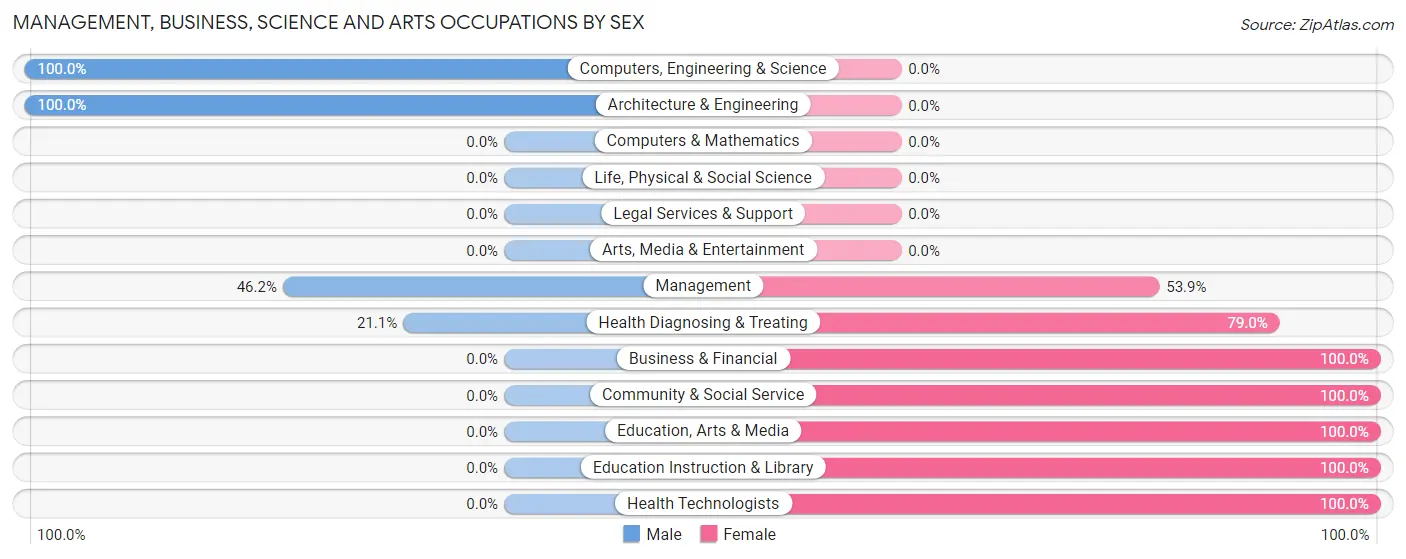
| Occupation | Male | Female |
| Management | 18 (46.2%) | 21 (53.8%) |
| Business & Financial | 0 (0.0%) | 103 (100.0%) |
| Computers, Engineering & Science | 6 (100.0%) | 0 (0.0%) |
| Computers & Mathematics | 0 (0.0%) | 0 (0.0%) |
| Architecture & Engineering | 6 (100.0%) | 0 (0.0%) |
| Life, Physical & Social Science | 0 (0.0%) | 0 (0.0%) |
| Community & Social Service | 0 (0.0%) | 49 (100.0%) |
| Education, Arts & Media | 0 (0.0%) | 23 (100.0%) |
| Legal Services & Support | 0 (0.0%) | 0 (0.0%) |
| Education Instruction & Library | 0 (0.0%) | 26 (100.0%) |
| Arts, Media & Entertainment | 0 (0.0%) | 0 (0.0%) |
| Health Diagnosing & Treating | 12 (21.0%) | 45 (78.9%) |
| Health Technologists | 0 (0.0%) | 11 (100.0%) |
| Total (Category) | 36 (14.2%) | 218 (85.8%) |
| Total (Overall) | 349 (35.5%) | 635 (64.5%) |
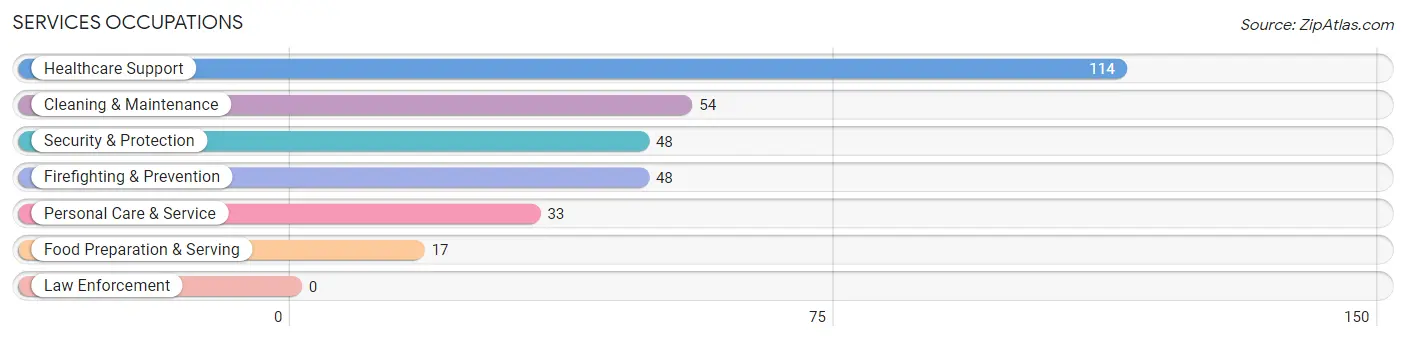
Services Occupations
The most common Services occupations in Bel Ridge are Healthcare Support (114 | 11.6%), Cleaning & Maintenance (54 | 5.5%), Security & Protection (48 | 4.9%), Firefighting & Prevention (48 | 4.9%), and Personal Care & Service (33 | 3.4%).
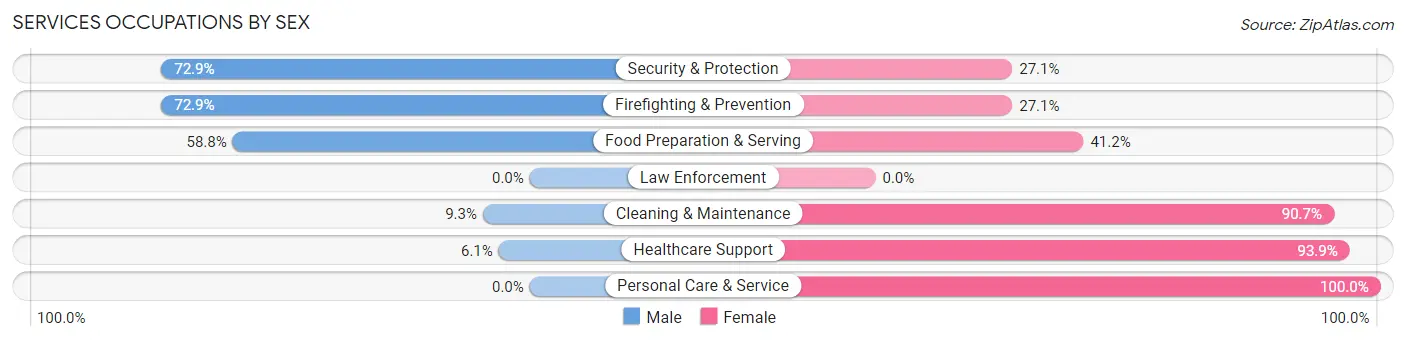
Services Occupations by Sex
Within the Services occupations in Bel Ridge, the most male-oriented occupations are Security & Protection (72.9%), Firefighting & Prevention (72.9%), and Food Preparation & Serving (58.8%), while the most female-oriented occupations are Personal Care & Service (100.0%), Healthcare Support (93.9%), and Cleaning & Maintenance (90.7%).
| Occupation | Male | Female |
| Healthcare Support | 7 (6.1%) | 107 (93.9%) |
| Security & Protection | 35 (72.9%) | 13 (27.1%) |
| Firefighting & Prevention | 35 (72.9%) | 13 (27.1%) |
| Law Enforcement | 0 (0.0%) | 0 (0.0%) |
| Food Preparation & Serving | 10 (58.8%) | 7 (41.2%) |
| Cleaning & Maintenance | 5 (9.3%) | 49 (90.7%) |
| Personal Care & Service | 0 (0.0%) | 33 (100.0%) |
| Total (Category) | 57 (21.4%) | 209 (78.6%) |
| Total (Overall) | 349 (35.5%) | 635 (64.5%) |
Sales and Office Occupations
The most common Sales and Office occupations in Bel Ridge are Office & Administration (130 | 13.2%), and Sales & Related (89 | 9.0%).

Sales and Office Occupations by Sex

| Occupation | Male | Female |
| Sales & Related | 48 (53.9%) | 41 (46.1%) |
| Office & Administration | 15 (11.5%) | 115 (88.5%) |
| Total (Category) | 63 (28.8%) | 156 (71.2%) |
| Total (Overall) | 349 (35.5%) | 635 (64.5%) |
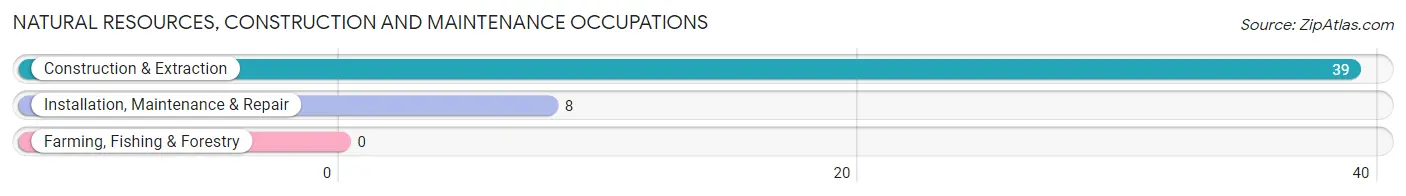
Natural Resources, Construction and Maintenance Occupations
The most common Natural Resources, Construction and Maintenance occupations in Bel Ridge are Construction & Extraction (39 | 4.0%), and Installation, Maintenance & Repair (8 | 0.8%).
Natural Resources, Construction and Maintenance Occupations by Sex

| Occupation | Male | Female |
| Farming, Fishing & Forestry | 0 (0.0%) | 0 (0.0%) |
| Construction & Extraction | 39 (100.0%) | 0 (0.0%) |
| Installation, Maintenance & Repair | 8 (100.0%) | 0 (0.0%) |
| Total (Category) | 47 (100.0%) | 0 (0.0%) |
| Total (Overall) | 349 (35.5%) | 635 (64.5%) |
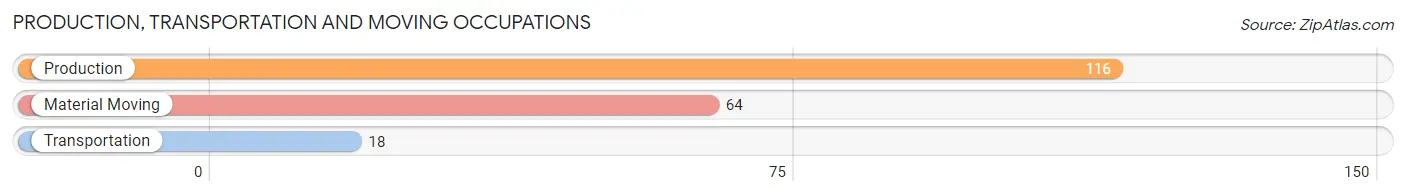
Production, Transportation and Moving Occupations
The most common Production, Transportation and Moving occupations in Bel Ridge are Production (116 | 11.8%), Material Moving (64 | 6.5%), and Transportation (18 | 1.8%).
Production, Transportation and Moving Occupations by Sex
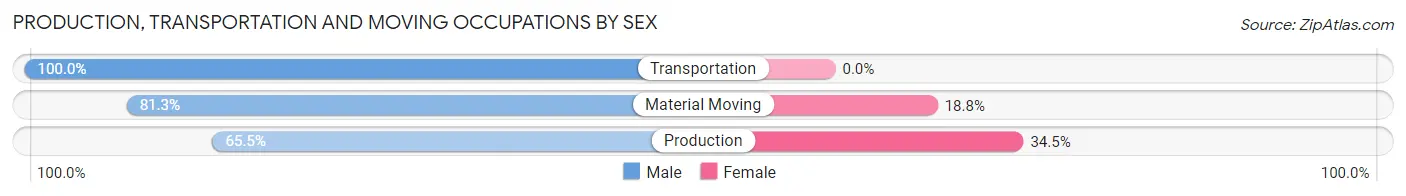
| Occupation | Male | Female |
| Production | 76 (65.5%) | 40 (34.5%) |
| Transportation | 18 (100.0%) | 0 (0.0%) |
| Material Moving | 52 (81.2%) | 12 (18.8%) |
| Total (Category) | 146 (73.7%) | 52 (26.3%) |
| Total (Overall) | 349 (35.5%) | 635 (64.5%) |
Employment Industries by Sex in Bel Ridge
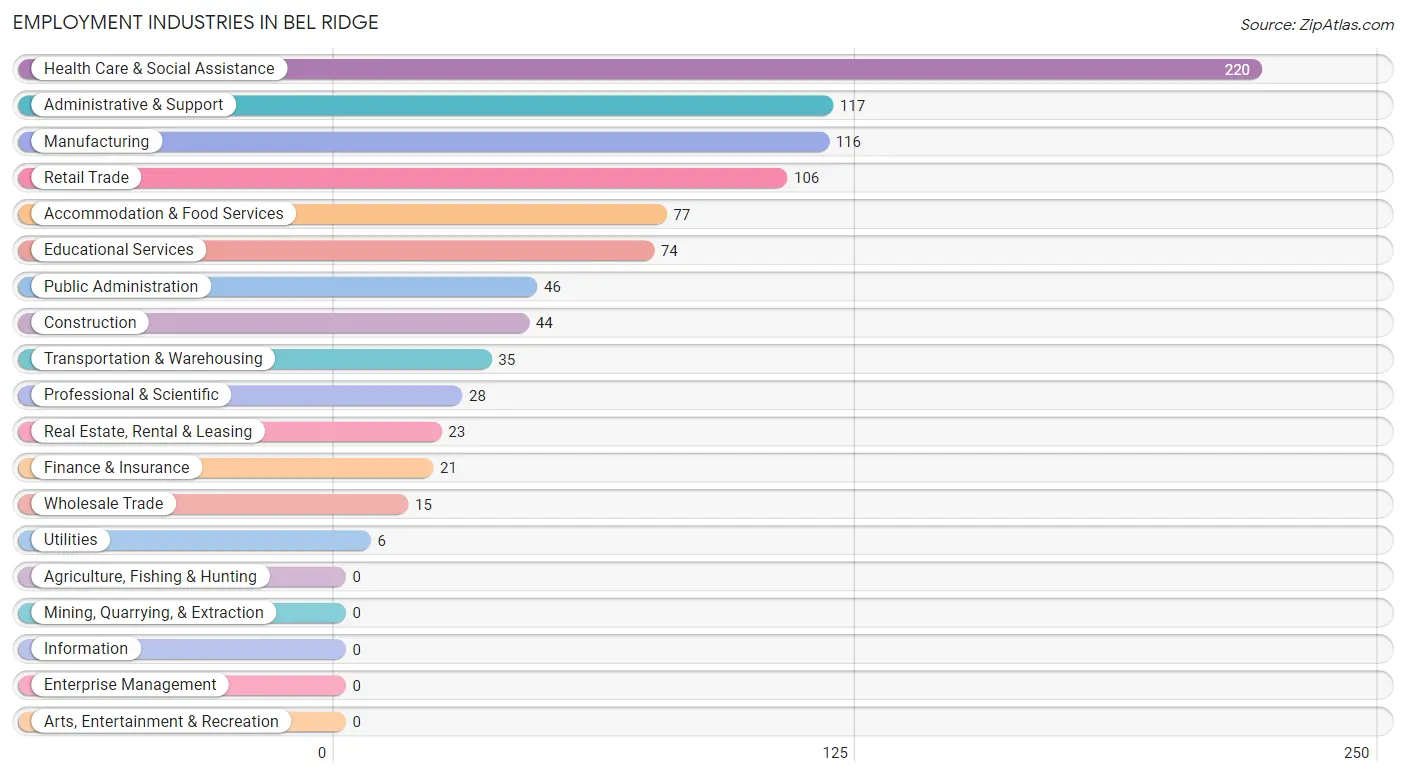
Employment Industries in Bel Ridge
The major employment industries in Bel Ridge include Health Care & Social Assistance (220 | 22.4%), Administrative & Support (117 | 11.9%), Manufacturing (116 | 11.8%), Retail Trade (106 | 10.8%), and Accommodation & Food Services (77 | 7.8%).
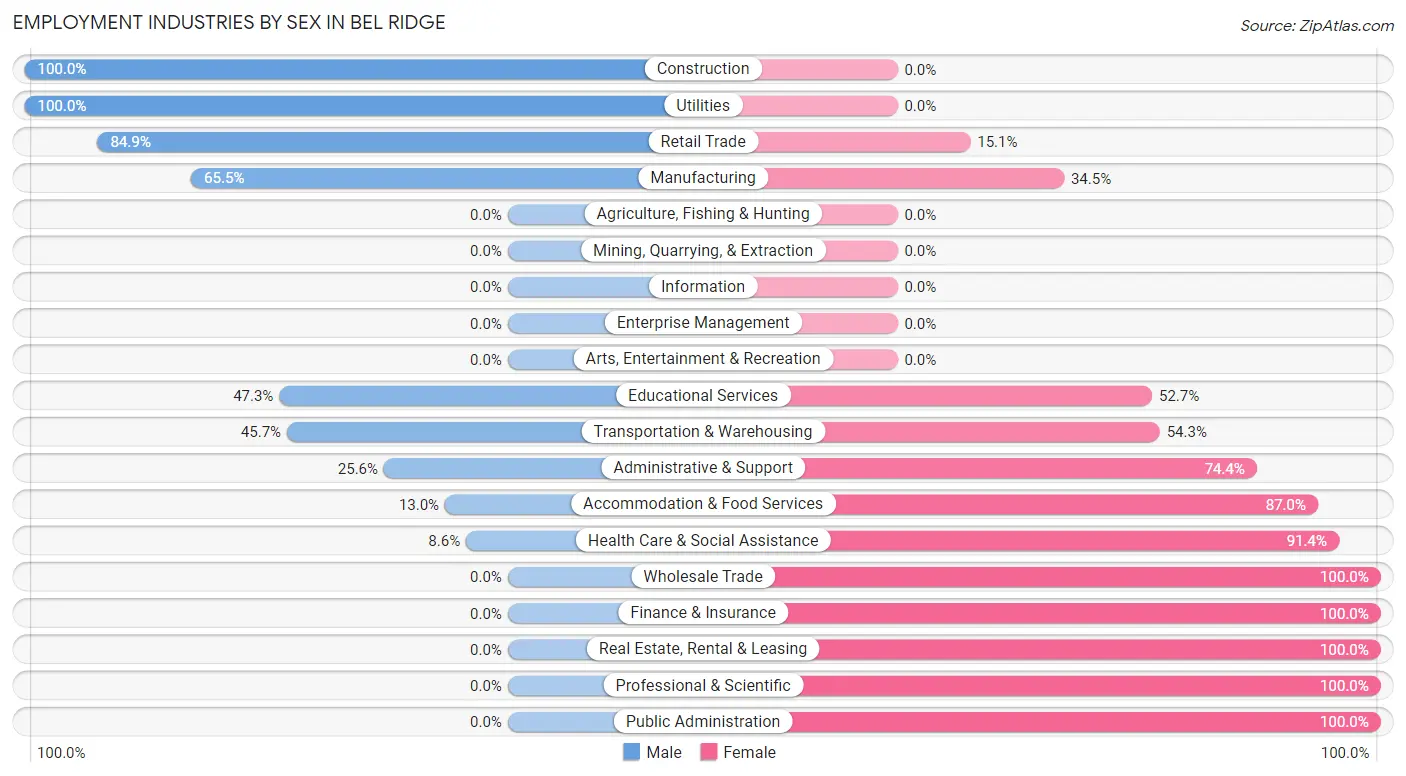
Employment Industries by Sex in Bel Ridge
The Bel Ridge industries that see more men than women are Construction (100.0%), Utilities (100.0%), and Retail Trade (84.9%), whereas the industries that tend to have a higher number of women are Wholesale Trade (100.0%), Finance & Insurance (100.0%), and Real Estate, Rental & Leasing (100.0%).
| Industry | Male | Female |
| Agriculture, Fishing & Hunting | 0 (0.0%) | 0 (0.0%) |
| Mining, Quarrying, & Extraction | 0 (0.0%) | 0 (0.0%) |
| Construction | 44 (100.0%) | 0 (0.0%) |
| Manufacturing | 76 (65.5%) | 40 (34.5%) |
| Wholesale Trade | 0 (0.0%) | 15 (100.0%) |
| Retail Trade | 90 (84.9%) | 16 (15.1%) |
| Transportation & Warehousing | 16 (45.7%) | 19 (54.3%) |
| Utilities | 6 (100.0%) | 0 (0.0%) |
| Information | 0 (0.0%) | 0 (0.0%) |
| Finance & Insurance | 0 (0.0%) | 21 (100.0%) |
| Real Estate, Rental & Leasing | 0 (0.0%) | 23 (100.0%) |
| Professional & Scientific | 0 (0.0%) | 28 (100.0%) |
| Enterprise Management | 0 (0.0%) | 0 (0.0%) |
| Administrative & Support | 30 (25.6%) | 87 (74.4%) |
| Educational Services | 35 (47.3%) | 39 (52.7%) |
| Health Care & Social Assistance | 19 (8.6%) | 201 (91.4%) |
| Arts, Entertainment & Recreation | 0 (0.0%) | 0 (0.0%) |
| Accommodation & Food Services | 10 (13.0%) | 67 (87.0%) |
| Public Administration | 0 (0.0%) | 46 (100.0%) |
| Total | 349 (35.5%) | 635 (64.5%) |
Education in Bel Ridge
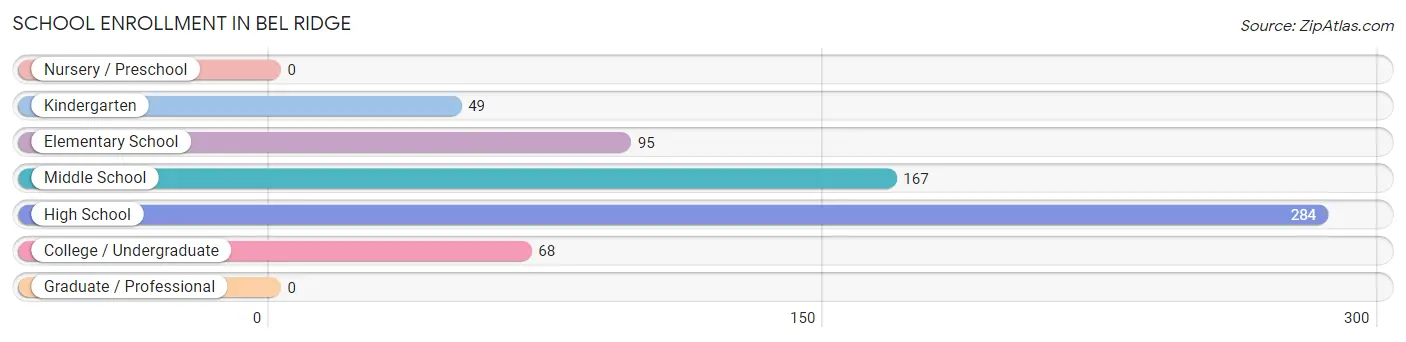
School Enrollment in Bel Ridge
The most common levels of schooling among the 663 students in Bel Ridge are high school (284 | 42.8%), middle school (167 | 25.2%), and elementary school (95 | 14.3%).
| School Level | # Students | % Students |
| Nursery / Preschool | 0 | 0.0% |
| Kindergarten | 49 | 7.4% |
| Elementary School | 95 | 14.3% |
| Middle School | 167 | 25.2% |
| High School | 284 | 42.8% |
| College / Undergraduate | 68 | 10.3% |
| Graduate / Professional | 0 | 0.0% |
| Total | 663 | 100.0% |
School Enrollment by Age by Funding Source in Bel Ridge
Out of a total of 663 students who are enrolled in schools in Bel Ridge, 41 (6.2%) attend a private institution, while the remaining 622 (93.8%) are enrolled in public schools. The age group of 20 to 24 year olds has the highest likelihood of being enrolled in private schools, with 41 (67.2% in the age bracket) enrolled. Conversely, the age group of 5 to 9 year old has the lowest likelihood of being enrolled in a private school, with 125 (100.0% in the age bracket) attending a public institution.
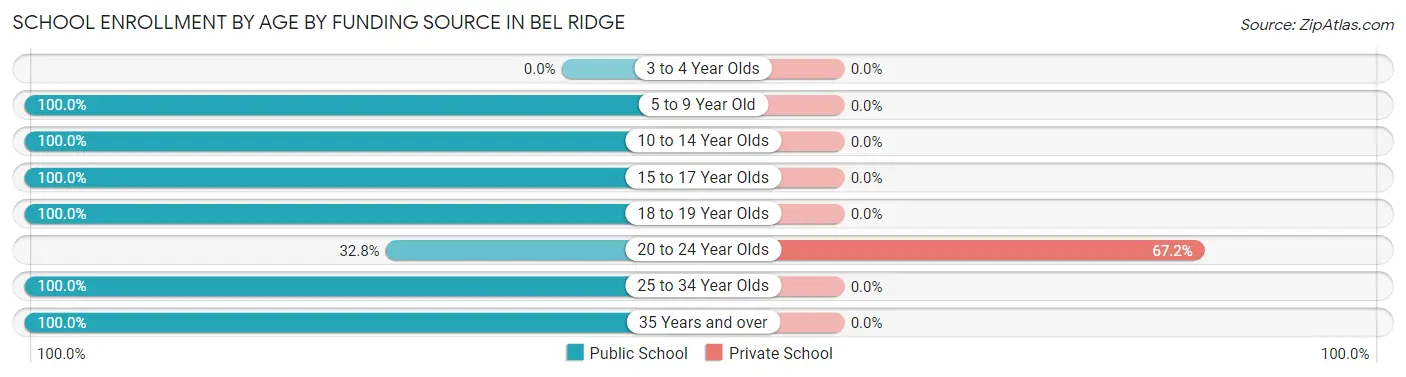
| Age Bracket | Public School | Private School |
| 3 to 4 Year Olds | 0 (0.0%) | 0 (0.0%) |
| 5 to 9 Year Old | 125 (100.0%) | 0 (0.0%) |
| 10 to 14 Year Olds | 202 (100.0%) | 0 (0.0%) |
| 15 to 17 Year Olds | 238 (100.0%) | 0 (0.0%) |
| 18 to 19 Year Olds | 19 (100.0%) | 0 (0.0%) |
| 20 to 24 Year Olds | 20 (32.8%) | 41 (67.2%) |
| 25 to 34 Year Olds | 7 (100.0%) | 0 (0.0%) |
| 35 Years and over | 11 (100.0%) | 0 (0.0%) |
| Total | 622 (93.8%) | 41 (6.2%) |
Educational Attainment by Field of Study in Bel Ridge
Communications (61 | 26.4%), arts & humanities (58 | 25.1%), social sciences (44 | 19.1%), science & technology (21 | 9.1%), and psychology (17 | 7.4%) are the most common fields of study among 231 individuals in Bel Ridge who have obtained a bachelor's degree or higher.
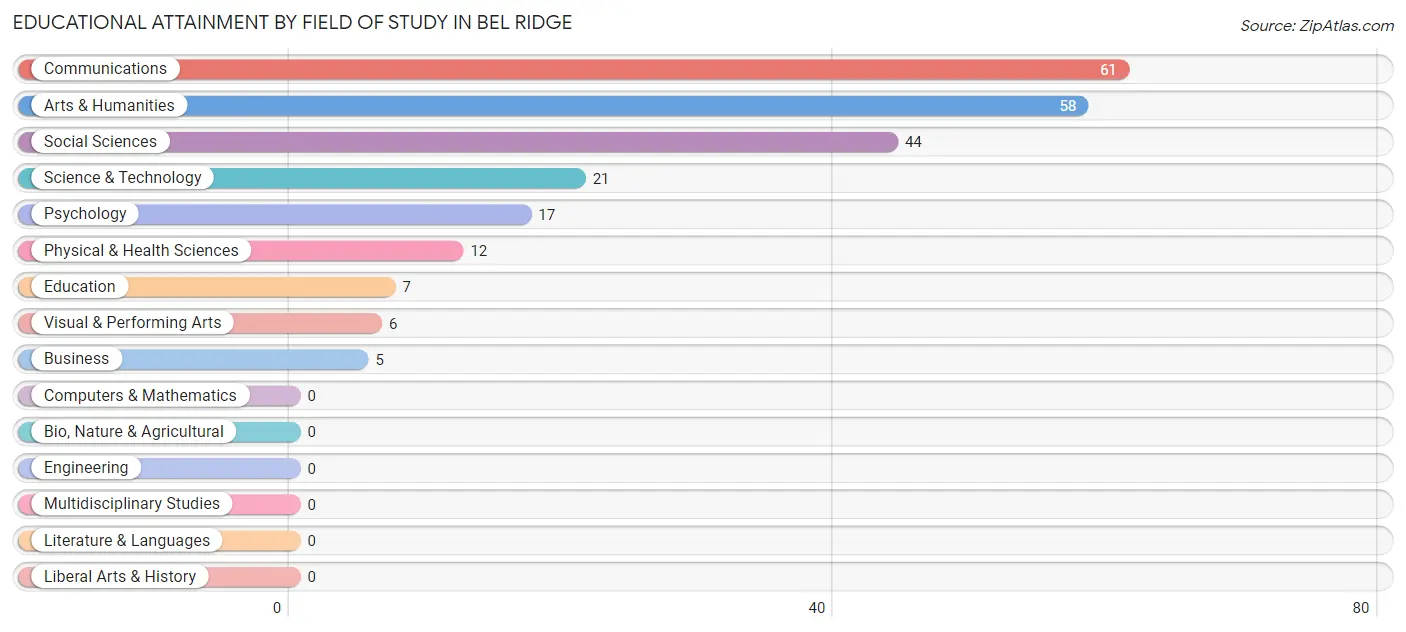
| Field of Study | # Graduates | % Graduates |
| Computers & Mathematics | 0 | 0.0% |
| Bio, Nature & Agricultural | 0 | 0.0% |
| Physical & Health Sciences | 12 | 5.2% |
| Psychology | 17 | 7.4% |
| Social Sciences | 44 | 19.1% |
| Engineering | 0 | 0.0% |
| Multidisciplinary Studies | 0 | 0.0% |
| Science & Technology | 21 | 9.1% |
| Business | 5 | 2.2% |
| Education | 7 | 3.0% |
| Literature & Languages | 0 | 0.0% |
| Liberal Arts & History | 0 | 0.0% |
| Visual & Performing Arts | 6 | 2.6% |
| Communications | 61 | 26.4% |
| Arts & Humanities | 58 | 25.1% |
| Total | 231 | 100.0% |
Transportation & Commute in Bel Ridge
Vehicle Availability by Sex in Bel Ridge
The most prevalent vehicle ownership categories in Bel Ridge are males with 2 vehicles (184, accounting for 52.7%) and females with 2 vehicles (140, making up 29.2%).
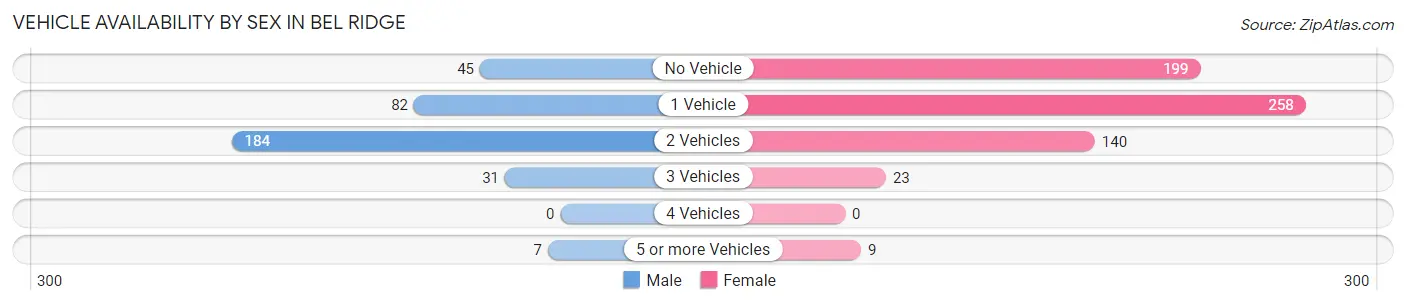
| Vehicles Available | Male | Female |
| No Vehicle | 45 (12.9%) | 199 (31.6%) |
| 1 Vehicle | 82 (23.5%) | 258 (41.0%) |
| 2 Vehicles | 184 (52.7%) | 140 (22.3%) |
| 3 Vehicles | 31 (8.9%) | 23 (3.7%) |
| 4 Vehicles | 0 (0.0%) | 0 (0.0%) |
| 5 or more Vehicles | 7 (2.0%) | 9 (1.4%) |
| Total | 349 (100.0%) | 629 (100.0%) |
Commute Time in Bel Ridge
The most frequently occuring commute durations in Bel Ridge are 30 to 34 minutes (219 commuters, 23.9%), 20 to 24 minutes (151 commuters, 16.5%), and 10 to 14 minutes (135 commuters, 14.7%).
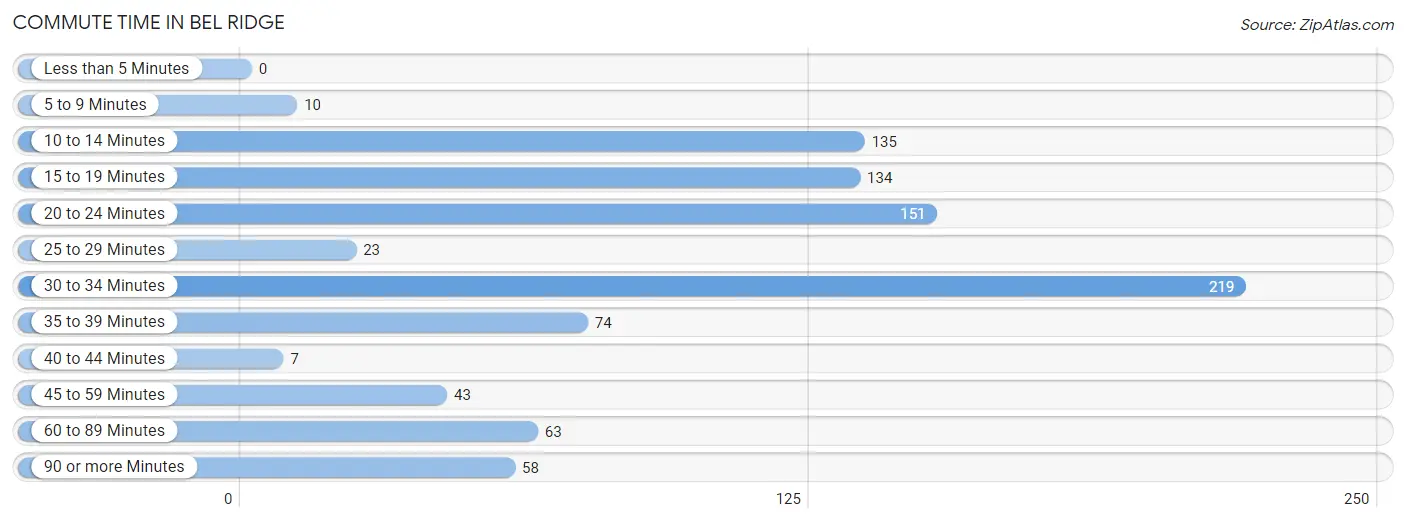
| Commute Time | # Commuters | % Commuters |
| Less than 5 Minutes | 0 | 0.0% |
| 5 to 9 Minutes | 10 | 1.1% |
| 10 to 14 Minutes | 135 | 14.7% |
| 15 to 19 Minutes | 134 | 14.6% |
| 20 to 24 Minutes | 151 | 16.5% |
| 25 to 29 Minutes | 23 | 2.5% |
| 30 to 34 Minutes | 219 | 23.9% |
| 35 to 39 Minutes | 74 | 8.1% |
| 40 to 44 Minutes | 7 | 0.8% |
| 45 to 59 Minutes | 43 | 4.7% |
| 60 to 89 Minutes | 63 | 6.9% |
| 90 or more Minutes | 58 | 6.3% |
Commute Time by Sex in Bel Ridge
The most common commute times in Bel Ridge are 10 to 14 minutes (87 commuters, 27.1%) for males and 30 to 34 minutes (139 commuters, 23.3%) for females.
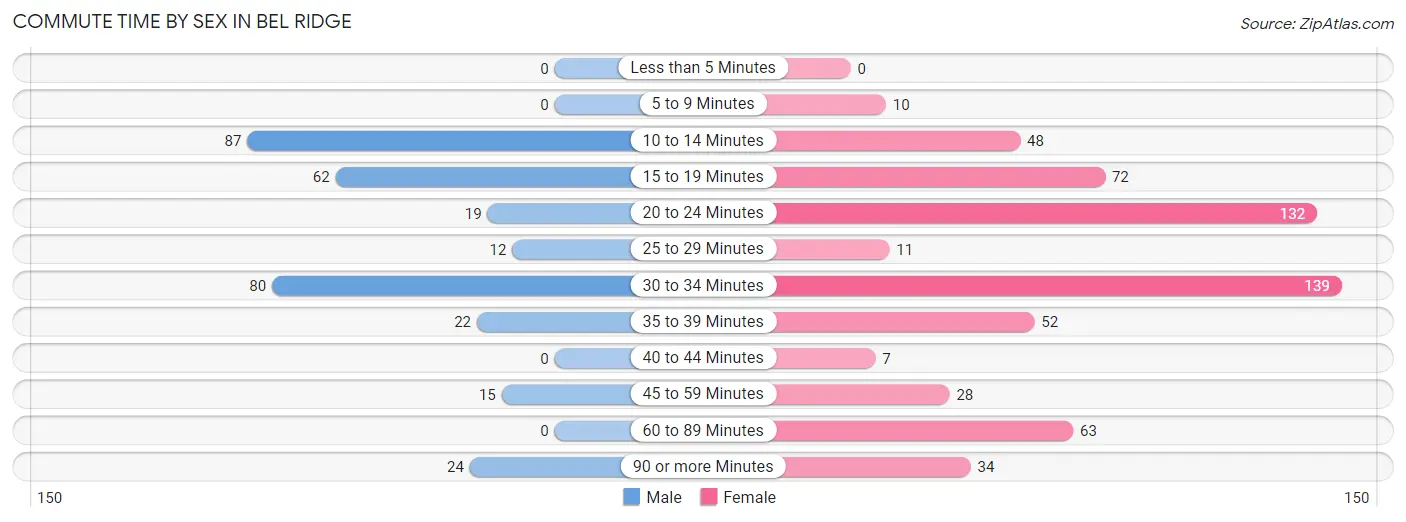
| Commute Time | Male | Female |
| Less than 5 Minutes | 0 (0.0%) | 0 (0.0%) |
| 5 to 9 Minutes | 0 (0.0%) | 10 (1.7%) |
| 10 to 14 Minutes | 87 (27.1%) | 48 (8.1%) |
| 15 to 19 Minutes | 62 (19.3%) | 72 (12.1%) |
| 20 to 24 Minutes | 19 (5.9%) | 132 (22.2%) |
| 25 to 29 Minutes | 12 (3.7%) | 11 (1.8%) |
| 30 to 34 Minutes | 80 (24.9%) | 139 (23.3%) |
| 35 to 39 Minutes | 22 (6.9%) | 52 (8.7%) |
| 40 to 44 Minutes | 0 (0.0%) | 7 (1.2%) |
| 45 to 59 Minutes | 15 (4.7%) | 28 (4.7%) |
| 60 to 89 Minutes | 0 (0.0%) | 63 (10.6%) |
| 90 or more Minutes | 24 (7.5%) | 34 (5.7%) |
Time of Departure to Work by Sex in Bel Ridge
The most frequent times of departure to work in Bel Ridge are 7:30 AM to 7:59 AM (77, 24.0%) for males and 8:00 AM to 8:29 AM (114, 19.1%) for females.
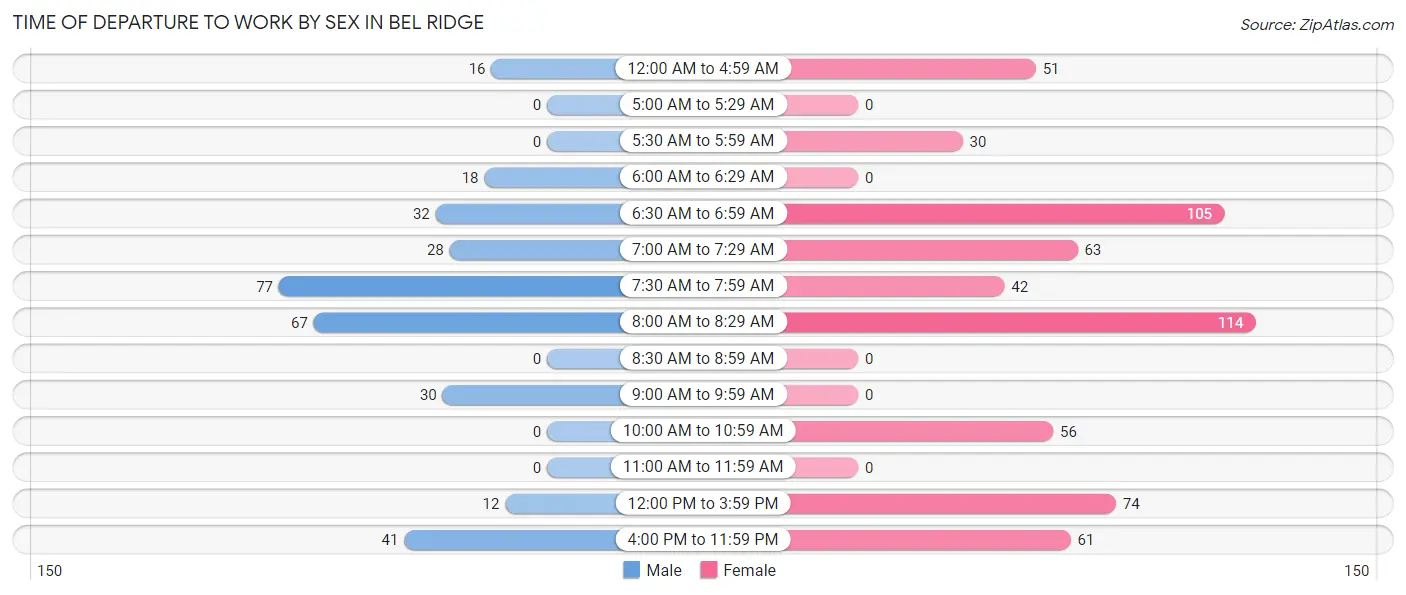
| Time of Departure | Male | Female |
| 12:00 AM to 4:59 AM | 16 (5.0%) | 51 (8.6%) |
| 5:00 AM to 5:29 AM | 0 (0.0%) | 0 (0.0%) |
| 5:30 AM to 5:59 AM | 0 (0.0%) | 30 (5.0%) |
| 6:00 AM to 6:29 AM | 18 (5.6%) | 0 (0.0%) |
| 6:30 AM to 6:59 AM | 32 (10.0%) | 105 (17.6%) |
| 7:00 AM to 7:29 AM | 28 (8.7%) | 63 (10.6%) |
| 7:30 AM to 7:59 AM | 77 (24.0%) | 42 (7.0%) |
| 8:00 AM to 8:29 AM | 67 (20.9%) | 114 (19.1%) |
| 8:30 AM to 8:59 AM | 0 (0.0%) | 0 (0.0%) |
| 9:00 AM to 9:59 AM | 30 (9.3%) | 0 (0.0%) |
| 10:00 AM to 10:59 AM | 0 (0.0%) | 56 (9.4%) |
| 11:00 AM to 11:59 AM | 0 (0.0%) | 0 (0.0%) |
| 12:00 PM to 3:59 PM | 12 (3.7%) | 74 (12.4%) |
| 4:00 PM to 11:59 PM | 41 (12.8%) | 61 (10.2%) |
| Total | 321 (100.0%) | 596 (100.0%) |
Housing Occupancy in Bel Ridge
Occupancy by Ownership in Bel Ridge
Of the total 951 dwellings in Bel Ridge, owner-occupied units account for 386 (40.6%), while renter-occupied units make up 565 (59.4%).
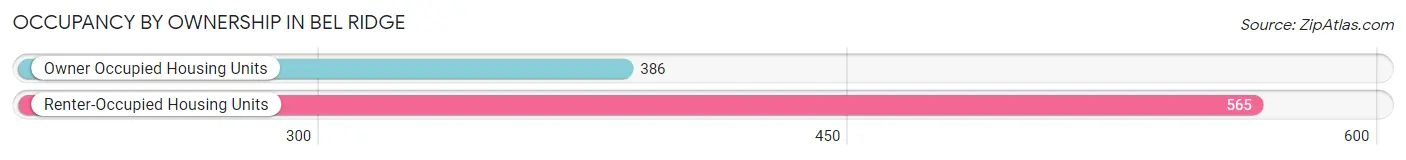
| Occupancy | # Housing Units | % Housing Units |
| Owner Occupied Housing Units | 386 | 40.6% |
| Renter-Occupied Housing Units | 565 | 59.4% |
| Total Occupied Housing Units | 951 | 100.0% |
Occupancy by Household Size in Bel Ridge
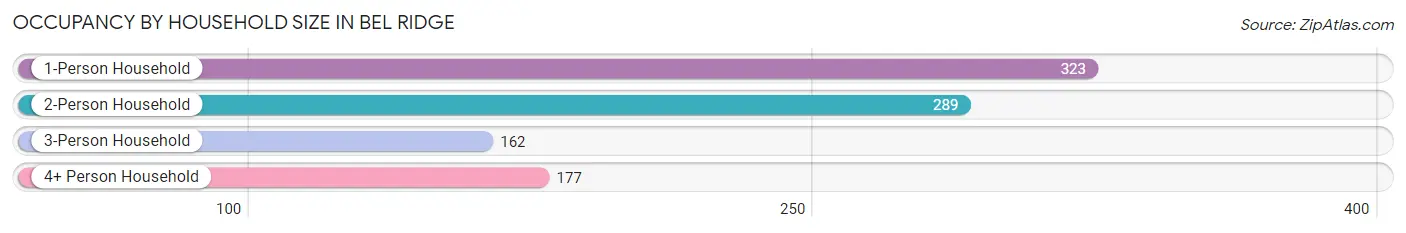
| Household Size | # Housing Units | % Housing Units |
| 1-Person Household | 323 | 34.0% |
| 2-Person Household | 289 | 30.4% |
| 3-Person Household | 162 | 17.0% |
| 4+ Person Household | 177 | 18.6% |
| Total Housing Units | 951 | 100.0% |
Occupancy by Ownership by Household Size in Bel Ridge
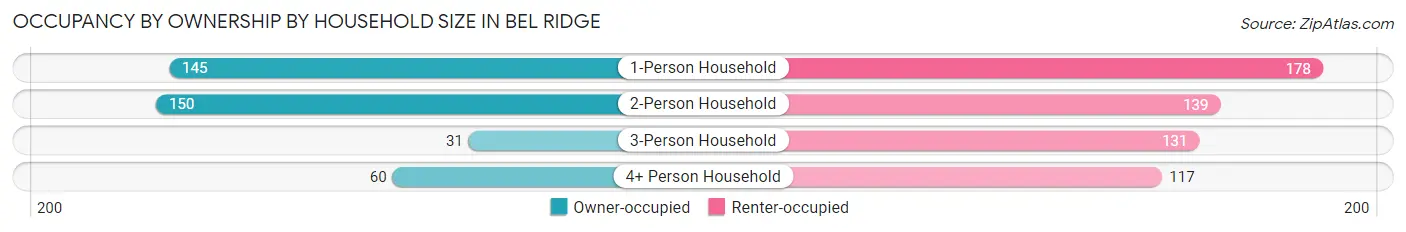
| Household Size | Owner-occupied | Renter-occupied |
| 1-Person Household | 145 (44.9%) | 178 (55.1%) |
| 2-Person Household | 150 (51.9%) | 139 (48.1%) |
| 3-Person Household | 31 (19.1%) | 131 (80.9%) |
| 4+ Person Household | 60 (33.9%) | 117 (66.1%) |
| Total Housing Units | 386 (40.6%) | 565 (59.4%) |
Occupancy by Educational Attainment in Bel Ridge
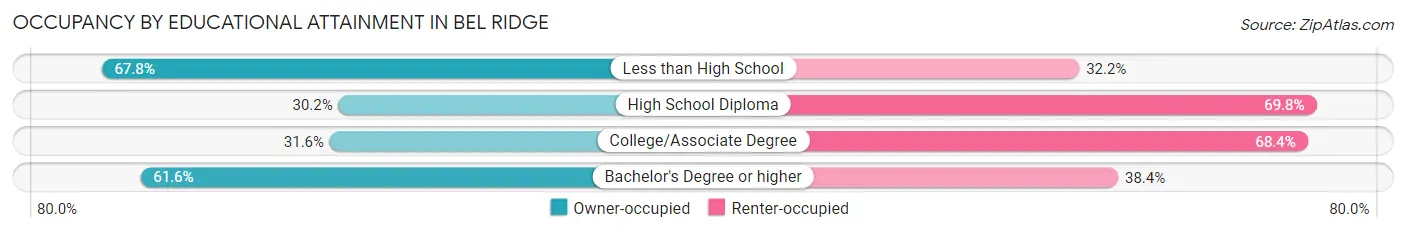
| Household Size | Owner-occupied | Renter-occupied |
| Less than High School | 80 (67.8%) | 38 (32.2%) |
| High School Diploma | 106 (30.2%) | 245 (69.8%) |
| College/Associate Degree | 102 (31.6%) | 221 (68.4%) |
| Bachelor's Degree or higher | 98 (61.6%) | 61 (38.4%) |
Occupancy by Age of Householder in Bel Ridge
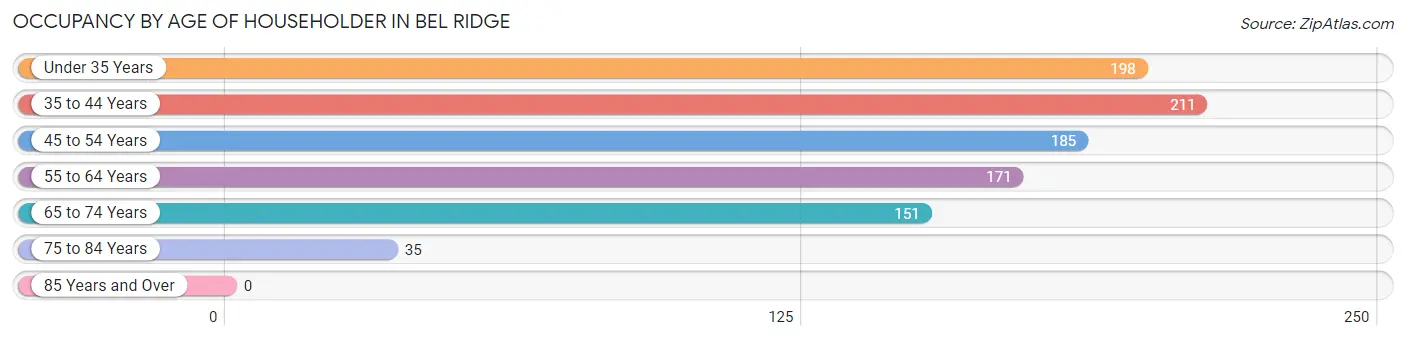
| Age Bracket | # Households | % Households |
| Under 35 Years | 198 | 20.8% |
| 35 to 44 Years | 211 | 22.2% |
| 45 to 54 Years | 185 | 19.5% |
| 55 to 64 Years | 171 | 18.0% |
| 65 to 74 Years | 151 | 15.9% |
| 75 to 84 Years | 35 | 3.7% |
| 85 Years and Over | 0 | 0.0% |
| Total | 951 | 100.0% |
Housing Finances in Bel Ridge
Median Income by Occupancy in Bel Ridge
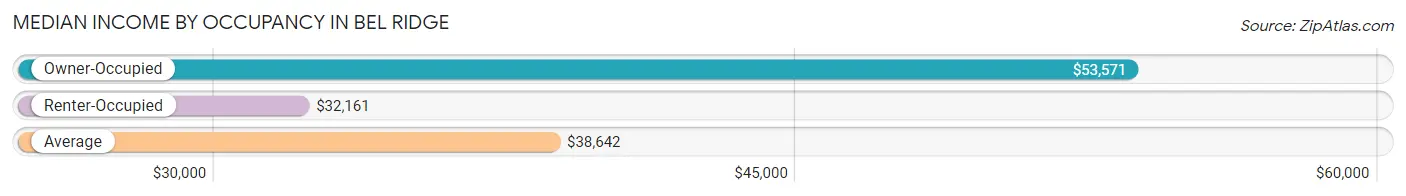
| Occupancy Type | # Households | Median Income |
| Owner-Occupied | 386 (40.6%) | $53,571 |
| Renter-Occupied | 565 (59.4%) | $32,161 |
| Average | 951 (100.0%) | $38,642 |
Occupancy by Householder Income Bracket in Bel Ridge
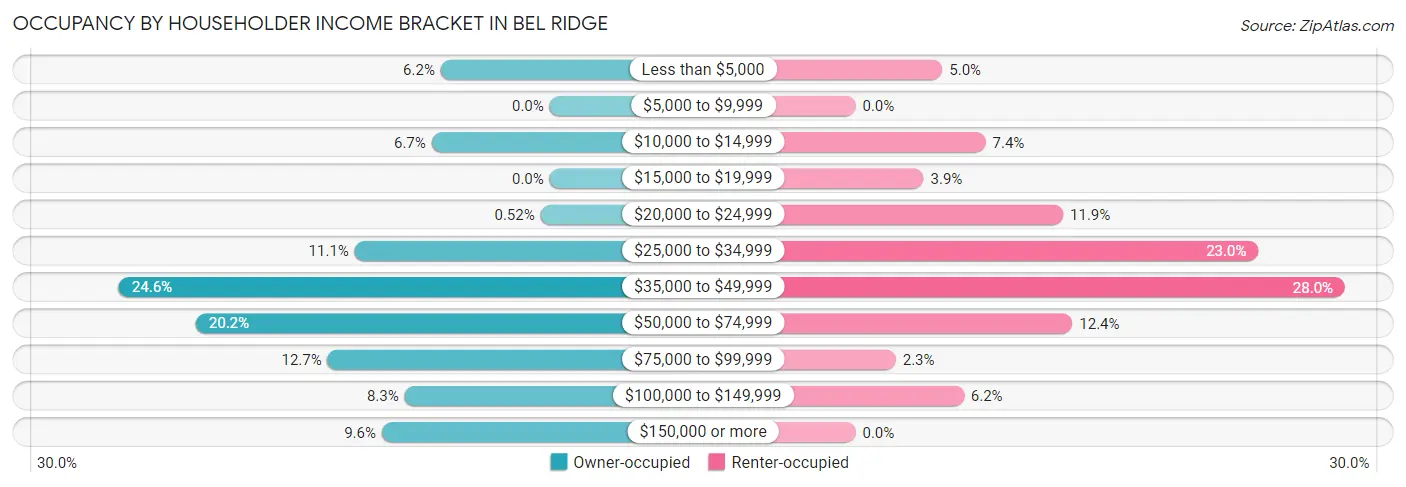
| Income Bracket | Owner-occupied | Renter-occupied |
| Less than $5,000 | 24 (6.2%) | 28 (5.0%) |
| $5,000 to $9,999 | 0 (0.0%) | 0 (0.0%) |
| $10,000 to $14,999 | 26 (6.7%) | 42 (7.4%) |
| $15,000 to $19,999 | 0 (0.0%) | 22 (3.9%) |
| $20,000 to $24,999 | 2 (0.5%) | 67 (11.9%) |
| $25,000 to $34,999 | 43 (11.1%) | 130 (23.0%) |
| $35,000 to $49,999 | 95 (24.6%) | 158 (28.0%) |
| $50,000 to $74,999 | 78 (20.2%) | 70 (12.4%) |
| $75,000 to $99,999 | 49 (12.7%) | 13 (2.3%) |
| $100,000 to $149,999 | 32 (8.3%) | 35 (6.2%) |
| $150,000 or more | 37 (9.6%) | 0 (0.0%) |
| Total | 386 (100.0%) | 565 (100.0%) |
Monthly Housing Cost Tiers in Bel Ridge
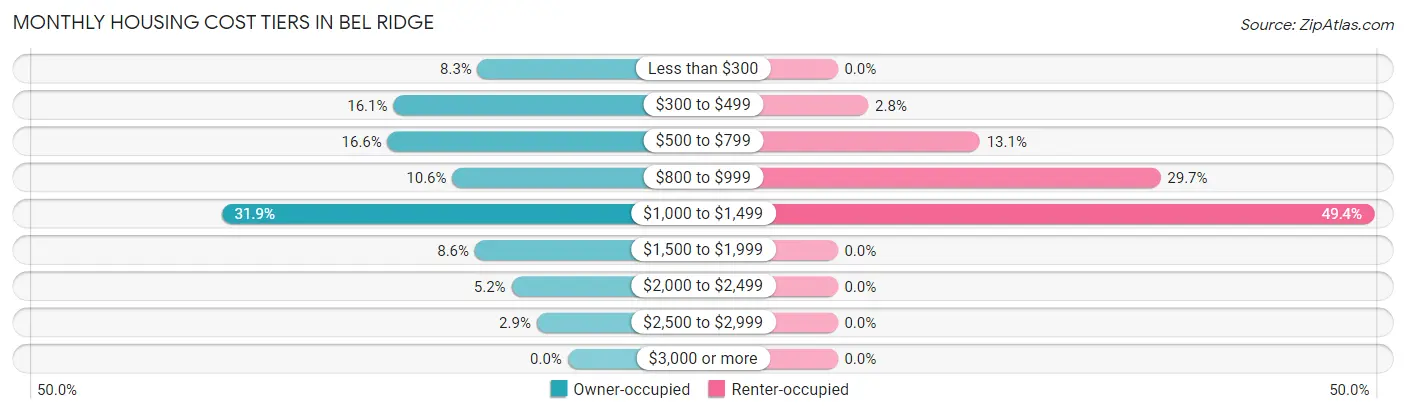
| Monthly Cost | Owner-occupied | Renter-occupied |
| Less than $300 | 32 (8.3%) | 0 (0.0%) |
| $300 to $499 | 62 (16.1%) | 16 (2.8%) |
| $500 to $799 | 64 (16.6%) | 74 (13.1%) |
| $800 to $999 | 41 (10.6%) | 168 (29.7%) |
| $1,000 to $1,499 | 123 (31.9%) | 279 (49.4%) |
| $1,500 to $1,999 | 33 (8.6%) | 0 (0.0%) |
| $2,000 to $2,499 | 20 (5.2%) | 0 (0.0%) |
| $2,500 to $2,999 | 11 (2.9%) | 0 (0.0%) |
| $3,000 or more | 0 (0.0%) | 0 (0.0%) |
| Total | 386 (100.0%) | 565 (100.0%) |
Physical Housing Characteristics in Bel Ridge
Housing Structures in Bel Ridge
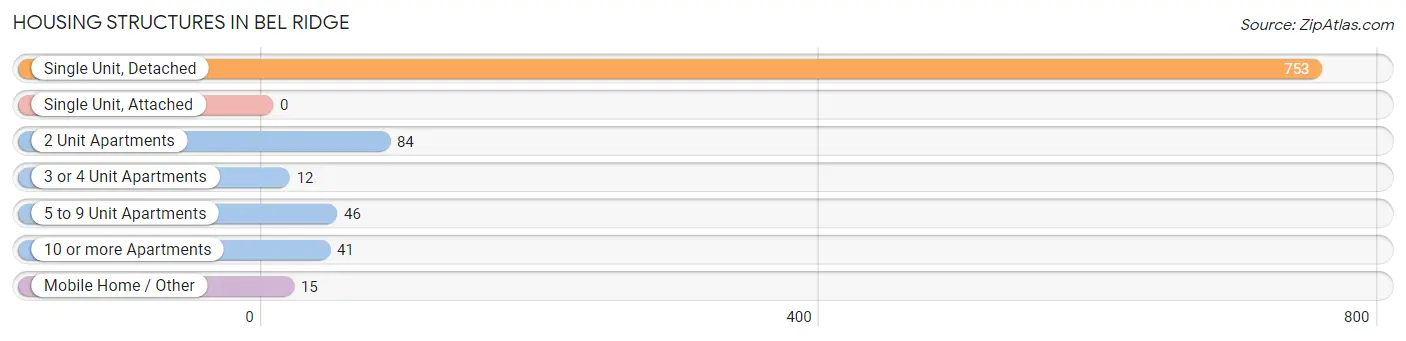
| Structure Type | # Housing Units | % Housing Units |
| Single Unit, Detached | 753 | 79.2% |
| Single Unit, Attached | 0 | 0.0% |
| 2 Unit Apartments | 84 | 8.8% |
| 3 or 4 Unit Apartments | 12 | 1.3% |
| 5 to 9 Unit Apartments | 46 | 4.8% |
| 10 or more Apartments | 41 | 4.3% |
| Mobile Home / Other | 15 | 1.6% |
| Total | 951 | 100.0% |
Housing Structures by Occupancy in Bel Ridge
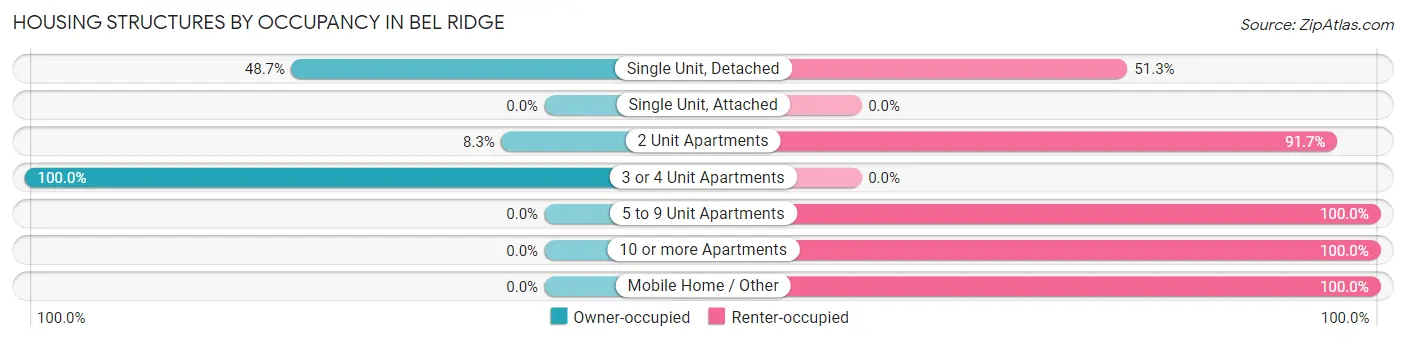
| Structure Type | Owner-occupied | Renter-occupied |
| Single Unit, Detached | 367 (48.7%) | 386 (51.3%) |
| Single Unit, Attached | 0 (0.0%) | 0 (0.0%) |
| 2 Unit Apartments | 7 (8.3%) | 77 (91.7%) |
| 3 or 4 Unit Apartments | 12 (100.0%) | 0 (0.0%) |
| 5 to 9 Unit Apartments | 0 (0.0%) | 46 (100.0%) |
| 10 or more Apartments | 0 (0.0%) | 41 (100.0%) |
| Mobile Home / Other | 0 (0.0%) | 15 (100.0%) |
| Total | 386 (40.6%) | 565 (59.4%) |
Housing Structures by Number of Rooms in Bel Ridge
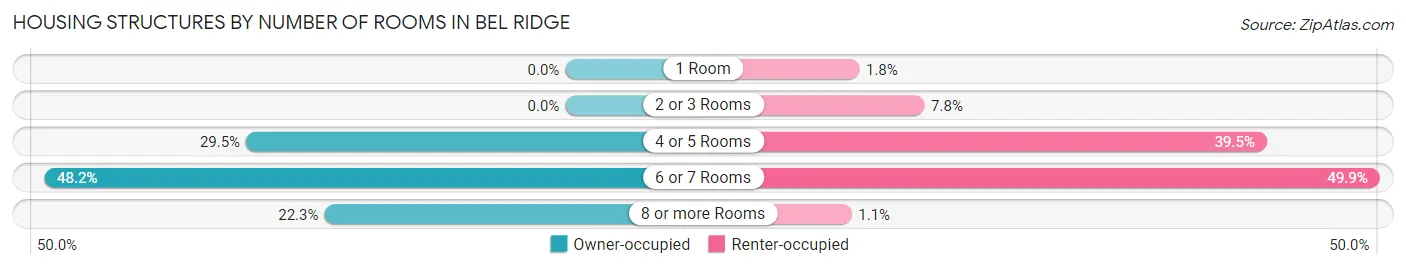
| Number of Rooms | Owner-occupied | Renter-occupied |
| 1 Room | 0 (0.0%) | 10 (1.8%) |
| 2 or 3 Rooms | 0 (0.0%) | 44 (7.8%) |
| 4 or 5 Rooms | 114 (29.5%) | 223 (39.5%) |
| 6 or 7 Rooms | 186 (48.2%) | 282 (49.9%) |
| 8 or more Rooms | 86 (22.3%) | 6 (1.1%) |
| Total | 386 (100.0%) | 565 (100.0%) |
Housing Structure by Heating Type in Bel Ridge
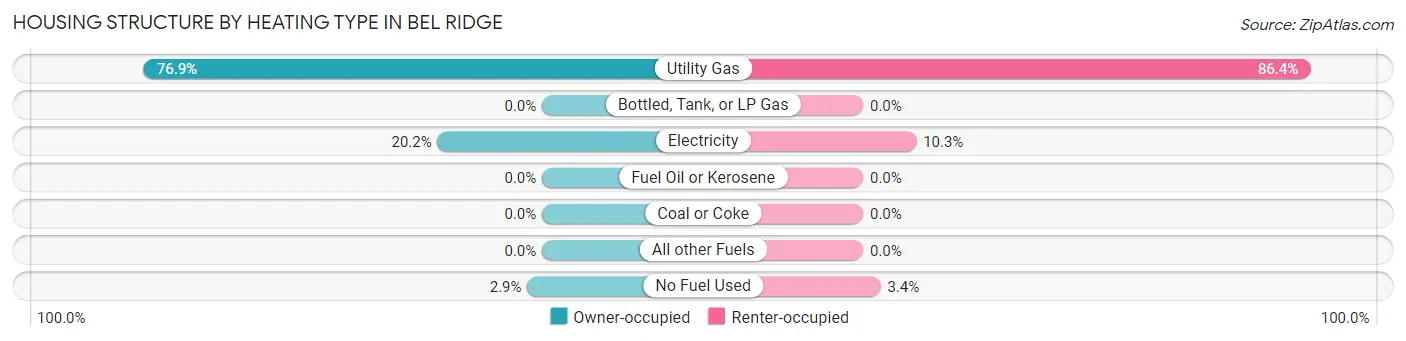
| Heating Type | Owner-occupied | Renter-occupied |
| Utility Gas | 297 (76.9%) | 488 (86.4%) |
| Bottled, Tank, or LP Gas | 0 (0.0%) | 0 (0.0%) |
| Electricity | 78 (20.2%) | 58 (10.3%) |
| Fuel Oil or Kerosene | 0 (0.0%) | 0 (0.0%) |
| Coal or Coke | 0 (0.0%) | 0 (0.0%) |
| All other Fuels | 0 (0.0%) | 0 (0.0%) |
| No Fuel Used | 11 (2.9%) | 19 (3.4%) |
| Total | 386 (100.0%) | 565 (100.0%) |
Household Vehicle Usage in Bel Ridge
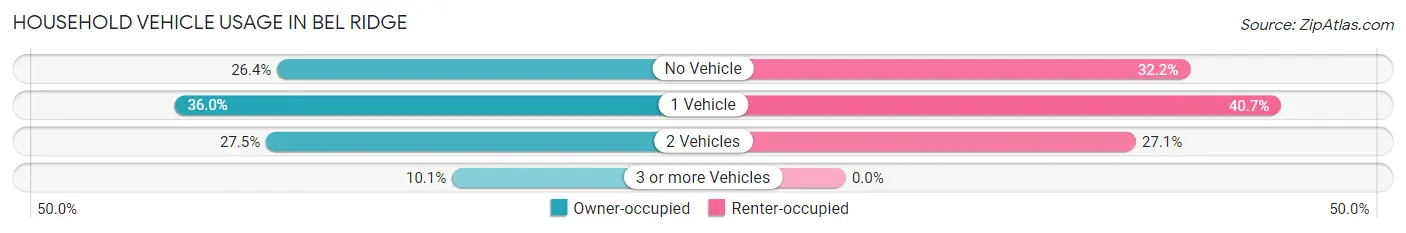
| Vehicles per Household | Owner-occupied | Renter-occupied |
| No Vehicle | 102 (26.4%) | 182 (32.2%) |
| 1 Vehicle | 139 (36.0%) | 230 (40.7%) |
| 2 Vehicles | 106 (27.5%) | 153 (27.1%) |
| 3 or more Vehicles | 39 (10.1%) | 0 (0.0%) |
| Total | 386 (100.0%) | 565 (100.0%) |
Real Estate & Mortgages in Bel Ridge
Real Estate and Mortgage Overview in Bel Ridge
| Characteristic | Without Mortgage | With Mortgage |
| Housing Units | 109 | 277 |
| Median Property Value | $76,800 | $87,600 |
| Median Household Income | $67,266 | $34 |
| Monthly Housing Costs | $401 | $0 |
| Real Estate Taxes | $1,199 | $0 |
Property Value by Mortgage Status in Bel Ridge
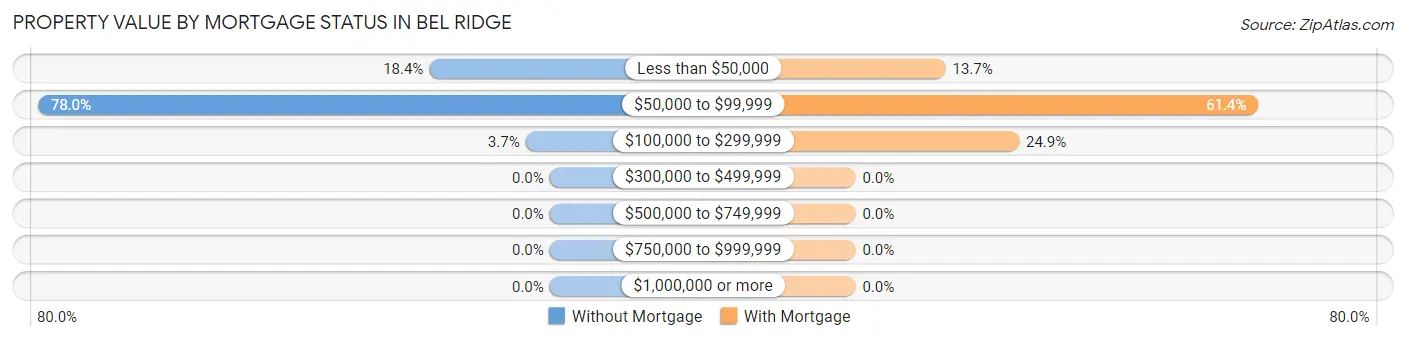
| Property Value | Without Mortgage | With Mortgage |
| Less than $50,000 | 20 (18.3%) | 38 (13.7%) |
| $50,000 to $99,999 | 85 (78.0%) | 170 (61.4%) |
| $100,000 to $299,999 | 4 (3.7%) | 69 (24.9%) |
| $300,000 to $499,999 | 0 (0.0%) | 0 (0.0%) |
| $500,000 to $749,999 | 0 (0.0%) | 0 (0.0%) |
| $750,000 to $999,999 | 0 (0.0%) | 0 (0.0%) |
| $1,000,000 or more | 0 (0.0%) | 0 (0.0%) |
| Total | 109 (100.0%) | 277 (100.0%) |
Household Income by Mortgage Status in Bel Ridge
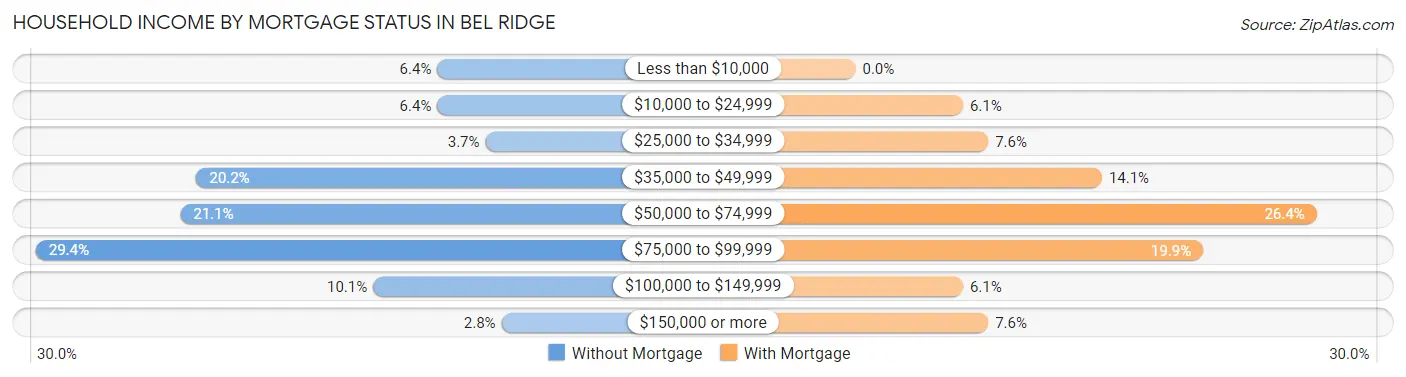
| Household Income | Without Mortgage | With Mortgage |
| Less than $10,000 | 7 (6.4%) | 0 (0.0%) |
| $10,000 to $24,999 | 7 (6.4%) | 17 (6.1%) |
| $25,000 to $34,999 | 4 (3.7%) | 21 (7.6%) |
| $35,000 to $49,999 | 22 (20.2%) | 39 (14.1%) |
| $50,000 to $74,999 | 23 (21.1%) | 73 (26.4%) |
| $75,000 to $99,999 | 32 (29.4%) | 55 (19.9%) |
| $100,000 to $149,999 | 11 (10.1%) | 17 (6.1%) |
| $150,000 or more | 3 (2.8%) | 21 (7.6%) |
| Total | 109 (100.0%) | 277 (100.0%) |
Property Value to Household Income Ratio in Bel Ridge
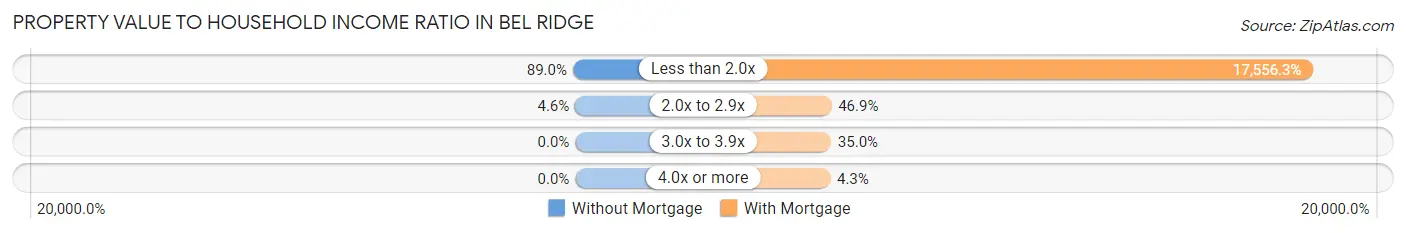
| Value-to-Income Ratio | Without Mortgage | With Mortgage |
| Less than 2.0x | 97 (89.0%) | 48,631 (17,556.3%) |
| 2.0x to 2.9x | 5 (4.6%) | 130 (46.9%) |
| 3.0x to 3.9x | 0 (0.0%) | 97 (35.0%) |
| 4.0x or more | 0 (0.0%) | 12 (4.3%) |
| Total | 109 (100.0%) | 277 (100.0%) |
Real Estate Taxes by Mortgage Status in Bel Ridge

| Property Taxes | Without Mortgage | With Mortgage |
| Less than $800 | 0 (0.0%) | 0 (0.0%) |
| $800 to $1,499 | 90 (82.6%) | 6 (2.2%) |
| $800 to $1,499 | 19 (17.4%) | 107 (38.6%) |
| Total | 109 (100.0%) | 277 (100.0%) |
Health & Disability in Bel Ridge
Health Insurance Coverage by Age in Bel Ridge
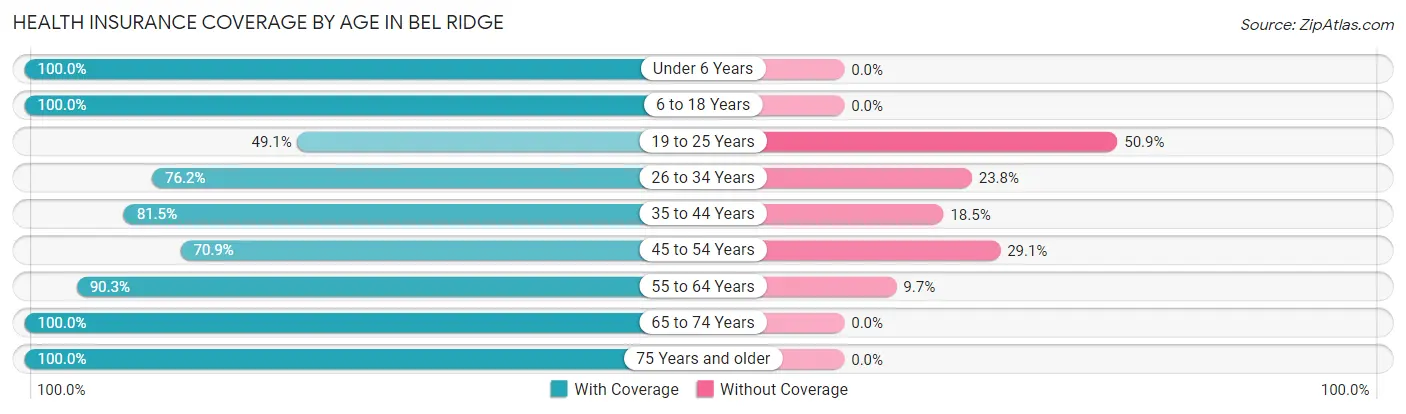
| Age Bracket | With Coverage | Without Coverage |
| Under 6 Years | 246 (100.0%) | 0 (0.0%) |
| 6 to 18 Years | 637 (100.0%) | 0 (0.0%) |
| 19 to 25 Years | 188 (49.1%) | 195 (50.9%) |
| 26 to 34 Years | 266 (76.2%) | 83 (23.8%) |
| 35 to 44 Years | 304 (81.5%) | 69 (18.5%) |
| 45 to 54 Years | 161 (70.9%) | 66 (29.1%) |
| 55 to 64 Years | 195 (90.3%) | 21 (9.7%) |
| 65 to 74 Years | 196 (100.0%) | 0 (0.0%) |
| 75 Years and older | 60 (100.0%) | 0 (0.0%) |
| Total | 2,253 (83.9%) | 434 (16.2%) |
Health Insurance Coverage by Citizenship Status in Bel Ridge

| Citizenship Status | With Coverage | Without Coverage |
| Native Born | 246 (100.0%) | 0 (0.0%) |
| Foreign Born, Citizen | 637 (100.0%) | 0 (0.0%) |
| Foreign Born, not a Citizen | 188 (49.1%) | 195 (50.9%) |
Health Insurance Coverage by Household Income in Bel Ridge
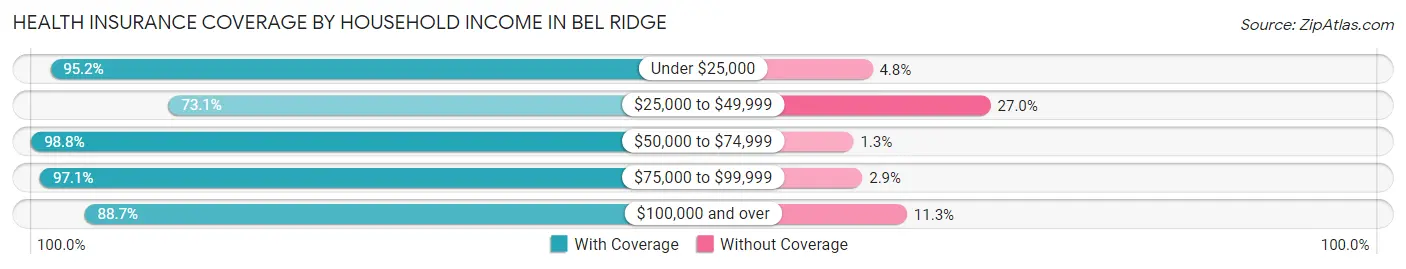
| Household Income | With Coverage | Without Coverage |
| Under $25,000 | 297 (95.2%) | 15 (4.8%) |
| $25,000 to $49,999 | 973 (73.1%) | 359 (27.0%) |
| $50,000 to $74,999 | 396 (98.8%) | 5 (1.3%) |
| $75,000 to $99,999 | 201 (97.1%) | 6 (2.9%) |
| $100,000 and over | 386 (88.7%) | 49 (11.3%) |
Public vs Private Health Insurance Coverage by Age in Bel Ridge
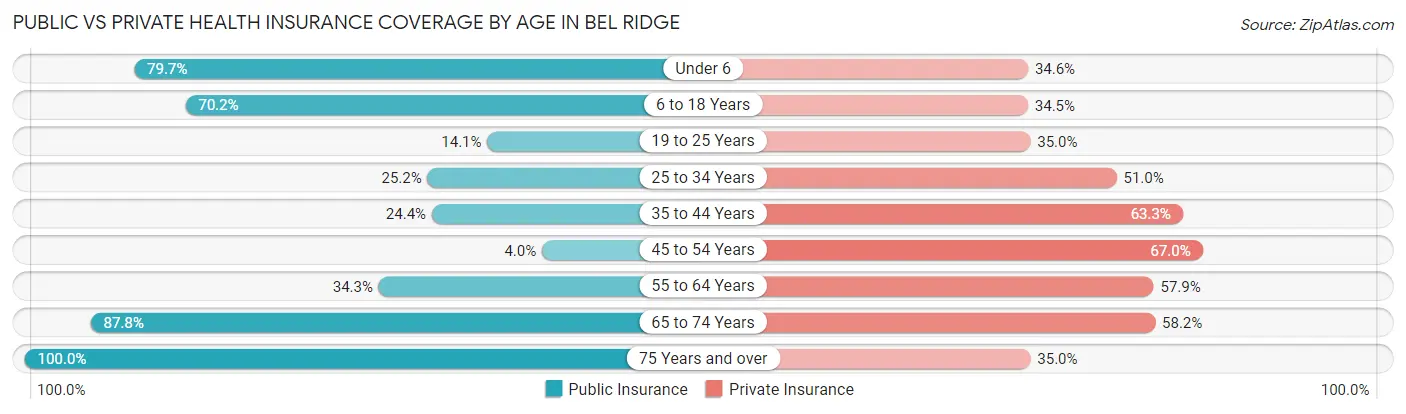
| Age Bracket | Public Insurance | Private Insurance |
| Under 6 | 196 (79.7%) | 85 (34.5%) |
| 6 to 18 Years | 447 (70.2%) | 220 (34.5%) |
| 19 to 25 Years | 54 (14.1%) | 134 (35.0%) |
| 25 to 34 Years | 88 (25.2%) | 178 (51.0%) |
| 35 to 44 Years | 91 (24.4%) | 236 (63.3%) |
| 45 to 54 Years | 9 (4.0%) | 152 (67.0%) |
| 55 to 64 Years | 74 (34.3%) | 125 (57.9%) |
| 65 to 74 Years | 172 (87.8%) | 114 (58.2%) |
| 75 Years and over | 60 (100.0%) | 21 (35.0%) |
| Total | 1,191 (44.3%) | 1,265 (47.1%) |
Disability Status by Sex by Age in Bel Ridge
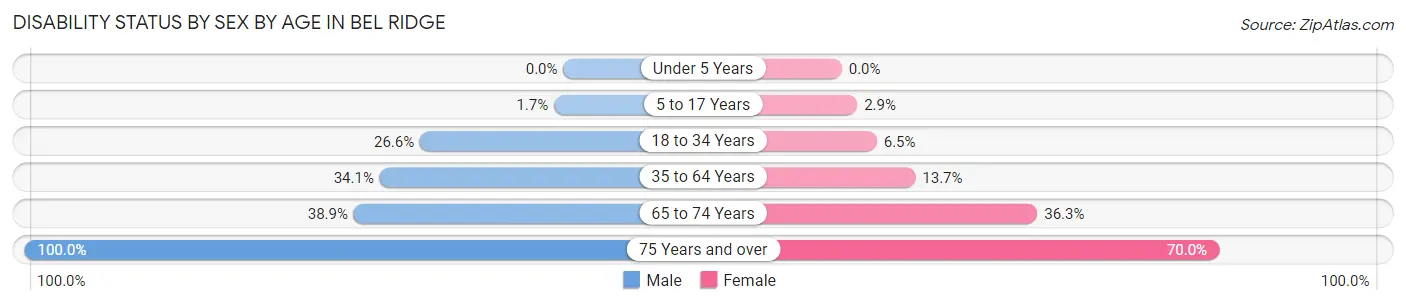
| Age Bracket | Male | Female |
| Under 5 Years | 0 (0.0%) | 0 (0.0%) |
| 5 to 17 Years | 6 (1.7%) | 8 (2.9%) |
| 18 to 34 Years | 75 (26.6%) | 30 (6.5%) |
| 35 to 64 Years | 91 (34.1%) | 75 (13.7%) |
| 65 to 74 Years | 28 (38.9%) | 45 (36.3%) |
| 75 Years and over | 20 (100.0%) | 28 (70.0%) |
Disability Class by Sex by Age in Bel Ridge
Disability Class: Hearing Difficulty
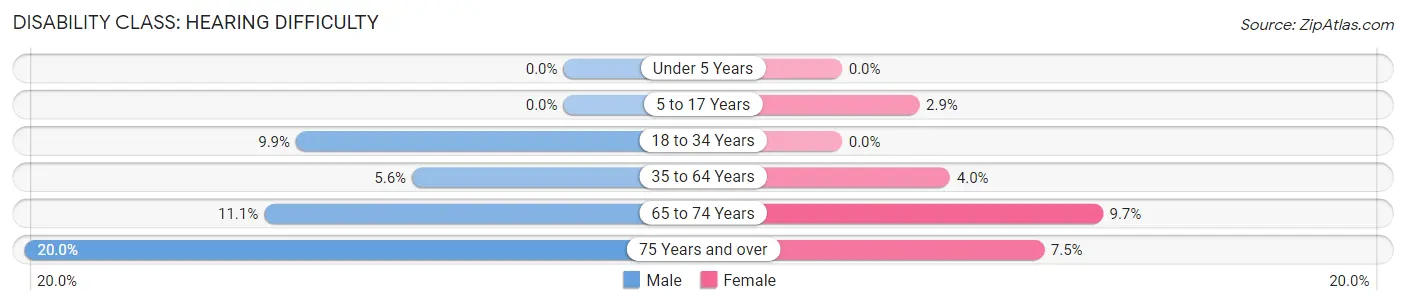
| Age Bracket | Male | Female |
| Under 5 Years | 0 (0.0%) | 0 (0.0%) |
| 5 to 17 Years | 0 (0.0%) | 8 (2.9%) |
| 18 to 34 Years | 28 (9.9%) | 0 (0.0%) |
| 35 to 64 Years | 15 (5.6%) | 22 (4.0%) |
| 65 to 74 Years | 8 (11.1%) | 12 (9.7%) |
| 75 Years and over | 4 (20.0%) | 3 (7.5%) |
Disability Class: Vision Difficulty
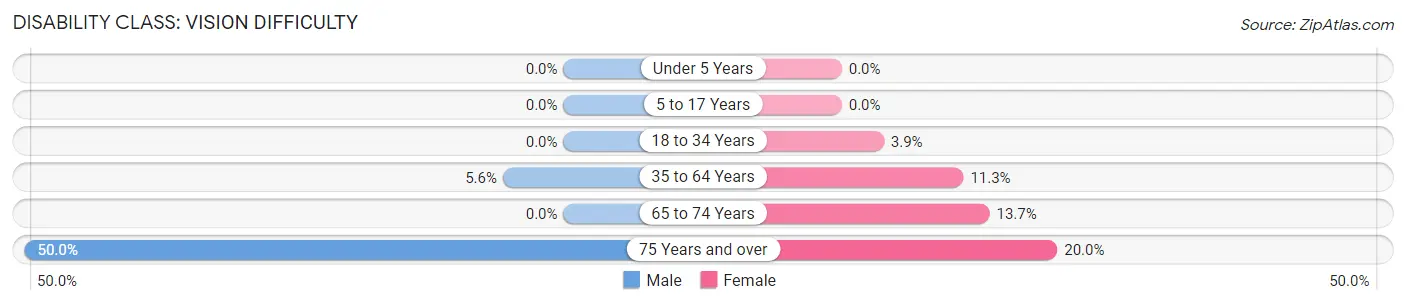
| Age Bracket | Male | Female |
| Under 5 Years | 0 (0.0%) | 0 (0.0%) |
| 5 to 17 Years | 0 (0.0%) | 0 (0.0%) |
| 18 to 34 Years | 0 (0.0%) | 18 (3.9%) |
| 35 to 64 Years | 15 (5.6%) | 62 (11.3%) |
| 65 to 74 Years | 0 (0.0%) | 17 (13.7%) |
| 75 Years and over | 10 (50.0%) | 8 (20.0%) |
Disability Class: Cognitive Difficulty
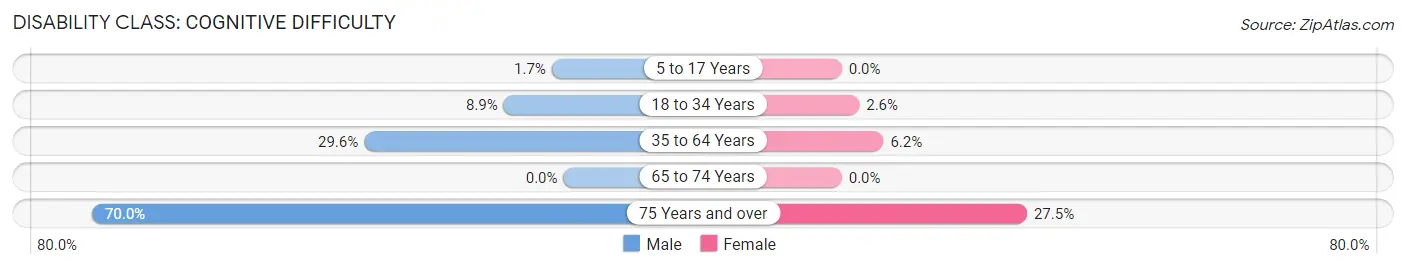
| Age Bracket | Male | Female |
| 5 to 17 Years | 6 (1.7%) | 0 (0.0%) |
| 18 to 34 Years | 25 (8.9%) | 12 (2.6%) |
| 35 to 64 Years | 79 (29.6%) | 34 (6.2%) |
| 65 to 74 Years | 0 (0.0%) | 0 (0.0%) |
| 75 Years and over | 14 (70.0%) | 11 (27.5%) |
Disability Class: Ambulatory Difficulty
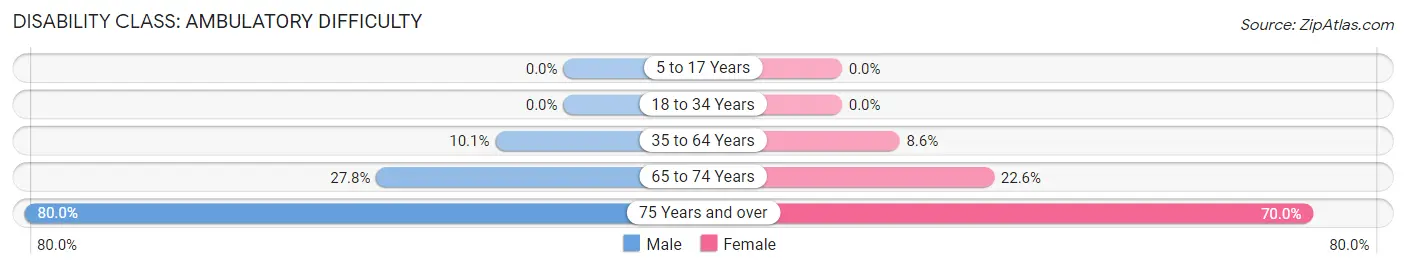
| Age Bracket | Male | Female |
| 5 to 17 Years | 0 (0.0%) | 0 (0.0%) |
| 18 to 34 Years | 0 (0.0%) | 0 (0.0%) |
| 35 to 64 Years | 27 (10.1%) | 47 (8.6%) |
| 65 to 74 Years | 20 (27.8%) | 28 (22.6%) |
| 75 Years and over | 16 (80.0%) | 28 (70.0%) |
Disability Class: Self-Care Difficulty
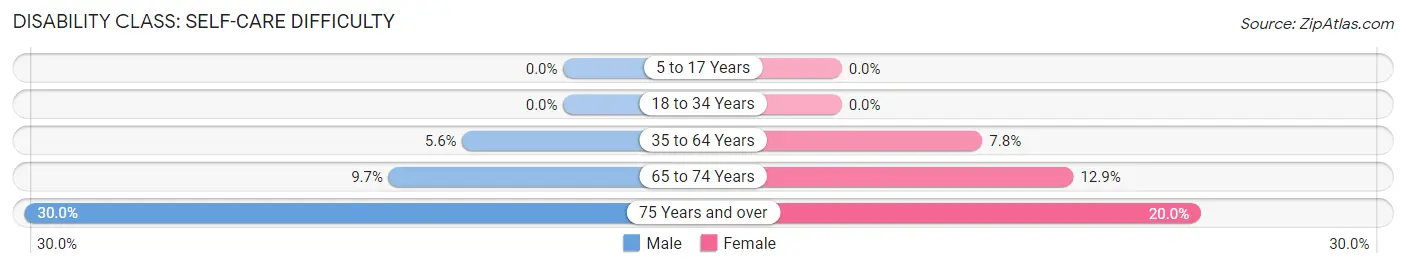
| Age Bracket | Male | Female |
| 5 to 17 Years | 0 (0.0%) | 0 (0.0%) |
| 18 to 34 Years | 0 (0.0%) | 0 (0.0%) |
| 35 to 64 Years | 15 (5.6%) | 43 (7.8%) |
| 65 to 74 Years | 7 (9.7%) | 16 (12.9%) |
| 75 Years and over | 6 (30.0%) | 8 (20.0%) |
Technology Access in Bel Ridge
Computing Device Access in Bel Ridge
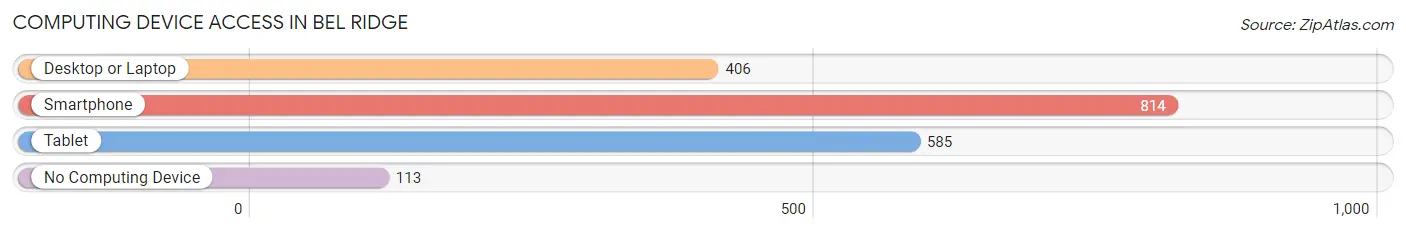
| Device Type | # Households | % Households |
| Desktop or Laptop | 406 | 42.7% |
| Smartphone | 814 | 85.6% |
| Tablet | 585 | 61.5% |
| No Computing Device | 113 | 11.9% |
| Total | 951 | 100.0% |
Internet Access in Bel Ridge
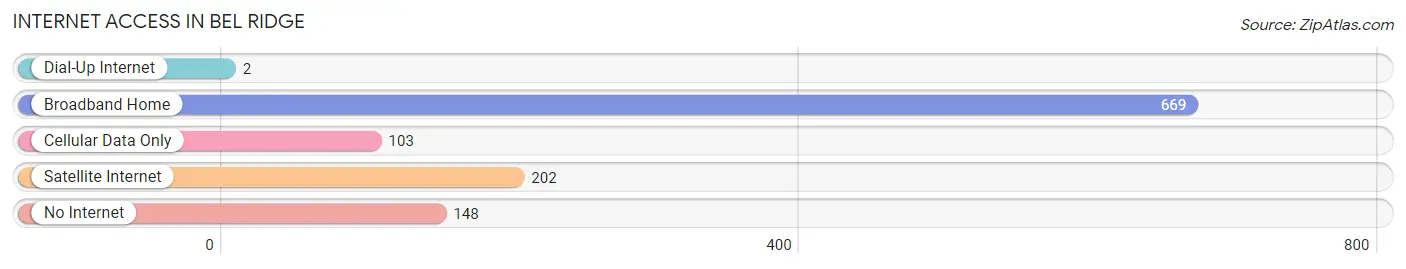
| Internet Type | # Households | % Households |
| Dial-Up Internet | 2 | 0.2% |
| Broadband Home | 669 | 70.4% |
| Cellular Data Only | 103 | 10.8% |
| Satellite Internet | 202 | 21.2% |
| No Internet | 148 | 15.6% |
| Total | 951 | 100.0% |
Bel Ridge Summary
History
Bel Ridge is a small city located in St. Louis County, Missouri. It is a suburb of St. Louis and is located just north of the city. The city was founded in the late 19th century and was originally known as Bel-Ridge. The name was derived from the two main roads that intersected in the area, Bel-Air Road and Ridge Road.
The city was originally a farming community and was home to many German immigrants. The city was incorporated in 1951 and has since grown to a population of over 4,000 people.
Geography
Bel Ridge is located in St. Louis County, Missouri. It is situated just north of the city of St. Louis and is bordered by the cities of Jennings, Normandy, and Pine Lawn. The city is located in the Missouri River Valley and is surrounded by rolling hills and wooded areas.
The city has a total area of 1.2 square miles, all of which is land. The city is located at an elevation of 590 feet above sea level.
Economy
Bel Ridge is a small city with a population of just over 4,000 people. The city is primarily a residential community and does not have a large commercial or industrial base. The city does have a few small businesses, including a grocery store, a gas station, and a few restaurants.
The city is also home to a few small manufacturing companies, including a plastics manufacturer and a metal fabrication company. The city also has a few small office buildings and a few retail stores.
Demographics
As of the 2010 census, Bel Ridge had a population of 4,072 people. The racial makeup of the city was 79.3% White, 15.2% African American, 0.3% Native American, 0.7% Asian, 0.1% Pacific Islander, and 4.4% from other races. Hispanic or Latino of any race were 2.2% of the population.
The median household income in Bel Ridge was $45,938, and the median family income was $51,938. The per capita income for the city was $20,938. About 11.2% of families and 13.2% of the population were below the poverty line, including 17.2% of those under age 18 and 8.2% of those age 65 or over.
Common Questions
What is Per Capita Income in Bel Ridge?
Per Capita income in Bel Ridge is $18,608.
What is the Median Family Income in Bel Ridge?
Median Family Income in Bel Ridge is $43,705.
What is the Median Household income in Bel Ridge?
Median Household Income in Bel Ridge is $38,642.
What is Income or Wage Gap in Bel Ridge?
Income or Wage Gap in Bel Ridge is 14.6%.
Women in Bel Ridge earn 85.4 cents for every dollar earned by a man.
What is Inequality or Gini Index in Bel Ridge?
Inequality or Gini Index in Bel Ridge is 0.40.
What is the Total Population of Bel Ridge?
Total Population of Bel Ridge is 2,687.
What is the Total Male Population of Bel Ridge?
Total Male Population of Bel Ridge is 1,096.
What is the Total Female Population of Bel Ridge?
Total Female Population of Bel Ridge is 1,591.
What is the Ratio of Males per 100 Females in Bel Ridge?
There are 68.89 Males per 100 Females in Bel Ridge.
What is the Ratio of Females per 100 Males in Bel Ridge?
There are 145.16 Females per 100 Males in Bel Ridge.
What is the Median Population Age in Bel Ridge?
Median Population Age in Bel Ridge is 28.5 Years.
What is the Average Family Size in Bel Ridge
Average Family Size in Bel Ridge is 3.6 People.
What is the Average Household Size in Bel Ridge
Average Household Size in Bel Ridge is 2.8 People.
How Large is the Labor Force in Bel Ridge?
There are 1,203 People in the Labor Forcein in Bel Ridge.
What is the Percentage of People in the Labor Force in Bel Ridge?
62.1% of People are in the Labor Force in Bel Ridge.
What is the Unemployment Rate in Bel Ridge?
Unemployment Rate in Bel Ridge is 18.3%.